Embed Size (px)
Citation preview
Thorsten Kempka, Thomas Kaiser and Klaus Solbach
Universitat Duisburg-Essen, Duisburg, Germany
Microwaves in fire detection
Abstract
Continuing our previous paper [2] published at AUBE ‘01, the issue of fire detection
by means of microwave radiation is further discussed. First a concept for this task is
presented, along with a short repetition of the physical fundamentals of thermal radiation,
electromagnetic wave propagation and attenuation.
In the second part the microwave receiver will be presented, which allows to carry out
experiments in Duisburg’s fire detection lab. The receiver is able to measure thermal
radiation in a frequency region from 2 GHz up to 40 GHz, where the superheterodyne
technique enables a rather flexible measurement range among arbitrary frequency bands
with width of 100 MHz.
The receiver is controlled by a normal PC, which makes the measurement setup config-
urable, i. e. one can choose any combination out of the 380 x 100 MHz frequency bands
for a single measurement. A graphical tool can be used to configure and to control the
measurements. This facilitates the set up of the desired frequency bands and to carry out
the data logging. In the last part of our contribution we are going to present and discuss
the results of measurements of selected standardized European test fires according to ISO
7240 (EN 54 Part 9).
Introduction
Today, typical smoke and flame detectors and also imaging cameras are based upon ther-
mal radiation in the infrared (IR) region. IR radiation itself is a special kind of an elec-
tromagnetic wave for the wavelength range 750 nm� λIR
�1 mm. The question arises
wether electromagnetic radiation with other wavelengths λ can be used for fire detection.
Without doubt, most of the thermal power radiated by the fire belongs to the IR spectrum.
So, the first choice for a radiometer, this is a device which measures the radiated power of

the fire, is the IR spectrum. Examples for such radiometers are flame detectors (e. g. see
[8]) or the above mentioned IR cameras. However, from scattered light or light extinction
detectors we know that the attenuation of this radiation due to smoke is rather high. In
fact, those detectors exploit the high attenuation of smoke or the high scattering due to
smoke in the fire case and not the emitted radiation power of the fire. Because of this it
is reasonable to look for a region of the electromagnetic spectrum where the attenuation
is less than in the IR region although the emitted power is even lower. In the micro- and
millimeterwave region, this means for a wavelength range 1 mm� λMW
�187 mm or
the corresponding frequency range 1.6 GHz�
fMW�
300 GHz, such characteristics are
given. Hence, exploiting thermal radiation in the microwave region (MW radiation for
short) for fire detection purposes is the topic of this contribution.
Concept
Fig. 1 represents one concept for the use of microwave radiation in fire detection. Because
PR�f � T �
PF�f � T �
Figure 1: Concept
of its temperature unequal to zero a fire emits electromagnetic radiation, The radiation
power PF�f � T � depends on the observed frequency f and certainly on the fire temperature.
The idea is, that a receiver measures the thermal radiation PR�f � T � within the room. If
there is no fire within the room it will measure the room temperature. If a fire is present,
the received thermal radiation power is increased.
To proof this simple concept, already used in the infrared region of the electromagnetic
spectrum, the thermal radiation power of a fire PF�f � T � has to be known. Also the radia-
tion power PR�f � T � at the receiver has to be known. The propagation of electromagnetic
waves and the interaction of waves have to be taken into account because they impact
PR�f � T � .
Fortunately, all of these phenomena are well investigated from other areas. PLANCK´s
law of radiation gives an upper bound for the thermal radiation power of a fire. For
propagation effects we can apply the free space propagation model for simplicity (known
e.g. from wireless communications) and the interaction with matter is described by MIE-
theory and RAYLEIGH-scattering, respectively. In the following paragraphs these physical
fundamentals are briefly revisited (For more information see e. g. [1], [7], [11], [12]).
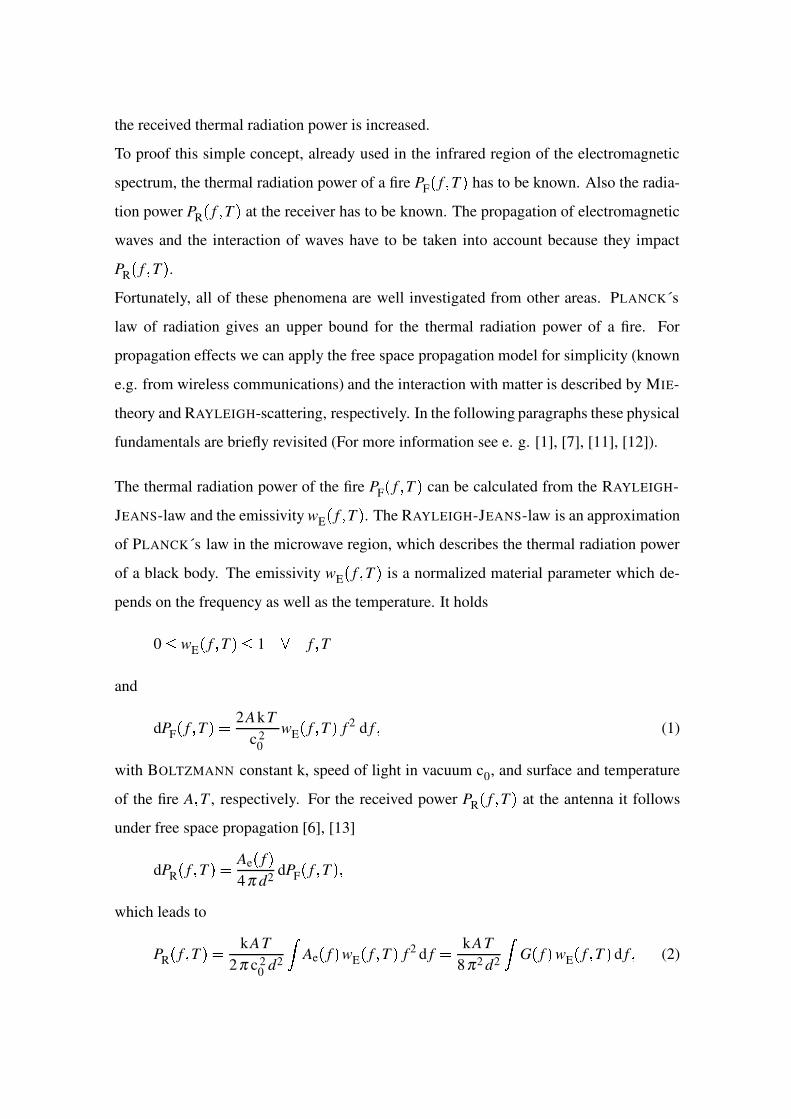
The thermal radiation power of the fire PF�f � T � can be calculated from the RAYLEIGH-
JEANS-law and the emissivity wE�f � T � . The RAYLEIGH-JEANS-law is an approximation
of PLANCK´s law in the microwave region, which describes the thermal radiation power
of a black body. The emissivity wE�f � T � is a normalized material parameter which de-
pends on the frequency as well as the temperature. It holds
0�
wE�f � T � � 1 � f � T
and
dPF�f � T ��� 2AkT
c 20
wE�f � T � f 2 d f � (1)
with BOLTZMANN constant k, speed of light in vacuum c0, and surface and temperature
of the fire A � T , respectively. For the received power PR�f � T � at the antenna it follows
under free space propagation [6], [13]
dPR�f � T ��� Ae
�f �
4π d2 dPF�f � T ���
which leads to
PR�f � T ��� kAT
2π c 20 d2
Ae�f � wE
�f � T � f 2 d f � kAT
8π2 d2
G�f � wE
�f � T � d f � (2)
with the distance between fire and antenna d, the effective area of antenna Ae�f � , and the
antenna gain G�f ��� Ae f � f 2
c 20
. For a narrow frequency band with center frequency fc and
bandwidth ∆ f we obtain
PR�fc � ∆ f � T ��� kAT
2π c 20 d2 wE
�fc � T � Ae
�fc � f 2
c ∆ f � kAT8π2 d2 wE
�fc � T � G � fc � ∆ f �
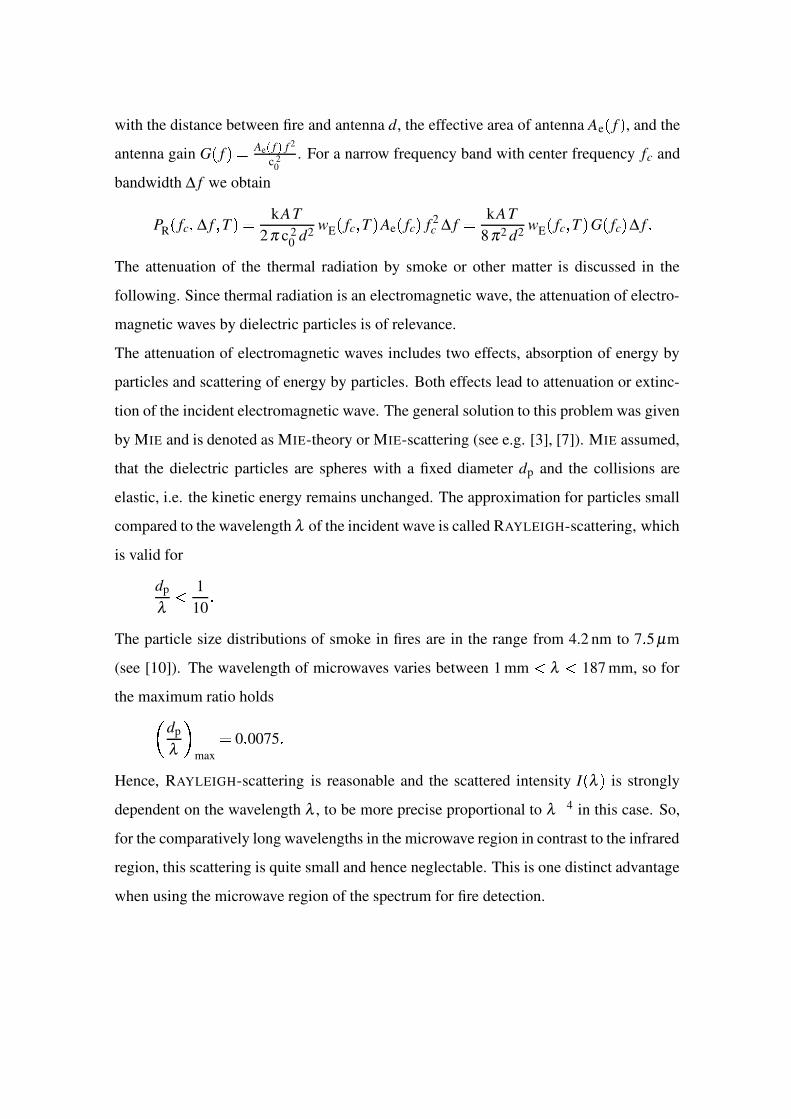
The attenuation of the thermal radiation by smoke or other matter is discussed in the
following. Since thermal radiation is an electromagnetic wave, the attenuation of electro-
magnetic waves by dielectric particles is of relevance.
The attenuation of electromagnetic waves includes two effects, absorption of energy by
particles and scattering of energy by particles. Both effects lead to attenuation or extinc-
tion of the incident electromagnetic wave. The general solution to this problem was given
by MIE and is denoted as MIE-theory or MIE-scattering (see e.g. [3], [7]). MIE assumed,
that the dielectric particles are spheres with a fixed diameter dp and the collisions are
elastic, i.e. the kinetic energy remains unchanged. The approximation for particles small
compared to the wavelength λ of the incident wave is called RAYLEIGH-scattering, which
is valid for
dp
λ 110�
The particle size distributions of smoke in fires are in the range from 4.2 nm to 7 � 5 µm
(see [10]). The wavelength of microwaves varies between 1 mm λ 187 mm, so for
the maximum ratio holds�dp
λ � max� 0 � 0075 �
Hence, RAYLEIGH-scattering is reasonable and the scattered intensity I�λ � is strongly
dependent on the wavelength λ , to be more precise proportional to λ � 4 in this case. So,
for the comparatively long wavelengths in the microwave region in contrast to the infrared
region, this scattering is quite small and hence neglectable. This is one distinct advantage
when using the microwave region of the spectrum for fire detection.

Microwave receiver
This section describes the microwave receiver we built up to measure the thermal radiation
power of fires. Currently it is able to measure between 2 - 40 GHz. The receiver is
designed according to the superheterodyne principle, which has two major advantages.
First, the receiver can easily be enlarged to deal with other frequency bands and second,
it is able to amplify the thermal power at an intermediate frequency, where succeeding
amplifiers are easier to build. Fig. 2 shows a principle sketch of our receiver.
26-40 GHzantenna
18-26 GHzantenna
12-18 GHzantenna
2-12 GHzantenna
Hot Load
low noise
amplifier amplifier
mixer and
mixer andamplifieramplifier
low noise
amplifier
oscillatorlocal
meterpower
switc
hing
switc
hing
data
acqu
isiti
on/c
ontr
olPC
thermal signal
oscillator signal
GPIB control
GBIP data
Figure 2: Schematic diagram of the microwave receiver
The four broad-band antennas cover the frequency bands 2-12 GHz, 12-18 GHz, 18-
26 GHz and 26-40 GHz and are followed by a switching stage, where each of the an-
tennas or a “Hot Load” could be selected. The Hot Load with a constant temperature of
100 � C is used to calibrate the complete measurement device. After the switching stage
two low noise amplifiers (LNA) amplify the received thermal radiation power with a gain
of GdB � 30dB and a noise figure F less than 3 dB over the whole frequency range. The
latter is needed to achieve a satisfactory temperature resolution ∆Tm, where [9]
∆Tm � Tm � Tr�∆ f τ
�with the radiometer bandwidth ∆ f , the measurement time τ , the temperature of the mea-
sured object Tm, and the noise temperature of the receiver Tr. Tab. 1 represents some
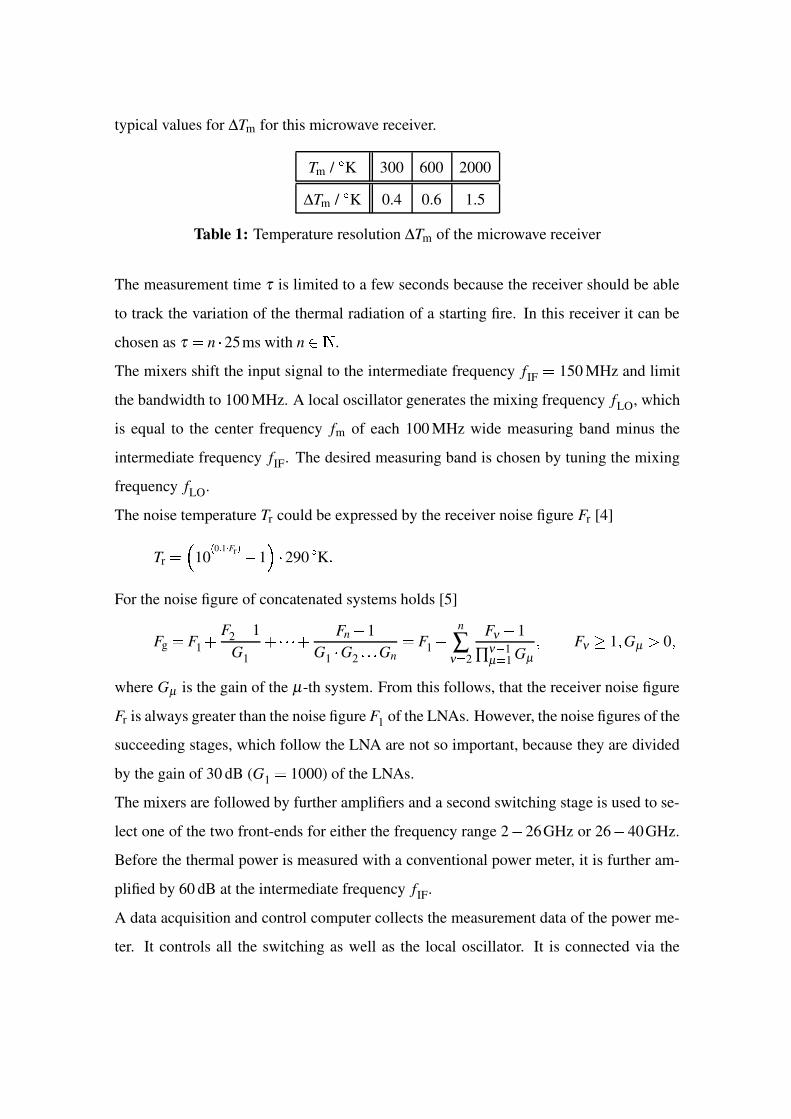
typical values for ∆Tm for this microwave receiver.
Tm / � K 300 600 2000
∆Tm / � K 0.4 0.6 1.5
Table 1: Temperature resolution ∆Tm of the microwave receiver
The measurement time τ is limited to a few seconds because the receiver should be able
to track the variation of the thermal radiation of a starting fire. In this receiver it can be
chosen as τ � n � 25ms with n ��� .
The mixers shift the input signal to the intermediate frequency fIF � 150 MHz and limit
the bandwidth to 100 MHz. A local oscillator generates the mixing frequency fLO, which
is equal to the center frequency fm of each 100 MHz wide measuring band minus the
intermediate frequency fIF. The desired measuring band is chosen by tuning the mixing
frequency fLO.
The noise temperature Tr could be expressed by the receiver noise figure Fr [4]
Tr ��� 10 � 0 � 1 � Fr ��� 1 !� 290 � K �For the noise figure of concatenated systems holds [5]
Fg � F1 � F2� 1
G1� �"�"� � Fn
� 1G1 � G2 �"�#� Gn
� F1 � n
∑ν $ 2
Fν� 1
∏ν � 1µ $ 1 Gµ
� Fν % 1 � Gµ & 0 �where Gµ is the gain of the µ-th system. From this follows, that the receiver noise figure
Fr is always greater than the noise figure F1 of the LNAs. However, the noise figures of the
succeeding stages, which follow the LNA are not so important, because they are divided
by the gain of 30 dB (G1 � 1000) of the LNAs.
The mixers are followed by further amplifiers and a second switching stage is used to se-
lect one of the two front-ends for either the frequency range 2 � 26GHz or 26 � 40GHz.
Before the thermal power is measured with a conventional power meter, it is further am-
plified by 60 dB at the intermediate frequency fIF.
A data acquisition and control computer collects the measurement data of the power me-
ter. It controls all the switching as well as the local oscillator. It is connected via the
general purpose interface bus (GPIB), which is a derivation of the HEWLETT-PACKARD-
Interface Bus (HPIB). This bus allows the remote control of different measurement de-
vices, like power meters, wave generators, or oscilloscopes.
Some limitations of our microwave receiver should be mentioned also. Because of the
design goal to measure over a wide frequency range a bulky receiver has to be build up.
Furthermore, all microwave components are manufactured for narrowband applications
so that this microwave receiver is an assembly of many narrowband receivers with differ-
ent properties in different frequency bands, e.g. the total amplification GMR�f � depends
on frequency. Hence, it is useful as a relative measuring device only, that compares the
measured thermal radiation power PM�f � T �'� GMR
�f �(� PR
�f � T � of fire to non-fire sit-
uations for each frequency band respectively. The evaluation of the absolute value of
PM�f � T � requires further calibration efforts and will not be discussed here.
Another drawback is the rather complex control of the receiver, that follows from the
broadband setup also. Because of this, the duration between two consecutive measured
values may vary, if several frequency bands are measured simultaneously. In this case
a configurable number of samples will be measured in one frequency band. Then the
receiver changes to the next frequency band and takes the samples for the new frequency
band. After all selected frequency bands are measured, the receiver will measure the
first band again. The duration of frequency band changes depends on switching times
for the different switches and the settling time of the local oscillator. The time between
measurement samples in the same band depends on the number of measured bands and
this can take some seconds. This is the reason why measurement results (see next section)
for multiple frequency bands are drawn over the sample number instead of time.
In the next section, results from measurements carried out in Duisburg’s fire detection lab
are presented in order to gain more insight about microwave emission of fires.
Experiments
In this section some fire test results are presented. The distance between the receiver
and the fire was approx. 1 m for all experiments. The test fires TF1 and TF2 out of the
European standard EN 54 Part 9 (old version) are used for the measurements.
sample number
ignitionP M
) f c
* T+ /W0.0012
0.0011
0.001
0.0009
0.0008
0.0007
0.00060 100 200 300 400 500 600
29550 MHz29650 MHz29750 MHz29850 MHz29950 MHz
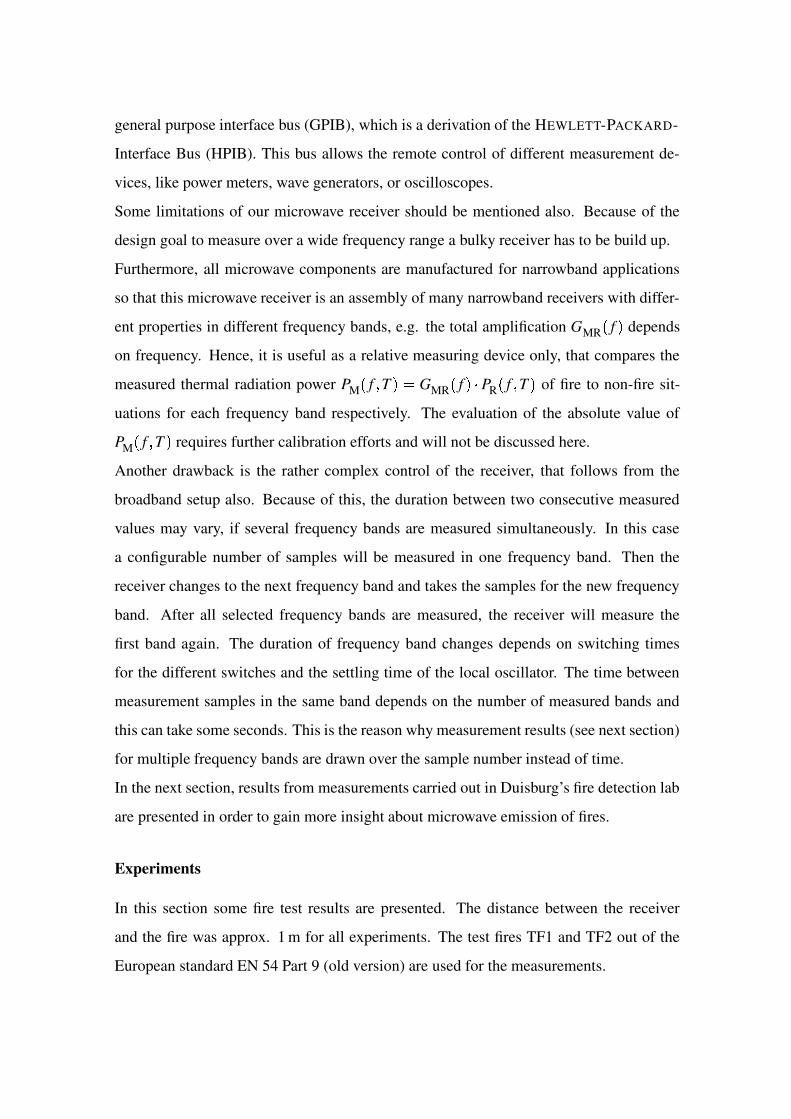
Figure 3: Measured thermal radiation power PM�f � T � of a TF1 for different frequencies
TF1 is an open wood fire where beechwood is burned. Fig. 3 presents the measured
thermal radiation power PM�f � T � of this fire for different frequencies. The ignition of
the wood took place at about n � 30 samples and is marked by the dashed line. At about
n � 100 samples the measured power begins to rise in a nearly exponential manner up
to the maximum at approx. n � 150 samples. After that time the radiation power drops
of linearly. At about n � 280 samples a calibration took place. Therefore the power of
the Hot Load was measured instead of the fire power. The two jumps between n � 400
and n � 500 follow from mopping the remaining wood out of the observed area. This
measurement was done for the frequency range of 26 GHz - 40 GHz. The results of the
other frequency bands within this range are very similar so they will not be shown here.
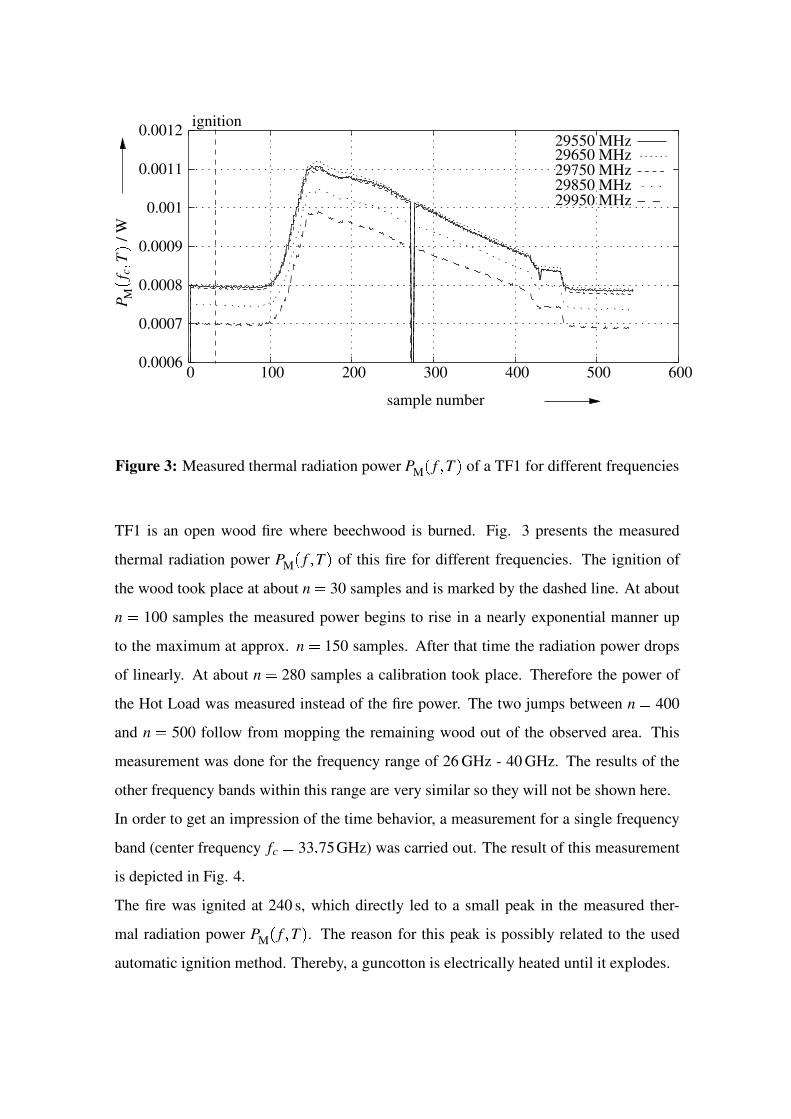
In order to get an impression of the time behavior, a measurement for a single frequency
band (center frequency fc � 33 � 75GHz) was carried out. The result of this measurement
is depicted in Fig. 4.
The fire was ignited at 240 s, which directly led to a small peak in the measured ther-
mal radiation power PM�f � T � . The reason for this peak is possibly related to the used
automatic ignition method. Thereby, a guncotton is electrically heated until it explodes.
time / s
ignitionP M
) f c
* T+ /W
0.0005
0.00055
0.0006
0.0007
0.00065
0.00075
0.0008
0.00085
0.0009
0 500 1000 1500 2000
33750 MHz
Figure 4: measured thermal radiation power PM�f � T � of a TF1
A rise in the measured power can be observed at about 330 s. Hence, 90 s after ignition
changes in the measured radiation power become visible, which is in agreement with data
taken form ionization chamber (MIC), extinction light sensor (MIREX), CO-, and CO2-
measurements. The jumps in the end of the fire are missing, because nobody mopped the
remaining wood out of the observed area.
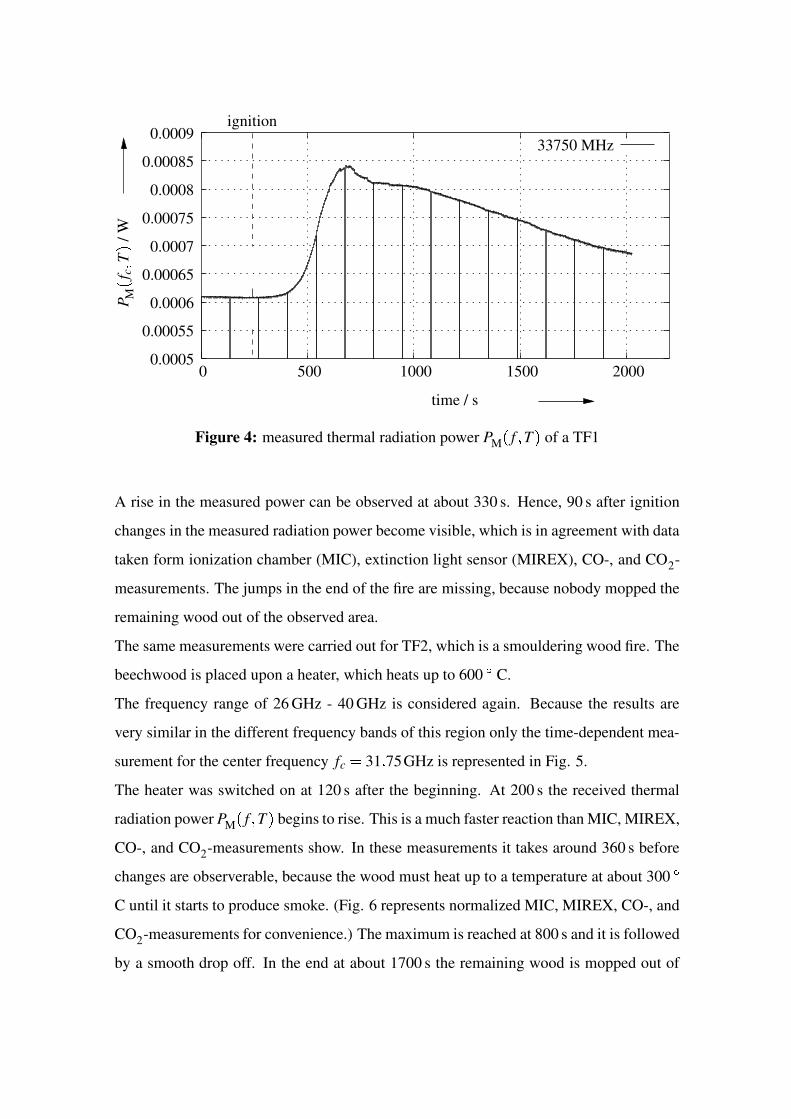
The same measurements were carried out for TF2, which is a smouldering wood fire. The
beechwood is placed upon a heater, which heats up to 600 � C.
The frequency range of 26 GHz - 40 GHz is considered again. Because the results are
very similar in the different frequency bands of this region only the time-dependent mea-
surement for the center frequency fc � 31 � 75GHz is represented in Fig. 5.
The heater was switched on at 120 s after the beginning. At 200 s the received thermal
radiation power PM�f � T � begins to rise. This is a much faster reaction than MIC, MIREX,
CO-, and CO2-measurements show. In these measurements it takes around 360 s before
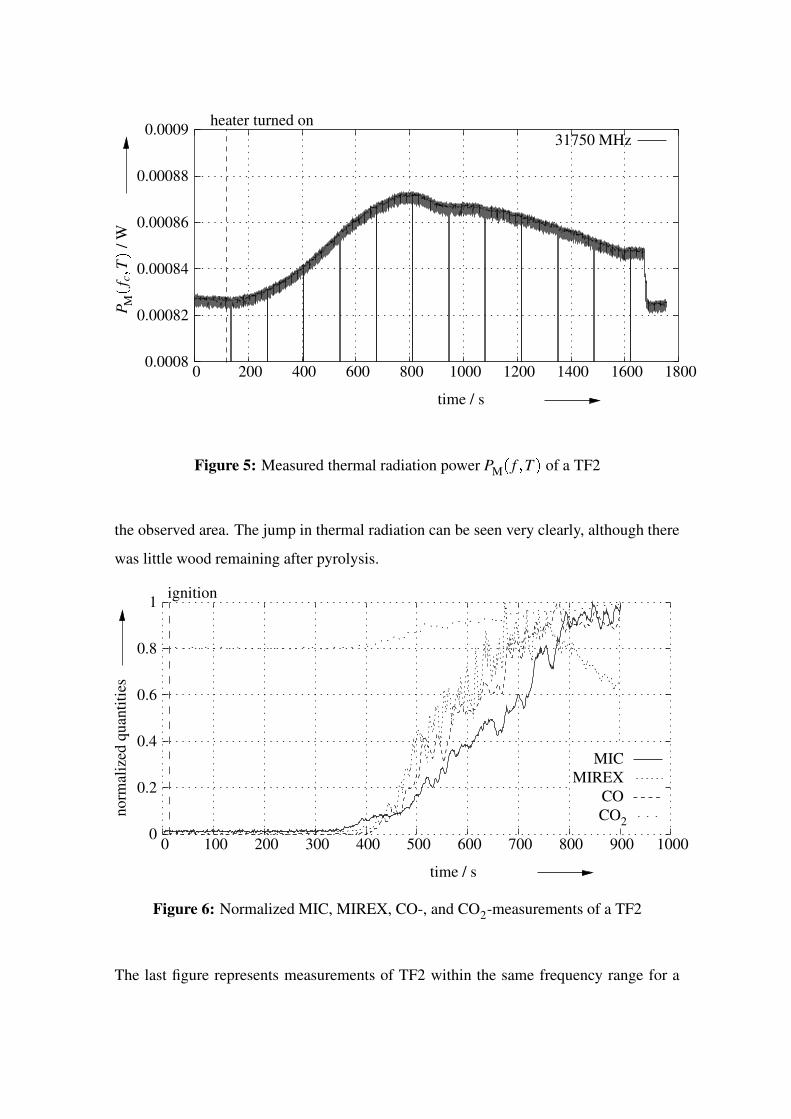
changes are observerable, because the wood must heat up to a temperature at about 300 �C until it starts to produce smoke. (Fig. 6 represents normalized MIC, MIREX, CO-, and
CO2-measurements for convenience.) The maximum is reached at 800 s and it is followed
by a smooth drop off. In the end at about 1700 s the remaining wood is mopped out of
time / s
heater turned onP M
) f c
* T+ /W0.0009
0.00088
0.00086
0.00084
0.00082
0.00080 200 400 600 800 1000 1200 1400
31750 MHz
1600 1800
Figure 5: Measured thermal radiation power PM�f � T � of a TF2
the observed area. The jump in thermal radiation can be seen very clearly, although there
was little wood remaining after pyrolysis.
norm
aliz
edqu
antit
ies
time / s
ignition1
0.8
0.6
0.4
0.2
01000 300 400200 500 600 700 800 900 1000
CO2
COMIREX
MIC
Figure 6: Normalized MIC, MIREX, CO-, and CO2-measurements of a TF2
The last figure represents measurements of TF2 within the same frequency range for a
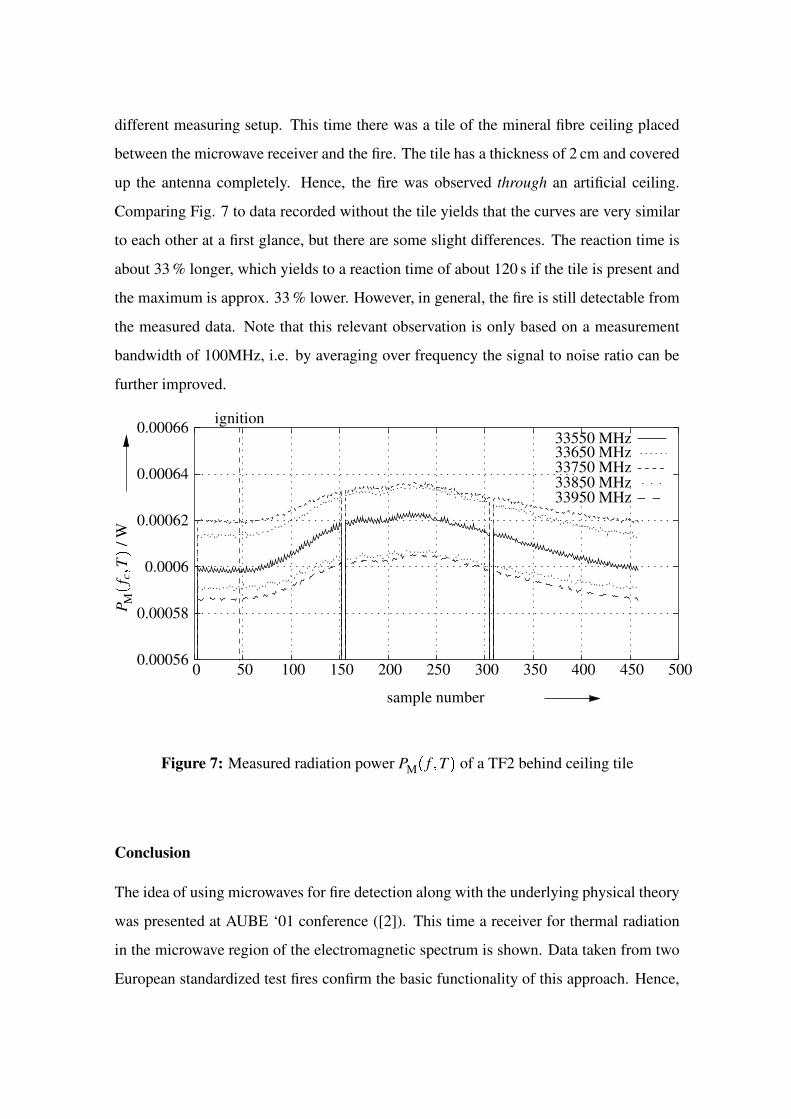
different measuring setup. This time there was a tile of the mineral fibre ceiling placed
between the microwave receiver and the fire. The tile has a thickness of 2 cm and covered
up the antenna completely. Hence, the fire was observed through an artificial ceiling.
Comparing Fig. 7 to data recorded without the tile yields that the curves are very similar
to each other at a first glance, but there are some slight differences. The reaction time is
about 33 % longer, which yields to a reaction time of about 120 s if the tile is present and
the maximum is approx. 33 % lower. However, in general, the fire is still detectable from
the measured data. Note that this relevant observation is only based on a measurement
bandwidth of 100MHz, i.e. by averaging over frequency the signal to noise ratio can be
further improved.
sample number
ignition
P M
) f c
* T+ /W
00.00056
0.00058
0.0006
0.00062
0.00064
0.00066
50 100 150 200 250 300 350 400 450 500
33550 MHz
33950 MHz33850 MHz33750 MHz33650 MHz
Figure 7: Measured radiation power PM�f � T � of a TF2 behind ceiling tile
Conclusion
The idea of using microwaves for fire detection along with the underlying physical theory
was presented at AUBE ‘01 conference ([2]). This time a receiver for thermal radiation
in the microwave region of the electromagnetic spectrum is shown. Data taken from two
European standardized test fires confirm the basic functionality of this approach. Hence,
thermal microwave radiation is a measureable quantity to detect fires. The measurements
of TF2 indicate that in some cases it is possible to detected fires earlier than with optical-
or gas-sensors. A further advantage is the penetration of non-metal materials by mi-
crowaves, which allows detection even behind walls.
Acknowledgment
The authors thank “Deutsche Forschungsgemeinschaft (DFG)” for supporting this project.
References
[1] C. Gerthsen, ”Physik” , Springer-Verlag 1966.
[2] T. Kaiser, T. Kempka, ”Is Microwave Radiation Useful for Fire Detection?”, Pro-
ceedings of 12th International Conference on Automatic Fire Detection AUBE ’01,
26.-28.3.2001, Gaithersburg, NIST Special Publication 965.
[3] M. Kerker, ”The scattering of light and other electromagnetic radiation” , Academic
Press 1969.
[4] R. Lentz, “Rauschen in Empfangsanlagen”, UKW-Berichte 3 , 1975.
[5] H. Luck, “Grundlagen der Nachrichtentechnik 1-4” , Vorlesungsskript Universitat
Duisburg-Essen, 2003.
[6] H. Meinke, F.W. Gundlach, ”Taschenbuch der Hochfrequenztechnik Bd1-3” ,
Springer-Verlag 1986, ISBN 3-540-15394-2 (Bd.1), 3-540-15395-0 (Bd. 2), 3-504-
15396-9 (Bd. 3).
[7] C. R. Nave, ”HyperPhysics” ,
http://hyperphysics.phy-astr.gsu.edu/hbase/hframe.html.
[8] R. Siebel, ”Ein LOW-COST Flammenmelder mit guten Alarm- und Falschalarm-
eigenschaften” (in German), Proceedings AUBE ’99 zur 11. Internationalen Kon-
ferenz uber Automatische Brandentdeckung, 16.-18.3.1999 in Duisburg, Heinz
Luck (Ed.), Agst Verlag, Moers 1999, ISBN 3926875313
[9] B. Schiek, H.-J. Siweris, ”Rauschen in Hochfrequenzschaltungen” , Huthig Buch
Verlag 1990, ISBN 3-7785-2007-5.
[10] E. Tamm, A. Mimre, U. Sievert, D. Franken, ”Aerosol Particle Concentration and
Size Distribution Measurements of Test-Fires as Background for Fire Detection
Modelling“, H. Luck (Herausgeber), Tagungsband der 11. Internationalen Kon-
ferenz uber automatische Brandentdeckung AUBE ’99, Duisburg, Marz 1999, Agst
Verlag Moers 1999, S. 150-159.
[11] F. T. Ulaby, R. K. Moore, A. K. Fung, ”Microwave Remote Sensing Vol.1 Funda-
mentals and Radiometry” , Addison-Wesley, 1981, ISBN 0-201-10759-7.
[12] B. Vowinkel, ”Passive Mikrowellenradiometrie” , Friedr. Vieweg & Sohn, Braun-
schweig / Wiesbaden, 1988, ISBN 3-528-08959-8.
[13] O. Zinke, ”Lehrbuch der Hochfrequenztechnik 1” , Springer-Verlag 1990, ISBN 3-
540-51421-X.


