Embed Size (px)
Citation preview
1
1Thinking
Maps® as aTransformational
Language forLearning
David Hyerle, Ed.D.
Topics to be discussed:
• introducing a common visual language for learning • describing five essential characteristics of Thinking Maps using a
Bubble Map• overviewing the book using a Tree Map for revealing themes of
transformational learning using Thinking Maps
M uch like a momentary respite before jumping back into an excit-ing journey, this book represents a resting place for present
research, results, and models of practice from over 15 years of bringingThinking Maps into schools. The authors of the chapters before you bringforth insights grounded in practical examples and experiences from their
01-Hyerle.qxd 4/27/2004 2:34 PM Page 1
travels. Together, their work creates a compelling display of whatcan happen when Thinking Maps are used as a language for learning bystudents across different cultures and languages, for deepening instructionby teachers in classrooms, and for raising the quality of professional devel-opment and change processes within whole schools.
This is because as a language of visual tools grounded in thinkingprocesses, Thinking Maps ultimately unite a school faculty around awell-documented need in classrooms and a central organizing principlefor twenty-first century education: equity of access to—and explicit teachingof—higher-order thinking tools for every child and every adult on the journey oflifelong learning.
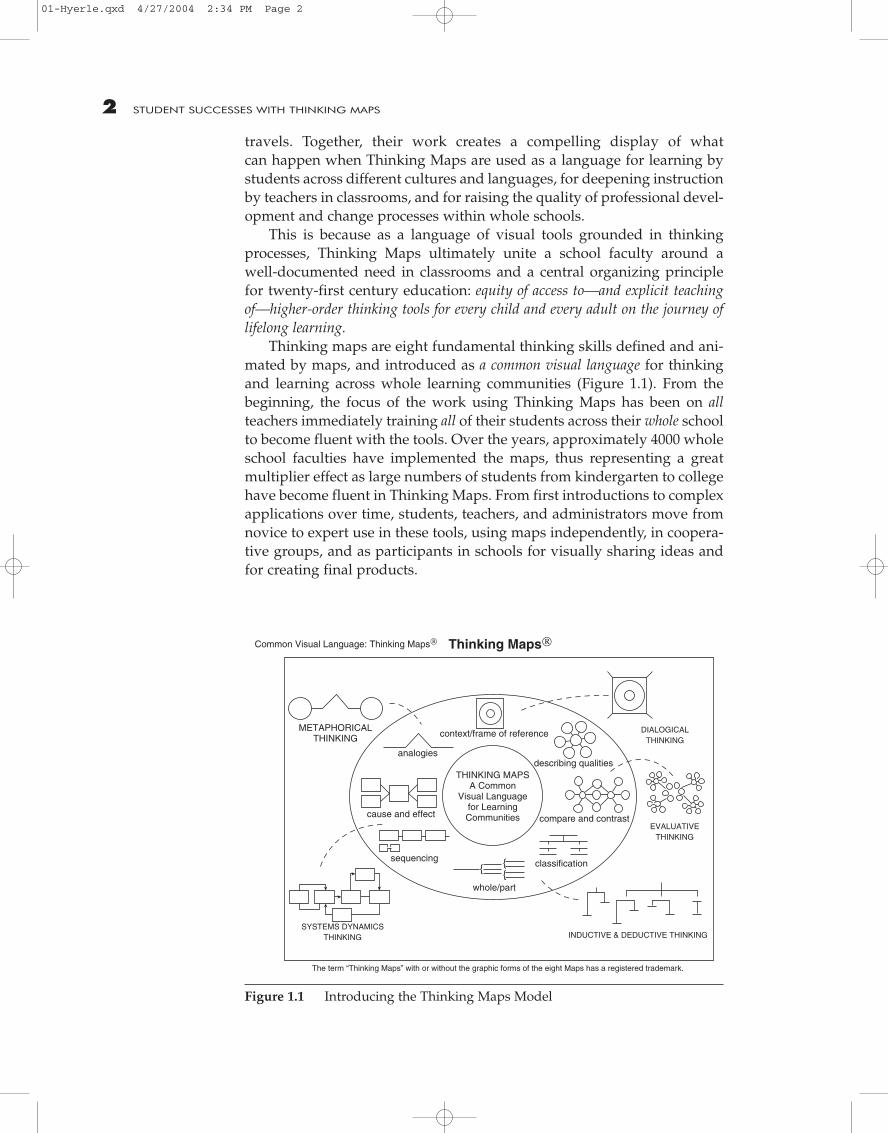
Thinking maps are eight fundamental thinking skills defined and ani-mated by maps, and introduced as a common visual language for thinkingand learning across whole learning communities (Figure 1.1). From thebeginning, the focus of the work using Thinking Maps has been on allteachers immediately training all of their students across their whole schoolto become fluent with the tools. Over the years, approximately 4000 wholeschool faculties have implemented the maps, thus representing a greatmultiplier effect as large numbers of students from kindergarten to collegehave become fluent in Thinking Maps. From first introductions to complexapplications over time, students, teachers, and administrators move fromnovice to expert use in these tools, using maps independently, in coopera-tive groups, and as participants in schools for visually sharing ideas andfor creating final products.
2 STUDENT SUCCESSES WITH THINKING MAPS
METAPHORICALTHINKING context/frame of reference
Thinking MapsCommon Visual Language: Thinking Maps
describing qualities
compare and contrast
classification
whole/part
The term “Thinking Maps” with or without the graphic forms of the eight Maps has a registered trademark.
sequencing
cause and effect
analogies
SYSTEMS DYNAMICSTHINKING INDUCTIVE & DEDUCTIVE THINKING
EVALUATIVETHINKING
DIALOGICALTHINKING
THINKING MAPSA Common
Visual Languagefor Learning Communities
{{ {
Figure 1.1 Introducing the Thinking Maps Model
01-Hyerle.qxd 4/27/2004 2:34 PM Page 2
From the authors of these chapters, you will learn about schoolwidechanges in teachers’ perspectives and student performance in an inner-cityelementary school in Long Beach, California, where 85% of the studentsentering classrooms speak Spanish as their first language; special educa-tion students in a middle school in North Carolina making performanceleaps of over three years’ growth in mathematics; girls from a single-sex,independent, K–12 school in New Zealand rising over four years to thetop of that nation’s educational ladder; and entering junior-collegestudents in Mississippi significantly shifting reading comprehensionscores, while those in the nursing program dramatically outperform theirpeers of previous years.
THE BIG PICTURE
The purpose of this introductory chapter is to give you a big-pictureoverview of how the wide-ranging stories across the 16 chapters weavetogether to create a unified theme of Thinking Maps as a transformationallanguage for learning. It also offers readers who are not familiar withThinking Maps a brief history and theoretical background for the work,definitions of the tools, and a wider description of how the tools supportteaching, learning, and leadership in schools. Upon first glance, some edu-cators perceive the maps as just an interesting set of graphics, rather thanas a cohesive, theoretically grounded language. One author, the principalof the inner-city elementary school mentioned above, even begins herchapter with this experience: When she first introduced her staff to theidea of implementing the maps across their school, they looked at themaps and said, “But we already do that!” By the end of the school year andinto the second year the school had transformed itself into a learningcommunity where students were making performance leaps well beyondteachers’ expectations.
Together, the authors share wide-ranging outcomes including signifi-cant quantitative performance shifts by students and qualitative changesin instruction from schools within cityscapes and sprawling new suburbanneighborhoods to rural landscapes and into multiple countries. Thechapters come together under four major sections, as shown in the tableof contents Flow Map (Figure 0.1), and descriptions below:
Section 1 integrates research on best practices, brain research, and arange of other models such as habits of mind, multiple intelligences, andlearning styles with practical examples of how Thinking Maps mediatestudents’ thinking, learning, and metacognitive behaviors. The backgroundoffered in the first section lays the foundation for showing how ThinkingMaps are used for content-specific learning in Section 2. Applications inthe areas of reading comprehension, writing processes, mathematics,and technology offer a view of how thinking skills may be taught directlyto students for independent transfer across the disciplines, while directlymeeting state standards. This focus on content learning leads into
3THINKING MAPS AS A TRANSFORMATIONAL LANGUAGE FOR LEARNING
01-Hyerle.qxd 4/27/2004 2:34 PM Page 3
Section 3, which shows how Thinking Maps work across whole schoolsfor improving teaching and learning, from descriptions of elementary,middle, and K–12 schools that have implemented the tools for multipleyears, to research from a junior college revealing significant results,to direct training of students in Singapore. The fourth and final sectionbroadens the focus to look at Thinking Maps as tools that simultane-ously support student as well as organizational learning. Thinking Mapsfacilitate the transformation of professional development within schoolsby “inviting explicit thinking” by teachers, in the mentoring processeswith beginning teachers, and by uniting whole school faculties around acommon visual language for “constructivist conversations.”
From a big-picture point of view, the successes that shine throughthe research and results discussed in this book reveal the development ofrich content knowledge and, more important, reflections on the continu-ous cognitive development of every learner—student, teacher, and admin-istrator—in a school. Many educators, as described in this book, broughtThinking Maps into their schools because they believed that there wouldbe an impact on teacher instruction and student performance. They wereproven right. Yet many of these teachers and administrators did not foreseethat Thinking Maps would also transform the culture of learning across thewhole school.
A BRIEF INTRODUCTION TOTHINKING MAPS AS A LANGUAGE
Every one of the authors of this book has contributed in different waysover the years to the continuing evolution of Thinking Maps. The themesthat emerge here go way beyond the first musings I had back in the springof 1986. I remember a moment of clarity immediately followed by a hum-bling awareness. I was eagerly generating ideas for a workbook I waswriting, meant for middle school students from underachieving schools.The focus was on the direct facilitation of their thinking skills abilities. Ithought I knew what I was doing—and then I realized what I didn’t know.Two core questions jumped from my mind, the first more theoretical, thesecond more practical:
What are fundamental thinking skills?
How do we support all learners to transfer these skills acrossdisciplines?
These questions came directly from my frames of reference: I had beenteaching in inner-city classrooms in Oakland, California, while studyingthe continuing underachievement in inner-city schools within low socio-economic communities (serving mostly African American children). I wasalso becoming increasingly more aware of the implications of the (still
4 STUDENT SUCCESSES WITH THINKING MAPS
01-Hyerle.qxd 4/27/2004 2:34 PM Page 4
existing) inequalities of access to quality education and the systemicachievement gap. I was looking at the past research on cognition, cognitivestyles, and mediation of thinking and learning, while trying to make senseof the array of new theories and practices of thinking skills instruction.During this time, the proponents of the nascent constructivist paradigmwere challenging the strict behavioralist mindset. As these many framesof reference converged in my mind, another insight arose, first hurriedlyscrawled across a paper napkin. My response was not a grand theory ormodel, nor a program of developmental lessons with a complex instrumentfor assessing thinking. It was a language called Thinking Maps.
Calling Thinking Maps a language was a clear expression of how theseeight visual tools, each surrounded by a visual frame of reference, workin unison, enabling all learners to communicate what and how they arethinking. Through this language, we have found that all learners convey,negotiate, and evolve meanings with others, and within themselves, throughvisual patterns of thinking.
As human beings, we thrive, creatively and analytically, largelybecause of our innate capacities for communicating through languages:alphabets, numerical systems, scientific symbols, musical notation, soft-ware programs, international sign language, and braille. Yet all of theselanguages have a foundation of fundamental cognitive structures suchas sequencing, categorizing, comparing, etc. Thinking Maps is really ameta-language for learning—an interrelated set of thinking patterns—forcommunicating and synthesizing our thinking from across these otherlanguages. Because of the universality of the cognitive skills upon whichthis language is based, and the visual-spatial, nonlinguistic form of thetools, the maps are used fluidly across content areas and cultures as shownin this book.
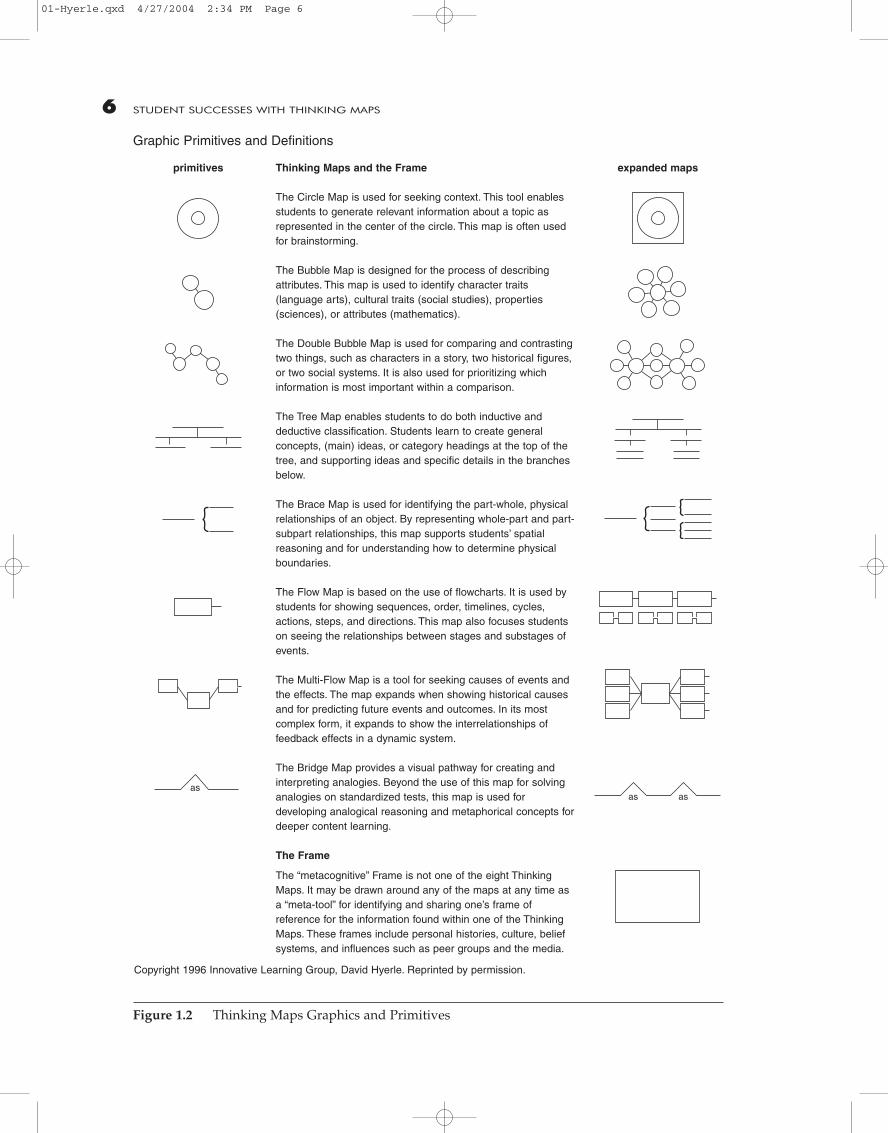
Thinking Maps, as a language, are eight cognitive skills, each repre-sented and activated by “graphic primitives” as displayed in static formin Figure 1.2 and expanded through our individual and cultural frames ofreference. These graphic primitives are used together, linked together,and visually scaffolded to create other products of learning such as a pieceof writing. Learners and teachers alike transfer and adapt the maps toshape and re-form otherwise static content knowledge and enter inter-disciplinary problem-solving, knowing they have tools to organize theirthinking. Ultimately, as the maps expand and integrate with words, num-bers, and other symbols on a page, colorfully across a white board, oron computer screens, learners face the boundless nature of their ownthinking.
Thinking Maps as VisualTools for Constructing Knowledge
On a global level, Thinking Maps also may be defined as a synthesis ofthree types of visual tools that educators and business people have usedfor generations: mind mapping–brainstorming webs, graphic organizers,
5THINKING MAPS AS A TRANSFORMATIONAL LANGUAGE FOR LEARNING
01-Hyerle.qxd 4/27/2004 2:34 PM Page 5
6 STUDENT SUCCESSES WITH THINKING MAPS
Figure 1.2 Thinking Maps Graphics and Primitives
Thinking Maps and the Frame
The Circle Map is used for seeking context. This tool enablesstudents to generate relevant information about a topic asrepresented in the center of the circle. This map is often usedfor brainstorming.
The Bubble Map is designed for the process of describingattributes. This map is used to identify character traits(language arts), cultural traits (social studies), properties(sciences), or attributes (mathematics).
The Double Bubble Map is used for comparing and contrastingtwo things, such as characters in a story, two historical figures,or two social systems. It is also used for prioritizing whichinformation is most important within a comparison.
The Tree Map enables students to do both inductive anddeductive classification. Students learn to create generalconcepts, (main) ideas, or category headings at the top of thetree, and supporting ideas and specific details in the branchesbelow.
The Brace Map is used for identifying the part-whole, physicalrelationships of an object. By representing whole-part and part-subpart relationships, this map supports students’ spatialreasoning and for understanding how to determine physicalboundaries.
The Flow Map is based on the use of flowcharts. It is used bystudents for showing sequences, order, timelines, cycles,actions, steps, and directions. This map also focuses studentson seeing the relationships between stages and substages ofevents.
The Multi-Flow Map is a tool for seeking causes of events andthe effects. The map expands when showing historical causesand for predicting future events and outcomes. In its mostcomplex form, it expands to show the interrelationships offeedback effects in a dynamic system.
The Bridge Map provides a visual pathway for creating andinterpreting analogies. Beyond the use of this map for solvinganalogies on standardized tests, this map is used fordeveloping analogical reasoning and metaphorical concepts fordeeper content learning.
The Frame
The “metacognitive” Frame is not one of the eight ThinkingMaps. It may be drawn around any of the maps at any time asa “meta-tool” for identifying and sharing one’s frame ofreference for the information found within one of the ThinkingMaps. These frames include personal histories, culture, beliefsystems, and influences such as peer groups and the media.
expanded mapsprimitives
asas as
Graphic Primitives and Definitions
Copyright 1996 Innovative Learning Group, David Hyerle. Reprinted by permission.
01-Hyerle.qxd 4/27/2004 2:34 PM Page 6
and thinking-process tools such as concept mapping. During my laterresearch on Thinking Maps, I became intrigued by different types of visualtools, finally writing two comprehensive books on the theory, practice, anddegree of effectiveness of these tools (Hyerle, 1996, 2000). I discoveredthrough research, my own teaching, and experiences that each of thesetypes of visual tools offered useful ways of visually accessing knowledge.
I also found that each kind of visual tool also had some weaknessesthat could not be overlooked. Early mind-mapping techniques that sur-faced in the early 1970s facilitate open-minded thinking yet lack the con-sistent structure and deeper levels of complexity required for today’sclassrooms. The now familiar “graphic organizers,” which surfaced in the1980s, help students organize large amount of information and scaffoldthinking but fail when they become static, blackline masters focused onisolated content tasks selected by the teacher, rather than initiated by thelearner. These tools are task-specific organizers because they usually focuson a specific content task and are often confined to the task at hand ratherthan easily transferable across disciplines.
A third kind of visual tool, “thinking-process” maps, is based on facili-tating well-defined thinking processes. Two of these forms, concept mappingand systems diagramming, richly convey complex interdependencies inconcepts and systems, respectively. Embedded in the strengths of these twomodels are also limitations: These models are each dependent on one form ofvisually structuring knowledge, hierarchical forms for concept mapping andfeedback loops for systems diagrams. This leads to an underrepresentationof other thinking processes. In addition, in practice, the translation of thesecomplex models is often daunting to students and teachers alike.
The combined practical, theoretical, and critical attributes of thesedifferent types of visual tools have informed the continuing evolution ofThinking Maps into a twenty-first-century language for learning, synthe-sizing many of the best qualities of these other types of visual tools: anevolution from the generative quality of brainstorming webs, the organiz-ing structure of graphic organizers, and the deep cognitive processing foundin concept maps.
FIVE QUALITIES OF THINKING MAPS
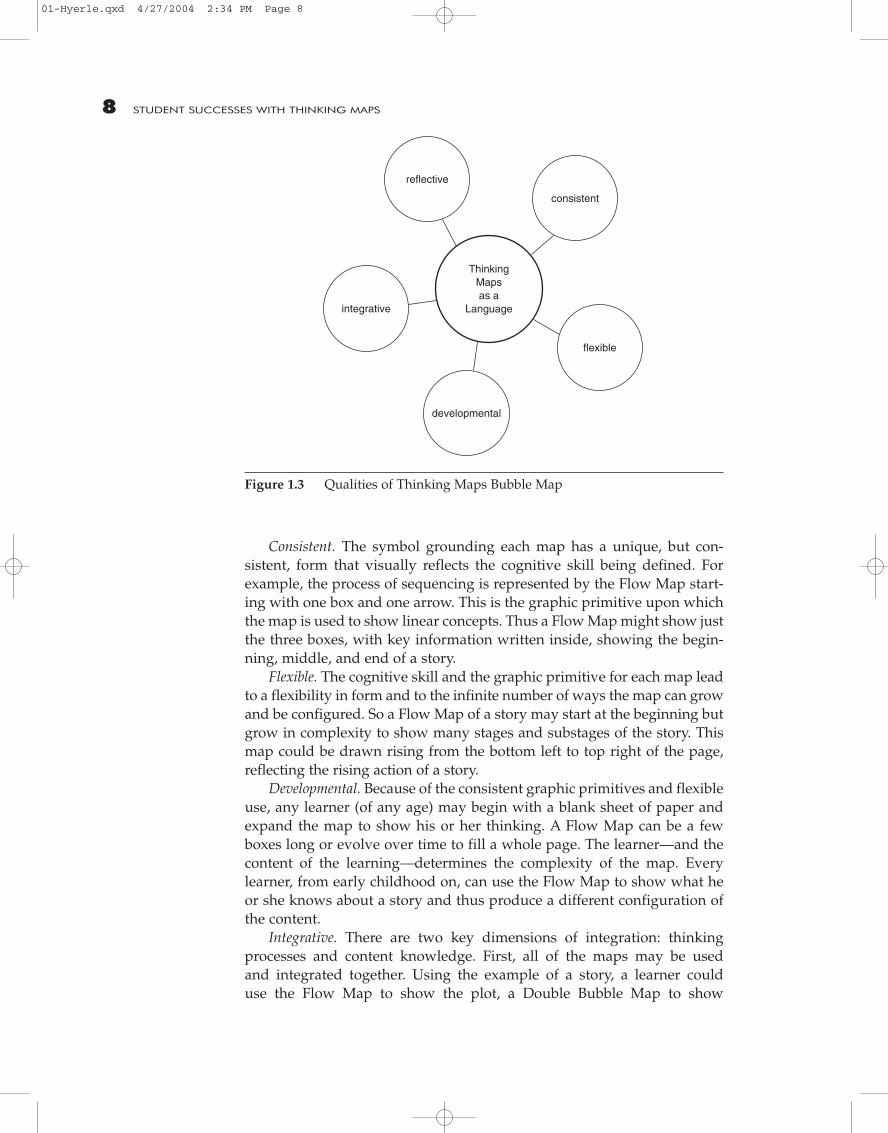
The key characteristics of different types of visual tools led to ThinkingMaps becoming a language of cognitive patterns that is analogous to thekey or legend of symbols that you will find on any map. The graphic sym-bols are the simple visual starting points for generating complex maps forcognitive networks that link together content using a range of thinkingprocesses. Each of the eight maps is theoretically grounded in a funda-mental cognitive process or thinking skill. Awareness of five critical attrib-utes of Thinking Maps (Figure 1.3), and a close look at just one of the eightmaps (the Flow Map), will clarify how all the maps work, and how theywork together.
7THINKING MAPS AS A TRANSFORMATIONAL LANGUAGE FOR LEARNING
01-Hyerle.qxd 4/27/2004 2:34 PM Page 7
Consistent. The symbol grounding each map has a unique, but con-sistent, form that visually reflects the cognitive skill being defined. Forexample, the process of sequencing is represented by the Flow Map start-ing with one box and one arrow. This is the graphic primitive upon whichthe map is used to show linear concepts. Thus a Flow Map might show justthe three boxes, with key information written inside, showing the begin-ning, middle, and end of a story.
Flexible. The cognitive skill and the graphic primitive for each map leadto a flexibility in form and to the infinite number of ways the map can growand be configured. So a Flow Map of a story may start at the beginning butgrow in complexity to show many stages and substages of the story. Thismap could be drawn rising from the bottom left to top right of the page,reflecting the rising action of a story.
Developmental. Because of the consistent graphic primitives and flexibleuse, any learner (of any age) may begin with a blank sheet of paper andexpand the map to show his or her thinking. A Flow Map can be a fewboxes long or evolve over time to fill a whole page. The learner—and thecontent of the learning—determines the complexity of the map. Everylearner, from early childhood on, can use the Flow Map to show what heor she knows about a story and thus produce a different configuration ofthe content.
Integrative. There are two key dimensions of integration: thinkingprocesses and content knowledge. First, all of the maps may be usedand integrated together. Using the example of a story, a learner coulduse the Flow Map to show the plot, a Double Bubble Map to show
8 STUDENT SUCCESSES WITH THINKING MAPS
flexible
ThinkingMapsas a
Language
consistent
reflective
integrative
developmental
Figure 1.3 Qualities of Thinking Maps Bubble Map
01-Hyerle.qxd 4/27/2004 2:34 PM Page 8
a comparison of characters, and then a Tree Map to identify the mainideas and supporting details. Multiple Thinking Maps are used for solvingmultistep problems, for comprehending overlapping reading text struc-tures, and for use during phases of the writing process. Second, the mapsare used deeply within and across content areas. For example, the FlowMap is used for plot analysis in reading comprehension, order of opera-tions in math, historical timelines in social studies, and studying recurringnatural cycles in science.
Reflective. As a language, the maps unveil what and how one is think-ing in patterns. Not only can the learner look down and reflect upon thepattern of content, but the teacher also reflects on and informally assessesthe content learning and thinking processes of the learner. In addition, atany time and with every map, learners may draw a rectangular framearound a map. This represents one’s frame of reference, or metacognitiveframe. For example, a high school student may have sketched out a FlowMap and identified a half dozen turning points in the flow of a novel. Bydrawing the frame around the map, the student can jot down what influ-enced this analysis and the references in the text. The framing tool goesbeyond merely referencing what one knows, to ask the learners how theyknow the information within each map.
These five characteristics are exemplified by the work of Bob Fardy, ascience curriculum coordinator in the Concord, Massachusetts, schools.Below, Bob discusses how he used multiple maps and the frame during anaction research design to help second grade students in learning abouthow to understand different types of rocks and how to develop a rubric forfurther scientific discoveries. He reveals how these consistent and flexiblevisual tools are integrated together in classrooms through practice that isdevelopmentally appropriate and reflective.
�DDeevveellooppiinngg aa RRoocckk RRuubbrriicc uussiinngg
MMuullttiippllee TThhiinnkkiinngg MMaappss
((bbyy BBoobb FFaarrddyy))
At the beginning of a “rocks and minerals” unit, I introduced second-gradestudents to three Thinking Maps: the Circle, Bubble, and Double BubbleMaps. In our school district, classroom teachers often use the K-W-L strategy(Ogle, 1988) when their students begin a new topic or unit of study. The strat-egy is an effective way for students, at the beginning of the unit or lesson, toidentify what they already know (K) and what they want (W) to know abouta topic, and to identify what they have learned (L) at the conclusion. As bothteachers and students were familiar with this approach, I introduced thestudents to the Circle Map and asked them to share what they already knewabout rocks.
9THINKING MAPS AS A TRANSFORMATIONAL LANGUAGE FOR LEARNING
01-Hyerle.qxd 4/27/2004 2:34 PM Page 9
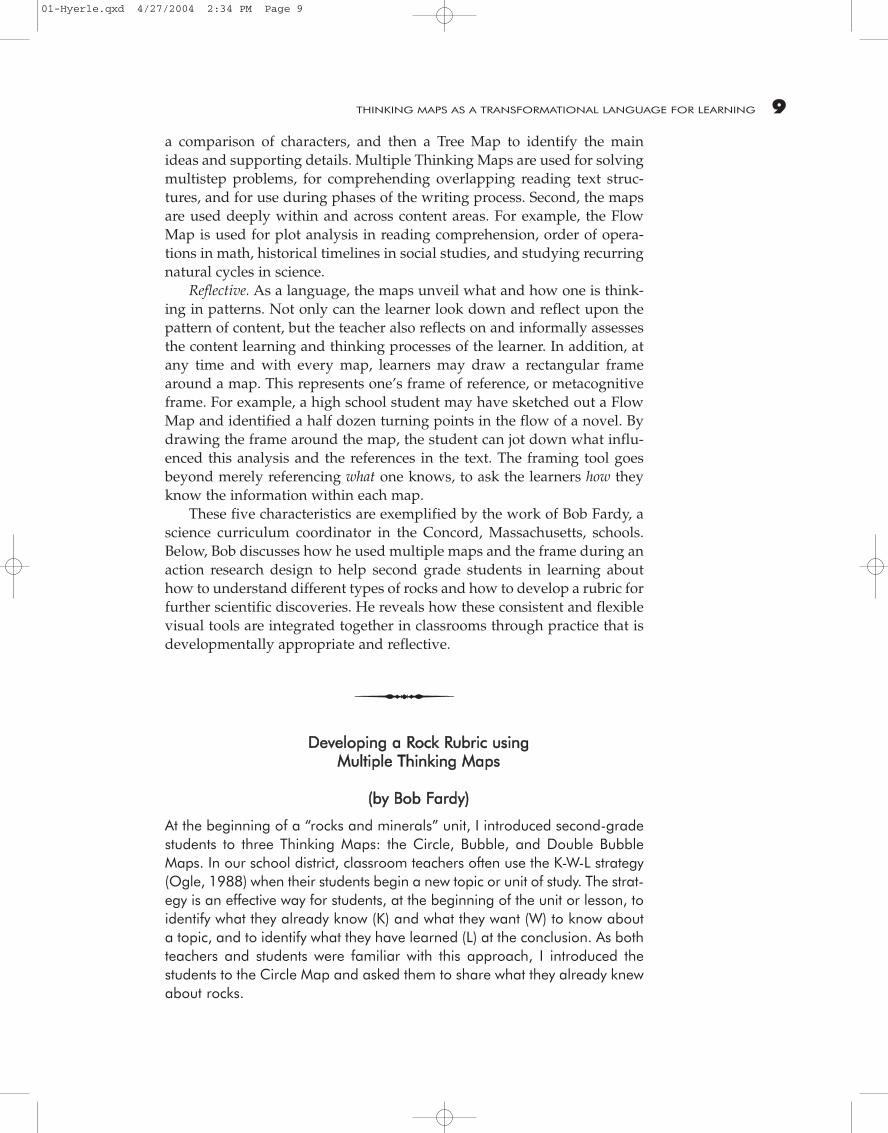
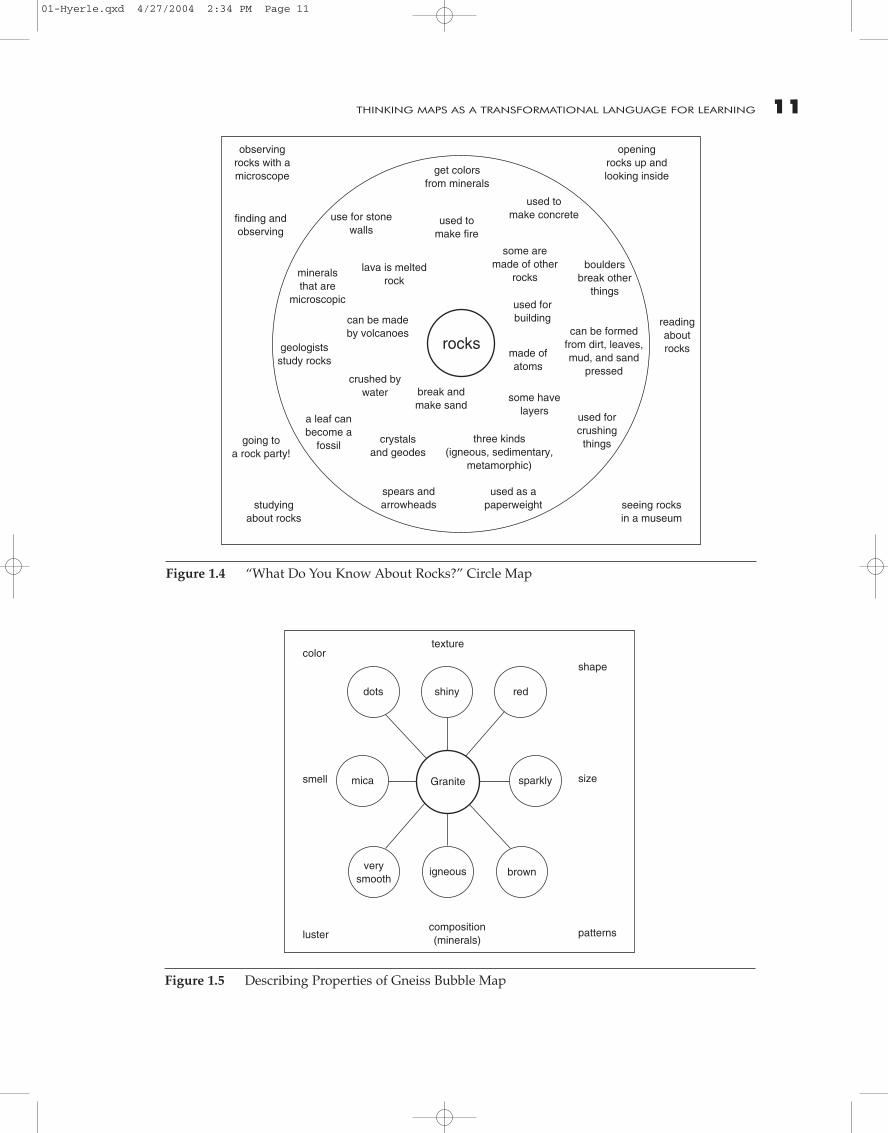
The Circle Map (Figure 1.4) proved to be an effective brainstorming toolfor the students. I recorded and displayed the students’ responses betweenthe concentric circles of the map. This tool helped me to carefully avoid anykind of linear listing, clustering, or linking of their responses that mightimply or infer some kind of hierarchical ordering of their ideas and/or mak-ing connections between and among their comments. In this way, the CircleMap served as a classroom mirror, reflecting the fluency and flexibilityof students’ thinking, ideas, and information at that moment in time. Asthe students continued to brainstorm what they knew about rocks, I beganto see the Circle Map as more than a mirror that reflected the students’responses. The map was also serving as a window, providing a means toaccess and assess the students’ thinking. I could identify their prior knowl-edge and surface some possible misconceptions and alternative conceptualframeworks. Indeed, the Circle Map was emerging as an effective tool forboth assessment and brainstorming.
For me, the distinguishing feature of the eight Thinking Maps, as com-pared with more traditional visual tools, is the “Frame” of reference which,as a metacognitive device, added another dimension to the lesson. As thestudents and I reviewed the Circle Map, we acknowledged the fact that “wealready knew many things about rocks.” Transferring our attention to theFrame, I asked the students, “How did you learn what you already know ?”In responding to this question, the students were reflecting on their ownlearning and at the same time were informing me as to the diversity oflearning experiences that had been their avenues for acquiring knowledgeand constructing meaning. The students identified their “ways of knowingand learning” in the outside frame.
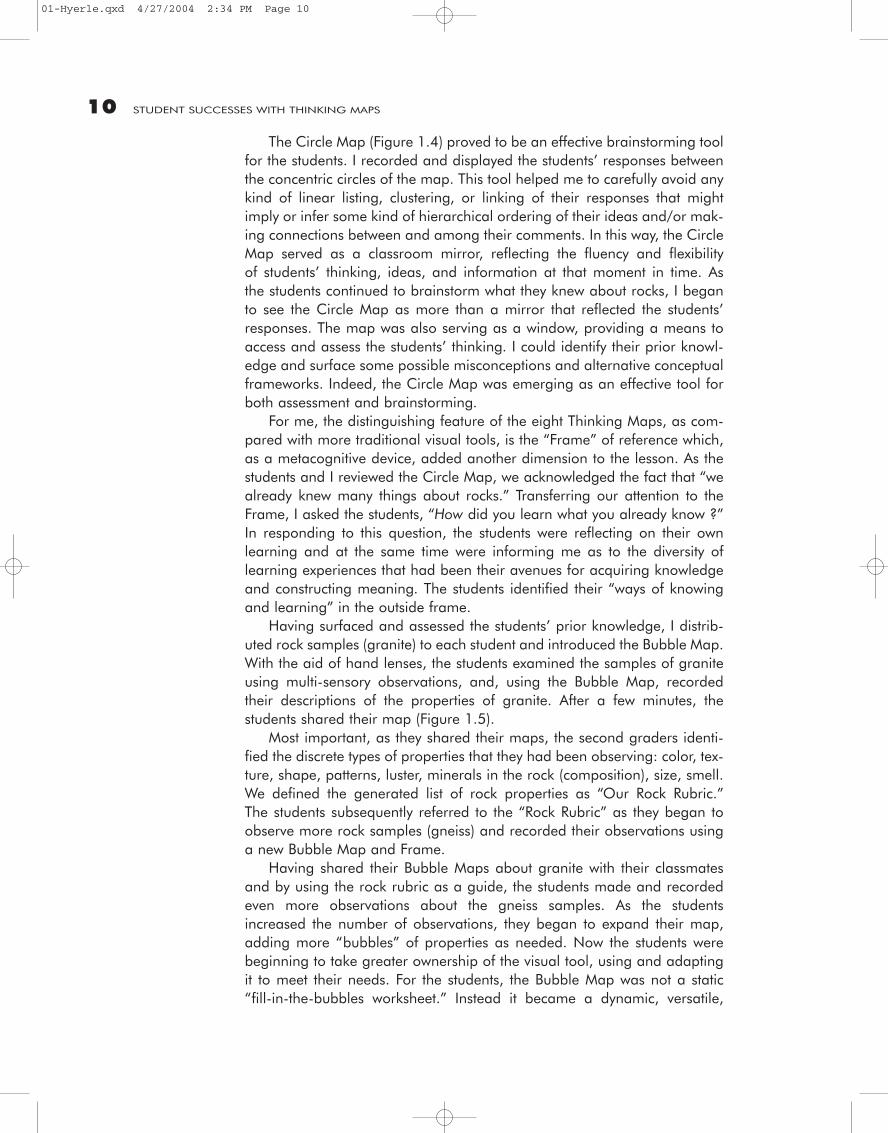
Having surfaced and assessed the students’ prior knowledge, I distrib-uted rock samples (granite) to each student and introduced the Bubble Map.With the aid of hand lenses, the students examined the samples of graniteusing multi-sensory observations, and, using the Bubble Map, recordedtheir descriptions of the properties of granite. After a few minutes, thestudents shared their map (Figure 1.5).
Most important, as they shared their maps, the second graders identi-fied the discrete types of properties that they had been observing: color, tex-ture, shape, patterns, luster, minerals in the rock (composition), size, smell.We defined the generated list of rock properties as “Our Rock Rubric.”The students subsequently referred to the “Rock Rubric” as they began toobserve more rock samples (gneiss) and recorded their observations usinga new Bubble Map and Frame.
Having shared their Bubble Maps about granite with their classmatesand by using the rock rubric as a guide, the students made and recordedeven more observations about the gneiss samples. As the studentsincreased the number of observations, they began to expand their map,adding more “bubbles” of properties as needed. Now the students werebeginning to take greater ownership of the visual tool, using and adaptingit to meet their needs. For the students, the Bubble Map was not a static“fill-in-the-bubbles worksheet.” Instead it became a dynamic, versatile,
10 STUDENT SUCCESSES WITH THINKING MAPS
01-Hyerle.qxd 4/27/2004 2:34 PM Page 10
11THINKING MAPS AS A TRANSFORMATIONAL LANGUAGE FOR LEARNING
observingrocks with amicroscope
finding andobserving
going toa rock party!
studyingabout rocks
seeing rocksin a museum
readingaboutrocks
openingrocks up and looking inside
use for stonewalls
get colorsfrom minerals
used tomake concrete
bouldersbreak other
things
can be formedfrom dirt, leaves,mud, and sand
pressed
used tomake fire
used forbuilding
made ofatoms
some havelayers
break and make sand
rocks
used as apaperweight
spears andarrowheads
crystalsand geodes
a leaf canbecome a
fossil
crushed bywater
can be madeby volcanoes
geologistsstudy rocks
lava is meltedrock
mineralsthat are
microscopic
some aremade of other
rocks
three kinds(igneous, sedimentary,
metamorphic)
used forcrushingthings
Figure 1.4 “What Do You Know About Rocks?” Circle Map
colortexture
shape
size
patternscomposition(minerals)luster
smell
verysmooth
igneous brown
dots shiny red
mica sparklyGranite
Figure 1.5 Describing Properties of Gneiss Bubble Map
01-Hyerle.qxd 4/27/2004 2:34 PM Page 11
open-ended graphic with a certain “elasticity” that could be stretched intandem with their thinking.
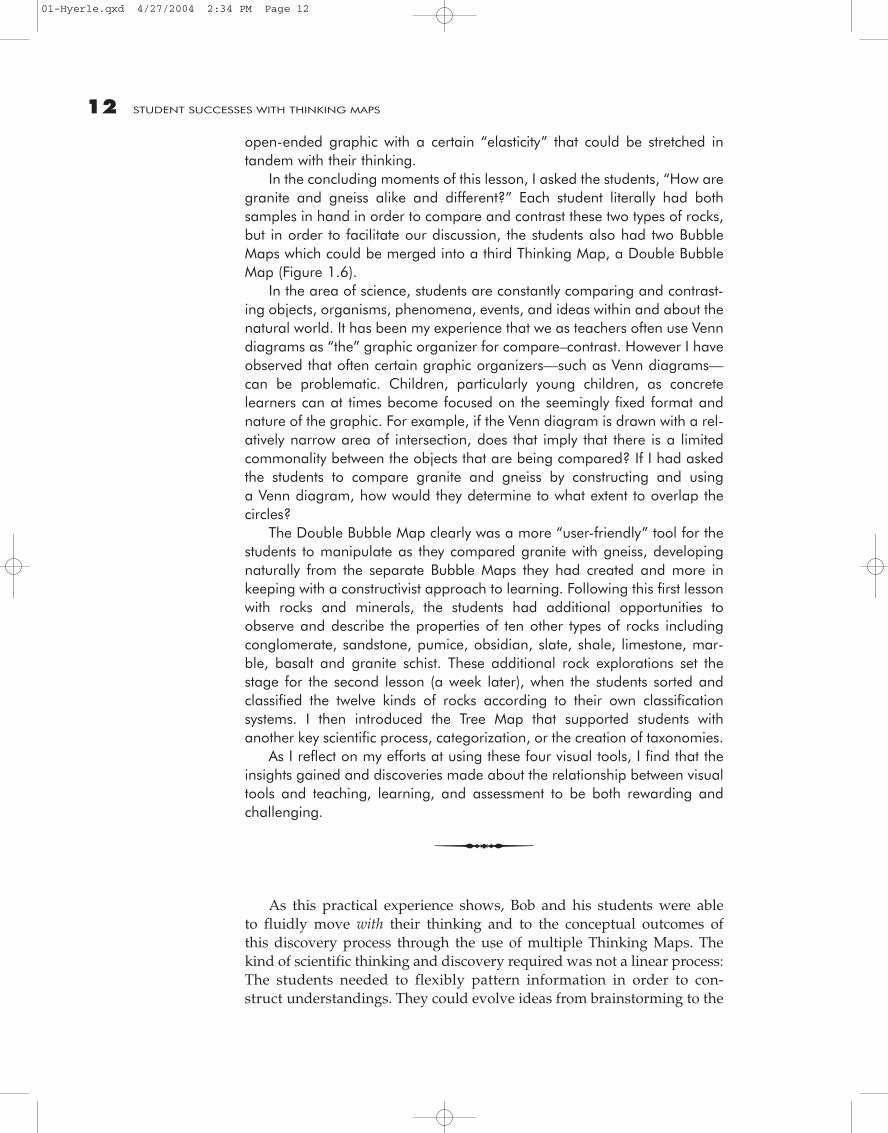
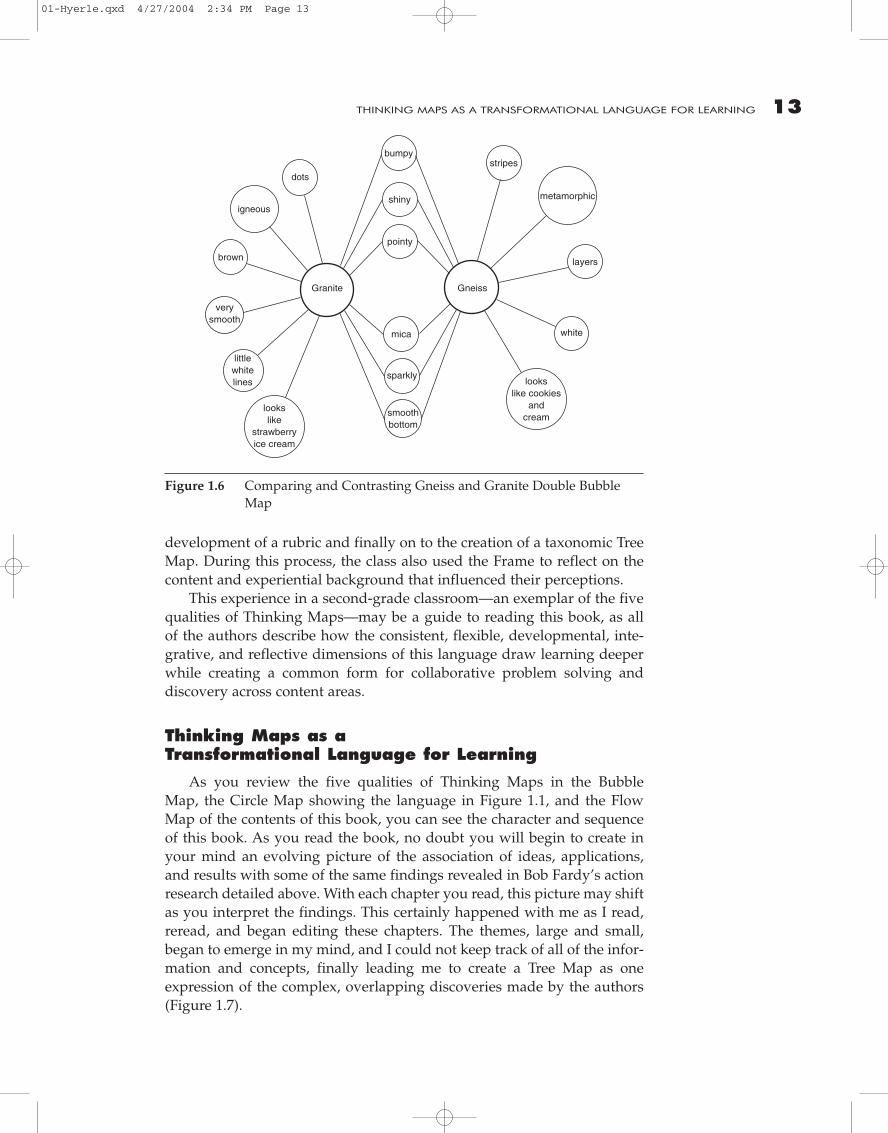
In the concluding moments of this lesson, I asked the students, “How aregranite and gneiss alike and different?” Each student literally had bothsamples in hand in order to compare and contrast these two types of rocks,but in order to facilitate our discussion, the students also had two BubbleMaps which could be merged into a third Thinking Map, a Double BubbleMap (Figure 1.6).
In the area of science, students are constantly comparing and contrast-ing objects, organisms, phenomena, events, and ideas within and about thenatural world. It has been my experience that we as teachers often use Venndiagrams as “the” graphic organizer for compare–contrast. However I haveobserved that often certain graphic organizers—such as Venn diagrams—can be problematic. Children, particularly young children, as concretelearners can at times become focused on the seemingly fixed format andnature of the graphic. For example, if the Venn diagram is drawn with a rel-atively narrow area of intersection, does that imply that there is a limitedcommonality between the objects that are being compared? If I had askedthe students to compare granite and gneiss by constructing and usinga Venn diagram, how would they determine to what extent to overlap thecircles?
The Double Bubble Map clearly was a more “user-friendly” tool for thestudents to manipulate as they compared granite with gneiss, developingnaturally from the separate Bubble Maps they had created and more inkeeping with a constructivist approach to learning. Following this first lessonwith rocks and minerals, the students had additional opportunities toobserve and describe the properties of ten other types of rocks includingconglomerate, sandstone, pumice, obsidian, slate, shale, limestone, mar-ble, basalt and granite schist. These additional rock explorations set thestage for the second lesson (a week later), when the students sorted andclassified the twelve kinds of rocks according to their own classificationsystems. I then introduced the Tree Map that supported students withanother key scientific process, categorization, or the creation of taxonomies.
As I reflect on my efforts at using these four visual tools, I find that theinsights gained and discoveries made about the relationship between visualtools and teaching, learning, and assessment to be both rewarding andchallenging.
�As this practical experience shows, Bob and his students were able
to fluidly move with their thinking and to the conceptual outcomes ofthis discovery process through the use of multiple Thinking Maps. Thekind of scientific thinking and discovery required was not a linear process:The students needed to flexibly pattern information in order to con-struct understandings. They could evolve ideas from brainstorming to the
12 STUDENT SUCCESSES WITH THINKING MAPS
01-Hyerle.qxd 4/27/2004 2:34 PM Page 12
development of a rubric and finally on to the creation of a taxonomic TreeMap. During this process, the class also used the Frame to reflect on thecontent and experiential background that influenced their perceptions.
This experience in a second-grade classroom—an exemplar of the fivequalities of Thinking Maps—may be a guide to reading this book, as allof the authors describe how the consistent, flexible, developmental, inte-grative, and reflective dimensions of this language draw learning deeperwhile creating a common form for collaborative problem solving anddiscovery across content areas.
Thinking Maps as aTransformational Language for Learning
As you review the five qualities of Thinking Maps in the BubbleMap, the Circle Map showing the language in Figure 1.1, and the FlowMap of the contents of this book, you can see the character and sequenceof this book. As you read the book, no doubt you will begin to create inyour mind an evolving picture of the association of ideas, applications,and results with some of the same findings revealed in Bob Fardy’s actionresearch detailed above. With each chapter you read, this picture may shiftas you interpret the findings. This certainly happened with me as I read,reread, and began editing these chapters. The themes, large and small,began to emerge in my mind, and I could not keep track of all of the infor-mation and concepts, finally leading me to create a Tree Map as oneexpression of the complex, overlapping discoveries made by the authors(Figure 1.7).
13THINKING MAPS AS A TRANSFORMATIONAL LANGUAGE FOR LEARNING
dots
igneous
brown
verysmooth
littlewhitelines
lookslike
strawberryice cream
Granite
bumpy
shiny
pointy
Gneiss
stripes
metamorphic
mica
sparkly
smoothbottom
white
layers
lookslike cookies
andcream
Figure 1.6 Comparing and Contrasting Gneiss and Granite Double BubbleMap
01-Hyerle.qxd 4/27/2004 2:34 PM Page 13
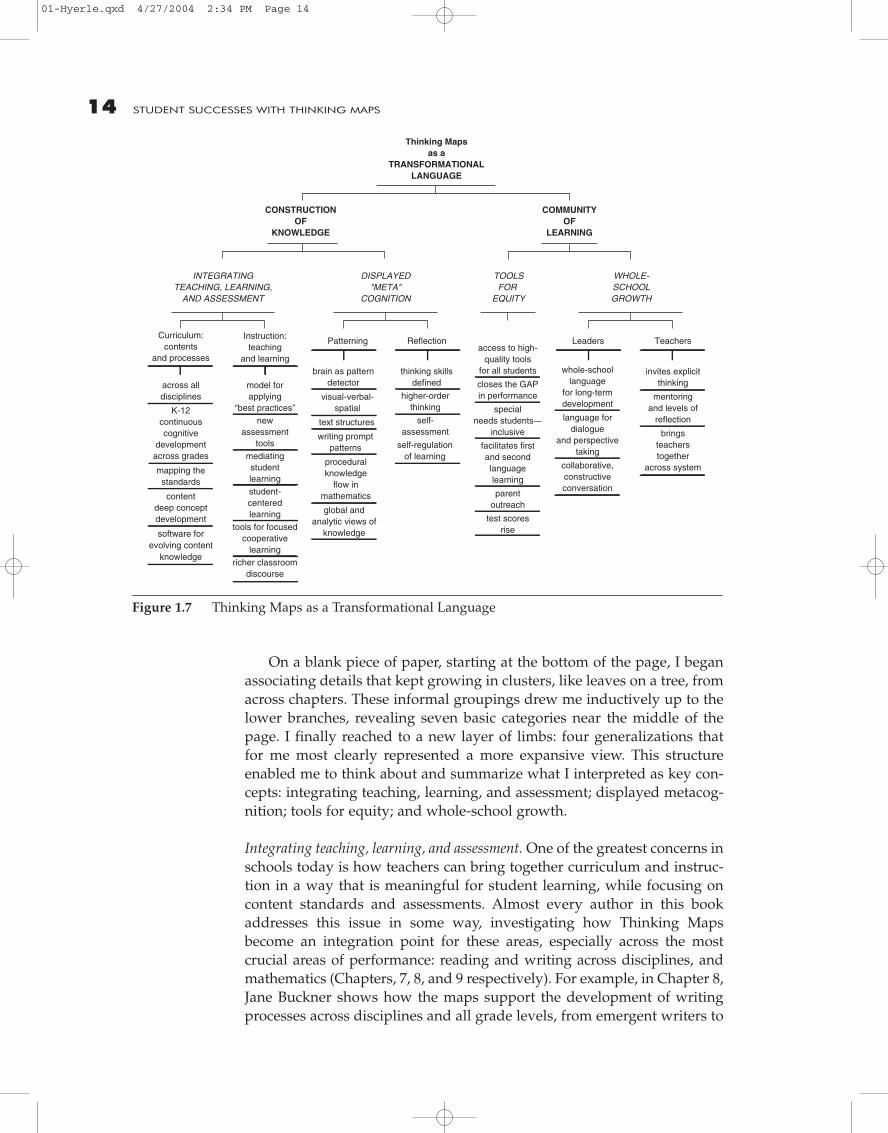
On a blank piece of paper, starting at the bottom of the page, I beganassociating details that kept growing in clusters, like leaves on a tree, fromacross chapters. These informal groupings drew me inductively up to thelower branches, revealing seven basic categories near the middle of thepage. I finally reached to a new layer of limbs: four generalizations thatfor me most clearly represented a more expansive view. This structureenabled me to think about and summarize what I interpreted as key con-cepts: integrating teaching, learning, and assessment; displayed metacog-nition; tools for equity; and whole-school growth.
Integrating teaching, learning, and assessment. One of the greatest concerns inschools today is how teachers can bring together curriculum and instruc-tion in a way that is meaningful for student learning, while focusing oncontent standards and assessments. Almost every author in this bookaddresses this issue in some way, investigating how Thinking Mapsbecome an integration point for these areas, especially across the mostcrucial areas of performance: reading and writing across disciplines, andmathematics (Chapters, 7, 8, and 9 respectively). For example, in Chapter 8,Jane Buckner shows how the maps support the development of writingprocesses across disciplines and all grade levels, from emergent writers to
14 STUDENT SUCCESSES WITH THINKING MAPS
Thinking Mapsas a
TRANSFORMATIONALLANGUAGE
CONSTRUCTIONOF
KNOWLEDGE
COMMUNITYOF
LEARNING
access to high-quality tools
for all students
closes the GAP in performance
specialneeds students−−
inclusive
facilitates firstand secondlanguagelearning
parentoutreach
test scoresrise
TOOLSFOR
EQUITY
INTEGRATINGTEACHING, LEARNING,
AND ASSESSMENT
Curriculum:contents
and processes
across alldisciplines
K-12continuous cognitive
developmentacross grades
mapping thestandards
content deep concept development
software for evolving content
knowledge
Instruction:teaching
and learning
model forapplying
“best practices”new
assessment tools
mediatingstudent learningstudent-centered learning
tools for focused cooperative
learningricher classroom
discourse
Leaders Teachers
whole-schoollanguage
for long-termdevelopment
invites explicitthinking
mentoringand levels of
reflection
bringsteachers together
across system
language fordialogue
and perspectivetaking
collaborative,constructiveconversation
WHOLE-SCHOOLGROWTH
Patterning Reflection
brain as patterndetector
visual-verbal- spatial
higher-orderthinking
self-assessment
self-regulationof learning
text structures
writing promptpatterns
proceduralknowledge
flow in mathematics
global andanalytic views of
knowledge
thinking skillsdefined
DISPLAYED"META"
COGNITION
Figure 1.7 Thinking Maps as a Transformational Language
01-Hyerle.qxd 4/27/2004 2:34 PM Page 14
high school levels, by providing clear “structures for organization.” Sheemphasizes the need for teachers to model the integrated use of the mapsacross writing prompts and links this work to specific state assessments.
Displayed metacognition. This term was coined by Dr. Art Costa as adescription of the power of visual tools, because these tools display beforethe learner a range of cognitive patterns of thinking, thus enabling richerreflections. This phrase also captures a central point made by manyauthors: When using Thinking Maps, students, teachers, and administra-tors become self-reflective, looking into their own thinking, and becomeself-regulated learners. These patterns, as Chris Yeager discusses inChapter 2, are extensions of how the brain works. The brain actively bindsdata together through neural patterns and networks information, pruningas needed, chunking information, grasping bits of linked information inworking memory, and then holding onto them in long-term memory. Chrisalso dovetails Robert Marzano’s research on best practices with brainresearch using a description of a fifth-grade social studies class. BonnieSinger follows in the next chapter by telling the “Story of David,” a boywith severe learning disabilities who, through the use of these tools overtwo years, was transformed from being a student with low performanceto a self-regulated learner.
Tools for equity. While the idea of facilitating cognitive and metacognitivedevelopment has been central to the past 50 years of educational psychol-ogy and neuroscience, often the promise of thinking skills instructionremained elusive and inaccessible to those in the greatest need. Anothertheme that arises from this book is an understanding that the mapsdirectly support teachers in mediating students’ thinking. In Chapter 5,Yvette Jackson discusses how the maps become tools for mediating think-ing and literacy development, especially when supporting children ofcolor who are struggling to learn in underachieving, inner-city schools. AsYvette points out, these children are often merely remediated throughrepetitive cycles of content learning but not deeply mediated through theirthinking abilities.
Ultimately, the issue here is about equal access to high-quality toolsfor thinking and instruction that support all students’ thinking abilities,across languages and cultures at the highest level. This call for equity isanswered throughout the book, most clearly in the stories by StefanieHolzman in Chapter 10 from a school in California and by Marjann Ball inChapter 13 from a junior college in Mississippi. Both of these chapterspresent research and results showing significant gains for closing theachievement gap.
Whole-school growth. The field of education is now faced with the complexproblem of teaching to the “whole child” while also attempting to trans-form “whole schools.” We are moving away from seeing students asindividual learners in straight rows of desks to a model of learning basedon a circle of learning. Many schools are directly teaching to the social and
15THINKING MAPS AS A TRANSFORMATIONAL LANGUAGE FOR LEARNING
01-Hyerle.qxd 4/27/2004 2:34 PM Page 15
emotional needs of all children, understanding that these are not justpathways to learning content, but are important in and of themselves. Thisinvolves consciously integrating conflict resolution and cooperative andsocial-emotional learning into the classroom context.
A similar shift is now occurring in the area of organizational changeacross whole schools as educators are becoming aware of how learningand leadership are intimately connected. An undercurrent of everychapter in this book is the depth of self-learning attained by students,teachers, and administrators in the context of working across whole schools. InChapters 10–12, we are offered detailed histories of how three very differ-ent schools across the K–12 spectrum implemented Thinking Maps as alanguage in their whole schools, clearly demonstrating how learning,teaching, and leadership are united through these common tools. In thelast three chapters, the authors focus on how educators learn to worktogether by visually surfacing perceptions and ideas through their interac-tions with each other. So often the conversations that happen in meetingsin schools become procedural rather than reflective, sometimes combativerather than constructive. Larry Alper closes his chapter and this book byoffering the term constructivist conversations as an expression of howThinking Maps become a new language for deepening conversations sothat people come together through the maps, facing their own and eachother’s thinking, “opening the space” for problem-solving and transform-ing the quality of thinking and learning across the whole school.
The four central ideas discussed above joined together for me as twomajor themes: “construction of knowledge” as a framework for learningand “communities of learning” expressing the communal quality of theeducational experience. I finally reached the top of the tree, discoveringthe overarching view from which I could see and make sense of the detailswithin the whole of the book Thinking Maps as a Transformational Languagefor Learning. The authors show us that Thinking Maps are a transformativelanguage for learning for personal growth, for collaborative work acrosscomplex and increasingly “virtual” technological organizations and soci-eties, and as common pathways for communicating across diverse lan-guages and cultures. As you may see in the written and graphic formsthroughout this book, these maps have simple starting points and spreadorganically as a seed maturing to full growth, providing for the creation ofinfinitely complex patterns of knowledge for every child, drawing out ourmultiple frames of reference and mirroring the richly textured landscapeof our lives.
16 STUDENT SUCCESSES WITH THINKING MAPS
01-Hyerle.qxd 4/27/2004 2:34 PM Page 16