Embed Size (px)
Citation preview

Climate Change Impacts on Water Resources
in the Lake Tana Basin in Ethiopia
Abaye Getahun Abebe
Supervisor:
Professor M.McClain
Mentor:
Dr. Shreedhar Maskey
Delft, April 2016
Examination Committee:
Professor M.McClain
Dr. Shreedhar Maskey
Dr. Patricia Trambauer
Contents
Introduction
• Study Area
Objectives
Materials and methods
Result and Discussion
Conclusion and Recommendation
2
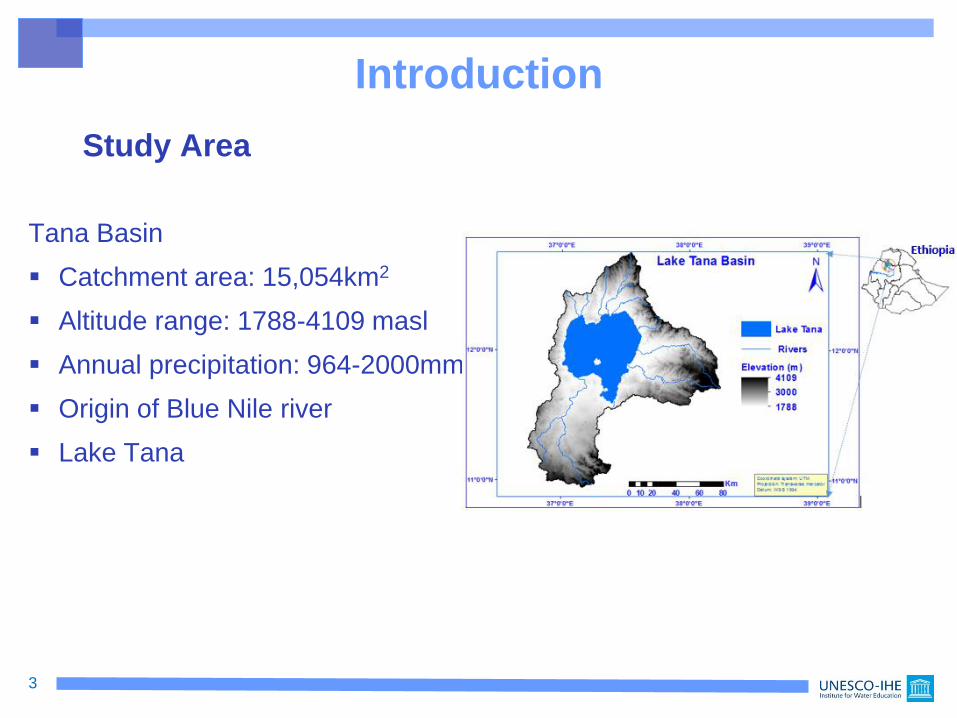
Introduction
Tana Basin
Catchment area: 15,054km2
Altitude range: 1788-4109 masl
Annual precipitation: 964-2000mm
Origin of Blue Nile river
Lake Tana
3
Study Area
Introduction
4
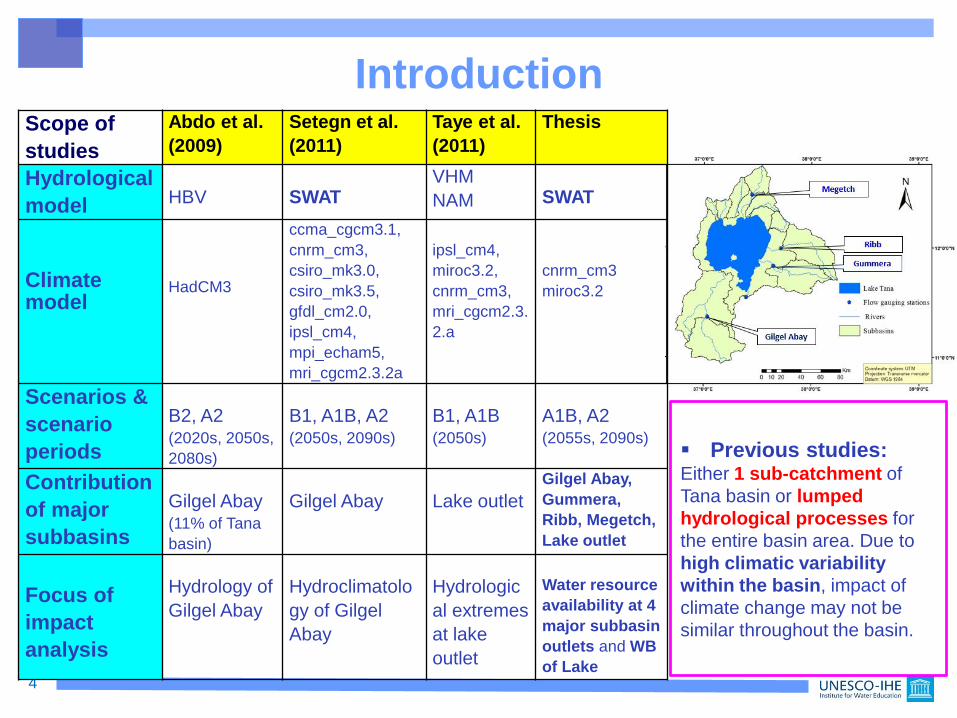
Scope of
studies
Abdo et al.
(2009)
Setegn et al.
(2011)
Taye et al.
(2011)
Thesis
Hydrological
model HBV SWATVHM
NAM SWAT
Climate model
HadCM3
ccma_cgcm3.1,
cnrm_cm3,
csiro_mk3.0,
csiro_mk3.5,
gfdl_cm2.0,
ipsl_cm4,
mpi_echam5,
mri_cgcm2.3.2a
ipsl_cm4,
miroc3.2,
cnrm_cm3,
mri_cgcm2.3.
2.a
cnrm_cm3
miroc3.2
Scenarios &
scenario
periods
B2, A2(2020s, 2050s,
2080s)
B1, A1B, A2 (2050s, 2090s)
B1, A1B(2050s)
A1B, A2(2055s, 2090s)
Contribution
of major
subbasins
Gilgel Abay(11% of Tana
basin)
Gilgel Abay Lake outlet
Gilgel Abay,
Gummera,
Ribb, Megetch,
Lake outlet
Focus of
impact
analysis
Hydrology of
Gilgel Abay
Hydroclimatolo
gy of Gilgel
Abay
Hydrologic
al extremes
at lake
outlet
Water resource
availability at 4
major subbasin
outlets and WB
of Lake
v
Previous studies:Either 1 sub-catchment of
Tana basin or lumped
hydrological processes for
the entire basin area. Due to
high climatic variability
within the basin, impact of
climate change may not be
similar throughout the basin. j
v
Objectives
Main objective:
To analyse climate change impacts on hydrology and water
resources of Tana basin using process based hydrological model
Specific objectives:
To analyse the past and future climatic variable changes in
precipitation and temperature
To analyse climate change impacts on water resources in the Tana
basin
To study the variations in climate change impacts at different sub-
basins of Lake Tana
5
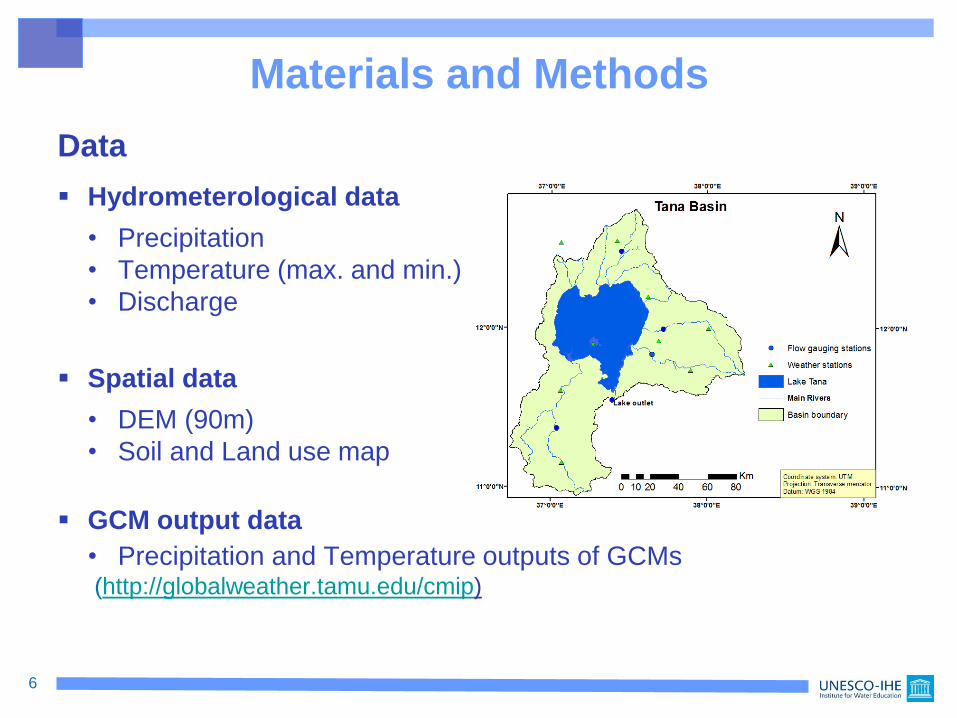
Materials and Methods
Data
Hydrometerological data
• Precipitation
• Temperature (max. and min.)
• Discharge
Spatial data
• DEM (90m)
• Soil and Land use map
GCM output data
• Precipitation and Temperature outputs of GCMs(http://globalweather.tamu.edu/cmip)
6
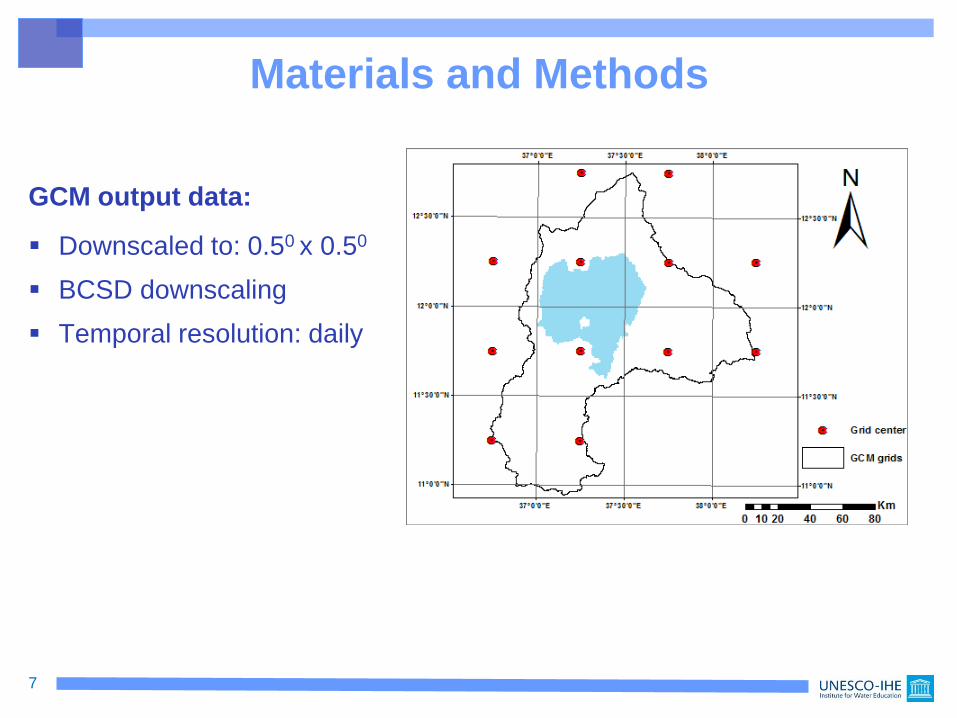
Materials and Methods
GCM output data:
Downscaled to: 0.50 x 0.50
BCSD downscaling
Temporal resolution: daily
7
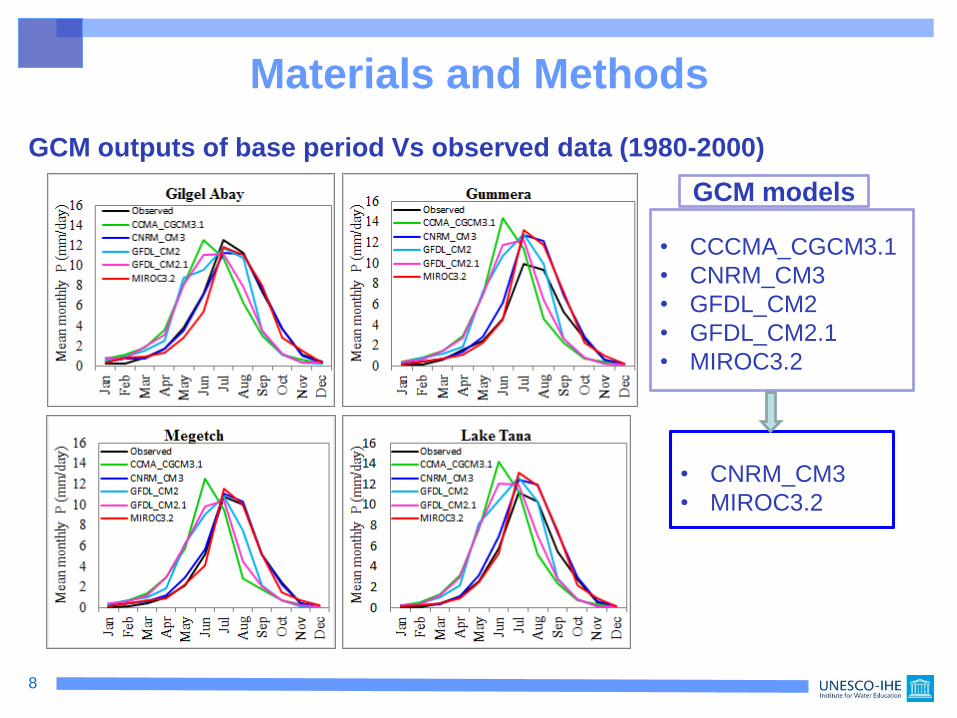
Materials and Methods
GCM outputs of base period Vs observed data (1980-2000)
8
• CCCMA_CGCM3.1
• CNRM_CM3
• GFDL_CM2
• GFDL_CM2.1
• MIROC3.2
• CNRM_CM3
• MIROC3.2
GCM models
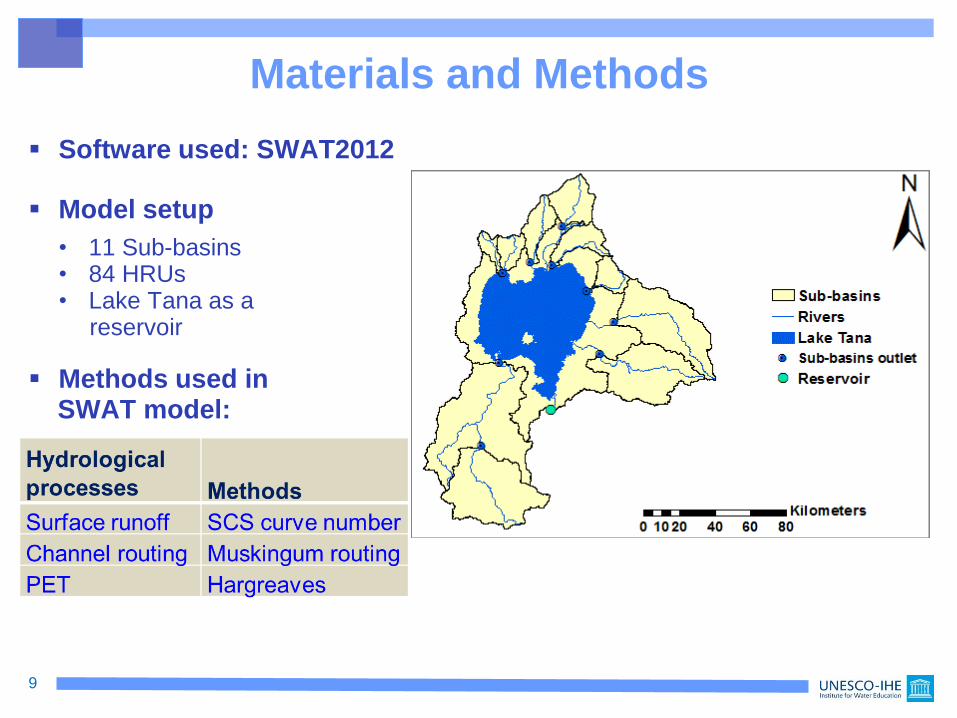
Materials and Methods
Software used: SWAT2012
Model setup
• 11 Sub-basins• 84 HRUs• Lake Tana as a
reservoir
Methods used inSWAT model:
9
Result and Discussion
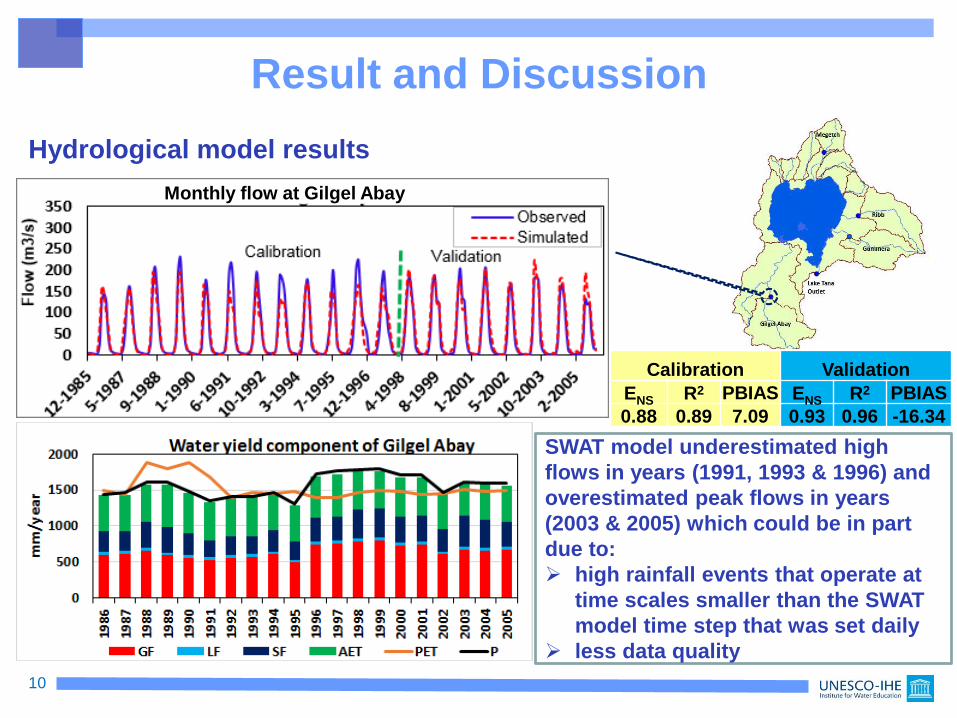
Hydrological model results
10
Monthly flow at Gilgel Abay
Calibration Validation
ENS R2 PBIAS ENS R2 PBIAS
0.88 0.89 7.09 0.93 0.96 -16.34
SWAT model underestimated high
flows in years (1991, 1993 & 1996) and
overestimated peak flows in years
(2003 & 2005) which could be in part
due to:
high rainfall events that operate at
time scales smaller than the SWAT
model time step that was set daily
less data quality
Result and Discussion
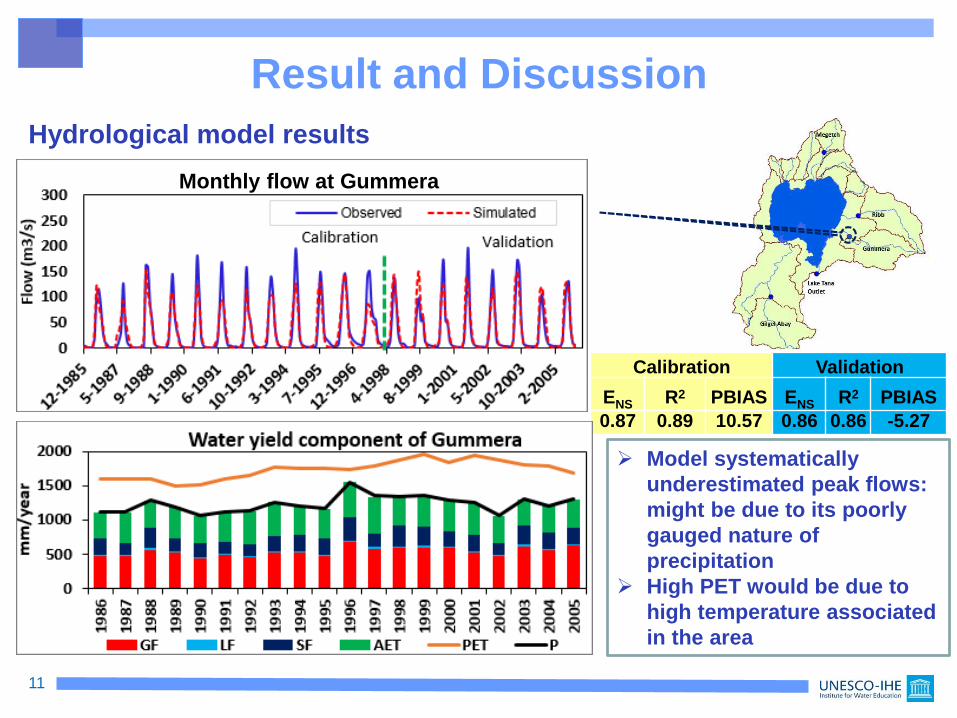
Hydrological model results
11
Monthly flow at Gummera
Calibration Validation
ENS R2 PBIAS ENS R2 PBIAS
0.87 0.89 10.57 0.86 0.86 -5.27
Model systematically
underestimated peak flows:
might be due to its poorly
gauged nature of
precipitation
High PET would be due to
high temperature associated
in the area
Result and Discussion
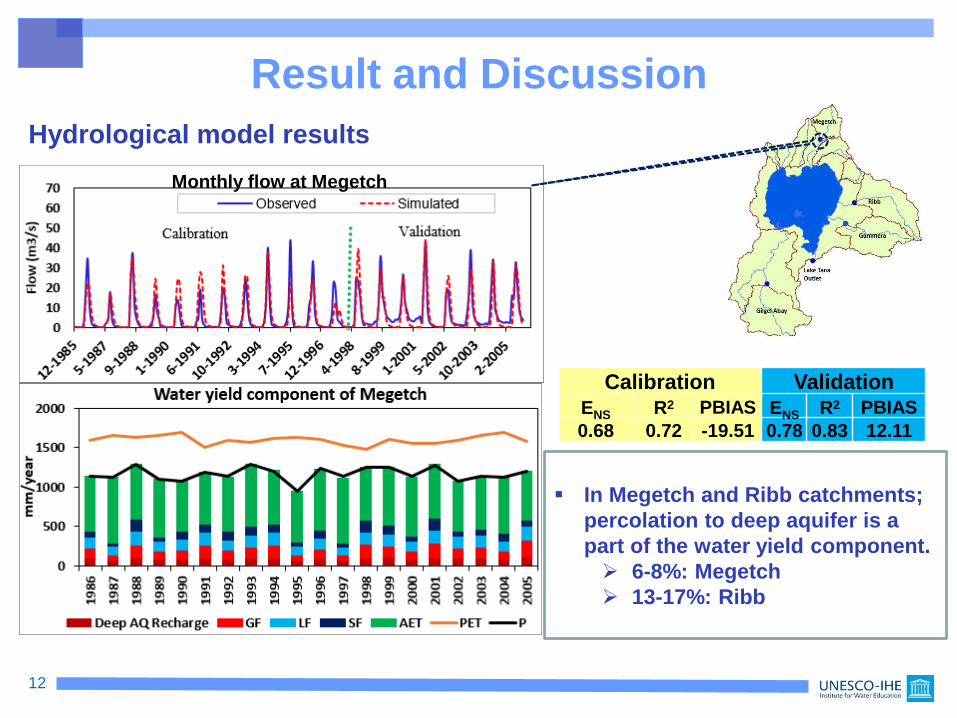
Hydrological model results
12
Calibration Validation
ENS R2 PBIAS ENS R2 PBIAS
0.68 0.72 -19.51 0.78 0.83 12.11
Monthly flow at Megetch
In Megetch and Ribb catchments;
percolation to deep aquifer is a
part of the water yield component.
6-8%: Megetch
13-17%: Ribb
Result and Discussion
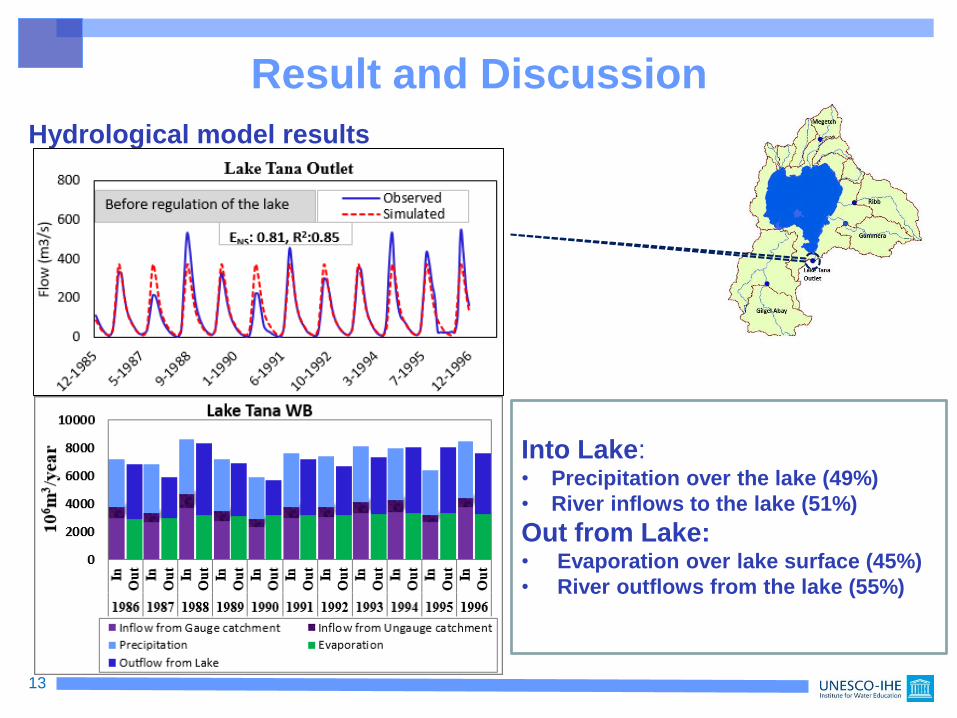
Hydrological model results
13
Into Lake:• Precipitation over the lake (49%)
• River inflows to the lake (51%)
Out from Lake:• Evaporation over lake surface (45%)
• River outflows from the lake (55%)
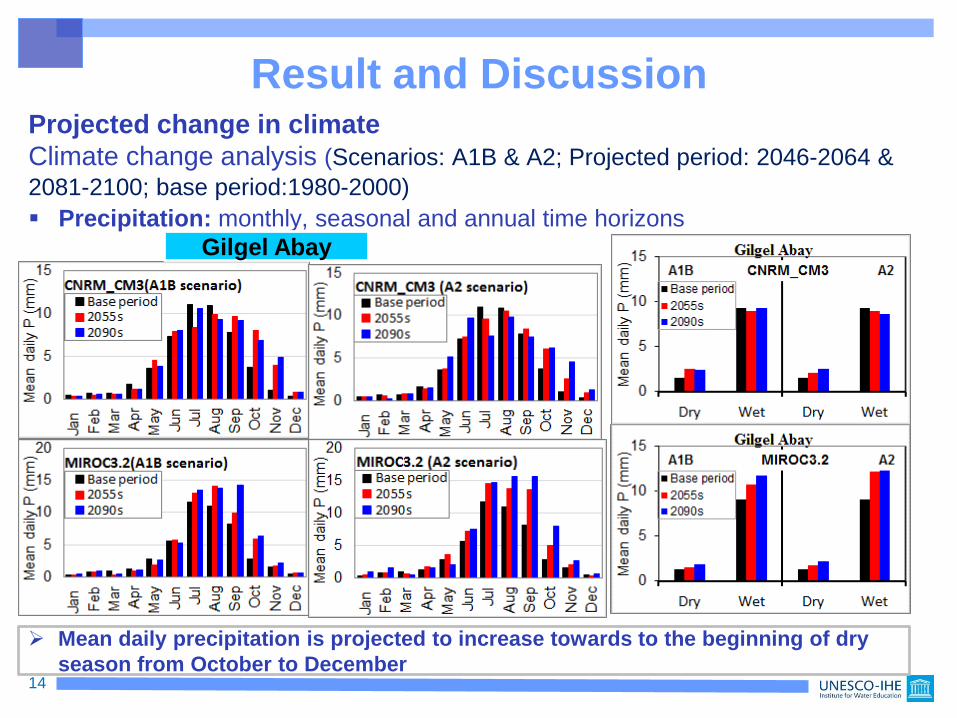
Result and DiscussionProjected change in climate
Climate change analysis (Scenarios: A1B & A2; Projected period: 2046-2064 &
2081-2100; base period:1980-2000)
Precipitation: monthly, seasonal and annual time horizons
14
Gilgel Abay
Mean daily precipitation is projected to increase towards to the beginning of dry
season from October to December
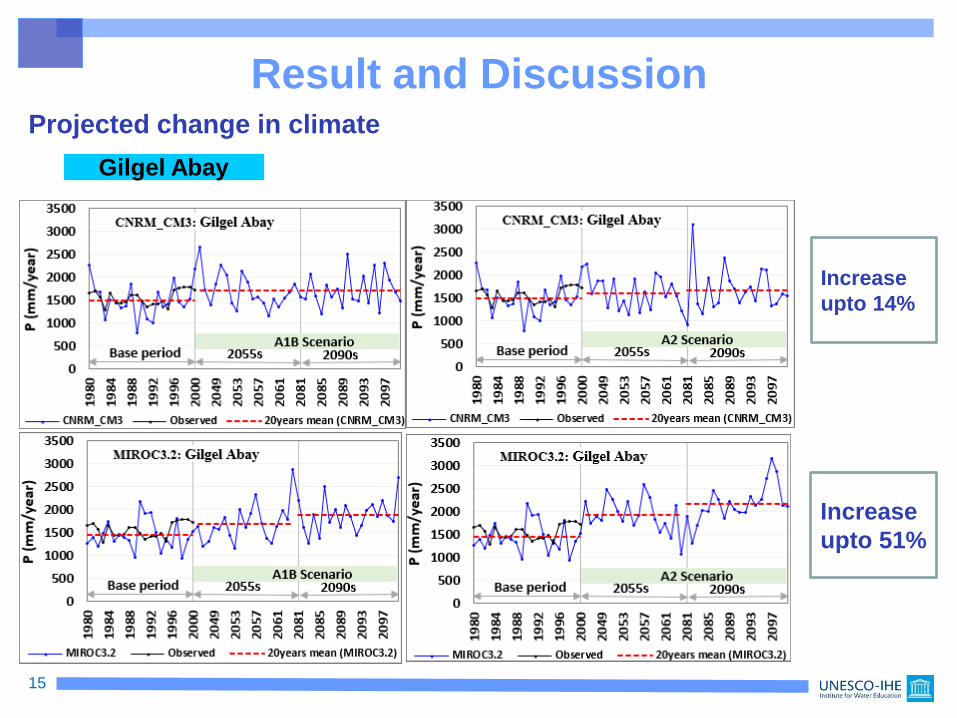
Result and DiscussionProjected change in climate
15
Gilgel Abay
Increase
upto 14%
Increase
upto 51%
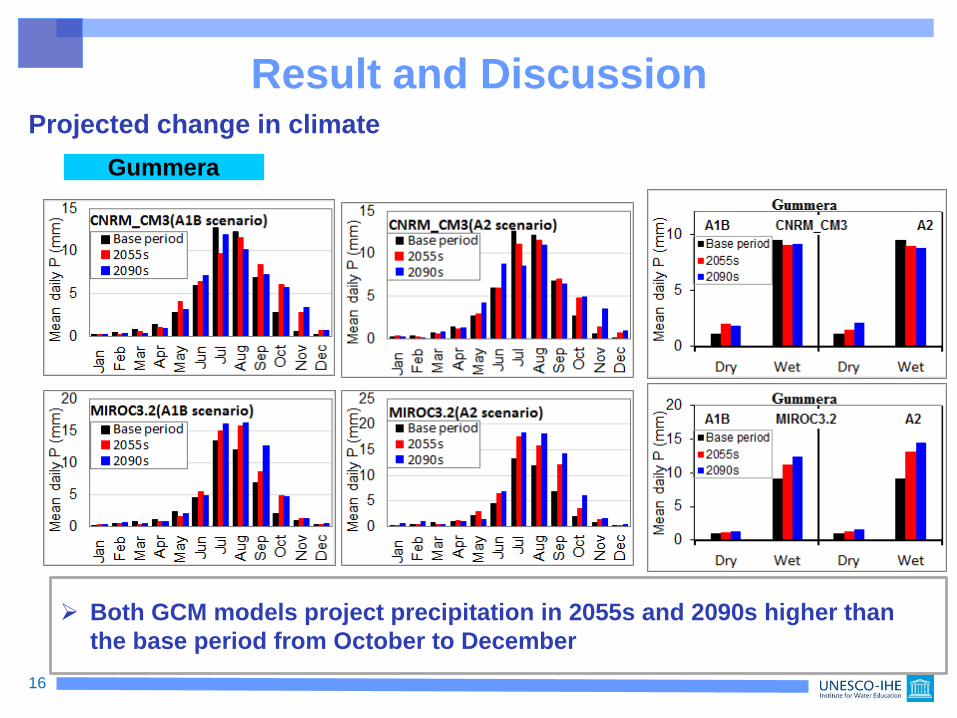
Result and DiscussionProjected change in climate
16
Gummera
Both GCM models project precipitation in 2055s and 2090s higher than
the base period from October to December
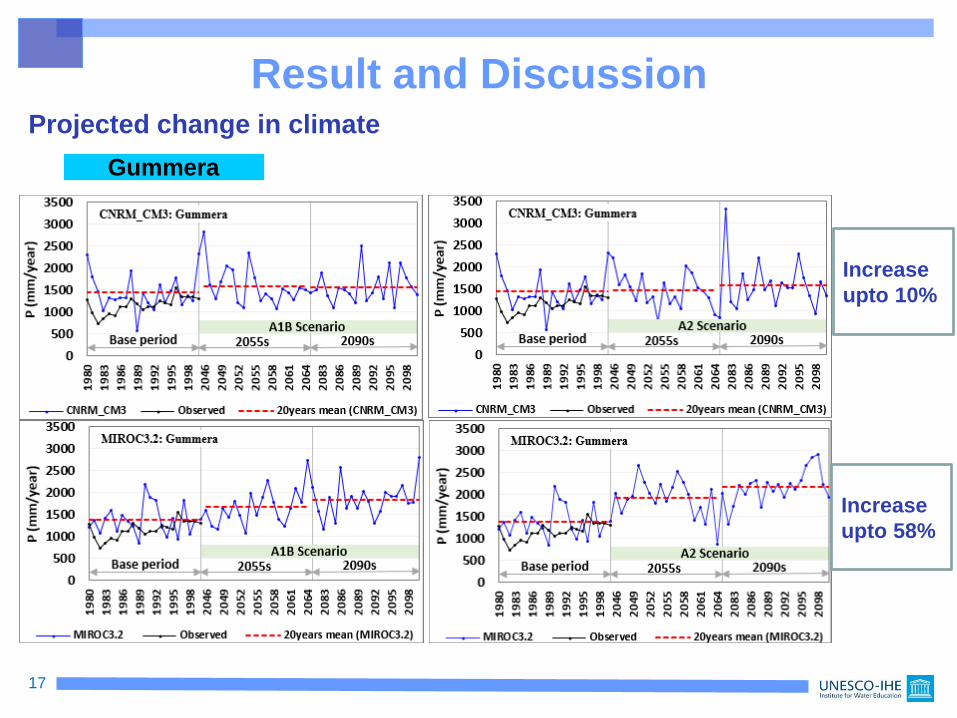
Result and DiscussionProjected change in climate
17
Gummera
Increase
upto 10%
Increase
upto 58%
Result and DiscussionProjected change in climate
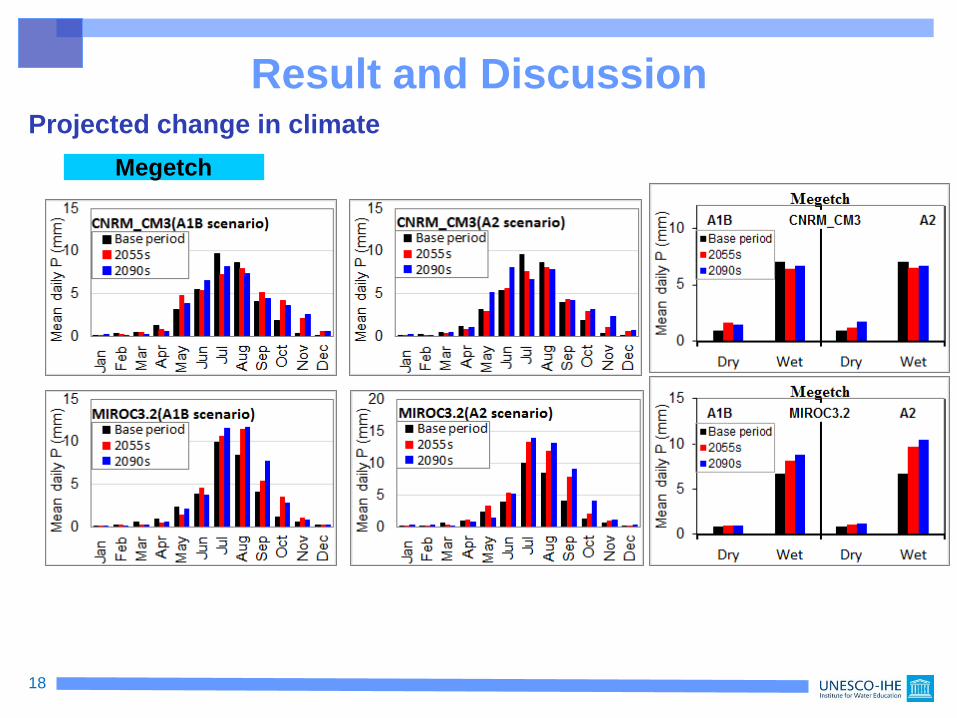
18
Megetch
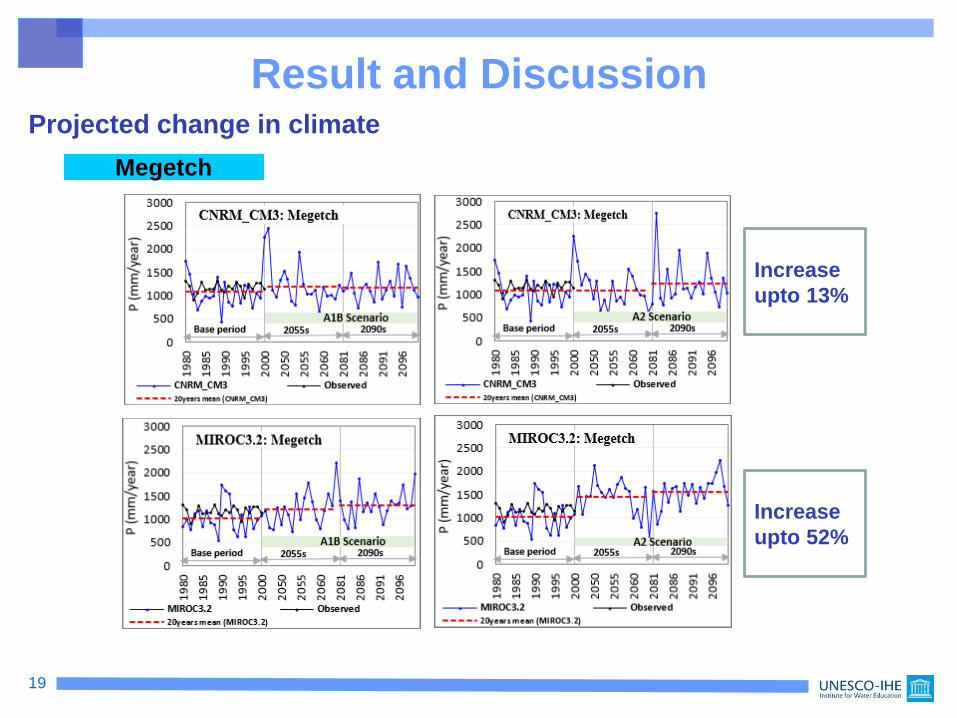
Result and DiscussionProjected change in climate
19
Megetch
Increase
upto 13%
Increase
upto 52%
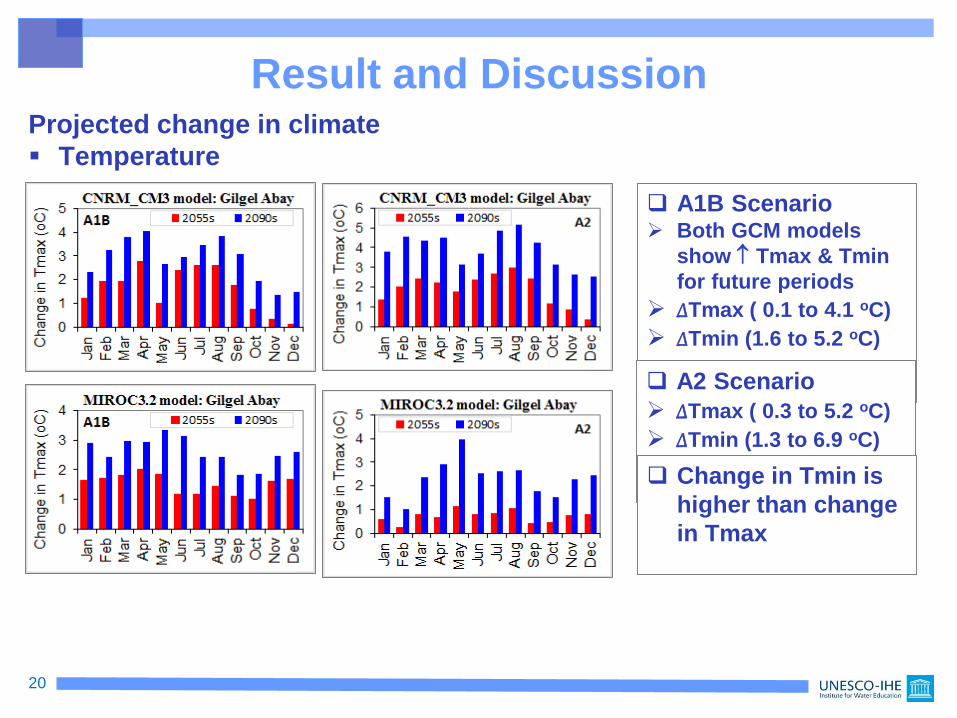
Result and DiscussionProjected change in climate
Temperature
20
A1B Scenario Both GCM models
show Tmax & Tmin
for future periods
∆Tmax ( 0.1 to 4.1 oC)
∆Tmin (1.6 to 5.2 oC)
A2 Scenario
∆Tmax ( 0.3 to 5.2 oC)
∆Tmin (1.3 to 6.9 oC)
Change in Tmin is
higher than change
in Tmax
Result and DiscussionProjected change in climate
Projected precipitation in our study increases towards to the end of
rainy season for the case of Gilgel Abay subbasin which is in lined with
Abdo et al.(2009). The mean annual projected precipitation in the Tana
Basin ranges from -1% to 58% which signifies the finding of Kim et
al.(2009) indicated that the climate likely become wetter in the mid of
the century.
The projected temperature change in our study increases upto 6.9oC in
Tana basin during 2090s. Previous studies made by Abdo et al. (2009)
and Setegn et al.(2011) have obtained the increase upto 5.8oC in the
end of the century. Hence, the Tana Basin is likely become warmer
due to climate change in the future.
21
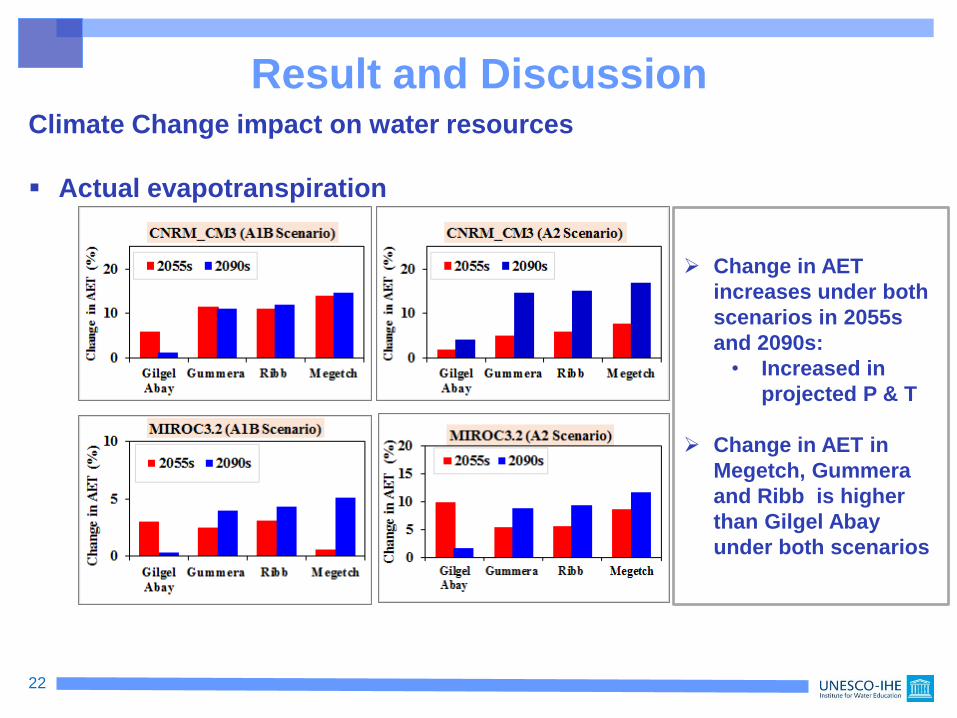
Result and DiscussionClimate Change impact on water resources
Actual evapotranspiration
22
Change in AET
increases under both
scenarios in 2055s
and 2090s:
• Increased in
projected P & T
Change in AET in
Megetch, Gummera
and Ribb is higher
than Gilgel Abay
under both scenarios
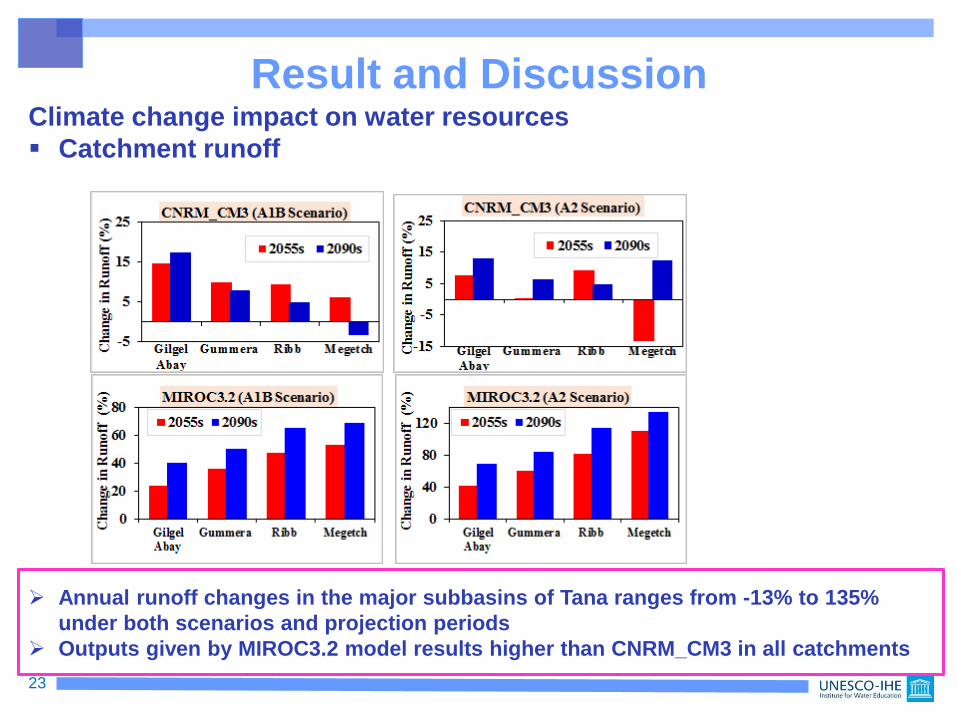
Result and DiscussionClimate change impact on water resources
Catchment runoff
23
Annual runoff changes in the major subbasins of Tana ranges from -13% to 135%
under both scenarios and projection periods
Outputs given by MIROC3.2 model results higher than CNRM_CM3 in all catchments
Result and DiscussionClimate change impact on water resources
Catchment runoff
The annual runoff changes in Gilgel Abay, Gummera, and Ribb are
increased in the scenario periods. This is supported by Taye et al (2011)
obtained that the annual runoff increases upto 79% at outlet of Tana
basin in the middle the century. Besides, Abdo et al (2009) argues the
runoff in the Gilgel Abay catchment increases in the future.
The studies made by Conway (2005), Kim et al.(2009) and Beyene et
al.(2010) reported the increase of streamflow in Blue Nile due to
climate change that are relevant for Tana basin.
24
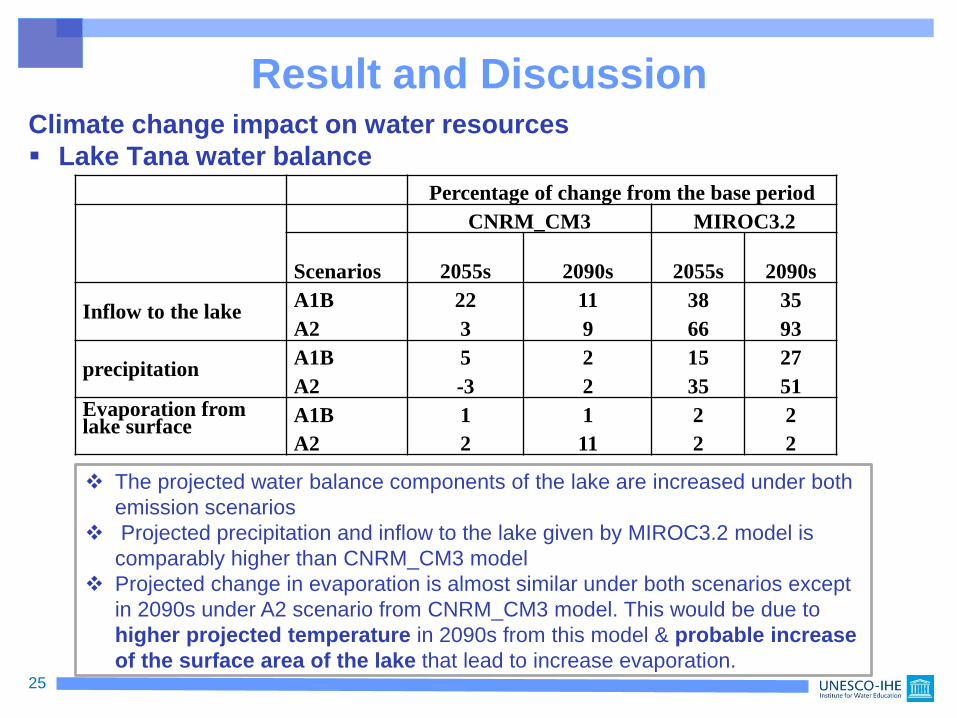
Result and DiscussionClimate change impact on water resources
Lake Tana water balance
25
Percentage of change from the base period
CNRM_CM3 MIROC3.2
Scenarios 2055s 2090s 2055s 2090s
Inflow to the lakeA1B 22 11 38 35
A2 3 9 66 93
precipitationA1B 5 2 15 27
A2 -3 2 35 51Evaporation from lake surface
A1B 1 1 2 2
A2 2 11 2 2
The projected water balance components of the lake are increased under both
emission scenarios
Projected precipitation and inflow to the lake given by MIROC3.2 model is
comparably higher than CNRM_CM3 model
Projected change in evaporation is almost similar under both scenarios except
in 2090s under A2 scenario from CNRM_CM3 model. This would be due to
higher projected temperature in 2090s from this model & probable increase
of the surface area of the lake that lead to increase evaporation.
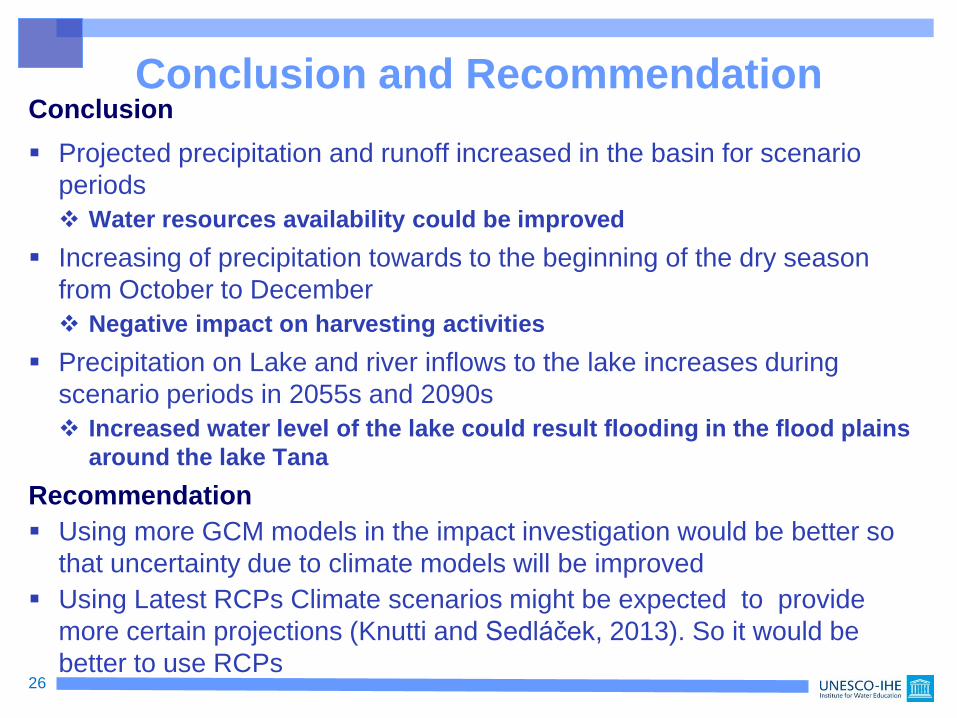
Conclusion and RecommendationConclusion
Projected precipitation and runoff increased in the basin for scenario
periods
Water resources availability could be improved
Increasing of precipitation towards to the beginning of the dry season
from October to December
Negative impact on harvesting activities
Precipitation on Lake and river inflows to the lake increases during
scenario periods in 2055s and 2090s
Increased water level of the lake could result flooding in the flood plains
around the lake Tana
Recommendation
Using more GCM models in the impact investigation would be better so
that uncertainty due to climate models will be improved
Using Latest RCPs Climate scenarios might be expected to provide
more certain projections (Knutti and Sedláček, 2013). So it would be
better to use RCPs26
27


![Pang Abay [Autosaved]](https://img.dokumen.tips/doc/110x75/55cf9c8c550346d033aa324d/pang-abay-autosaved.jpg)