Embed Size (px)
Citation preview
Chemical Engineering Science 101 (2013) 81–89
Contents lists available at ScienceDirect
Chemical Engineering Science
0009-25http://d
n CorrE-m
journal homepage: www.elsevier.com/locate/ces
Thermal performance of lab-scale solar reactor designed for kineticsanalysis at high radiation fluxes
Selvan Bellan, Elisa Alonso, Fabrisio Gomez-Garcia, Carlos Perez-Rabago, José Gonzalez-Aguilar n, Manuel RomeroIMDEA Energy Institute, Ramon de la Sagra 3, 28935 Móstoles, Spain
H I G H L I G H T S
� Numerical model of thermochemical reactor.
� Thermal performance of lab-scale thermochemical reactor.� Thermo-fluid flow, absorption efficiency and radiation loss of thermochemical reactor.a r t i c l e i n f o
Article history:Received 15 February 2013Received in revised form25 April 2013Accepted 13 June 2013Available online 22 June 2013
Keywords:Chemical reactorCFD modelingThermochemical cycleHigh radiation fluxSolar energyNumerical analysis
09/$ - see front matter & 2013 Elsevier Ltd. Ax.doi.org/10.1016/j.ces.2013.06.033
esponding author.ail address: [email protected] (J. Gonza
a b s t r a c t
The availability of lab-scale reactor designs with suitable control and monitoring of reaction parametersbecomes essential when high flux/temperature conditions reproducing solar-driven thermochemical processesare needed. Since the chemical kinetics strongly depends on irradiance, temperature and fluid flow distributionaround the reactant, a detailed thermal analysis supports the understanding of reactor response and kineticsassessment for specific solar reactor designs. This study describes a numerical model for analyzing the thermalperformance of a laboratory-scale solar thermochemical reactor, which has been designed and built for analysisof reduction of metal oxides. Model validation is accomplished by comparing the simulation results withexperimental measurements and previous published numerical results. Parametric simulations are performedto examine the influence of gas flow rate and sample position on the reactor's thermal performance. Thermo-fluid flow inside the reactor, the total energy absorption, radiation losses, absorption efficiency, and maximumtemperature attained by the sample are predicted for different operating conditions.
& 2013 Elsevier Ltd. All rights reserved.
1. Introduction
One of the most attractive research areas in solar thermoche-mical processes is the synthesis of valuable fuels and chemicals byconcentrated solar energy (e.g. Steinfeld, 2005; Romero andSteinfeld, 2012). The solar-driven thermochemical cycles are gen-erally based on the metal oxides reduction process. Since theoperating temperature of such cycles is high, solar concentratedenergy technology has been used, which provides such a heatsource (e.g. Kodama and Gokon, 2007). Production of fuels fromthis technology is considered as an effective method for long-termenergy storage and production of energy carriers, such as hydrogenand solar fuels (Romero and Steinfeld, 2012). Hence, a specificeffort has been devoted to design and optimize the solar reactorsince it is the key component of overall solar-driven processesinvolving water-splitting cycles (e.g. Meier et al., 1996; Palumbo
ll rights reserved.
lez-Aguilar).
et al., 2004). Solar reactors for highly concentrated applicationsusually feature the use of cavity-type configuration to attain andwithstand high reaction temperature with sufficient efficiency,whereby the absorption of the receiver is increased by focusingconcentrated solar radiation through a small aperture (Steinfeld,2005). To provide an efficient heat transfer directly to the reactant,ceramic materials have been employed for inner cavity (e.g. Mulleret al., 2006; Abanades et al., 2007). To obtain isothermal conditionsand high absorption efficiencies, insulated cavity type receivershave been designed and used (e.g. Abanades et al., 2007). Thesereactors have been classified by the orientation to the incomingconcentrated sunlight, such as horizontal or vertical. Some synth-esis routes involve endothermic reduction of metal oxides in whichconcentrated solar energy provides the heat to drive the reaction
MxOy -Solar
MxOy−1 þ 1=2 O2 ð1Þ
Depending on the metal selected (Zn, Sn, Ni, Fe, Mn, Ce, etc.),reduction temperature of solar-driven reactions may be in therange between 900 and 1700 1C (Kodama and Gokon, 2007).
S. Bellan et al. / Chemical Engineering Science 101 (2013) 81–8982
In two-step thermochemical cycles, the next step is the reaction ofthe reduced oxide with water and carbon dioxide to form syngasand the original metal oxide by non-solar exothermic reaction
MxOy−1 þ CO2=H2O-MxOyþCO=H2 ð2ÞIn addition to the set of Eqs. (1) and (2), more complex
thermochemical cycles containing a higher number of chemicalreactions have also been proposed (Sturzenegger et al., 1998;Kreider et al., 2011).
In order to efficiently provide thermal energy to the reactingmatter, solar reactors must be designed to withstand high tem-perature, minimize thermal losses, and achieve high chemicalconversion rates. Thus, knowledge of chemical kinetics and yieldsunder real on-sun operational conditions may be supported withtesting and modeling of lab-scale reactor analogs. Traditionally,one of the approaches to tackle this issue is using the conventionalthermal analysis technique, such as thermogravimetric analysis orthermal desorption. However, the heating rate and thermalgradients obtained by the reacting matter in this analysis wouldbe substantially lower than the concentrated solar-driven process.Hence, the reaction kinetics observed in the conventional thermalanalysis might be different in solar driven processes. The reactantspreparation process (i.e. shaping, pressing, milling, etc. to feed intothe reactor) also plays significant role in this reaction kinetics.
Different devices and set-ups have been used for determiningkinetics at high radiation fluxes. The thermal decomposition of ZnO ina 45-kW concentrating solar furnace was studied at PSI (Paul ScherrerInstitute, Villigen, Switzerland) (Moller and Palumbo, 2001). Thesample was placed in the center of an insulated cavity covered by aquartz window at its front and directly exposed to solar radiation. TheArrhenius law was used to calculate the reaction rate and the kineticparameters were calculated from the sample mass loss. Schünk et al.performed a further analysis of ZnO reduction using a solar-driventhermogravimeter at PSI's solar furnace (Schunk et al., 2008). Thedevice consisted of cavity-type receiver with an adapted sampleholder for the in situ measurements of sample mass variation.A revised version of the same experimental setup has been success-fully applied for analyzing the kinetics of non-volatile metal oxides atPSI's 50-kWth high flux solar simulator (Gonzalez-Aguilar et al., 2012).
The chemical kinetics was also determined from carrier gascomposition analysis at reactor downstream for the TREMPERreactor (Frey et al., 2001) at PSI's solar furnace and, sphericaltransparent reactors (Abanades and Flamant, 2006) in a verticalsolar furnace at CNRS-PROMES, Odeillo, France. In both cases, thesample was enclosed in a transparent, sealed cover and it wasirradiated by the surrounding controlled atmosphere. In addition,
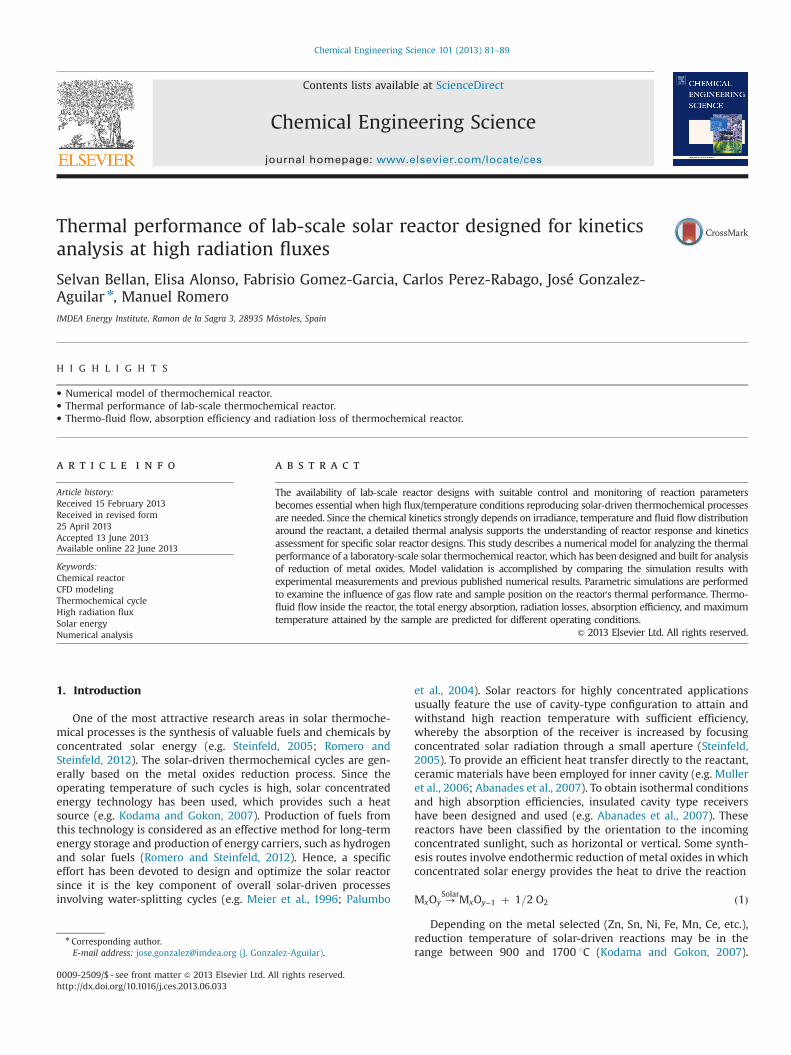
Fig. 1. Schematic (a) and snapshot (b) of the solar thermochemical reactor. (1) Inlet ga(6) Cavity receiver, (7) Lining and (8) Water cooling circuit.
two methodologies have been examined to determine the SnO2
and ZnO reductions kinetics (Abanades and Levêque, 2013).Recently, a laboratory-scale reactor was designed and fabricatedat IMDEA Energy Institute (Alonso et al., 2011, 2012) to study thethermal reduction of non-volatile metal oxides by directly expos-ing the reactant to high radiation fluxes, and the instantaneousoxygen concentration at the outlet is observed.
Since the chemical reactions involved in the thermochemicalcycles as described in aforementioned processes depend on thetemperature attained by the reactant and its surrounding atmo-sphere, a complete thermal behavior of the reactant i.e., thetemperature received by the sample, temperature gradient, con-vection losses at the sample outer surface due to carrier gas flow,etc., is required to implement the chosen chemical reaction and itscorresponding reactor design. For e.g. the Mn3O4/MnO thermalreduction process requires the sample at low temperature gradientto execute the reaction efficiently. So, the objective of the presentstudy is to develop a three dimensional numerical model to studythe thermal performance of the reactor, such as temperatureattained by the reactants, the total energy absorption, radiationlosses and absorption efficiency for different operating conditions.
2. Reactor modeling
2.1. Solar thermochemical reactor
The schematic and snapshot of the reactor are shown in Fig. 1(a) and Fig. 1(b) respectively (Alonso et al., 2012). It consists of analumina cavity receiver surrounded by a well-insulating lining toreduce conduction heat losses. Concentrated solar radiation entersthe cavity receiver through a water-cooled, transparent quartzglass window and 30 mm diameter aperture. In order to exposethe sample to the high radiation flux density, the sample ismounted on alumina rod-type sample holder and positionedinside the cavity receiver. The carrier gas main pipe from thecylinder is divided into four equal parts and radially connected tothe reactor close to the quartz window at perpendicular to eachother. Argon gas is used as carrier gas to transport the gaseousproducts (mainly O2) continuously to the exit of the reactor. Massflow controller (MPC20-BBASP1) is fixed at the main pipe tocontrol and measure the carrier gas flow and a ZrO2-cell oxygenanalyzer (ABB EasyLine EL3020) is fixed at the outlet to measurethe oxygen concentration. The reactor is enclosed by stainless steelhousing and instrumented with thermocouples, flow meters andpressure sensors to monitor the experiments.
s ports, (2) Reactor outlet, (3) Sample holder, (4) Quartz glass, (5) Thermocouples,
Sample radius (m)
Frustum radius (m)
0 0.003 0.006 0.009 0.012
0.02 0.03 0.04 0.05
500
1000
1500
2000
2500
0
100
200
300
400
500
600
700
S.D. 30 mmS.D. 50 mmS.D. 70 mmFrustum
Inci
dent
rad
iatio
n flu
x in
tens
ityon
the
sam
ple
(kW
/m2 )
Inci
dent
rad
iatio
n flu
x in
tens
ityon
the
frus
tum
(kW
/m2 )
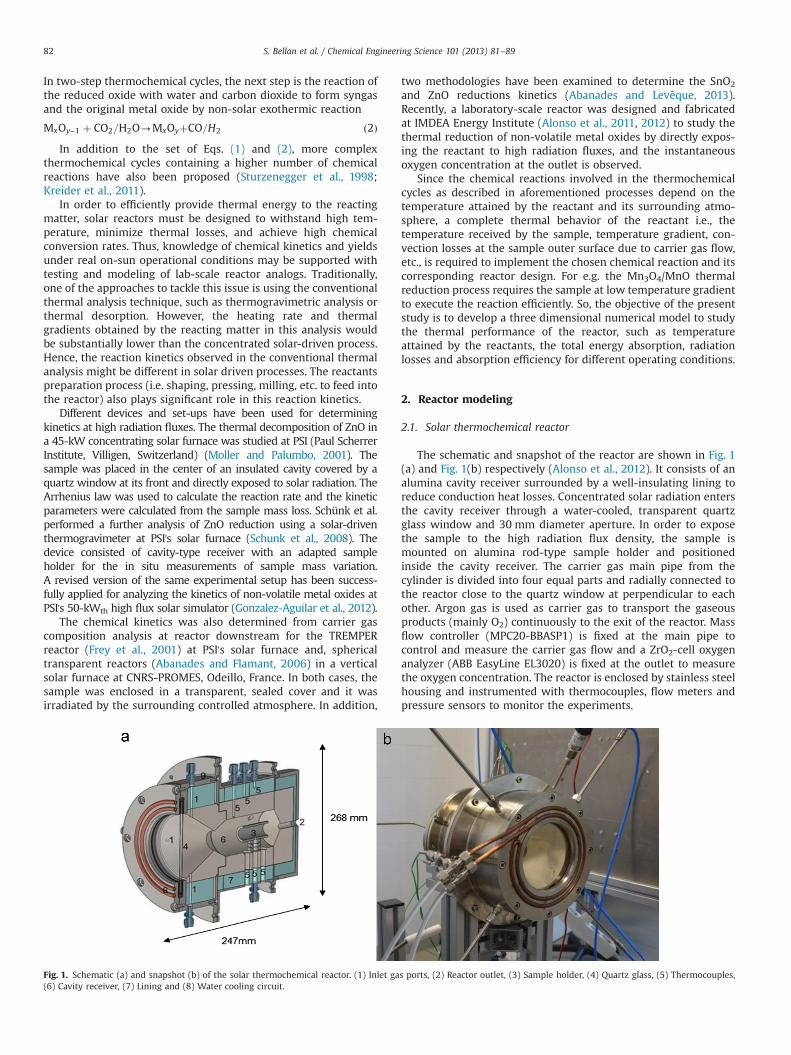
Fig. 2. Incident radiation flux distribution along the frustum and sample surface fordifferent distances.
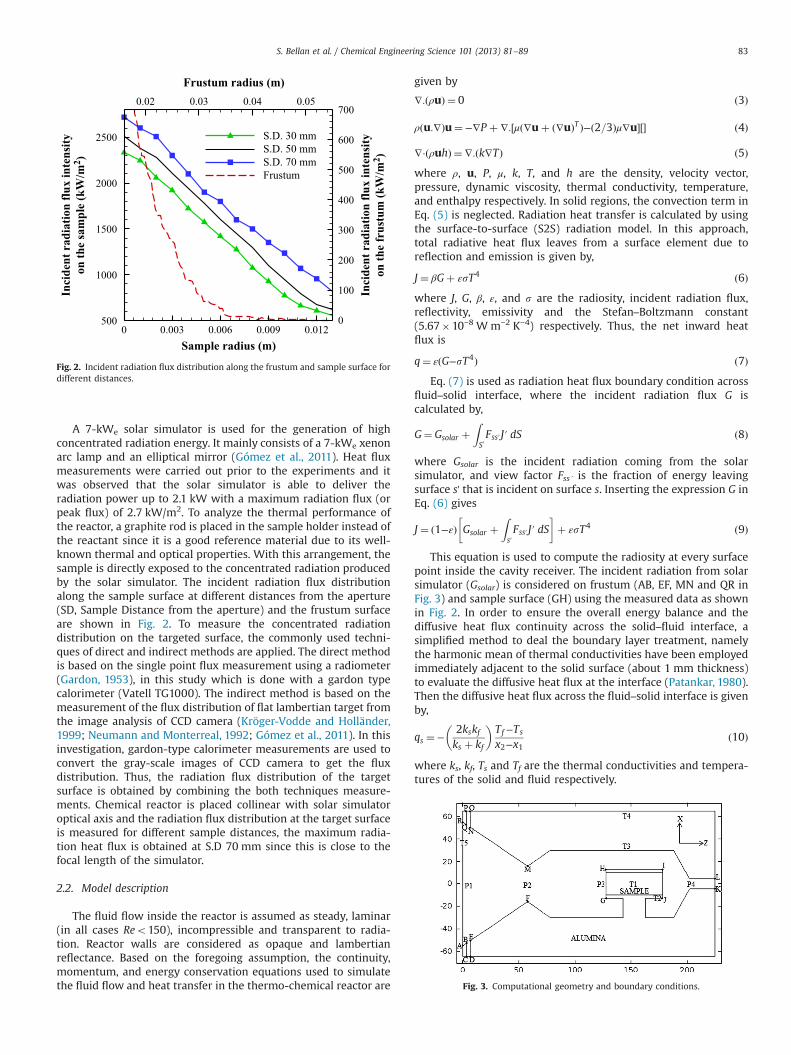
Fig. 3. Computational geometry and boundary conditions.
S. Bellan et al. / Chemical Engineering Science 101 (2013) 81–89 83
A 7-kWe solar simulator is used for the generation of highconcentrated radiation energy. It mainly consists of a 7-kWe xenonarc lamp and an elliptical mirror (Gómez et al., 2011). Heat fluxmeasurements were carried out prior to the experiments and itwas observed that the solar simulator is able to deliver theradiation power up to 2.1 kW with a maximum radiation flux (orpeak flux) of 2.7 kW/m2. To analyze the thermal performance ofthe reactor, a graphite rod is placed in the sample holder instead ofthe reactant since it is a good reference material due to its well-known thermal and optical properties. With this arrangement, thesample is directly exposed to the concentrated radiation producedby the solar simulator. The incident radiation flux distributionalong the sample surface at different distances from the aperture(SD, Sample Distance from the aperture) and the frustum surfaceare shown in Fig. 2. To measure the concentrated radiationdistribution on the targeted surface, the commonly used techni-ques of direct and indirect methods are applied. The direct methodis based on the single point flux measurement using a radiometer(Gardon, 1953), in this study which is done with a gardon typecalorimeter (Vatell TG1000). The indirect method is based on themeasurement of the flux distribution of flat lambertian target fromthe image analysis of CCD camera (Kröger-Vodde and Holländer,1999; Neumann and Monterreal, 1992; Gómez et al., 2011). In thisinvestigation, gardon-type calorimeter measurements are used toconvert the gray-scale images of CCD camera to get the fluxdistribution. Thus, the radiation flux distribution of the targetsurface is obtained by combining the both techniques measure-ments. Chemical reactor is placed collinear with solar simulatoroptical axis and the radiation flux distribution at the target surfaceis measured for different sample distances, the maximum radia-tion heat flux is obtained at S.D 70 mm since this is close to thefocal length of the simulator.
2.2. Model description
The fluid flow inside the reactor is assumed as steady, laminar(in all cases Reo150), incompressible and transparent to radia-tion. Reactor walls are considered as opaque and lambertianreflectance. Based on the foregoing assumption, the continuity,momentum, and energy conservation equations used to simulatethe fluid flow and heat transfer in the thermo-chemical reactor are
given by
∇:ðρuÞ ¼ 0 ð3Þ
ρðu:∇Þu¼ −∇P þ ∇:½μð∇uþ ð∇uÞT Þ−ð2=3Þμ∇u�½� ð4Þ
∇⋅ðρuhÞ ¼∇:ðk∇TÞ ð5Þwhere ρ, u, P, μ, k, T, and h are the density, velocity vector,pressure, dynamic viscosity, thermal conductivity, temperature,and enthalpy respectively. In solid regions, the convection term inEq. (5) is neglected. Radiation heat transfer is calculated by usingthe surface-to-surface (S2S) radiation model. In this approach,total radiative heat flux leaves from a surface element due toreflection and emission is given by,
J ¼ βGþ εsT4 ð6Þwhere J, G, β, ε, and s are the radiosity, incident radiation flux,reflectivity, emissivity and the Stefan–Boltzmann constant(5.67�10−8 W m−2 K−4) respectively. Thus, the net inward heatflux is
q¼ εðG−sT4Þ ð7ÞEq. (7) is used as radiation heat flux boundary condition across
fluid–solid interface, where the incident radiation flux G iscalculated by,
G¼ Gsolar þZS0Fss′J′ dS ð8Þ
where Gsolar is the incident radiation coming from the solarsimulator, and view factor Fss´ is the fraction of energy leavingsurface s' that is incident on surface s. Inserting the expression G inEq. (6) gives
J ¼ ð1−εÞ Gsolar þZs0Fss0 J′ dS
� �þ εsT4 ð9Þ
This equation is used to compute the radiosity at every surfacepoint inside the cavity receiver. The incident radiation from solarsimulator (Gsolar) is considered on frustum (AB, EF, MN and QR inFig. 3) and sample surface (GH) using the measured data as shownin Fig. 2. In order to ensure the overall energy balance and thediffusive heat flux continuity across the solid–fluid interface, asimplified method to deal the boundary layer treatment, namelythe harmonic mean of thermal conductivities have been employedimmediately adjacent to the solid surface (about 1 mm thickness)to evaluate the diffusive heat flux at the interface (Patankar, 1980).Then the diffusive heat flux across the fluid–solid interface is givenby,
qs ¼−2kskfks þ kf
� �Tf−Ts
x2−x1ð10Þ
where ks, kf, Ts and Tf are the thermal conductivities and tempera-tures of the solid and fluid respectively.
Table 1Grid independence tests for three mesh models.
Point Normal Fine Extrafine
T (K) V (m/s) T (K) V (m/s) T (K) V (m/s)
P1 545.80 0.412 554.85 0.414 560.30 0.424P2 610.37 0.488 617.614 0.498 624.098 0.506P3 1636.08 0.044 1616.41 0.043 1607.72 0.044P4 1299.10 7.357 1308.62 7.345 1312.60 7.332
S. Bellan et al. / Chemical Engineering Science 101 (2013) 81–8984
The computational domain is formed by the region inside thereactor limited by quartz glass, the inlet region, ceramic cylindersurrounded by the cavity and the reactor exit. The cross-sectionalview of the computational domain at ZX (or vertical) plane isshown in Fig. 3. In which T1–T5 and P1–P4 are embeddedthermocouple positions and reference points respectively. Theargon gas is supposed to enter the cavity through four inlet ports(CD and PQ in Fig. 3) at 1 atm and 300 K, where the mass flow rateboundary condition is applied. Since the ambient surroundingsbehave as blackbody, the radiation flux from quartz window (AR)to ambient surrounding is calculated by,
q¼ εsðT4amb−Twall
4Þ ð11Þ
where Tamb and Twall are the ambient temperature and walltemperature respectively. Convective heat flux condition is appliedat the external boundary (AC, DK, LO and PR) of cavity cylinderwith a convection heat transfer coefficient of 5.0 W/m2 K. Thespecific heat capacity of the argon gas at constant pressure is520 J/kg K (Murphy and Arundell, 1994) and the temperature-dependent thermodynamic and transport properties are shown inFig. 4. The specific heat capacity of alumina and graphite are 1025and 712 J/kg K, and the densities are 3900 and 1850 kg/m3
respectively. The temperature dependent thermal conductivity ofalumina and graphite is shown in Fig. 5. The surface emissivity ofdiffusely-reflecting cavity inner wall (alumina) and the sample
Temperature (K)
Dyn
amic
vis
cosi
ty (p
a.s)
Den
sity
(kg/
m3 )
The
rmal
con
duct
ivity
(W/m
K)
1000 2000 3000 4000 50000.0E+00
4.0E-05
8.0E-05
1.2E-04
1.6E-04
0
0.4
0.8
1.2
1.6
0
0.04
0.08
0.12
0.16
Dynamic viscosityDensityThermal conductivity
Fig. 4. Thermodynamic and transport properties of argon.
Temperature (K)
Alu
min
a T
h. C
ond.
(W/m
K)
Gra
phite
Th.
Con
d. (W
/mK
)
1000 2000 3000
10
15
20
25
20
40
60
80
100
AluminaGraphite
Fig. 5. Thermal conductivity of alumina and graphite.
(graphite) are 0.07 and 0.88 respectively. These properties wereobtained from manufacturer (Carbosystems, Madrid, Spain) andliterature (Thomas and Amanie, 2000). The surface emissivity ofquartz window is equal to 0.93 (Duffie and Beckman, 2006). Thesematerial properties are incorporated in the model and all equa-tions given earlier are solved using the finite element techniquebased commercial software COMSOL Multiphysics 4.2 (COMSOL,2012).
2.3. Grid independent studies
In order to obtain the optimized computational mesh, gridindependence tests are conducted on the mesh models at thebeginning of the simulation process. The mesh is refined in nearwall and high (temperature and velocity modulus) gradientregions. In this study, three levels of refinements are considered,normal, fine and extra fine. The total number of elements fornormal, fine and extra fine refinements is 195,584, 344,409 and558,641 respectively. The simulations are performed for threemesh models at the gas flow rate of 9 LPM and the sampledistance at 70 mm. The temperature and velocity magnitudes areextracted from four points to monitor the effects of mesh refine-ment. The selected points are shown in Fig. 3. Since the gradient oftemperature and velocity is high in these regions, these points areselected and their coordinates (X, Y, Z) are P1 (0, 0, 0.005 m), P2(0, 0, 0.058 m), P3 (0, 0, 0.126 m) and P4 (0, 0, 0.202 m). Theresults of grid independence tests for the three mesh models areshown in Table 1. For the four points, average difference of thetemperatures and velocities between normal and fine refinementmodels is 1.14%. As for average difference between the normal andextra fine models is 1.46%. From these results, it is concluded thatdrastically increasing the number of elements only improves thepercentage difference around 1.3% and therefore, the normal meshhaving 195,584 elements is adequate and shown in Fig. 6.
2.4. Model validation
To validate the present numerical model, a graphite rod wasplaced in the sample holder (as mentioned in Section 2.1) andexperiments are carried out for the gas flow rate of 9 LPM and thesample distance at 70 mm. After reaching steady state, thetemperature of the reactor is measured at different positions(T1–T5). The numerically predicted and experimentally measuredtemperatures are compared in Table 2. It clearly shows that thepredicted results are comparable with measurements. The averagedifference of 3.13% is noted between the numerically predictedand experimentally measured temperatures. In addition to that,present model results are compared with previously publishedmodel results (Abanades et al., 2007). The geometry, incident solarflux density profile absorbed by the inner wall cavity and thephysical properties of the materials were taken from the previousmodel and simulations were performed. Temperature profile onthe inner wall surface predicted by the present and published
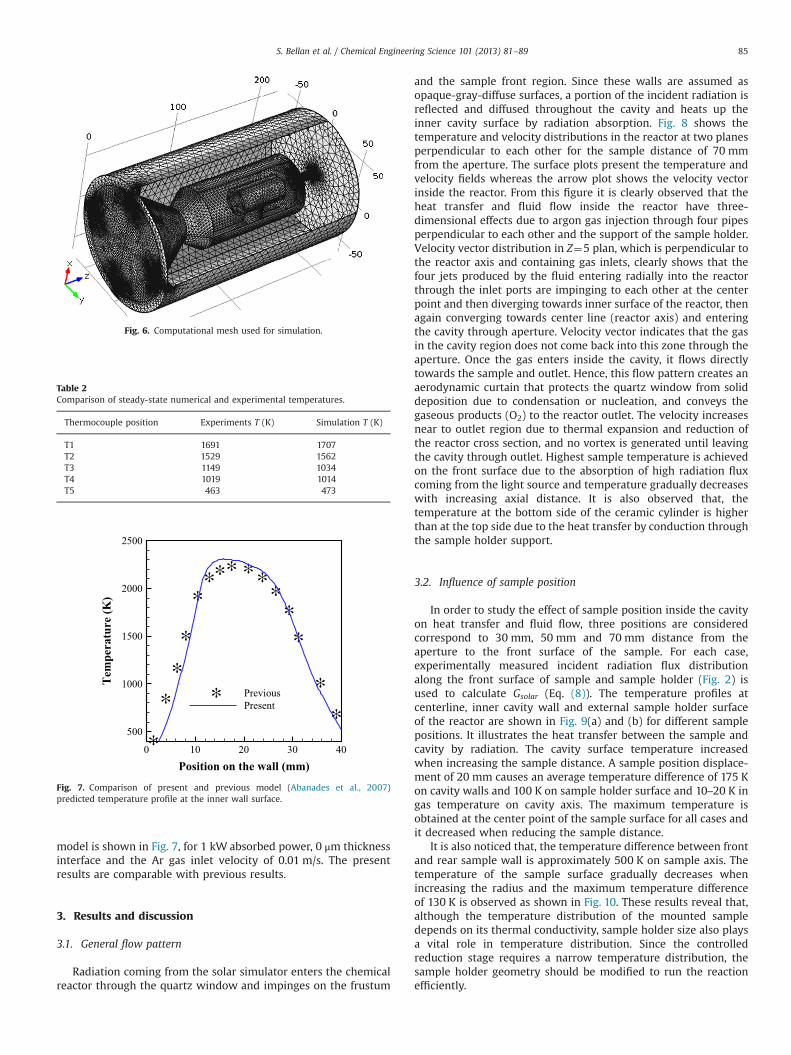
Fig. 6. Computational mesh used for simulation.
Table 2Comparison of steady-state numerical and experimental temperatures.
Thermocouple position Experiments T (K) Simulation T (K)
T1 1691 1707T2 1529 1562T3 1149 1034T4 1019 1014T5 463 473
Position on the wall (mm)
Tem
pera
ture
(K)
0 10 20 30 40
500
1000
1500
2000
2500
PreviousPresent
Fig. 7. Comparison of present and previous model (Abanades et al., 2007)predicted temperature profile at the inner wall surface.
S. Bellan et al. / Chemical Engineering Science 101 (2013) 81–89 85
model is shown in Fig. 7, for 1 kW absorbed power, 0 μm thicknessinterface and the Ar gas inlet velocity of 0.01 m/s. The presentresults are comparable with previous results.
3. Results and discussion
3.1. General flow pattern
Radiation coming from the solar simulator enters the chemicalreactor through the quartz window and impinges on the frustum
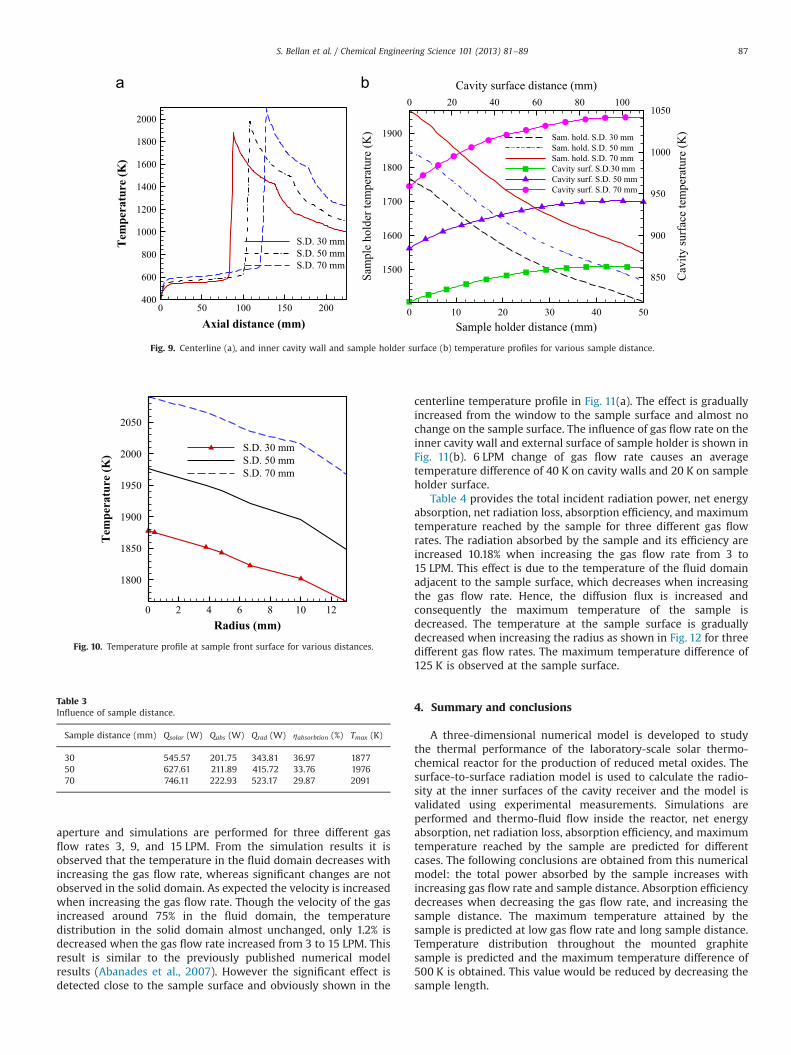
and the sample front region. Since these walls are assumed asopaque-gray-diffuse surfaces, a portion of the incident radiation isreflected and diffused throughout the cavity and heats up theinner cavity surface by radiation absorption. Fig. 8 shows thetemperature and velocity distributions in the reactor at two planesperpendicular to each other for the sample distance of 70 mmfrom the aperture. The surface plots present the temperature andvelocity fields whereas the arrow plot shows the velocity vectorinside the reactor. From this figure it is clearly observed that theheat transfer and fluid flow inside the reactor have three-dimensional effects due to argon gas injection through four pipesperpendicular to each other and the support of the sample holder.Velocity vector distribution in Z¼5 plan, which is perpendicular tothe reactor axis and containing gas inlets, clearly shows that thefour jets produced by the fluid entering radially into the reactorthrough the inlet ports are impinging to each other at the centerpoint and then diverging towards inner surface of the reactor, thenagain converging towards center line (reactor axis) and enteringthe cavity through aperture. Velocity vector indicates that the gasin the cavity region does not come back into this zone through theaperture. Once the gas enters inside the cavity, it flows directlytowards the sample and outlet. Hence, this flow pattern creates anaerodynamic curtain that protects the quartz window from soliddeposition due to condensation or nucleation, and conveys thegaseous products (O2) to the reactor outlet. The velocity increasesnear to outlet region due to thermal expansion and reduction ofthe reactor cross section, and no vortex is generated until leavingthe cavity through outlet. Highest sample temperature is achievedon the front surface due to the absorption of high radiation fluxcoming from the light source and temperature gradually decreaseswith increasing axial distance. It is also observed that, thetemperature at the bottom side of the ceramic cylinder is higherthan at the top side due to the heat transfer by conduction throughthe sample holder support.
3.2. Influence of sample position
In order to study the effect of sample position inside the cavityon heat transfer and fluid flow, three positions are consideredcorrespond to 30 mm, 50 mm and 70 mm distance from theaperture to the front surface of the sample. For each case,experimentally measured incident radiation flux distributionalong the front surface of sample and sample holder (Fig. 2) isused to calculate Gsolar (Eq. (8)). The temperature profiles atcenterline, inner cavity wall and external sample holder surfaceof the reactor are shown in Fig. 9(a) and (b) for different samplepositions. It illustrates the heat transfer between the sample andcavity by radiation. The cavity surface temperature increasedwhen increasing the sample distance. A sample position displace-ment of 20 mm causes an average temperature difference of 175 Kon cavity walls and 100 K on sample holder surface and 10–20 K ingas temperature on cavity axis. The maximum temperature isobtained at the center point of the sample surface for all cases andit decreased when reducing the sample distance.
It is also noticed that, the temperature difference between frontand rear sample wall is approximately 500 K on sample axis. Thetemperature of the sample surface gradually decreases whenincreasing the radius and the maximum temperature differenceof 130 K is observed as shown in Fig. 10. These results reveal that,although the temperature distribution of the mounted sampledepends on its thermal conductivity, sample holder size also playsa vital role in temperature distribution. Since the controlledreduction stage requires a narrow temperature distribution, thesample holder geometry should be modified to run the reactionefficiently.
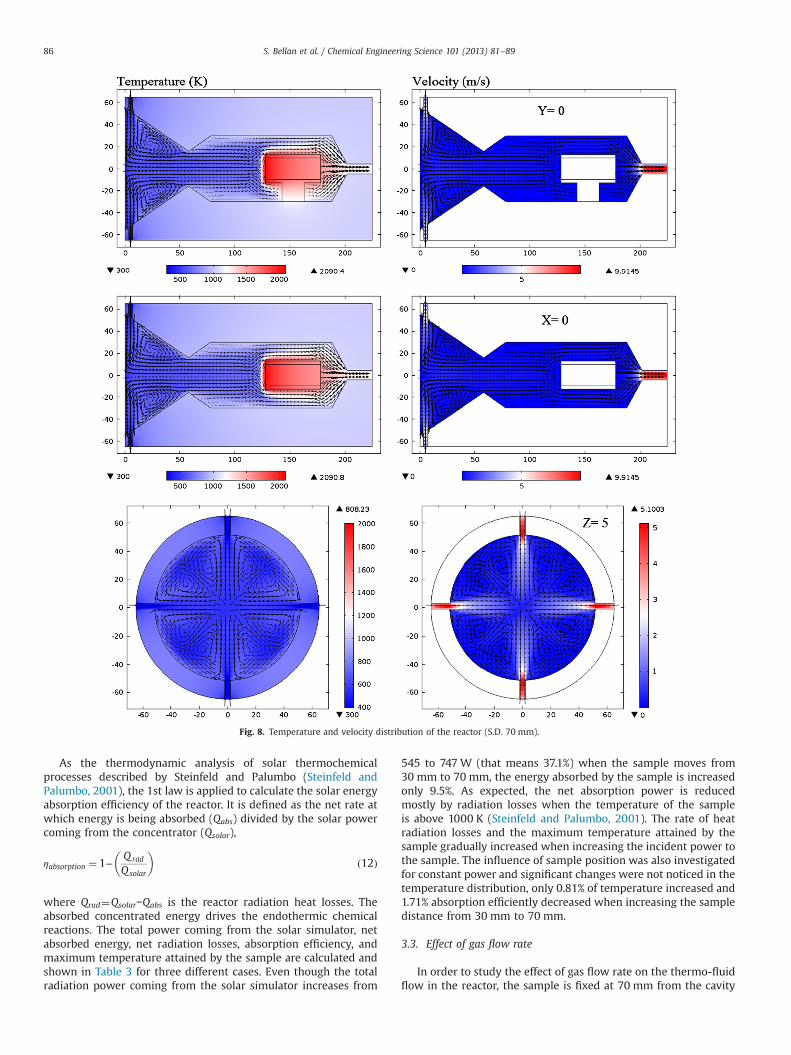
Fig. 8. Temperature and velocity distribution of the reactor (S.D. 70 mm).
S. Bellan et al. / Chemical Engineering Science 101 (2013) 81–8986
As the thermodynamic analysis of solar thermochemicalprocesses described by Steinfeld and Palumbo (Steinfeld andPalumbo, 2001), the 1st law is applied to calculate the solar energyabsorption efficiency of the reactor. It is defined as the net rate atwhich energy is being absorbed (Qabs) divided by the solar powercoming from the concentrator (Qsolar),
ηabsorption ¼ 1−Qrad
Qsolar
� �ð12Þ
where Qrad¼Qsolar−Qabs is the reactor radiation heat losses. Theabsorbed concentrated energy drives the endothermic chemicalreactions. The total power coming from the solar simulator, netabsorbed energy, net radiation losses, absorption efficiency, andmaximum temperature attained by the sample are calculated andshown in Table 3 for three different cases. Even though the totalradiation power coming from the solar simulator increases from
545 to 747 W (that means 37.1%) when the sample moves from30 mm to 70 mm, the energy absorbed by the sample is increasedonly 9.5%. As expected, the net absorption power is reducedmostly by radiation losses when the temperature of the sampleis above 1000 K (Steinfeld and Palumbo, 2001). The rate of heatradiation losses and the maximum temperature attained by thesample gradually increased when increasing the incident power tothe sample. The influence of sample position was also investigatedfor constant power and significant changes were not noticed in thetemperature distribution, only 0.81% of temperature increased and1.71% absorption efficiently decreased when increasing the sampledistance from 30 mm to 70 mm.
3.3. Effect of gas flow rate
In order to study the effect of gas flow rate on the thermo-fluidflow in the reactor, the sample is fixed at 70 mm from the cavity
Axial distance (mm)
Tem
pera
ture
(K)
0 50 100 150 200400
600
800
1000
1200
1400
1600
1800
2000
S.D. 30 mmS.D. 50 mmS.D. 70 mm
Sample holder distance (mm)
Cavity surface distance (mm)
Sam
ple
hold
er te
mpe
ratu
re (K
)
Cav
ity su
rfac
e te
mpe
ratu
re (K
)
0 10 20 30 40 50
0 20 40 60 80 100
1500
1600
1700
1800
1900
850
900
950
1000
1050
Sam. hold. S.D. 30 mmSam. hold. S.D. 50 mmSam. hold. S.D. 70 mmCavity surf. S.D.30 mmCavity surf. S.D. 50 mmCavity surf. S.D. 70 mm
Fig. 9. Centerline (a), and inner cavity wall and sample holder surface (b) temperature profiles for various sample distance.
Radius (mm)
Tem
pera
ture
(K)
0 2 4 6 8 10 12
1800
1850
1900
1950
2000
2050
S.D. 30 mmS.D. 50 mmS.D. 70 mm
Fig. 10. Temperature profile at sample front surface for various distances.
Table 3Influence of sample distance.
Sample distance (mm) Qsolar (W) Qabs (W) Qrad (W) ηabsorbtion (%) Tmax (K)
30 545.57 201.75 343.81 36.97 187750 627.61 211.89 415.72 33.76 197670 746.11 222.93 523.17 29.87 2091
S. Bellan et al. / Chemical Engineering Science 101 (2013) 81–89 87
aperture and simulations are performed for three different gasflow rates 3, 9, and 15 LPM. From the simulation results it isobserved that the temperature in the fluid domain decreases withincreasing the gas flow rate, whereas significant changes are notobserved in the solid domain. As expected the velocity is increasedwhen increasing the gas flow rate. Though the velocity of the gasincreased around 75% in the fluid domain, the temperaturedistribution in the solid domain almost unchanged, only 1.2% isdecreased when the gas flow rate increased from 3 to 15 LPM. Thisresult is similar to the previously published numerical modelresults (Abanades et al., 2007). However the significant effect isdetected close to the sample surface and obviously shown in the
centerline temperature profile in Fig. 11(a). The effect is graduallyincreased from the window to the sample surface and almost nochange on the sample surface. The influence of gas flow rate on theinner cavity wall and external surface of sample holder is shown inFig. 11(b). 6 LPM change of gas flow rate causes an averagetemperature difference of 40 K on cavity walls and 20 K on sampleholder surface.
Table 4 provides the total incident radiation power, net energyabsorption, net radiation loss, absorption efficiency, and maximumtemperature reached by the sample for three different gas flowrates. The radiation absorbed by the sample and its efficiency areincreased 10.18% when increasing the gas flow rate from 3 to15 LPM. This effect is due to the temperature of the fluid domainadjacent to the sample surface, which decreases when increasingthe gas flow rate. Hence, the diffusion flux is increased andconsequently the maximum temperature of the sample isdecreased. The temperature at the sample surface is graduallydecreased when increasing the radius as shown in Fig. 12 for threedifferent gas flow rates. The maximum temperature difference of125 K is observed at the sample surface.
4. Summary and conclusions
A three-dimensional numerical model is developed to studythe thermal performance of the laboratory-scale solar thermo-chemical reactor for the production of reduced metal oxides. Thesurface-to-surface radiation model is used to calculate the radio-sity at the inner surfaces of the cavity receiver and the model isvalidated using experimental measurements. Simulations areperformed and thermo-fluid flow inside the reactor, net energyabsorption, net radiation loss, absorption efficiency, and maximumtemperature reached by the sample are predicted for differentcases. The following conclusions are obtained from this numericalmodel: the total power absorbed by the sample increases withincreasing gas flow rate and sample distance. Absorption efficiencydecreases when decreasing the gas flow rate, and increasing thesample distance. The maximum temperature attained by thesample is predicted at low gas flow rate and long sample distance.Temperature distribution throughout the mounted graphitesample is predicted and the maximum temperature difference of500 K is obtained. This value would be reduced by decreasing thesample length.
Axial distance (mm)
Tem
pera
ture
(K)
0 50 100 150 200400
600
800
1000
1200
1400
1600
1800
2000
3 LPM9 LPM15 LPM
a
a
a
a
aa
aa
a a a a
b
b
bb
bb
bb b b b
Sample holder distance (mm)
Cavity surface distance (mm)
Sam
ple
hold
er te
mpe
ratu
re (K
)
Cav
ity su
rfac
e te
mpe
ratu
re (K
)
0 10 20 30 40 50
0 20 40 60 80 100
1600
1700
1800
1900
940
960
980
1000
1020
1040
1060
1080
Sam. hold. 3 LPMSam. hold. 9 LPMSam. hold. 15 LPMCavity surf. 3 LPMCavity surf. 9 LPMCavity surf. 15 LPM
a
b
Fig. 11. Centerline (a), and inner cavity wall and sample holder surface (b) temperature profiles for various gas flow rates.
Table 4Influence of gas flow rate on reactor thermal performance.
Gas flow rate (LPM) Qsolar (W) Qabs (W) Qrad (W) ηabsorbtion (%) Tmax (K)
3 746.11 209.44 536.66 28.07 21069 746.11 222.93 523.17 29.87 2091
15 746.11 233.19 512.92 31.25 2078
Radius (mm)
Tem
pera
ture
(K)
0 2 4 6 8 10 121950
2000
2050
2100
3 LPM9 LPM15 LPM
Fig. 12. Temperature profile at the reactor sample surface for different gasflow rates.
S. Bellan et al. / Chemical Engineering Science 101 (2013) 81–8988
Acknowledgment
The authors wish to thank “Comunidad de Madrid” and “EuropeanSocial Fund” for its financial support to the SOLGEMAC Project throughthe Program of Activities between Research Groups (S2009/ENE-1617).JGA acknowledges support from the Spanish Ministry of Science andInnovation (grant Ramon y Cajal RYC-2009-05358).
References
Abanades, S., Flamant, G., 2006. Thermochemical hydrogen production from a two-step solar-driven water-splitting cycle based on cerium oxides. Solar Energy 80,1611–1623.
Abanades, S., Charvin, P., Flamant, G., 2007. Design and simulation of a solarchemical reactor for the thermal reduction of metal oxides: case study of zincoxide dissociation. Chem. Eng. Sci. 62 (22), 6323–6333.
Abanades, S., Levêque, G., 2013. Kinetic analysis of high-temperature solid–gasreactions by an inverse method applied to ZnO and SnO2 solar thermaldissociation. Chem. Eng. J. 217, 139–149.
Alonso, E., Pérez, C., González-Aguilar, J., Romero, M., 2012. Thermal performance andresidence time distribution determination in a solar reactor for chemical kinetics. In:Proceedings of the 18th SolarPACES Conference, Marrakech, Morocco.
Alonso, E., Gómez, F., González-Aguilar, J., Romero, M., 2011. Experimental analysis ofMn3O4/MnO reduction in a packed-bed type solar reactor: oxygen partial pressureinfluence. In: Proceedings of the SolarPACES Conference, Granada, Spain, pp. 20–23.
COMSOL Multiphysics Version 4.2, COMSOL AB, Stockholm, Sweden, 2012.Frey, T., Steiner, E., Wuillemin, D., Sturzenegger, M., 2001. Tremper–a versatile tool
for high-temperature chemical reactivity studies under concentrated solarradiation. J. Solar Energy Eng. 12, 147–152.
Gardon, R., 1953. An instrument for the direct measurement of intense thermalradiation. Rev. Sci. Instrum. 24 (5), 366–370.
Gómez, F., Gonzalez-Aguilar, J., Romero, M., 2011. Experimental 3D flux distributionof a 7 kWe-solar simulator. In: Proceedings of the SolarPACES Conference,Granada, Spain, pp. 20–23.
Gonzalez-Aguilar, J., Alonso, E., Hutter, C., Romero, M., Steinfeld, A., 2012. Char-acterisation of Solid–Gas Chemical Reactions by Solar Thermogravimetry,World Renewable Energy Forum, Denver, Colorado, May 13–17.
Duffie, J.A., Beckman, W.A., 2006. Solar Engineering of Thermal Processes 3rd ed.,John Wiley & Sons, Inc.; Hoboken.
Kodama, T., Gokon, N., 2007. Thermochemical cycles for high temperature solarhydrogen production. Chem. Rev. 107, 4048–4077.
Kreider, P.B., Funke, H.H., Cuche, K., Schmidt, M., Aldo Steinfeld., A., Weimer, A.W.,2011. Manganese oxide based thermochemical hydrogen production cycle. Int.J. Hydrogen Energy 36, 7028–7037.
Kröger-Vodde, A., Holländer, A., 1999. CCD flux measurement system PROHERMES.J. Phys. IV France 9, Pr3-649–Pr3-654.
Meier, A., Ganz, J., Steinfeld, A., 1996. Modeling of a novel high-temperature solarchemical reactor. Chem. Eng. Sci. 51 (11), 3181–3186.
Moller, S., Palumbo, R., 2001. Solar thermal decomposition kinetics of ZnO in thetemperature range 1950-–2400 K. Chem. Eng. Sci. 56, 4505–4515.
Muller, R., Haeberling, P., Palumbo, R.D., 2006. Further advances toward the develop-ment of a direct heating solar thermal chemical reactor for the thermal dissociationof ZnO(s). Solar Energy 80 (5), 500–511.
Murphy, A.B., Arundell, C.J., 1994. Transport coefficients of argon, nitrogen, oxygen,argon–nitrogen, and argon–oxygen plasmas. Plasma Chem. Plasma Process14 (4), 451–490.
Neumann, A., Monterreal, R., 1992. Measurement of concentrated solar radiationwith the HERMES II systema at PSA. In: 6th International Symposium on SolarThermal Concentrating Technologies, Mojacar, Spain, Sept. 28–Oct. 2.
Palumbo, R., Keunecke, M., Moller, S., Steinfeld, A., 2004. Reflections on the design ofsolar thermal chemical reactors: thoughts in transformation. Energy 29, 727–744.
Patankar, S.V., 1980. Numerical Heat Transfer and Fluid Flow. Hemisphere/McGraw-Hill, Washington, DC (Chapter 3).
Romero, M., Steinfeld, A., 2012. Concentrating solar thermal power and thermo-chemical fuels. Energy Environ. Sci. 5, 9234.
Schunk, L.O., Haeberling, P., Wepf, S., Wuillemin, D., Meier, A., Steinfeld, A., 2008. Areceiver–reactor for the solar thermal dissociation of zinc oxide. J. Solar EnergyEng. 130 (2), 021009–021015.

S. Bellan et al. / Chemical Engineering Science 101 (2013) 81–89 89
Steinfeld, A., Palumbo, R., 2001. Solar thermochemical process technology. In:Meyers, R.A. (Ed.), Encyclopedia of Physical Science and Technology, 15.Academic Press, London, pp. 237–256.
Steinfeld, A., 2005. Solar thermochemical production of hydrogen—a review. SolarEnergy 78, 603–615.
Sturzenegger, M., Ganz, J., Nüesch, P., Schelling, T., 1998. Solar hydrogen frommanganese oxide—a new thermochemical cycle. Hydrogen Energy Progress XII1–3, 801–805.
Thomas, J.H., Amanie, N.A., 2000. Experimental and Numerical Characterization of aSteady-State Cylindrical Blackbody Cavity at 1100 1C. NASA/TM-2000-209022.