Embed Size (px)
Citation preview

See discussions, stats, and author profiles for this publication at: https://www.researchgate.net/publication/229035201
Theory Driven Real Time Empirical Investigation on Joint Implementation of
PDCA and 5S for Performance Improvement in Plastic Moulding Industry
Article in Australian Journal of Basic and Applied Sciences · October 2009
CITATIONS
7
2 authors:
Some of the authors of this publication are also working on these related projects:
virtual team efficiency View project
Prof. Dr. Md. Abdul Wazed
Chittagong University of Engineering & Technology
38 PUBLICATIONS 375 CITATIONS
SEE PROFILE
Shamsuddin Ahmed Mohammed Shahadat
Islamic University of Technology
145 PUBLICATIONS 1,617 CITATIONS
SEE PROFILE
All content following this page was uploaded by Shamsuddin Ahmed Mohammed Shahadat on 30 September 2014.
The user has requested enhancement of the downloaded file.

Australian Journal of Basic and Applied Sciences, 3(4): 3825-3835, 2009
ISSN 1991-8178
© 2009, INSInet Publication
Corresponding Author: M. A. Wazed, Department of Engineering Design & Manufacture, Faculty of Engineering,University of Malaya (UM), 50603 Kuala Lumpur, Malaysia (Phone: 60-143-605425;E-mail: [email protected].
3825
Theory Driven Real Time Empirical Investigation on Joint Implementation of PDCAand 5S for Performance Improvement in Plastic Moulding Industry
M.A. Wazed and Shamsuddin Ahmed
Department of Engineering Design & Manufacture, Faculty of Engineering, University of Malaya(UM), 50603 Kuala Lumpur, Malaysia.
Abstract: The main purpose of this paper is to present case study on how a theory driven real time
empirical investigation can offset the quality related problems and bring better results in other
performance dimensions. A systematic approach and application of the basic and advanced
management tools and techniques are used to solve the part rejection problems in a plastic moulding
manufacturing plant. In order to illustrate this, the study focused on joint application of PDCA and
5S approaches. Analysis has shown that the current average rejection rate (per month) in the moulding
plant is 3.26 percent. Therefore, there is an urgent need for the company to reduce this by
implementing a set of well-drawn solutions. The main defects found during the online inspection are
the black dots (47 percent) and colour lines (18 percent). The root causes behind these effects are
related to 5Ms (man, material, machine, method and mother of nature). However, implementation of
the joint approach results significant improvement and good impressions to the customers and a
cleaner and comfortable working condition for the employees and management. The recommended
solution is not only appropriate for the moulding plant alone but can also be mimicked by other
manufacturing industries facing the similar problem(s). The case study presented here shows the
application of basic principles, management tools and techniques towards performance improvement
in a manufacturing plant. This paper provides approaches to aid in reducing the online rejection
during moulding process. The work is original of its nature.
Key words: Moulding industry, Rejection reduction, Defect, 5S.
INTRODUCTION
Quality, cycle time, cost and profitability are interdependent. Many organizations now focus upon the "total
performance improvement" or "business excellence" rather than quality alone. Hence, for discovering problems
in manufacturing and solving them in a sustained manner, process focus is vital. Statistical tools are important
for improving product and service quality. In most industry, quality improvement efforts have statistics as their
foundation because these statistical data can be used to aid in decisions making process, changes or pursuing
a particular course or action. In reality, there are many workplaces which are dirty and are disorganized.
Hence, the proper housekeeping approach which is called 5S for seiri (sort), seiton (set in order), seisi (shine),
seiketsu (standardize), and shitsuke (sustain) could be implemented. The benefit of good workplace include the
prevention of defects; prevention of accidents; and the elimination of time wasted for searching tools,
documentation and other ingredients of manufacture. Performance improvement is the concept of measuring
the output of a particular process or procedure, then modifying the process or procedure in order to increase
the output/efficiency/ effectiveness of the process or procedure. This concept can be applied to measure either
individual performance or organizational performance. Generally, improvements in terms of product quality are
short-lived and not effective, hence for sustainable overall improvement we should focused on the
organizational management, processes involved and the concerned individuals with process priority.
The traditional view of quality, measures the process performance in defective parts per hundred produced.
With total quality the same is taken in parts per million (ppm). Beside, the traditional view focused on
after-the-fact inspections of products. With total quality the emphasis is on continuous improvement of
products, processes and people in order to prevent problems before they occur (David and Stanley, 2003.).

Aust. J. Basic & Appl. Sci., 3(4): 3825-3835, 2009
3826
Since this study is focusing on the overall performance improvement, therefore, it will cover a structured
program to systematically approach the total organization, cleanliness, and standardization in the workplace
which are essential for high-performance. 5S is the extension of the total productive maintenance which stresses
on maintaining a well-organized workplace.
Continuous process improvement has acquired a broad meaning, i.e., enduring efforts to act upon both
chronic and sporadic problems and to make refinements of processes. For chronic problems, it means achieving
better and better levels of performance for each year; for sporadic problems, it means taking corrective action
on periodic problems; for process refinements, it means taking such action as reducing around a target value
(Frank, 2001).
Juran's Quality Trilogy addresses three process improvement components which are quality planning,
quality control and quality improvement Juran Trilogy, (2003). Quality planning is the process for designing
products, services, and processes to meet new breakthrough goals; quality control is the process for meeting
goals during operations; and quality improvement is the process for creating breakthroughs to unprecedented
levels of performance. The basic concept of this strategy is that each failure has a root cause and since causes
are preventable, hence prevention is cheaper (Frank, 2001).
There are four types of improvement strategies which are the repair, refinement, renovation and reinvention
(Dale, et al., 2003). The repair strategy is divided into two levels where at the first level the strategy is to fix
than to break anything. This level is a temporary or short term measure. However, for the second, the strategy
is to identify and eliminate the root cause(s) of the problem and affect a permanent solution. The refinement
strategy involves activities that continually improve a process and thus improves the efficiency and
effectiveness. Thirdly the renovation process involves in shifting to new technology or other breakthrough
improvements. Lastly the reinvention is also called as reengineering strategy. Reengineering is the most
demanding improvement strategy because the process is developed through a complete understanding of
customer's requirements and expectations.
The isolation and analysis of a problem and development of a permanent solution, is an integral part of
the quality-improvement process (Donna, 2006). In day to day production, problem arises and the traditional
companies barely manage to tamp down the flames of one problem before other arises elsewhere. An effective
approach to solve problems is to locate and eliminate the root or the real cause using logical and systematic
methods. The reported problem solving methods include PDSA (Pland-Do-Study-Act) cycle, Six Sigma,
Taguchi's method, Juran's improvement program, Croby's quality philosophy, the Deming cycle etc.
The Six Sigma strategy is a modification of PDCA cycle and was designed to improve an existing business
process. The methodology is known as Define-Measure-Analyse-Improve-Control (DMAIC) cycle (Jeroen de
Mast, 2004). Taguchi discerns between the online and offline quality control. Juran's improvement program
is prominent of developing a habit of making annual improvements in quality and annual reductions in
quality-related costs. The Crosby's quality philosophy is embodied in what he calls "Absolute of Quality
Management" and the "Basic Elements of Improvement". He had also proposed a 14-steps program for quality
improvement. The Deming cycle, originally known as Shewart cycle, is a methodology for quality improvement.
This cycle is composed of four stages: plan, do, study and act (James and William, 1999).
There are numerous statistical and quality control tools that can be used in analyzing the situations and
in providing actions depending on the collected data. However, in statistical process control (SPC), there are
seven basic techniques that may used for improving products and service quality: Pareto Analysis, Process
Maps/ Flow Chart, Cause-and-effect Diagrams, Check Sheets, Histograms, Control Charts and Scatter Diagrams
(Donna, 2006). In 1976, the Japanese Society for Quality Control Technique Development proposed seven tools
for quality improvement: Affinity Diagram, Interrelationship Digraph, Tree Diagram, Matrix Diagram,
Prioritization Matrices, Process Decision Program Chart, Activity Network Diagram, Brainstorming,
WHY-WHY Diagram, Force-Field Analysis and Nominal Group Technique (John, et al., 2004).
In a molding plant, cleanliness is hard to be maintained. Spilled powder, oil from the hydraulic system,
and parts on the floor make housekeeping difficult. However, lack of housekeeping may be a major cause for
rejected parts. Hence, the 5S movement, the main constituents of Total Productive Maintenance (TQM), can
be used as a method of performance enhancement. It is a simple management technique that boosts productivity
through five activities (Frank, 2001).
UMW Auto Parts Sdn Bhd (APSB) is a well known company in Malaysia that distributes parts to the
automotive market around the Globe. Their products include oil filters for heavy equipment, automotive
elements and housings, brake fluids, carbon cannisters, air filters, coolants, oil filters, air filters for heavy
equipment etc. APSB dedicated most of their blow moulding products (especially brake fluid bottle and

Aust. J. Basic & Appl. Sci., 3(4): 3825-3835, 2009
3827
lubricant bottle) to Plastic Industries Sdn. Bhd. (Sonyu). The rejection problems in the plastic moulding plant
of Sonyu are unsolved for the past few years, hence a theory driven real time empirical investigation is carried
out to solve it. This case study will locate the root causes which are responsible for rejection. A systematic
approach and the basic and advanced management tools and techniques are used to solve the part rejection
problems. The manufacturing company didn't implement any statistical tools in observing, determining and
analyzing the process variation and process capability. We introduce the statistical process control tool to
monitor the behavior of the process continuously and thus provide a feedback loop that can enable the
organization to achieve process improvement. Beside, the study also focuses on the joint implementation of
PDSA cycle and 5S movement as a method of performance enhancement.
The ultimate goal of this study is to improve the performance of the company through process focus with
multifold objectives. They include reducing of online rejection rate to 25000 ppm per month; assuring of
quality of products; detecting of major faults using relevant mathematical and statistical tools and techniques;
and finding of causes of faults and categorize those using proper tools and techniques.
Data collection, analysis and improvement:
In this section, the collected data are presented, analyzed and improvement actions will be suggested and
implemented. The actual rejection quantity for each part for January - September (in ppm) is shown in Table
1. The analysis will include the defective parts during online moulding process, losses due to scrap and rework,
histogram analysis, attribute and variable control chart analysis, process capability study and finally the 5S
movement analysis. The tools used include Pareto Chart, Why-Why analysis, brainstorming, Cause-and-Effect
diagram, questionnaire survey, SPSS version 13.0 etc. Investigations on the processes are mainly done through
observation and interview session. After implanting the suggested solutions, again data will be collected and
same analysis will be repeated. If the results show improvement in rejection or reducing the variation, the
solutions will be recommended for implementation.
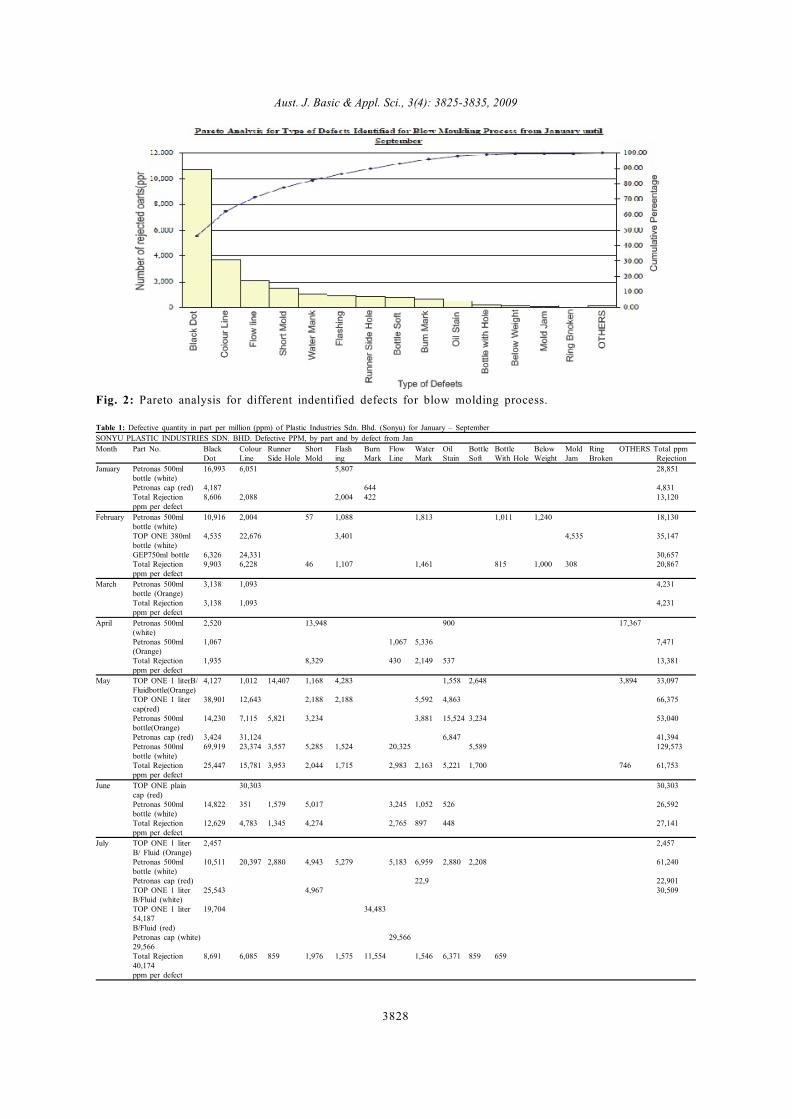
Pareto Chart Analysis:
According to Pareto principle, typically, approximately 80% of the problems result from approximately
20% of the causes. The ACTUAL rejection (Table 1) is grouped in their respective type of defects identified
(Table 2). From Table 2, it is observed that the two main defects are black dot (46.35%) and colour line
(17.55%). These two defects contributed 63.9% of the overall rejection. Therefore, at this stage, it is obvious
that rejection will decrease if these two main defects are reduced. The overall rejection is composed of two
different processes, injection and blow moulding process, are shown in Fig. 1 and Fig. 2 respectively. The cap
of the bottle is manufactured through injection moulding process while the bottle is produced through blow
moulding process. From these figures, again the main defects are black dot and colour line. Therefore, it is
indeed that the rejection in blow moulding process is much higher than the rejection in the injection moulding
process.
Fig. 1: Pareto analysis for different indentified defects for injection molding process
Aust. J. Basic & Appl. Sci., 3(4): 3825-3835, 2009
3828
Fig. 2: Pareto analysis for different indentified defects for blow molding process.
Table 1: Defective quantity in part per million (ppm) of Plastic Industries Sdn. Bhd. (Sonyu) for January – September
SONYU PLASTIC INDUSTRIES SDN. BHD. Defective PPM, by part and by defect from Jan
Month Part No. Black Colour Runner Short Flash Burn Flow Water Oil Bottle Bottle Below Mold Ring OTHERS Total ppmDot Line Side Hole Mold ing Mark Line Mark Stain Soft With Hole Weight Jam Broken Rejection
January Petronas 500ml 16,993 6,051 5,807 28,851bottle (white)Petronas cap (red) 4,187 644 4,831Total Rejection 8,606 2,088 2,004 422 13,120ppm per defect
February Petronas 500ml 10,916 2,004 57 1,088 1,813 1,011 1,240 18,130bottle (white)TOP ONE 380ml 4,535 22,676 3,401 4,535 35,147bottle (white)GEP750ml bottle 6,326 24,331 30,657Total Rejection 9,903 6,228 46 1,107 1,461 815 1,000 308 20,867ppm per defect
March Petronas 500ml 3,138 1,093 4,231bottle (Orange)Total Rejection 3,138 1,093 4,231ppm per defect
April Petronas 500ml 2,520 13,948 900 17,367(white)Petronas 500ml 1,067 1,067 5,336 7,471(Orange)Total Rejection 1,935 8,329 430 2,149 537 13,381ppm per defect
May TOP ONE 1 literB/ 4,127 1,012 14,407 1,168 4,283 1,558 2,648 3,894 33,097Fluidbottle(Orange)TOP ONE 1 liter 38,901 12,643 2,188 2,188 5,592 4,863 66,375cap(red)Petronas 500ml 14,230 7,115 5,821 3,234 3,881 15,524 3,234 53,040bottle(Orange)Petronas cap (red) 3,424 31,124 6,847 41,394Petronas 500ml 69,919 23,374 3,557 5,285 1,524 20,325 5,589 129,573bottle (white)Total Rejection 25,447 15,781 3,953 2,044 1,715 2,983 2,163 5,221 1,700 746 61,753ppm per defect
June TOP ONE plain 30,303 30,303cap (red)Petronas 500ml 14,822 351 1,579 5,017 3,245 1,052 526 26,592bottle (white)Total Rejection 12,629 4,783 1,345 4,274 2,765 897 448 27,141ppm per defect
July TOP ONE 1 liter 2,457 2,457B/ Fluid (Orange)Petronas 500ml 10,511 20,397 2,880 4,943 5,279 5,183 6,959 2,880 2,208 61,240bottle (white)Petronas cap (red) 22,9 22,901TOP ONE 1 liter 25,543 4,967 30,509B/Fluid (white)TOP ONE 1 liter 19,704 34,48354,187B/Fluid (red)Petronas cap (white) 29,56629,566Total Rejection 8,691 6,085 859 1,976 1,575 11,554 1,546 6,371 859 65940,174ppm per defect

Aust. J. Basic & Appl. Sci., 3(4): 3825-3835, 2009
3829
Table 1: Conntinue
August TOP ONE 1 liter 13,706 19,189 2,19335,088 cap (red)Petronas cap (red) 25,641 25,641Petronas 500ml 19,340 38,487 57,827bottle (white)Petronas cap (white) 2,456 2,7025,158TOP ONE 1 liter B/ 69,001 10,299 123,584s
202,884Fluid bottle (Orange)TOTAL 13,216 8,235 884 7,030 2,410 803 32,578
September Petronas 500ml 31,342 644 805 1,353 15,622 5,862 4,832 60,461bottle (white)Petronas cap (red) 8,850 8,850TOP ONE 500ml 40,715 9,714 2,872 4,224 4,139 2,999 64,662B/Fluid (white)TOP ONE 1 liter 32,023 32,023cap (red)Total Rejection 31,197 2,674 995 1,519 5,187 1,946 2,652 759 46,929per defect
AVERAGE 15,119 5,727 787 1,539 1,096 2,231 2,097 1,833 853 773 235 123 38 76 95 32,621Rejection ppmRANK 1 2 9 6 7 3 4 5 8 10 11 12 15 14 13
Table 2: Rejection rate (in ppm) for each type of defect identified
Ranking Type of Defects No. of Defect Quantity (in ppm) Rejection % Cumulative %
1 Black Dot 15119 46.35 46.352 Colour Line 5727 17.55 63.903 Burn Mark 2231 6.84 70.744 Flow Line 2097 6.43 77.175 Water Mark 1833 5.62 82.796 Short Mold 1539 4.72 87.517 Flashing 1096 3.36 90.878 Oil Stain 853 2.61 93.489 Runner Side Hole 787 2.41 95.8910 Bottle Soft 773 2.37 98.2611 Bottle with Hole 235 0.72 98.9812 Below Weight 123 0.38 99.3613 Ring Broken 76 0.23 99.5914 Mold Jam 38 0.12 99.7115 Other 95 0.29 100.00
Total 32621 100.00 100.00
Cause and Effect Diagram and WHY-WHY Analysis
Cause and Effect Diagram and WHY-WHY Analysis:
In determining the possible causes, several main factors like raw material, method, machine, people or
staffs involved and organization's environment are considered. Brainstorming session is conducted with seven
people from the management consists of General Manager and Managing Director, Sales and Marketing
Manager (Injection), Production Manager, Production Executive (both from Injection and Blowing) and
production executive for identifying the possible causes.
The causes identified for black dots and for colour lines are then placed in the Ishikawa Diagram or the
Cause-and Effect Diagram (Fig. 3 and Fig. 4) respectively. Several causes contributed towards the formation
of black dot in the plastic parts produced. The diagrams show innumerous of factors that should be investigate,
however, the focus should be given to the most likely cause(s) that contribute towards the rejection of the
black dot and colour line. Therefore, WHY-WHY strategy is used to reach at the root cause(s).
WHY-WHY strategy is used to find out root cause(s) (Fig. 5 and Fig. 6 for black dot and for colour lines
respectively). After a few level of WHY, the causes is categorized into the control factor and the noise factor.
Therefore, the scope of investigation is further reduced. It is then assured from Fig.5 that the contamination
of second grade material is the main factor of black dot. However, the second grade material can be
contaminated due to several factors such as use of dirty crushing machine, defect not removed properly in the
earlier stage before crushing process, the dusty environment in the factory and others. From observation, the
operators are found to be careless in trimming off the contaminated part that are recycled (closed loop cycle).
Therefore, proper control of the second grade material is vital in order to reduce the rejection due to black
dot. Beside, there are also others factors that contribute to rejection.
From Fig. 6 it is clear that the rejection due to colour lines, mainly because of machine, method and raw
material used. SONYU claimed that the colour line can be cured by adding the recycled material (also known
as second grade material). However, technically, the colour line is due to the improper control of the machine
temperature and pressure, which affect the properties of the material (especially the material flow rate and
viscosity). SONYU uses aging blow moulding machine to manufacture the plastic bottle which is also another
factor that should be considered. Because, as the production goes on, the machine parameter will run out and
causes the formation of colour line and others defect.

Aust. J. Basic & Appl. Sci., 3(4): 3825-3835, 2009
3830
Questionnaire Survey:
As through observation and interview session, it is impossible to cover all the intended areas, therefore,
a survey questionnaire is conducted in order to gather the response. This questionnaire survey is used to collect
the quantitative data towards the causes for the defect identified. Beside, the survey also includes the optimal
solutions that will be implemented in the moulding plant. The survey form was distributed among the
staffs/officers/management and then from the survey results some conclusions are made using the SPSS
software. Figure 7 and Fig. 8 show the survey results related causes of black dot and colour line due to input
factors and raw materials respectively. The factors for contamination of raw materials and causes related to
manpower, method, machine and environment are shown in Fig 9, Fig. 10, Fig. 11, Fig. 12 and Fig. 13 in
order.
Fig. 3: Cause-and-Effect Diagram for black dot.
Fig. 4: Cause-and-Effect Diagram for colour line.

Aust. J. Basic & Appl. Sci., 3(4): 3825-3835, 2009
3831
Fig. 5: Why-Why Diagram for black dot.

Aust. J. Basic & Appl. Sci., 3(4): 3825-3835, 2009
3832
Fig. 6: Why-Why Diagram for colour line.
Fig. 7: Percentage of factors that cause the black dot (left) and the colour line (right).
Fig. 8: Possible causes related to the raw material towards formation of black dot (left) and colour line (right).

Aust. J. Basic & Appl. Sci., 3(4): 3825-3835, 2009
3833
Fig. 9: Percentage of possible causes towards contamination of raw material.
Fig. 10: Ranking of possible causes related to man power towards black dot.
Fig. 11: Possible causes related to method toward black dot (left) and colour line (right)

Aust. J. Basic & Appl. Sci., 3(4): 3825-3835, 2009
3834
Fig. 12: Possible causes related to machine towards black dot (left) and colour line (right).
Fig 13: Ranking of possible causes related to environment towards black dot (left), colour line (right)
DISCUSSIONS AND CONCLUSIONS
The questionnaire survey and analysis have provided useful information in identifying the most likely
causes to be investigated and the optimal solution(s) that should be finally implemented in the later stage.
The main contributors to the rejection due to black dot and colour line are identified. The main factor of
the formation of black dot is the contamination of raw material used. The material is contaminated mainly due
to not remove the contaminated section properly by the operators. Beside, the materials are also being
contaminated during the material preparation stage. The carelessness of the operators in removing the
contaminated parts is another cause. This factor determines the quality of the second grade material. Apart from
that, method used such as lacking of standard operating procedure and machine setup procedure contributes
to the rejection due to black dot. Use of dirty machine and dirty environment has also contribution in
formation of black dot.
The most preferred way in solving the black dot problem is through controlling of the second grade
material where operators needs to increase their awareness in inspecting the parts and trimmed off any
contaminated section found. Besides, management at SONYU has also shown their interest in applying standard
operating procedure in the working environment so as to systemize and standardize the way workers activities.
Lastly, 5S movement is to be implemented in the moulding plant so as to improve the house keeping method.
For the rejection due to colour line uneven mixing and insufficient volume of second grade material is the
main contributor. Apart from that, the setting of the optimal moulding conditions is another major cause
towards colour line. Aging moulding machine is also increases the possibility of getting colour line as the
machine goes out of control after several hours or days of production. Maintenance of the moulding machine
is vital to assure the efficiency of the machine. Proper cleaning of the machines are crucial as dirty machine
used will affect in the quality of the parts produced.
Aust. J. Basic & Appl. Sci., 3(4): 3825-3835, 2009
3835
REFERENCES
David, L. and B. Stanley, 2003. Quality Management: Introduction to Total Quality Management for
Production, Processing, and Services (4th Edition). Prentice Hall, Upper Saddle River, NJ.
Frank, M., 2001. Quality Planning and Analysis, 4th edition. Mc-Graw Hill.
JuranTrilogy, 2003. 6-SigmaTechnologyGroup,Available:http://www.6sigmatech.com/ QzoneJuranTrilogy.asp
[Accessed on 12 February 2008].
Dale, H., B. Carol, H. Glen and B. Mary, 2003. Total quality Management, 3rd ed. Prentice Hall, Upper
Saddle River, NJ.
Donna, C., Quality, 2006. 4th edition. Prentice Hall, Upper Saddle River, NJ.
Jeroen de Mast, 2004. 'A methodology comparison of three strategies for quality improvement', Journal
of Quality Reliability, 21(2): 198-213.
James, R. and M. William, 1999. The Management and Control of Quality, 4th edition. 1999,
South-Western College Publishing, Cincinnati, Ohio.
John, E., L. Grace and T. Russell, 2004. The Quality Improvement Handbook. ASQ Quality Press,
Milwaukee, Wisconsin.
View publ icat ion statsView publ icat ion stats