Embed Size (px)
Citation preview

J. T. TOWNSENDPurdue University,West Lafayette, Indiana 47907
Theoretical analysis of analphabetic confusion matrix*
A study was undertaken to acquire a confusion matrix of the entire upper-case Englishalphabet with a simple nonserifed font under tachistoscopic conditions. This wasaccomplished with two experimental conditions. one with blank poststimulus field andone with noisy poststimulus field, for six Ss run 650 trials each. Three mathematicalmodels of recognition, two based on the concept of a finite number of sensory states andone being the choice model, were compared in their ability to predict the confusionmatrix after their parameters were estimated from functions of the data. In order toascertain the facility with which estimates of similarity among the letters could lead to apsychological space containing the letters, 'l1ij, the similarity parameter of the choicemodel was input to an ordinally based multidimensional scaling program. Finally,correlation coefficients were computed among parameters of the models, the scaledspace, and a crude measure of physical similarity. Briefly, the results were: (I) thefinite-state model that assumed stimulus similarity (the overlap activation model) and thechoice model predicted the confusion-matrix entries about equally well in terms of asum-of-squared deviations criterion and better than the ali-or-none activation model,which assumed only a perfect perception or random-guessing state following a stimuluspresentation; (2) the parts of the confusion matrix that fit best varied with the particularmodel, and this finding was related to the models; (3) the best scaling result in terms of agoodness-of-fit measure was obtained with the blank poststimulus field condition, with atechnique allowing different distances for tied similarity values, and with the Euclidean asopposed to the city-block metric; and (4) there was agreement among the models in termsof the way in which the models reflected sensory and response bias structure in the data,and in the way in which a single model measured these attributes across experimentalconditions, as well as agreement among similarity ami distance measures with physicalSimilarity.
The study reported in these pagessoughtto pursue several related goals. The broadgoal was establishment and investigationofa tachistoscopic confusion matrix obtainedfrom human observers attempting toidentify single members of the completeupper-case English alphabet. Despite theabundance of data concerning legibility ofalphanumeric characters (e.g., see Cernog &Rose, (967), some of the results are ofmarginal significance to the psychologistbecause (1) of the highly specific appliednature of the study, (2) too few trials orsubjects were run. (3) only a few of theletters of the alphabet were used, or (4) noattempt was made to use mathematicalmodels to separate the response-biascharacteristics from the stimulus or sensorycharacteristics. This study was intended tocomplement the literature by rectificationof these limitations.
Within the above-stated broad goal wasthe subsidiary aim of examining the abilityof three simple mathematical models topredict average behavior in a completeidentification confusion study. Because ofthe large array of data represented by the
'The data were gathered and part of theanalysis of this study was accomplished at theUniverxity of Hawaii with the aid of a Universityof Hawaii intramural research grant.
26 by 26 confusion matrix, it was requiredof the models that they be of sufficientlysimple structure that parameter estimationbe feasible. One of the few extant modelsthat possesses this property withoutsimplifying assumptions is the choicemodel (Luce, 1959, 1963a). However,work with finite-state detection models(e.g.. see Atkinson & Kinchla, 1965; Luce,1963b) also suggested the possibility ofextension of this type of model to morecomplex situations. Because of the veryexplicit nature of assumptions of thesemodels about the sensory and biasprocesses. they can be helpful ininvestigation of perceptual characteristicsby manipulation of these assumptions, Tothis end. two generalizations of theactivation model suitable for application inthe present experiment were developed. Aswill be seen, one of these is like the choicemodel in that it possesses structure fordescription of psychological similarity, butthe other assumes only two psychologicalsc nsor y states relating to perfectinformation or no information at all. It wasof interest to learn if better predictions areobtained with models that assume sensoryconfusion states as opposed to thetwo-state type of model just mentioned aswell as to compare the choice model withthe activation representative. In addition, a
simple correlational analysis was carriedout in order to acquire a rough idea as towhat extent the models seemed to beconsistent in different conditions and,among themselves, to be measuring orreflecting the same attributes within thedata. One limitation, of course, in thepresent type of study is that the modelspurport to explain individual behavior.Hence, the work reported here must beviewed as testing the ability of the modelsto handle a large amount of averagedhuman confusion data but not as providinga critical test of the models' assumptionsthat are meant to apply at the level of theindividual. An experiment is in progresscollecting long-term confusion data at theindividual level.
A second major type of analysisincluded in the present study was the useof an ordinal-based multidimensionalscaling procedure applied to estimatedsimilarity parameters in the hope oflearning more about the characteristics ofpsychological space for letteridentification, when all letters are in thestimulus population. The results of this andthe analysis with the substantive modelsare discussed, interrelated, and comparedto a simple. physical measurement ofinterletter similarity.
Apart from the hypothesis-testingfunction of an experiment. there existaspects that perhaps should be viewed as ofan information-gathering nature. In thiscontext, latencies and confidence ratingswere collected and the summary resultscommented on, although the modelsemployed here were not developed to theextent necessary to make predictionsconcerning these.
THEORETICAL DEVELOPMENTSIt was of interest in the present study to
compare two models selected from a classof finite-state models with the choicemodel (Luce, 1963a). and a "threshold"finite-state model with models postulatingsensory confusion. The class of finite-statemodels from which the two representativeswere selected was motivated by the simplefinite-state models used in some detectionexperiments (Atkinson & Kinchla, 1965;Kinchla, Townsend. Yellott, & Atkinson.1966) and multisymbol recognitionsituations (Townsend, 1966). In order toprovide continuity with the intuitions andstructure developed earlier. we will refer 10
the finite class of models as the generalactivation model.
General Activation ModelThe nature of the activation model in
our development supposes a mapping ofthe set of N possible stimulus events to a(finite) set of n hypothetical internalsensory states. On the basis of the
40 Copyright 1971, PsychonomicJournals.Lnc.. Austill, Texas Perception & Psychophysics, 1971, Vol. 9 (lA)

particular internal state activated, S isassumed to make a decision as to thestimulus event, thus yielding a mapping ofthe n internal states to the set of N possibleresponses. For the complete identificationexperiment with N stimuli. the sensoryactivation matrix would appear as S = (ajj)where i = I, 2,' ., Nand j = 0, I. 2, •• , n.The second subscript refers to thehypothetical sensory states so, s\ , ••• , Sn'
Similarly. we may write the decision- orbias-process matrix as D = (bi.j), wherei=0.1.2,···.n and j=I.2... ·,N.Finally. we obtain the general theoreticalconfusion matrix by premultiplying D byS:
where i = 1,2, ... , Nand k= 1,2. -, N,where. in general, the only constraints arethat
n NL ai' = 1 and that L b~ = I.
j=O I j= I
The interpretation of the internal sensorystates we wish to make in this paper is interms of sensory confusions among thevarious stimuli. For example, depending onthe actual set of stimuli, it might bepossible that S is certain that the presentedstimulus is one of a particular subset ofstimuli (the cardinality possibly beingequal to zero or to the number of possiblestimuli) and hence, S must choose fromthis subset on the basis of learning ormotivational factors.
It should be noted that one can devisecon tinuous-state models that possessproperties that reasonably mimicfinite-state models. For example, if thesensory results of each stimuluspresentation could be described by auniform distribution, then there wouldexist, in general, areas of nonoverlap ofprobability density; if an observationoccurred in such an area, a reasonablestrategy would be for S to respond withthe associated response, with probabilityone. On the other hand, if an observationwere obtained at a point where, say. kstimuli gave rise to equal a priori densities,S might well guess on the basis of hisknowledge of the presentationprobabilities. For example, he mightchoose the signal with the highest a priorior a posteriori probability (whichmaximizes average number correct), or hemight employ a Bayesian probabilitymatching strategy. The second strategywould occur when S chooses, say, S. fromthe k alternatives with probability
(k )peS)
k (k lL P(Sj)
j= 1(k)
In this expression, P(Si) represents thea priori probability of stimulus Si and thesuperscript merely indicates that thestimulus is a member of the k-stimulisubset of equal-density stimuli at theobserved point. Under the expressedcircumstance this above quantity is boththe Bayesian probability (hence the term"B ay esian probability matching") ofstimulus Sj given the particular observedpoint and the conditional probability of Sjgiven the stimulus must be in the k-stimulisubset. We will not attempt to distinguishsuch theories from the finite-state theorieshere.
In order to obtain tractable special casesand to investigate the relative importanceof pairwise sensory confusions as opposedto "pure" guessing (where S is in a state ofcomplete uncertainty regarding thepresented stimulus), we develop theall-or-none and overlap activation modelsfor application to letter-recognitionexperiments.
All-or-None Activation ModelThe first specialization posits that S
either obtains such information from thedisplay as allows him to respond perfectlyor he is thrown into an uncertain statewhere he has no partial information andmust respond by guessing. Note that Scould be in this uncertain state eitherbecause he fails to detect anything at all orbecause such characteristics of the letter ashe observes do not aid in identifying it. Ifwe index the letters of the alphabet by thenumbers I through 26 and refer to S. asstimulus i (i.e .. the it h letter of thealphabet) and R
1as response j, we may
write the appropriate sensory activationmatrix as S =' ai.,) where i = I, 2,' , 26,j = 0, I, 2, ..• , 2/;' and where
11 a, when j = 0,1
aii = at when j = i,ootherwise,
where, as before, j refers to sensory state si'These sensory states are related to the setof overt responses by the decision matrixD = (b i , ), where i = 0, I, "',26,j = I, 2, ..• , 26, and
IPj when i = 0 )bil '" I when i = j,
ootherwise.
Hence, s, through S26 represent "certain"sensory states since P(Rilsj) = I; but in the"uncertain" state, so. S is assumed to guessSi with probability Pi. which may dependon learning and motivation variables.Multiplying these two matrices yields thetheoretical confusion matrix C '" (Cij)where i = I, 2, ". 26, j = I, 2,.. •• 26. andCjj = ajo ij + (J ~. aj)pj where
0"= /1 wheni=j'lII 0 otherwise.
A few comments are in order concerningrelated work on this model. For thetwo-signal case. when a, = a2, this modelreduces to that developed for two-intervalforced-choice detection experiments byAtkinson and Kinchla (1965) and byKinchla and associates (1966). Smith(1968) has studied properties of confusionmatrices generated by this mode, which heterms a "pure perceptibility" model, andhe has shown that it can be viewed as aspecial case of the choice model; this resultwill be mentioned again after the briefpresentation of the choice model.
The all-or-none activation modelrequires estimation of 2N - I parameters,51 in the present experiment.
Overlap Activation ModelThe basic intuition for the overlap
activation model is that in addition to aunique activation state relating a letter in aone-one fashion to the correct response.there exist partial-information states suchthat S is in a state of uncertainty withrespect to two letters; thus. this modelassumes that pairwise similarity can affectinterletter confusability. When in a state ofconfusion, S is postulated to respondaccording to the relative magnitude of thetwo concerned response-bias probabilities.We thus express the sensory activationmatrix as composed of entries for the pairs(S" tLk)' where i = 1,2, .' ,26,j = 1,2, • ,26, and k= i.i + I. ",26.and where the entry for (S], tj.k) is givenby
~jk = I~Jk when j = i, k = i, or both, II 0 otherwise.
Note that ti,i is the certain state for Sj, andtt,j is the uncertain state for Sj and Sj, i =1= j,and can proceed from presentation ofeither s, or s, (~ij = ~jj). The correspondingdecision matrix is given by entriescorresponding to the pairs (tj,b Rill) wherej.k are as before and m = I, 2, •• '. 26, Theentry for ('I,k, Rill) is equal to one whenj = k = m, to gl/(gj + gk) when j = m =1= k, togk/(gj + gk) when k = m *- j, and to 0
Perception & Psychophysics, 1971, Vol. 9 (IA) 41

P(Rj ISj)P(Rj lSi)
1)jj = peRi I Sj)P(Rj I Sj) .
Multidimensional Scaling ModelAlthough the preceding substantive
models possess sufficient structure todescribe interletter (sensory) confusabilityand one (choice model) posits a functionrelating the similarity scale to distance in ametric space, they cannot be used facilelyto test assumptions about the appropriatemetric or the number of dimensions in ahypothesized underlying visual space. Tothis end, a program developed by Kruskal(1964a, b) was employed to obtaininformation about possible dimensions ofconfusion, as well as to test applicability ofthe Euclidean vs the city-block metric toan interletter confusion matrix. Kruskal'smethod, an extension of Shepard's ordinalscaling procedure (Shepard, 1962a, b),permitted this to be accomplished with aminimum of substantive assumptions.
METHOD
~jj = peRi ISj) +P(Rj lSi)
21)
ApparatusA Gerbrands two-field, two-mode
tachistoscope (Model T-2B-I) was used topresent the letters. A simple mechanicalshutter was employed to increase the
1-(N-I)7)
~jj = I + (N - 1)7)'
where N is again the number ofexperimental stimuli. But, for1)> I/(N -- I), a reasonable possibility forconfusable stimuli, ~ij < 0, which iscontradictory to the overlap model.Presently, we know of no correspondingtheoretical results against the choice modelwhen we map from the overlap to thechoice model. Thus, it may be that thechoice model is the more general of thetwo despite the almost equal number ofparameters.
constant for constant stimulus andsensitivity conditions.
Similarly, a mapping from theparameters of the choice model to theoverlap model or vice versa may beprovided. Under some circumstances, thismay imply nontestability of the twomodels against one another. However, themodels do not predict identicalrelationships in the data, and in certaincases data may support one and falsify theother. For example, suppose that1)ij = 1)kl= 1), for i *- j and k *- I, and that{3i = (3j =~, for all i, j. The mapping fromthe choice model parameters to the overlapmodel parameters is then given by
(l-oj)Pi
OJ+(1- OJ)Pj'
(I - 0j)Pj
OJ +(I -- 0j)Pj
If we now substitute the theoreticalexpressions for P(Rj I Sj) from thethreshold model, we obtain
1)jj~jc·· =
1) 26
~ 1)jk~kk=l
and this shows that for the thresholdmodel and the choice model to hold for agiven set of data, 1)ij must be factorableinto independent numbers associated withSj and Sj. Hence, although it can bedeveloped from entirely distinctconceptions, the threshold model can beviewed as a special case, when one neglectsunderlying assumptions giving rise to theparameters, of the choice model. To seethat they are, nevertheless, not the sametheory, it suffices to note that for thetwo-signal case, the threshold modelgenerates linear and the choice modelcurvilinear isosensitivity curves. Or, to putit another way, if the threshold modelprovided good fits to several sets of datagenerated by varying motivationalconditions, then only the Pi parameterswould change; but by Smith's result, thiswould perturb not only the bias parameter(3j, but also the similarity parameter 1)jjwhich in terms of the theory should remain
response, as given by multiplying the scalevalues of the bias and similarityparameters, relative to the total strengthrelating the given stimulus to other stimuli.For the present study, this results in thetheoretical confusion matrix C = (Cij),where i=I,2,"',26, j=I,2,"',26,and
In addition, the similarity parameters aresymmetric (1)ij = 1)jj), and it is assumed that1)ii= I for all i, thus fixing the unit. Asindicated above, this results in(N(N + 1)/2] - I (350) free parametersto be estimated from the data.
For our purposes, the most importantpart of Smith's (1968) result relating thethreshold to the choice model can beshown readily by viewing the relationshipthat is assumed to obtain between theconfusion matrix probabilities and thesimilarity parameters:
Choice ModelThe ch oice model requires less
discussion, being a straightforwardapplication of that model as presented byLuce (1963a). As does the overlapactivation model, this model postulates aninfluence of pairwise similarity on stimulusconfusions. Both the similarity parametersand bias parameters are assumed to lie onratio scales. Given a particular stimulus, theprobability of any possible response isassumed to be the strength of that
Cjj = ~jj (gj; g)when i *- j.
Now, it is clear that this modelrepresents a deviation from the all-or-nonemodel since not only is stimulus confusionallowed, but a pure, no-information,guessing state is precluded. It is also aone-step extension in the sense that wecould have postulated the existence ofk-wise confusion states. In general, this lastpossibility generates an unmanageablenumber of parameters. However, if one iswill ing to posit further theoreticalstructure, then the number of parametersmay be reduced. This approach was takenby Nakatani (1968) in the development ofa hybrid model that results in a set ofconfusion states, where from two to all Nobjects may be confused. AlthoughNakatani's work was independent of thepresent results, both have employed theexpedient of using the ratios of therelevant bias, for example, gi/(gj + gj), todescribe the S's guessing bias for aparticular confusion state.
The overlap model is favored byproperties relevant to the present aims:(I) It allows comparison of a two-wayconfusion activation model with anactivation model that allows only N-wayconfusion or no confusion, and (2) itpossesses just one more parameter,(N(N + 1)]/2, than the choice model,which allows for a fair comparison betweenthem for the large amount of data reportedherein. Hence, for the present experiment,351 parameters were estimated for theoverlap activation model and 350 for thechoice model.
and
otherwise, where gi is the response biasparameter for Rj.
The theoretical confusion matrix, givenas the result of the two foregoing processesis written C = (Ci,j) where i = 1, 2,"", 26,j = I, 2," -, 26,
42 Perception & Psychophysics, 1971, Vol. 9 (IA)

number of independent fields to three.Stimuli were presented on 8 x II in.
white index cards, using an IBM ExecutiveDirectrix typewriter, one letter per card,with the stimulus population consisting ofone deck made up of five Englishupper-easealphabets in a quasirandom (i.e.,shuffled) order. A prestimulus fixationpoint was placed approximately 10 minbelow the locus of the letter presented inthe stimulus field. A singleletter subtendedan angle of about 30 min and the fixationpoint an angle of about 6 min at S's eye.The possible visual fields were white withfixation point, white with letter, and noise.The noise field was produced by typingalternately with "normal" and "expanded"spacing modes on the Executive Directrixtypewriter, and successive rows of letterswere made to overlap. The characterstyped were selected haphazardly from theupper-case English alphabet. Use of theresulting noise field made perception ofpresented letters much more difficult.
The luminance for CI (Without noise),the first experiment, was at all times5.6 fl., and for CII (with noise)i the secondexperiment, the luminance was 5.6 fl, forthe prestimulus and stimulus fields and forthe noise field was 4.0 fl.
ProcedureThe stimulus exposure sequence for CI
was: white prestimulus field with fixationpoint; stimulus field containing a randomlyselected letter; poststimulus fieldcontaining fixation point. The sequence forCII was: white prestimulus field; stimulusfield containing a randomly selected letter;noise field with jumbled letters; whitepoststimulus field containing fixationpoint.
The trials were S-paced, S initiating astimulus exposure following an alertingbuzzer sounded by E. The displayed letterfollowed the press of the start button byI sec. The only instruction to S with regardto his response speed was that a letterresponse was to be made within 5 sec afterthe stimulus exposure, after which he wasto rate his sensory accuracy by giving aconfidence rating (CR) of I to 4. Ss wereinstructed that a CR of I meant absolutecertainty, 2 relative certainty, 3 relativeuncertainty, and 4 absolute uncertainty,i.e., guessing at random. Following S'sresponse, E told him the letter that hadbeen presented. Each trial consumed about15 sec, with approximately 5 secintervening between feedback and the nextbuzzer sound. Latencies were recorded byE on each trial from a Hunter timer linkedto a voice-operated relay and a microphonepositioned close to S's mouth.
Two days of practice and calibrationpreceded 5 experimentaJ days in CJ. A
stimuJus duration was selected for each Ssuch that his overall probability correctwas about 0.5, that is, at threshold. Theselected duration was then used for that Sthe remainder of CI. Following CI, I daywas taken to recalibrate Ss for CII.However, performance with thepoststimulus noise proved much morevariable; therefore, each S was recalibratedevery day during the five experimentalsessions. Both conditions included 20warm-up trials at the beginning of eachsession.
Each experimental condition consistedof calibration followed by fiveexperimental sessions, each sessionoccupying approximately I h during which130 triaJs of five pseudorandomized(shuffled) alphabets were presented. Eachrow of the resulting confusion matricesthus contained J50 points for bothconditions. The amount of data perindividual was insufficient to estimatestability but the group-average confusionmatrices appeared quite constant from thefirst half to the second half of theconditions. All the models assumesteady-state behavior is generating theresponse proportions.
The study required 13 consecutive days,including two weekends. A S was run atthe same time each day.Estimation
In all three models, estimation of thesensory and bias parameters was effectedby setting each parameter equal to afunction of confusion-matrix valuesassociated with the parameter within aparticular theory. The exact formulae usedare given in the appendix.
The stimulus durations, chosen to yieldprobability-correct values close to 0.50,were large enough to allow zero probabilityof confusion entries in the confusionmatrix. This caused a problem inestimation since the functions used toestimate the parameters often containedobserved (P(Ri/Sj) terms in thedenominator. In order to allow estimationof all relevant parameters, a conventionwas uniformly adopted across the models.Since each row in the confusion matrix wasbased on 150 trials, it was decided to takethe best estimate of the "zero" confusionprobabilities (in terms of sum of squareddeviations of predicted from observedvalues) lying between 0.000001 and 0.01.That is, the computer performed a seriesofiterations, and on each iteration exactlyone value in the above range was tried forall the zero confusion entries. For eachsuch value, the set of parameters wasestimated for the model at hand and thesum of squared deviations computed; thatvalue associated with the smallest sumof squared dcviations was chosen as
the best estimated overall value of the zeroentries. The rationale behind theconvention was that if the "true"confusion probabilities were greater than0.0 I, then one or more confusions wouldhave occurred on the average in the 150trials represented in each row of theconfusion matrix. On the other hand, if theprobability of confusion were less than0.01 but greater than zero, one wouldexpect to observe caseswhere the entry for150 trials turned out to be zero. Thus, in asense, one extra parameter was estimatedfor each of the models. The calculated sumof squared deviations varied between theobtained minimum and about 1.50 for theoverlap and choice models but varied onlya few I OOths for the threshold model. As itturned out, when estimates were alsoobtained for "zero" confusion probabilitiesbetween 0.01 and 1.00, in only one casewas the sum of squared deviations reducedand that by only 0.02; this occurred forthe choice model in CL
It should be noted that in addition tothe analytical difficulties associated withdivision by zero, the scaling properties ofLuce's choice theory require strongerassumptions when the set of choicealternatives consists of some perfectly andsome imperfectly discriminable pairs(Luce, 1959). The overlap activation modeland the choice model required estimationof 351 and 350 parameters, respectively,and the all-or-none activation modelrequired estimation of 51 parameters. Thenumber of degrees of freedom associatedwith the empirical confusion matrix was650.Subjects
Six females recruited from introductorypsychology classes at the University ofHawaii were employed as Ss. Their visionwas required to be 20/20 after correction.
RESULTS AND DISCUSSIONTables I and 2 show the empirical
confusion matrices for the twoexperimental conditions. Table 3 showspredictions from the three modelscompared with the empirical values for theletter "p"-a symbol possessing curved- aswell as straight-line features. The tableillustrates the superior ability of theoverlap and choice models to reflectsimilarity as well as the tendency to alteredstructure from CI to CIl.1 Although thepredictions do seem to follow the generalpattern of the confusions in the empiricalmatrix. a numerical index of precision maybe helpful in interpretation. An idea ofrelative accuracy of the three models canbe gained from Table 4, which indicatesthe sum of squared deviations of predictedfrom empirical points over all 676 cells foreach confusion matrix.
Perception & Psychophysics, 1971, Vol. 9 (IA) 43

Tahle 1________E=I:.:.:nr:piric~.L.!-·onfusi().!!_Matrix:Condition I
ABC D E F G HResponse
J K L M N 0 P Q R STU V W X Y Z
B
C
D
E
F
G
H
.58 .00 .00 .01 .00 .01 .00 .02 .02 .03 .10 .02 .00 .02 .01 .02 .00 .05 .00 .04 .00 .01 .00 .06 .00 .01
.02 .26 .02 .05 .02 .00 .04 .07 .01 .02 .01 .01 .03 .08 .03 .03 .03 .18 .01 .01 .06 .01 .00 .01 .00 .00
.01 .01 .50 .01 .05 .03 .03 .02 .01 .01 .03 .04 .00 .00 .07 .03 .01 .02 .01 .04 .01 .01 .01 .01 .01 .01
.01 .04 .01 .46 .01 .00 .05 .04 .01 .01 .00 .00 .01 .01 .12 .02 .05 .05 .00 .02 .06 .01 .00 .01 .01 .00
.01 .03 .03 .01 .36 .07 .00 .03 .03 .04 .06 .11 .00 .00 .03 .05 .00 .01 .00 .07 .01 .01 .00 .01 .03 .01
.00 .01 .00 .01 .02 .33 .01 .03 .09 .05 .03 .07 .01 .01 .00 .03 .00 .01 .01 .18 .01 .01 .00 .01 .07 .01
.01 .01 .08 .01 .01 .01 .34 .09 .01 .01 .02 .03 .00 .04 .11 .03 .03 .03 .01 .01 .07 .02 .00 .00 .01 .00
.01 .01 .01 .OJ .00 .01 .01 .50 .01 .01 .01 .01 .03 .15 .03 .02 .00 .04 .00 .03 .04 .01 .03 .00 .01 .00
.00 .00 .00 .00 .01 .03 .01 .01 .57 .08 .01 .11 .00 .00 .01 .01 .00 .02 .00 .09 .00 .01 .00 .00 .03 .00
J .01 .00 .00 .OU .00 .01 .01 .02 .15 .48 .01 .03 .00 .00 .03 .01 .00 .01 .01 .08 .04 .01 .00 .02 .05 .01
K .03 .01 .01 .OJ .01 .02 .00 .06 ,1")5 .01 .50 .04 .01 .02 .04 .03 .00 .03 .00 .01 .01 .01 .01 .05 .03 .00
L .01 .00 .01 .01 .01 .01 .00 .03 .14 .03 .02 .60 .00 .01 .03 .01 .00 .nl .00 .07 .00 .00 OJ .00 .02 .00
M .00 .01 .00 .01 .00 .00 .01 .10 .00 .01 .01 .00 .1i2 .08 .05 .01 .01 .01 .01 .01 .01 .01 .05 .01 .00 .00
N .03 .01 .00 .01 .00 .00 .01 .06 .00 .00 .03 .00 .07 .54 .03 .01 .03 .04 .01 .01 .02 .02 .04 .01 .01 .01
o .01 .01 .06 .05 .00 .01 .11 .01 .oo .02 .01 .00 .01 .03 .51 .02 .10 .01 .00 .02 0') .00 .01 .00 .00 .01
P .01 .02 .02 .01 .01 .09 .01 .05 .03 .01 .01 .01 .01 .01 .06 .52 .00 .06 .00 .03 .01 .01 .00 .01 .01 .01
Q .01 .01 .01 .01 .00 .00 .11 .06 .00 .01 .01 .01 .00 .03 .28 .01 .36 .01 .00 .00 .05 .00 .01 .01 .00 .00
R .00 .04 .01 .00 .01 .01 .01 .09 .02 .01 .03 .03 .02 .05 .03 .05 .00 .49 .01 .02 .01 .01 .01 .03 .01 .00
S .01 .01 .03 .01 .02 .00 .02 .06 .03 .03 .06 .03 .00 .03 .04 .05 .00 .03 .43 .03 .01 .02 .00 .03 .01 .02
T .01 .00 .00 .01 .04 .05 .01 .01 .16 .04 .01 .05 .01 .01 .04 .04 .00 .00 .01 .42 .01 .OJ .01 .01 .05 .01
U .00 .00 .01 .01 .00 .00 .01 .11 .01 .00 .01 .02 .02 .05 .07 .01 .01 .01 .00 .02 .)5 .04 .04 .01 .00 .01
v .00 .00 .00 .01 .01 .00 .00 .03 .02 .02 .01 .01 .00 .01 .02 .02 .01 .01 .00 .02 .07 .60 .02 .01 .09 .01
W .01 .00 .00 .01 .00 .00 .00 .08 .00 .01 .02 .01 .05 .07 .05 .01 .01 .02 .00 .02 .05 .08 .45 .03 .01 .01
x .01 .00 .00 .00 .01 .00 .00 .03 .02 .01 .07 .01 .00 .04 .02 .01 .00 .00 .00 .05 .00 .03 .01 .55 .08 .04
Y .01 .00 .00 .00 .00 .01 .00 .05 .02 .03 .03 .03 .00 .03 .06 .01 .00 .00 .01 .06 .01 .08 .01 .03 .51 .01
Z .01 .01 .01 .01 .01 .00 .00 .03 .01 .06 .03 .00 .00 .00 .02 .00 .01 .00 .01 .03 .01 .01 .01 .05 .03 .66-- _._-------------
In order to acquire some intuition onthe size of these errors, we may comparethe obtained values in Table 4 with aprediction following from randomprediction (i.e., on the average, uniform orequiprobable confusions and probabilitycorrect) on the part of a model. That is, allconfusion entries are simply 1/26. If we letPij refer to entries in the empiricalconfusion matrix, then the sum of squareddeviations under random prediction wouldbe
26 ( 1)2 26L Pij - -26- = L Pij - I.
1,)= I 1,)= I
This index is largest when one value oneach row is I and the rest are 0; it thenattains the value of 25. Table 4 indicatesthe sum of deviations squared, as well asthis (equiprobable) index, for the twoconditions. Also, it shows the sum ofsquared deviations for the main diagonalonly and the index figured only on the
------------
main diagonal. This table can be used todiscuss several points. First of all, thechoice model and the overlap model areabout equal in their ability to fit the datafor CI, although the overlap model appearsa little more accurate in CII. Secondly, itappears that the large increment in numberof parameters (in fact, a factor of seven)for the two activation models permittingsensory confusion does not seem topurchase a corresponding increase in fit,relative to the calculated index. In fact, it
44 Perception & Psychophysics, 1971, Vol. 9 (IA)
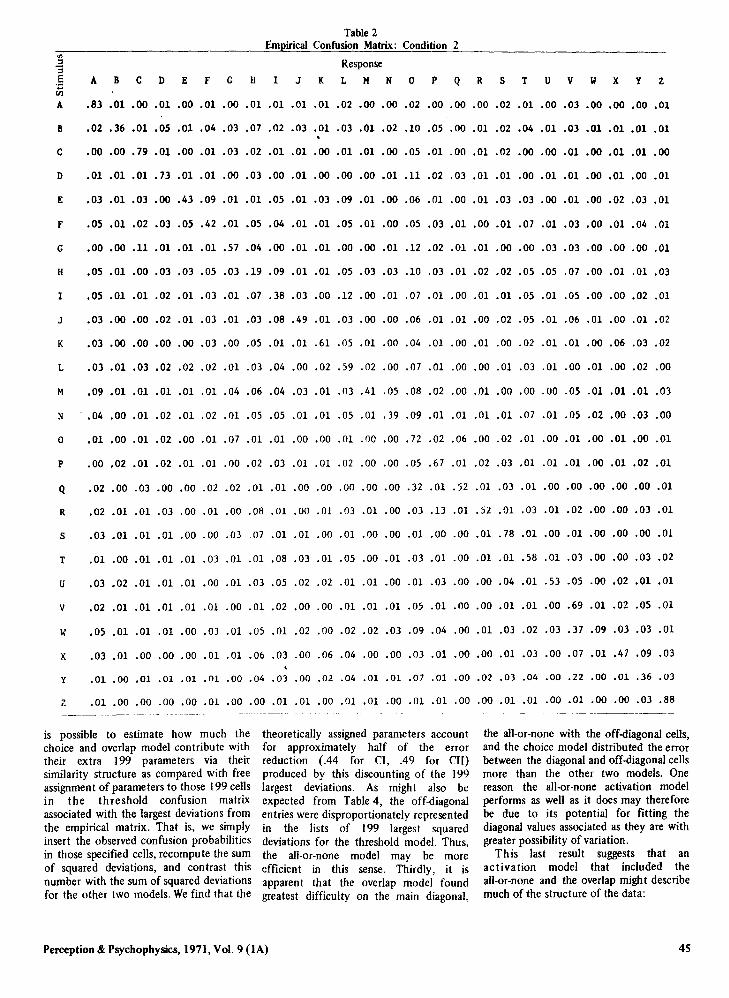
Table 2Empirical Confusion Matrix: Condition 2
'"-3 ResponseJAB C D E F G H I J K L M N 0 P Q R STU V W X Y ZViA .83 .01 .00 .01 .00 .01 .00 .01 .01 .01 .01 .02 .00 .00 .02 .00 .00 .00 .02 .01 .00 .03 .00 .00 .00 .01
B .02 .36 .01 .05 .01 .04 .03 .07 .02 .03 .01 .03 .01 .02 .10 .05 .00 .01 .02 .04 .01 .03 .01 .01 .01 .01
C .00 .00 .79 .01 .00 .01 .03 .02 .01 .01 .00 .01 .01 .00 .05 .01 .00 .01 .02 .00 .00 .01 .00 .01 .01 .00
D .01 .01 .01 .73 .01 .01 .00 .03 .00 .01 .00 .00 .00 .01 .11 .02 .03 .01 .01 .00 .01 .01 .00 .01 .00 .01
E .03 .01 .03 .00 .43 .09 .01 .01 .05 .01 .03 .09 .01 .00 .06 .01 .00 .01 .03 .03 .00 .01 .00 .02 .03 .01
F .05 .01 .02 .03 .05 .42 .01 .05 .04 .01 .01 .05 .01 .00 .05 .03 .01 .00 .01 .07 .01 .03 .00 .01 .04 .01
G .00 .00 .11 .01 .01 .01 .57 .04 .00 .01 .01 .00 .00 .01 .12 .02 .01 .01 .00 .00 .03 .03 .00 .00 .00 .01
H .05 .01 .00 .03 .03 .05 .03 .19 .09 .01 .01 .05 .03 .03 .10 .03 .01 .02 .02 .05 .05 .07 .00 .01 .01 .03
I .05 .01 .01 .02 .01 .03 .01 .07 .38 .03 .00 .12 .00 .01 .07 .01 .00 .01 .01 .05 .01 .05 .00 .00 .02 .01
J .03 .00 .00 .02 .01 .03 .01 .03 .08 .49 .01 .03 .00 .00 .06 .01 .01 .00 .02 .05 .01 .06 .01 .00 .01 .02
K .03 .00 .00 .00 .00 .03 .00 .05 .01 .01 .61 .05 .01 .00 .04 .01 .00 .01 .00 .02 .01 .01 .00 .06 .03 .02
L .03 .01 .03 .02 .02 .02 .01 .03 .04 .00 .02 .59 .02 .00 .07 .01 .00 .00 .01 .03 .01 .00 .01 .00 .02 .00
M .09 .01 .01 .01 .01 .01 .04 .06 .04 .03 .01 .03 .41 .05 .08 .02 .00 .01 .00 .00 .00 .05 .01 .01 .01 .03
N .• 04 .00 .01 .02 .01 .02 .01 .05 .05 .01 .01 .05 .01 .39 .09 .01 .01 .01 .01 .07 .01 .05 .02 .00 .03 .00
o .01 .00 .01 .02 .00 .01 .07 .01 .01 .00 .00 .01 .00 .00 .72 .02 .06 .00 .02 .01 .00 .01 .00 .01 .00 .01
P .00 .02 .01 .02 .01 .01 .00 .02 .03 .01 .01 .02 .00 .00 .05 .67 .01 .02 .03 .01 .01 .01 .00 .01 .02 .01
Q .02 .00 .03 .00 .00 .02 .02 .01 .01 .00 .00 .00 .00 .00 .32 .01 .52 .01 .03 .01 .00 .00 .00 .00 .00 .01
R .02 .01 .01 .03 .00 .01 .00 .08 .01 .00 .01 .03 .01 .00 .03 .13 .01 .52 .01 .03 .01 .02 .00 .00 .03 .01
S .03 .01 .01 .01 .00 .00 .03 .07 .01 .01 .00 .01 .00 .00 .01 .00 .00 .01 .78 .01 .00 .01 .00 .00 .00 .01
T .01 .00 .01 .01 .01 .OJ .01 .01 .08 .03 .01 .05 .00 .01 .OJ .01 .00 .01 .01 .58 .01 .03 .00 .00 .03 .02
U .03 .02 .01 .01 .01 .00 .01 .OJ .05 .02 .02 .01 .01 .00 .01 .OJ .00 .00 .04 .01 .53 .05 .00 .02 .01 .01
v .02.01.01.01.01.01.00.01.02.00.00.01.01.01.05.01.00. 00 .01 .01 .00 .69 .01 .02 .05 .01
W .05 .01 .01 .01 .00 .OJ .01 .05 .01 .02 .00 .02 .02 .03 .09 .04 .00 .01 .OJ .02 .OJ .37 .09 .03 .OJ .01
x .03 .01 .00 .00 .00 .01 .01 .06 .03 .00 .06 .04 .00 .00 .03 .01 .00 .00 .01 .OJ .00 .07 .01 .47 .09 .OJ
Y .01 .00 .01 .01 .01 .01 .00 .04 .03 .00 .02 .04 .01 .01 .07 .01 .00 .02 .03 .04 .00 .22 .00 .01 .36 .03
Z .01 .00 .00 .00 .00 .01 .00 .00 .01 .01 .00 .01 .01 .00 .01 .01 .00 .00 .01 .01 .00 .01 .00 .00 .03 .88
is possible to estimate how much the theoretically assigned parameters accountchoice and overlap model contribute with for approximately half of the errortheir extra 199 parameters via their reduction (.44 for CI, .49 for CII)similarity structure as compared with free produced by this discounting of the 199assignment of parameters to those 199 cells largest deviations. As might also bein the threshold confusion matrix expected from Table 4, the off-diagonalassociated with the largest deviations from entries were disproportionately representedthe empirical matrix. That is, we simply in the lists of 199 largest squaredinsert the observed confusion probabilities deviations for the threshold model. Thus,in those specified cells, recompute the sum the all-or-none model may be moreof squared deviations, and contrast this efficient in this sense. Thirdly, it isnumber with the sum of squared deviations apparent that the overlap model foundfor the other two models. We find that the greatest difficulty on the main diagonal,
Perception & Psychophysics, 1971, Vol. 9 (IA)
the all-or-none with the off-diagonal cells,and the choice model distributed the errorbetween the diagonal and off-diagonal cellsmore than the other two models. Onereason the all-or-none activation modelperforms as well as it does may thereforebe due to its potential for fitting thediagonal values associated as they are withgreater possibility of variation.
This last result suggests that anact iva tion model that included theali-or-none and the overlap might describemuch of the structure of the data:
45

Table 3. ._ .__ ._. .__.__1!~J>r_e~I.1I:Itive 1"heor~tic:11 Predictions
Condition IResponse
A BCD E F G R I J K 1 M N 0 P Q R s T u V W x y Z
EHP .01 .02 .02 .01 .01 .09 .01 .05 .03 .01 .01 .01 .01 .01 .06 .52 .00 .06 .00 .03 .01 .01 .00 .01 .01 .01
AON .02 .02 .02 .02 .02 .02 .02 .04 .02 .02 .02 .02 .02 .02 .02 .53 .02 .02 .02 .02 .02 .02 .02 .02 .02 .02p
OlP .01 .02 .02 .01 .02 .04 .01 .04 .02 .01 .02 .01 .01 .01 .05 .56 .00 .05 .01 .04 .01 .02 .00 .01 .01 .00
eRe .01 .01 .02 .01 .02 .03 .01 .05 .02 .01 .02 .01 .01 .01 .05 .57 .00 .06 .00 .05 .01 .01 .00 .01 .01 .00
PI:
Condition 2Response
.00 .02 .01 .02 .01 .01 .00 .02 .03 .01 .01 .02 .00 .00 .OS .67 .01 .02 .03 .01 .01 .01 .00 .01 .02 .01
.01 .01 .01 .01 .01 .01 .01 .02 .01 .01 .01 .01 .01 .01 .04 .68 .01 .01 .01 .01 .01 .01 .01 .01 .01 .01
OLP .00 .02 .01 .02 .01 .02 .01 .02 .02 .00 .01 .02 .00 .00 .05 .64 .01 .05 .02 .01 .01 .01 .01 .00 .01 .01
eRe .00 .01 .01 .02 .01 .02 .00 .03 .02 .00 .01 .02 .00 .00 .06 .70 .00 .03 .00 .01 .01 .02 .00 .00 .01 .01
EMP = empirical. AD}\' = all-ot-none activation model. DLP = overlap activation model, Cllt: = chotec model
Model
andN gi
~(R(S) =0· + L ok--I I II koFi I gi + gk
Figures Ia and Ib show the curves for afairly typical S relating, in the first part,probability correct to latency and, in thesecond, probability correct to confidencerating. As the figures indicate, there is acontinuous decrease in probability correctas latency increases for both conditions.Such a relationship between accuracy andlatency has also been found to hold formultisymbol processing tasks (Estes &Wessel, 1967; Townsend, 1966), andsuggests that the phenomenon may beconnected with the same mechanisms inboth cases, perhaps with the processingcharacteristics of individual symbols. Othercharacteristics, shown in Fig. I a, are thelonger mean latency and standarddeviations for CI than for CII. This isprobably connnected with the fact thatafter recalibration on CII, the Ss' averageperformance was better than on CI. To besure, performance actually decreased in CIIon letters H, I, M, N, W, X, and Y,indicating again a possible shift inconfusion structure, perhaps due to thepresence of the poststimulus noise mask.Only one S did not exhibit this pattern; hehad a larger mean in CI but a smallerstandard deviation.
Figure Ib shows the typical relationshipof probability correct to confidence rating.Although this result has been taken asindicative of the continuity of perceptualstates (as, in fact, it may be), Krantz( I 969) and Wickelgren ( 1968) havepointed out, in essence, that one mustconsider the S's processes that evaluate hisperceptual states and lead to thedistribution of confidence ratings found inthe data.
In addition to acting as parameters of
the probability of the certainty states vsthe uniqueness of the probabilities of thesensory confusion states. Too, they wouldperhaps aid in the interpretation of thesignificance of the number of parametersper se. For example, suppose the firstsubcase above fit no better than theali-or-none model and the second subcasefit as well as but not better than theoverlap model. This would provide anindication that the number of parametersmight have more influence than theparticular structure of the models. Anotherpossibility suggested by Smith (1968)might be to fit probability mixtures of anytwo activation models or even an activationmodel and the choice model, i.e.,aMI + (I - a)MII, where MI refers toModel I and Mil to Model II and a is less
than 1 and greater than O. To the extentthat the sum of errors squared isindependent of the value of a are the twomodels explaining the same aspects of thedata. Estimation techniques and computerprograms are currently being developed toallow fits of these subcases to the data.
One interesting outcome was that ellwas not better fit by the ali-or-none modelthan was CI. The absence of fadingafterimages undegraded by noise docs notseem to have diminished the sensoryconfusability of the stimuli. It appears thatthe combination of the increaseof stimulusduration necessary for adequateperformance in CII and the effects of themask did not radically affect the processingcharacteristics of the Ss, at least withreference to the fitting ability of themodels tested here. It does appear that thechoice model predicts less successfully inCII, although it is not clear why.
5.987.84
.07
.14CICII
Condi- All-or- Equi-tion Choice None Overlap probable
Entire Confusion MatrixCI .23 .49 .26 6.97CII .36 .49 .23 8.14
Main Diagonal.02 .18.06 .18
Table 4Sum of Squared Deviations of Theoretical
from Empirical Points
gjP(R(S) = 0' --
) I I) gj +gj
+ (1- ~ Qik) gj' i oF j,k=1
Two subcases of this model of interestcould be extruded by (I) Jetting all 0jk beequal but allowing the Oji to be different(this case would have just one moreparameter than the all-Of-none model), or(2) letting all the Ojj be equal but allowingthe 0ij to be different. This case wouldhave just one more parameter than thechoice models and the same as the overlapmodel. These cases should give some ideaof the relative importance of uniqueness of
46 Perception & Psychophysics, 1971, Vol. 9 (IA)

6----6 R' I SECONDARY
.-- R' 2 SECONDARY_ R" PRtMARY
c>--<> R' 2 PRJMARY.30
.10
25
.35
.30
25l>--A R • I SECONDARY....... R· 2 SECONDARY- R'I PRIMARY<>--<> R' 2 PRIMARY
en 20enwa:f-en
15
10
05
en .20enwa:r-en .15
DIMENSIONS
35
Two of the possible dimensionsmentioned above, roundness and verticallinearity, correspond to two of thedimensions reported by Kunnapas (1966).Nevertheless, despite this finding anddespite the hopeful outcome of Brown andAndrews's (1968) comparison of the scaledspace of a discrimination and judgmenttask, it should not be surprising if resultsshould differ in the Kunnapas and the
Fig. 2b. Kruskal measure of fit as afunction of number of dimensions in thespace, Condition II.
2 3 4 5 6 7 8 9 10
DIMENSIONS
Fig. 2a. Kruskal measure of fit as afunction of number of dimensions in thespace, Condition I.
letters having "tied" similarity scores tohave different distances in psychologicalspace without penalty in terms of stress.The other, the secondary approach,augments the stress value when tied pairsof letters fail to be associated with equaldistance.
As can be seen in Figs. 2a and 2b, ingeneral the Euclidean metric is superior tothe city-block metric, the primaryapproach is superior to the secondaryapproach, and CI is more easily fit into amultidimensional space than is CII. Theexception to this is CII, r = I, which,except for spaces spanning three and IWO
dimensions, is associated with lower stressvalues than is CIl, r =2. The reason for thisexception is not clear at present.
Each of the eight stress curves in fig. 2areaches Kruskal's (1964a, b) criterion of.10 in less than 10 dimensions, and rathernice "elbows" are present. Also, fromKlahr's (1969) recent results we can alsoinfer the "significance" of at least theprimary curves. For example, in 50 sets ofrandomly generated sets of )6 points, 5'lr,of the cases were associated with stressvalues of .170 or less for three dimensionswhen fit with the Kruskal program. Wewould expect this result in even fewer caseswith our greater number of points (26).Nevelthclcss, there was some inconsistencyof spatial configurations for the twoexperimental conditions, for the twomet rics, and even of the primary as opposed
to the secondary approach. Perhaps evenmore unsettling was failure of a set ofdimensions clearly related to our intuitionsconcerning visual similarity to reveal itself.This result points up the difficulty inherentIn using scaling techniques as a detectivedevice unless the scaled dimensions eitherarc very elementary and obvious or unlessthey turn out to be equivalent to somepreviously hypothesized dimensions Fromexamination of letters having relativelylarge projections on various dimensions onecould infer the Importance of direction oflines and angles, roundness, and verticallinearity. hut, again. these did not appearin the same form for the differentconditions and approaches. and the lettersassociated with onc of these attributeswere not always the same or evencompletely consistent with the attribute.
The difference in the ability of CI andCII to be fit into a multidimensional spacemay part wily follow from the recalibrat ionprocedure carried out in ell. To take anextreme example, if a S's performancevaried because of daily fluctuauons Inat tention. equal accuracy. as given by therccahbration. may not have implied thesame underlying visual space. Theconfusion matrix for CII would then be acomposite of several underlying spaces.
2 3 4
CONFIDENCE RATING
I 2 3 4 5 6
RESPONSE LATENCYIN SEC
Fig. I b. Probability correct as a functionof confidence rating for a typical S.
similarity in the choice model, T/i i ascst imarcd by thc formula has beensuggested as possessing several propertiesappropriate for a measure of similarity(Shepard. 1958); for this reason. theresulting values were used as input data forthe multidimensional scaling analysis. Thepresent application of Kruskal's ( 1964h)program included two fit iechruqucs aswell as fitting the Euclidean and city-blockmctrics. One technique, referred to as theprimary approach, allows two pairs of
1.0OX"--__A
.9
t; .8l&J~ .7oo .6
~ .5:Jiii .4
~ .3
Q,. .2
.1
.1
o 52 CI
fj. 52 C2
Fig. Ia, Probability correct as a functionof latency for a typical S.
1.00 52 CI
.9t::. 52 C2
t; .8l&Ja:: .7a::0 .6u>- .5...:J .4iii~ .3
s .2Q,.
Perception & Psychophysics, 1971, Vol. 9 ( I A) 47

Table 6Correlation Coefficients for Similarity Parameters, Distance
Measures, and a Physical Similarity Measure.
OlP CHC de ds----Model CII Cl CII CI CII CI ell PHOVlP
OlP Cl .58 .43 -.67 -.61 .48ell .64 -.67 -.54 .53
CHC CI .97 -.75 -.70 .70CII -.76 -.65 .65
deCI .63 .86 ~-.69
CII .75 -.58
dsCI .57 -.67CII -.54
,. See text for further explanation.
Table 5Correlation Coefficients for the Bias Parametersfor the ThreeModels and theTwoConditions·
OlP CHC AON
Model CII CI CII CI elI
AON CI .48
OlP CI .53 .88 .53CII .89 .83
CHC CI .23 .70CII .60
,. See text for explanation of headings.
present type of studies; one demandsconscious evaluation of perfectlyperceptible stimuli and the otherimmediate identification of severelydegraded images produced bytachistoscopic exposure.
The finding that a Euclidean metric isgenerally most appropriate for the presentdata may at first seem bizarre. Torgerson(1958) and Shepard (1964), for example,have suggested that certain types of visualdimensions may be conducive to theappearance of a city-block metric, suchdimensions being "perceptually distinct"and "compelling." Letters, such as ''0''and "I," for instance, may seem to bemade up of perceptually distinct types ofelements. There are several possibilitiesthat might be related to this finding. Someof the structure that appears to beindependent may actually be related. Forinstance, the extent of linearity of, say, anellipse is inversely related to its degree ofroundness, and perceptual blur due totachistoscopic conditions might produceseveral gradations of linearity, thusproducing perceptual dimensions bettersuited to a Euclidean metric. Also, ofcourse, since letters are made up of severalkinds of elements, this would tend topromote perceptual continuity among theletters themselves. A third possibility isthat restricted (in time) observations suchas those in the present study could lowerthe probability of sampling informationfrom several dimensions simultaneouslyand thus improve the fit of a Euclideanmetric relative to the city-block metric(e.g., see the discussion by Hyman & Well,1967). It should be mentioned that thelack of clear-cut results relating toparticular dimensions of similarity andperhaps even the support of a Euclideanmetric may be due to an artifact caused byscaling group data, especially if Ss employdifferent dimensions in their identificationprocess. An experiment is in progress thatincludes the gathering of long-term data forindividual Ss and the application of thepresent analyses to them.
In an effort to obtain a rough idea of theextent to which the various models were
reflecting the same underlying structure inthe data, correlation coefficients wereobtained for analogous parameters in thethree models, and these are shown inTables 5 and 6 for bias and similarityparameters, respectively. In Tables 5 and 6,AON =ali-or-none activation model, OLP =overlap activation model, and CHC =choice model. The two conditions are givenby CI and CII. Table 6 includescorrelations with and among two possiblemetrics and a crude physical measure ofinterletter similarity. The metrics are onessuggested by Luce (1963a) to be associatedwith the choice model (del and the other isthat obtained from application of thescaling program (d.), The measure ofphysical overlap or similarity (PHOVLP)was found by taking blown-up versions ofthe font used in the experiment andsuperimposing them in pairs on a 10 by 10grid (the letters were eight units high andabout five units wide, on the average).Then, the relative intersection wascomputed for each pair, the intersectiondivided by the union of cells covered in thematrix.
Bearing in mind that we usuallyinterpret the correlation coefficient r or r2
as referring to a linear relationship, theobtained values are surprisingly large.Within the bias table, the correlationswithin a condition are higher than acrossconditions; this may indicate an actualchange of biases by Ss from CI and Cll.Also, the highest correlations are obtainedbetween the overlap activation model andthe choice model, suggesting that despitetheir differing heritage, these two modelsreflected bias processes in a similar way,and different from the ali-or-none model,by virtue of their ability to depict stimulussimilarity.
Among the similarity parametercorrelations, the most salient result was theremarkable r of .97 of the choice model inthe two conditions, as contrasted with thelowest correlation of biases for the choicemodel across conditions, which, of course,we would expect if bias changed and
stimulus similarity did not, and a modelreflects these properties. To be sure, thedifferences in the scaling fits indicate that,at the least, the psychological spaces maynot have been identical for the twoconditions. When examining the correlationswith the supposed metrics, we may note,as a reference, the correlation of about .75obtained by correlating l'lij with -In(71ij)(de). The overlap parameters correlatedslightly higher with -In(71ij) than they dowith 71ij. Also, a favorable relationship isfound between the metric -In(71ij) and themetric from the multidimensional scalingprogram. It is interesting to note that if therelationship between 71ij in CI and CII wereby way of a similarity transformation(y = ax, "a" constant) as choice theorydemands if the similarity structure is thesame in CI and CII, then the correlationcoefficient for -In(71ij) for the twoconditions would also be large. The factthat it is not (r =.63) tells us that therelationship must have been affine(y =ax + b, "a," "b" constan ts) ratherthan strictly simply a stretch or shrinkagerelationship. This probably followed fromfewer estimated similarities of zero in CIthan in CII. Of course, conventionalapplication of the theory would assume nozero similarities.
Concluding the correlation analysis isthat of the physical overlap measure, ameasurement that does not suffer from thebuilt-in dependencies that characterize theother numbers in the correlation tables.The results are again substantially in theexpected direction with the highestcorrelations found with the choicesimilarity parameters and with the scalingmetric.
The approach assumed in this paper hasbeen of a twofold nature. On the one hand,mathematical models were employed asinvestigatory structures to reveal andexplicate various aspects of the data; thesubstantive recognition models and thescaling technique were complementary inthis aim. On the other hand, there was atheory-testing facet of the study which
48 Perception & Psychophysics, 1971, Vol. 9 (IA)

and the bia\ naramctcr- are e ... unrated hy:
REFERENCESATKINSON, R. C, & KINCHLA. R. A. A
learning model for forced-choice detectionexperiments, British Journal of Mathematical& Statistical Psychology, 1965, 18, 183-206.
BROWN. D. R., & ANDREWS, M. H. Visual formdiscrimination: Multidimensional analyses.Perce p t ion & Psychophysics, 1%8. 3,401-406_
BUSH, R. R. Estimation and evaluation, In R. D_Lucc, R. R. Bush, and E. Galantcr (Fds.),Han d book of mathematical psychology.Vol. I. New York: Wiley, 1963_ 1'1'.429-469
CLRNOG. U. Y., & ROSE, I. C. (l-ds.).l.egibility of alphanumeric characters antiother symbols. II. A reference handbook.Washington. D.C: National Bureau ofStandards Misrellaneous 262-2.1967.
ESTFS, W. K., & WFSSEl., D. L. Reaction timein relation to display size and correctness ofre sp on sc in forced-choice visual signaldetection. Perception & Psychophysics, 1966,1.369-373_
HYMAN, R., & WELL, A, Judgments ofsimilarity and spatial models. Percep tu-n &Psychophysics, 1967.2,233·248.
KINCHl.A. R. A.. TOWNSEND, J. r.,YELlOn. .I. I., & ATKINSON, R. C.Influence of correlated visual cues on auditorysignal detection. Perception & Psychophysics,1966, I. 67-73.
Kl.AHR, U. A Monte Carlo investigation of thestatistical significance of Kruskul's nonmctricscaling procedure. Psychometrika, 1969, 34.319-330.
KRANTZ. D. H. Threshold theories of signaldetection. Psychological Review, 1969, 76,308,324.
KRliSKAL, .I. B. Multidimensional scaling byoptimizing goodness-of-fit to a nonmctrichypo thcxix, Psychome trika. 1964a. 29. )·28.
KRl:SKAI . .I. B. Nonrne tric multidimensionalscaling: A numerical method. Psychomctrik a,1964b, 29. 115·130.
Kl·JNNAPAS. T. Visual perception of capitalletters. Scandinavian Journal of Psychology.1966,7.189-196.
LlICF, R. D. Individual choice bchovior. NewYork: Wiley. 1959.
LLCE, R. D. Detection and recognition. In R. U.l.ucc, R. R. Bush, and L. Galarnc r (Lds.),Ho n d b o ok o] mathematical psvrhotogv.Vol. I N",,, York: Wiley, 1963a. 1'1'.103·189.
r.uct.. R. D. A threshold model tor simpledetection experiments. Psychological Review.1963b, 70, 61· 79.
NAKATANI. I.. II. A confusion-choke stimulusrecognition model applied !O wordrecognition. Technical Report No. 31. 1968,l I u m a n Communication Laboratory.University of California. Los Angeles.
SHLI'ARD, R. N. Stimulus and responsegeneralization: Deduction of the gL'lll'rali/Jtionquotient from a trace model. P\H:hofog"icalReview. 1958. 65. 242·256.
SHU'ARD, R. N. The analysis of proximities:Multidimensional scaling with an unknowndistance function: I. Psychomernka. 1962a,27, ] 25·140.
SHJ-:PARD. R. N. The analysis of proximuics:Multidimensional scaling with an unknowndistance function: II. Psychomctrika, 1962b.27,219·246.
SHI:PARD, R. N. Attention and the metricstructure of the stimulus. Journal ofMathematical Psychology, 1964. I. 54-87.
SMITH, K. Models of confusion, Paper deliveredto Psychonornic Sccic ty, St. Louis, 1968.
TORCJ-:RSON, W. S. Mel/JOdI of scaling. NewYork: Wiley. 1958.
TOWNSFND. J. T. Choice behavior in acu c d-r ccogniuon task. Technical Report
(i = I. 2..... NI., Igi = TN:
y ...1,[~ I'
i=] ji
which. of course. cancc}, out in the CXpre"\10J1"
for Pit.
I t may be obxcrvcd that instead of \clcding asingle letter to Lise in estimating all the bia-,ratios. in order to possibly give more stability tothe estimates. tor each bias parameter. each letterwa-, used as the denominator and the average
taken. In terms of the model. this simply resultsin an overall multiplication of the {31 bv thecon-rant
Choice ModelThe choice model and the relevant formulae
arc well known; hence. we shall simply list themand remark that this model possesses the samenumber of similanty and gue ... ,ing parameter' lL's.,one as the overlap model for a tOlal of 3511 Ihesunilaritv parume tcr functions arc:
11 _[Pilii] ' "' \i..J·~1.2.·".Nl
ii - 1'..1'.". Il It
N. L Pji.j= \ .#01
and the guessing biases were obtained from theformula:
Substitution of the theoretical expressions forthe confusion matrix entries, Pij' will suffice toshow that the above arc the appropriateIormulac.
~'i ~ Pij + Pii· ti.] z: 1,2.•••. N. i i= II
Overlap Activation ModelIn this model. structure existed to measure or
reflect pairwise stimulus similarity. Theparameters assigned this function we called ~iJ'
designating the overlap or similarity of stimulus iand stimulus .1. To denote the probability that"perfect" sensory information was obtained. weused the symbol ~ii' As this model included nopure guessing state. only perfect information andpairwise confusion states, we employed theassumption that when in a confusion state, saybetween s, and Sj. the S gave response Ri withprobability gi!(gi + gil, where gi is the response
strength or response bias (like Pi in theall-or-none activation model); this implies the
con-rant ratio rule on the guessing biasev,
The expressions which yielded the sensoryparameters for tim model were:
Alt-er-None Activation ModelIt will be recalled that there exist no similarity
parameters as such in this model, only stimulusparameters reflecting the likelihood of obtaininu
sensory information, which is related in aone-one fashion to the (correct) response (0,1. Inaddition, if the S docs not find himself in thiscertain state, he must guess from all 2h
alternatives and he picks alternative "i" \\ ithprobability Pi. This model possesses a total 015 Iparameters for this experiment as compared with650 degrees of freedom in thc data rill'estimates for the sensory parameters were:
0i" {Ph <I
+ £lI z; I
*i
ti = 1.2, .... Nl
• N 2p' ~ ----~---- (i ~ 1.2.' ". N)
1 N N P'k~ ~--2+N 2
]=1 k> I Pji*, #o,.j
where. as before, N is the number of surnuli. andresponses m an experiment. TIll' estimates for theguessing bia-, parameter" were given hy
APPENDIXAlthough there exist maximum likelihood
estimation procedures for the choice model andthe ali-or-none model, for convenience andhomogeneity of estimation technique, allparameters were estimated by setting eachparameter equal to a function of the data Ii.c.,
the modified method of moments (aush, 1963) I 'the particular function, of course, being relatedto the particular model and the specificparameter. For simplicity_we will here denote1>(RjlSi) as l'ij'
especially manifested itself in theevaluation and comparison of therecognition models. Although thisapproach proved fruitful in delineatingsome of the characteristics of alphabeticconfusion and suggesting the type of modelnecessary to deal with visual confusions,the spatial configurations resulting fromthe scaling analysis were less thansatisfactory, in terms of describing apsychologically intuitive set of dimensions.To some extent, this may be a function ofthe sheer complexity of the Englishalphabet; it may prove valuable to build upa psychophysics of simple visual elements,such as lines at various orientations, andthen begin to construct more complex.alphabets with these. In this way the lawsrelating to the emergent properties of themore complex stimulimay become known.
Perception & Psychophysics, 1971, Vol. 9 (I A) 49

No. 103, 1966, Institute for MathematicalStudies in the Social Sciences, StanfordUniversity.
WICKElGREN, W. A. Testing two-state theorieswith operating characteristics and a posteriori
probabilities. Psychological Bulletin, 1968.69.126-131.
NOTE1. The complete set of theoretical predictions
may be obtained from the AmericanDocumentation Institute.
(Accepted for publication April 24. J970.)
50 Perception & Psychophysics, 1971, Vol. 9 (IA)