Embed Size (px)
Citation preview
The World Income Distribution of Income: Falling Poverty and…
Convergence, Period
Sala-i-Martin (2006)
Convergence literature
• Beta divergence: poor countries grow slower than rich countries
• Sigma divergence: dispersion of income per capita across countries grew over time

Changing unit of observation
• Idea: change unit of observation from country to individuals
• Results: beta and sigma convergence
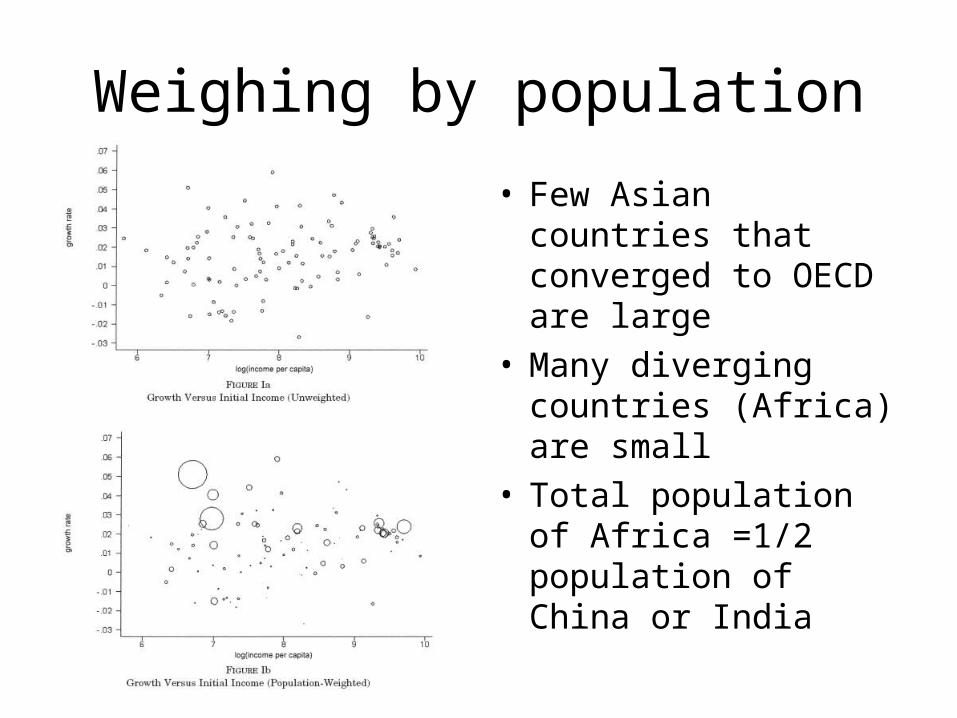
Weighing by population
• Few Asian countries that converged to OECD are large
• Many diverging countries (Africa) are small
• Total population of Africa =1/2 population of China or India
Population Weights: Limits
• Assumes all individuals within a country have the same income
• Ex: income per capita in a country just above poverty line…no poors?
• Conclusion: use within country information…problematic (data)
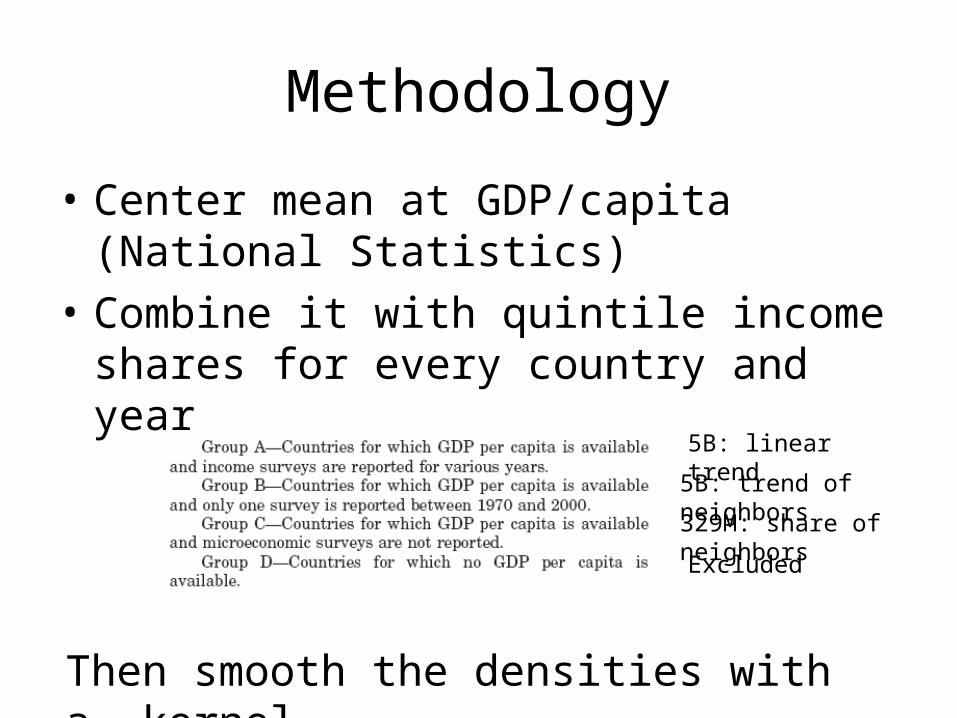
Methodology
• Center mean at GDP/capita (National Statistics)
• Combine it with quintile income shares for every country and year
5B: trend of neighbors
329M: share of neighbors
5B: linear trend
Excluded
Then smooth the densities with a kernel
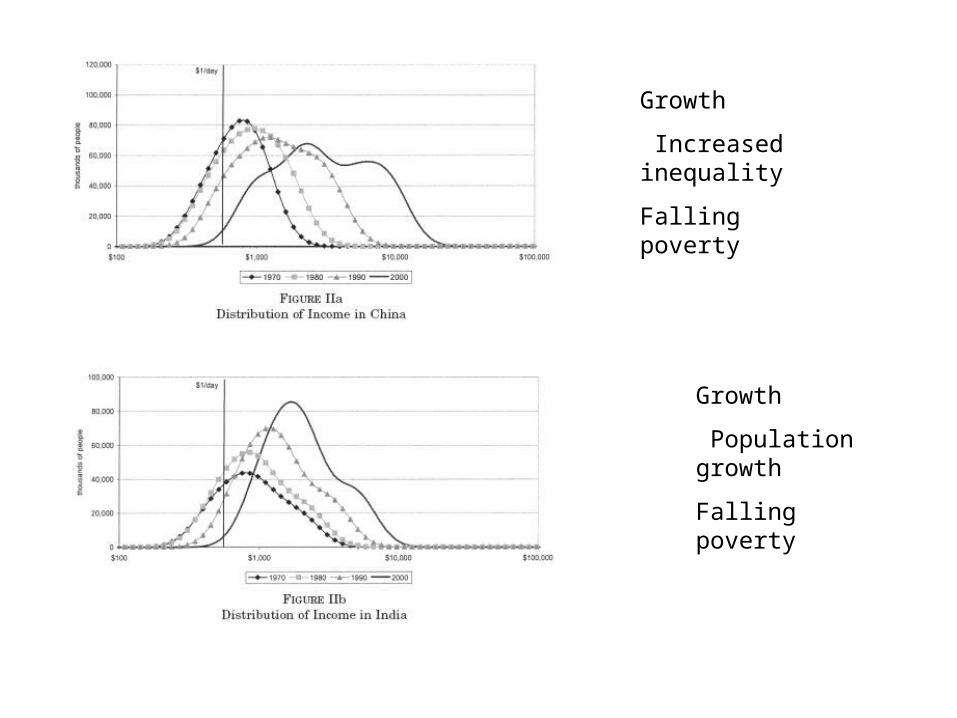
Growth
Increased inequality
Falling poverty
Growth
Population growth
Falling poverty

No poors
Growth
Reduction in inequality
Falling poverty
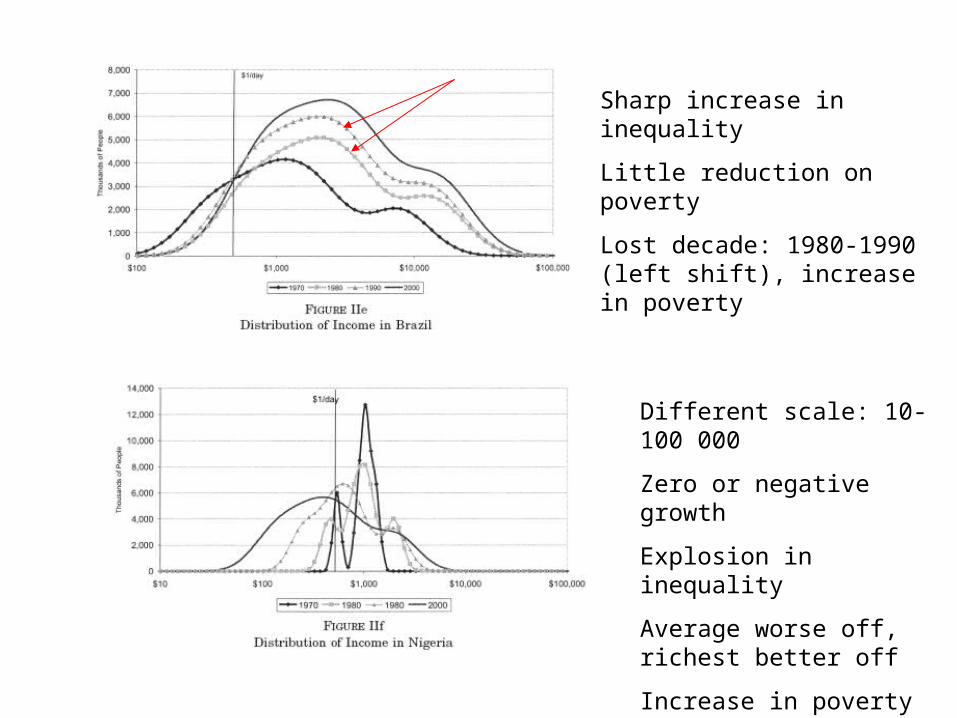
Sharp increase in inequality
Little reduction on poverty
Lost decade: 1980-1990 (left shift), increase in poverty
Different scale: 10-100 000
Zero or negative growth
Explosion in inequality
Average worse off, richest better off
Increase in poverty
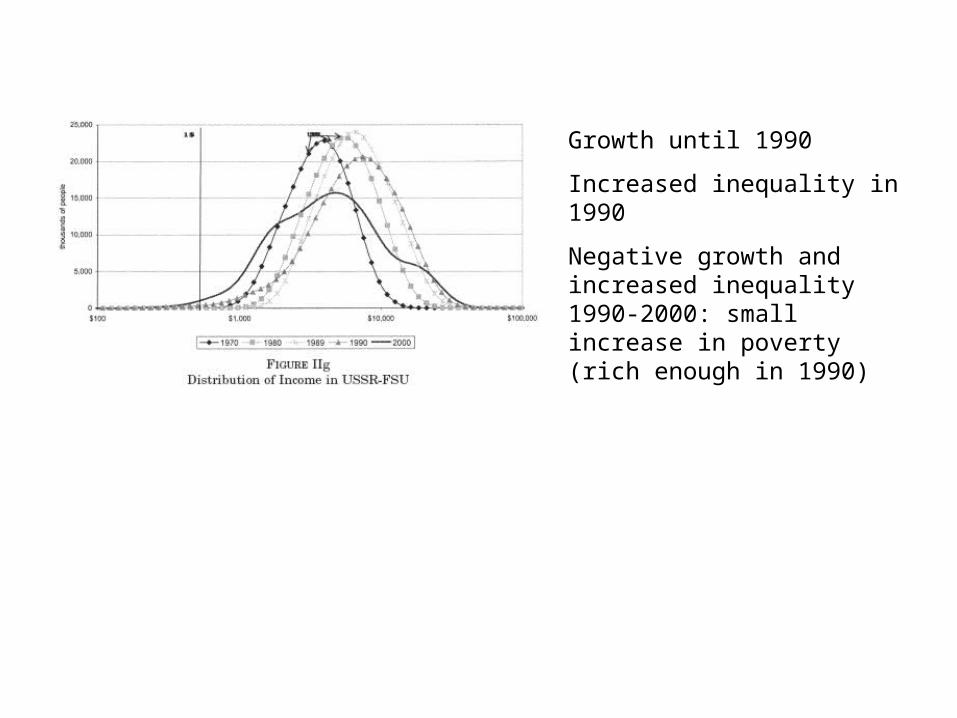
Growth until 1990
Increased inequality in 1990
Negative growth and increased inequality 1990-2000: small increase in poverty (rich enough in 1990)
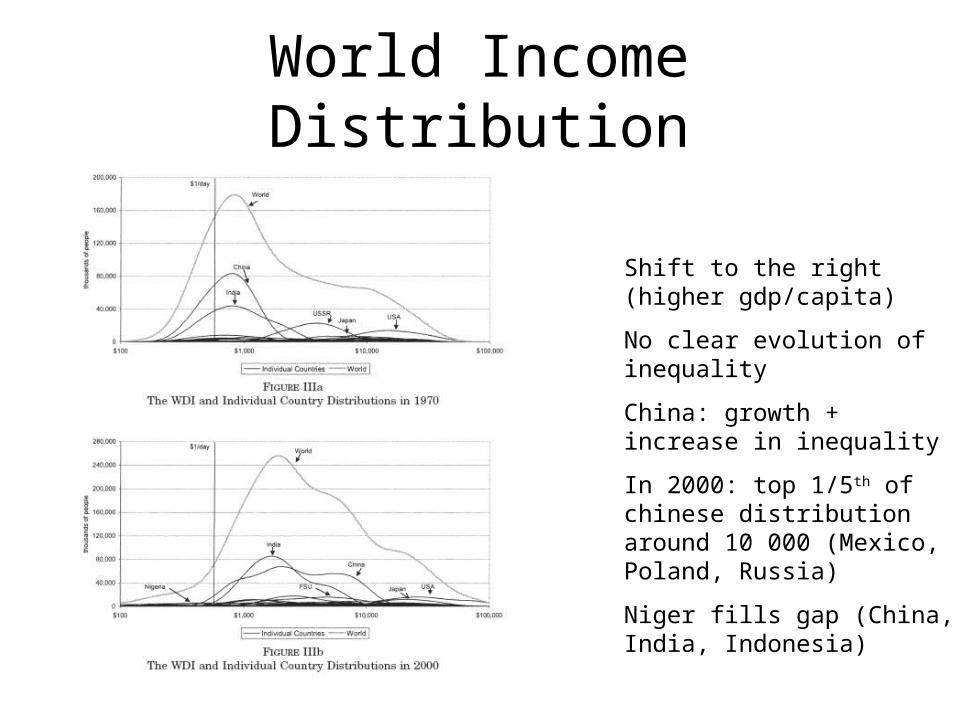
World Income Distribution
Shift to the right (higher gdp/capita)
No clear evolution of inequality
China: growth + increase in inequality
In 2000: top 1/5th of chinese distribution around 10 000 (Mexico, Poland, Russia)
Niger fills gap (China, India, Indonesia)
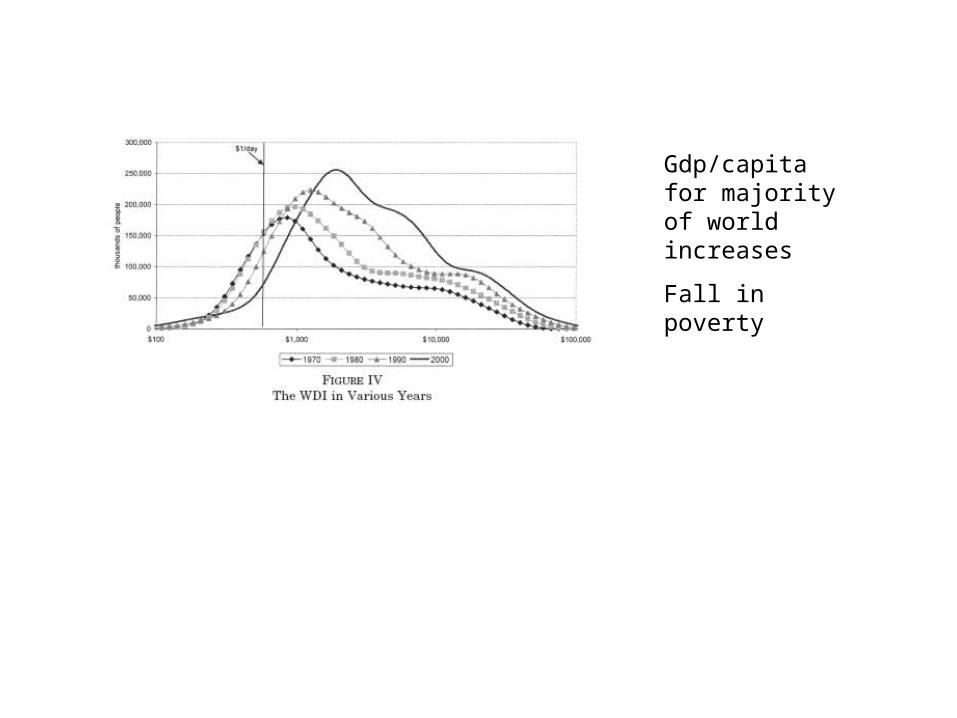
Gdp/capita for majority of world increases
Fall in poverty
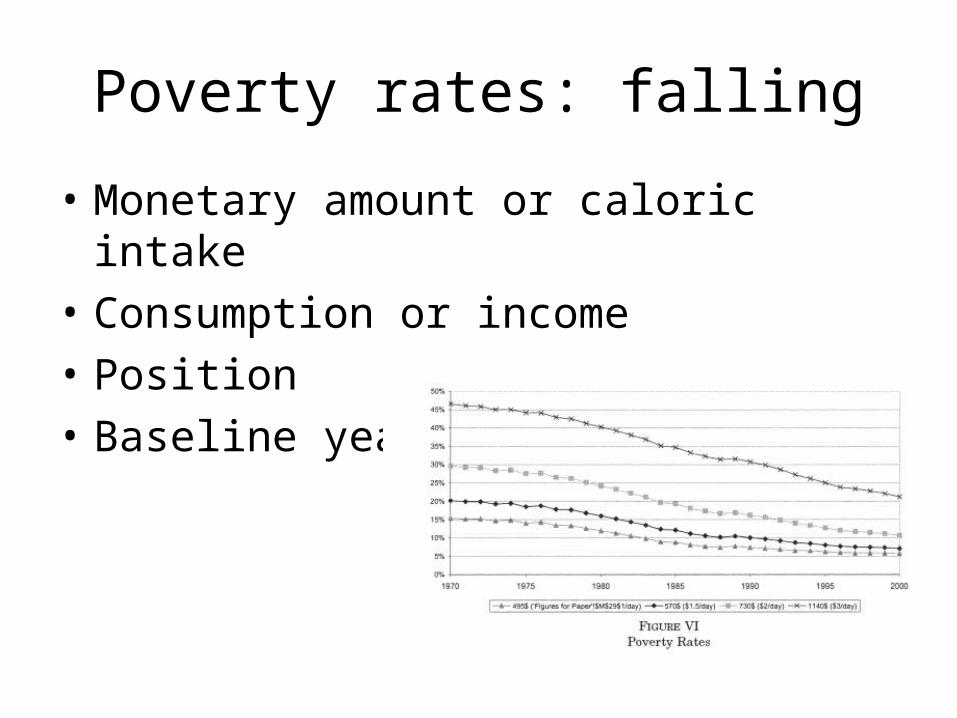
Poverty rates: falling
• Monetary amount or caloric intake
• Consumption or income
• Position
• Baseline year
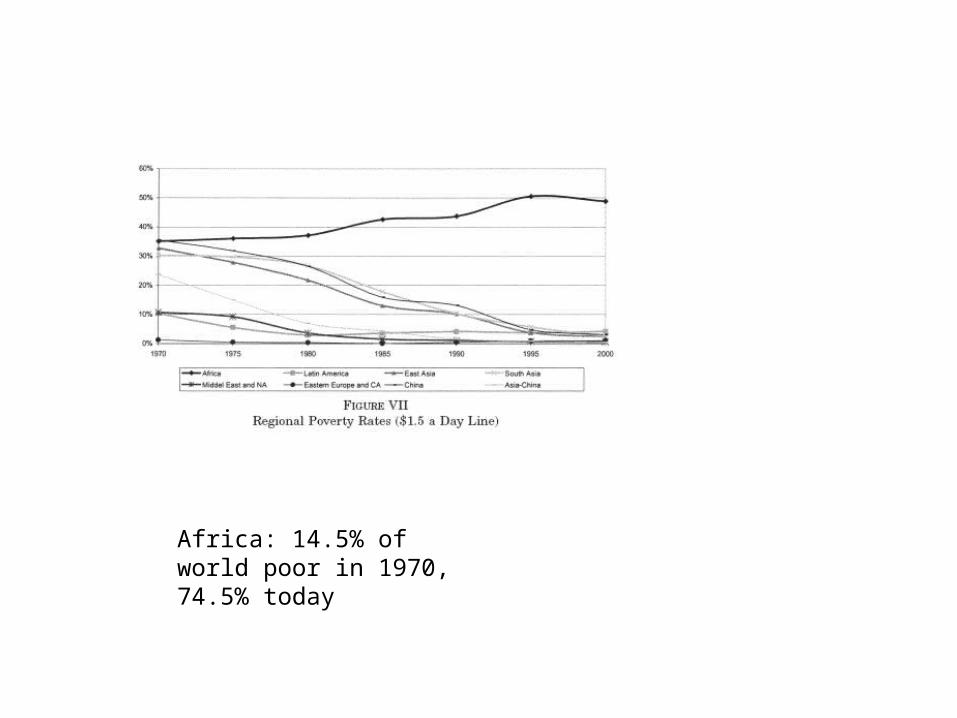
Africa: 14.5% of world poor in 1970, 74.5% today
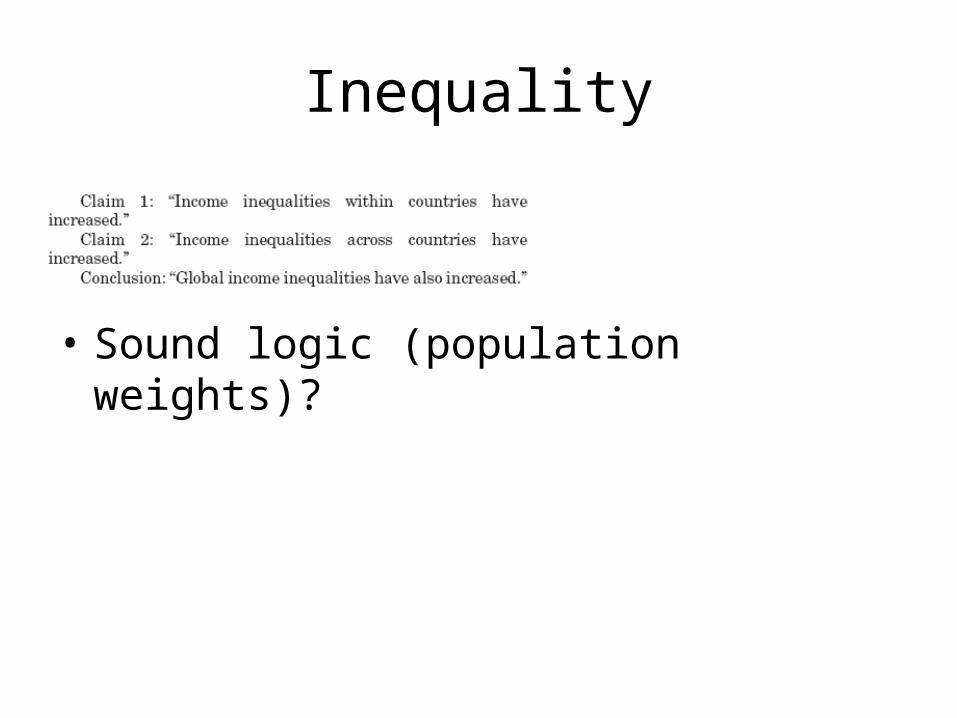
Inequality
• Sound logic (population weights)?
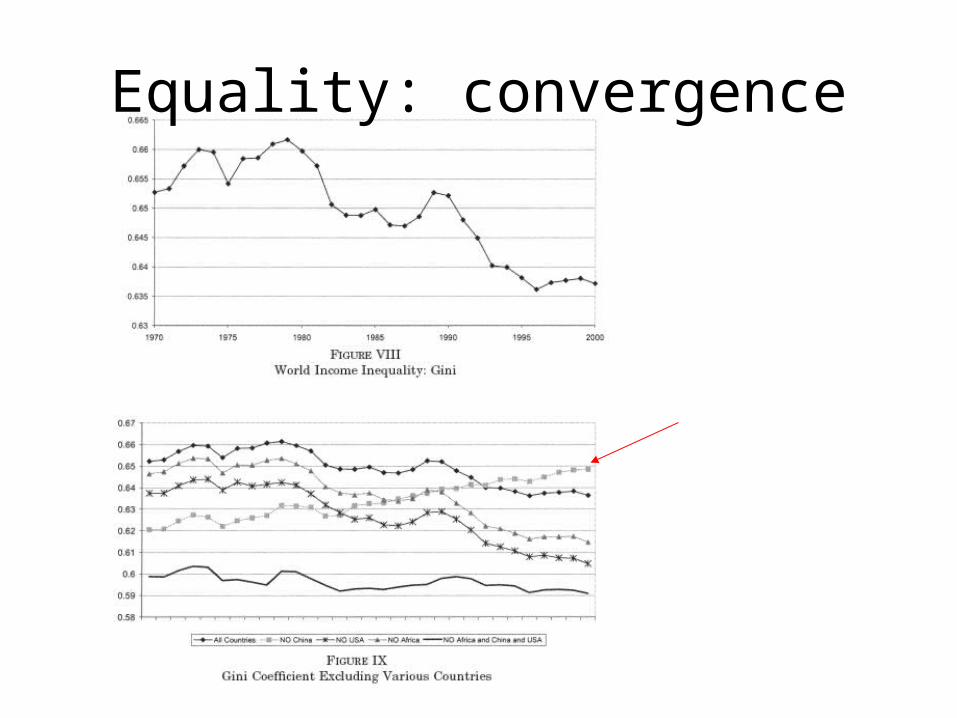
Equality: convergence
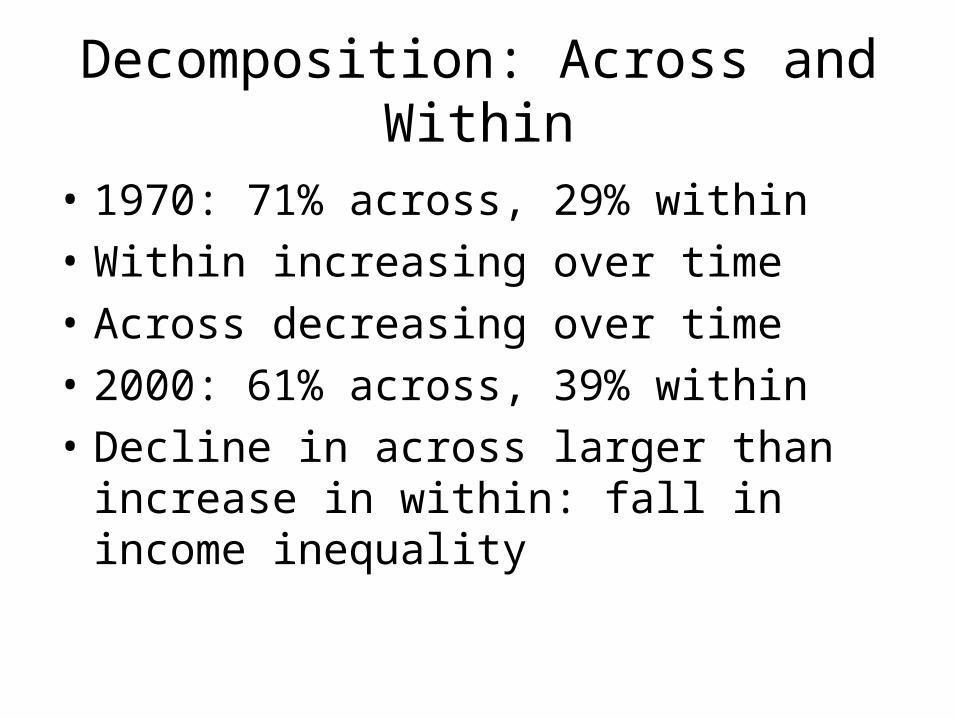
Decomposition: Across and Within
• 1970: 71% across, 29% within
• Within increasing over time
• Across decreasing over time
• 2000: 61% across, 39% within
• Decline in across larger than increase in within: fall in income inequality