Embed Size (px)
Citation preview
1
THE WELLBEING & RESILIENCE CENTRE IN PARTNERSHIP WITH ADELAIDE CITY COUNCIL BASELINE WELLBEING MEASUREMENT REPORT AUGUST 2016
THE WELLBEING AND RESILIENCE CENTRE
2
...exists to build wellbeing and resilience at scale. Through collaborative partnerships that bring together practice, policy and applied research, the Wellbeing and Resilience Centre leads, measures, builds, embeds and researches across the life course with
individuals; children, young people, adults and families, as well as at the population level; with communities, businesses, organisations and cities’
THE WELLBEING & RESILIENCE CENTRE
GABRIELLE KELLY, DIRECTOR WELLBEING & RESILIENCE CENTRE
3
Disclaimer This document has been prepared by the Wellbeing and Resilience Centre at the South Australian Health and Medical Research Institute (SAHMRI), based upon survey data collected by SAHMRI in May/June 2016 using the PERMA+ survey tool and is reported in good faith. Data have been collapsed where necessary to protect confidentiality. This report provides the baseline measurement data. The comprehensive descriptive data is provided in a separate document. The results obtained from the PERMA+ survey do not constitute medical advice or professional services and should not be used for diagnosis or treatment.
CONTENTS WELLNESS & RESILIENCEADELAIDE CITY COUNCILBASELINE MEASUREMENT RESULTSFIGURE 1: THE DISTRIBUTION OF THE PERMA SCOREKEY TARGET AREAS TO CONSIDERFIGURE 2: COMPARISON BETWEEN GLOBAL WELLBEING SCORES AND ACCFIGURE 3: COMPARISON OF WELLBEING SCORES, BY GENDERFIGURE 4: COMPARISON OF WELLBEING SCORES, BY AGE GROUPSFIGURE 5: COMPARISON OF WELLBEING SCORES, BY COUNTRY OF ORIGINWHAT DID WE LEARN?THE PLUS + ELEMENTSCONCLUSION AND REFERENCES
45678
10111213141516
4
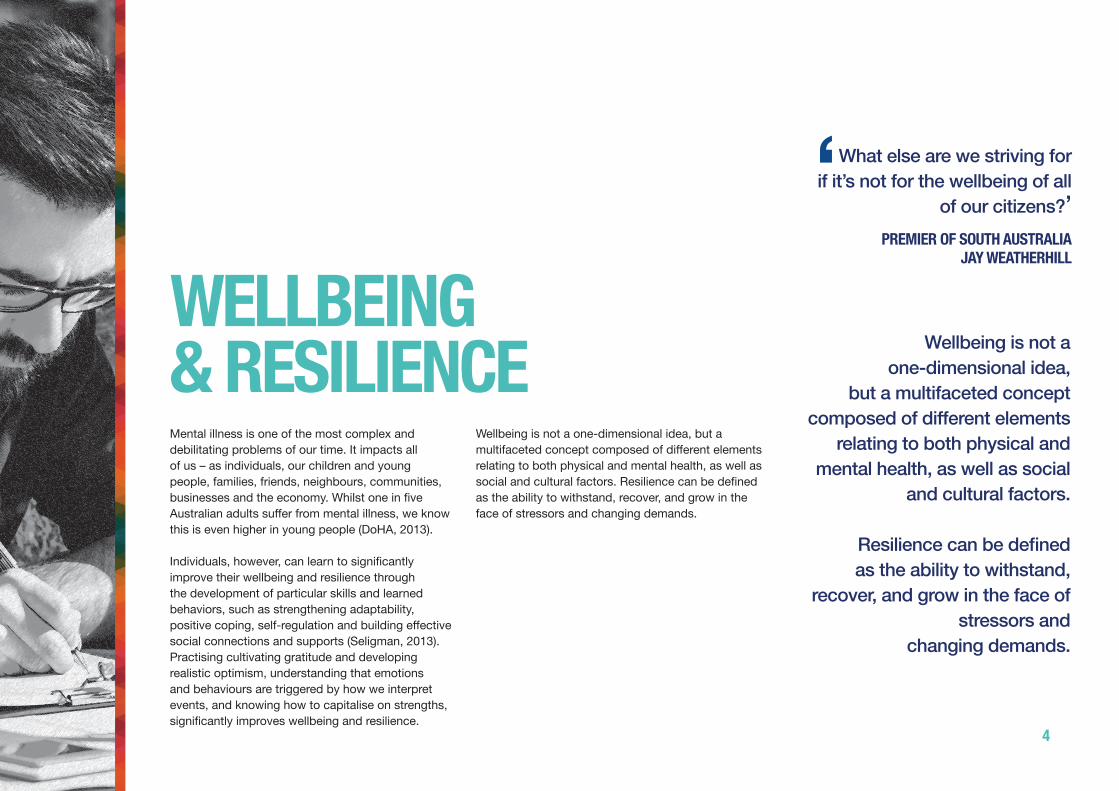
Mental illness is one of the most complex and debilitating problems of our time. It impacts all of us – as individuals, our children and young people, families, friends, neighbours, communities, businesses and the economy. Whilst one in five Australian adults suffer from mental illness, we know this is even higher in young people (DoHA, 2013).
Individuals, however, can learn to significantly improve their wellbeing and resilience through the development of particular skills and learned behaviors, such as strengthening adaptability, positive coping, self-regulation and building effective social connections and supports (Seligman, 2013). Practising cultivating gratitude and developing realistic optimism, understanding that emotions and behaviours are triggered by how we interpret events, and knowing how to capitalise on strengths, significantly improves wellbeing and resilience.
Wellbeing is not a one-dimensional idea, but a multifaceted concept composed of different elements relating to both physical and mental health, as well as social and cultural factors. Resilience can be defined as the ability to withstand, recover, and grow in the face of stressors and changing demands.
WELLBEING & RESILIENCE
What else are we striving for if it’s not for the wellbeing of all
of our citizens?’ PREMIER OF SOUTH AUSTRALIA
JAY WEATHERHILL
Wellbeing is not a one-dimensional idea,
but a multifaceted concept composed of different elements
relating to both physical and mental health, as well as social
and cultural factors.
Resilience can be defined as the ability to withstand,
recover, and grow in the face of stressors and
changing demands.
5
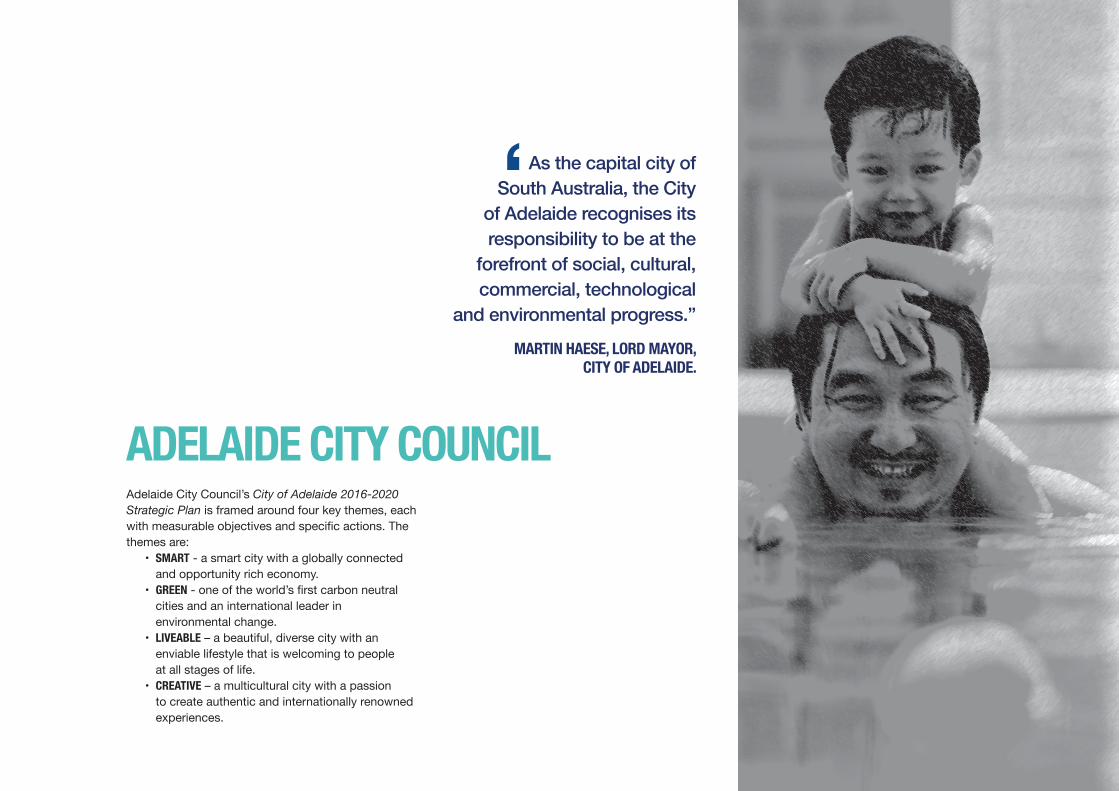
ADELAIDE CITY COUNCILAdelaide City Council’s City of Adelaide 2016-2020 Strategic Plan is framed around four key themes, each with measurable objectives and specific actions. The themes are:
• SMART - a smart city with a globally connectedand opportunity rich economy.
• GREEN - one of the world’s first carbon neutralcities and an international leader inenvironmental change.
• LIVEABLE – a beautiful, diverse city with anenviable lifestyle that is welcoming to peopleat all stages of life.
• CREATIVE – a multicultural city with a passionto create authentic and internationally renownedexperiences.
As the capital city of South Australia, the City
of Adelaide recognises its responsibility to be at the
forefront of social, cultural, commercial, technological
and environmental progress.”
MARTIN HAESE, LORD MAYOR, CITY OF ADELAIDE.
6
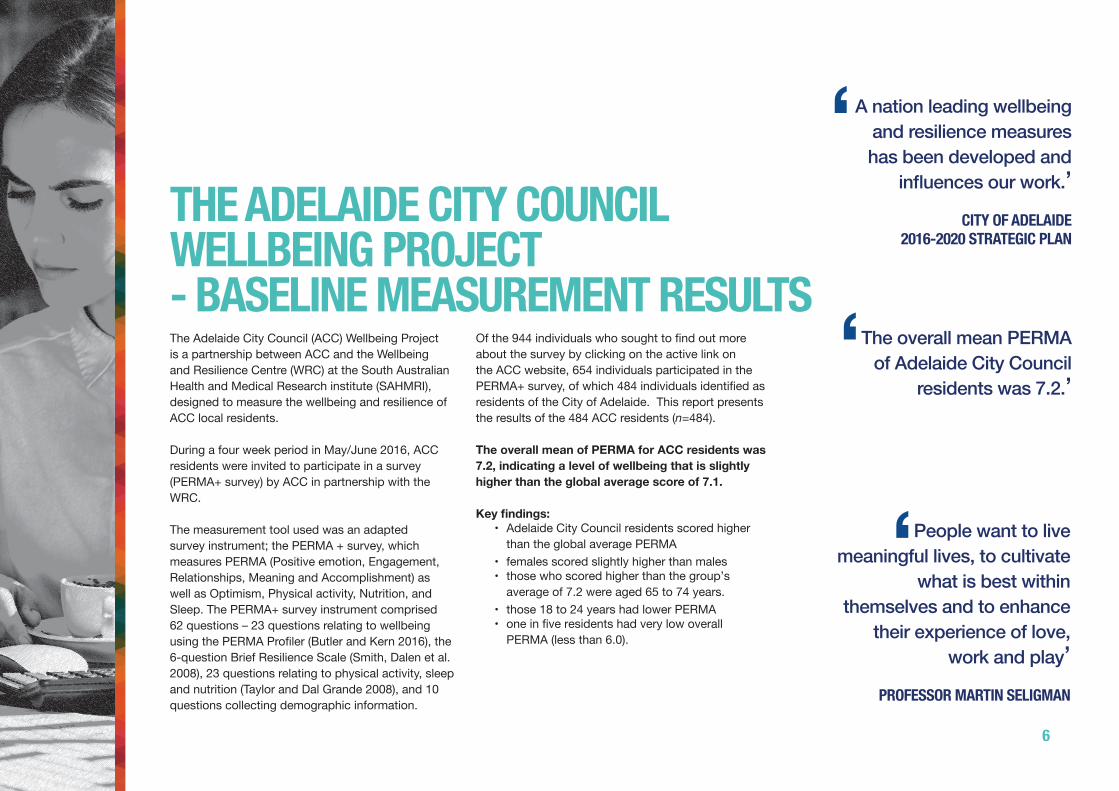
THE ADELAIDE CITY COUNCIL WELLBEING PROJECT - BASELINE MEASUREMENT RESULTSThe Adelaide City Council (ACC) Wellbeing Project is a partnership between ACC and the Wellbeing and Resilience Centre (WRC) at the South Australian Health and Medical Research institute (SAHMRI), designed to measure the wellbeing and resilience of ACC local residents.
During a four week period in May/June 2016, ACC residents were invited to participate in a survey (PERMA+ survey) by ACC in partnership with the WRC.
The measurement tool used was an adapted survey instrument; the PERMA + survey, which measures PERMA (Positive emotion, Engagement, Relationships, Meaning and Accomplishment) as well as Optimism, Physical activity, Nutrition, and Sleep. The PERMA+ survey instrument comprised 62 questions – 23 questions relating to wellbeing using the PERMA Profiler (Butler and Kern 2016), the 6-question Brief Resilience Scale (Smith, Dalen et al.2008), 23 questions relating to physical activity, sleepand nutrition (Taylor and Dal Grande 2008), and 10questions collecting demographic information.
Of the 944 individuals who sought to find out more about the survey by clicking on the active link on the ACC website, 654 individuals participated in the PERMA+ survey, of which 484 individuals identified as residents of the City of Adelaide. This report presents the results of the 484 ACC residents (n=484).
The overall mean of PERMA for ACC residents was 7.2, indicating a level of wellbeing that is slightly higher than the global average score of 7.1.
Key findings:• Adelaide City Council residents scored higher
than the global average PERMA• females scored slightly higher than males• those who scored higher than the group’s
average of 7.2 were aged 65 to 74 years.• those 18 to 24 years had lower PERMA• one in five residents had very low overall
PERMA (less than 6.0).
A nation leading wellbeing and resilience measures has been developed and
influences our work.’ CITY OF ADELAIDE
2016-2020 STRATEGIC PLAN
The overall mean PERMA of Adelaide City Council
residents was 7.2.’
People want to live meaningful lives, to cultivate
what is best within themselves and to enhance
their experience of love, work and play’
PROFESSOR MARTIN SELIGMAN
7
DISTRIBUTION OF PERMA
PERMA Score
FREQ
UEN
CY
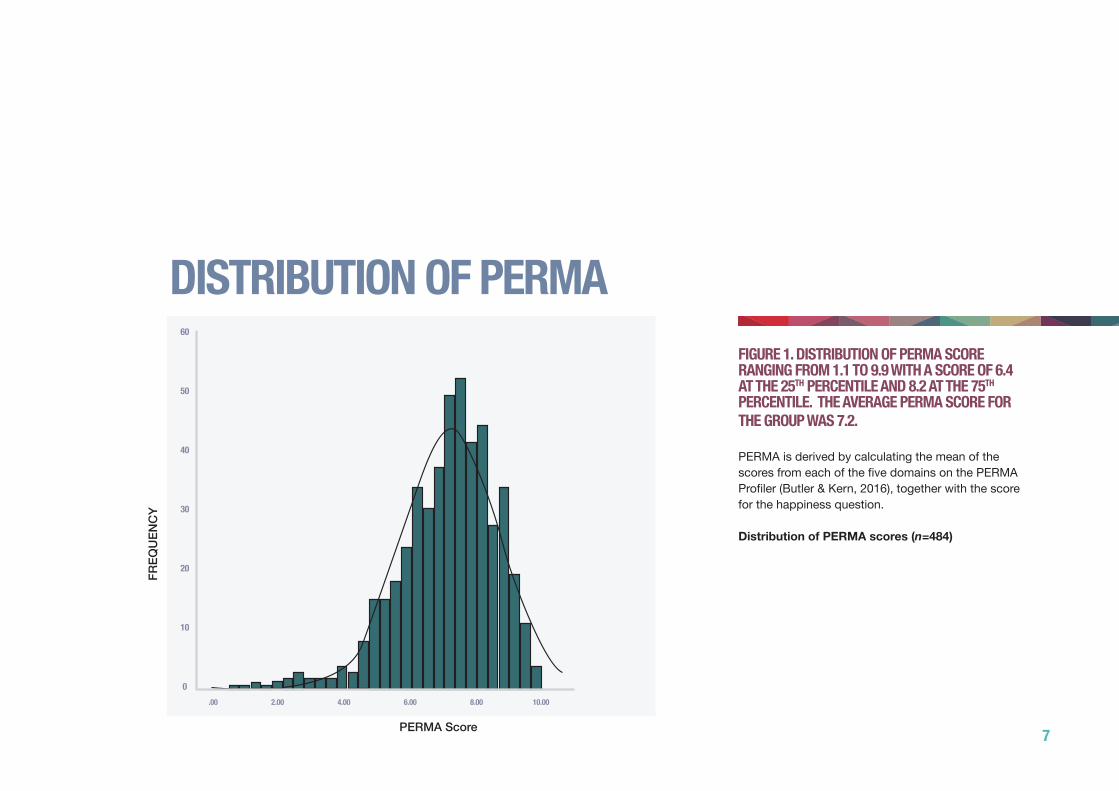
FIGURE 1. DISTRIBUTION OF PERMA SCORE RANGING FROM 1.1 TO 9.9 WITH A SCORE OF 6.4 AT THE 25TH PERCENTILE AND 8.2 AT THE 75TH PERCENTILE. THE AVERAGE PERMA SCORE FOR THE GROUP WAS 7.2.
PERMA is derived by calculating the mean of the scores from each of the five domains on the PERMA Profiler (Butler & Kern, 2016), together with the score for the happiness question.
Distribution of PERMA scores (n=484)
60
50
40
30
20
10
0
8
DEMOGRAPHIC GROUPS SCORING LOWER IN PERMA+ DOMAINS AND ELEMENTS
MALE
FEMALE
18-24 YEARS
DIVORCED
SINGLE/NEVER MARRIED
WIDOWED
SEPARATED
ASIAN (ETHNICITY)
EUROPEAN (ETHNICITY)
AUSTRALIA/NEW ZEALAND(ETHNICITY)
Y Y
Y Y
Y Y Y Y Y Y Y Y
Y
Y Y Y Y Y Y
Y
Y
Y Y Y Y Y
Y Y Y Y Y
Y
POSITIVEEMOTION
ENGAGEMENT RELATIONSHIPS MEANING ACCOMPLISHMENT OPTIMISM GENERALHEALTH
RESILIENCE
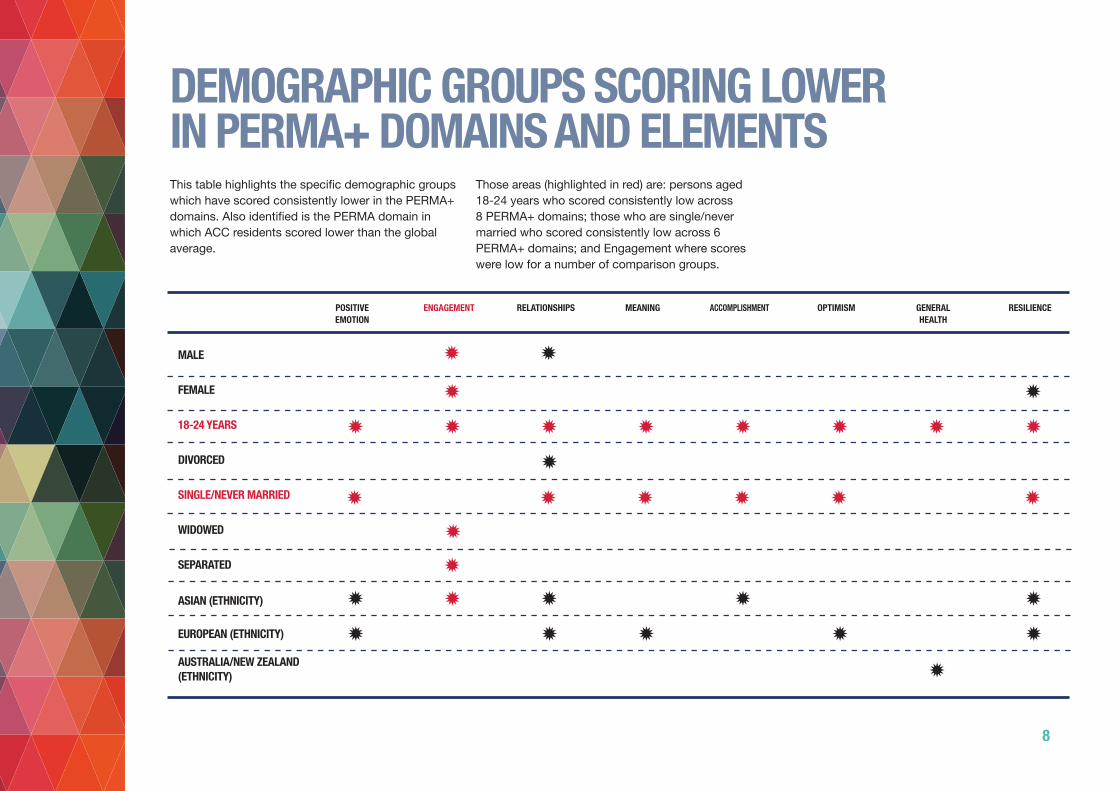
This table highlights the specific demographic groups which have scored consistently lower in the PERMA+ domains. Also identified is the PERMA domain in which ACC residents scored lower than the global average.
Those areas (highlighted in red) are: persons aged 18-24 years who scored consistently low across 8 PERMA+ domains; those who are single/never married who scored consistently low across 6 PERMA+ domains; and Engagement where scores were low for a number of comparison groups.
9
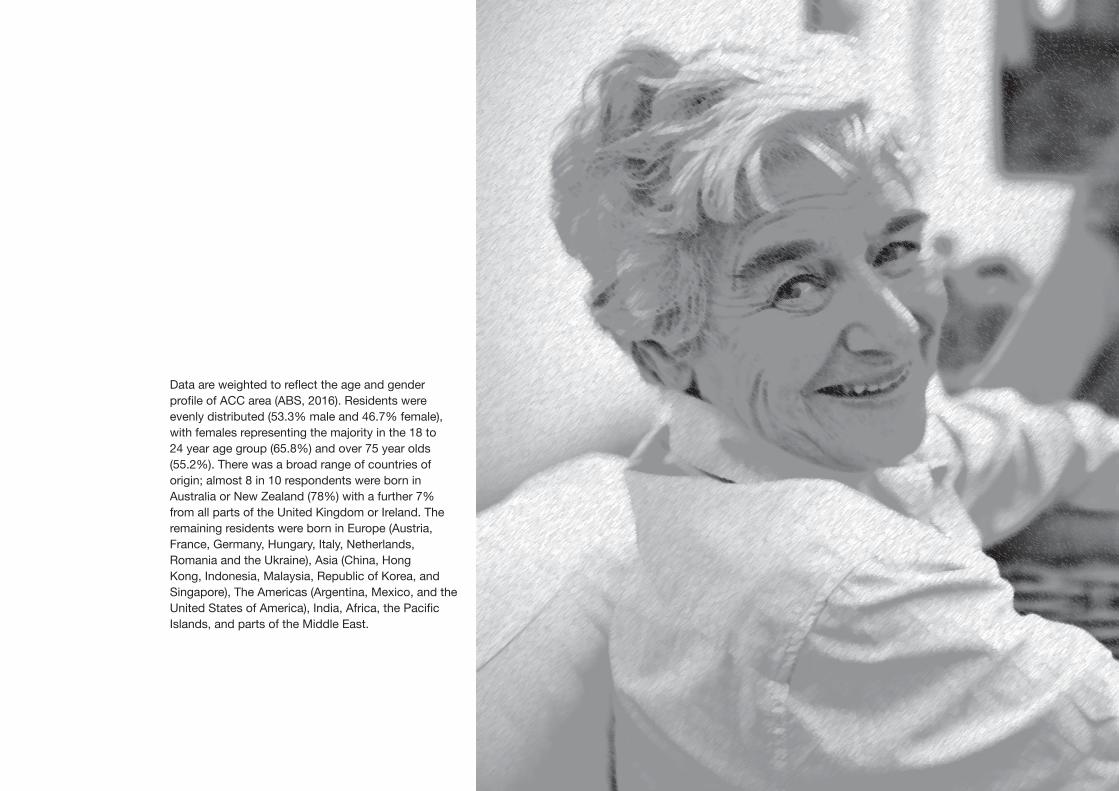
Data are weighted to reflect the age and gender profile of ACC area (ABS, 2016). Residents were evenly distributed (53.3% male and 46.7% female), with females representing the majority in the 18 to 24 year age group (65.8%) and over 75 year olds (55.2%). There was a broad range of countries of origin; almost 8 in 10 respondents were born in Australia or New Zealand (78%) with a further 7% from all parts of the United Kingdom or Ireland. The remaining residents were born in Europe (Austria, France, Germany, Hungary, Italy, Netherlands, Romania and the Ukraine), Asia (China, Hong Kong, Indonesia, Malaysia, Republic of Korea, and Singapore), The Americas (Argentina, Mexico, and the United States of America), India, Africa, the Pacific Islands, and parts of the Middle East.
10
ENGAGEMENTPOSITIVEEMOTION
7.75
7.5
7.25
7
6.75
6.5
6.25
6
5.75
5.5
5.25
0
PERMA ACCOMPLISHMENTMEANINGRELATIONSHIPS
COMPARISON BETWEEN GLOBAL WELLBEING SCORES AND ACC
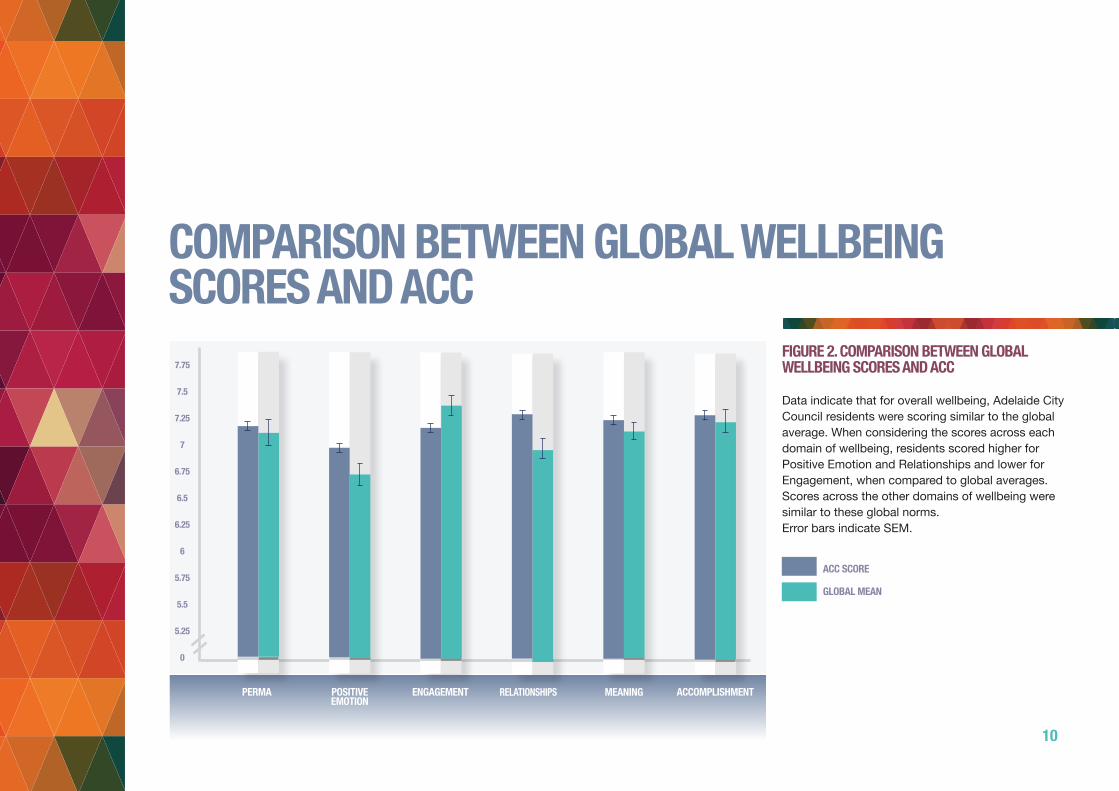
FIGURE 2. COMPARISON BETWEEN GLOBAL WELLBEING SCORES AND ACC
Data indicate that for overall wellbeing, Adelaide City Council residents were scoring similar to the global average. When considering the scores across each domain of wellbeing, residents scored higher for Positive Emotion and Relationships and lower for Engagement, when compared to global averages. Scores across the other domains of wellbeing were similar to these global norms.Error bars indicate SEM.
ACC SCORE
GLOBAL MEAN
11
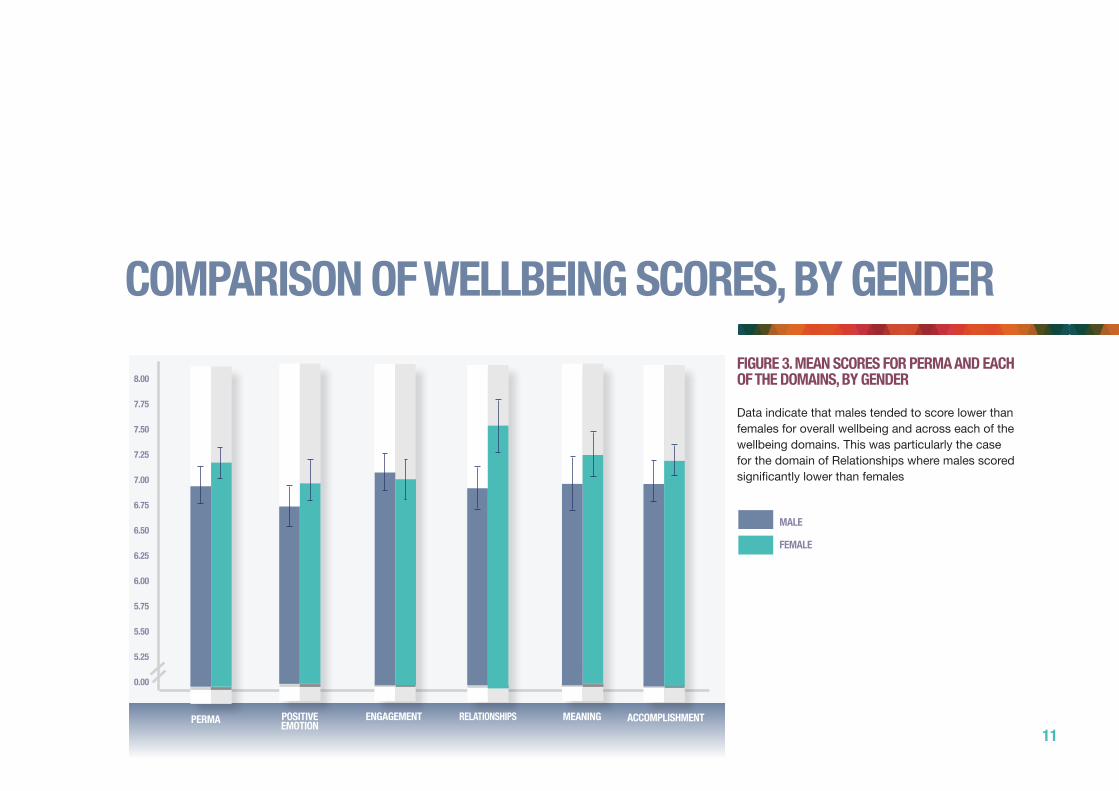
FIGURE 3. MEAN SCORES FOR PERMA AND EACHOF THE DOMAINS, BY GENDER
Data indicate that males tended to score lower than females for overall wellbeing and across each of the wellbeing domains. This was particularly the case for the domain of Relationships where males scored significantly lower than females
COMPARISON OF WELLBEING SCORES, BY GENDER
8.00
7.75
7.50
7.25
7.00
6.75
6.50
6.25
6.00
5.75
5.50
5.25
0.00
MALE
FEMALE
PERMA POSITIVEEMOTION
ENGAGEMENT RELATIONSHIPS MEANING ACCOMPLISHMENT
12
COMPARISONS IN WELLBEING SCORES ACROSS AGE GROUPS
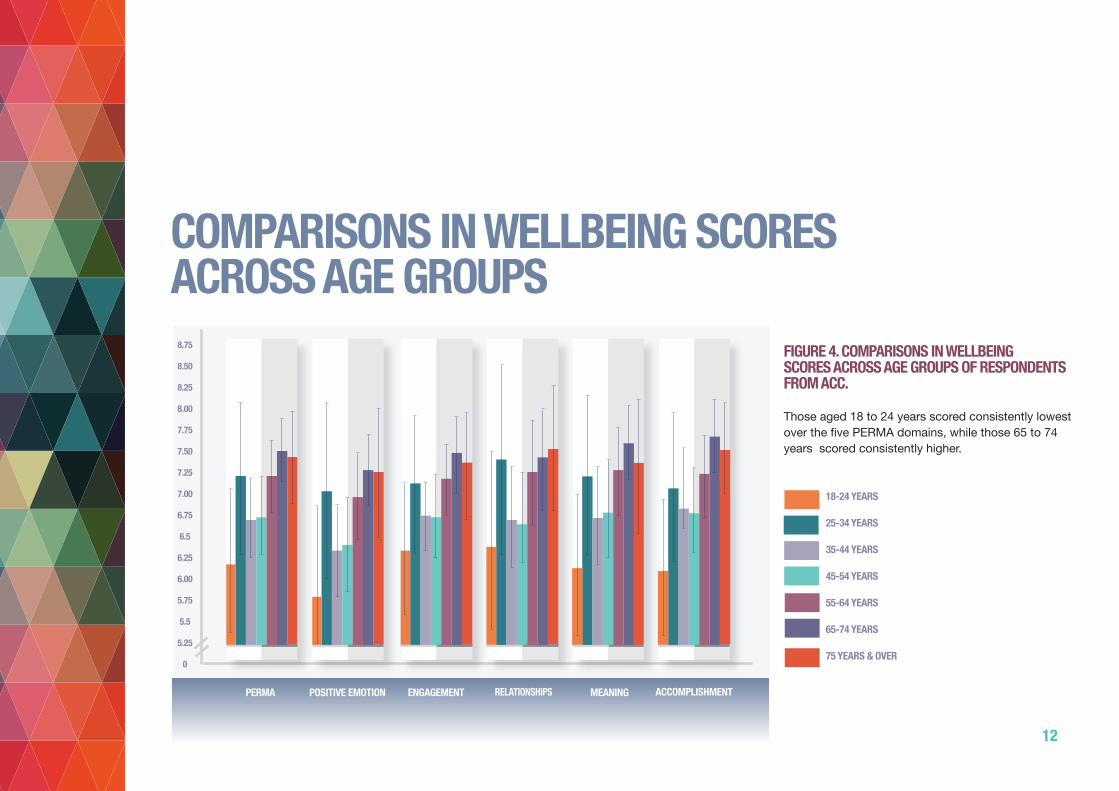
FIGURE 4. COMPARISONS IN WELLBEING SCORES ACROSS AGE GROUPS OF RESPONDENTS FROM ACC.
Those aged 18 to 24 years scored consistently lowest over the five PERMA domains, while those 65 to 74 years scored consistently higher.
ENGAGEMENTPOSITIVE EMOTION
8.75
8.50
8.25
8.00
7.75
7.50
7.25
7.00
6.75
6.5
6.25
6.00
5.75
5.5
5.25
0
PERMA ACCOMPLISHMENTMEANINGRELATIONSHIPS
18-24 YEARS
25-34 YEARS
35-44 YEARS
45-54 YEARS
55-64 YEARS
65-74 YEARS
75 YEARS & OVER
13
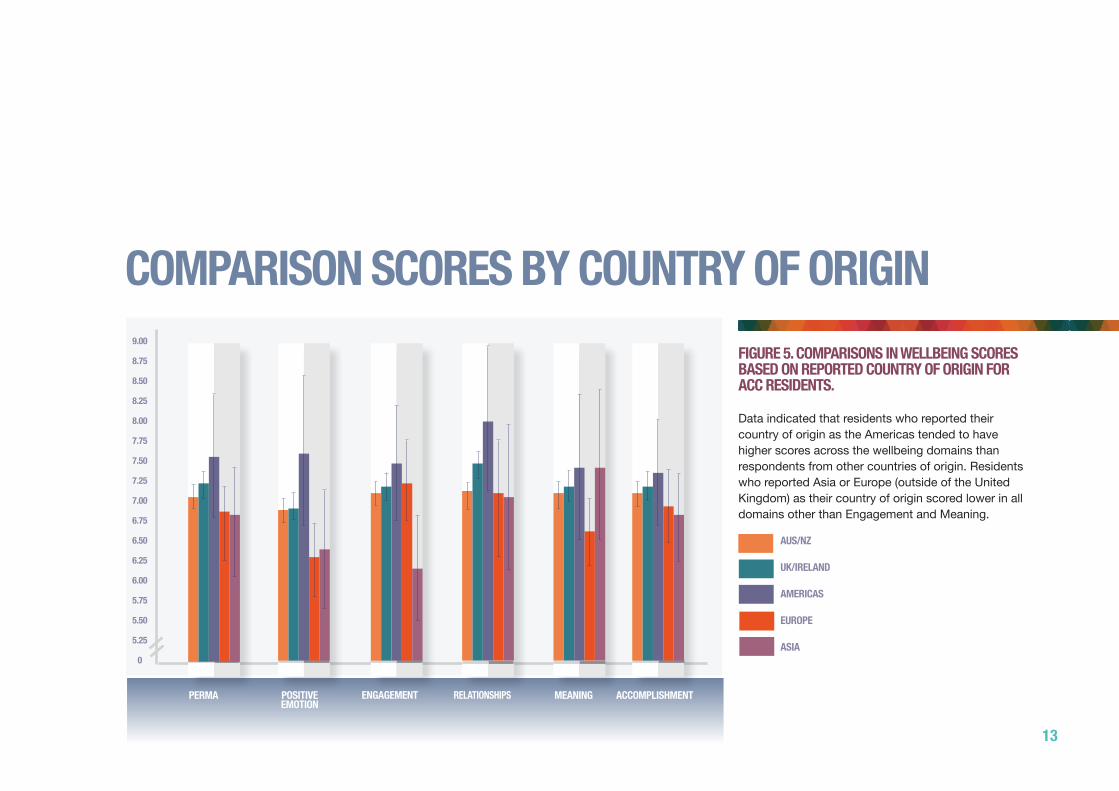
FIGURE 5. COMPARISONS IN WELLBEING SCORES BASED ON REPORTED COUNTRY OF ORIGIN FOR ACC RESIDENTS.
Data indicated that residents who reported their country of origin as the Americas tended to have higher scores across the wellbeing domains than respondents from other countries of origin. Residents who reported Asia or Europe (outside of the United Kingdom) as their country of origin scored lower in all domains other than Engagement and Meaning.
COMPARISON SCORES BY COUNTRY OF ORIGIN9.00
8.75
8.50
8.25
8.00
7.75
7.50
7.25
7.00
6.75
6.50
6.25
6.00
5.75
5.50
5.25
0
AUS/NZ
UK/IRELAND
AMERICAS
EUROPE
ASIA
ACCOMPLISHMENTMEANINGRELATIONSHIPSENGAGEMENTPOSITIVEEMOTION
PERMA
14
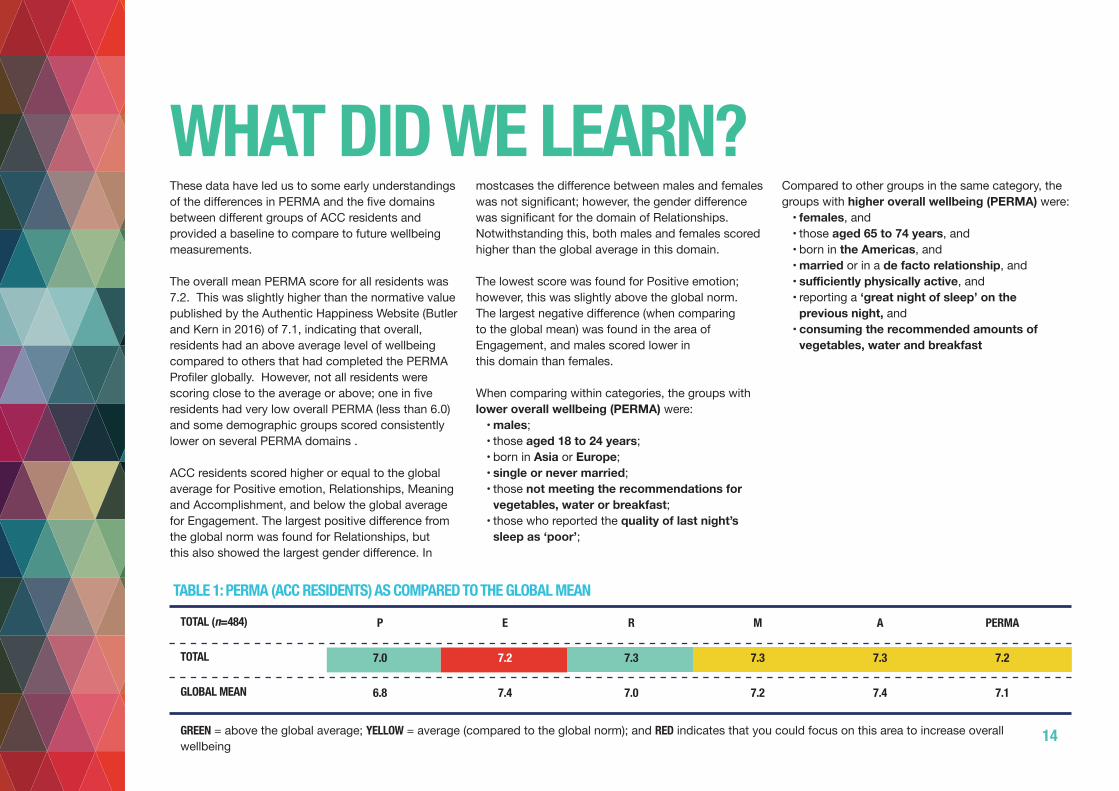
These data have led us to some early understandings of the differences in PERMA and the five domains between different groups of ACC residents and provided a baseline to compare to future wellbeing measurements.
The overall mean PERMA score for all residents was 7.2. This was slightly higher than the normative value published by the Authentic Happiness Website (Butler and Kern in 2016) of 7.1, indicating that overall, residents had an above average level of wellbeing compared to others that had completed the PERMA Profiler globally. However, not all residents were scoring close to the average or above; one in five residents had very low overall PERMA (less than 6.0) and some demographic groups scored consistently lower on several PERMA domains .
ACC residents scored higher or equal to the global average for Positive emotion, Relationships, Meaning and Accomplishment, and below the global average for Engagement. The largest positive difference from the global norm was found for Relationships, but this also showed the largest gender difference. In
mostcases the difference between males and females was not significant; however, the gender difference was significant for the domain of Relationships. Notwithstanding this, both males and females scored higher than the global average in this domain. The lowest score was found for Positive emotion;however, this was slightly above the global norm.The largest negative difference (when comparingto the global mean) was found in the area ofEngagement, and males scored lower inthis domain than females.
When comparing within categories, the groups with lower overall wellbeing (PERMA) were: • males; • those aged 18 to 24 years; • born in Asia or Europe; • single or never married; • those not meeting the recommendations for vegetables, water or breakfast; • those who reported the quality of last night’s sleep as ‘poor’;
Compared to other groups in the same category, the groups with higher overall wellbeing (PERMA) were: • females, and • those aged 65 to 74 years, and • born in the Americas, and • married or in a de facto relationship, and • sufficiently physically active, and • reporting a ‘great night of sleep’ on the previous night, and • consuming the recommended amounts of vegetables, water and breakfast
WHAT DID WE LEARN?
TOTAL (n=484)
TOTAL
GLOBAL MEAN
P E R M A PERMA
7.0 7.2 7.3 7.3 7.3 7.2
6.8 7.4 7.0 7.2 7.4 7.1
GREEN = above the global average; YELLOW = average (compared to the global norm); and RED indicates that you could focus on this area to increase overall wellbeing
TABLE 1: PERMA (ACC RESIDENTS) AS COMPARED TO THE GLOBAL MEAN
PHYSICAL HEALTH AND WELLBEING ARE INTRINSICALLY LINKED
These data support the importance of physical activity, sleep and adequate nutrition on subjective wellbeing indicating that PERMA is positively affected by meeting recommendations for level of physical activity, nutritional intake, and quality of sleep per night.
Those who reported undertaking sufficient physical activity, as recommended by Australia’s physical activity and sedentary behaviour guidelines (Commonwealth of Australia 2014), scored higher on each PERMA domain and overall wellbeing, compared with those who undertook some, or no, physical activity. Additionally, those reporting that their physical activity level was ‘a bit or a lot more than usual’ over the last week, had the highest overall PERMA, and domain, scores.
PERMA SCORES WERE ALSO IMPACTED BY SLEEP QUALITY
While the mean hours of sleep per night for residents was just under the recommended 7 to 9 hours (6.91 hours) just under 70% of people (69.3%) met these recommendations.
This resulted in the remaining 30% returning a PERMA score of 6.9 as compared to 7.4 (for those meeting the sleep recommendations). Additionally, there was a clear gradient from lowest to highest PERMA score, moving from those reporting a ‘poor night of sleep’ (6.3) to those reporting having a ‘great night of sleep’ (7.8).
CONSUMPTION OF THE RECOMMENDED SERVES OF VEGETABLES, WATER AND BREAKFAST IS ASSOCIATED WITH HIGHER PERMA
Almost three out of four residents met the recommendations for eating breakfast at least five times per week (74.6%), although, those meeting the recommended daily consumption of fruits and vegetables was only to 50.3% and 19.3% respectively.
These results compare to the overall state population where 10.7% consume the recommended serves of vegetables per day and 46.7% consume the recommended serves of fruit.
Data indicated that consuming the recommended serves of vegetables and water per day, and having breakfast between five and seven times a week, was also more likely to be associated with higher PERMA scores.
ACC results by gender show that females were more likely than males to meet the nutritional guidelines for fruit and vegetable intake, and having breakfast at least five times a week. In addition, those 55 years and over were also more likely to consume the recommended serves of fruit and vegetables and eat breakfast at least five times per week, however, were less likely to drink the recommended 8-15 glasses of water per day. Those in the younger age group (18 to 34 years) were more likely drink the recommended glasses of water per day, compared to the other groups.
THE PLUS + ELEMENTS
15
16
REFERENCESButler, J. & Kern, M. L. (2015). The PERMA-Profiler: A brief multidimensional measure of flourishing. Available from http://www.peggykern.org/questionnaires.htmlCommonwealth of Australia. (2014). “Australia’s physical activity and sedentary behaviour guidelines: Adults.” Make your move - Sit less Be active for life!Diener, E. and M. Y. Chan (2011). “Happy People Live Longer: Subjective Well-Being Contributes to Health and Longevity.” Applied Psychology: Health and Wellbeing 3: 1-43.
DoHA (2013). National Mental Health Report 2013: tracking progress of mental health reform in Australia 1993 – 2011. Canberra, ACT, Department of Health and Ageing.Howell, R. T., M. L. Kern and S. Lyubomirsky (2007). “Health benefits: Meta-analytically determining the impact of well-being on objective health outcomes.” Health Psychology Review 1(83-136).Seligman, M. (2013). Building the State of Wellbeing: A Summary of Progress. Adelaide., Government of South Australia.
Smith, B. W., J. Dalen, K. Wiggins, E. Tooley, P. Christopher and J. Bernard (2008). “The brief resilience scale: Assessing the ability to bounce back.” International Journal of Behavioral Medicine 15(3): 194-200.Taylor, A. W. and E. Dal Grande (2008). “Chronic disease and risk factor surveillance using the SA Monitoring and Surveillance System (SAMSS)-history, results and future challenges.” Public Health Bulletin 3(5): 17-21.
* SEM denotes the Standard Error of the Mean. Error bars for all other figures denote the 95% confidence interval of the groups’ mean score; that is, the variation in values that we would expect to get if we measured an entire population. The 95% confidence interval around the mean indicates that if a random sample was repeatedly studied, 95% of the time, the true mean will fall within the confidence interval. Thus, the error bars can be used to visually show where differences are significant and non-significant. Where there is no crossing of the bars between the groups being compared (i.e. the columns on the graphs) it is very likely that there will be significant differences in the mean scores for those variables.
CONCLUSIONThese data have led us to some early understandings of the differences in PERMA and the five domains between different groups of ACC residents and provided a baseline to compare to future wellbeing measurements.
Across all the areas of wellbeing some definite trends emerged. Those aged 65 to 74 years consistently returned higher scores than the average for the group, while those 18 to 24 scored lower than the average for all domains. Females were consistently scoring higher than males across all domains and additional health indicators, other than for Happiness where
there was no difference between genders and for resilience where males scored higher than females. In all other domains (except Engagement), even with the variation between genders, all residents scored above or equal to the global mean scores.