Embed Size (px)
Citation preview
The Value of TOU Tariffs in Great Britain: Insights for Decision-makers
Volume I: Final Report
PREPARED FOR
PREPARED BY
The Brattle Group
Ryan Hledik
Will Gorman
Nicole Irwin
University College London (UCL)
Michael Fell
Moira Nicolson
Gesche Huebner
July 2017

This report was prepared for Citizens Advice by The Brattle Group and University College
London (UCL). All results and any errors are the responsibility of The Brattle Group and UCL
and do not represent the opinion of their clients.
Acknowledgements: We would like to acknowledge the valuable project management and
conceptual contributions of Simon Moore, Clare Silcock, and Morgan Wild of Citizens
Advice. We are also grateful to several industry stakeholders for generously taking the time to
speak with us about this important issue. Finally, we are highly appreciative of Brattle
colleague Serena Hesmondhalgh for her critical contributions to the power systems modeling
described in this report, and to Ahmad Faruqui and Neil Lessem for peer review.
Please direct inquiries to:
Citizens Advice: Morgan Wild, [email protected]
The Brattle Group: Ryan Hledik, [email protected]
UCL: Mike Fell, [email protected]

ii | brattle.com
Table of Contents
Glossary of Acronyms ............................................................................................................................ i
Executive Summary .............................................................................................................................. ii
Introduction ................................................................................................................................. ii
Methodology ................................................................................................................................ ii
The Value of TOU Tariffs .......................................................................................................... iii
The Consumer Appeal of TOU Tariffs ...................................................................................... iv
Recommendations ...................................................................................................................... vi
I. Introduction ................................................................................................................................. 1
Unique Study Features ................................................................................................................ 2
Important Considerations ........................................................................................................... 3
Organization of the Report ......................................................................................................... 4
II. TOU Valuation Methodology ..................................................................................................... 5
Overview ...................................................................................................................................... 5
Determinants of TOU System Value .......................................................................................... 6
Market Scenarios ......................................................................................................................... 7
Avoided Costs .............................................................................................................................. 9
TOU Tariff Designs ................................................................................................................... 16
Enrolment Rates and Per-Participant Impacts ........................................................................ 17
III. The Value of TOU Tariffs ......................................................................................................... 20
Twelve Key Findings ................................................................................................................. 20
Summary .................................................................................................................................... 31
Putting the Results Into Context .............................................................................................. 32
IV. Consumer Acceptance of TOU Tariffs: An Evidence Review ................................................ 35
Consumer Attractiveness of TOU Tariffs ................................................................................. 35
Consumer Satisfaction with TOU Tariffs ................................................................................. 38
Customer Responsiveness to TOU Tariffs ................................................................................ 40
V. TOU Marketing Considerations: Primary Market Research .................................................. 44
Introduction ............................................................................................................................... 44
Tariff Design .............................................................................................................................. 44
Marketing ................................................................................................................................... 46
Critical Peak Rebates ................................................................................................................. 48
Direct Load Control ................................................................................................................... 49
TOU Tariffs and Trust ............................................................................................................... 50
VI. Conclusions and Recommendations ......................................................................................... 52
References and Additional Resources ................................................................................................ 57
i | brattle.com
Glossary of Acronyms
BAM Brattle Annual Model
BEIS Department for Business, Energy & Industrial Strategy
CBT Irish Consumer Behaviour Trial
CLNR Customer Led Network Revolution
CONE Cost of New Entry
CPP Critical Peak Pricing
CPR Critical Peak Rebate
DNO Distribution Network Operator
EV Electric Vehicle
GB Great Britain
HP Heat Pump
iTOU Inverted Time-of-Use
LCL Low Carbon London
NPV Net Present Value
PRISM Price Impact Simulation Model
RTP Real-time Pricing
TOU Time-of-Use
UCL University College London
WPD Western Power Distribution

ii | brattle.com
Executive Summary INTRODUCTION New developments are changing the way households consume electricity in Great Britain
(GB). A market for smart home appliances is emerging, electric vehicles (EVs) are expected
to become more prevalent, and a nationwide rollout of smart meters is underway. Retail
tariff structures may also evolve as part of this trend. A possibility that is receiving particular
interest is the provision of time-of-use (TOU) retail tariffs to domestic customers.
TOU tariffs more accurately reflect the time-varying nature of electricity costs than current
tariff offerings. Rather than charging customers a flat price regardless of when electricity is
consumed, prices in TOU tariffs vary by time of day. The price signal can be static (i.e., the
same every day) or dynamic (i.e., changing in response to system conditions).
The price signal in TOU tariffs gives customers an incentive to shift their electricity
consumption to lower-priced hours, providing bill savings opportunities and an associated
potential reduction in overall power system costs. TOU tariffs are also often discussed as an
important enabler of the adoption of new home automation technologies.
While some prior studies have quantified the potential value of TOU tariffs to the power
system, and other studies have explored the value of TOU tariffs to consumers, there has been
little research that has systematically combined these considerations into a comprehensive
view of the overall value of TOU tariffs. To fill that research void, Citizens Advice
commissioned The Brattle Group and University College London (UCL) to conduct a study on
TOU value. This study addresses two key topics: (1) quantifying the system value of TOU
tariffs in GB and assessing the market conditions under which that value will materialise, and
(2) exploring consumer preferences for TOU tariffs.
METHODOLOGY There are several novel features of the study design:
Our assumptions about customer enrolment and price responsiveness are informed by a
comprehensive evidence review and additional primary market research. Enrolment
assumptions are based on a “rapid review” which drew on an initial pool of more than 4,000
studies to identify the existing research on the consumer appeal of TOU tariffs. Price
response assumptions are derived from a review of the results of more than 40 domestic
pricing field trials and over 20 meta-studies on consumer price response. To supplement this
review, we surveyed 3,000 domestic energy bill-payers in GB to assess preferences for TOU
tariffs in further detail.
System benefits are quantified through detailed modelling of the drivers of marginal costs and
the ability of TOU tariffs to avoid those costs. We utilized a sub-hourly power generation
dispatch model to capture the energy market dynamics that are driven by different demand
and supply scenarios (e.g., growth in adoption of renewables or electrification of heating and
transportation). The ability of TOU tariffs to provide capacity value was modelled in a way
iii | brattle.com
that accurately accounts for operational constraints associated with the tariffs (e.g., a fixed
window of peak hours). TOU value was assessed under four different plausible future market
scenarios: Current Trends, High Renewables, Electrification, and Electrification with
Automation.
The analysis includes conventional and emerging TOU tariff designs. We analysed a range of
tariff designs, including conventional options, such as static TOU and critical peak pricing
(CPP) as well as emerging options such as critical peak rebates (CPR), inverted static TOU
tariffs (iTOU), and a half-hourly Smart Home Rate (SHR). We explore the potential value
associated with both opt-in and opt-out TOU offerings.
The methodological framing and assumptions are informed by interviews with key industry
stakeholders. To account for a diverse range of perspectives on the issue of TOU value, we
conducted phone and in-person interviews with Ofgem, distribution network operators
(DNOs), suppliers, academics, and demand response aggregators.
THE VALUE OF TOU TARIFFS Under future market conditions that are similar to those that exist today, we estimate annual
savings of opt-in TOU offerings to be around £20 to £25 million/year. This equates to roughly
£1 per GB household per year. If those savings were captured entirely by participants, with a
nationwide participation rate of around 20%, the savings to participants would be roughly £5
per household per year. By comparison, the typical domestic customer’s annual electricity
bill in GB is between £500 and £600 per year. For reasons discussed in Section III of the
report, similar results were observed for a market scenario with significantly higher adoption
of renewable generation.
It is important to note that these savings estimates are associated only with load shifting.
Savings estimates will vary by participant depending on the participant’s size and degree of
price responsiveness. Additionally, it is the case that the portion of the population with a
flatter-than-average load profile would see additional bill savings from these tariffs, by virtue
of enrolling in a tariff that better accounts for the lower costs that they impose on the power
system. Further, these estimates do not reflect the non-monetary or difficult-to-quantify
benefits of TOU tariffs discussed throughout this report.
In a system with increased capacity costs, electrified heat and transport, and/or adoption of
smart home appliances, our estimates of TOU value are roughly in the range of £150 to £250
million/year. Achieving savings of this magnitude would likely require higher capacity prices
(e.g., driven by electrification of heating and transport), adoption of automating technologies,
and/or opt-out deployment of TOU tariffs. These aggregate savings amount to roughly
between £5 and £10 in savings per year per GB household. In the specific instance where the

iv | brattle.com
benefits are being driven by a relatively small share of customers with automating
technologies, savings per participant could be between around £30 and £90 per year.1
A summary of the TOU system value estimates for each tariff design and market scenario is
presented in Table ES-1. Twelve key insights related to the value of TOU tariffs are
summarized in Section III of the report.
Table ES-1: TOU System Value (£ million/year)
THE CONSUMER APPEAL OF TOU TARIFFS
The evidence review conducted in this study identified a number of important insights
regarding the appeal of TOU tariffs to consumers, as summarized in Table ES-2.
1 This is based on a relatively simple algorithm to simulate automated price response. A more
detailed assessment of the price responsiveness of a fully-equipped “smart home” would be a
valuable extension of this research. Some automated appliances could also potentially provide
ancillary services, a benefit which is not captured in this analysis.
Current
Trends
High
RenewablesElectrification
Electrification
with
Automation
Static TOU (opt‐in)£19 £20 £54 £103
CPR (opt‐in)£22 £25 £76 £126
CPP (opt‐in)£24 £27 £81 £131
SHR (opt‐in)£3 £3 £10 £272
iTOU (opt‐in)N/A £4 N/A N/A
Static TOU (opt‐out)£47 £48 £131 £183
CPR (opt‐out)£40 £45 £137 £190

v | brattle.com
Table ES-2: Factors Associated with Customer Uptake of TOU Tariffs
Factor Key takeaways Strength of findings
Recruitment method (opt‐in versus opt‐out)
Biggest driver of differences across reviewed studies. 83% average enrolment with opt‐out versus 26% with opt‐in. On average, customers who are enrolled on TOU tariffs through opt‐out policies reduce their peak electricity consumption by less than those who actively opt‐in. However, aggregate peak reductions under an opt‐out policy will likely be higher than opt‐in due to higher opt‐out enrolment rates.
High
Financial incentive (e.g. gift card)
Statistically significant impact in comparison across studies, with 35% enrolling when offered incentive versus 20% enrolling when not offered
High
Tariff type Static TOU (35% average uptake) is more popular than dynamic, particularly hourly RTP (18%). Limited data makes it difficult to detect significant differences in uptake across individual tariff designs like CPP, CPR, etc.
Moderate
Automation Comparison across studies finds no statistically significant difference in uptake associated with automating technologies. However, individual studies that have tested this experimentally find that automation increases uptake, possibly to a greater extent for dynamic tariffs than static TOU.
Moderate
Bill protection Comparison across studies finds higher uptake with bill protection (35%) than without (27%) though the difference is not statistically significant. However, one survey study from Australia which tested the impact of bill protection experimentally (assigned participants to the same tariff but randomly varied whether it was accompanied with bill protection) found that bill protection had a modest positive impact on uptake.
Moderate
Messaging (e.g. “sign up to save money”)
There is limited research on this issue since most studies emphasise the potential financial savings, making it hard to find a control for comparison. Results, where available, are largely conflicting though suggest a modest effect from promoting environmental benefits.
Inconclusive
Type of customer (e.g. low income, region)
This was not included in the analysis because the reviewed studies did not break down uptake by participant or customer type. Two survey studies which tested this explicitly found no correlation between various socio‐economic and demographic factors and willingness to switch to a TOU tariff.
Inconclusive
Additionally, through the review of TOU studies we found that customers who enrolled in
TOU tariffs largely have had a positive experience. About four out of five customers expressed
satisfaction with their TOU tariff, and similar numbers would participate again or
recommend the tariff to others. This suggests that initial skepticism regarding TOU tariffs
may eventually be overcome as customers gain experience with the tariffs.
The TOU study review also found that field trials and full scale deployments across the globe
have consistently detected customer response to the TOU price signals in the form of peak
demand reductions. Trials in GB and Ireland are at the mid- to lower-end of the range and
have typically included up to 10% average peak demand reduction across tariff offerings.
The evidence review also identified a number of gaps in the industry’s understanding of key
issues related to consumer preferences for TOU tariffs. Primary market research conducted

vi | brattle.com
in this study was designed to address these research gaps. Highlights of the primary market
research findings include:
On average, roughly one-quarter (26%) of customers indicate that they would switch
to a TOU tariff. This is generally higher than the expectations of several stakeholders
with whom we spoke in the context of this study.
Research on the relative differences in likely uptake across individual TOU tariff
designs detects little difference. This is a somewhat surprising finding, given
potentially significant different value propositions that the tariffs present to
customers. This finding should be explored further through alternative forms of
market research (e.g., focus groups).
Age is related to the likelihood that a customer will enrol in a TOU tariff, with
younger consumers being more likely to sign up than those older than 65.
Our results hint that offering TOU tariffs could have negative implications for trust in
the electricity supply industry, although this effect is small. Our findings also suggest
that trusted non-governmental organizations could be best placed to mitigate such
concern.
Tailored messaging was effective at boosting demand for a static TOU amongst EV
owners (a group that is potentially more likely to save money on TOU tariffs).
Additionally, the perceived opportunity to save money on the tariff and “ease of use”
both contribute to an increased likelihood of uptake. If suppliers could design and
market TOU tariffs suited to the lifestyles or consumption patterns of particular
consumer groups, this may provide a potential avenue for increasing uptake to TOU
tariffs whilst helping consumers to beneficially switch to tariffs that will save them
money.
RECOMMENDATIONS The findings of this study lead to a number of recommendations for policymakers, network
operators, suppliers, and other industry stakeholders that are exploring the possibility of a
transition to TOU tariffs.
Focus on customer engagement and communication, as they will be critical considerations in
any tariff transition. The estimates of TOU value established in this study essentially scale
linearly with enrolment. At low levels of TOU enrolment, value will be very limited. But if
a significant number of domestic customers enrol in well-designed TOU tariffs in the future,
the benefits could be on the order of tens or hundreds of millions of pounds per year. It will
therefore be critical to explore innovative options for engaging with customers about the
potential benefits of the TOU tariffs, if they are offered in the future.
Take a holistic view of the value of TOU tariffs that extends beyond simple monetary value.
There is limited variation in value across the core TOU tariff designs (i.e., TOU, CPP, and
CPR). This similarity in system value estimates across the TOU options means that non-
monetary considerations (such as simplicity, ease-of-use, distributional bill impacts, and cost-
reflectivity), could be as or more important as monetary considerations in future TOU
deployment decisions.

vii | brattle.com
Give CPR tariffs serious consideration and test them through an opt-out field trial. CPR
tariffs have received relatively little attention as a tariff option in GB thus far. Their
customer-friendly design and proven impact on peak demand makes CPR tariffs a potentially
attractive candidate for cost-effectively tapping into the demand response potential of the
domestic sector. CPR tariffs could be particularly interesting to explore through a field trial
that is deployed on an opt-out basis, given the no-lose proposition the tariff presents for
participants.
Ensure charging and settlement processes facilitate the provision of economically efficient
TOU design. If suppliers are to be expected to offer TOU tariffs in the future, they will need
to have a financial incentive to do so. Current settlement processes and network charging
structures do not fully reward suppliers for cost savings associated with reductions in the peak
demand of their customers. Half-hourly settlement and network charges which accurately
reflect the time-varying nature of the cost of delivering power are necessary in this regard,
though the costs of improving the settlement and charging processes should be compared to
the benefits of doing so (work which is underway in part through Ofgem’s ongoing
Mandatory Half Hourly Settlement business case analysis).
In the near- to medium-term, TOU design should focus primarily on avoiding capacity costs.
In our analysis, across a range of market scenarios, avoided generation capacity cost drives the
bulk of TOU value. Exploring opportunities to avoid the capital costs associated with new
generation, transmission, and possibly distribution capacity is likely to continue to be more
productive than chasing energy value. Given the finding in this study that there is significant
interest in TOU tariffs among customers, it will also be important to consider the extent to
which future TOU tariff designs which appeal to customer preferences but do not produce
system benefits (e.g. through a peak period that does not align with the system peak) may
shift costs to non-participants.
Voluntary Smart Home Rate tariffs may help to solve the “chicken and egg” problem that is
perceived to limit the adoption of automating technologies. There is a perception among
some industry stakeholders that automating technologies will not achieve significant market
traction until there are granular retail price signals to which the technologies can respond. A
cost-based, voluntary SHR tariff could provide this opportunity.
Explore options available for making automating technologies accessible to low income
customers. This study has demonstrated that there is significant TOU tariff value to be
unlocked by automating technologies. Maximizing the net societal value of automating
technologies – and ensuring that there will not be negative distributional impacts associated
with their adoption – will likely require facilitating widespread uptake of the technology. As
such, it will be important to examine options that are available to extend these opportunities
to all types of customers and not just those with higher incomes.

1 | brattle.com
I. Introduction New developments are changing the way households consume electricity in Great Britain
(GB). A market for smart home appliances is emerging, electric vehicles (EVs) are expected
to become more prevalent, and a nationwide rollout of smart meters is underway. Retail
tariff structures may also evolve as part of this trend. A possibility that is receiving particular
interest is the provision of time-of-use (TOU) retail tariffs to domestic customers.
Time-of-use (TOU) tariffs more accurately reflect the time-varying nature of electricity costs
than current tariff offerings. Rather than charging customers a flat price regardless of when
electricity is consumed, prices in TOU tariffs vary by time of day. The price signal can be
static (i.e., the same every day) or dynamic (i.e., changing in response to system conditions).
The price signal in TOU tariffs gives customers an incentive to shift their electricity
consumption to lower-priced hours, providing bill savings opportunities and an associated
potential reduction in overall power system costs. TOU tariffs are also often discussed as an
important enabler of the adoption of new home automation technologies.
Some evidence already suggests that TOU tariffs are capable of delivering on this promise.
Field trials conducted in GB, Ireland, and to a much larger extent in other jurisdictions have
consistently found that consumers reduce peak demand in response to time-differentiated
price signals. In Europe, a large share of domestic customers in France, Italy, and Spain are
enrolled in TOU tariffs. In GB, roughly 13% of customers are enrolled in a TOU tariff known
as Economy 7 and suppliers have begun to introduce new tariffs with a time-varying
element.2,3 In parts of North America, the peak demand reductions from domestic TOU tariff
offerings are sold directly into the wholesale capacity market.4 These benefits are passed
through to consumers in the form of reduced electricity rates and direct incentive payments
for load reductions.
While there is some international experience with TOU tariffs, there is still significant
potential for increased uptake of new and innovative offerings. In the longer term, some
imagine that the use of TOU tariffs could extend beyond encouraging system peak demand
reductions to additionally facilitate around-the-clock balancing of supply and demand. These
2 While 13% of customers are enroled in the tariff, this number has been declining over the past
several years. The tariff was designed specifically for customers with thermal storage heating
systems. It is a static TOU design; only one of the many types of time-varying tariff designs
considered in this study. For further discussion of the Economy 7 tariff, see Citizens Advice,
“Take a Walk on the Demand-Side,” August 2014.
https://www.citizensadvice.org.uk/about-us/policy/policy-research-topics/energy-policy-research-
andconsultation-responses/energy-policy-research/take-a-walk-on-the-demand-side/
3 British Gas’s “HomeEnergy FreeTime” tariff and Green Energy UK’s “Time of Day Tariff” are two
examples. 4 In Pepco’s service territory, this is translating into $20 to $40 million per year in avoided capacity
costs. See Direct Testimony of Karen Lefkowitz Before the Maryland Public Service Commission,
April 2016.
2 | brattle.com
tariff designs could be in the form of sub-hourly real-time prices that reflect fluctuations in
supply from intermittent renewable generation resources, prices that vary across locations on
the distribution system to encourage more beneficial siting and operation of distributed
energy resources, or “inverted” TOU tariffs that encourage on-site electricity consumption
during daytime hours when rooftop solar PV systems would otherwise produce net excess
electricity.
In spite of growing interest in the value of full-scale TOU deployments in GB, there has been
relatively limited research to quantify the value of such an offering. While some prior studies
have quantified the potential value of TOU tariffs to the power system, and other studies have
explored the value of TOU tariffs to consumers, there has been little research that has
systematically combined these considerations into a comprehensive view of the overall value
of TOU tariffs. To fill that research void, Citizens Advice commissioned The Brattle Group
and University College London (UCL) to conduct a study on TOU value. Citizens Advice is
the statutory advocate for energy consumers. Part of its role is to provide perspective on
important emerging consumer issues. As such, this study addresses two key topics: (1)
quantifying the system value of TOU tariffs in GB, and (2) exploring consumer preferences
for TOU tariffs. Brattle led the assessment of the system value of TOU tariffs and UCL led the
research on consumer preferences.
UNIQUE STUDY FEATURES Our assumptions about customer enrolment and price responsiveness are informed by a
comprehensive evidence review and additional primary market research. To develop the
participation rate assumptions, we relied on a “rapid review” methodology which drew on an
initial pool of more than 4,000 studies to identify the existing research on the consumer
appeal of TOU tariffs. Development of price response assumptions included a review of more
than 20 meta-studies encompassing over 40 domestic pricing field trials with a focus on
consumer price response. To complement this research, we surveyed 3,000 domestic energy
bill-payers in GB to assess preferences for TOU tariffs in more detail. In contrast, prior
assessments of TOU tariff value have largely relied on illustrative assumptions about
participation rates and the share of “flexible load” that will respond to price.
System benefits are quantified through detailed modelling of both the drivers of marginal
costs and the ability of TOU tariffs to avoid those costs. We utilized a sub-hourly power
generation dispatch model to accurately capture the energy market dynamics that are driven
by different demand and supply scenarios (e.g., the impacts of an increase in market
penetration of renewables or an increase in electricity demand due to adoption of electric
vehicles and heat pumps). Further, the ability of TOU tariffs to provide capacity value was
modeled in a way that accurately accounts for operational constraints associated with the
tariffs (e.g., a fixed window of peak hours) rather than relying on commonly encountered
simplistic assumptions that linearly relate demand reductions to cost savings.
The analysis includes both conventional and emerging TOU tariff designs. Tariff designs such
as static TOU and critical peak pricing (CPP) have already received interest in GB. Other
tariff designs are only beginning to become part of the conversation, including critical peak
3 | brattle.com
rebates (CPR), inverted static TOU tariffs (iTOU), and a half-hourly Smart Home Rate (SHR).
Our study analyses each of these tariff designs (further descriptions are provided in Section
II). We also explore the potential value associated with an opt-out TOU offering.
The methodological framing and assumptions are informed by interviews with key industry
stakeholders. To account for a diverse range of perspectives on this issue, we conducted
phone and in-person interviews with Ofgem, DNOs, suppliers, academics, and demand
response aggregators.5
IMPORTANT CONSIDERATIONS It is important to clarify the terminology being used in this report. In GB, it is common for
the term “TOU” to broadly refer to time-varying tariffs of all types, including both static and
dynamic pricing options. Alternatively, the term “static TOU” commonly refers to a specific
type of tariff design that has pre-defined peak and off-peak prices which do not change on a
dynamic basis. Thus, CPP, CPR, and static TOU tariff designs are all different types of TOU
tariffs. While this terminology is fairly GB-specific and different than in other jurisdictions,
it has been adopted for this report.
Estimates of value are reported for the year 2030 (in real 2016 GBP). It is expected that smart
meters will have been deployed across GB by that time, leaving enough time for metering and
settlement barriers to be removed and for suppliers to develop full-scale TOU offerings. But
there is considerable uncertainty associated with such projections of the future. We have
analysed a number of scenarios to account for a range of potential future states of the GB
energy market, though it is important to acknowledge this inherent uncertainty.
Under the current regulatory framework, whether or not TOU tariffs are offered in the future
will depend on if they are offered by competitive retail suppliers; there is no regulatory
mandate to do so. Our analysis does not account for the likelihood that suppliers choose to
offer TOU tariffs in the future. Rather, we assume that, in the future, the tariffs are being
offered widely to consumers, and develop realistic enrolment rates that are consistent with
that assumption. Participation rates are based on empirical research and well-subscribed
international tariff offerings.
Finally, it is worth noting that this study focuses exclusively on retail electricity tariffs for
domestic customers. We do not analyse tariffs for the natural gas sector or non-domestic
customers. Further, we do not assess the costs and benefits of a broader range of pricing
options that are not time-varying (e.g., fixed bill, pre-payment, inclining block tariffs) nor do
we consider the broader range of non-price based demand-side response options.
5 See Appendix A for further details.

4 | brattle.com
ORGANIZATION OF THE REPORT The remainder of this report is organized as follows: Section II discusses the methodological
framework for assessing the value of TOU tariffs. Section III summarises 12 key findings from
the TOU value assessment that are important considerations for decision-makers. Section IV
presents a review of the international literature on customer acceptance of TOU tariffs.
Section V summarises new primary market research conducted specifically for this study on
consumer preferences for TOU tariffs. Section VI concludes the report with policy
recommendations based on the findings of this study.
5 | brattle.com
II. TOU Valuation Methodology OVERVIEW The focus of this study is on the system value of TOU tariffs (also sometimes referred to as
“societal value”). Specifically, we quantify the total power system costs that could be avoided
when customers respond to the introduction of time-varying price signals. The result is an
estimate of the total monetary savings that could be achieved through a TOU tariff offering.
How these benefits are shared among stakeholders such as customers, suppliers, and grid
operators would depend on how the tariff is designed and rolled out.
The approach to quantifying TOU value in this study involves four steps. This approach is
derived from widely-used industry practices for valuing demand-side resources.6
The first step is to identify the costs that can potentially be avoided as customers change their
consumption patterns in response to TOU tariffs (e.g., generation capacity costs, energy
costs). These are referred to as “marginal costs.” Marginal costs vary depending on supply
and demand conditions in the energy market. We have relied on a review of historical cost
data and a detailed production cost model (known as the Brattle Annual Model, or “BAM”) to
develop these marginal cost estimates.7
The second step is to define the TOU tariff designs being analysed. This involves first
allocating marginal costs to hours of the year in a manner that is proportional to the drivers of
those costs (i.e., allocating peak-capacity related costs to peak load hours). The resulting
aggregate hourly price profile is used to define the pricing periods in each TOU tariff and to
establish the relationship between peak and off-peak prices in the retail tariff.
The third step is to simulate customer response to the new TOU tariffs. We have established
estimates of price responsiveness based on an international literature review. A suite of tools
for modelling customer price response known as “PRISM” was used to calibrate the estimates
of price response to TOU tariffs with various peak-to-off-peak price ratios assumed for this
study.8
The fourth step is to quantify the aggregate system value of TOU tariffs. This begins with the
development of achievable enrolment assumptions, based on a literature review and
supplemented with primary market research. The enrolment rates are combined with the
estimates of per-participant impacts developed in the third step (above) to establish aggregate
6 For further discussion, see Ryan Hledik and Ahmad Faruqui, “Valuing Demand Response:
International Best Practices, Case Studies, and Applications,” prepared for EnerNOC, January
2015.
http://www.brattle.com/system/publications/pdfs/000/005/343/original/Valuing_Demand_Respons
e_-_International_Best_Practices__Case_Studies__and_Applications.pdf?1468964700 7 For more information about BAM, see Appendix B. 8 For more information about PRISM, see Appendix C.

6 | brattle.com
changes in the system load shape. These changes in the half-hourly system load shape are
combined with the half-hourly aggregate cost profiles (developed in the first step) to estimate
the total change in system costs.
Figure 1 illustrates each step of the methodological framework. Detail behind each step is
discussed further in the remainder of this section.
Figure 1: TOU Valuation Methodology Overview
DETERMINANTS OF TOU SYSTEM VALUE Many factors determine the potential value of TOU tariffs to the power system. For instance,
the average peak demand reduction from TOU participants is one important factor driving
TOU value. The magnitude of the average participant’s peak demand reductions is a function
of the strength of the price signal in the TOU tariff (i.e. the peak-to-off-peak price ratio), the
price responsiveness of customers (i.e., “price elasticity”), the nature of the price signal in the
tariff (i.e., higher charge versus rebate), the tariff deployment method (opt-in versus opt-out),
and the market saturation of automating technology (e.g., smart thermostats).
The timing of the load reduction also impacts TOU value. This is determined by the number
of high priced events that are permissible under the tariff rules and the breadth and timing of
the peak period window (e.g. 4 pm to 8 pm, 3 pm to 9 pm, etc.).
The participation rate is also a key driver of TOU value. Enrolment is a function of the bill
savings opportunity the TOU tariff presents to customers, the appeal of the design of the TOU
tariff, the effectiveness with which it is communicated to customers, and the extent to which
customers have experience with the tariff and/or have been educated about its implications.
Define market scenarios
Run BAM to establish energy & capacity prices
Establish peak‐driven
T&D capacity costs
Review network cost
projections
Allocate avoidable costs to half‐hourly intervals based on loss of load probability
Establish peak period of TOU
tariffs to capture
highest costs
Define TOU tariff designs
and associated constraints
Use PRISM to simulate average customer response to new tariff
Establish price elasticity and technology assumptions
Develop participation
rate assumptions
Estimate aggregate system impact of
TOU response
Review literature on customer
enrolment in TOU tariffs
Conduct primary market research on consumer
preferences for TOU tariffs
Combine with half‐hourly
cost profile to quantify total avoided cost
Determine avoidable costs
Define TOU tariff designs
Simulate price response
Quantify aggregate system value
1
2
3
4

7 | brattle.com
The magnitude and timing of marginal costs are also critical factors to determining TOU
value. Avoided capacity costs, for instance, will be determined by the urgency of the need for
new capacity and the alignment (or “coincidence”) of various capacity cost drivers with the
timing of load reductions. Avoided energy costs will be a function of the load shape and the
mix of generation resources, which determine a marginal generation costs profile (largely fuel
costs).
The methodological approach used in this study accounts for this array of considerations.
MARKET SCENARIOS The future state of the UK power sector is uncertain. Four illustrative scenarios were
developed to account for this uncertainty.9 The definition of the four scenarios is informed
by conversations with industry stakeholders and reference to National Grid’s Future Energy
Scenarios reports.10 All scenarios are developed for the year 2030. The scenarios span a range
of assumptions around the adoption of renewable generation, the electrification of heating
and transport, and the proliferation of smart home technologies which would automate
response to TOU tariffs. They are illustrative of plausible future conditions rather than a
prediction of what is likely to happen.
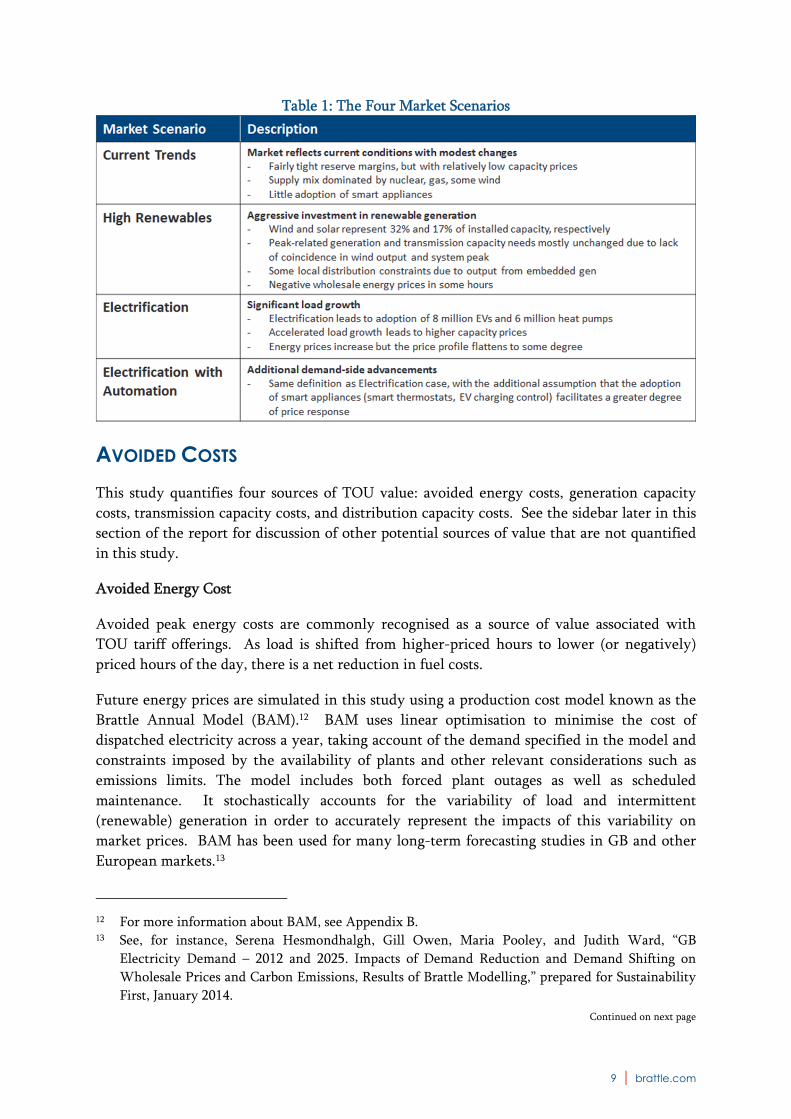
Current Trends Scenario
In the Current Trends scenario, the market reflects current conditions with the exception of a
few commonly expected future changes. Those changes include retirement of all remaining
coal generation capacity, a modest escalation of natural gas prices, and the addition of
renewable generation capacity (mostly wind).
The Current Trends scenario is characterised by reserve margins that continue to be fairly
tight (i.e., around 10%). In spite of the low reserve margin, capacity prices remain modest -
this is discussed further below. The supply mix is dominated by natural gas, renewables
(mostly wind and solar), and nuclear. We assume little future adoption of smart home
appliances and electric heating and transport in this scenario.
High Renewables Scenario
The High Renewables scenario builds off of the Current Trends case, with the only difference
being a significant increase in the market adoption of wind and solar generation. In the High
Renewables case, wind generation accounts for 32% of all installed capacity and solar PV
accounts for 17%. That is relative to future wind and solar capacity of 23% and 13%,
respectively, in the Current Trends case and only 14 and 10% today. In terms of the share of
9 For further information on the assumptions behind each scenario, see Appendix D. 10 2016 National Grid Future Energy Scenarios (FES). See website:
http://www2.nationalgrid.com/uk/industry-information/future-of-energy/future-energy-
scenarios/

8 | brattle.com
total 2030 electricity supply, the wind and solar share increases from 30% in the Current
Trends scenario to nearly 50% in the High Renewables scenario.
The High Renewables scenario is characterized by capacity prices that are similar to those in
the Current Trends scenario. While the High Renewables scenario includes a significant
amount of new wind and solar capacity, the output from those resources is relatively low
during the time of the system peak, thus providing limited capacity relief.11 Additional
transmission costs would be associated with connecting remotely-located generation to the
system rather than meeting peak demand related needs that are incremental to the Current
Trends case. Peak-related distribution costs are assumed to be unaffected in a similar manner,
though as is discussed later in this report there may be an opportunity to reduce distribution
capacity needs arising from constraints related to excess output from distributed generation.
Electrification Scenario
The Electrification case differs from the Current Trends case in that it assumes significant
load growth due to the adoption of electric vehicles (EVs) and electric heat pumps (HPs).
Specifically, we assume the addition of 8 million EVs (representing 27% market share) and 6
million HPs (22% market share). This leads to an increase in system peak demand of roughly
9 GW, or 16% relative to the Current Trends Scenario.
The Electrification scenario is characterised by higher capacity prices, as accelerated load
growth would increase the need for new capacity. This assumption applies not only at the
bulk system level, but also to the distribution system where an increase in domestic load
would likely increase the number of locations on the grid experiencing congestion.
Electrification with Automation Scenario
The Electrification with Automation scenario differs from the Electrification scenario only in
that it additionally assumes that customers have adopted technologies that automate load
reductions in response to TOU price signals. Specifically, we assume that of those customers
with a HP, half own a smart thermostat. Similarly, of the customers with an EV, half are
assumed to own some type of smart charging technology (which could range from a simple
timer to a charger than can remotely receive real-time signals to manage charging).
Among industry stakeholders, there generally tends to be a view that an acceleration of
renewables adoption is more likely to occur than widespread adoption of EVs and HPs.
Similarly, there seems to be an industry perception that electrification of transport is more
likely than electrification of heating. The extent to which these or other developments will
occur is, of course, highly uncertain and is the reason for analysing each of these scenarios. A
summary of the scenario descriptions is provided in Table 1.
11 The difference in capacity price in the High Renewables scenario relative to the Current Trends
scenario is attributable to lower energy profits that would be earned by the marginal generator in
the High Renewables scenario, thus necessitating a slightly higher capacity price to provide the
necessary financial incentive to keep the unit online.
9 | brattle.com
Table 1: The Four Market Scenarios
AVOIDED COSTS This study quantifies four sources of TOU value: avoided energy costs, generation capacity
costs, transmission capacity costs, and distribution capacity costs. See the sidebar later in this
section of the report for discussion of other potential sources of value that are not quantified
in this study.
Avoided Energy Cost
Avoided peak energy costs are commonly recognised as a source of value associated with
TOU tariff offerings. As load is shifted from higher-priced hours to lower (or negatively)
priced hours of the day, there is a net reduction in fuel costs.
Future energy prices are simulated in this study using a production cost model known as the
Brattle Annual Model (BAM).12 BAM uses linear optimisation to minimise the cost of
dispatched electricity across a year, taking account of the demand specified in the model and
constraints imposed by the availability of plants and other relevant considerations such as
emissions limits. The model includes both forced plant outages as well as scheduled
maintenance. It stochastically accounts for the variability of load and intermittent
(renewable) generation in order to accurately represent the impacts of this variability on
market prices. BAM has been used for many long-term forecasting studies in GB and other
European markets.13
12 For more information about BAM, see Appendix B. 13 See, for instance, Serena Hesmondhalgh, Gill Owen, Maria Pooley, and Judith Ward, “GB
Electricity Demand – 2012 and 2025. Impacts of Demand Reduction and Demand Shifting on
Wholesale Prices and Carbon Emissions, Results of Brattle Modelling,” prepared for Sustainability
First, January 2014.
Continued on next page
10 | brattle.com
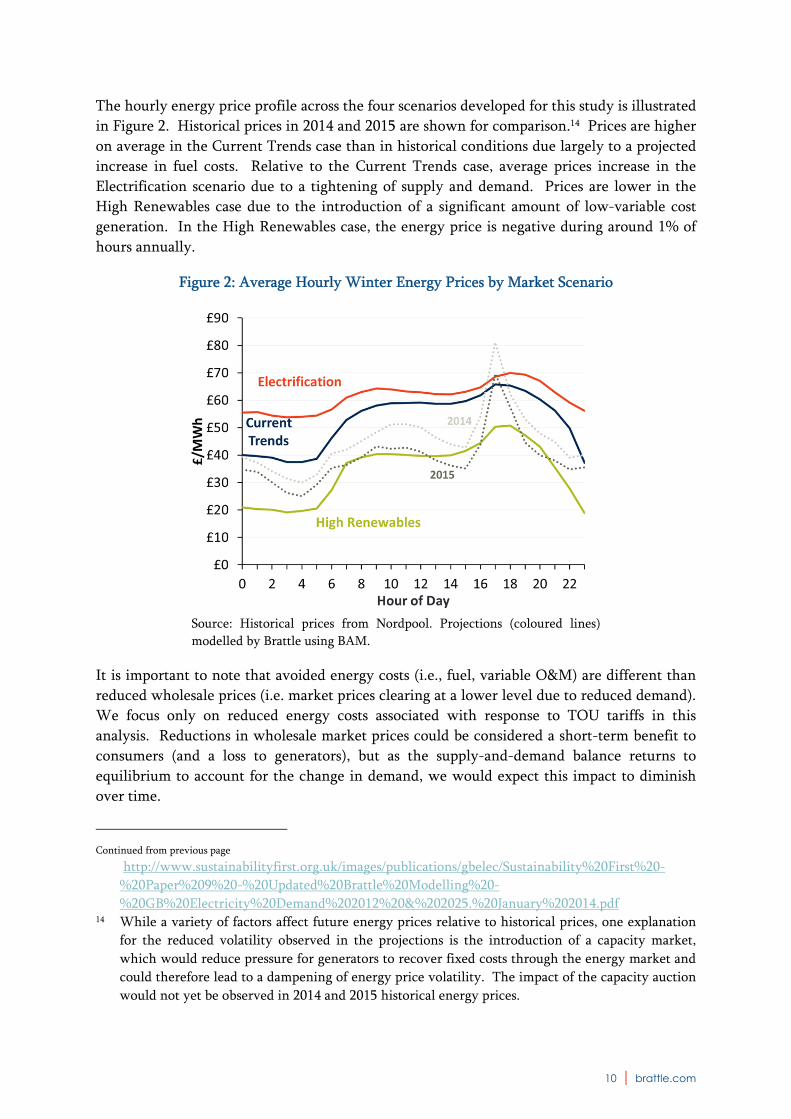
The hourly energy price profile across the four scenarios developed for this study is illustrated
in Figure 2. Historical prices in 2014 and 2015 are shown for comparison.14 Prices are higher
on average in the Current Trends case than in historical conditions due largely to a projected
increase in fuel costs. Relative to the Current Trends case, average prices increase in the
Electrification scenario due to a tightening of supply and demand. Prices are lower in the
High Renewables case due to the introduction of a significant amount of low-variable cost
generation. In the High Renewables case, the energy price is negative during around 1% of
hours annually.
Figure 2: Average Hourly Winter Energy Prices by Market Scenario
Source: Historical prices from Nordpool. Projections (coloured lines)
modelled by Brattle using BAM.
It is important to note that avoided energy costs (i.e., fuel, variable O&M) are different than
reduced wholesale prices (i.e. market prices clearing at a lower level due to reduced demand).
We focus only on reduced energy costs associated with response to TOU tariffs in this
analysis. Reductions in wholesale market prices could be considered a short-term benefit to
consumers (and a loss to generators), but as the supply-and-demand balance returns to
equilibrium to account for the change in demand, we would expect this impact to diminish
over time.
Continued from previous page
http://www.sustainabilityfirst.org.uk/images/publications/gbelec/Sustainability%20First%20-
%20Paper%209%20-%20Updated%20Brattle%20Modelling%20-
%20GB%20Electricity%20Demand%202012%20&%202025.%20January%202014.pdf 14 While a variety of factors affect future energy prices relative to historical prices, one explanation
for the reduced volatility observed in the projections is the introduction of a capacity market,
which would reduce pressure for generators to recover fixed costs through the energy market and
could therefore lead to a dampening of energy price volatility. The impact of the capacity auction
would not yet be observed in 2014 and 2015 historical energy prices.
11 | brattle.com
Avoided Generation Capacity Costs
Reductions in demand in response to peak prices in TOU tariffs can address reliability
concerns related to generation supply shortages and avoid or defer the need for investment in
new generation capacity. Avoided generation capacity costs have been the primary driver of
TOU system value in most international case studies.
In GB, prices in National Grid’s capacity auction have only ranged between £18 and
£22.50/kW-yr since its inception in 2014.15 These prices appear low in contrast to the
levelized cost of a peaking generation unit (which can sometimes be in excess of £100/kW-
yr). This is a particularly puzzling contrast given recent concerns about capacity shortages
and single-digit reserve margins.16
There are several theories to explain this perceived inconsistency between capacity need and
auction results. One is that the steep demand curve in the capacity auction results in
capacity prices that are very sensitive to minor changes in expected supply. Another
possibility is that current system conditions do not reflect the expected conditions in the
future years of the capacity auction (which is a four-year forward-looking auction). It is also
possible that the unexpected participation of small-scale embedded diesel generators
dampened prices; policy changes have the potential to reduce the amount of this type of
capacity that clears in the auction in the future. There is also the possibility that concerns
about supply shortages have been simply overblown and/or based on misinterpretation of
National Grid’s estimates of available reserves.
In the long-run, capacity prices should theoretically approach the net cost of new entry
(CONE), which in the UK market is estimated at £50/kW-year.17 To establish a reasonable
assumption for the Current Trends scenario, and in recognition of the currently low market
prices, we assume a value of £35/kW-year which is roughly the average of recent market
prices and net CONE. A similar assumption is used in the High Renewables scenario, with an
adjustment to account for the lower energy margins that would be earned by the marginal
unit due to lower energy prices. In the Electrification scenario, the marginal cost of
generation capacity is assumed to be the full net CONE value of £50/kW-year due to tighter
reserve margins and a greater need for new capacity, as discussed above.
Avoided Transmission Capacity Costs
Similar to generation capacity, transmission capacity could potentially be avoided through
peak demand reductions. Avoided transmission costs are sometimes, but not always, included
15 National Grid, “Provisional Capacity Market Results,” 2014-2016. 16 See, for instance, Kiran Stacey, “UK Turn to Diesel to meet Power Supply Crunch,” Financial
Times, November 3, 2015. 17 Capacity Market Auction Guidelines, National Grid, July 2016, pg. 5. Gross CONE is the total cost
of installing new marginal generation capacity. It is typically determined as a bottom-up
engineering estimate or through a survey of recent power plant additions, and ultimately vetted
through a public stakeholder process. Net CONE is gross CONE less the energy and ancillary
services profits that would be earned in the market by the marginal generation unit.
12 | brattle.com
in assessments of TOU value. This is partly because only a portion of transmission capacity
expenditures are driven by peak demand. Transmission is also built to address local
congestion issues or to access remotely located sources of renewable generation, neither of
which is necessarily related to system peak demand.
For the typical domestic customer, transmission costs represent only 5% of the total bill
(£25/year, or £26/kW-yr). A review of avoidable transmission costs in other regions suggests
a range of £10/kW-yr to £50/kW-yr. In the Current Trends and High Renewables scenarios,
we have assumed a marginal transmission capacity cost of £15/kW-yr, which is within this
range. The Electrification scenarios assume a marginal transmission cost of £20/kW-year to
better reflect the added stress that load growth would place on the transmission system.
Avoided Distribution Capacity Costs
Stress on the distribution system could potentially be lessened if the peak demand reductions
from TOU tariffs are coincident with the timing of local peaks on the distribution system.
The use of demand response and other distributed resources to reduce distribution costs is an
area of significant emerging interest among utilities, regulators, policymakers, and
stakeholders internationally. Regulatory initiatives in California and New York, for example,
have specifically directed utilities to identify locations on the distribution system where
capacity upgrades could be deferred through the use of demand response. The deferral of a
$1.2 billion substation upgrade in the Brooklyn area of New York through the use of
distributed resources is one commonly cited example.18
Conversations with DNOs suggest that similar efforts to identify these distribution upgrade
deferral opportunities are underway in GB. A prevailing view is that this will be best
achieved through targeted demand response programmes with fully automated load
reductions. Retail tariffs with prices that vary locally on the distribution system are
technically a possibility, though most stakeholders consider that possibility to be particularly
far beyond the industry’s current capabilities. One stakeholder suggested that GB’s Economy
7 tariff had historically led to significant deferrals in the need for distribution infrastructure,
though a specific study quantifying this impact could not be identified.
In this study, we have considered the possibility that TOU tariffs could lead to modest
incremental distribution capacity avoidance through a broad, average system-wide reduction
in peak demand. A review of the Low Carbon London field trial, in which UK Power
Networks explored distribution cost avoidance opportunities, and a review of Ofgem’s most
recent Price Control Review, suggests that peak-driven distribution costs could be up to
around £10/kW-year on average.19 This forms the basis for our assumption in the Current
Trends and High Renewables scenarios.
18 Robert Walton, “The non-wire alternative: ConEd’s Brooklyn-Queens pilot rejects traditional grid
upgrades,” Utility Dive, August 2016. 19 Distribution costs represent roughly 20% of the average customer’s bill (£100/yr, or £110/kW-yr),
but it appears that only 5% to 10% of this is directly related to load growth
13 | brattle.com
Marginal distribution capacity costs are assumed to be significantly higher in the
Electrification scenarios, at £30/kW-year. Significant adoption of heat pumps and EVs among
domestic customers has the potential to create local constraints due the possibility of
“clustered” adoption and the significant impact that these technologies can have on an
individual household’s peak demand (a single HP could increase the class-average domestic
customer’s peak by around 90%; an EV could increase it by around 30%). The £30/kW-year
assumption is within the range of marginal costs observed in other international jurisdictions.
It is important to note that these marginal distribution capacity cost assumptions are an
average across the system. Costs could be significantly higher in portions of the grid that are
constrained and lower (or zero) in areas where there is significant excess distribution
capacity. An assessment of the potential for distributed resources to avoid distribution costs is
highly system specific and, while the distribution assumptions in this study are a reasonable
starting point, this is an area of the analysis with considerable uncertainty and would
significantly benefit from further research.
Allocating Capacity Costs over Time
Capacity costs are allocated to hours of the year proportional to the likelihood that those
hours will drive the need for new capacity. This is a proxy for the reliability risk for
insufficient capacity that each hour represents. Capacity costs are allocated to the top 100
half-hourly load intervals of the year.20 The allocation is proportional to each interval’s share
of total load in the top 50 hours (i.e., more capacity cost is allocated to the top load hour than
the 50th).
This approach has the advantage of accurately accounting for the constraints that exist in a
TOU tariff offering, or any demand response offering for that matter. For instance, if the
peak period in a TOU tariff is from 4 pm to 8 pm and there is a 10% probability that the
system peak will occur outside this window, the capacity value of the TOU tariff is effectively
reduced by 10%. A similar implicit reduction accounts for the limited number of high-price
events that could be called in a dynamic pricing tariff.
Generation and transmission capacity costs are allocated to the 100 half-hourly increments
with the highest system load, reflecting the bulk system-level drivers of these costs.
Distribution capacity costs, on the other hand, are allocated proportional to peak domestic
load intervals rather than system load. This reflects the geographical clustering of different
customer types, and the fact that portions of the distribution system therefore commonly
serve one type of customer.
The allocation of capacity costs to hours of the day is illustrated in Figure 3. The highest costs
– including most of the capacity costs - are concentrated in the four-hour window of time
between 4 pm and 8 pm during the winter.
20 Capacity costs are allocated based on net load (i.e., load net of solar and wind generation). This
accounts for the impact that inflexible generation resources would have on system planning.

14 | brattle.com
Figure 3: Allocation of Marginal Costs Over Winter Days (Current Trends Scenario)
Under current conditions, the system peak and domestic class peak are relatively well
aligned, though there is some divergence in the Electrification scenarios. A summary of
capacity prices and load characteristics of each scenario is provided in Table 2.
Table 2: Market Scenario Cost and Load Characteristics
Current
Trends
High
RenewablesElectrification
Marginal costs (£/kW‐yr)
Generation capacity £35 £39 £50
Transmission capacity £15 £15 £20
Distribution capacity £10 £10 £30
Peak demand (GW) 55 54 64
Reserve margin 10% 10% 8%
Timing of system peak 5:00 PM 5:00 PM 6:00 PM
Timing of domestic peak 5:30 PM 5:30 PM 6:30 PM

15 | brattle.com
Sidebar: Non-quantified sources of potential TOU value
There are additional potential sources of value from TOU tariffs which are not quantified
in this analysis. These tend to be non-monetary, difficult to assign a monetary value, or
theoretically possible but largely unproven thus far in the context of TOU tariffs.
Ancillary services: It is theoretically possible to extend ancillary services price signals to
domestic retail customers, though thus far this is largely an unproven concept.
Reduced wholesale market prices: A reduction in demand during high-priced hours could
(temporarily) reduce wholesale market prices – a benefit to consumers.
Improved fairness in retail pricing: More cost-reflective tariffs would remove the large
subsidy from “flat load” customers to “peaky load” customers that is present in the current
tariff offerings.
Environmental benefits: If TOU tariffs reduce consumption or shift it to hours when
power plants with lower emissions rates are on the margin, this can potentially result in a
net environmental benefit. This will depend on the specific characteristics of the system in
which the time-varying rates are being offered. For most TOU tariffs, the environmental
impact is very modest due to a limited number of peak pricing events and limited change
in total electricity consumption.
Facilitating the adoption of distributed energy resources: TOU tariffs can improve the
economic attractiveness of certain types of distributed resources such as energy storage
and electric vehicles.
Reduced hedging costs: Suppliers must hedge against price and volume risk in order to
provide customers with a flat-price tariff. Shifting some of this risk to the customer in the
form of a time-varying price in a TOU tariff could warrant a lower average price for
participants in the tariff.
Conservation: Some studies have suggested that TOU pricing could lead to a net reduction
in overall energy consumption (e.g. by promoting adoption of energy efficient appliances).
That would, in particular, enhance energy cost savings. In this study, we have quantified
only the value of load shifting and have assumed no net change in total annual
consumption.
16 | brattle.com
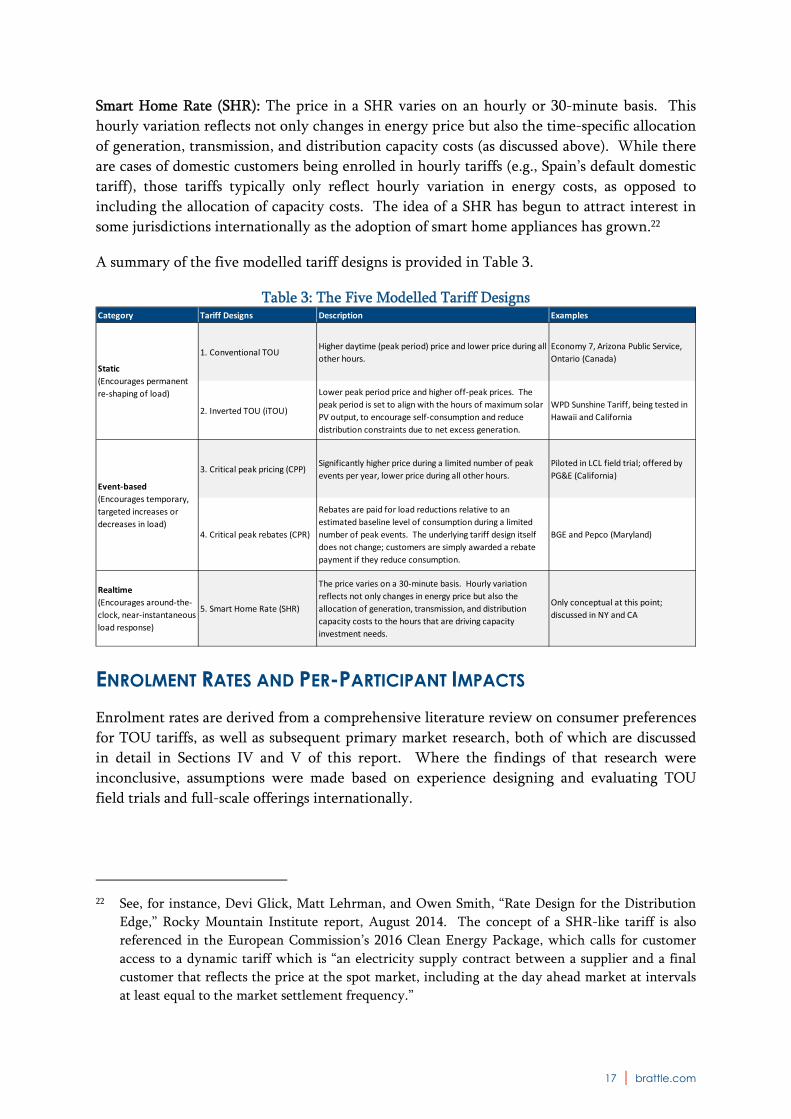
TOU TARIFF DESIGNS This study modelled five TOU tariff designs: Conventional static TOU, inverted static TOU
(iTOU), critical peak pricing (CPP), critical peak rebate (CPR), and a half-hourly “Smart
Home Rate” (SHR).
Each of the tariffs is designed to be revenue neutral for the domestic class as a whole. This
means that, in the absence of a change in customer load shape, each TOU tariff would collect
the same revenue from the domestic class as the current tariff offerings. This assumption
isolates the impact of the tariff design on customer behaviour, without also getting into the
separate issue of the impacts of an overall rate increase or decrease.
Static TOU: Static TOU tariffs charge customers a higher price during peak hours of the day
and a lower price during off-peak hours. The tariff is static in the sense that the price
schedule is known to customers and does not change. In this study, we have assumed that
the peak period applies from 4 pm to 8 pm on weekdays. Based on a review of tariff
deployments and GB marginal costs, the static TOU has a peak-to-off-peak price ratio of 2-to-
1 in the Current Trends and High Renewables scenarios, and 4-to-1 in the Electrification
scenarios. The ratio is higher in the Electrification scenarios due to higher capacity costs
being allocated to the peak period of the tariff.
Inverted TOU (iTOU): An iTOU charges lower prices during mid-day hours and higher
prices during other hours. The lower-priced period is set to align with the hours of maximum
solar PV output, to encourage self-consumption and reduce distribution constraints due to net
excess generation from distributed solar. This tariff design was tested recently with
customers in Western Power Distribution’s (WPD’s) service territory.21 We assumed an
iTOU design for this study that was similar in concept to the one tested by WPD. The peak
period of the rate analysed in our study is from 11 am to 3 pm during summer months only.
Critical peak pricing (CPP): CPP tariffs charge significantly higher peak period prices during
a limited number of peak events per year, and lower prices during all other hours. The peak
price signal is dynamic, with customers being notified of a peak price event one day in
advance. We have assumed that the tariff would include a limit of 15 peak price events per
year. The peak-to-off-peak price ratio is 6-to-1 in the Current Trends and High Renewables
scenarios and 10-to-1 in the Electrification scenarios, for the same reasons discussed above.
Critical Peak Rebate (CPR): A CPR is the “mirror image” of a CPP tariff. Rather than
charging a higher price during peak events, rebates are paid to customers for load reductions
relative to an estimated baseline consumption level. The underlying tariff design itself does
not change; customers are simply awarded a rebate payment if they reduce consumption. As
such the CPR effectively is a no-lose proposition for customers. The modelled number of
peak events and the implied price ratio in the CPR are the same as in the CPP tariff.
21 Final reports for the Sunshine Tariff Field Trial can be found on the RegenSW website:
https://www.regensw.co.uk/sunshine-tariff
17 | brattle.com
Smart Home Rate (SHR): The price in a SHR varies on an hourly or 30-minute basis. This
hourly variation reflects not only changes in energy price but also the time-specific allocation
of generation, transmission, and distribution capacity costs (as discussed above). While there
are cases of domestic customers being enrolled in hourly tariffs (e.g., Spain’s default domestic
tariff), those tariffs typically only reflect hourly variation in energy costs, as opposed to
including the allocation of capacity costs. The idea of a SHR has begun to attract interest in
some jurisdictions internationally as the adoption of smart home appliances has grown.22
A summary of the five modelled tariff designs is provided in Table 3.
Table 3: The Five Modelled Tariff Designs
ENROLMENT RATES AND PER-PARTICIPANT IMPACTS Enrolment rates are derived from a comprehensive literature review on consumer preferences
for TOU tariffs, as well as subsequent primary market research, both of which are discussed
in detail in Sections IV and V of this report. Where the findings of that research were
inconclusive, assumptions were made based on experience designing and evaluating TOU
field trials and full-scale offerings internationally.
22 See, for instance, Devi Glick, Matt Lehrman, and Owen Smith, “Rate Design for the Distribution
Edge,” Rocky Mountain Institute report, August 2014. The concept of a SHR-like tariff is also
referenced in the European Commission’s 2016 Clean Energy Package, which calls for customer
access to a dynamic tariff which is “an electricity supply contract between a supplier and a final
customer that reflects the price at the spot market, including at the day ahead market at intervals
at least equal to the market settlement frequency.”
Category Tariff Designs Description Examples
1. Conventional TOUHigher daytime (peak period) price and lower price during all
other hours.
Economy 7, Arizona Public Service,
Ontario (Canada)
2. Inverted TOU (iTOU)
Lower peak period price and higher off‐peak prices. The
peak period is set to align with the hours of maximum solar
PV output, to encourage self‐consumption and reduce
distribution constraints due to net excess generation.
WPD Sunshine Tariff, being tested in
Hawaii and California
3. Critical peak pricing (CPP)Significantly higher price during a limited number of peak
events per year, lower price during all other hours.
Piloted in LCL field trial; offered by
PG&E (California)
4. Critical peak rebates (CPR)
Rebates are paid for load reductions relative to an
estimated baseline level of consumption during a limited
number of peak events. The underlying tariff design itself
does not change; customers are simply awarded a rebate
payment if they reduce consumption.
BGE and Pepco (Maryland)
5. Smart Home Rate (SHR)
The price varies on a 30‐minute basis. Hourly variation
reflects not only changes in energy price but also the
allocation of generation, transmission, and distribution
capacity costs to the hours that are driving capacity
investment needs.
Only conceptual at this point;
discussed in NY and CA
Realtime
(Encourages around‐the‐
clock, near‐instantaneous
load response)
Static
(Encourages permanent
re‐shaping of load)
Event‐based
(Encourages temporary,
targeted increases or
decreases in load)
18 | brattle.com
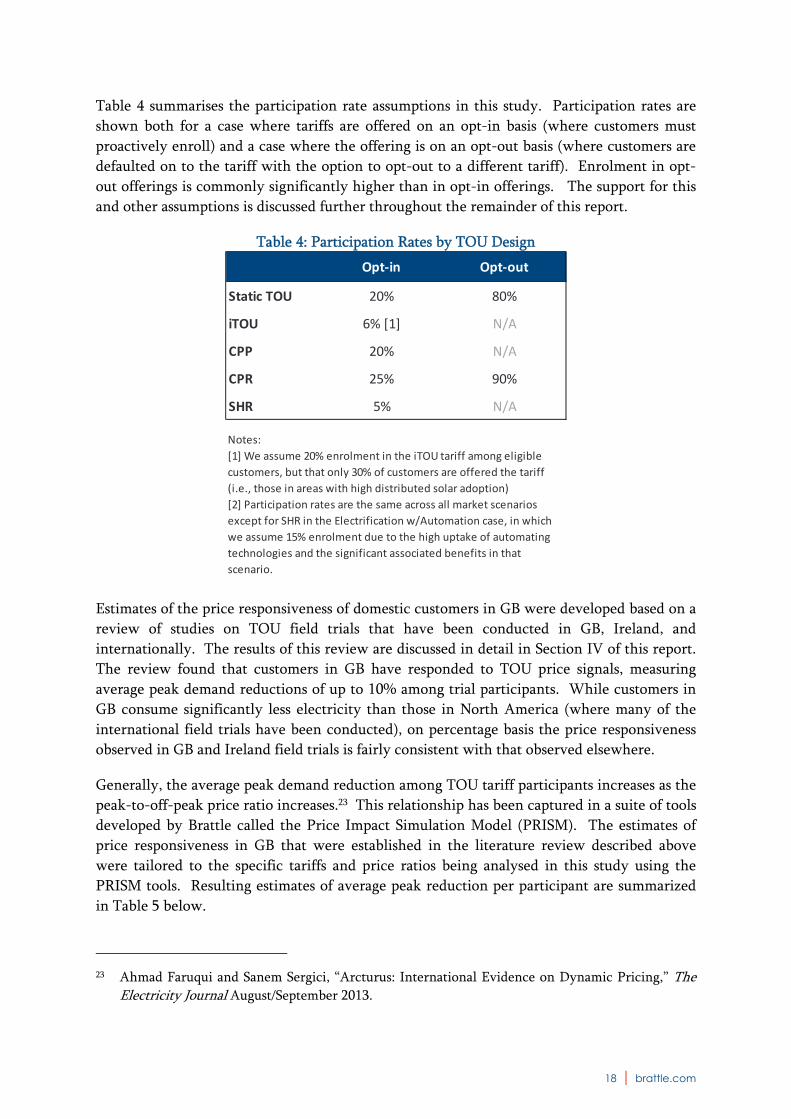
Table 4 summarises the participation rate assumptions in this study. Participation rates are
shown both for a case where tariffs are offered on an opt-in basis (where customers must
proactively enroll) and a case where the offering is on an opt-out basis (where customers are
defaulted on to the tariff with the option to opt-out to a different tariff). Enrolment in opt-
out offerings is commonly significantly higher than in opt-in offerings. The support for this
and other assumptions is discussed further throughout the remainder of this report.
Table 4: Participation Rates by TOU Design
Estimates of the price responsiveness of domestic customers in GB were developed based on a
review of studies on TOU field trials that have been conducted in GB, Ireland, and
internationally. The results of this review are discussed in detail in Section IV of this report.
The review found that customers in GB have responded to TOU price signals, measuring
average peak demand reductions of up to 10% among trial participants. While customers in
GB consume significantly less electricity than those in North America (where many of the
international field trials have been conducted), on percentage basis the price responsiveness
observed in GB and Ireland field trials is fairly consistent with that observed elsewhere.
Generally, the average peak demand reduction among TOU tariff participants increases as the
peak-to-off-peak price ratio increases.23 This relationship has been captured in a suite of tools
developed by Brattle called the Price Impact Simulation Model (PRISM). The estimates of
price responsiveness in GB that were established in the literature review described above
were tailored to the specific tariffs and price ratios being analysed in this study using the
PRISM tools. Resulting estimates of average peak reduction per participant are summarized
in Table 5 below.
23 Ahmad Faruqui and Sanem Sergici, “Arcturus: International Evidence on Dynamic Pricing,” The Electricity Journal August/September 2013.
Opt‐in Opt‐out
Static TOU 20% 80%
iTOU 6% [1] N/A
CPP 20% N/A
CPR 25% 90%
SHR 5% N/A
Notes:
[1] We assume 20% enrolment in the iTOU tariff among eligible
customers, but that only 30% of customers are offered the tariff
(i.e., those in areas with high distributed solar adoption)
[2] Participation rates are the same across all market scenarios
except for SHR in the Electrification w/Automation case, in which
we assume 15% enrolment due to the high uptake of automating
technologies and the significant associated benefits in that
scenario.

19 | brattle.com
Table 5: Per-Participant Peak Demand Impacts of TOU Tariffs
Current
Trends
High
RenewablesElectrification
Electrification
w/Automation
[1]
Static TOU
Opt‐in 5% 5% 7% 8%
Opt‐out 3% 3% 4% N/A
iTOU
Opt‐in N/A 10% [2] N/A N/A
CPP
Opt‐in 10% 10% 14% 16%
CPR
Opt‐in 8% 8% 11% 12%
Opt‐out 4% 4% 5% N/A
SHR
Opt‐in 3% 3% 5% Varies [3]
Notes:
[1] Electrification w/Automation impacts are reported as a weighted average of customers with
automating tech and those providing only behavioural response. Impacts for customers with
automating tech are higher than those shown in the table. Impacts from EVs are accounted for
separately.
[2] iTOU impact is % of load shifted to lower priced peak period.
[3] SHR response varies by hour with a maximum load reduction of 25%.
[4] Unless otherwise noted, reported impact is average across all participants and all peak hours of
the TOU tariff.

20 | brattle.com
III. The Value of TOU Tariffs TWELVE KEY FINDINGS The result of the modelling described in Section II is a range of estimates of the total annual
system costs that could be avoided through a full scale rollout of TOU tariffs in GB. The
results span five possible tariff offerings and four market scenarios. This section of the report
is organized around 12 key findings from the TOU value assessment.
Finding #1: Customers do respond to TOU price signals
There is a perception among some industry stakeholders that domestic customers in GB will
not respond to TOU price signals. This is typically in spite of the findings of field trials and
full-scale deployments which have shown that customers do respond to price, under a range
of conditions and in the absence of automating technology (a review of those field trials is
presented in Section IV).
The perceived lack of domestic customer price responsiveness is commonly due in part to
extrapolating from one’s own experience or preferences for TOU tariffs. It is also often
attributed to a view that domestic customers have relatively little flexible load.
Behind these views, there tends to be an underappreciation for the significant heterogeneity
in the domestic segment. While it is efficient to extrapolate from one’s own experience as a
customer, the domestic customer base is simply too diverse for this extrapolation to be
broadly applicable to the class as whole.
For instance, field trials have anecdotally found that 70 to 80% of the aggregate peak demand
reduction from a TOU tariff can come from only 20 to 30% of the TOU participants. In other
words, some customers will not respond to TOU tariffs at all, some will respond a little, and
some will respond a lot. Since it is ultimately the aggregate response that matters when
determining the system value of TOU tariffs, it is important to recognize that populations of
TOU participants have always included a group of customers who do not respond. The tariffs
have produced meaningful impacts in spite of this.
This diversity in the domestic class also makes it very difficult to construct a bottom-up
estimate of those individual loads that are likely to respond to price signals. It can be difficult
for TOU participants to articulate the specific actions that led to peak demand reductions,
partly because customers often do not have a strong sense of the electricity intensity of
various appliances. Further, while some TOU impact evaluations have identified air-
conditioning as a driver of flexibility, it is also the case that field trials in winter peaking
regions or regions with low market penetration of central air-conditioning have detected
significant levels of price response.
There is a broad variety of ways that customers could go about reducing peak load beyond
delaying the use of their washer and dryer (commonly perceived to be the likely sources of
load flexibility). For instance, lighting is commonly characterised as “inflexible load” but it is
not difficult to imagine a customer who becomes more conscious about not leaving the lights
21 | brattle.com
on in unattended rooms during peak pricing hours after enrolling in a TOU rate. Customers
may also choose to upgrade “inflexible” end-uses to more energy efficient models and achieve
permanent peak demand reductions as a result.
There has also been some skepticism that the findings of TOU field trials cannot be
extrapolated to the broader population of customers. The view is that this is partly due to
self-selection bias24 among participants in the trials and partly due to an unusual amount of
information and “attention” that the customers receive as participants. In contrast to this
view, however, field trials that were conducted on an opt-out basis have detected a
statistically significant level of price response, thus addressing the concern about self-
selection bias.25 It is also the case that full-scale TOU offerings have produced significant
peak reductions even at modest peak-to-off-peak price ratios, suggesting that the impacts
observed in field trials can also be observed on a full-scale basis.26
Rather than attempting to model the plethora of ways in which a diverse group of customers
may respond to TOU tariffs, we have relied on a review of studies reporting the average
impacts that have been observed across hundreds of thousands of participants in TOU tariffs
in GB and internationally. These results implicitly account for the breadth of ways in which
customers respond (or do not respond) to TOU tariffs.
With opt-in offerings in the Current Conditions scenario, we find that behavioural response
to TOU tariffs alone could produce 300 to 600 MW of system peak demand reduction in GB
(the equivalent of at least four mid-sized peaking units). Under more extreme price
conditions, with electrification of heating and transport, and with adoption of automating
technologies, we estimate that TOU tariffs could potentially reduce system peak demand by
more than 1,000 MW. Fully automated whole-home response, and/or opt-out TOU tariff
offerings have the potential to increase this estimate further.
Finding #2: Under current market trends, voluntary TOU tariffs can provide modest but
meaningful cost savings
Under Current Trends, and with opt-in deployment, the value of TOU tariffs ranges from £19
to £24 million/year.27 Averaged across all households in GB, this equates to roughly £1 per
domestic GB customer per year. It is roughly £5 of annual savings per TOU participant.
24 In other words, there is a view that customers who choose to participate in the field trials are
likely to be more engaged and price responsive than the typical customer.
25 Potter, Jennifer, Stephen S. George, and Lupe R. Jimenez, “SmartPricing Options Final
Evaluation,” prepared for the U.S. Department of Energy, September 2014.
26 Ahmad Faruqui et al, “Analysis of Ontario’s Full Scale Roll-out of TOU Rates – Final Study,”
prepared for the Independent Electric System Operator, February 3, 2016.
27 A summary of estimates of system value for all market scenarios and tariff designs is provided later
in this section of the report.
22 | brattle.com
These values are gross savings in the form of avoided resource costs that could be shared
between suppliers, network operators, TOU participants, and possibly TOU non-participants.
How those savings would be allocated would depend on the specific design of the TOU tariff
offering.
Looking across the individual TOU designs, the total value of static TOU, critical peak pricing
(CPP), and critical peak rebate (CPR) tariffs is surprisingly similar in magnitude. It is
generally the case that the relative strengths and weaknesses of each tariff design are offset to
some degree. For instance, while CPR may have higher enrolment rate than the CPP tariff,
this advantage in participation is offset by a slightly lower average per-participant peak
reduction in the CPR due to differences in the nature of the price signal. Similarly, while the
static TOU produces a lower average peak impact, the price signal applies on a daily basis and
therefore captures value on many more days than the CPP or CPR tariffs.
Finding #3: Customer participation in TOU tariffs will be a key driver of system benefits
In a transition to TOU tariffs, a policy decision will need to be made regarding whether the
tariffs will be offered on an opt-in or opt-out basis (sometimes also referred to as a “default”
offering). With an opt-in offering, customers must proactively leave their current tariff to
sign up for new TOU tariff. With an opt-out offering, customers are automatically moved to
the TOU tariff, with the option to switch to a different (and possibly non-time-varying) tariff.
Some regions of the world are transitioning to domestic TOU tariff deployments on an opt-
out basis. All four million households in the province of Ontario, Canada have been
defaulted to a static TOU, with the option to choose a different rate offered by retail supplier.
TOU pricing is the default domestic tariff across Italy for 25 million customers.28 In Spain,
roughly half of all domestic customers remain on the standard tariff, in which the energy
charge varies by hour. Ireland is expected to transition to a default domestic TOU tariff
following the completion of its smart metering deployment. In the United States, Baltimore
Gas & Electric and Pepco Holdings have transitioned all of their domestic customers in
Maryland and Delaware to a default CPR. The major utilities in California will transition
their domestic customers to default static TOU tariffs in the next few years.
While the possibility of an opt-out offering of TOU tariffs has not been at the forefront of
retail tariff discussions in GB, we explored the potential impacts of such an offering given its
international relevance.
Evidence suggests that customers are much more likely to remain enrolled in TOU tariffs if
they are deployed on an opt-out basis. Generally, a successful opt-in offering might attract
20% of customers, whereas 80% or more of customers may remain enrolled in a TOU tariff
when deployed on an opt-out basis.29 Conversely, the price responsiveness of the average
28 Walter Graterri and Simone Maggiore, “Impact of a Mandatory Time-of-Use Tariff on the
Residential Customers in Italy,” November 14, 2012.
http://www.ieadsm.org/Files/Content/14.Espoo_IEA_DSM_Espoo2012_SimoneMaggiore_RSE.pdf 29 See Section V of this report for additional detail. For further discussion, also see Ahmad Faruqui,
Ryan Hledik, and Neil Lessem, “Smart by Default,” Public Utilities Fortnightly, August 2014.

23 | brattle.com
customer in an opt-out offering is lower than in an opt-in offering. One field trial found that
peak demand reductions from the average customer in an opt-out offering were 40 to 50%
lower than in an equivalent opt-in offering.30
Deploying TOU tariffs on an opt-out basis roughly doubled the total system value of the tariff
in our analysis. While average per-participant impacts are likely lower with opt-out
offerings, this is more than offset by the observed significant increase in enrolment. Figure 4
illustrates the comparison of total annual system value between opt-in and opt-out
deployments.31
Figure 4: Value of TOU Tariffs, Opt-in versus Opt-out
Regardless of whether TOU tariffs are deployed on an opt-in or opt-out basis, marketing and
customer engagement will play a critical role in the success of the offering under either
deployment scenario. For an opt-out offering, it will be important to ensure that customers
are aware of the tariff change and the options at their disposal to respond to the new tariff,
particularly any vulnerable customers who may experience a bill increase.
For opt-in offerings, significant engagement efforts will be needed to achieve meaningful
enrolment levels. Case studies from other jurisdictions suggest that significant participation
can be achieved even on an opt-in basis. For example, Arizona Public Service has more than
half of its domestic customers enrolled in a voluntary TOU, driven in part by a concerted
effort by the utility’s customer service department to provide customers with information
30 Jennifer M. Potter, Stephen S. George, and Lupe R. Jimenez, “SmartPricing Options Final
Evaluation,” prepared for the U.S. Department of Energy, September 2014.
https://www.smartgrid.gov/files/SMUD-CBS_Final_Evaluation_Submitted_DOE_9_9_2014.pdf. 31 CPP tariffs were not considered for opt-out deployment in this study since there is no
international evidence of such an offering to domestic customers.
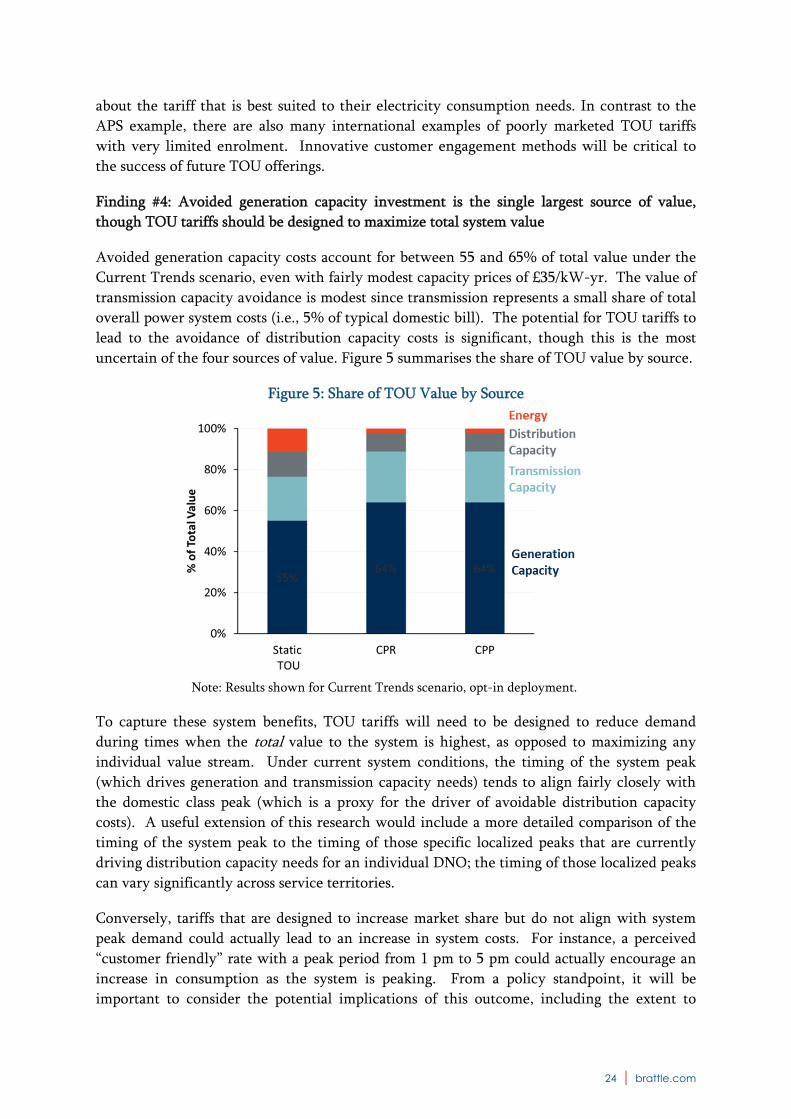
24 | brattle.com
about the tariff that is best suited to their electricity consumption needs. In contrast to the
APS example, there are also many international examples of poorly marketed TOU tariffs
with very limited enrolment. Innovative customer engagement methods will be critical to
the success of future TOU offerings.
Finding #4: Avoided generation capacity investment is the single largest source of value,
though TOU tariffs should be designed to maximize total system value
Avoided generation capacity costs account for between 55 and 65% of total value under the
Current Trends scenario, even with fairly modest capacity prices of £35/kW-yr. The value of
transmission capacity avoidance is modest since transmission represents a small share of total
overall power system costs (i.e., 5% of typical domestic bill). The potential for TOU tariffs to
lead to the avoidance of distribution capacity costs is significant, though this is the most
uncertain of the four sources of value. Figure 5 summarises the share of TOU value by source.
Figure 5: Share of TOU Value by Source
Note: Results shown for Current Trends scenario, opt-in deployment.
To capture these system benefits, TOU tariffs will need to be designed to reduce demand
during times when the total value to the system is highest, as opposed to maximizing any
individual value stream. Under current system conditions, the timing of the system peak
(which drives generation and transmission capacity needs) tends to align fairly closely with
the domestic class peak (which is a proxy for the driver of avoidable distribution capacity
costs). A useful extension of this research would include a more detailed comparison of the
timing of the system peak to the timing of those specific localized peaks that are currently
driving distribution capacity needs for an individual DNO; the timing of those localized peaks
can vary significantly across service territories.
Conversely, tariffs that are designed to increase market share but do not align with system
peak demand could actually lead to an increase in system costs. For instance, a perceived
“customer friendly” rate with a peak period from 1 pm to 5 pm could actually encourage an
increase in consumption as the system is peaking. From a policy standpoint, it will be
important to consider the potential implications of this outcome, including the extent to

25 | brattle.com
which the increase in cost could be recovered from non-participants and the extent to which
these cost increases would be accurately accounted for under current settlement processes.
Finding #5: Critical Peak Rebates have significant potential but are under-researched in GB
CPRs consistently produce value across the market scenarios. Aside from their financial
value, CPRs also have a number of non-monetary advantages relative to other TOU tariff
designs. First, CPRs offer a risk-free proposition to customers. On a CPR, customers earn a
rebate if they reduce peak consumption or otherwise simply continue to be charged the
standard price according to their existing tariff. Second, CPRs provide a price signal that has
been proven through numerous field trials to produce significant peak demand reductions
that are roughly comparable on a per-participant basis to those of a critical peak pricing
tariff.32 Third, evidence from some jurisdictions (such as Maryland and Delaware in the U.S.)
suggests that CPRs are the most politically practical option to deploy, particularly on an opt-
out basis, due to their no-lose nature for customers.
CPRs also have some disadvantages relative to other TOU tariff designs. In particular, it is
challenging to accurately estimate each individual participant’s baseline peak period
consumption in the absence of the rebate payment. There are various established methods
for performing this calculation, though each has some degree of inherent inaccuracy. The
tariffs must be carefully designed to avoid over- or under-compensating customers. CPRs also
do not correct the cross-subsidy that exists on flat-priced tariffs between customers with flat
load profiles and those with peaky load profiles.
In spite of the potential advantages of CPRs, they are under-researched in GB. It would be a
useful future research activity to better understand the extent to which customers in GB are
likely to enrol in and respond to such a tariff. Market research on customer interest may
need to extend beyond conventional surveys. As is discussed in Section V of this report,
initial market research has not detected a significant difference in consumer interest in CPRs
relative to other possible offerings, including a flat pricing tariff. Given the no-lose
proposition that CPRs offer, among many possible explanations it is conceivable that
customers simply need more information to be made aware of the potential benefits of such a
tariff.
Finding #6: Renewables growth alone is not likely to significantly impact the system value of
conventional TOU tariffs
Under the valuation framework adopted for this study, the addition of wind and solar
capacity to the GB system does not significantly increase the value of TOU tariffs. Energy
prices decrease with the addition of low variable cost generation, thus reducing the already
modest energy value associated with shifting load from peak to off-peak periods. Capacity
prices are assumed to increase somewhat, to provide the necessary incentive to keep sufficient
generation online. The value of TOU tariffs increases in this regard. However, the increase
32 Some field trials have found no statistically significant difference between CPR and CPP price
elasticities, while others have found that customers respond slightly more to the CPP price signal.
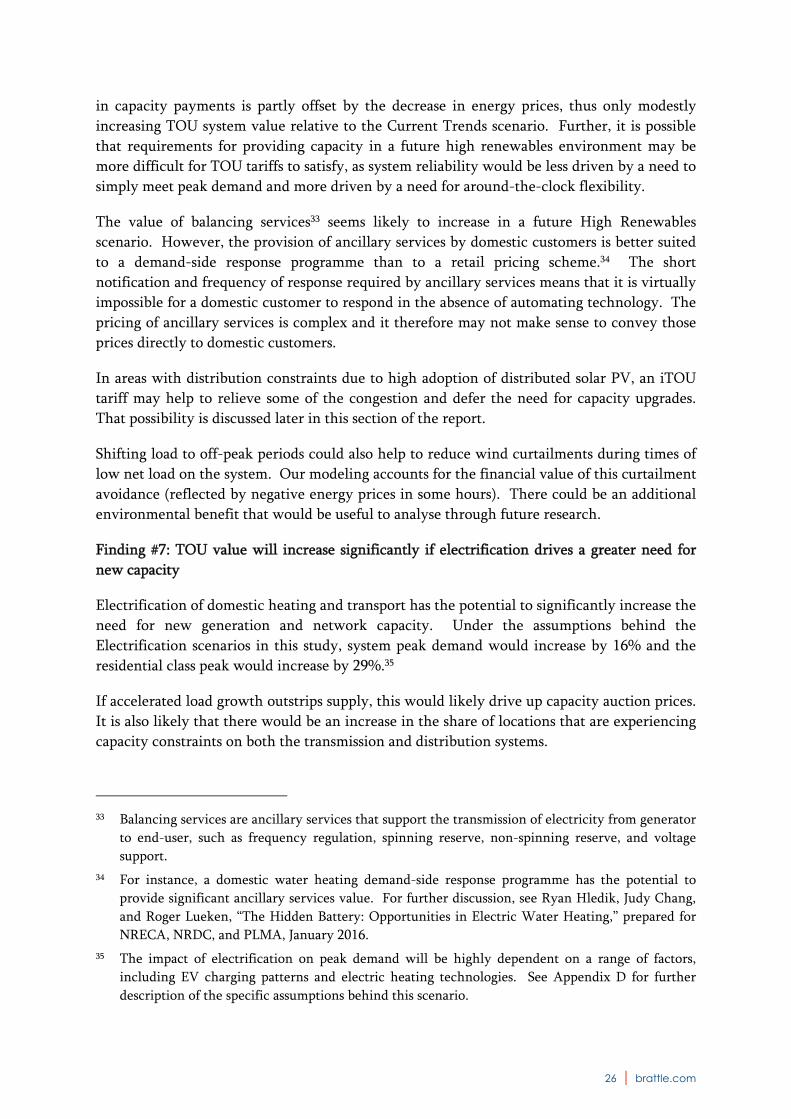
26 | brattle.com
in capacity payments is partly offset by the decrease in energy prices, thus only modestly
increasing TOU system value relative to the Current Trends scenario. Further, it is possible
that requirements for providing capacity in a future high renewables environment may be
more difficult for TOU tariffs to satisfy, as system reliability would be less driven by a need to
simply meet peak demand and more driven by a need for around-the-clock flexibility.
The value of balancing services33 seems likely to increase in a future High Renewables
scenario. However, the provision of ancillary services by domestic customers is better suited
to a demand-side response programme than to a retail pricing scheme.34 The short
notification and frequency of response required by ancillary services means that it is virtually
impossible for a domestic customer to respond in the absence of automating technology. The
pricing of ancillary services is complex and it therefore may not make sense to convey those
prices directly to domestic customers.
In areas with distribution constraints due to high adoption of distributed solar PV, an iTOU
tariff may help to relieve some of the congestion and defer the need for capacity upgrades.
That possibility is discussed later in this section of the report.
Shifting load to off-peak periods could also help to reduce wind curtailments during times of
low net load on the system. Our modeling accounts for the financial value of this curtailment
avoidance (reflected by negative energy prices in some hours). There could be an additional
environmental benefit that would be useful to analyse through future research.
Finding #7: TOU value will increase significantly if electrification drives a greater need for
new capacity
Electrification of domestic heating and transport has the potential to significantly increase the
need for new generation and network capacity. Under the assumptions behind the
Electrification scenarios in this study, system peak demand would increase by 16% and the
residential class peak would increase by 29%.35
If accelerated load growth outstrips supply, this would likely drive up capacity auction prices.
It is also likely that there would be an increase in the share of locations that are experiencing
capacity constraints on both the transmission and distribution systems.
33 Balancing services are ancillary services that support the transmission of electricity from generator
to end-user, such as frequency regulation, spinning reserve, non-spinning reserve, and voltage
support.
34 For instance, a domestic water heating demand-side response programme has the potential to
provide significant ancillary services value. For further discussion, see Ryan Hledik, Judy Chang,
and Roger Lueken, “The Hidden Battery: Opportunities in Electric Water Heating,” prepared for
NRECA, NRDC, and PLMA, January 2016.
35 The impact of electrification on peak demand will be highly dependent on a range of factors,
including EV charging patterns and electric heating technologies. See Appendix D for further
description of the specific assumptions behind this scenario.

27 | brattle.com
Under this electrification scenario, and assuming only behavioural response to price signals
(i.e., no automating technologies), an increased system-wide need for capacity could triple or
quadruple the value of TOU tariffs. This finding specifically demonstrates the sensitivity of
TOU value to assumed capacity prices. Figure 6 illustrates the impact of rapid load growth on
TOU value.
Figure 6: Impact of Accelerated Load Growth on TOU Value
Note: Results only shown for “opt-in” cases.
While the Electrification scenario illustrates a plausible case where capacity prices increase in
the future, it is possible in a different scenario that capacity value could decrease in the future
(e.g., due to lower-than-expected demand). This has been the case in Germany and Spain, for
example, where there is significant excess generating capacity during peak times and
therefore limited value in conventional peak demand reductions. Expectations around future
capacity costs will be a critical consideration when establishing TOU policy.
Finding #8: Automating technology coupled with electrification would further boost value
Field trials have consistently shown that automating technologies (e.g., smart thermostats,
smart EV chargers) significantly increase price response. While there is scepticism among
some stakeholders in GB around the likelihood that domestic customers will exhibit
behavioural price response, many agree that adoption of automating technologies is the key
to unlocking the full demand response potential of the domestic sector. The results of our
analysis confirm that the possible boost in responsiveness from automating technologies
would significantly increase the value of TOU tariffs.
In the Electrification w/Automation scenario, the adoption of enabling technology alone
increases the value of an opt-in CPR tariff by £50 million/yr. Roughly proportional increases
are observed for TOU and CPP tariffs. The incremental impact of the adoption of automating

28 | brattle.com
technology is illustrated in Figure 7. For simplicity, the result for the CPR tariff is shown as
an illustrative case.
Figure 7: Incremental Impact of Load Growth and Automating Technology
Note: Results shown for opt-in CPR as illustrative case
It is important to note that the savings of £126 million/year shown above do not account for
the cost of the automating technology. On one hand, it is possible that this technology will
be adopted by customers regardless of the presence of TOU tariffs. For instance, customers
may purchase a smart thermostat for its remote control capabilities and ease of programming,
with the ability to respond to price signals being a secondary – or even unrecognised –
feature. On the other hand, it could be the case that customers need to be provided a
financial incentive to purchase such equipment. For instance, a North American utility offers
a higher CPR payment to customers with smart thermostats due to the added reliability
associated with a technology-enabled demand reduction. This dynamic will be an important
consideration when comparing the societal benefits of technology-enabled price response to
its costs.
Finding #9: In the absence of automating technology, sub-hourly prices have limited value
Market research offers a mixed view on customer acceptance of granular (i.e., hourly or sub-
hourly) prices. Some studies have found that customers are relatively unreceptive to hourly
real-time prices signals. On the other hand, the primary market research described in Section
V of this report detected the possibility of some appeal of this type of tariff among consumers.

29 | brattle.com
An hourly tariff offering in Illinois, USA has experienced modest enrolment.36 Further,
participants in the tariff tended to treat the hourly prices as if they were a static TOU tariff.
They recognise that afternoon/evening hours are typically the most expensive hours of the
day, and exhibit a general shift in consumption from peak to off-peak hours. However,
significant price responsiveness is not observed on an hour-to-hour basis.
In some competitive markets such as New Zealand and Texas, suppliers have begun to offer
tariffs with hourly prices. The hourly prices are a direct pass-through of wholesale energy
market prices. Anecdotally, it appears that some customers have been attracted to the
perceived transparency and “honesty” of a tariff which is considered to have no hidden fees.
The tariffs are simply presented as a pass through of costs to the customer, with a modest
service fee for the supplier. It seems at least possible that this type of messaging might
eventually be the gateway to a tariff which, combined with automating technology, results in
significant price response among domestic customers.
Informed by the somewhat limited empirical evidence that is available on hourly pricing for
domestic customers, in this study we have assumed that customer uptake of the SHR rate will
be modest in the absence of automating technologies. That modest uptake, combined with a
similarly modest degree of price response among participants, leads to low aggregate system
value of only around £3 million/year for an opt-in offering, in the absence of automating
technologies (compared to around £20 million/year for static TOU, CPP, or CPR offerings).
Finding #10: Real-time automated price response on a sub-hourly basis can be a game-
changer… if it materialises
The benefits of smart home rate (SHR) tariffs could potentially increase dramatically in
scenarios where appliances are responding to real-time prices in an automated fashion. Smart
home appliances could effectively be programmed to turn on or off in response to hourly
price signals, effectively creating a whole-home “demand curve” for electricity.
There is considerable uncertainty that this future scenario will materialise. It is not known to
what extent smart appliances will be adopted, the degree to which those devices will be
programmed to respond to price changes, or whether the appropriate wholesale price signals
and market rules will provide an incentive to respond. Thus, this is a scenario with large
potential but also very significant uncertainty.
Based on a simple algorithm to model automated real-time price response, even at relatively
low levels of participation (i.e., 15% of customers, all of whom are assumed to be equipped
with smart home technology), the benefits of automation increase by orders of magnitude for
the SHR tariff. Annual benefits could exceed £270 million/year in this scenario. This is the
36 There are roughly 20,000 customers participating in the programme out of around 5 million
households in the state of Illinois. For more information about the tariff, see Anthony Star,
Marjorie Isaacson, and Larry Kotewa, “Evaluating Residential Real-Time Pricing: Connecting
Customer Response to Energy Market Impacts.” http://www.elevateenergy.org/wp/wp-
content/uploads/2014/01/Evaluating_Residential_Real_Time_Pricing.pdf

30 | brattle.com
highest value of any scenario analysed in this study. Figure 8 presents the dramatic contrast
in the value of a SHR tariff with and without technology.
Figure 8: Potential Value of SHR Tariff Coupled with Smart Home Technology
Finding #11: A longer peak period window would increase TOU value, but there is a trade-off
with customer acceptance
Extending the end of the peak period window to 9 pm, rather than the conventional end at 8
pm, could increase the benefits of TOU tariffs to some degree. This is particularly the case in
a future scenario with electrification, where the overall system benefits increase by 9% by
extending the peak period by one hour. In the Electrification scenario, the timing of the
system peak will broaden and the distribution peak will begin to diverge from the system
peak, thus requiring a broader peak window (though even in our fairly extreme
Electrification scenario, the divergence was not particularly dramatic).
The trade-offs with customer acceptance of a longer peak period would need to be examined
through further research. While 5 hours is not an unusually long duration, the period would
extend into the late evening. This could potentially hamper customers’ ability to delay
electricity-intensive activities until the off-peak hours. Figure 9 illustrates the average
marginal costs in each hour of the day (averaged over all hours of the year), to provide a sense
of the extent to which a 4 pm to 8 pm window captures the highest value hours.
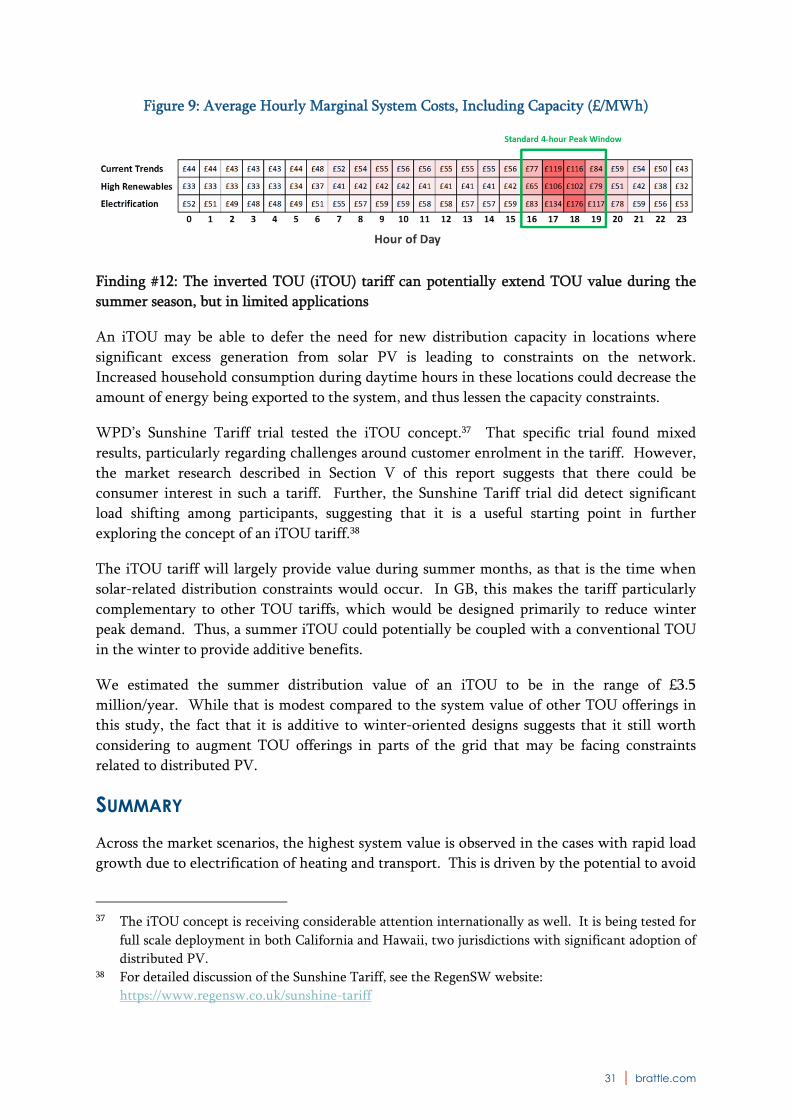
31 | brattle.com
Figure 9: Average Hourly Marginal System Costs, Including Capacity (£/MWh)
Finding #12: The inverted TOU (iTOU) tariff can potentially extend TOU value during the
summer season, but in limited applications
An iTOU may be able to defer the need for new distribution capacity in locations where
significant excess generation from solar PV is leading to constraints on the network.
Increased household consumption during daytime hours in these locations could decrease the
amount of energy being exported to the system, and thus lessen the capacity constraints.
WPD’s Sunshine Tariff trial tested the iTOU concept.37 That specific trial found mixed
results, particularly regarding challenges around customer enrolment in the tariff. However,
the market research described in Section V of this report suggests that there could be
consumer interest in such a tariff. Further, the Sunshine Tariff trial did detect significant
load shifting among participants, suggesting that it is a useful starting point in further
exploring the concept of an iTOU tariff.38
The iTOU tariff will largely provide value during summer months, as that is the time when
solar-related distribution constraints would occur. In GB, this makes the tariff particularly
complementary to other TOU tariffs, which would be designed primarily to reduce winter
peak demand. Thus, a summer iTOU could potentially be coupled with a conventional TOU
in the winter to provide additive benefits.
We estimated the summer distribution value of an iTOU to be in the range of £3.5
million/year. While that is modest compared to the system value of other TOU offerings in
this study, the fact that it is additive to winter-oriented designs suggests that it still worth
considering to augment TOU offerings in parts of the grid that may be facing constraints
related to distributed PV.
SUMMARY Across the market scenarios, the highest system value is observed in the cases with rapid load
growth due to electrification of heating and transport. This is driven by the potential to avoid
37 The iTOU concept is receiving considerable attention internationally as well. It is being tested for
full scale deployment in both California and Hawaii, two jurisdictions with significant adoption of
distributed PV. 38 For detailed discussion of the Sunshine Tariff, see the RegenSW website:
https://www.regensw.co.uk/sunshine-tariff
32 | brattle.com
higher capacity costs in those scenarios. Adoption of technology to automate the response of
those (and other) electric loads to retail prices further increases the system value of TOU
tariffs. There is relatively little difference in value between the Current Trends and High
Renewables cases. As we have defined the High Renewables scenario, energy prices decrease
but capacity prices increase, serving largely as offsetting factors in the TOU value estimation
assessment. A summary of the TOU system value estimates for each tariff design and market
scenario is presented in Table 6.
Table 6: TOU System Value (£ million/year)
Similarities in the value of different TOU tariffs suggest that non-monetary considerations
will be as or more important as financial considerations when developing new TOU tariffs,
policies, and programmes. In this light, Sections IV and V of this report specifically assess the
consumer appeal of TOU tariff designs and communication strategies.
PUTTING THE RESULTS INTO CONTEXT Under the Current Trends and High Renewables scenarios, annual savings of opt-in TOU
offerings are around £20 to £25 million/year. This equates to around £1 per GB household per
year. If those savings were captured entirely by participants, with a nationwide participation
rate of around 20%, the savings to participants would be around £5 per household per year.
The typical domestic customer’s annual electricity bill is between £500 and £600 per year.
It is important to note that these are savings estimates associated only with load shifting.
Savings estimates will vary by participant depending on the participant’s size and degree of
price responsiveness. Additionally, it is the case that the portion of the population with a
flatter-than-average load profile would see additional bill savings from these tariffs, by virtue
of enrolling in a tariff that better reflects the costs that they impose on the power system.
Current
Trends
High
RenewablesElectrification
Electrification
with
Automation
Static TOU (opt‐in)£19 £20 £54 £103
CPR (opt‐in)£22 £25 £76 £126
CPP (opt‐in)£24 £27 £81 £131
SHR (opt‐in)£3 £3 £10 £272
iTOU (opt‐in)N/A £4 N/A N/A
Static TOU (opt‐out)£47 £48 £131 £183
CPR (opt‐out)£40 £45 £137 £190

33 | brattle.com
Further, these estimates do not reflect the non-monetary or difficult-to-quantify benefits of
TOU tariffs discussed throughout this report.
At the upper-end of the spectrum, estimates of TOU value are very roughly in the range of
£150 to £250 million/year. Achieving savings of this magnitude would likely require higher
capacity prices (e.g., driven by electrification), adoption of automating technologies, and/or
opt-out deployment of TOU tariffs. These aggregate savings amount roughly to between £5
and £10 in savings per year per GB household. In the specific instance where the benefits are
being driven by a relatively small share of customers with automating technologies, savings
per participant could be between £30 and £90 per year.39
We are aware of two other studies that have looked specifically at the value of domestic TOU
tariffs in Great Britain: The Department for Business, Energy, & Industrial Strategy (BEIS)
2016 updated smart metering cost benefit analysis40 and a 2012 study for the Department of
Energy & Climate Change (DECC, predecessor to BEIS) on the system benefits of TOU
tariffs41. Other studies have considered the potential value of demand response or system
flexibility broadly in GB, but did not specifically analyse TOU tariffs.
The 2016 BEIS analysis estimates that load shifting from domestic TOU tariffs could amount
to slightly under £1 billion in net present value (NPV) terms for an 18 year period beginning
in 2016. These benefits are not provided on an annualized basis. Using scaling factors we
developed based on annual values elsewhere in the BEIS report, we estimate that the annual
system value of domestic TOU tariffs in the BEIS study may be somewhere around £100
million/year. The BEIS estimate is for opt-in deployment of static TOU.
The 2016 BEIS estimate is within the range of estimates in our study, though the BEIS
estimate is above the high end of what we have estimated as feasible for an opt-in offering
without automating technology. While several of the assumptions in the BEIS study are
similar to those in this study, there are two assumptions that appear to be partially driving the
difference in results. The first is that BEIS assumes a participation rate of 30% by the end of
the forecast horizon, which is higher than the 20% enrolment rate supported by our analysis.
The second is an assumed peak demand reduction among participants of approximately 15%.
This is three times the behavioural peak impact we estimated for static TOU participants, and
50% higher than the CPP impact in the Current Conditions scenario. The BEIS impact is in
line with assumptions of price response that are aided by automating technology and/or
driven by a very significant peak-to-off-peak price ratio in a dynamic tariff. There may also
39 This is based on a relatively simple algorithm to simulate automated price response. A more
detailed assessment of the price responsiveness of a fully-equipped “smart home” would be a
valuable extension of this research. Some automated appliances could also potentially provide
ancillary services, a benefit which is not captured in this analysis. 40 BEIS, “Smart Meter Roll-out Cost-Benefit Analysis,” November 10, 2016.
https://www.gov.uk/government/publications/smart-meter-roll-out-gb-cost-benefit-analysis 41 Baringa and Element Energy, “Electricity System Analysis – Future System Benefits from Selected
DSR Scenarios,” prepared for DECC, August 2012.

34 | brattle.com
be differences in the marginal cost assumptions between the two studies, though we were not
able to identify those assumptions in the BEIS reports.
The 2012 DECC study quantifies annual savings ranging from £150 to £400 million per year
by 2030.42 The low end of this range is for a static TOU in a “low demand” scenario and the
high end of the range is for a CPP in a “high demand” scenario.
TOU value estimates in the 2012 DECC study begin near the upper-end of the range
identified in our study, and extend well above the highest value we have estimated. It
appears that one major driver of this difference is an assumption in the DECC study that all
scenarios include electrification of heating and demand, and that response from EVs, heat
pumps, and other appliances is automated to some degree. As such, the 2012 DECC scenarios
would be most comparable to the Electrification w/Automation scenario in this study.
Additionally, while marginal cost estimates were not published, the study indicates that the
“capital and fixed costs of an OCGT” were the basis for calculating avoided generation
capacity costs. That would likely be above the net CONE value used in this study, and well
above recent prices observed in the capacity auction (which did not exist at the time the 2012
DECC study was being conducted).
42 The analysis also includes a scenario with £50 million in annual value, though this scenario largely
is designed to illustrate the importance of choosing a peak period window that aligns with the
timing of major cost drivers.
35 | brattle.com
IV. Consumer Acceptance of TOU Tariffs: An Evidence Review
We conducted a thorough review of studies on the consumer acceptance of TOU tariffs. This
literature review had two purposes. First, it informed the participation and price response
impact assumptions in the TOU value analysis discussed earlier in this report. Second, the
review provided useful insight on various factors that are likely to influence customer uptake
in future TOU offerings, and identified important questions that are unanswered in the
current body of literature on TOU tariffs.
Our review was designed to assess the consumer attractiveness of TOU tariffs, the satisfaction
of customers who have experience with these tariffs, and the extent to which customers have
exhibited price responsiveness when enroled in a new TOU tariff.
CONSUMER ATTRACTIVENESS OF TOU TARIFFS
Approach
Few studies have specifically set out to measure the extent to which consumers would sign up
for a TOU tariff voluntarily, and little is known about what might make TOU tariffs more
attractive to consumers. We conducted a systematised review to synthesize the available
evidence. Using the search criteria outlined in Appendix E, we identified and screened more
than 4,000 unique documents (e.g., industry studies, academic articles, government reports)
against a set of inclusion criteria. A final list of 27 studies was identified as being sufficient to
answer two main research questions:
1. What is domestic consumer demand for TOU tariffs in GB (overall attractiveness)?
2. What factors are associated with a decreased or increased attractiveness of TOU tariffs
(factors associated with attractiveness)?
To ensure that sufficient evidence was gathered to conduct a quantitative analysis, our review
not only included statistics on sign-up rates to commercially available TOU tariffs but also
used responses in quantitative surveys (stated willingness to switch to a TOU tariff) and
recruitment rates to TOU tariff trials.
We extracted findings and ran a meta-analysis to estimate the impact of tariff design and
other features (e.g. presence and absence of bill protection, automation, type of marketing,
etc.) on uptake.43 The evidence has been extracted from studies conducted in six countries
(US, GB, Australia, France, Norway, Netherlands) with most of the evidence coming from the
US, followed by GB and Australia. Although we have controlled for country in our analysis
(by including it as a variable in the regression model), we recommend that the evidence here
be interpreted as being broadly relevant to all countries included. Since most of the GB
43 See Appendix E for further discussion.

36 | brattle.com
evidence is survey-based and there is considerable insight to be obtained from analysis of
direct participation in a commercially available tariff, the cross-country evidence is likely to
provide a better indicator of eventual uptake than relying on GB studies alone.
Overall Attractiveness
Across surveys, tariff trials and commercial deployments, the range of observed uptake of
domestic TOU tariffs is very large, ranging from 0 to 96%. The mean enrolment rate is 29%
but with considerable variation around this mean. Figure 10 summarises each of the 66
measures of uptake from the 27 studies.
Figure 10: Measures of Uptake to TOU Tariffs from all Reviewed Studies (% of Eligible
Population)
Each bar in Figure 10 represents an observed measure of uptake. Some studies obtained
multiple measures (for example, in cases where they tested more than one tariff and reported
uptake by tariff) so individual studies may appear multiple times. The remainder of this
section discusses the factors that are most likely to be driving this variation in uptake
observed across measures and across studies.
Factors Associated with Customer Attractiveness
Table 7 summarises the evidence on the factors associated with consumer attractiveness to
TOU tariffs, including an indication of strength of findings. High strength means that there is
a strong statistical association, which can be interpreted as meaning that this factor is highly
likely to be associated with uptake. Moderate means that while there was no association in
0%
10%
20%
30%
40%
50%
60%
70%
80%
90%
100%
1 3 5 7 9 11 13 15 17 19 21 23 25 27 29 31 33 35 37 39 41 43 45 47 49 51 53 55 57 59 61 63 65
Mean
Uptake
Study Count

37 | brattle.com
the meta-analysis (the across study comparison), individual studies that explicitly seek to test
the impact of that factor on uptake (using randomization) do find an association. Inconclusive
means that there was no statistical association found. This cannot be interpreted as evidence
that the factor has no impact on uptake but just that there is not enough evidence to say
either way.
Table 7: Factors Associated with Customer Attractiveness to TOU Tariffs
Factor Key takeaways Strength of findings
Recruitment method (opt‐in versus opt‐out)
Biggest driver of differences across studies. 83% average enrolment with opt‐out versus 26% with opt‐in. Customers who are enrolled on TOU tariffs by default under opt‐out policies reduce their peak time electricity consumption by substantially less than those who actively opt‐in (US Department of Energy, 2015), however overall peak reductions under an opt‐out policy will be higher than under opt‐in by virtue of the fact opt‐out enrolment achieves much higher enrolment rates (Cappers et al., 2016).
High
Financial incentive (e.g. gift card)
Statistically significant impact in comparison across studies, with 35% enrolling when offered incentive versus 20% enrolling when not offered
High
Static vs. dynamic Static (35% average uptake) is more popular than dynamic, particularly hourly RTP (18%).
High
Automation Comparison across studies finds no statistically significant difference in uptake associated with automating technologies. However, individual studies that have tested this experimentally (e.g. by assigning customers to the same tariff but randomly varying whether it is accompanied by automation) find that automation increases uptake, possibly to a greater extent for dynamic tariffs than static.
Moderate
Bill protection Comparison across studies finds higher uptake with bill protection (35%) than without (27%) though the difference is not statistically significant. However, one survey study from Australia which tested the impact of bill protection experimentally (assigned participants to the same tariff but randomly varied whether it was accompanied with bill protection) found that bill protection had a modest positive impact on uptake(Stenner et al., 2015).
Moderate
Dynamic tariff options
Limited data makes it difficult to compare across individual dynamic tariff designs like CPP, CPR, etc.
Inconclusive
Messaging (e.g. “sign up to save money”)
There is limited research on this issue since most studies emphasise the potential financial savings, making it hard to find a control for comparison. The only alternative type of messaging tested was telling customers about the environmental benefits of TOU tariffs however the evidence on this is conflicting: two international survey studies(Buryk et al., 2015; Schwartz et al., 2015) find that it increases willingness to switch while another survey study on GB consumers finds that it has no effect(Nicolson, Huebner and Shipworth, 2017).
Inconclusive
Type of customer (e.g. low income, region)
This was not included in the analysis because the reviewed studies did not break down uptake by participant or customer type. Two survey studies which tested this explicitly found no correlation between various socio‐economic and demographic factors and willingness to switch to a TOU tariff (Fell, 2016; Nicolson, Huebner and Shipworth, 2017). However, there is no evidence based on actual enrolment rates to commercially available tariffs.
Inconclusive

38 | brattle.com
Summary
The literature review suggests that attractiveness of TOU tariffs varies substantially across
studies. Uptake of time-varying tariffs offered on an opt-in basis can reasonably be expected
to fall anywhere between 1% and 43%. If the tariffs are rolled out on an opt-out basis,
enrolment can be expected to exceed 50% and approach 100%. The UK Government is
working on the basis of 30% of domestic consumers being enrolled on a TOU tariff by 2030 as
part of its smart meter cost benefit analysis.44 This falls toward the higher end of the opt-in
estimate. The upper bound of consumer opt-in uptake was obtained from surveys, in which
consumers stated the likelihood that would switch to a tariff if it was available today. The
lower end of the range comes from commercially available tariff participation.
Our analysis suggests that, aside from opt-out enrolment, other ways of increasing uptake to
TOU tariffs include small upfront financial payments (e.g. gift card), with some evidence that
bill protection and combining a TOU with automation could increase uptake. However, since
bill protection has not been widely tested, more research is required as to whether it is likely
to affect GB consumer uptake.
More research is also required to investigate whether automation is likely to increase the
attractiveness of TOU tariffs, particularly because automation could both increase the number
of customers who could save money on a TOU tariff and reduce the hassle burden on
consumers of responding to price changes. Finally, opt-in enrolment of any type (e.g.
combined with bill protection etc.) is unlikely to yield uptake rates as high as could be
achieved with opt-out enrolment.
CONSUMER SATISFACTION WITH TOU TARIFFS Approach
A “satisfaction review” was conducted to assess the perceptions of customers who had some
experience with a TOU tariff. The satisfaction review was based on documents identified in
the attractiveness review (discussed above) and additional documents provided by The Brattle
Group.45 In total, 19 documents were reviewed, covering 16 field trials. As all documents
except for one were reports from US trials, no differentiation according to country was
feasible. In most studies that had used multiple TOU designs, satisfaction ratings were not
reported based on tariff type, making it difficult to draw conclusions about relative difference
in satisfaction with various tariff specifications. Satisfaction was measured in a number of
ways, including (1) an expression by participants of overall satisfaction, (2) an indication that
participants would recommend the tariff to a friend, and (3) an indication that participants
would enrol again in the future.
44 BEIS, “Smart meter roll-out cost benefit analysis,” 2015.
https://www.gov.uk/government/uploads/system/uploads/attachment_data/file/567167/OFFSEN_2
016_smart_meters_cost-benefit-update_Part_I_FINAL_VERSION.PDF 45 See list in References and Additional Resources at the end of this report.

39 | brattle.com
Satisfaction
Between 60 and 96% of participants indicated that they were satisfied overall with their
respective TOU programme. A tariff design combining static TOU with critical peak pricing
(CPP) had both the lowest and the highest rating (as observed in different treatments),
indicating that factors beyond the tariff design played a role in influencing satisfaction. For
instance, a measure including smart control systems in the study had the highest satisfaction
ratings among all programmes we reviewed. The average proportion of customers who were
satisfied across the programmes was 79%. Similarly, on average, 86% of participants said they
would participate again in a similar programme. One study had both an opt-in and an opt-out
group with over 90% considering staying on the tariff. Whilst this result was not reported
separately for opt-in and opt-out customers, one can infer that, at minimum, 72% of those in
the opt-out group would participate again. Two studies actually offered customers a second
year of participation, which was accepted by 74% and 90% of customers. Additionally, across
all studies reviewed, the percentage of customers who would recommend the programme to
others averaged 75%.
Figure 11 summarises the results of the satisfaction review. We generally conclude that
experience of being on a TOU tariff was positively evaluated.
Figure 11: Results of Satisfaction Review (% of TOU Tariff Participants)
It is important to note that the response rate to satisfaction surveys was often low (or, more
frequently, not reported). With one exception, those who dropped out of the study were not
surveyed. Hence, the results reflect the opinion of those who stayed enrolled in the study and
were willing to participate in a survey about their satisfaction levels with a TOU tariff.
Drop-out rates across the studies ranged from 10 to 43%, with an average of 23%. It often was
not clear if customers dropped out for reasons connected with the study itself or because they
were unable to participate any longer (e.g. because they moved away). One study explicitly
measured satisfaction amongst drop-outs and found that only 20% of those who dropped out

40 | brattle.com
were satisfied. Not saving money was the most important reason for dissatisfaction and drop-
outs, while unpredictability of peak events was associated with dissatisfaction in one study.
Similarly, saving money was observed to be the most important motivator to participate in
the study and satisfaction.
Summary
Generally, customers had a positive experience with TOU tariffs. About four out of five
customers were satisfied, and similar numbers would participate again or recommend the
programme to others. However, not everyone chose to respond to satisfaction surveys and
drop-out satisfaction would most likely have been lower overall. Still, this is an encouraging
finding and suggests that initial skepticism regarding TOU tariffs may eventually be overcome
as customers gain experience with the tariffs. Transition methods such as temporary bill
protection and enhanced consumer engagement and outreach efforts could help to facilitate
this experience.
CUSTOMER RESPONSIVENESS TO TOU TARIFFS Approach
A number of wide-ranging reviews have already been conducted with the aim of assessing
the extent to which consumers on TOU tariffs vary their electricity consumption in response
to the tariff. We conducted a ‘review of reviews’ with the aim of presenting an overall picture
of response to different TOU types and the factors that are associated with this. Using a search
strategy outlined in Appendix E, we identified a pool of 23 sources (post-screening), with
more detailed information extraction from 10 reviews on peak reduction and bill savings, the
role of technology and automation, and possible distributional impacts. The same information
was also extracted from four major recent trials conducted in the UK/Ireland which included
testing the effects of TOU tariffs – the Customer Led Network Revolution, Low Carbon
London, the Irish Customer Behaviour Trials, and the Energy Demand Reduction Project.
Peak Demand Reduction
TOU tariffs commonly aim to reduce peak electricity demand. Figure 12 summarises findings
from six reviews according to this metric, broken down by tariff type. For each review the
average peak reduction was calculated by tariff type; the range of these averages, and the
mean of these averages, is shown on the chart in grey.

41 | brattle.com
Figure 12: Range of Average Peak Reductions in Field Trials
The review averages (in grey) show a large degree of variability in responsiveness even within
classes of tariff design. CPP tariffs have tended to elicit the strongest peak reductions (on
event days), followed by critical peak rebate (CPR), and finally static TOU and hourly or sub-
hourly real-time pricing (RTP, for which there is relatively little data). One study found a
slight decrease in peak reduction in longer static TOU trials, while the opposite was the case
for CPP/CPR trials.46 The same study also broke down pilots by sample size; there was
substantial variability, but no indication that larger trials saw smaller peak reductions. U.S
Department of Energy trials showed that opt-in customers tended to be more responsive than
opt-out customers (11% peak reduction after two years, vs 6%).47 Peak reductions in the
UK/Ireland trials were at the mid to lower end of the ranges represented in the reviews. It is
noteworthy that the LCL trial also showed an average 11 to 14% increase in consumption
during low price periods, suggesting potential for trough-filling (such as during times of low
net load).
Large Loads and Automated Response
The reviews are consistent in showing that the magnitude of response tends to be larger
when customers have large loads such as air conditioning, electric heating and other major
46 Stromback, J., Dromacque, C. and Yassin, M., ‘The potential of smart meter enabled programmes
to increase energy and system efficiency: a mass pilot comparison’, VaasaETT Global Energy Think
Tank, 2011. 47 U.S. Department of Energy, Final Report on Customer Acceptance, Retention, and Response to
Time-Based Rates from the Consumer Behavior Studies, 2016. Available at:
https://www.smartgrid.gov/files/CBS_Final_Program_Impact_Report_20161107.pdf

42 | brattle.com
appliances. Modelling by The Brattle Group suggests that while customers with major
appliances in hot climates may be able to reduce peak demand by 15 to 40%, depending on
TOU price ratio, the reduction for customers in cool climates with no major appliances is did
not exceed 10% at any price ratio.48 This latter figure is broadly in line with the results of
recent UK/Irish trials included above, representing a cooler climate with limited penetration
of large electrical loads.
The presence of technology which could automate response to TOU pricing consistently
increased peak reduction. The U.S. DOE trials focused on the use of programmable
communicating thermostats (notably, all for air conditioning), which increased response to
static TOU, CPP and CPR tariff designs. Automation also had modest reliability benefits.
None of the recent UK/Irish trials tested automation of appliances in response to price signals.
CPP and CPR tariffs have most often been tested thus far for their ability to reduce summer
peak demand, so most of the effects shown in the results reflect automaton of air-
conditioning systems. Although GB expects growth in major electric appliances (i.e. heat
pumps and electric vehicles), there is currently little evidence on automating response in GB.
However, evidence that is available elsewhere suggests that automation has an important role
to play. For example, a study by SDG&E found EV owners used timers to set their EVs to
charge at off-peak times.49
Bill Savings
Few of the studies reviewed reported on financial savings, and the extent of savings is clearly
dependent on specific aspects of tariff design. Trial results on this and other metrics can be
skewed as bill protection is often offered, meaning customers face no actual penalty if they do
not alter their behaviour. Reported savings for the UK/Irish trials were as follows:
Low Carbon London (LCL): Over 75% saved compared to flat rate, mean saving £21,
4.3% (info on average loss unavailable), maximum loss £40
Customer Led Network Revolution (CLNR): 40% of participants would have lost
money (without bill protection), median loss £18.40 (info on average saving was
unavailable), maximum loss £190.78
Irish Customer Behaviour Trial (CBT): Range of measures used, but on average
participants saved (average €0.67 to €25.47 depending on measure)
Distributional Impacts
There is mixed evidence on the existence of associations between various socio-economic
variables and response to TOU pricing. Previous Brattle review and modelling based on data
48 Faruqui, A. and Sergici, S., ‘Arcturus: International Evidence on Dynamic Pricing’, The Electricity
Journal, 26(7), pp. 55–65, 2013. doi: 10.1016/j.tej.2013.07.007. 49 Cook, J., Churchwell, C. and George, S., Final Evaluation for San Diego Gas & Electric’s Plug-in
Electric Vehicle TOU Pricing and Technology Study. Nexant, 2014. Available at:
https://www.sdge.com/sites/default/files/documents/1681437983/SDGE%20EV%20%20Pricing%2
0%26%20Tech%20Study.pdf
43 | brattle.com
from U.S. trials has suggested peak reduction tends to be slightly lower for low-income than
average customers, but that the majority of such customers will benefit financially even
without load shifting as their demand tends to be flatter.50 The review of pilots by VaasaETT
found that ‘social factors such as age, income, education, household size, load profile and
environmental factors such as house type, house size, house age etc. ... do not have an impact
on pilot results’.51 However, they note that such factors are rarely captured by studies.
The UK/Irish trials also show somewhat mixed results. The CLNR trial found no significant
difference between customer sociodemographic categories either in peak reduction or
likelihood of saving/losing money overall. Similarly, Low Carbon London found no
significant differences in response between sociodemographic groups. In the Irish Customer
Behaviour Trials, higher socio-economic groups achieved greater overall electricity
reductions – they also tended to consume more electricity originally. There was less of a
pattern for peak reduction, with higher reduction associated with more education and having
children in the home.
Summary
The reviews included show high variability of peak reductions within and between tariff
designs, but CPP tends to provoke highest reductions, followed by CPR and static TOU (RTP
is similar, but with less evidence). UK/Irish trials are at the mid to lower end of the range
(usually up to 10% peak reduction) – consistent with low penetration of major appliances
such as air conditioning and lack of automated response (which has been shown to
significantly increase response, although predominantly in the case of air conditioning). Field
trial participants tended of save money on TOU tariffs compared to flat rate tariffs, but
savings (and the proportion who save) are variable and large losses are possible. There is no
strong evidence for consistent associations with socio-demographic factors.
50 Faruqui, A., Sergici, S. and Palmer, J., The Impact of Dynamic Pricing on Low Income Customers.
IEE Whitepaper, 2010. Available at:
http://www.edisonfoundation.net/IEE/Documents/IEE_LowIncomeDynamicPricing_0910.pdf 51 Stromback, J., Dromacque, C. and Yassin, M., ‘The potential of smart meter enabled programmes
to increase energy and system efficiency: a mass pilot comparison’, VaasaETT Global Energy Think
Tank, 2011.

44 | brattle.com
V. TOU Marketing Considerations: Primary Market Research
INTRODUCTION The systematised review we undertook for this report (see Section IV) identified relatively
little research which set out explicitly to measure potential uptake to TOU tariffs, and no
research on certain tariff designs and marketing considerations. We therefore conducted a
large survey experiment to begin to address these research needs. Administered online to a
nationally representative sample of nearly 3,000 energy bill-payers in Great Britain, the
experiment measured customers’ stated uptake to a range of TOU tariffs and related offerings
with different experimental groups being shown different tariff designs or other information
in a randomized control trial design. This section of the report describes the aims and findings
of each experiment.52
TARIFF DESIGN In the tariff design experiment, participants were randomly assigned to one of five groups,
and were shown one of five TOU tariffs and an attractive flat-rate tariff that was the same
across all groups (with single rate of 12p/unit of electricity).53 Participants were then asked if
they would switch to the TOU tariff, the flat-rate tariff, or stick with their current tariff. The
five TOU designs were:
1. A static TOU with off-peak rate of 6p/unit (weekends, daytime, night) and on-peak
rate of 18 p/unit (weekday evenings)
2. An inverted TOU (iTOU) with a standard rate of 15p/unit applying in non-summer
months and during specific times in summer and a day rate of 5p/unit applied during
summer months in mid-day hours.
3. Critical Peak Pricing (CPP), where a price of 60p/unit was charged during up to 18
events, with a base rate of 10p/unit.
4. Critical Peak Rebate (CPR), where bill credit was given during up to 18 peak events if
consumers reduced their peak period consumption, with a base rate of 12p/unit.
5. Real-time pricing (RTP) with last year’s annual average being given as 10p/unit.
All tariffs were advertised with the same standing charge of 22p and as being fixed for a year,
with switching possible at any time without paying a fee. Given that the main outcome of
interest was switching to a TOU tariff, we combined the answer categories of switching to the
flat rate tariff and staying on one’s current tariff into one, and contrasted it with switching to
a TOU tariff.
52 Further detail on this study is provided in Appendix F. 53 Showing both tariffs was seen as being closer to reality as in any real-world switching, consumers
would see TOU tariffs and static tariffs when e.g. using a comparison webpage.

45 | brattle.com
Overall, about one quarter (26%) of respondents indicated they would switch to the TOU
tariff, with the same proportion (26%) switching to the flat-rate tariff; the remaining half
(48%) indicated they would rather stay on their current tariff. Figure 13 shows the
percentage of respondents switching to the various TOU Tariffs.
Figure 13:%age of Respondents who would Switch to a TOU Tariff
The inverted TOU was the most popular tariff, with a statistically significantly greater
proportion switching to it than to any other tariff.54 The second most popular tariff was real-
time pricing; however, the difference in percentage switching was only significantly different
to the static TOU. The share of those switching to a static TOU, critical peak pricing, and
critical peak rebate did not differ significantly from each other.
These results are somewhat surprising in light of previous research. The relatively low uptake
of the static TOU and the high uptake of real-time pricing are particularly noteworthy.
Regarding the latter, anecdotal evidence55 suggests that real-time pricing could be perceived
as fair and/or transparent, if consumers feel they are paying the actual price of electricity
without any hidden fees to the supplier. The lower attractiveness of static TOU in comparison
to both previous estimates and to the inverted TOU is potentially explained by respondents
putting greater emphasis in their decision on unit prices – which were lower in the inverted
TOU – and neglecting the temporal aspect of when the prices would apply.
In a second step we analysed which factors were related to switching to a TOU tariff. Those
living in socially rented accommodation were significantly less likely to sign up to a TOU
tariff than owner-occupiers (78% vs 73% not signing up). Also, those older than 65 years
were significantly less likely to sign up to a TOU tariff than those aged 18-34 (78% vs 69%
54 Statistical significance is set at p <0.05.
55 For example media reports on Flick Electric Co. in New Zealand, which offers a real-time pricing
tariff (see Reed, R. [2015], ‘Cheap is never nasty with NZ’s fairest power deal’, Kiwi Families,
https://www.kiwifamilies.co.nz/2015/10/cheap-is-never-nasty-with-nzs-fairest-power-deal/
46 | brattle.com
not signing up).56 Also, those with an income above £120,000 were significantly more likely
to sign-up to a TOU tariff than those with a median income (category £20,000-30,000). Both
the perceived ease of use of a tariff and in particular the perceived ability to save money on
the tariff were highly significant impact factors.
No other analysed factors were significantly related to switching rates (i.e., gender,
employment status, type of heating system, occupancy pattern, children under 15, being on
prepayment meter, household size, being on a TOU, having appliances with timers).
MARKETING In this experiment, participants were asked if they would sign up to a three-period static TOU
tariff.57 Instead of randomly assigning participants to different tariff designs, participants
were randomly shown different types of marketing messages promoting the same tariff to see
what effect, if any, this might have on the average person’s willingness to switch to the TOU
tariff or even the willingness of particular consumer sub-group to switch. One group of
participants were shown a flat-rate tariff to control for general willingness to switch. Overall,
there were six experimental groups altogether:
1. Flat rate tariff (no marketing message)
2. Static TOU (no marketing message)
3. Static TOU + bill protection where participants are informed that they will get
reimbursed during the first six months should their bill be higher than under a flat
rate tariff
4. Static TOU + tailoring where the tariff is described as being particularly suitable for
electric vehicles owners
5. Static TOU + labelling where the tariff is presented to be approved as a ‘good tariff’ by
the British energy regulator
6. Static TOU + disaggregation, where participants are told they will see electricity
consumption broken up by appliance
Participants were asked whether they would switch to the tariff or whether they would like
to stick with their current tariff. The average willingness to switch across all conditions is
high compared to observed switching rates in GB; 32% of participants said that they would
switch across all experimental conditions with an average switching rate to the TOU tariff of
30%. However, willingness to switch varies depending on the group to which participants
were assigned.
56 However, the effect of tenure and age were relatively weak and no longer significant at p < 0.05
once controlling for multiple comparisons. The percentages provided are not adjusted for other
variables.
57 A three-period static TOU tariff would have a high priced peak period during late afternoon /
early evening, a low-price off-peak period during nighttime hours, and a mid-priced mid-peak
period during all other hours.

47 | brattle.com
Figure 14: Intention to Switch to Tariff Across Marketing Conditions
Regression analysis58 shows that compared to the static TOU group with no marketing
intervention, uptake of the flat-rate tariff is significantly higher and, as expected, uptake of
the tariff tailored to electric vehicle owners is significantly lower – both with large effect
sizes. There were no statistically significant differences in uptake for the other groups. When
compared to the flat-rate tariff, uptake to the TOU tariff is statistically significantly lower
regardless of what marketing method is used.
Finding that a TOU tariff with bill protection is less appealing than a flat-rate tariff and no
more appealing than a TOU tariff without any bill protection at all was quite surprising. A
similar survey run in Australia found that bill protection increased willingness to switch to a
TOU tariff by 10%, making it as appealing to switch to as a standard flat-rate tariff.59
However, our analysis did show that for loss-averse consumers (people more concerned about
avoiding financial losses than making financial savings), combining the TOU tariff with bill
protection means that this group of consumers are no longer less willing to switch to a TOU
tariff than a flat-rate tariff.
The finding that the EV-tailored message reduced the average bill payers’ willingness to
switch is consistent with our predictions given that the average person does not own an EV
and just 5% of the participants in our sample indicated that they owned or leased an electric
58 A type of analysis which estimates the level of association between variables.
59 One possible explanation for this difference is that the Australian survey did not give customers an
option to stick with their current tariff; rather, they were asked to indicate how willing they
would be to switch to the time of use tariff on a scale ranging from 1-100. Although a score of 1
could be interpreted by customers as not switching, it is perhaps not as salient an option as in this
survey, where customers were making a binary choice over whether to switch to the tariff or stick
with their current one. In reality, this is the choice customers will be faced with, and, as is
evident, inertia is highly prevalent in the GB energy market, with the majority of consumers not
switching tariff or supplier despite large savings potential.

48 | brattle.com
vehicle. Nevertheless, and as expected, our results do suggest that EV owners are significantly
more likely to switch to a TOU tariff when they are told it is well suited to them. Used
wisely, this tailoring approach could also be used to deter customers who may be financially
better off sticking with a flat rate tariff, from switching to a time of use tariff.
Including a quality assurance label was expected to increase TOU tariff uptake. That it did not
may be reflective of the fact consumers are not familiar with the UK energy regulator (see
findings in next section regarding trust). It is possible that approval by another external body
could increase willingness to switch.
Similarly, telling customers the tariff would come with an app showing them how much
electricity is being used by each of their household appliances (disaggregation) had no impact
on willingness to switch. That is also surprising, considering anecdotal evidence indicating
that customers have expressed a desire for this type of information.60 A possible reason for
this is that customers have limited use for the energy information due to constraints on time
and capacity to process the information.
CRITICAL PEAK REBATES In this study, we have identified CPRs as a potentially attractive tariff design option for
domestic GB customers. Given the relevance of that tariff design, we used this experiment to
explore the impact of various schemes to compensate customers for reducing electricity
demand at specified times throughout the year. We tested two options:
The effect of the type of rebate on uptake. The control option was a payment of £20
directly into the participant’s bank account. Comparators were a £20 electricity bill
credit, 100 free units of electricity and a lottery to win one of five £1000 cash prizes.
We were interested to know if consumers would be less willing to sign up to lower
value offerings (especially the free units, equivalent to around £12-14 per consumer,
and lottery which would be worth an average of £5 per consumer if 1000 customers
participate61).
The effect of the identity of the organisation offering the rebate. The control (and
other) options were framed as offered by the participant’s current supplier. The
comparator was a direct payment from a fictional company “Purple Power, an energy
management company”. The objective was to test the potential for non-suppliers
unknown to consumers to offer this kind of product.
Figure 15 shows the proportion of participants in each group who said they would sign up to
the offering.
60 There are a number of commercially available products that aim to enable consumers to see a
breakdown of their household electricity use by appliance – see for example Bidgely, PlotWatt
and Smappee. 61 These financial equivalents were intentionally not made explicit to participants.

49 | brattle.com
Figure 15: Percentage of Customers Signing up to CPR
Mean uptake across the groups was 31% (range 23 to 35%). Statistical testing revealed no
significant differences in uptake across the experimental groups, with the exception of the
lottery, which was significantly less attractive. This option is likely to have constituted the
lowest average value per consumer, and participants may have recognized this. It was also the
only option where a reward was not guaranteed. However, the equivalence in uptake
between the free units and direct payment (and bill credit) options suggests that the lower
value of free units was not recognized. Under this option consumers would be a third worse
off than under the direct payment or bill credit options for providing the same service, while
the saving to suppliers would be even greater since the marginal cost to them in supplying a
unit is less than the retail price. Significant differences were also apparent between age
groups, with more than twice as many 18-34 year-olds (55%) willing to sign up to the basic
offering (with bank transfer) than those aged 55 and over (25%).
The finding that there was not a significant impact on uptake when CPR is offered by an
unknown company suggests the market for this kind of offering is open to a wider variety of
non-supplier entrants and actors (including distribution network operators), which may be
good for consumer choice and competition.
DIRECT LOAD CONTROL Other sections of this report have touched on the potential for automation to support
flexibility of electricity demand. This experiment set out to test the acceptability of a scheme
where suppliers offer consumers a free smart thermostat in return for permission to turn their
heating up and down to help shape demand. We explored the effect on uptake of changing
the temperature range over which this could operate (either 1 or 3 oC up and down), the
provision (or not) of override ability and the effect of offering a choice of thermostats versus a
single model. Figure 16 shows the uptake results for each experimental group.

50 | brattle.com
Figure 16: Percentage of customers signing up to the Thermostat Offer
Mean uptake of the thermostat offer was 33% (range 29 to 39%). The difference in uptake
between offerings allowing 1 or 3 oC changes up or down was not significant. However,
customers were significantly more likely to sign up when they had the possibility to override
supplier control (bars 1 and 2) compared to when they were explicitly told they did not (bars
3 and 4). This suggests that consumers either are not concerned about the potential to
experience up to 6 oC swings in temperature so long as they can override it, and/or that that
giving temperature information in this way was not meaningful to many customers. It is
notable that 29% of customers still said they would sign up to the offering with maximum
temperature range and no override – a situation with potentially concerning consequences,
especially for vulnerable individuals.
Providing consumers with a choice of thermostats did not significantly affect uptake
compared to the control group (low [1 oC up or down] temperature change, with override),
perhaps suggesting that thermostat design is not the driving consideration in this decision.
There were, again, significant differences in uptake by age group, with almost two-thirds
(65%) of 18-34 year-olds signing up to the basic offering (low temperature range, with
override) compared to just 26% of those aged 55 and over.
TOU TARIFFS AND TRUST Previous work has shown that customers who say they trust their energy supplier are more
likely than those who do not to switch to a TOU tariff offered by that supplier62. However, in
the experiment we explored the opposite question – whether the act of offering TOU tariff
might have an effect on consumer trust in suppliers. This interest was prompted by informal
discussions with suppliers suggesting concern that consumers perceive such tariffs as just
62 Fell, M.J., Shipworth D., Huebner G.M., Elwell C.A, Knowing Me, Knowing You: The role of
trust, locus of control and privacy concern in acceptance of domestic electricity demand-side
response. ECEEE 2015 Summer Study Proceedings, Presqu’île de Giens, France: 2015, p. 2153–63.

51 | brattle.com
another attempt by suppliers to make profit. Such a perception amongst suppliers could
prevent TOU tariffs coming onto the market.
We measured customers’ stated trust in their supplier in four different experimental groups.
The first group simply included the questions on trust. The second group saw these questions
preceded by a statement that many suppliers, including theirs, are looking offer more TOU
tariffs. The third group saw a similar statement, but in this case it said that the government
was encouraging suppliers to introduce such tariffs. The final saw the same statement but
with ‘consumer organizations’ instead of the government. In this way, we aimed to test both
the effect of offering TOU tariffs on trust in suppliers, and also whether this could be affected
depending on where the driver for this was seen to come from. Figure 17 summarises the
results.
Figure 17: Customers Stating they View their Supplier as Very/Fairly Trustworthy
Mentioning time of use tariffs had a statistically significant negative impact on stated trust in
supplier, although the effect was very small. This negative effect increased when it was
suggested that this was driven by government. However, when it was suggested that it was
encouraged by consumer groups, mentioning TOU tariffs was statistically no different from
not mentioning TOU tariffs at all. To some extent this finding validates possible concerns
amongst suppliers that introducing TOU tariffs could have negative trust impacts. It also
suggests that government may not be the best organization to mitigate this impact, and that
trusted independent bodies could have a more important role to play.

52 | brattle.com
VI. Conclusions and Recommendations The findings of this study lead to a number of recommendations for policymakers, network
operators, suppliers, and other industry stakeholders that are exploring the possibility of a
transition to TOU tariffs.
Focus on customer engagement and communication, as they will be critical considerations in
any tariff transition.
The estimates of TOU value established in this study essentially scale linearly with
enrolment. At low levels of TOU enrolment, value will be very limited. But if a significant
number of domestic customers enrol in well-designed TOU tariffs in the future, the benefits
could be on the order of tens or hundreds of millions of pounds per year. It will therefore be
critical to explore innovative options for engaging with customers about the potential benefits
of the new tariff offerings. This is supported by the conclusion of the “satisfaction
assessment” described in Section IV, which suggests that customers may demonstrate initial
risk aversion when considering enrolling in a TOU tariff, but are typically highly satisfied
once they have experience with the tariff and understand its impacts and the opportunities it
presents.
The findings of the primary market research described in Section V further suggest that
additional considerations may be necessary for vulnerable households. Across all designs,
average TOU uptake (at 26%) is broadly consistent with previous findings63 and government
aspirations64. However, the lower uptake amongst the older population suggests these
consumers may in need of greater outreach and engagement efforts in order to benefit from
any savings potential associated with TOUs.
Tailored messaging was effective at boosting demand for a static TOU amongst EV owners (a
group that is potentially more likely to save money on TOU tariffs). If suppliers could design
TOU tariffs suited to the lifestyles or consumption patterns of particular consumer groups –
and market these tariffs accordingly – this may provide a potential avenue for increasing
uptake to TOU tariffs while helping consumers to switch to tariffs that will save them money
(see Section IV which showed that some customers who signed up to TOU tariffs in trials
experienced bill increases).
Finally, the findings of our primary market research hint that there should be some concern
that offering TOU tariffs could have negative implications for trust in the electricity supply
industry, although this effect is small. They also suggest that trusted non-governmental
63 Fell, M.J., Nicolson, M., Huebner, G.M., Shipworth, D., “Is it time? Consumers and time of use
tariffs”, report to Smart Energy GB, 2015.
https://www.researchgate.net/publication/273446769_Is_it_time_Consumers_and_time_of_use_ta
riffs 64 BEIS, “Smart meter roll-out cost benefit analysis,” 2015.
https://www.gov.uk/government/uploads/system/uploads/attachment_data/file/567167/OFFSEN_2
016_smart_meters_cost-benefit-update_Part_I_FINAL_VERSION.PDF
53 | brattle.com
organizations could be best placed to mitigate such concern. A strategic approach will
therefore be needed to minimize the risk that TOUs are not introduced by suppliers through
concern about negative trust implications.
Take a holistic view of the value of TOU tariffs that extends beyond simple monetary value.
There is surprisingly limited variation in value across the core TOU tariff designs (i.e., TOU,
CPP, and CPR). This is partly because, from an operational standpoint, the strengths and
weaknesses of the design of each tariff tend to have offsetting influence on the relative value
of each tariff option. The similarity in value estimates is also due to a lack of evidence from
the available research to suggest very significant differences in customer uptake of the
different tariff options.65
The similarity in system value estimates across the TOU options means that non-monetary
considerations could be as or more important than monetary considerations in future TOU
deployment decisions. If TOU deployments are part of future policy considerations, non-
monetary considerations will include simplicity in tariff design and perceived “ease of use” of
the tariff by consumers, fairness, the potential impacts on low income customers, and the
extent to which the tariff designs align with the UK government’s energy policy objectives.66
Give critical peak rebate (CPR) tariffs serious consideration and test them through an opt-out
field trial.
CPR tariffs have received relatively little attention as a tariff option in GB thus far. Field
trials in GB and Ireland have largely focused tariffs with higher peak period prices and lower
off-peak period prices (both static and dynamic). The customer-friendly design and proven
impact on peak demand of CPR tariffs makes them a potentially attractive candidate for cost-
effectively tapping into the demand response potential of the domestic sector.
CPR tariffs could be particularly interesting to explore through a field trial that is deployed
on an opt-out basis. There is some scepticism in GB around the validity of the findings prior
TOU field trials, in part due to concern about self-selection bias among voluntary
participants. A field trial with opt-out participation would help to assess the validity of these
concerns.67 CPR tariffs are perhaps easier to test on an opt-out basis than other tariffs due to
the no-lose proposition that they offer to customers (i.e., they are simply “layered” on the
customer’s existing tariff, with no financial downside to the customer).
65 Future primary market research that extends beyond surveys and includes focus groups and other
methods may help to identify more distinct differences in consumer preferences for the tariff
options. 66 For further discussion of fairness in tariff design, see Jon Bird, “Smarter, Fairer? A discussion paper
on cost reflectivity and socialisation of costs in domestic electricity prices,” prepared for
Sustainability First, March 14, 2016. 67 For instance, opt-in and opt-out offerings could be tested side-by-side in a controlled experiment
to assess the relative impacts of each.
54 | brattle.com
It is arguably surprising that uptake of the CPR offering was not higher in the market
research conducted in our study, given the no-lose proposition of the tariff. This suggests that
non-financial considerations – such as not wanting to have to pay attention to alerts – may be
influencing customers’ perception of the tariff. In a future CPR offering, it will be critical to
better understand any concerns and identify the type of information that needs to be
provided to consumers to make the benefits of such an offering clear.
Ensure charging and settlement processes facilitate the provision of economically efficient
TOU design.
If there is an expectation that suppliers will offer TOU tariffs in the future, they will need to
have a financial incentive to do so. Without half-hourly settlement, and to the extent that
network charges do not accurately reflect the time-varying nature of the cost of delivering
power, suppliers currently do not incur costs in a manner that rewards them or their
domestic customers for shifting load from high-cost to low-cost hours. In fact, without this
incentive, it is conceivable that suppliers could develop tariff designs that may facilitate an
increase in market share but would encourage electricity consumption behaviour that would
unintentionally also increase system costs.
Of course, the costs of improving the settlement and charging processes should be compared
to the benefits of doing so. This activity is currently underway in part through Ofgem’s
ongoing Mandatory Half Hourly Settlement business case analysis.
TOU design should focus primarily on avoiding capacity costs in the near- to medium-term.
In our analysis, across a range of scenarios, avoided generation capacity cost drives the bulk of
TOU value. Exploring opportunities to avoid the capital costs associated with new
generation, transmission, and possibly distribution capacity is likely to continue to be more
productive than chasing energy value, particularly if the addition of renewable and nuclear
capacity leads to reductions in wholesale energy market prices in the future.
The situation could change if, in the future, the GB market has little marginal generation
capacity value due to significant excess generation supply (e.g., similar to the situation in
Germany and Spain). In this case, particularly if the supply mix is dominated by renewables,
it seems likely that the widespread adoption of smart home technologies would be needed to
unlock the value of real-time energy price arbitrage and/or the provision of ancillary services
(the latter of which would likely need to be pursued through demand-side response
programmes rather than pricing programmes due to the complexity of conveying real-time
ancillary services prices to consumers).
It is also important to consider the implications of TOU tariff design in the context of the
system value that the tariffs can provide. In this study, we have quantified the value of TOU
tariffs that are well designed from a system cost standpoint. That is, we have examined cost-
based tariffs that are designed specifically to encourage customers to consume electricity in a
more economically efficient manner. At the same time, we have identified a significant
amount of general customer interest in TOU tariffs (26% indicated that they would switch to
a TOU tariff). It is possible that, in the future, suppliers will choose to offer TOU tariff
55 | brattle.com
designs which maximize customer uptake but do not accurately reflect system costs.68 In this
situation, it is possible that TOU participants will change their electricity consumption
behaviour in response to the TOU price signal in a way that actually contributes to an
increase in system costs. It will be important from a policy standpoint to consider the extent
to which this may lead to costs being over-recovered from non-participants in order to make
up for the shortfall.
Voluntary smart home rate (SHR) tariffs may help to solve the “chicken and egg” problem
that is perceived to limit the adoption of automating technologies.
There is a perception among some industry stakeholders that automating technologies will
not achieve significant market traction until there are granular retail price signals to which
the technologies can respond. A cost-based, voluntary SHR tariff could provide this
opportunity. The voluntary nature of such an offering would provide an opportunity for
financial savings to those customers who have the technology without exposing those
customers who do not invest in the technology to the financial risk associated with variable
prices. A well-designed tariff that is cost-based would ensure that non-participants would
not bear the burden of under-recovered costs in the SHR tariff.
Explore options available for making automating technologies available to low income
customers.
This study has demonstrated that there is significant value in TOU tariffs to be unlocked by
automating technologies. According to our study, widespread adoption of automating
technologies could easily double the value of TOU tariffs, and would potentially provide
other demand-side response benefits as well.
Further, consumer interest in direct load control in our market research study (see Section V)
was significant (at one-third of customers), particularly considering that the only associated
reward was the upfront provision of a smart thermostat. There are indications that a
substantial proportion of customers could be willing to sign up to such an offer while yielding
large amounts of control to third parties (i.e. up to 6 oC temperature range with no possibility
of override).69 This suggests fairly broad interest in automating technology among GB
customers.
Given the up-front cost of both automating technology and the new electric end-uses that
they are designed to control (e.g., electric vehicles), it is possible that these opportunities
could be limited to customers with higher incomes. However, maximising the net societal
value of automating technologies – and ensuring that there will not be negative distributional
impacts associated with their adoption – will likely require facilitating widespread uptake of
the technology. As such, it will be important to examine options that are available to extend
68 This is more likely in a situation where suppliers are not exposed to and settled in a matter that
fully reflects the time-varying nature of power costs. 69 Regulators or consumer advocates should ensure that vulnerable consumers are protected against
possible harm or discomfort that may result from such potentially severe conditions.
56 | brattle.com
these opportunities to all types of customers and not just those with higher incomes. On-bill
financing, rebates, and low-income energy efficiency assistance programmes are policy
options that have been explored in various contexts in other jurisdictions and could be useful
to consider in the context of smart home technologies for customers in GB as well.
Further exploration of the benefits of an inverted TOU (iTOU) tariff in areas with high
distributed solar PV adoption could be a valuable future research activity.
The strong showing of the inverted TOU tariff – the first time uptake for such a tariff has
been measured amongst the average British energy bill payer – could be positive for
distribution networks struggling to deal with high levels of solar generation. However, given
that preliminary experience with the Sunshine Tariff identified difficulty in enroling
customers, more research is needed to explain and confirm the popularity demonstrated in
our study.
There is a need for new and innovative research on consumer preferences for TOU tariffs and
their potential system impacts.
Throughout this report, we have identified a number of areas that would benefit from further
research. Regarding system value, there is a particular need to better understand the
potential impacts that TOU tariffs could have on the distribution system. Avoided
distribution capacity costs are a very system-specific calculation. It would also be valuable to
conduct bill impact analysis using individual customer load shapes. This could provide
insight regarding how bills for various customer segments are likely to change under the new
tariff offerings, and the magnitude of bill savings that might be achieved by participants with
various energy management technologies.
Further research would also be valuable in regarding customer preferences for TOU tariffs.
For instance, further analysis of customers’ relative preferences for different TOU tariff
designs (static TOU, CPP, CPR, etc) is needed. While the research conducted in this study
detected limited differences in uptake across the tariff designs, alternative research
methodologies may enhance our understanding of these findings.
As the supply mix changes and customers adopt new electricity intensive technologies and
distributed generation, it is possible that the timing of the peak period will change for system
planning purposes. New research on customer preferences for different peak period pricing
windows would be useful in this regard.
Finally, this study found that TOU uptake is surprisingly resistant to measures aimed at
increasing enrolment, such as adding bill protection or quality assurance labelling. More
work is needed to understand the reasons for these findings and explore alternative ways of
reassuring and protecting consumers.

57 | brattle.com
References and Additional Resources General
Baringa and Element Energy, “Electricity System Analysis – Future System Benefits from
Selected DSR Scenarios,” prepared for DECC, August 2012.
BEIS, “Smart Meter Roll-out Cost-Benefit Analysis,” November 10, 2016.
Bird, Jon, “Smarter, Fairer? A discussion paper on cost reflectivity and socialisation of costs in
domestic electricity prices,” prepared for Sustainability First, March 14, 2016.
Citizens Advice, “Take a Walk on the Demand-Side,” August 2014.
Cook, Jonathan, Candice Churchwell. and Stephen George, Final Evaluation for San Diego
Gas & Electric’s Plug-in Electric Vehicle TOU Pricing and Technology Study. Nexant, 2014.
Faruqui, Ahmad, Neil Lessem, Sanem Sergici, Dean Mountain, Frank Denton, Byron Spencer,
and Chris King, “Analysis of Ontario’s Full Scale Roll-out of TOU Rates – Final Study,”
prepared for the Independent Electric System Operator, February 3, 2016.
Faruqui, Ahmad, Ryan Hledik, and Neil Lessem, “Smart by Default,” Public Utilities Fortnightly, August 2014.
Faruqui, Ahmad, and Sanem Sergici, “Arcturus: International Evidence on Dynamic Pricing,”
The Electricity Journal August/September 2013.
Faruqui, Ahmad, Sanem Sergici, and Jennifer Palmer “The Impact of Dynamic Pricing on
Low Income Customers,” IEE Whitepaper, 2010.
Fell, Michael, David Shipworth, Gesche Huebner, and Clifford Elwell. Knowing Me,
Knowing You: The role of trust, locus of control and privacy concern in acceptance of
domestic electricity demand-side response. ECEEE 2015 Summer Study Proceedings,
Presqu’île de Giens, France: 2015, p. 2153–63.
Fell, Michael, Moira Nicolson, Gesche Huebner, and David Shipworth, “Is it time? Consumers
and time of use tariffs”, report to Smart Energy GB, 2015.
Glick, Devi, Matt Lehrman, and Owen Smith, “Rate Design for the Distribution Edge,” Rocky
Mountain Institute report, August 2014.
Graterri, Walter, and Simone Maggiore, “Impact of a Mandatory Time-of-Use Tariff on the
Residential Customers in Italy,” November 14, 2012.
Hesmondhalgh, Serena, Gill Owen, Maria Pooley, and Judith Ward, “GB Electricity Demand
– 2012 and 2025. Impacts of Demand Reduction and Demand Shifting on Wholesale Prices
and Carbon Emissions, Results of Brattle Modelling,” prepared for Sustainability First,
January 2014.

58 | brattle.com
Hledik, Ryan, Judy Chang, and Roger Lueken, “The Hidden Battery: Opportunities in Electric
Water Heating,” prepared for NRECA, NRDC, and PLMA, January 2016.
Hledik, Ryan, and Ahmad Faruqui, “Valuing Demand Response: International Best Practices,
Case Studies, and Applications,” prepared for EnerNOC, January 2015.
Lefkowitz, Karen, Direct Testimony Before the Maryland Public Service Commission, April
2016
National Grid, “Capacity Market Auction Guidelines,” July 2016, pg. 5.
National Grid, “Provisional Capacity Market Results,” 2014-2016.
Potter, Jennifer, Stephen S. George, and Lupe R. Jimenez, “SmartPricing Options Final
Evaluation,” prepared for the U.S. Department of Energy, September 2014.
Stacey, Kiran, “UK Turn to Diesel to meet Power Supply Crunch,” Financial Times, November 3, 2015.
Star, Anthony, Marjorie Isaacson, and Larry Kotewa, “Evaluating Residential Real-Time
Pricing: Connecting Customer Response to Energy Market Impacts.”
Stromback, Jessica, Christophe Dromacque, and Mazin Yassin, “The potential of smart meter
enabled programmes to increase energy and system efficiency: a mass pilot comparison,”
VaasaETT Global Energy Think Tank, 2011.
U.S. Department of Energy, Final Report on Customer Acceptance, Retention, and Response
to Time-Based Rates from the Consumer Behavior Studies, 2016.
Walton, Robert, “The non-wire alternative: ConEd’s Brooklyn-Queens pilot rejects
traditional grid upgrades,” Utility Dive, August 2016.
Market Scenario Development
Boait, P. and Anne Stafford, “Electrical Load Characteristics of Domestic Heat Pumps and
Scope for Demand Side Management,” 21st International conference on Electricity
Distribution, Frankfurt June 2011.
Braun, David, and Paul Rowley, “Modeling the Contribution of Domestic Heat Pumps to
Delivering UK Energy Policy Objectives,” Applied sciences, December 2012.
Ecotope Inc, “Heat Pump Water Heater Model Validation Study,” Prepared for the Northwest
Energy Efficiency Alliance, March 2015.
Element Energy, “Further Analysis of Data from the Household Electricity Usage Study,”
Prepared for the Committee on Climate Change, March 2014.
Element Energy, “Pathways to high penetration of electric vehicles,” Prepared for the
Committee on Climate Change, December 2013.

59 | brattle.com
Gardner, P, “UK Generation and Demand Scenarios for 2030,” Prepared by Garrad Hassan,
September 2011.
Imperial College London, “Impact & opportunities for wide-scale EV deployment,” Prepared
for UK Power Networks Report B1, September 2014.
“Impact of Electric Vehicle and Heat Pump loads on network demand profiles,” Prepared for
UK Power Networks Report B2, September 2014.
Kelly, Nick, and Paul Tuohy, “Future Energy Demand in the Domestic Sector,” University of
Strathclyde, October 2012.
“Mid-term Adequacy Forecast 2016 editions,” European Network of Transmission System
operators for Electricity.
MIT, “MIT Study on the Future of Natural Gas,” Appendix 5D, 2011.
National Grid, “Future Energy Scenarios: GB gas and electricity transmission,” July 2016.
Pasaoglu, G, D. fiorello, L. Zani, A. Martino, A. Zubaryeva, and C. Thiel, “Projections for
Electric Vehicle Load Profiles in Europe Based on Travel Survey Data,” JRC Scientific and
Policy reports for the European Commission, 2013.
UK Department of Energy & Climate Change, “Updated energy and emissions projections:
2015,” February 2016.
Acceptance of TOU Tariffs
Baladi, Mostafa, Joseph Herriges, and Thomas Sweeney, “Residential response to voluntary
time-of-use electricity rates,” Resource and Energy Economics, September 1998.
BEIS, “Smart Energy Research - BEIS Consumer Panel,” 2016.
Bleything, Sean, Seth Blumsack, Paul Hines, Lisa Morris, “Vermont Electric Cooperative
Consumer Behavior Study Year 2 Final Report - the Effect of Variable Peak Pricing on
Electricity Demand,” June 2015.
Bourne T, Watson M. “Sunshine Tariff - Customer Recruitment Learning Report,” October
2016.
Blumsack AS, Beraldi A, Mountain G, et al, “Load Impact Analysis of Green Mountain Power
Critical Peak Events, 2012 and 2013,” March 2015.
Charles River Associates, “Primer on Demand-Side Management with an Emphasis on Price-
Responsive Programs - Report Prepared for The World Bank,” 2005.
DTE Energy, “Dynamic Peak Pricing Pilot - Final Evaluation Report,” 2014.

60 | brattle.com
Energy Center of Wisconsin, “Minnesota Power’s Advanced Metering Infrastructure Project
AMI Behavioural Research Pilot Interim Results from a Consumer Enhanced Feedback Pilot,”
2014.
Ericson Torgeir, “Households’ self-selection of dynamic electricity tariffs,” Applied Energy,
2011.
Fell, Michael. “Taking charge: perceived control and acceptability of domestic demand-side
response,” 2016.
GDS Associates, “Marblehead Municipal Light Department Energysense CPP Pilot Final
Evaluation Report,” 2013.
Hartway R, Price S, Woo CK. “Smart meter, customer choice and profitable time-of-use rate
option,” Energy. 1999.
Herter Karen, “Residential implementation of critical-peak pricing of electricity,” Energy Policy. 2007.
IHS Global Insight, “Demand Side Market Participation Report,” 2009.
Lakeland Electric, “Lakeland Electric Consumer Behavior Study Final Evaluation Report,”
2015.
Neenan B, Patton M, “FirstEnergy’s Smart Grid Investment Grant Consumer Behavior Study
Final Evaluation,” 2015.
Nicolson, Moira, Gesche Huebner, and David Shipworth, “Are consumers willing to switch to
time of use electricity tariffs? The importance of loss-aversion and electric vehicle
ownership,” Energy Res Soc Sci. January 2017.
NV Energy, “Nevada Dynamic Pricing Trial Final Report,” 2015.
PEPCO, “PowerCents DC Program Final Report,” 2010.
Phillips, Rebekah, Gill Owen, and Judith Ward, “Project Lessons Learned from Trial
Recruitment: Customer - Led Network Revolution Trials,” July 2013.
Potter Jennifer, Stephen George, Lupe Jiminez, “SmartPricing Options Final Evaluation,”
September 2014.
Qiu, Yueming, Gregory Colson, and Michael Wetzstein, “Risk preference and adverse
selection for participation in time-of-use electricity pricing programs,” Resource and Energy Economics, February 2017.
Schare, S. et al., “NSTAR Smart Grid Pilot Final Technical Report,” 2015.

61 | brattle.com
Schofield, James, Richard Carmichael, Simon Tindemans, matt Woolf, mark Bilton, and
Goran Strbac, “Residential Consumer Responsiveness to Time-Varying Pricing - Low Carbon
London Learning Lab,” September 2014.
Star, Anthony, Marjorie Isaacson, David Haeg, and Larry Kotewa, “The Dynamic Pricing
Mousetrap: Why Isn’t the World Beating Down Our Door?” 2010.
Stenner K, Frederiks E, Hobman E V, Meikle S. “Australian Consumers’ Likely Response to
Cost- Reflective Electricity Pricing,” 2015.
Verhagen E, Ketter W, Rook L, van Dalen J. “The impact of framing on consumer selection of
energy tariffs,” 2012 International Conference on Smart Grid Technology, Economics and Policies, 2012.
TOU Satisfaction
Blumsack, Seth, and Paul Haines, “Analysis of Green Mountain Power Critical Peak Events
During the Summer/Fall 2012,” 2013.
Borenstein, Severin, Michael Jaske and Arthur Rosenfeld, “Dynamic Pricing, Advanced
Metering and Demand Response in Electricity Markets,” 2002.
Momentum Market Intelligence, “Statewide Pricing Pilot: End-of-Pilot Customer
Assessment,” December 2004.
DNV GL, “Critical Peak Pricing Pilot,” prepared for Portland General Electric, May 15, 2014.
eMeter Strategic Consulting, “PowerCentsDC TM Program Final Report,” September 2010.
Hammerstrom, D. J. et al, “Pacific Northwest GridWise TM Testbed Demonstration Projects
Part I: Olympic Peninsula Project,” October 2007.
Hartway, Rob, Snuller Price, and C.K Woo, “Smart meter, customer choice and profitable
time-of-use rate option,” Energy, October 1999.
Herter Energy, “SMUD ’ s Residential Summer Solutions Study,” February 2012.
Idaho Power, “2006 Time-of-Day and Energy Watch Pilot Programs – Year Two Final
Report,” 2007.
Marblehead Municipal Light Department, “ENERGYSENSE CPP Pilot Interim Evaluation
Report,” May 2012.
Mui, Ming, “Long Island Smart Energy Corridor Final Technology Performance Report,”
Submitted to U.S. Department of Energy, April 2015.
NSTAR Electric, “NSTAR Smart Grid Pilot Final Technical Report,” Prepared for U.S.
Department of Energy, February 2015.

62 | brattle.com
Connecticut Light & Power, “Results of CL&P Plan-it Wise Energy Pilot,” Docket No. 05-10-
03RE01, Compliance Order No. 4, 2003.
Sioux Valley Energy. “EmPOWER Critical Peak Pricing Pilot Assessment,” March 2012.
Summit Blue, “Final Report for the MyPower Pricing Segments Evaluation,” submitted for
Public Service Electric and Gas Company, December 2007.
UK Power Networks, “DNO Guide to Future Smart Management of Distribution Networks
Summary Report,” December 2014.
US Department of Energy, “Demand Reductions from the Application of Advanced Metering
Infrastructure, Pricing Programs, and Customer-Based Systems,” December 2012.
Price Response
Biviji, M., Uçkun, C., Bassett, G., Wang, J. and Ton, D. “Patterns of electric vehicle charging
with time of use rates: Case studies in California and Portland,” IEE PES, February 2014.
Commission for Energy Regulation, “Electricity Smart Metering Customer Behaviour Trials
(CBT) Findings Report and appendices,” May 2011.
Cook, Jonathan, Candice Churchwell, and Stephen George, “Final Evaluation for San Diego
Gas & Electric’s Plug-in Electric Vehicle TOU Pricing and Technology Study,” Prepared by
Nexant, February 2014.
Faruqui, Ahmad, and Sanem Sergici, “Arcturus: International Evidence on Dynamic Pricing,”
The Electricity Journal August/September 2013.
Faruqui, Ahmad, Sanem Sergici, and Jennifer Palmer “The Impact of Dynamic Pricing on
Low Income Customers,” IEE Whitepaper, 2010.
Frontier Economics and Sustainability First, (2012) “Demand Side Response in the domestic
sector - a literature review of major trials,” Report to DECC, 2012.
Gyamfi, S., Krumdieck, S. and Urmee, T. “Residential peak electricity demand response—
Highlights of some behavioural issues,” Renewable and Sustainable Energy Reviews, pp. 71–
77, 2013.
Hu, Z., Kim, J., Wang, J. and Byrne, J. “Review of dynamic pricing programs in the U.S. and
Europe: Status quo and policy recommendations,” Renewable and Sustainable Energy Reviews, pp. 743–751, 2015.
Newsham, G. R. and Bowker, B. G. “The effect of utility time-varying pricing and load
control strategies on residential summer peak electricity use: A review,” Energy Policy, pp.
3289–3296, 2010.
Owen, G., Pooley, M. and Ward, J. (2012) “Paper 3: What demand side services could
household customers offer?” Report by Sustainability First, 2012.

63 | brattle.com
Raw, G. and Ross, D. “Energy Demand Research Project: Final Analysis,” Report to Ofgem.
AECOM, 2011.
Schey, S., Scoffield, D. and Smart, J. “A First Look at the Impact of Electric Vehicle Charging
on the Electric Grid in The EV Project,” EVS26 International Battery, Hybrid and Fuel Cell Electric Vehicle Symposium, 2012.
Schofield, J. “Dynamic time-of-use electricity pricing for residential demand response: design
and analysis of the Low Carbon London smart-metering trial,” Doctoral Thesis, Imperial
College London, 2015.
Stromback, J., Dromacque, C. and Yassin, M. “The potential of smart meter enabled programs
to increase energy and system efficiency: a mass pilot comparison,” VaasaETT Global Energy
Think Tank, 2011.
U.S. Department of Energy “Final Report on Customer Acceptance, Retention, and Response
to Time-Based Rates from the Consumer Behavior Studies,” 2016.
Whitaker, G., Wardle, R., Barteczko-Hibbert, C., Matthews, P., Bulkeley, H. and Powells, G.
“Insight Report: Domestic Time of Use Tariff: A comparison of the time of use tariff trial to
the baseline domestic profiles,” 2013
Zarnikau, J., Zhu, S., Russell, R., Holloway, M. and Dittmer, M. “How Will Tomorrow’s
Residential Energy Consumers Respond to Price Signals? Insights from a Texas Pricing
Experiment,” The Electricity Journal, pp. 57–71, 2015.