Embed Size (px)
Citation preview

The Use of Personality Assessments as a Selection Tool in
U.S. Small and Medium-Sized High Impact Firms
Heidi A. Hughes
A thesis submitted to the University of Gloucestershire in accordance with the
requirements of the degree of Master of Research
January 2012

2
Abstract
This thesis is a comparison of employee selection techniques used by U.S. high
impact and non-high impact SMEs to Piotrowski & Armstrong’s (2006) findings
on employee selection techniques used by U.S. large companies. Primarily, the
focus is on personality and integrity assessments, as these tools, combined with
other selection techniques, increase the ability to predict job success as
measured by supervisory rating and turnover (Barrick & Mount, 1991; Barrick,
Stewart, & Piotrowski, 2002). Personality and integrity assessments have also
been shown to reduce adverse hiring practices on minorities (Nga & Sears,
2010; Ones, Schmidt, & Viswesvaran, 1993). Despite the advantages of these
assessment tools, empirical research indicates most employers prefer to use the
‘classic trio’ of selection techniques, which include conducting interviews,
reviewing applications and CV’s, and contacting references(Cook, 2004).
Piotrowski & Armstrong (2006) indicate that less than 29% of large U.S. firms
utilize personality or integrity assessments, however, trade publications
suggests psychological tests, including personality and integrity assessments, is
nearing $2 billion in revenue. This suggests that many more firms are using
assessments than reported by recent research.
This research was conducted through a self-administered questionnaire.
Descriptive statistics in the form of frequency tables were used to describe the
findings on selection techniques for both high impact and non-high impact SMEs
and a comparison to large firms. Results from this project suggest both high
impact and non-high impact SMEs use both personality and integrity
assessments more often than large firms. The research further demonstrates
that similar to research on Italian, German, and British SMEs, American high
impact, or knowledge and skills intensive firms, are more likely to have a full-
time HR person or group, than similarly related non-high impact firms.
Heidi A. Hughes
January 2012
Masters of Research

3
Author’s Declaration
I declare that the work in this thesis was carried out in accordance with the
regulations of the University of Gloucestershire and is original except where
indicated by specific reference in the text. The thesis has not been presented to
any other education institution in the United Kingdom or overseas.
Any views expressed in the thesis are those of the author and in no way
represent those of the University.
Signed: ________________________________ Date: _________________
Word length: 22,411

4
Acknowledgements
Many people have helped make this project possible. I would first like to thank
my research supervisors, Lynn Nichol, Darren Caudle and Mary Fuller. Their
support and guidance was invaluable. I would also like to thank the Master of
Research course leaders, Ros Jennings and John Hockey, who are enthusiastic
about philosophy and methods and taught me the importance of momentum.
I would also like to thank all the firms that took part in the project. Without their
time and willingness to participate, this project would not have happened.
Finally, I would like to thank Juliette Allen Howard and the Davidson family for
their support and providing me with encouragement and a sense of community.

5
Table of Content Page Number Title Page Abstract 2 Author’s Declaration 3 Acknowledgements 4 Table of Contents 5 List of Tables 6 List of Figures 7 Chapter One
Introduction 8
Chapter Two Literature Review
12
Chapter Three Epistemology
34
Chapter Four Research Methods
42
Chapter Five Research Findings
58
Chapter Six Discussion of Findings
72
Chapter Seven Conclusion
81
References Appendices

6
List of Table’s
Table 2.1 P – J fit vs. P – O fit Table 2.2 Meta-analysis of various selection techniques Table 2.3 Covet personality based integrity factors Table 2.4 Personality assessment factors Table 2.5 Personality inventory format Table 3.1 Comparison between two paradigms Table 3.2 Strength and weakness of two paradigms Table 3.1 Questionnaire for all high impact SMEs Table 5.1 Frequency of MA responses to Integrity / Personality Table 5.2 Chi-square of the integrity assessment variable Table 5.3 Chi-square of the personality assessment variable Table 5.4 Personality and integrity use in all SMEs Table 5.5 Comparison of selection techniques between SMEs and large
firms Table 5.6 Use of personality / integrity differences between high impact and
non-high impact firms Table 5.7 Selection techniques between high impact and non-high impact
SMEs Table 5.8 Comparison of industry per high impact and non-high impact firms Table 5.9 Chi-square values of designated HR person or group Table 5.10 Designated HR person among high impact and non-high impact
firms Table 5.11 Designated HR person in non-high impact SMEs Table 5.12 Outsourced recruitment and selection functions Table 5.13 P-O versus P-J fit

7
List of Figures
Figure 2.1 Personality based job analysis Figure 2.2 Common forms of psychological tests for employment selection Figure 3.1 Deductive stages of empirical knowledge Figure 5.1a Employee size per Inc. listing Figure 5.1.b Employee size per participant responses Figure 5.2a Frequency of firms per industry according to Inc. Figure 5.2b Frequency of firms per participant responses Figure 5.3 Growth rate

8
Chapter One Introduction
1.1 Introduction
This research focuses on employee selection techniques used by high impact and
non-high impact small and medium-sized enterprises (SMEs) in the United States.
The interest in this subject came after fifteen years of management experience in a
large financial services company, which included human resources management
(HRM) practices such as employee selection, followed by the experience of
looking for a year-long employment position prior to enrolling in the Master of
Research programme. The experience of looking for employment after fifteen
years with one company exposed how much the job application process had
changed in the past twenty years. This fuelled a desire to understand how
employers use various selection techniques.
1.2 Research Problem
Employee selection is crucial to the financial well-being of a business. It is
estimated that positive employee engagement can contribute more than a
$100,000 value to a large company’s annual operating income (Davenport, Harris,
& Shapiro, 2010) but disruptive behaviour, such as absenteeism, low productivity,
high turnover, and theft, results in an almost $25 billion cost per year to U.S.
companies (PR Newswire, 2011; Woods & Savino, 2007), therefore, selecting
employees who will be positively engaged in their role, rather than disruptive,
should be a concern for employers.
Employers are concerned with selecting the best candidate, but U.S. companies
also must adhere to fair and ethical hiring practices according to federal and state
regulations. The Civil Rights Act of 1964, Title VII, prohibits employers with 15 or
more employees from discriminating based on race, colour, religion, sex, or
national origin. The Americans with Disabilities Act prohibits employers with 15 or
more employees from discriminating base on physical or mental impairments
(EEOC, Woods & Savino, 2007). Employee selection tools that help the employer
hire the best candidate and also provide objective and quantifiable results are
generally considered fairer than subjective techniques (Arvery & Renz, 1992) and
help employers hire based on EEOC guidelines.

9
Personality and integrity assessments used in the employee selection process
have been shown to provide predictive value in areas such as job performance,
supervisor satisfaction and turnover rates (Barrick & Mount, 1991; Barrick,
Stewart, & Piotrowski, 2002; Dunnette, Easton, Hough, Kamp, & McClowly, 1990)
and have also been shown to help mitigate discrimination against protected
classes of workers such as race, colour, sexual orientation, religion, gender, and
disability (de Meijer, Born, Terlouw, & van der Molen, 2006; Nga & Sears, 2010;
Ones, Schmidt, & Viswesvaran, 1993). These assessments have been found to be
more predictive when designed using personality based job analysis (PBJA) and
connected to person-job (P-J) fit over person-organization (P-O) fit, but many
organizations favour P-O fit and primarily use the ‘classic trio’ of selection
techniques which include conducting an interview, reviewing an application, and
contacting references (Cook, 2004). Additionally, some states, such as
Massachusetts, restrict or prohibit the use of pencil and paper or computer tests
that screen future employees for deceptive traits (Woods & Savino, 2007;
Commonwealth of MA). This may impact the usability of personality and integrity
assessments for firms in those states.
Selection techniques and other HRM functions within SMEs have started to gain
attention in the past decade, with a look at British (Bacon & Hoque, 2005), German
(Behrends, 2008) and Italian firms (Ordanini & Silversti, 2008). Recent research in
the U.S. has indicated that 29% of large companies use personality and integrity
assessments as selection tools, but little research has covered selection
techniques of small American firms. However, entrepreneurial and small business
activity has been touted as a panacea for curing unemployment and boosting
economic growth in the United States (Litan, 2010; Office of the United States
Trade Representative). Over half of the U.S. working population is employed by an
SME and SMEs accounted for 64% of net new jobs between 1993 and 2008 (SBA,
2010) which suggests an increasing number of workers will go through a pre-
employment screening process with an SME at some point in their professional
life.
Much of the existing literature on SMEs indicate they are less likely to engage in
formal HRM practices, including recruitment and selection techniques, than their
large company counterparts (Carlson, Upton, & Seaman, 2006). The reasons for
deficient HRM functions in SMEs can vary from lack of financial and human capital

10
resources (Hall, 1992; Rutherford, Buller, & McMullen, 2003) to lack of need
(Behrends, 2007; Leung, 2003). Some small firms are more likely to outsource
HRM functions (Barczyk, Husain, & Green, 2007; Ordanin & Silvestri, 2008) or
develop HRM in-house as the complexity of the firm grows (Behrends, 2007).
High impact SMEs are firms that are rapidly growing in both revenue and
employees, are generally in knowledge and technology intensive industries, and
typically have more than 15 employees (Bee, 2009). In these firms, the need for
highly qualified employees may outstrip the informal social network from which
other small firms use to recruit and hire (Bacon & Hoque, 2005; Behrends, 2007).
Additionally, firms with more than 15 employees are required to comply with the
U.S. Equal Employment Opportunity Commission’s discrimination policies. Both of
these factors can influence the need for these firms to adopt selection practices
that can increase the predicitivness of a good hire, and also be objective and fair
for all candidates. The aim of this thesis is fill the gap regarding selection
techniques for high impact SMES in the U.S. and to determine if these firms use
personality and / or integrity assessments as part of the employee selection
process.
1.3 Research Hypotheses
Three research hypotheses were developed to respond to the gap in the current
knowledge regarding the use of personality and integrity assessments in U.S. high
impact SMEs. Each of the hypotheses was formed within the context of the
literature regarding the legality of integrity assessments in certain states and the
reported use of the selection tools in large companies. The hypotheses are as
follows:
H1 Employers in Massachusetts will be less likely to use personality
assessments of any kind during the selection process due to the legality of
testing for honesty / integrity.
H2 SMEs in the U.S. will be less likely to use personality / integrity
assessments than large firms as indicated by Piotrowski and Armstrong
(2006).

11
H3 High impact SMEs will be more likely than non-high impact SMEs to adopt
personality / integrity assessments in the selection process.
The goal of this project is to contribute to the growing empirical knowledge of
SMEs HRM functions. The findings of this project help identify current employee
selection practices and related HRM functions.
1.4 Plan of the Thesis
Chapter two provides a background knowledge regarding employee selection
techniques and how they are used to help predict successful placement outcomes
for both employees and employers, and how employee selection is placed within
the field of HRM. The chapter also discusses SMEs, what recent literature has
been produced in regards to their use of HRM function and employee selection
practices, and the relevance of these firms to the U.S.
Chapter three explores objective epistemological claims and the positivist
theoretical perspective and its relationship to HRM theories. The chapter also
discusses current criticism regarding positivism, both from within, and outside, the
paradigm.
Chapter four outlines the research methods used to create a quantitative self-
administered survey questionnaire used to collect data for the project, and review
the data analysis process. It also discusses how sample participants were selected
and ethical concerns, including measures used to mitigate harm to self, the
reputation of the university, and participants.
Chapter five reviews the analyzed findings from the survey and chapter six
provides a deeper discussion of the findings, how they relate to the hypotheses
and overall aim of the research, and the current debate in literature.
Chapter seven provides a further discussion regarding the research process, the
limitations of the findings and suggestions for future research. It also reviews the
limitations of the researcher and considers how the limitations will be addressed in
the future and provides a conclusion to the thesis.

12
Chapter Two Literature Review
2.1 Introduction
The aim of this chapter is to examine the use of personality and integrity
assessments as an employee selection tool, in context with firm size and
geographical location. It starts by looking at the importance of employee
selection and the concepts of differing ‘fit’ between employee and employer. It
then reviews the different selection techniques currently in practice and
empirical evidence suggesting which techniques predict successful placement.
The chapter then takes a deeper look into the value of personality and integrity
assessments. It concludes by reviewing emerging research on SME HRM and
employee selection processes and looks at the importance of SMEs in the U.S.
and identifies current gaps in the literature regarding U.S. SMEs in order to help
justify the purpose of this research.
2.2 The Importance of Selection
Recruiting, hiring, and engaging the ‘right’ employee has financial implications to
a company. Schmidt & Hunger (1998) calculated that based on a $40,000
annual position, an employee working at the 84th percentile produces $16,000
more per year for the company than those employees who are ranked by their
supervisor at the 50th percentile. In other words, top performers produce almost
40% more for an employer than an average worker. Davenport, Harris & Shapiro
(2010) calculated that positive employee engagement can contribute more than
a $100,000 value to a large company’s annual operating income. Conversely,
disruptive employee behaviour such as absenteeism, low productivity, high
turnover, and theft, results in almost a $25 billion cost per year for U.S.
companies (PR Newswire, 2011; Woods & Savino, 2007).
Employee turnover costs vary by industry, from approximately $6,000 for leisure
and hospitality employees to almost $20,000 for information and knowledge
intensive employees (O’Connell & Kung, 2007). Zielinski (2011) estimated the
actual cost of turnover, which factors in loss of production and effects on other
employees in addition to recruitment, selection, and training costs, is closer to
the annual salary of that particular position. As a benchmark for what that cost

13
may be to the employer, the median salary for an IT generalist, which would be
a knowledge intensive employee, in the Chicago area, is currently $53,873
(Salary.com).
With increased capital on one end of the spectrum and substantial loss on the
other, selecting the right employee should be important to all organizations.
2.3 Fit
Determining what makes a ‘right’ employee is different for each organization.
Some organizations are more interested in employees having person-
organization (P-O) fit. P-O fit occurs when the employee’s actions, customs,
beliefs, or attitudes match the organization’s mission and culture as a whole.
Some organizations may desire employees who have a stronger person-job (P-
J) fit. P-J fit occurs when the employee’s knowledge and skills match the needs
of a specific job (Arthur, Bell, Villado, & Doverspike, 2006; Carless, 2005).
Recruitment agencies often find they are able to place more candidates when
they focus on matching P-O fit (Coverdill & Finlay, 1998). Employees with strong
P-O fit tend to have more of their personal needs met through work, and
employee-employee and employee-employer conflict may be lower than those
employees who are hired based on P-J fit (Arthur et al., 2006; Bolton & Bolton,
1996). However, P-O fit has been shown to have less significance in predicting
performance levels, job satisfaction, and overall turnover than P-J fit does
(Kristof-Brown, Zimmerman, & Johnson, 2005). The table below demonstrates
the predictive validity of performance, satisfaction, and retention rates of P-O fit
versus P-J fit as researched by O’Reilly, Caldwell, & Mirable (1992)* and Arthur
et al., (2006)**.
Table 2.1 P-J fit versus P-O fit
Performance Overall Satisfaction Retention
P-J Fit* 0.34 0.49 0.26
P-O Fit** 0.15 0.32 0.24

14
In all three factors, P-J fit demonstrated a higher validity in predicting a
successful job placement. Additionally, there are concerns that focusing on P-O
fit can lead to unethical and unfair hiring practices. Hiring managers may have
an explicit or implicit desire to find candidates that have social similarities to
themselves, or the image that management is trying to project about their
company. An applicant that does not match the desired image based on race,
gender, age, or appearance could be excluded (Coverdill & Finlay, 1998). An
example includes discriminating against overweight people for public facing jobs
such as sales positions (Pingitore, Dugoni, Tindale, & Spring, 1994).
However, creating personality measures that correlate to job performance is
difficult (Murphy & Dziweczynski, 2005). Personality based job analysis (PBJA)
is the attempt to match specific personality traits to specific job needs. It also
means knowing what work performances should be measured. In many
analyses, supervisory satisfaction, or ranking, is the concept measured, but the
criterion could also be sales growth, customer satisfaction, absences and
punctuality (Cook, 1998).
Figure 2.1 Personality based job analysis
Personality trait
Agreeableness
Specific job need
Pleasant and helpful
to customers
Measurement of
successful employee
Supervisor rating /
customer service survey
Experts may fall into the trap of selecting traits that are self-serving. As an
example, an executive who is a people oriented person may believe that being
people oriented is an important trait for leadership, where as an analytical
executive may believe that being analytical is more important (Cucina,
Vasilopoulos, & Sheal, 2005). Additionally, some managers lack the experience
needed for PBJA, or may not be aware that some factors have been empirically
measured as more important than others (Varczyk, Husain, & Green, 2007).
15
2.4 Selection Techniques
For some employers, the process of employee selection can seem as arbitrary
as casting lots. In most situations, a large pool of candidates needs to be filtered
down to a point where only one candidate is hired for a particular position (Guion
& Gibson, 1988). There are many techniques that can be used as the filter.
Some techniques have been empirically proven to be more valid and reliable in
predicting job success than others, while some techniques have been shown to
increase an adverse impact on protected classes (Arvey & Renz, 1992).
Protected classes include minority’s that could be judged based on race, colour,
religion, sex (including pregnancy), national origin, age (40 or older), disability,
or genetic information (EEOC). From the employer’s perspective, the desire is to
hire the candidate that will be the most productive, for the longest duration of
employment, with the least amount of difficulty or conflict. From a societal and
governmental perspective, employers must also consider fair and equal hiring
practices.
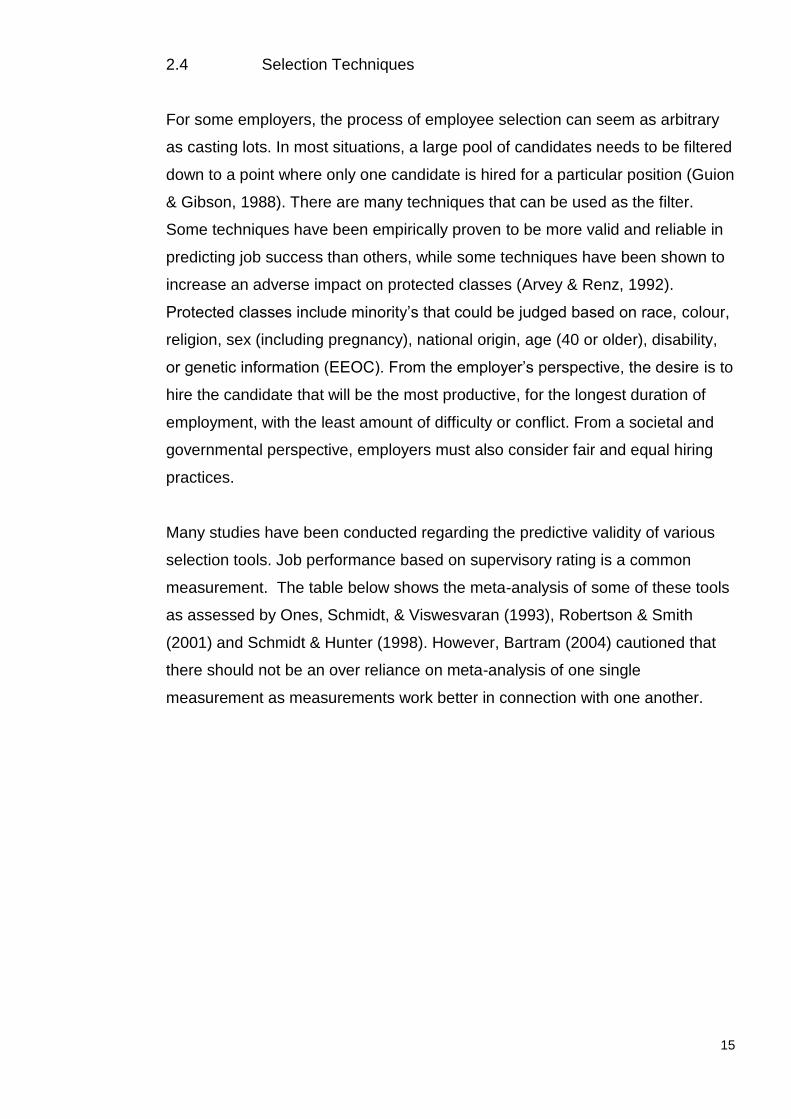
Many studies have been conducted regarding the predictive validity of various
selection tools. Job performance based on supervisory rating is a common
measurement. The table below shows the meta-analysis of some of these tools
as assessed by Ones, Schmidt, & Viswesvaran (1993), Robertson & Smith
(2001) and Schmidt & Hunter (1998). However, Bartram (2004) cautioned that
there should not be an over reliance on meta-analysis of one single
measurement as measurements work better in connection with one another.

16
Table 2.2 Meta-analysis of various selection techniques
Ones, Schmidt &
Viswesvaran, 1993 Robertson & Smith, 2001 Schmidt & Hunter, 1998
GMA + P + I .67 GMA + I .65 Work samples .54
GMA + I .65
GMA + structured
interview .63 GMA .51
GMA + P .53 GMA + work sample .60 Structured interview .51
Integrity .41 Work sample .54 Job knowledge test .48
GMA .51 Integrity .41
Structured interview .51 Unstructured interview .38
Integrity .41 Assessment centre .37
Personality assessment .40 Biodata .35
Biodata .35 Job experience .18
References .26
Years of experience .18
(A note regarding different technique labels: Different researchers use different
terms for similar tools. General mental ability (GMA) and cognitive tests are
often used simultaneously (Cook, 2004) though cognitive tests generally refer to
numbers, spatial awareness, and verbal abilities (Bertua, Anderson, & Salgado,
2005). In this thesis, GMA will be used throughout to include both. Likewise,
integrity and honesty are used interchangeably throughout the literature.
Integrity will be used to represent both for the remainder of this thesis.)
Despite the evidence supporting GMA, integrity, and personality assessments,
employers tend to rely on techniques that present a lower validity in predicting
job success. Cook (2004) indicated that most employers rely on the ‘classic trio’
as a selection process, which includes reviewing applications or resumes,
conducting an interview, and contacting referees. Early research by Harris and
Dworkin (1990) indicated that out of 200 HR practitioners, 88% used
unstructured interviews, 76% conducted structured interviews, and 97% used
references. At that time only 20% used personality assessments and 5% used
paper and pencil integrity tests. The increased availability of the Internet and
software applications may have lead to an increase in the use of similar
computer assessments. Terpestra (1996) indicated that the top five selection
methods among HR executives was collecting work samples, contacting
references, conducting unstructured interviews followed by conducting
17
structured interviews and using assessment centres. The least likely tools to be
used were assessing GMA, collecting biodata, and using personality
assessments.
A recent study by Piotrowski and Armstrong (2006) indicated large U.S.
companies are embracing the use of the Internet to facilitate the selection
process, but similar to earlier research, the most common methods are
gathering information from resumes, application blanks and references. Only
19% indicated they used personality assessments, while 28.5% assessed for
integrity and 21.9% tested for violence potential. So while the use of integrity
testing has risen since the early 1990’s, personality assessment use has stayed
the same. As has been pointed out by these many researchers, practitioners
often use methods that are in opposition of empirically tested methods.
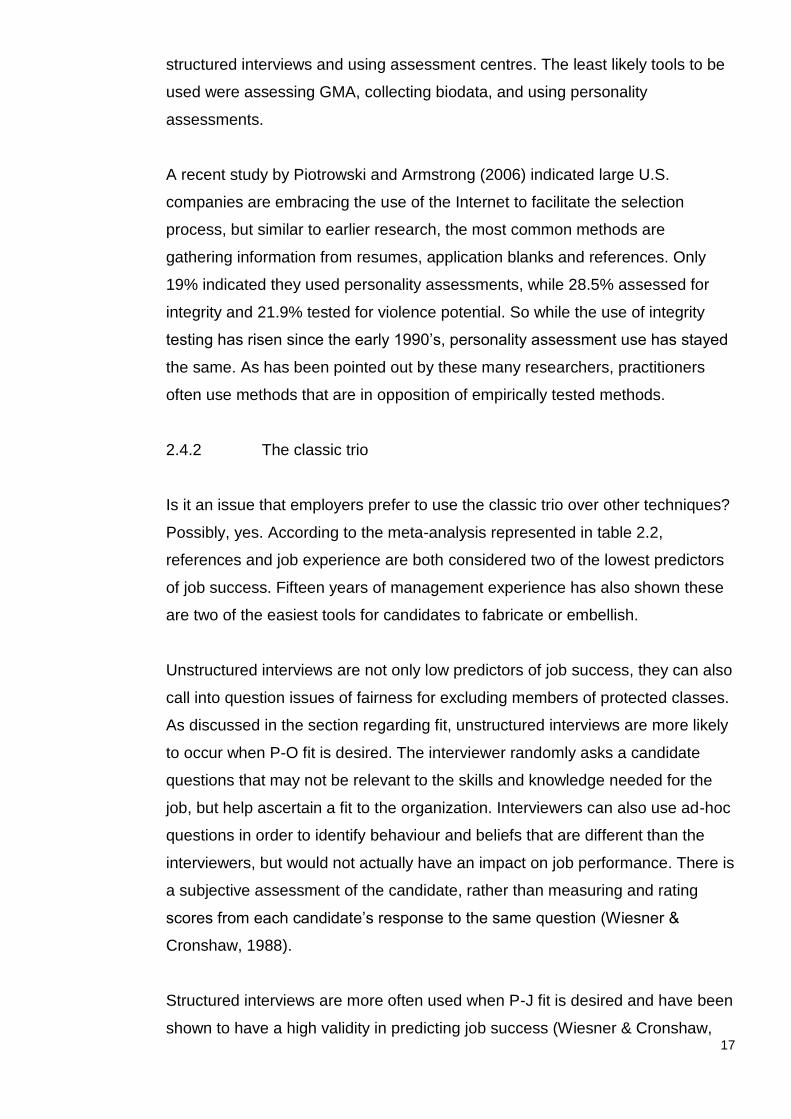
2.4.2 The classic trio
Is it an issue that employers prefer to use the classic trio over other techniques?
Possibly, yes. According to the meta-analysis represented in table 2.2,
references and job experience are both considered two of the lowest predictors
of job success. Fifteen years of management experience has also shown these
are two of the easiest tools for candidates to fabricate or embellish.
Unstructured interviews are not only low predictors of job success, they can also
call into question issues of fairness for excluding members of protected classes.
As discussed in the section regarding fit, unstructured interviews are more likely
to occur when P-O fit is desired. The interviewer randomly asks a candidate
questions that may not be relevant to the skills and knowledge needed for the
job, but help ascertain a fit to the organization. Interviewers can also use ad-hoc
questions in order to identify behaviour and beliefs that are different than the
interviewers, but would not actually have an impact on job performance. There is
a subjective assessment of the candidate, rather than measuring and rating
scores from each candidate’s response to the same question (Wiesner &
Cronshaw, 1988).
Structured interviews are more often used when P-J fit is desired and have been
shown to have a high validity in predicting job success (Wiesner & Cronshaw,

18
1988). A structured interview is designed as specific questions asked of each
candidate and should be based on a detailed job analysis and responses to
specific skill related questions are quantified, scored, and measured against
other candidates. Thus, image, race, gender, and other non-skill related factors
should become irrelevant and decrease the adverse impact on protected
classes (Arvey & Renz, 1992).
One such type of structured interview is the competence or behaviour
description interview (BDI). The BDI uses specific questions based on the
behaviour needed for a specific job, and where the candidate provides
responses from similar past experiences (Janz, 1982). The information
regarding past behaviour strongly predicts the likelihood the candidate will have
the same behaviour in the future in a similar job (Motowidlo, Carter, Dunnette,
Tippisn, Werner, Burnette, & Vaughan, 1992).
There are debates on how BDI’s should be used. Motowidlo et al., (1992)
suggested that BDI’s allow employers to probe a candidate based on their initial
response. They believed that more experienced interviewers would be more
successful using the BDI format. However, Lievens & Peeters (2008) did not find
a significant difference between novice and experienced interviewers in their
ability to effectively use the BDI format. Lievens & Peeters (2008) also
demonstrated that these types of highly structured interviews were better at
evaluating competency while mitigating employer response to impression
management behaviour.
An additional concern with extensive probing is that further questions are based
on a candidate’s response. As such, the additional questions would not be
standard questions applied to each candidate. A recent study by McCarthy, Van
Iddenkinger, & Campion (2010) set out to measure the effects of demographic
similarity during the selection process. They felt by limiting the use of follow-up
questions during the BDI format, the candidate still provided valid responses,
and the highly structured nature of the interview could reduce adverse impact on
minorities.
According to the meta-analysis, structured interviews provide .51 validity and
increase when combined with techniques such as GMA but not necessarily with

19
the two other methods that comprise the classic trio. According to McDaniel,
Scmidt, & Maurer’s (1994) research, the validity of structured interviews drop to
.44 validity, which is marginally higher than the validity of integrity and
personality assessments. They also indicate that between structured and
unstructured, situational to psychological, there are fifteen different ways that an
interview can be conducted and measured, which suggests that pinpointing the
exact style of interview an employer conducts can be difficult.
2.4.3 Biodata
Biodata has been shown to have low validity and according to the research is
one of the least used tools (Piotrowski & Armstrong, 2006; Terpestra, 1996) but
it is important to discuss as a comparison to personality assessments. It may be
difficult to get an accurate assessment of how many company’s really use
biodata information. If the majority of company’s indicate they use application
and resumes, biodata is presented. However, hiring candidates based on age,
marital status and other biodata related factors can be grounds for discrimination
lawsuits and therefore companies may be hesitant to reveal they use this
information.
Biodata is information regarding age, marital status, and length of service with
previous employers. This information can be captured through an application,
resume, or a specific questionnaire. It looks for “aspects of personal background
that can predict work behaviour” (Cook, 1998, p.135). Employers may hope to
gain insight into a candidate’s level of assertiveness, independence, or other
such personality factors. In this way, biodata can overlap, or seem similar to
personality assessments. However, among other issues, personality inventory
scoring remains consistent and quantifiable for all candidates, while biodata
does not (Cooper & Robertson, 1995).
2.4.4 Psychological Tests
There are several forms of psychological tests that can be used in the employee
selection process. These include achievement, aptitude, general mental ability
and personality traits and behaviours. This chapter is concern with GMA,
personality and integrity tests.

20
Figure 2.2 Common forms of psychological tests for employment selection
Psychological Test
2.4.4.a GMA
GMA has shown a high degree of validity. As a stand-alone assessment it
provides .51 predictability to job success. Its validity increases when paired with
other selection techniques and its score is objective and can be compared to a
standard norm, elements that according to Arvey and Renze (1992) are
necessary for fair hiring practices. However, using GMA as a selection tool has
been shown to have a negative impact on minorities and its use is the most
often cause of discrimination lawsuits (Murphy & Dziweczynski, 2005) which
may explain why companies that are regulated for ethical fairness are less likely
to use GMA assessments (Nga & Sears, 2010).
2.4.4.b Personality and Integrity: Reverse Adverse Impact on Minorities
Personality and integrity assessments have also shown a high degree of validity,
and similar to GMA, increase in validity when paired with other techniques. Their
scores are also objective and quantifiable and meet the criteria for fairness.
Interestingly, many employers and HR managers consider personality and
integrity assessments to have a negative impact on minorities (Rynes, Colbert,
& Brown, 2002). Nga & Sears (2010) showed that 75% of HR manager’s
interviewed believed personality assessments were biased against minorities.
However, these assessments have shown to not only not discriminate against
minorities, they have been shown to increase minority’s viability (Nga & Sears,
2010). De Meijer, Born, Terlouw, & van de Molen (2006) indicated that only in
the use of personality tests did minorities ‘score higher’ than the majority. Ones
Achievement Aptitude GMA Personality Integrity / Honesty
Covert – Personality Overt

21
et al., (1993) demonstrated that based on ability tests alone, only 15.9% of black
applicants were hired, but when ability and integrity tests were combined, 21.8%
of black applicants were hired.
2.4.4.c Personality and Integrity: Similar but Different
Personality and integrity assessments often get lumped together as if one type
of assessment. One consultant’s website indicated “the most commonly used
personality tests are honesty or integrity” (Business Insight Technologies) and
Woods and Savino (2007) believed that both integrity and personality tests are
used to “point out potential shortcomings of job applicants, such as tendencies
to engage in theft and violence in the workplace” (p.4). However, while both of
these tests can have overlapping trait assessments, they are not the same
(Wanek, Sackett, & Ones, 2003).
The use of integrity tests in U.S. employment has increased since the mid-
1980’s when polygraphs were banned from the workplace (Woods & Savino,
2007). They were designed to assess the employee’s propensity towards theft,
absenteeism, turnover, and global performance. Integrity tests can be overt, in
which questions directly ask about past or future behaviours and attitudes
towards theft, dishonesty, and illegal acts. Covert tests are based on personality
measures and not explicit to the test taker what is being measured (Sacket,
Burris, & Callahan, 1989). In this way, covert personality based integrity test and
personality test seem to blur the assessment line.
Table 2.3 and 2.4 capture the factors that four common covert integrity test
measure and the factors that four common personality assessments measure.

22
Table 2.3 Covert personality based integrity factors
TEST FACTOR FACTOR FACTOR FACTOR FACTOR FACTOR
Personnel Reaction Blank (PRB) Sociability Dependability Conscientiousness Internal Values Self-Restraint
Acceptance of convention
Personnel Decisions Inc (PDI) Employment Inventory Authority Thrill seeking Hostility Non-conformance Irresponsibility Socialization
Reliability Scale / Hogan Personnel Selection Series Authority Thrill seeking Conscientiousness Vocational identity
Social insensitivity
London House Employment Productivity Index Dependability Interpersonal Cooperation Drug avoidance
Table 2.4 Personality assessment factors
TEST FACTOR FACTOR FACTOR FACTOR FACTOR FACTOR FACTOR FACTOR
16PF Cool - Warm Concrete -
Abstract Affected by feelings - Emotionally stable
Submissive - Dominate
Sober - Enthusiastic
Expedient - Conscientious
Shy - Bold Tough - Tender
Trusting - Suspicious
Forthright - Shrewd
Self-assured - Apprehensive
Conservative - Experimental
Group oriented - Self-sufficient
Undisciplined - Follow self-image
Relaxed - Tense
California Psychology Inventory (CPI) Dominance
Capacity for status
Social presence Self-acceptance
Sense of well being
Responsibility Socialisation Self-control
Tolerance
Good impression Communality Conformance Independence
Intellectual efficiency
Psychological mindedness Flexibility
Feminity Empathy Independence
Managerial potential
Work orientation
NEO - FFI / Big Five Conscientiousness Agreeableness Extraversion
Emotional Stability Openness
DiSC Dominance Influence Stable Compliant

23
It is easy to see the similarities in the factors. Most noticeably, the integrity tests
and the Big Five (Costa & McCrae, 1987), measure conscientiousness,
agreeableness, and emotional stability. Other similarities could be factors such
as socialization or sociability in comparison to social presence, influence, and
group orientation.
Despite the similarities in the factor that is being measured, the two tests are
measuring the factors for different reasons. Integrity tests are attempting to
assess the candidate’s ethics and honesty, while personality assessments are
looking for factors or traits that determine if that candidate will be successful in a
specific job. For example, conscientiousness measures the ability to be guided
by an internal compass which demonstrates self-discipline, thinking clearly
before taking action, and being organized (Cook, 2004). The integrity test may
measure this factor to see if the candidate has the self-discipline to avoid
unethical behaviour, while the personality test is measuring the candidate’s self-
discipline to meet projected business targets. A similar factor, but with a different
goal of measurement.
2.4.4.d Legality of Integrity Assessments
While integrity tests have been shown to provide an overall higher predictive
validity than personality assessments, legislation is such that not all states are
allowed to use them. Currently, California and Rhode Island allow the tests to be
used, but employers cannot use the outcomes as a basis for refusal to hire.
Massachusetts’ general labour laws state that it is unlawful to use “a polygraph
or any other device, mechanism, instrument or written examination” to detect
“deception, the verification of truthfulness, or rendering of a diagnostic opinion
regarding the honesty of an individual” (The Commonwealth of MA) which is
interpreted by some to include integrity and honesty assessments (Shaffer &
Schmidt, 1999; Woods & Savino, 2007). This can be an issue, as noted earlier,
the difference between personality and integrity tests can be confusing, or
assessments are designed to overlap with one another. This issue leads to the
first hypothesis of the research project.

24
H1 Employers in Massachusetts will be less likely to use personality
assessment of any kind during the selection process due to the legality of
testing for honesty / integrity.
2.4.4.e Personality Assessments
2.4.4.e.1 Predictive Validity and Reliability
Employee’s can generally learn new skills, but personality traits, such as
openness and honesty are difficult to train. However, openness and honesty are
valued more than skills, and are “attributes well measured by integrity and
personality questionnaires” (Bartram, 2004, p.251). The concern for how well
personality assessments can measure these traits and predict a successful
applicant has been addressed by several researchers.
In the late 1960’s researchers felt that employers used catch-all personality
inventories for all job positions, with no forethought into what the specific needs
of the job were. This resulted in low predictive validity (Guion & Gottier, 1965).
Hollenbeck and Whitener (1988) suggested that perhaps earlier research,
specifically Guion & Gottier’s, was tarnished by low sample size. Twenty years
after his 1960’s claims, Guion (1987; 1988) retracted his earlier sentiments and
suggested that personality assessments do offer more validity in predicting job
success, but maintained they should be custom designed from attributes needed
for a specific job. He suggested employers should hire candidates based on a
‘prototype’, which can be thought of as a pattern, or model, employers can use
to define the most applicable traits needed for that particular job. Hired
candidates should match this prototype as closely as possible. This is similar to
the idea of hiring based on PBJA and P-J fit, which has also been shown to
have a higher degree of predictive validity.
Barrick & Mount (1991), Barrick, Stewart, & Piotrowski (2002), Bartram (2004;
2005), Dunnette, Eaton, Hough, Kamp, & McClowly (1990) and Hough (2002)
are some of the researchers that have indicated that personality assessments
demonstrate predictive validity to job success. The meta-analysis indicates the
device provides upwards of .41 validity. Even those who caution against the

25
enthusiastic use of personality assessments as a selection tool have indicated
that they do provide an acceptable amount of validity (Hurtz & Donovan, 2000).
While .41 is slightly lower than that of structured interviews, the fact that
personality assessments in combination with other measurement tools reduce
the adverse affects against minorities, suggest it is a tool that should be used
more often.
Not all personality assessments are equal, nor are they all equal to the task of
employee selection. As an example, the Myers-Brigg Type Indicator (MBTI) is a
popular test with corporate trainers in America, and shows value as a
development tool amongst existing employee’s, but is not designed as a
predictive tool, nor does it offer a method for assessing faking responses
(Searle, 2003). One assessment that has shown to demonstrate high predictive
validity and has lower response distortion is the NEO-FFM, also known as the
Big Five, or five factor model.
The Big Five measure five factors (Digman, 1997): Extraversion / surgency,
agreeableness, conscientiousness, emotional stability / neuroticism, and
openness to experience. Extraversion is “interest in social interaction [and] an
active, zestful, and venturesome approach to life and interpersonal
relationships” (Digman, 1997, 1250.). Emotional stability / neuroticism is a
reverse trait in that it measures for levels of anxiety, depression, anger, and
insecurity (Barrick & Mount, 1991). Agreeableness is the level of “being
courteous, flexible, trusting, good-natured, cooperative, forgiving and tolerant”
(Barrick & Mount, 1991, p.4) and conscientiousness measures the ability to “be
careful, thorough, responsible, organized and planful” (Barrick & Mount, 1991,
p.4). Openness to experience is “being imaginative, cultured, curious, and
broad-minded” (Barrick & Mount, 1991, p.5).
Empirical research has demonstrated that ‘conscientiousness’ has a strong
predictive value for almost all positions and multiple criterion measures such as
supervision rating and job training proficiency (Barrick & Mount, 1991).
Bartram’s 2004 report indicated that “conscientiousness actually appears to
assess honesty better than general job performance while the reverse is the
case for integrity tests” (p.251). If this is the case employers who are prohibited

26
from using integrity assessments can look to using the Big Five as not only a job
predictive assessment, but also as a measurement of integrity.
Barrick & Mount (1991) also reported that certain Big Five traits are better at
predicting success for certain positions, such as ‘extraversion’ for management
and sales, but is less important in skilled positions such as secretarial or
accounting work. This relates back to Guion’s (1987; 1988) suggestion that
personality assessments should be used, but only as it is designed towards
specific positions.
Interestingly, ‘agreeableness’, which could be considered traits needed to get
along with teammates, has not been shown to be a valid predictor for most
positions (Barrick & Mount, 1991), which is in opposition to the common
perception that people are more often dismissed because of personality
disagreements than job skills (Bolton & Bolton, 1996; Inglish, 2011; Schminke,
2006).
Carless (2003) provided guidelines for when managers should review
personality scores, suggesting managers review the scores after an interview so
as not to have a preconceived idea about the candidate. This suggests
personality assessments are used as a confirming tool, or as a way to select
between two otherwise equal candidates. She also suggested by reviewing the
scores afterwards, non-job relevant personality traits will not influence the
decision. However, in an ideal situation, the personality assessment would be
designed to the relevant job, thus not capturing irrelevant personality information
in the first place.
Kim Yin, Drasgo, & Sawin (1999) indicated that over time, certain taxonomy, or
criterion, can become irrelevant, especially when an assessment is based on job
skills that have become obsolete. The warning here is that if a company does
design a personality assessment based on PBJA, the test should be reviewed
every few years, or when job roles change, to adjust for outdated constructs.
There are different theories as to how personality affects job performance. One
theory is that personality traits work through the relationship with motivation.

27
Motivation propels a person towards action or a state of doing (Hollenbeck &
Whitener, 1988). Barrick et al., (2002) demonstrated that ‘conscientiousness’
and ‘extraversion’ are motivation drivers for sales staff in achieving status and
accomplishments. Bartram (2005) suggested rather than motivation, personality
traits affect competency, or ability, which in turn affects job performance.
Less has been published regarding reliability issues, which suggest that it is less
of a concern for academics than questions of validity. It may be less of concern
as it is generally tested before continuing on to test for validity. Reliability
means the measurement tool remains consistent. In a test re-test situation
scores should be at least .80 consistent (Salkind, 2008). A reliable personality
assessment is what provides the objective and quantifiable measure as all
participants engage with the same, or similar, questions regarding attitudes and
actions.
2.4.4.e.2 Distortion
Another concern that has been raised regarding personality and integrity
assessments is the ability of the test taker to fake or distort responses. Faking,
sometimes known as ‘impression management’ or ‘consistency’ can result in
employers selecting a candidate that is not fit for the position, which affects the
validity of the assessment. Faking can also result in a dishonest candidate
getting hired over a more honest one, which impacts fairness (Arvey & renze,
1992). Unfortunately, there is no tool designed to be guaranteed fake proof.
Even the very way that candidates dress in their best attire, smile, and are
courteous during an interview, attempts to manipulate the impression of the
interviewer. However, there are some ways to reduce distortion.
There are two main sources for faking: self-deception and impression
management. Self-deception occurs when a candidate selects a response
based on an inaccurate and often overly positive view of their self (Barrick,
Murrary, & Mount, 1996). Impression management occurs when a candidate
chooses an answer that they feel is more socially desirable than an honest
answer would be (Barrick, Murray, & Mount, 1996). In the case of applying for a
job, the candidate would choose a response they feel would make them appear

28
to be more qualified for the position, regardless if the response is truthful or not.
While a small amount of both self-deception and impression management does
occur in the results of personality and integrity assessments, it does not occur at
high levels, nor does it seem to affect the validity of the assessments (Barrick,
Murrary, & Mount, 1996; Dunnette et al., 1990). Dunnette et al, (1990) indicated
that careless responses were more of an issue than faking for social desirability.
They also suggested that when candidates were warned that fake responses
would be detected, faking decreased.
Different assessment formats can also be used to decrease faking. There are
three basic inventory formats: endorsement, forced-choice and rating. Table 2.5
below provides an example of each.
Table 2.5 Personality inventory format
Endorsement format
I like meeting new people
True False
Forced-choice format
On your day off would you rather
paint a picture paint your house
Rating format
I feel tired at the end of the day Never 5 4 3 2 1 Always
The forced-choice format has been shown to decrease faking (Dunnet et al.,
1990) in such a way that all responses are equally social desirable. However,
the concern with this format is that at times either both answers suit the
participant equally, or neither does at all. This forces a response that is not
always fully indicative of that person (Walley & Smith, 1998). However, tests that
offer four choices within a scale of “most like me” and “least like me” (Cook,
2004, p.162) offer candidates more choices instead of forcing them into an
either / or response.
2.4.4.e.3 Privacy
There is justifiable concern regarding privacy and the use of some personality
assessments as a selection tool. Intensive assessments such as Minnesota

29
Multiphase Personality Inventory (MMPI) and the California Personality
Inventory (CPI) are also used in medical and psychological situations to uncover
physical and mental disabilities. Most employment positions do not warrant the
employer knowing about physical or mental issues such as anxiety or
depression. Additionally, questions regarding sexual practices, religious
commitments, and political affiliation not only invade a person’s privacy, but are
illegal and unethical constructs to use as a measure of discrimination (Woods &
Savino, 2007). Furthermore, catch-all inventory questionnaires have not shown
to increase the validity in predicting job success. Therefore, abbreviated
personality assessments based on PBJA helps both test validity and also
decreases invasion of privacy.
2.4.4.e.4 Current Use of Personality and Integrity as a Selection Tool
Most academic research has indicated that the use of personality and integrity
assessments as a selection tool is less than 29% for large U.S. companies
(Piotrowski & Armstrong, 2006; Teprestra, 1996). However, according to
practitioners and trade publications, there are anywhere from 2,500 to 8,000
personality related tests on the market and over 65% of employers are using
them (Katunich, 2005; Woods & Savino, 2007).
It’s difficult to know exactly why there is a gap between empirical findings and
trade publication numbers. Finding the answer is beyond the scope of this
project, however, one suggestion may be that perhaps where the assessment
takes place in the pre-employment process may alter an employer’s perception
of if they believe they use the assessment as a selection process or not.
For many large retail service chains and employment agencies a candidate
applies for a position through the Internet on the company’s website. The steps
to apply for a job are:
Complete biodata blanks
Complete work history blanks
Complete personality / integrity assessment
Submit application

30
One large international fast food company has customized a thirty-five question
personality assessment that the candidate must complete before being
permitted to submit an application. (This questionnaire was accessed by using a
dummy profile and a sample of the first ten questions can be found in the
appendix.)
A large financial services company has a different approach to measuring a
candidate’s personality. Similar to above, the candidate applies directly through
the company website, but does not complete a personality assessment at this
time. Their steps are:
Upload resume (which populates biodata and work history)
Overt questions regarding theft and ability to obtain bond coverage
Skill assessment and interest
Submit application
After successful completion of the first interview, the candidate is then subjected
to a customized personality assessment based on a sales position using PBJA.
Both of these situations demonstrate that candidates encounter a personality /
integrity assessment, but at different stages of the application process. In the
first scenario, the company website is both a recruitment and selection tool
(Tippins, Beaty, Drasgow, Fritz, Gibson, et al., 2006). The candidate can
investigate the company, and then, if they feel there may be a strong P-O fit,
they take the next step and apply directly on-line. It may be possible that in
these situations, a company does not consider the pre-interview filtering tool as
using personality / integrity assessment as part of the selection process but
rather a part of the recruitment process.
Both of these examples also demonstrate practices used by large companies.
Small firms may be less likely to use the Internet to facilitate the selection
process. The next section of this chapter will briefly review the current
knowledge regarding HRM and selection techniques used by SMEs and to
explain why this project focuses on SMEs in the United States.
31
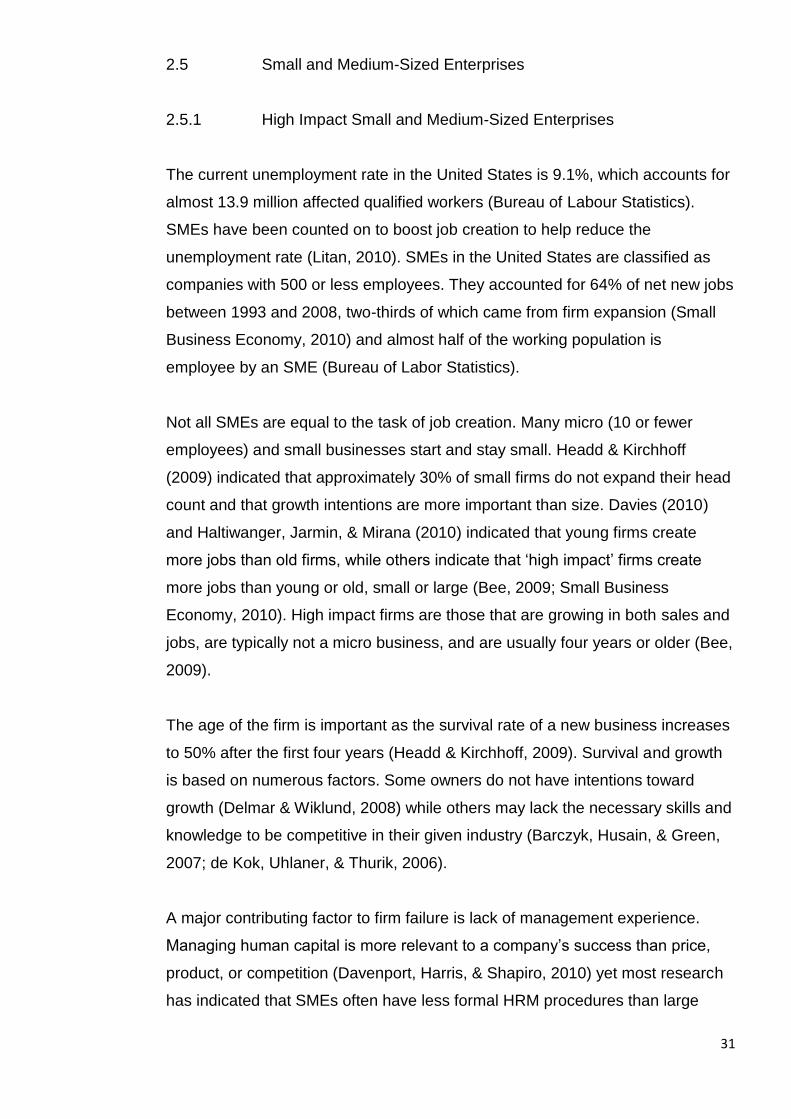
2.5 Small and Medium-Sized Enterprises
2.5.1 High Impact Small and Medium-Sized Enterprises
The current unemployment rate in the United States is 9.1%, which accounts for
almost 13.9 million affected qualified workers (Bureau of Labour Statistics).
SMEs have been counted on to boost job creation to help reduce the
unemployment rate (Litan, 2010). SMEs in the United States are classified as
companies with 500 or less employees. They accounted for 64% of net new jobs
between 1993 and 2008, two-thirds of which came from firm expansion (Small
Business Economy, 2010) and almost half of the working population is
employee by an SME (Bureau of Labor Statistics).
Not all SMEs are equal to the task of job creation. Many micro (10 or fewer
employees) and small businesses start and stay small. Headd & Kirchhoff
(2009) indicated that approximately 30% of small firms do not expand their head
count and that growth intentions are more important than size. Davies (2010)
and Haltiwanger, Jarmin, & Mirana (2010) indicated that young firms create
more jobs than old firms, while others indicate that ‘high impact’ firms create
more jobs than young or old, small or large (Bee, 2009; Small Business
Economy, 2010). High impact firms are those that are growing in both sales and
jobs, are typically not a micro business, and are usually four years or older (Bee,
2009).
The age of the firm is important as the survival rate of a new business increases
to 50% after the first four years (Headd & Kirchhoff, 2009). Survival and growth
is based on numerous factors. Some owners do not have intentions toward
growth (Delmar & Wiklund, 2008) while others may lack the necessary skills and
knowledge to be competitive in their given industry (Barczyk, Husain, & Green,
2007; de Kok, Uhlaner, & Thurik, 2006).
A major contributing factor to firm failure is lack of management experience.
Managing human capital is more relevant to a company’s success than price,
product, or competition (Davenport, Harris, & Shapiro, 2010) yet most research
has indicated that SMEs often have less formal HRM procedures than large

32
companies (Carlson, Upton, & Seaman, 2006). However, small high performing
firms tend to invest more in HRM practices such as recruitment, selection,
training, and development, than low performing firms (Carlson, Upton, &
Seaman, 2006; Mazzarol, 2003). Here then is an indication that size is not the
differentiating factor in HRM practices, but firm performance.
2.5.2 The Selection Process in High Impact SMEs
The difference between recruitment and selection can be fuzzy in small firms.
Many micro companies employ family members, and well known friends, where
the selection process is based on willingness and availability (Leung, 2003). As
business grows, referrals from existing employees begin to replace the internal
social network of the owner / manager (Behrends, 2007; Kotey & Slade, 2005).
One business owner indicated that he in-sourced new employees from business
partners after having worked with the employee on joint projects (Leung, 2003).
In these situations, the recruitment process eliminates the need for a formal
selection process.
As firms increase head count, they become subject to legal requirements of
fairness. The Civil Rights Act and the American Disability Acts become
applicable to firms once they have 15 or more employees. Most high impact
SMEs have more than 15 employees and therefore are required to comply with
these laws which may alter their selection process.
Section 2.3 discusses the issues surrounding P-J fit, namely that hiring a
candidate with a strong P-J fit provides more predictive validity in performance
levels, job satisfaction, and overall turnover (Kristof-Brown, Zimmerman, &
Johnson, 2005). However hiring based on P-J fit takes more time and skill to
conduct a personality based job analysis (PBJA). Moreover, employees of small
businesses tend to have many functions and job roles which means the
employee may need to fit several personality based job roles. Additionally,
employers perceive their ability to select a promising candidate as relatively
high, but their ability for job design and strategic HR planning as quite low
(Barczy, Husain, & Green, 2007). This suggests that SMEs are more likely to
hire based on P-O fit, instead of P-J fit. Little research has been conducted on

33
the importance of P-O fit versus P-J fit for small businesses. Barrett, Neeson, &
Billington (2007) interviewed small business owners who suggested that finding
employees “who reflected their own philosophy” and had work attitudes “similar
to their own” was most important, which suggests hiring based on P-O fit
intuitively feels better to small business owners. However, Barber, Wesson,
Roberson, & Taylor (1999) indicated that almost 60% of employees in small
business self-selected into the company (Barber, Wesson, Roberson, & Taylor,
1999), therefore, SME employers should be even more concerned with trying to
find P-J fit among the already interested P-O candidates.
Regardless of which fit the employer is most interested in hiring for, the more
formalized HRM practices the business has, the more likely the employee will
feel both P-J and P-O fit (Boon, Den Hartog, Boselie, & Paauwe, 2011; Pajo,
Coetzer, & Guenole, 2010). Boon et al., (2011) indicated that increased HR
functions increased fit “by consistently communicating values characteristics as
well as demands and expectations of the organisation” (p.140). However, as
reviewed in section 2.5.1, the level of HRM in SMEs may vary by performance.
Administration costs may be another reason SMEs adopt fewer HRM practices
and may keep the selection process as informal as possible. Assessments are
expensive, while interviewing is not. Bates (2002) estimated the average price to
customize an assessment is $20,000, with an additional $50 per applicant. One
large company indicated they spent over $200,000 to customize their personality
simulations (Zielinski, 2011). Small firms that do not forecast hiring needs, nor
hire large quantities of people at once, do not have the benefit of economy of
scale to absorb such costs (Barber et al., 1999). This provides context for the
second hypothesis.
H2 Small and medium-sized enterprises in the U.S. will be less likely to use
personality / integrity assessments than large firms as indicated by
Piotrowski and Armstrong (2006).
As a firm grows it must move from a simple central structure, where employees
have informal roles and report to small number of managers, to a functional
decentralized structure, where employees have more structured roles within

34
divisions (Stacey, 1996). There is not specific measurement of complexity for
when this must occur within a given firm.
Ordanini & Silvestri (2008) indicated that many small Italian firms outsource
some HRM functions due to cost. 12% outsourced the entire recruitment and
selection process. However, knowledge and technology intensive firms were
less likely to outsource these functions, but managed them in-house. Likewise,
Bacon & Hoque (2005) indicated SMEs in the United Kingdom involved in
knowledge intensive work, or with highly skilled employees, are more likely to
engage in formal HRM practices, including the use of personality, or skills
assessment, in the selection process. The majority of high impacts SMEs in the
U.S. are knowledge and technology intensive firms. This leads to the third
hypothesis.
H3 High impact SMEs will be more likely than non-high impact SMEs to
adopt personality / integrity assessments in the selection process.

35
2.6 Conclusion
Employers use many techniques to select which candidate they hire. The
literature reviewed in this chapter, such as Arvey & Renz (1992), suggested that
some tools, such as unstructured interviews, are more subjective than others,
which may open companies to litigation for adverse hiring practices. Some
techniques such as contacting references, has demonstrated low predictive
ratings but are favoured by most employers.
Personality and integrity assessments have been shown to offer predictive
validity in job success, and reduce the impact of adverse hiring practices on
protected classes. While companies may prefer P-O fit, employees with a strong
P-J fit have also been shown to have a higher prediction of job success.
Personality assessments, as described above, are best used with a P-J fit
model. They should be custom designed based on an assessment of skills and
knowledge needed for a particular position.
Some states are not currently allowed to test candidates for honesty which could
limit their usage of integrity assessments. However, ‘conscientiousness’, one of
the factors of the Big Five, has shown to predict both job success in almost all
positions, and also to measure integrity. Other factors of the Big Five, such as
‘extraversion’ have also demonstrated validity in predicting job success in
certain positions.
Despite their validity, a recent survey showed that less than 30% of larger
American firms used either integrity or personality assessments. This research
builds on that study by researching the selection techniques, including
personality and integrity assessments, of high impact SMEs in the U.S.
The next chapter will discuss the philosophical underpinnings that guided the
theory and design of this project.

36
Chapter Three Epistemology
3.1 Introduction
The subject of epistemology is a stand-alone chapter in this thesis. The Master
of Research degree was undertaken as a foundation to pursuing a PhD. This
foundation involves learning how to critically think about the purpose of research
which includes gaining “a sound knowledge of research philosophies,
paradigms, and theoretical perspectives in particular areas” (Master of Research
Handbook, p. 4)
The purpose of research is to move beyond passive and anecdotal observations
of the everyday world, and engage in a thorough examination of the phenomena
of the social world. Knowledge gained through deliberate study can contribute
to existing knowledge, provide information to professional practitioners, or help
build new theory (Black, 1999; Bryman, 1989; 1995).
At times it can seem that deliberate study is achieved through designing a
research project by choosing between qualitative and quantitative methods such
as designing a survey or participating in observation based on personal
preferences. But deliberate study requires an understanding that method
choices are not independent of theory, and should not be made merely to
legitimate, or prove a specific point (Hoshmand, 2003). Researchers should first
identify the epistemological and theoretical underpinnings of their research,
which in turn shapes the design, collection, and analysis of the data. It can even
affect the literature used in building the foundation of theory development
(Crotty, 1998). Similarly, Silverman (2001) suggested philosophical theories
help guide researchers to look at phenomena from a particular view, and that
choice guides the direction of the methods. However, unlike Hoshmand, he
indicates that one methodology over another “isn’t true or false, only more
useful” (p.4). Or in other words, the goals of the researcher can help decide
what philosophy is most useful (Black, 1999; de Vaus, 1996).

37
3.2 Two Paradigms
There are largely two contrasting paradigms in the social sciences; positivism
and social constructionism. This research contributes to the field of HRM and
borrows from psychology theory regarding personality trait assessments. While
the majority of the literature used as supporting evidence in this project is from
the positivist paradigm, HRM and psychology researchers also operate under
constructionist paradigms.
An HRM researcher working in the positivist paradigm may be interested in
looking at uncovering HRM best practices from many organizations, or creating
experimental groups to determine cause and effect of a new management
process. These aims are undertaken by being objective, systematic, and
reducing the phenomena to the simplest, operationalized term. Things,
constructs, people’s actions, can be quantified and measured.
Under social constructionist paradigms, the researcher might become more
entrenched in one specific organization to understand how employees perceive
HRM practices and how their perception affects the impact of the HRM designs.
Table 3.1 Comparison between two paradigms
Positivism Social Constructionist The observer Must be independent Part of what is being observed
Research progresses through Hypothesis and deductions Gathering rich data from which ideas are induced
Concepts Operationalized and measurable Stakeholder perspective
Units of analysis Reduced to simplest terms Complexity of the ‘whole’ situation
Generalization Statistical probability Theoretical abstraction
Sample requires Large numbers selected randomly
Small numbers chosen for specific reasons
Easterby-Smith, Thorpe, & Lowe (2002), p.30
A quantitative positivistic research project can most often be completed more
quickly than a qualitative constructionist project. Responses can be gathered
using a survey that reaches many participants in a short span of time. The data
gathered is already pre-coded as variables are operationalized during the design

38
of the project, and the results can be used as a general application for similar
institutions (Easterby-Smith, Thorpe, & Lowe, 2002). Constructionists, on the
other hand, must immerse themselves with their participants. Building trust and
decoding the groups particular language takes time. The researcher must also
spend enough time observing participants to gather enough information to find
patterns, after which complex analysis is applied to extract meaning (Easterby-
Smith, Thorpe, & Lowe, 2002).
However, quantitative research practices have difficulty capturing why concepts
and phenomena have been created, and also limits the ability to generate new
theories (Easterby-Smith, Thorpe, & Lowe, 2002; Yin, 2003).
Table 3.2 Strength and weakness of two paradigms
Positivism Strengths
Fast and economical
Cover a wide range
Can be predictive
Considered more ‘legitimate’ by policy makers Weaknesses
Not flexible
Difficult to understand the ‘why’
Not ideal for generating new theory Constructionist Strengths
Look at process over time
Understand meaning and ‘why’
Can help create new theory Weaknesses
Increased time and involvement
More complex analysis and interpretation
Lower credibility based on ‘subjective’ interpretation
Easterby-Smith, Thorpe, & Lowe (2002), p.42
3.2 Chosen Paradigm
This research is based on the epistemology of objectivism, which means there is
a belief that phenomena exists outside constructed social meanings, can be
independently observed, and measured by the researcher. The social theoretical
perspective adopted under this epistemology is positivism. As in the natural

39
sciences, positivism attempts to provide knowledge that is general,
“unambiguous and accurate” (Crotty, 1998, p.18).
This paradigm was chosen for several reasons. First, there was a pre-
determined goal of the research to collect specific responses to specific
questions from a specific sample of participants. Deductive reasoning, or pre-
determinism, is a hallmark of positivism, where systematic and objective testing
is done to prove or disprove a hypothesis. Secondly, the data collected from this
research was not used to build new theory, but was used to statistically compare
with previous quantitative research performed by Piotrowski & Armstrong
(2006). By collecting data from similar constructs, using similar methods, the two
results can be compared for similarities and differences between large
companies and small companies. Lastly, the scope of the project in both time
and size necessitated a more systematic approach than paradigms that involve
building theory based on interpretations from observation.
The positivist paradigm in HRM research is not without its critics. Hendry &
Pettigrew (1992) suggested that each organizations language and norms are
different and react to external conditions differently. The implication is that
organizational studies should be subjective and constructive. Sisson & Storey
(2000) suggested the HRM model, which is focused on building work teams,
should be a qualitative endeavour – getting the ‘right’ people in teams. However,
many of the scales used to measure ‘right’ fit employees are based on statistical
modelling from measuring employee efficiency (Nelson,1980) to psychometric
measures (Barrick & Mount, 1991; Barrick, Stewart, & Piotrowski, 2002;
Dunnette, Eaton, Hough, Kampe, & McCloy, 1990). Additionally, sometimes a
spectator can more easily observe than someone within the group. Sometimes
“knowing requires a certain distance from being or doing” (Fay, 1996, p.20).
Outside observers are not as easily caught in the mixed and contradicting
driving emotions as someone who is ‘being’.
Critics also argue that positivists’ obsession with finding legitimacy is an issue.
Essex & Smythe (1999) implied that researchers sometimes use numbers, or
statistics, as proof of an outcome, with an assumption that numbers are theory
free. They explained that statistics are measurements, and if used incorrectly,

40
lead to either an incorrect outcome, or a useless one. Costa & Shrimp (2001)
suggested American students are taught that methods are more important than
theory, and often the methods are quantitative, which results in students being
implicitly taught the positivist paradigm. Fleetwood & Hesketh (2006) echoed
this sentiment, suggesting graduate students are taught statistical measures, but
their research never explicitly explains how the scientific method is used, and
therefore, are unaware of how it affects the outcome of their research. They
further indicate that by not acknowledging the epistemological claims, the results
of the observed phenomena are closed to further interpretation. In contrast, the
UK Master of Research programs help students learn the importance of theory
and provide the opportunity to explicitly discuss how a chosen paradigm affects
the outcomes of the research project.
The use of statistics or discussion between quantitative and qualitative methods
does not in itself signify a division between positivist and constructionist. The
goal of being objective, valid, and generalisable is what defines positivism
(Crotty, 1998). Additionally, positivism is concerned with providing technical
knowledge that can be used by others, but does not provide a value term in of
itself (Giddens, 1975) but allows the interpreter, and in this case, the HRM
practitioner, to decide if the knowledge is useful to their organization. However,
Wick & Freeman (1998) contest this idea and believe that value-less research
does not produce practical knowledge.
Some critics believe that positivists are overly concerned with publication and
providing outcomes (Wagoner, 2007) which results in ‘scientism’ (Fleetwood &
Hesketh, 2006). Scientism is “an exaggerated trust in the efficacy of scientific
methods to explain social or psychological phenomena” (Proctor, 1985). There
is a desire to be absolute and correct (Cohen, Manion, & Morrison, 2007) or in
other words, inflexible and unyielding. However, natural scientists, who are not
tied to the constrictions of positivism, acknowledge there is a level of subjectivity
occurring in observation. Scientists incorporate ‘discretion’ and ‘judgment’ when
developing their experiments, but attempt to do so without compromising
objectivity by adhering to “logical consistency” (Kosso, 2009, p.38).

41
Garfinkel, an early positivist philosopher, indicated there should be some degree
of fit between observation and theory, and that one should choose the more
rational choice, or the choice that is more closely related to the theory (Giddens,
1975). Economist Matiaske (2004) also suggested that rational choice focuses
on the collective phenomena of organized actions, or the “aggregated effects of
individual actions” (p.260). These aggregated actions give an organization its
own character and language, which could allow HRM to create its own
ontological claims. He explains there is a difference between describing
individual behaviour and the logic of aggregating typical actions. This is not
dissimilar to Durkheim who believed there was a common belief among the
collective conscience, but believed that “fundamental definitions must be sought
among the external characteristics of phenomena” (Giddens, 1972, p.65) and
that in order to predict the future, one must break down and identify patterns.
Constructionists may indicate that “typical” cannot be defined, but positivism
suggests there are a set of norms, within a body of people, that can be
observed. There are always exceptions and outliers, but it is the collective whole
that creates the nucleus of phenomena, or in this case, an organization.
Habermas cautions that if not careful, one could have an over-reliance on
empiricism and choose to ignore prejudice in observation and one should
question the authority of the original knowledge that is providing ontological
claims (Giddens, 1975). Here then is the link between natural sciences ‘logical
consistency’ and positivism’s ‘rational choice’, noting that the positivistic
philosophy is not suggesting an absolute right or wrong choice, but the one that
has the better fit.
3.3 Stages of Discovery
Positivists generate hypothesis a priori, or after the process of gaining empirical
knowledge. Hypotheses are thus generated based on a hierarchical process of
knowledge.

42
Figure 3.1 Deductive stages of empirical knowledge (Bryman, 1998; Kosso,
2009)
Bryman (1989) explained that it is not only the presence of counting and
measuring that makes research quantitative, but it is the use of deductive
reasoning. Deductive reasoning allows for research to be “propelled by a prior
set of concerns” (p.24) that are tied to the general and wide set of phenomena.
Ayalon and Even (2008) indicated that deductive reasoning is logical and
procedural, systematic and organized. Subjective inference, which occurs in
social sciences, is still based on the rules of formal logic.
Systematic deductive reasoning prepares the researcher to find certain patterns
in the phenomena (Black, 1999). This is similar to looking for car keys in a
cluttered room. Thinking about the shape, size, and colour of the keys allows the
mind to visually discard anything that is not the set of keys. Oftentimes, this pre-
coding facilitates quicker collection and analysis of data. Black also suggested
the purpose of quantitative results in social sciences is to present data on what
the general population has done, with the intent to predict what the general
population will do. Fast and predictive information is an advantage to business
organizations.
Business organizations want information that is relevant and easy to understand
(Carless, 2009; Saari, 2007). Bryman (1989) suggested business organizations
have specific needs that differ from other social sciences such as psychology
and sociology. Typically, “relevant” (p.32) knowledge is gained and discussed

43
through quantitative research. Statistics can provide descriptive predictions in a
language that business professionals can understand. Quantitative research can
also capture similarities between many employees or firms, which help
practitioners identify information that is applicable to their organization without
the need to interpret individualized subjective qualitative research.
Determining the relationship of the hypothesis to the design of the research is
also important. There are two types of hypothesis in the social sciences;
correlational and causal (Balnaves & Caputi, 2007). A correlation hypothesis
suggests that A is related to B. Generally, testing the hypothesis is done by
gathering data, but does not include an experimental design as variables do not
need to be manipulated to show a relationship. A causation hypothesis proposes
that A affects, or changes, B. Testing this relationship is usually done through
experimentation and can be difficult to prove. Bryman (1989) warned that
quantitative research can be overly focused on finding causality. In fact, the
phrase “correlation does not imply causation” has become repeated so often it
would be difficult to assign an original author to it.
Black (1999) cautioned that it is more important for researchers to find “truth”
than to be “right” (p.6). Expectations can lead researchers to design experiments
that will statistically prove the hypothesis is correct. However, the purpose of
systematic analysis is to collect data that “either proves or refutes evidence of a
proposed relationship” (p.20) which provides empirical information that is closer
to being ‘truth’.
3.4 Conclusion
The continued debate regarding differing epistemological and theoretical
perspectives helps the researcher to be vigilant in their approach to research
design. There are strengths and weaknesses with each approach and
researchers should look to their goals to decide what paradigm to embrace.
Researchers may also find that throughout their career, alternating paradigms
and methodological approaches can bring a more rich and broad spectrum to
their body of work. Above all, researchers should be aware that methods are of
little use without epistemological guidance.

44
Chapter Four Research Methods
4.1 Introduction
The previous chapter discussed the importance of knowing the boundaries of
the philosophical foundation supporting a research project before being able to
design the research methods. This project embraces the positivist paradigm,
which dictates the methods of data collection and analysis is systematic,
operationalized, and quantified.
4.2 Project Phases
This research project has been carried out in four major phases. The first phase
included an extensive literature review in the field of HRM, psychology, and their
associated epistemological and ontological claims. The review provided an
opportunity to identify gaps in the current field regarding selection techniques in
American high impact and non-high impact SMEs which led to the formation of
the three hypotheses outlined in chapter two.
The second phase was designing the methods needed to collect and analyze
the data, and identifying a sample population. The third phase involved the
collection and analysis of the data and the fourth phase involved synthesizing
the information for discussion and the completion of the Master of Research
thesis.
This chapter explores the second phase of the research; designing a
quantitative research project which was used to systematically collect and
measure evidence to support three hypotheses. This chapter will describe the
creation of a self-administered survey questionnaire, identify the sample
participants, the distribution of the survey and collection of the data, and the
method of analysis.
The goal of survey design is to create an analysis that is generalisable (Bryman,
1998). In the case of investigating selection techniques and HRM functions, the
aim is to provide information that is applicable to a wide range of organizations

45
in size, location, and industry. A second goal is to create a project that can be
replicated (Bryman, 1998) in such a way that the same, or different researchers,
can create a similar project to test the validity of the original data. Sections 4.3
through 4.5 provide the steps used for this project that can be used for
replication.
4.3 Participants
4.3.1 Sampling
Well designed quantitative research attempts to gather information from as
many participants as possible that represent the targeted population. When the
population is large, researchers narrow down the list to a sample of the
population. Ideally, the sample should represent the whole as best as possible
(Black, 1999). There are several ways that a sample list can be created; simple
random sampling, stratified random sampling, cluster sampling, and purposive
sampling (Black, 1999).
Random sampling is done by choosing, at random, the companies that will be
contacted. While this is random, it may also result in not having a balanced
representation of the whole. Stratified random sampling occurs when the
researcher identifies specific groups that have similar traits and then randomly
chooses among the identified groups. Cluster sampling involves participants
within a given cluster, such as industry or geography. Purposive sampling
involves hand picking the companies who will be included in the project. The
benefit of this method is assuring the participants closely align to the aim of the
project, however, this method is also open to criticism that the researcher
selected firms that would respond in a manner that would support the hypothesis
(Black, 1999). Despite this concern, this research project did use purposive
sampling as it provided greater control in finding a very specific population that
applied to the hypothesis.

46
4.3.2.a Sample Size and Purposive Sampling
The range of employee size for SMEs in the United States is one to 500
employees. Micro firms (10 or fewer employees) were excluded from this
sample as they fall below the EEOC regulations for fair hiring practices and may
only need to use recruitment over selection practices. The range of 10 to 500
employees is wide and needed to be narrowed, thus firms with over 250
employees were also excluded. There are two reasons for this. First, there are
many more complex human resource issues as firms become larger (Stacey,
1996) and including the larger firms would alter the results of the truly small
firms. Second, many of the other regions in the world classify SMEs as 1 to 250.
By capping this sample size to 250, this project can more easily be compared
against other studies such as those conducted by Behrends (2007) and Bacon
and Hoque (2005).
There are three targeted groups for this project; high impact SMEs in all U.S.
states minus Massachusetts, high impact SMEs in Massachusetts, and non-high
impact SMES in all U.S. states. These three groups correlate to the three
hypotheses:
H1 Employers in Massachusetts will be less likely to use personality
assessments of any kind during the selection process due to the legality of
testing for honesty / integrity.
H2 SMEs in the U.S. will be less likely to use personality / integrity
assessments than large firms as indicated by Piotrowski and Armstrong
(2006).
H3 High impact SMEs will be more likely than non-high impact SMEs to
adopt personality / integrity assessments in the selection process.
4.3.2.b Group One: High Impact SMEs in the U.S. Minus MA
U.S. high impact SMEs were identified through Inc.’s annual 500 list. Inc., is a
leading business magazine in the U.S., catering to entrepreneurs and innovative

47
business owners. Each year the magazine publishes an annual report of the top
500 fastest growing companies based on the current three years of revenue.
Companies must be privately held, based in the U.S., and not a subsidiary of a
larger company (Inc. 500/5000 FAQ). These are considered high impact firms.
The on-line database of the published lists allows the viewer to sort listings
according to location, number of employees, growth, and industry. The database
can also be customized to capture previous years, or extend beyond the print
listed 500 companies. This research used the current 2011 top 500. Out of 500
companies, 86 were omitted because they had fewer than 10 employees, or
more than 250. An additional 11 companies were registered in Massachusetts
and were moved to the Massachusetts high impact list. As the Inc. list is a
sample in itself, the goal was to contact the remaining 403 companies.
4.3.2.c Group Two: High Impact SMES in MA
In order to collect enough responses from the MA group to quantifiably test
hypothesis one, the Inc. list was expanded to 2010 and 2009. The inclusion
increased the MA sample size to 138.
4.3.2.d Group Three: Non-high Impact SMEs
There are several business listing services available for a paid subscription,
such as Dunn & Bradstreet and Reference USA, however, due to budget
constraints non-high impact SMEs were identified through MANTA, a free on-
line business listing resource. MANTA collects information regarding business
listings through third-party sources (MANTA FAQ). MANTA is not equal to Inc. in
reliability, validity, nor in its filtering system, however, it does provide a
comprehensive list of firms that do, or have, existed.
The following filter was applied to the database:
Has been claimed by a company representative
Number of employees 10 – 249
Single location

48
These filters resulted in 91,720 companies though not all listed companies are
active. The ‘claimed by company representative’ filter indicates that a
representative from the company has contacted MANTA to verify its existence,
which suggests these listings should be legitimate and currently operational. The
‘single location’ filter also indicates the company is located in one area, and not
part of a subsidiary.
The goal was to contact an equal number of non-high impact SMEs in similar
industries as those in the high impact SMEs sample. By comparing similar
industries, growth impact could be attributed towards management factors such
as HRM, rather than differences in industry fluctuation. By matching as many
similar traits as possible, a better comparison can be made between high impact
and non-high impact firms.
After six weeks of creating the non-high impact sample size, only 252
companies were located.
4.4 Survey Design
4.4.1 Reliability and Validity
The value, strength, and authority of knowledge gained by quantitative research
methods depend on the survey design and analysis. The design must be both
reliable and valid (Black, 1999; de Vaus, 1996).
4.4.1.a Reliability
The extent to which answers provided by the participants are consistent, honest,
or true represents the reliability of a test or survey (Black, 1999). Social
scientists examine human behaviour, attitudes, beliefs, and actions, which are
notoriously complex. Confusion between researcher and participants can be
caused by regional, ethnic, or social differences. In the case of business
research, confusion can be caused by different employment background (Black,

49
1999; de Vaus, 1996). Confusion can also occur if questions are poorly written,
or involve jargon, or technical terminology (de Vaus, 1996).
4.4.1.b Validity
Validity means the survey, or experiment, measures variables relevant to the
hypothesis being tested, and is meaningful to the field of research. It also means
the construct that was intended to be measured was measured, but does not
include constructs that are irrelevant to the study. To obtain validity, the
researcher must ask the right questions from the right population (de Vaus,
1996; Balnaves & Caputi, 2007).
This project was designed to capture information from high impact and non-high
impact SMEs in the U.S. regarding their selection techniques. The survey was
distributed to firms with only 10 to 250 employees, a size within the SME
parameter. Additionally, the survey was distributed to a cohort of SMEs which
had achieved exceptional growth in the past three years, which classified them
as high impact. These measures helped target the right population.
The questions on the survey were designed to capture information about the use
of selection techniques and HRM concepts as they related to the hypotheses,
but did not ask questions that may have been interesting to the researcher, but
irrelevant to the study. A sample of the survey questionnaire can be found in the
appendix.
4.4.1.c Pilot Study
A pilot survey was distributed to five HRM practitioners and five SME business
owners within the researcher’s social network. This allowed for detailed
discussions regarding the intended goals of the survey and the perceptions and
understanding of the questions as they were written. The pilot survey also tested
for confusing, ambiguous, or jargon laden questions and was adjusted according
to their feedback. This helped increase both the reliability and validity of the
survey.

50
4.4.2 The Questionnaire
There are two main methods for conducting exploratory quantitative analysis:
interviews or self administered surveys (Bryman, 1998). The self administered
survey questionnaire was used for this project. Some disadvantages to this
method are the inability to explain confusing or ambiguous terms, the inability to
verify who responded to the survey, and the tendency to produce extremely low
response rates (Bryman, 1998). However, for a year-long graduate student
project, the advantages outweighed the disadvantages. The advantages are
lower administration cost, faster distribution and collection of data, and less
interview affect on participant responses (Bryman, 1998). In addition,
geographical boundaries limited the ability to conduct in person or telephone
interviews. To mitigate some of the disadvantages, the pilot study was
conducted to address issues of clarity and in order to address low response
rates, follow up reminders were distributed in a timely manner.
Two questionnaires were created with a combination of open-ended questions
and closed-end forced Likert scales. Initial ideas for the design was adopted
from research performed by Piotrowski & Armstrong (2006) regarding
recruitment and selection practices of the U.S. Fortune 1000, Behrends (2005)
research on HRM practices of German SMEs, De Kok, Uhlaner, and Thurik’s
(2006) research on HRM practices in family owned firms, and Woodall, Scott-
Jackson, Newham & Gurney (2005) research on outsourced HRM functions.
The first questionnaire was distributed to high impact SMEs and high impact
SMEs in Massachusetts. The first four questions pertained to the demographics
of the organization. Question one asked for the state of registration in order to
insure MA responses were kept separate from all other states and was directly
related to H1. Questions two, three, and four asked for employee size, industry,
and growth rate to insure the responses were from high impact SMEs and to
compare to the demographics of the non-high impact firms.
The question regarding industry was forced choice based on the represented
industries on Inc. There are currently 20 sectors and 1,170 industries in the U.S.
(U.S. Census Bureau, NAICS). NAICS codes can seem to overlap, such as

51
541511 – custom computer programming and 541512 – computer systems
design services. To provide an open-ended question would open the possibility
of having too many variations of responses. This project is more concerned with
larger group analysis such as computers and advertising, not the subgroup of
each sector. As non-high impact firms were selected to closely mirror the high
impact firms, the forced choice categories helped narrow the choices to the most
closely related industry.
Questions five and six asked if the firm had a full time HR person or division,
and if the firm outsourced any recruitment or selection processes. These
questions used Likert type scales by including “yes, for all jobs”, “yes, for some
jobs” and “no”. These two questions were indirectly related to the hypothesis,
but the rationale was if firms were more likely to outsource these processes,
they would be less likely to know what selection techniques were used by a third
party.
Question seven asked if firms used any of eleven selection techniques including
integrity and personality assessments and also used a Likert type scale by
including “yes, for all jobs”, “yes, for some jobs” and “no”. This question was
directly related to all three hypotheses. Question eight asked if the firm felt P-O
or P-J was more important to the organization. This question went beyond the
hypotheses but was important to investigate how fit might affect selection
processes.
The survey for the non-high impact SMEs was altered by removing the question
regarding the firm’s growth in the past three years. The feedback from the pilot
study indicated that non-high impact firms felt this question was an invasion of
privacy where as high impact firms had already provided this information to Inc.
making it public knowledge. The majority of the non-high impact firms were more
than 15 years old, and were cross referenced with the Inc database to insure
they were not classified as a high impact firm. Intention and ability to achieve
substantial continuous growth would have most likely occurred by this time
(citation), thus, presumably the firms included in this sample were truly non-high
impact firms.

52
4.4.3 Data Collection
The questionnaire was constructed on SurveyMoneky, an on-line survey
software program. There were three active surveys for the targeted samples.
The titles were as follows:
MRes = High impact SMEs excluding MA
MASS MRes = High impact SMEs in MA
SMEs = Non-high impact SMEs
The titles were used as a way for the researcher to keep track of the different
surveys, but not unduly influence the responses by indicating to the participant
which group they were in.
A first email with a request for informed consent was distributed, with the
appropriate survey link, from the student’s university email account. The emails
were inserted into blind copy so that no company would be able to see who else
was on the list. Companies that indicated they could not take part in the survey
were placed on a do not contact list. One week after the drop of the first email, a
reminder was distributed. One week prior to the deadline, a final email was
issued requesting a final call for any company that would like to participate.
Those companies that have indicated an interest in the research findings have
been added to a distribution list to receive a copy of the findings when
completed.
SurveyMonkey was monitored on a consistent basis and answers were
extracted and placed into both an Excel and SPSS database for analysis.
4.4.4 Data Analysis
This project had three hypotheses to test and needed to compare the use
frequency of personality and integrity assessments of SMEs to the Fortune
1000; to compare the use frequency of personality and integrity assessments
between high impact SMEs in Massachusetts with high impact SMEs in all other

53
states; and to compare the use frequency of personality and integrity
assessments between high impact SMEs and non-high impact SMEs.
For this purpose, descriptive statistics were created using frequency tables
providing the mode and percentage of responses, as they compared to the
above stated categories. Descriptive statistics describe the data in accessible
graphs and charts that are easier for the general public to understand (Black,
1999). These tables were created by using SPSS® to perform an ordinal
univariate analysis. A univariate analysis attempts to show the frequency of the
variable (de Vaus, 1996) and is the same technique used by the Piotrowski &
Armstrong’s (1996) comparison study. In addition to the frequency tables, a chi-
square test was conducted on the variables. Chi-square is a nonparametric test
used in situations where the sample size is smaller than 30 or in situations
where Likert scales are used (Dancey & Reidy, 2011; Salkind, 1996). Chi-
square analysis helps determine whether the results of the survey are significant
beyond what would be expected by chance (Salkind, 1996).
4.4.5 Data Coding in SPSS
Variables represent the constructs within the hypothesis. In order to quantify the
responses, the variables must be coded in a way that numeric labels are
assigned. The data is then inserted into SPSS® which allows the researcher to
use descriptive statistics to show the frequency of the variables.

54
The range for employee size increased after 100 as there were fewer firms in
the higher range category. To obtain employee frequency, size was coded in
SPSS ® as the following:
SPSS ® code Employee size
1 10 – 20
2 21 - 30
3 31 – 40
4 41 – 50
5 51 – 60
6 61 – 70
7 71 – 80
8 81 – 90
9 91 – 100
10 101 – 125
11 126 – 150
12 151 – 190
13 190 +
14 Declined
Similar to the employee range, the decision for the range of growth came after
reviewing the responses and deciding how the range would best be represented
without cluttering the chart with excessive columns. Growth frequencies for high
impact SMEs were coded as the following:
SPSS ® code Percentage of Growth
1 10 – 20%
2 21 – 40%
3 41 – 50%
4 50 – 70%
5 71 – 99%
6 100 – 200%
7 201 – 300%
8 301 – 400%
9 401 – 500%
10 501 – 700%
11 701 – 900%
12 901% +
13 Declined

55
Coding for the question regarding outsourcing and selection techniques were
coded as the following:
SPSS ® code Outsourcing
1 Yes, for all positions
2 Yes, for some positions
3 No
4 Declined
Coding for the question regarding a designated HR group or person was the
following:
SPSS ® code Designated HR
1 Yes, full time
2 Yes, part time
3 No
The response to P-O and P-J fit were coded as the following:
SPSS ® code Fit
1 P-O fit
2 P-J fit
4.5 Ethical Framework
Effective quantitative research is not only systematic and practical, it is also
ethical. Researchers try to contribute to the existing field of knowledge, but they
must also consider how their investigations, experiments, and findings impact
those they interact with, and society at large. At the very least, researchers
should avoid doing harm to others or themselves. At the best, researchers can
contribute to the greater good of society (Beauchamp, Faded, Wallace Jr., &
Walters, 1982).
Some critics believe unethical research practices not only harm participants, but
can erode “trust” and are “morally unjustifiable” (Beauchamp et al., 1982, p.12)
and that the ends do not justify the means, which is a deontological view
(Saunders, 2008). Others take a teleological view and believe scientists have a
right to unearth information that contributes to knowledge, which at times can
mean taking calculated risks that broach blurry ethical lines (Saunders, 2008) or
that the ends do justify the means. This project does not take any extreme
teleological notion of ethics and is concern with practices that are ethical to self,
the university and the participants of the project.

56
4.5.1 Informed Consent
Informed consent is the process in which the researcher communicates to the
participant the goals, methods, and any risk associated with the project, and
allows the participant to autonomously consent, or decline, the invitation to be
involved in the project. The informed consent should be accurate, clear, and
understandable to the participant. It should also be free from deception,
provocation, or coercion that may persuade the participants to take part against
their will. It should also explain how the researcher will deal with issues of
confidentiality and anonymity (Beauchamp et al., 1982; Research Ethics, 2008).
The informed consent for this project involved a cover letter in the email to the
participants, explaining the purpose of the project. It was addressed to the
owner / manager or HR division of the firm and used business terms and
concepts that are common to those positions. There was no threat or offer for
reward involved. Participants consented by taking part in the survey. Contact
information for both the researcher and the researcher’s supervisor was
provided should participants have had any questions or concerns regarding the
project. A copy of the informed consent letter can be found in appendix B.
4.5.2 Deception
Deception occurs when a researcher misrepresents themselves and / or the
goals of the research project. It can also occur if a researcher omits information
that would prevent an individual from making an informed decision to participate.
Deception can cause harm to both the participant and the researcher and
information gained under false measures could be considered invalid by other
academic researchers (Beauchamp et al., 1982).
Issues around deception are debated more often in qualitative research where
full disclosure of the researcher’s role or goals could affect how the participants
act. In quantitative projects, questions should be straightforward and
researchers must accept the answers provided by the participants (Easterby-
Smith, Thorpe, & Lowe, 2002).

57
There was no intention to deceive in this project. The pilot study of both the
informed consent and survey questionnaire helped tailor a clear and concise
instrument that was free of purposeful deception. Additionally, the analysis of the
data was free of manipulation or false reports regarding the significance of
findings.
4.5.3 Coercion
Coercion is the act of causing a person to act in a way that is involuntary. This
can be done through deception, where the participant does not know the full
truth to respond accordingly, or it can occur through force, threat, bribery, or
offering a substantial reward (Beauchamp et al., 1982). In this age of social
networking, coercion can also take place by threatening firms with posting
negative comments on social media outlets, or vice versa, a promise to write
positive reviews for participation.
The informed consent letter outlined the goals and methods of the research
project. It explained who the targeted audience was, but did not try to pressure
companies to participate by suggesting negative repercussions would happen if
they did not. Nor were any promises to a reward if they did. Additionally, by
collecting responses anonymously, no threat could be made to the companies
by the researcher and readers of the findings.
4.5.4 Privacy
Pinkard described privacy as “being let alone” (Beauchamp et al., 1982, p.248)
and that the invasion of privacy can occur in three basic ways: intrusion, making
private knowledge public, and damaging a reputation by falsifying facts. Privacy
is important to both individuals and organizations. Businesses may have
different reasons for not wanting to disclose company information, such as, fear
of competition, fear of disclosing information that could result in increased
government regulation, and fear of employee’s gaining leverage over
management (Bryman, 1998).

58
While the inherit nature of research includes a level of intrusion, excessive
intrusion should be avoided. In this project, the company information was
extracted from the public websites Inc. and MANTA. The contact emails were
then extracted from the company’s website. Owners, managers and HR staff
were not contacted through their personal email, or social networking sites,
unless indicated to do so by the company. Three attempts were made to each
email address. If a company requested to be removed from the study they were
placed on the do not contact list and did not receive the follow up reminders.
This approach helped minimize the amount of intrusion to the company.
To further maintain privacy, issues of confidentiality and anonymity were also
addressed.
4.5.4.a Confidentiality
Confidentiality is maintaining that certain known facts regarding the participants
remain private between the researcher and the participant (Saunders, 2008).
This project used public sources to create a sample population, but the exact
companies contacted remain confidential to the researcher only. At the
completion of the project the list containing email addresses will be destroyed.
Additionally, care was taken so the identification on any one company cannot be
deduced through the research findings.
4.5.4.b Anonymity
Anonymous responses are those not known to even the researcher. The
informed consent and survey link were distributed through email as a blind copy
to fifty email addresses at one time, with a total of one hundred per day. The
company could respond at their convenience. In this way, the researcher was
unable to allocate any given response to a particular company which allowed for
responses to be collected anonymously.

59
4.6 Summary
The aim of this chapter was to outline the research methods of this project,
which involved the creation of a self-administered survey questionnaire, and
review ethical research practices. The chapter identified three sample groups,
high impact SMEs in all states except Massachusetts, high impact SMEs in
Massachusetts only, and non-high impact SMEs. The survey was hosted on
SurveyMonkey and a link along with an informed consent letter was distributed
to the sample groups through email. Data was collected and analyzed through
SPSS® to create descriptive statistics in the form of frequency tables which can
be compared to previous research. The findings of this process will be reviewed
in the following chapter.

60
Chapter Five Research Findings
5.1 Introduction
This chapter provides an overview of the research findings from the self-
administered survey questionnaire. The chapter first reviews the survey
response rate per targeted group and provides an overview of the size and
industries that were represented. It then reviews the findings in comparison to
the hypotheses. The chapter concludes with reviewing additional findings that
help add to the literature regarding size, growth, and selection techniques.
5.2 The Sample Population
The overall response rate for the survey was 73 out of 751 companies, which
resulted in a response rate of 9.7%. In comparison, researchers Celuch &
Murphy (2010) conducted a recent survey on American SMEs and Internet
usage and obtained a 12.3% response rate and indicated this was the norm for
self-administered survey research on SMEs in that region.
5.2.1 High Impact SMEs minus Massachusetts
403 companies from the Inc. 500 fit the parameter of 10 to 250 employees. 70 of
these companies had embedded email accounts which were not accessible
which reduced the sample size to 331. 43 usable responses were collected with
a result of 12.9% response rate.
5.2.2 High Impact SMEs in Massachusetts
2009, 2010, and 2011 Inc. top 500 lists were used to create a sample size of
138 companies registered in Massachusetts. 10 responses were collected which
provided a 7.2% response rate for this group.
5.2.3 Non-high impact SMEs
282 non-high impact SMEs were contacted and 20 responses were collected.
This provided a 7.1% response rate for this group.

61
5.3 Overview of the participating SMEs
5.3.1 Firms per Size
The smallest firms, ranging from ten to thirty employees, were represented the
most in both the Inc. listings, and the participant responses. Figure 5.1a
represents the firms by employee size according to the top 500 Inc. listing, and
figure 5.1b represents the firms by employee size as represented by the
responses to the survey. These figures demonstrate that those who participated
were closely aligned to the sample population.
Figure 5.1a Employee size per Inc. listing

62
Figure 5.1b Employee size per participant responses
5.3.2 Firms per Industry
Where possible, non-high impact firms were selected that mirrored those of the
high impact firms. Figure 5.2a provides the industry breakdown according to the
Inc. top 500. Figure 5.2b provides the industry breakdown according to the
participant responses.

63
Figure 5.2a Frequency of firms per industry according to Inc.

64
Figure 5.2b Frequency of firms per industry according to participant responses
There were twenty-five industries represented in Inc. The four most common
were government services, advertising, software, and IT. Seventeen industries
were represented in the participant responses with the top four being software,
IT, government, and advertising: very similar to the Inc. list. Certain industries in
the Inc. list were difficult to contact, such as retail services. Many of these firms
did not have an email contact available and were not included in this project.
Other industries from the Inc list not represented chose not to participate.
5.3.3 Growth Rate
Continuous growth is the differentiating measure between high impact and non-
high impact firms. Figure 5.3 below demonstrates the growth rate of the high
impact firms that responded to the survey. Four high impact firms declined to
report their growth and there were twenty non-high impact companies. As

65
discussed in chapter four, the question regarding growth was removed from the
non-high impact SMEs survey list.
Figure 5.3 Growth rate
There were six firms reporting a 100% return and two firms reporting a 200%
return, with no firms reporting in between those extremes. There were several
companies that achieved between 2,000% and 6,000% three-year growth.
These are reflected in the 901%+ category.
5.4 Hypotheses testing
This section will review the hypotheses stated in chapter two, and briefly review
the outcome of the results. Detailed discussion regarding the implications and
suggestions will be reviewed in chapter six.
Chi-square analysis on personality and integrity variables indicated responses
could have been a result of chance. However, chi-square tests run on the other

66
Likert rated ordinal variables demonstrated significance in responses. When
appropriate, chi-square values will be provided in this chapter. A result of all
other chi-square values can be found in the appendix.
5.4.1 Hypothesis One
H1 Employers in Massachusetts will be less likely to use personality
assessments of any kind during the selection process due to the legality of
testing for honesty / integrity.
One hundred and thirty-eight high impact SMEs registered in Massachusetts
were contacted with only ten responding. The responses were too low to obtain
a statistically significant chi-square value. If the assumption that the responses
were not random, the research hypothesis still cannot be accepted. Five
companies responded they did use both personality and integrity assessments
for all positions, and two indicated they used both assessments for some
positions.
Table 5.1 Frequency of MA responses to integrity / personality questionnaire
State: MA All positions Some positions Never Declined Total
Use of integrity assessment 5 2 2 1 10
Use of personality assessment 5 2 2 1 10
5.4.2 Hypothesis Two
H2 SMEs in the U.S. will be less likely to use personality / integrity
assessments than large firms as indicated by Piotrowski and Armstrong
(2006).
Chi-square test results indicate the integrity and personality variables are
significant at the ALL level, meaning, both high impact and non-high impact
groups combined. Integrity equalled 11.219 and personality 14.178 against the
p<.05 level. Divided into their subgroups, high impact and non-high impact, the
chi-square values were not significant enough to reject the null hypotheses.

67
Table 5.2 Chi-square of the integrity assessment variable
DF two-tailed p value Statistical significance Probability level
0.10 0.05
High Impact 3 0.063 7.302 6.251 7.815
*Non-high impact 3 0.221 4.400 6.251 7.815
All 3 0.011 11.219 6.251 7.815
* Less than 5
counts
Table 5.3 Chi-square of the personality assessment variable
DF two-tailed p value Statistical significance Probability level
0.10 0.05
High Impact 3 0.072 7.000 6.251 7.815
*Non-high impact 2 0.074 5.200 4.605 5.991
All 3 0.003 14.178 6.251 7.815
* Less than 5 counts
Similar to hypothesis one, if the assumption is that the responses were not
random, the research hypothesis still cannot be accepted. According to these
findings, SMES are more than 50% likely to incorporate personality / integrity
assessments than the Fortune 1000 as outlined by Piotrowski & Armstrong
(2006). Table 5.4 below compares the results from this research to Piotrowski &
Armstrong.
Table 5.4 Personality and integrity use in all SMEs (n=70) compared to
Piotrwoski & Armstrong (n=151) (2006)
n Yes (%)
P&A Integrity 42 28
P&A Personality 29 19
All SMEs integrity 43 59
All SMEs personality 49 67
Additionally, this research provides a full comparison of selection techniques
captured by this survey, in comparison to Piotrowski & Armstrong’s study. Not all

68
criteria were equally measured by each study and N/A indicates the measures
captured here, but not in the 2006 research.
Table 5.5 Comparison of selection techniques between SMEs and
Fortune 1000
P&A US SMEs
Application Resume 98% 96%
References 97% 93%
Skills assessment 50% 79%
Integrity 28% 59%
Biodata 25% 43%
Personality 19% 67%
Structured interview N/A 94%
Job description N/A 91%
Unstructured interview N/A 70%
GMA N/A 56%
5.4.3 Hypothesis Three
H3 High impact SMEs will be more likely than non-high impact SMEs to
adopt personality / integrity assessments in the selection process.
The chi-square values outlined in the section above indicate the high impact
responses were not significant enough to accept the results, and the non-high
impact responses were less than 5 in certain fields which further decrease the
accuracy of the chi-square analysis. The null hypothesis must be accepted.
However, with the understanding that the responses may be a result of chance,
this project will continue to evaluate the information in the context they are not.
According to these findings non-high impact firms were more likely to use
integrity assessments overall than high impact firms. Non-high impact firms were
10.6% more likely to use personality assessments for all jobs than high impact
firms, and 19.8% more likely to use them for some jobs, which in all, accounts
for non-high impact firms using personality assessments 30% more often than
high impact firms.

69
Table 5.6 Use of personality / integrity differences between high impact and
non-high impact companies in %
Yes, all jobs Yes, some jobs
High impact integrity 28.3% 28.3%
Non-high impact integrity 30.0% 35.0%
High impact personality 28.3% 30.2%
Non-high impact personality 40.0% 50.0%
5.5 Additional Findings
In addition to testing the three research hypotheses, the findings for this project
have provided additional information regarding selection tools, a few HRM
practices as they relate to selection, and how SMEs view the importance of fit. In
many of the constructs, non-high impact firms showed little difference to high
impact firms.
Table 5.7 below provides a full comparison of selection techniques reported
between high impact and non-high impact SMEs. Surprisingly, non-high impact
firms were more likely to conduct GMA assessments over integrity assessments,
and 20% more likely to use them than high impact firms.
Table 5.7 Selection techniques between high impact and non-high impact
SMEs
High impact Non-high impact
n Yes (%) n Yes (%)
Application / resume 50 94 20 100
Structured interview 50 94 19 95
References 49 92 19 95
Job description 48 91 19 95
Skills assessment 40 76 18 90
Unstructured interview 38 72 13 65
Personality assessment 31 59 18 90
Integrity 30 57 13 65
GMA 27 51 14 70
Biodata 19 36 13 65

70
The literature suggested that knowledge intensive industries may be more
involved with the selection process and this research expected the high impact
firms to use more of these techniques. A comparison of industry’s between high
impact and non-high impact firms was drawn to see if one industry was more
represented in the non-high impact firm that might shed some light on why non-
high impact firms were more likely to use personality, integrity, and GMA
assessments than high impact firms. The most represented industries in both
groups were knowledge intensive, such as software, and would not explain the
differences.
Table 5.8 Comparison of industry per high impact and non-high impact firms
High impact Non-high impact
Advt 4 3
Business P&S 5 1
Computer 3 2
Construction 1 1
Consumer P&S 3 1
Energy 1 1
Environment 1 None
Fncl Services 2 None
Food & Bev 1 None
Govt 6 1
Health 3 None
HR 1 None
IT 10 1
Logistics 1 None
Manf 3 2
Software 7 7
Telecomms 1 None
The one major difference between the two groups was having a designated full
time HR group or person. As the differences seemed significant, chi-square
analysis was applied to each group to assure the responses were not random.
The high impact group was statistically significant while the non-high impact had
less than five counts in some fields and therefore is more difficult to measure the
significance.

71
Table 5.9 Chi-square values of designated HR person or group
DF two-tailed p value Statistical significance Probability level
0.10 0.05
High Impact 2 0.000 21.774 4.605 5.991
*Non-high impact 2 0.047 6.100 4.605 5.991
All 2 0.0001 21.068 4.605 5.991
* less than 5 counts
Accepting that responses are not random, the high impact firms were almost
30% more likely to have a full time HR person or group, and non-high impact
firms were55% less likely to have any HR person at all.
Table 5.10 Designated HR person among high impact and non-high impact
firms
Yes, full time Yes, part
time No
High Impact 62.3% 11.3% 26.4%
Non-high impact 35% 10% 55%
Reviewing ten specific answers extracted from the non-high impact group, size
had more bearing on HR group than industry, but not evenly so. Company A and
B are both smaller software firms and do not have an HR person. Company I
and J are also software firms, larger in size, and do have an HR person.
However, company G, a manufacturing company, only reported eleven
employees, yet has a full time HR person.

72
Table 5.11 Designated HR person in non-high impact SMEs
Industry EE HR Person/Department
Yes, full time Yes, part time No
A - Software 12 x
B - Software 3
x
C - Construction 25
x
D - Computer 16
x
E - Computer 90 x F - Business Products 7
x
G - Manf 11 x H - Gvt services 25
x
I - Software 49 x J - Software 25 x
In addition to looking at the frequency of a designated HR person, the project
also looked at how often companies outsourced the recruitment and selection
process. This was important to measure insofar as companies that outsource
the selection process would be less likely to know what selection tools were
used. The chi-square values for these variables proved statistically significant,
with high impact firms equalling 44.593 for outsourcing recruitment and 63.827
for outsourcing selection.
Only a small portion of either group outsourced recruitment and selection for all
positions. However, high impact firms were significantly more likely to outsource
recruitment and selection for some positions, in relation to non-high impact
firms.
Table 5.12 Outsourced recruitment and selection functions
Yes, for all Yes, for some
jobs No Declined
High impact recruitment 4% 36% 57% 4%
Non-high impact recruitment 5% 35% 60% High impact selection 4% 13% 83% Non-high impact selection 5% 95%
The survey was also designed to capture the importance of fit for each
organization. Both high impact and non-high impact firms felt P-O fit was more
important than P-J fit.

73
Table 5.13 P-O versus P-J fit
P - O fit P - J fit
High impact 62% 38%
Non-high impact 65% 35%
5.6 Conclusion
These findings did not support the research hypotheses. The state of company
registration did not affect the rate of use of personality assessments nor integrity
assessments. The findings also showed that these SMEs were more likely to
use personality and integrity assessments than the large companies from the
2006 study.
In many respects, high impact and non-high impact firms use similar practices of
the variables measured for this project. The most significant difference between
high impact and non-high impact firms was having a designated HR person or
group. The implications of these findings will be discussed in the following
chapter.

74
Chapter Six Discussion
6.1 Introduction
The purpose of this study was to determine if high impact SMEs in the U.S. used
personality and integrity assessments as part of the selection process, more
often than the Fortune 1000 reported in 2006. The literature reviewed in chapter
two showed that personality and integrity assessments can provide an increase
in predictive validity to job success measured by supervisor ratings and turnover
rates. Personality and integrity assessments combined with other techniques
can also help increase fair and ethical hiring practices which may help decrease
adverse hiring practices on protected classes. (Arvey & Renz, 1992; De Meijer,
Born, Terlous, & van de Molen, 2006; Nga & Sears, 2010, Ones et al., 1993).
Three research hypotheses were generated to respond to the purpose of the
study and were tested through the use of an eight question self-administered
survey. While the results did not support the hypotheses, the findings do help
provide discussion points in the current knowledge regarding selection
techniques and SMEs.
This chapter will first discuss chi-square values of the data as they relate to
accepting the research or null hypotheses. The chapter will then discuss the
implications of the findings for the hypotheses and additional findings.
6.2 Chi-Square
Due to the low response rate for the non-high impact group, there were less
than five counts for some measurements. As mentioned in chapter four, chi-
square tests are ideal for using on either Likert scales or when responses are
less than 30, however, there is an assumption that responses will be greater
than five. With twenty non-high impact responses, divided into three scales, 6.66
would be the equal random response for each scale which does not allow for
great variance in either random or significant responses.

75
Personality and integrity were the two most important variables of the survey,
however, chi-square tests indicated the responses were statistically insignificant
for each sub-group, or in other words, there is a possibility the responses were
due to chance. However, chi-square tests on other variables did demonstrate
statistical significance. While one has to accept the possibility of chance, one
can also consider that participants are unlikely to randomly answer some
questions but be thorough in answering others.
6.3 Hypothesis One
H1 Employers in Massachusetts will be less likely to use personality
assessments of any kind during the selection process due to the legality of
testing for honesty / integrity.
The literature reviewed Massachusetts general labour laws that prohibit any
device used to measure honesty or intentions towards deception from current or
future employees with the assumption that integrity assessments violate this
law, and furthermore, many personality assessments used for similar purposes
would also violate this law (Woods & Savino, 2007). It was posited that SMEs
registered in Massachusetts would be unlikely to use personality assessments,
however, the results from the data indicate that some firms in Massachusetts
use both personality and integrity assessments.
An issue with using exploratory short surveys is the inability to find a causal
relationship between criteria, or to use follow up questions to understand more
fully the kind of assessments that are being used or how the employer is using
them. In situations such as this, where practices seem to be in opposition of the
law, the researcher should question the authority of the responses.
One suggestion could be that firms are using subjective methods of ‘assessing’
candidates during the interview process rather than issuing a paper and pencil,
or computer proctored assessment. However, two firms indicated they used
personality and integrity assessments for some positions, and two indicated they
never used either assessment. If subjective assessment was occurring, one
would thing more firms would report “yes, for all positions”.

76
Another suggestion is that SMEs either use external consultants or purchase HR
software systems directly from vendors (Greer, Youngblood, & Gray, 1999;
Khanna & New, 2005). Finding vendor services that fit the firm’s needs can take
time and managers may not be aware of state and federal regulations regarding
integrity assessments. Managers may select the assessments during the
request for proposal (Zappe, 2009) or the assessments may be pitched during
the sales process. Saari (2007) cautioned HR practitioners to look out for
“consultants selling poorly developed and legally vulnerable selection methods”
(p.1043). For some vendors, the initial sale of a product is more lucrative than
maintaining an ongoing relationship with a company (Bill, 2009; Greer,
Youngblood, & Gray, 1999). As such, the vendors may be less concerned about
the legality of the products they are selling to firms.
Additionally, not all assessments are equal in predictive validity, or based on
empirical research. Personality assessments are more predictive if they are
based on job analysis. Off the shelf assessments are only telling what the
personality trait is, not how it relates to a specific job. Conversely, some
companies do try to measure personality trait to skill set needed, but may be
using assessments that have not been empirically tested. The financial company
outlined in section 2.4.4.e.4 uses an assessment software package that
categorized people into four personality types similar to those outlined by Bolton
& Bolton (1996) which are analytical, driver, amiable, and expressive, which
similar to the MBTI, may be useful in development programs for existing staff,
but less effective for predicting job success.
SME owners and HR practitioners should make sure to contract with reputable
vendors and consultants who understand not only the needs of the firm, but also
state and federal legislation. The U.S. Small Business Administration is a
resource for both guidance and company directory’s for SMEs.

77
6.3 Hypothesis Two
H2 SMEs in the U.S. will be less likely to use personality / integrity
assessments than large firms as indicated by Piotrowski and Armstrong
(2006).
The SMEs who participated in this project reported to use integrity assessments
30% more and personality assessments 46% more than those from Fortune
1000 comparison study. The findings from this study do correlate more to the
literature regarding the assessment market. Trade publications estimate the pre-
employment assessment industry to be upwards of $2 billion globally, with more
than 2/3 of companies using one form of assessment or another, with
psychological assessments such as personality and GMA being used most
frequently (Fraunheim, 2011). As discussed in section 6.2 above, SMEs may be
more likely to purchase recruitment and selection packages from vendors which
may have more selection techniques as the standard programmes. Large
companies may also use vendor software but have the economy of scale to
customize the tools offered.
6.4 Hypothesis Three
H3 High impact SMEs will be more likely than non-high impact SMEs to
adopt personality / integrity assessments in the selection process.
The findings of this project suggest non-high impact firms are 30% more likely to
use personality assessments and almost 10% more likely to use integrity
assessments than high impact firms. Two possible scenarios could account for
the reverse findings. First, non-high impact firms may be even more reliant on
off the shelf recruitment and selection software packages than high impact firms.
However, that would not explain while personality assessments are used much
more than integrity. A second scenario could be related to confounding
terminology. Over 55% of the non-high impact firms lacked an HR person. As
discussed in the literature review, integrity and personality assessments can
appear to be the same. It may be that those companies without an HR person

78
may not be aware of the distinction between the two assessments and may think
they are only using personality assessments when they are using both.
6.5 Additional Findings
In addition to testing the hypotheses, the survey data provided findings that can
be compared to previous research and helps aid the conversation regarding
SMEs in the U.S.
6.5.1 Sample Size
The sample size was lower than hoped for and will be discussed in chapter
seven regarding limitations.
Not surprisingly, the response rate for the high impact group was higher than
that of the non-high impact group. First, the sample size was higher for the high
impact group, with 341 over 282 for the non-high impact group. Additionally, the
cover letter to the high impact firm may have been appealed more to business
owner’s sense of pride. As these firms were identified through their success and
Inc. award, the cover letter was able to congratulate them on their success and
also provide a context for how they were located. The cover letter to the non-
high impact group could not make such claims and locating current and
legitimate non-high impact firms was more difficult.
6.5.2 Selection Techniques
Similar to Cook’s (2004) findings, the ‘classic trio’ was the most used selection
approach of all the SMEs in this project. 96% reviewed applications or resumes,
94% conducted a form of interview, and 93% contacted references. However,
the use of other selection techniques was higher than anticipation compared to
Piotrowski & Armstrong (2006), Harris & Dworkin (1990) and Terpestra (1996).
As suggested earlier, the increased accessibility to the Internet and software
applications, coupled with increased HR consulting firms, may have resulted in
an increase in technique applications.

79
When separating out the high impact responses from the non-high impact firms,
personality, integrity, GMA, and biodata use drops considerably for the high
impact group. This suggests that high impact SMEs may be more similar to
larger firms in their need for more complex and custom designed selection
techniques than non-high impact firms.
6.5.3 Designated HR
Many smaller firms do not have the resources, financial, knowledge, or human
capital, to allocate a full time HR person or group. Indeed, not all small firms
need such a position. However, as firms become more complex, either in
product offering, expanding locations, or employee growth, the need for strategic
management and HR practices grows (De Kok, Uhlaner, and Thurik, 2006;
Hendry & Pettigrew, 1992; Stacey, 1996). Behrends (2007) suggested
developing HR functions is not about size, or lack of experience, but about
“growth-induced adaptive behavior” (p.59) and that professional services and
knowledge-intensive firms were more likely to incorporate HR functions due to
complexity of product and human capital. The findings from this project match
this theory.
The findings in this project demonstrate that over 62% of the high impact firms
have a full time HR person or group, and 11% have a part-time HR person,
while only 33% of the non-high impact firms had a full time, and 11% had a part-
time HR person. The firms in both groups are similar in both size and industry,
therefore, employee size alone does not correlate to increased HR practices.
While a growing employee base may increase recruitment practices, the
complexity of the organization is what demands strategic change (Hendry &
Pettigrew, 1992). Carlson, Upton, & Seaman, 2006) indicated the difference in
HR need wasn’t size or age, but whether the firm was high performing or low
performing. According to the literature high impact firms are more complex in
both product and human capital needs and outperform other SMEs in their
industry.

80
These researchers do indicate it is difficult to tell if increased HR practices help
firms to grow, or if growth demands increased HR functions, though De Grip &
Sieben (2009) indicated that it is the employees that benefit more from
advanced HR functions, not necessarily the company itself.
6.5.4 Outsourcing
Not all companies conducted the recruitment and selection process in house.
Oranini & Silvestri (2008) indicated that more knowledge intensive firms would
conduct more recruitment and selection process in house, but this project
demonstrated the opposite. 40% of high impact firms outsourced either all or a
portion of services, and 36% of non-high impact firms did. 17% of high impact
firms also outsourced either all or a portion of the selection process, while no
non-high impact firm did.
The decision to outsource HR functions can be a cost saving measure,
especially for smaller firms that may not need a fully integrated HR person.
Additionally, small firms may outsource functions to obtain best practices where
the skill set for HR processes within the firm is limited (Woodall, Scott-Jackson,
Newham, & Gurney, 2007). However, Krisof-Brown, Zimmerman, & Johsnon
(2005) warned that recruiters can sometimes select candidates based on the
recruiter’s personality rather than the needs of the organization.
Interestingly, the human resource industry represents 2.5% of the Inc. 500. This
seems insignificant until one considers there are 1,700 industries in the U.S.
(NCAIS). These HR firms are divided between those that specialize in
outsourcing payroll, administration of retirement and pension plans, employee
benefits, and training, and firms that specialize in recruitment and job placement
services including conducting the selection process. Many of those listed on Inc.
indicate their particular services are tailored towards other small and mid-size
companies.

81
6.5.5. Fit
One issue with outsourcing HR functions, especially recruitment and selection,
is finding a consultant that understands the culture of the organization. The
majority of participants, both high impact and non-high impact firms, indicated
that P-O fit was more important than P-J fit.
6.5.6 Intentions and Web Presence
All companies in the Inc. 500 list had a current web page and either used an
embedded contact form, or provided an email address with the company name
such as [email protected]. Hausdorf & Duncan (2004) indicated that small
firms used the Internet to the same degree that large companies did. This
seems true for high impact firms. However, it is a different story with the non-
high impact firms. Even after applying the filter ‘has been claimed by a company
representative’ to the MANTA website, which served to verify the company
listing as legitimate and current, approximately 31% of the companies in the
MANTA population did not have an active Internet site. Of the companies that
did have a current web presence, 11% used personal email accounts such as
yahoo, gmail, and AOL. These two factors suggest non-high impact firms do not
utilize the Internet as part of their business strategy.
Websites can be an inexpensive way for companies to communicate with clients
and run a business without heavy investments in real estate such as office and
storage facilities (NSGA, 2011). Customers also feel a company offers more
value if there is a website (Saeed, Grover, & Yujong, 200%). Using websites for
communication is important to market orientation, or the way in which a
company meets customer’s needs (Celuch & Murphy, 2010). Social media such
as Twitter or Facebook have not been around long enough for empirical
research to be conducted regarding their ability to boost firm growth.
6.6 Conclusion
In many of the variables measured for this project, high impact and non-high
impact firms seemed similar to each other. The most noticeable difference being

82
more high impact firms have a designated HR staff and web presence. Many of
the participants in this project indicated that P-O fit was more important than P-J
fit and not surprisingly, the ‘classic trio’ was the most dominant method of the
selection process. Applications, references, and subjective interviews have a
lower degree of validity in predicting job success and can have a negative
impact on minorities.
Six firms had less than fifteen employees and not governed by the Civil Rights
Act and the American with Disabilities Act. All other firms are governed by these
acts and should embrace fair and ethical selection practices such as using
quantified and objective techniques. Both personality and integrity assessments
can be used as providing predictive validity and are quantified and objective,
though states such as Massachusetts prohibit the use of integrity assessments.
The U.S. SMEs in this project report to use personality and integrity
assessments more often than the 2006 comparison study of large U.S.
companies. Surprisingly, firms in Massachusetts also responded to using both
personality and integrity assessments, despite state’s general labour laws.
The next and concluding chapter of this thesis will discuss possible future
research aimed at understanding why the research findings were contrary to the
hypotheses.

83
Chapter Seven Conclusion
7.1 Introduction
This chapter will review limitations of this project and suggestions for possible
future research. It will also offer reflection for the researcher in context with the
aims of the Master of Research degree and the future for academic progression.
7.2 Limitations
7.2.1 Sample Size
The greatest limitation to this research was the low response rate. The overall
response rate was 9.9% which as discussed in chapter five, is only marginally
lower than similar response rates for this demographic and region. The low
response rate could be attributed to numerous factors such as origin of request,
time of year, spam filters and personal email accounts.
A research article (Teagarden, Von Glinow, Bowen, Frayne, et al., 1995)
uncovered in the final stages of this project discussed the methodology and
sampling issues of an international project. The article indicated that countries
tend to be nation-centric when it comes to academic research. UK, Canada and
Mexico firms more fully cooperated when the research appeared to originate
from their country. The study also found that North American firms were less
likely to respond to questions regarding their “internal workings and strategy”. As
this research was conducted through a British university, American firms may
have been less interested in participating in a study that seemed removed from
them. Future research that crosses national boundaries should consider the
suggestion of Teagarden et al., (1995) to use regional cover letters and a local
address. Qualitative research, where the researcher can build trust with the
participants, may be a way to more fully understand the ‘internal workings’ of a
firm.
The timing of the survey may have impacted the response rate as well. U.S.
companies can adopt any consecutive 12 months as their fiscal year (IRS

84
publication 538) though the U.S. government operates from October 1st to
September 30th. Over 10% of the firms in this project are directly related to
government services and may also follow that fiscal year. In addition to the fiscal
year, most companies follow a traditional January through December calendar
year for operation and project management.
The Master of Research degree began 1st February, 2011. The final survey
questionnaire and sample population was finalized at the end of August with the
first round of distribution occurring in September. This time frame falls within
both the end of the government’s fiscal year and the beginning of the 4th quarter
for operations. A final attempt was made to secure more responses from the
non-high impact firms during November with little impact. One company
responded indicating they were interested in participating in the project but was
in the middle of the 4th quarter and would be unable to take the time to complete
the survey. The timing of the survey would mostly likely impact most of the firms
in the sample.
Future projects regarding U.S. companies should take into account tax and
operating deadlines. Even though the survey questionnaire was short it was
non-essential to the participants and therefore not a high priority.
Spam filters and embedded contact forms and personal email accounts may
have also contributed to low sample size and low response rate. A test was
conducted on twenty embedded contact forms which resulted in a zero response
rate. Firms with embedded contact forms were removed from the sample.
However, as technology advances, more firms move to embedded contact forms
as it cuts down on spam. Future email survey projects may have to look at a two
pronged process where a request is made through the embedded form asking
for contact to a gatekeeper to the company. While this may slow down the initial
process it may increase the validity of responses as those firms who are more
committed to the research will provide better access.
The sample size was also limited to finding legitimate and current listings. Future
researchers on this subject should consider benefits of subscription listings such
as Dunn & Bradstreet despite the cost.

85
7.2.2 Self-administered Questionnaire
Self-administered questionnaires limit the researcher from responding to
questions participants may have regarding the questions or to clarify what is
being asked. The researcher also cannot confirm who participated in the survey.
This survey was addressed to either the owner / manager of the firm, or an HR
person. Both of these positions would know what selection techniques are used
for the firm, and what HR functions are performed in-house or outsourced.
However, as an email survey, anyone who clicked on the hyperlink would be
able to respond to the questionnaire. This may be an executive assistant who
will be more connected to the practices of the firm, or a customer service person
assigned to email who may be less knowledgeable regarding the firm’s
practices.
The limitations of this method are most apparent regarding H1 where the
researcher is prevented from fully understanding if Massachusetts firms are
using integrity assessments, and if so, why, despite general labour laws.
Future research could follow deductive reasoning, which is formulating a new
hypothesis based on the fallacy of the original hypothesis. In this manner a more
in-depth survey could be designed based on this one specific issue. In person,
or over the phone interviews could also be conducted which would allow the
researcher the ability to clarify responses. In person interviews would also allow
the researcher to validate the position of the participant within the firm.
7.2.3 SurveyMonkey
The pilot test on SurveyMonkey was distributed to a small sample of colleagues.
As each test came in and was discussed, the survey was cleared. However, a
limitation to SurveyMonkey’s reporting capabilities became apparent once the
questionnaire went live. Depending on the question type (text, multiple choice,
and drop down menu) responses are either separated out with a time stamp in
the order the response comes in, or responses are tabulated together.

86
Below is an example of three responses to an open text question such as ‘what
stat is the company registered in?’
CA – 11:45 a.m.
WI – 10:17 a.m.
TX – 9:56 a.m.
The next sample demonstrates three responses from the same participants to a
multiple choice question, which represents the majority of questions in the
survey:
P-O Fit = 2 (66%) P-J Fit = 1(33%).
For the purpose of this project, and in most correlation analysis, the tabulation of
responses is adequate, however, extracting multiple responses at once limits
the ability to see the exact relationship between variables for any given firm.
Additionally, this could have been an issue if the MA sample group had been
sent the same survey link as all other high impact firms.
Pilot studies are best conducted in an exact formation that the project will be
conducted.
7.3 Future Research
Building on the research findings and subjective interpretations developed
reviewing the sample size, future research could help build out the knowledge of
U.S. SMEs. Some high impact firms have expanded to include international
offices. Future research could try to see if these firms use the same selection
techniques for their international offices, and if so, what impact that may have on
international candidates.
Chapter six discussed the possibility of SMEs using off the shelf personality and
integrity assessments. Future research could delve deeper to find out what are
the more common assessments, or vendors, being used by these firms and try
to get more of a sense of how closely the assessments measure the skills

87
needed for a specific job. Additionally, some firms used personality and integrity
assessments for some of the positions, not all. Further research could look at
which positions the assessments are used for, whether they were entry level,
more knowledge and skill intensive, or if they were leadership positions.
Table 5.11 in chapter five pointed out the non-high impact manufacturing firm
that had a small employee head count but had a full time HR person. While this
was an outlier in the responses for this project, it suggests that future research
could look into transactional versus strategic HR groups in SMEs.
7.4 Reflections on the purpose of the study
Interest in HRM practices and the selection process for SMEs was sparked and
propelled by two main factors. First, as briefly mentioned in the introduction of
the thesis, I worked as a manager in a large multinational firm for almost fifteen
years where I was responsible for selecting new staff. The hiring process
primarily involved either an informal meeting with the candidate, or a semi-
structured interview based on my own experience of the position, but not on any
formal PBJA or direction from HR. My own experience as an interviewee within
the company was similar; very informal and based on impression management
more than personality and behavioural traits needed for a specific role.
Due to relocating I resigned from the multinational firm. As I was finishing my
MBA and knew I would be entering a graduate programme in one year I began
looking for service positions that would not entail too much training or
commitment on mine or the employer’s part. I found that applying for these types
of positions had greatly changed in the past 15-20 years. All applications had to
be submitted via the internet and they all included a personality or integrity
assessment. I wondered if this new method for selecting employees helped
reduce staff turnover. I ended up being offered a contract position with a small
organisation.
The interview process was the most difficult I had encountered, with a highly
structured format in a panel discussion. The focus of the interview was to find
best-fit to the organisation, not necessarily the position itself. As I discovered

88
through my own progress, and interviewing new employees, ad-hoc jobs were
created based on the experience and skill of the employee rather than selecting
employees who had skills needed for a specific position. The organisation has a
high turnover rate and so I still questioned the effectiveness of hiring based on
fit.
The second factor, as mentioned in section 2.5.1, is a growing interest in the
U.S. on how to leverage SMEs to increase the employment rate. This is more
difficult to reflect on as the interest may be a reflection of my culture and not just
employment need. Independence and financial wealth seem to be part of the
American dream. This drives many people towards entrepreneurship and small
business. Working in cities such as Boston and D.C., many of my clients were
small business owners and personal acquaintances were involved in start-ups
and venture capitalism. The most common periodicals for me to read were those
tailored towards small businesses, such as INC., Entrepreneurship, and Fast
Company.
These two factors initiated my literature search. The literature search indicated
there is a current gap in the knowledge regarding U.S. SME employee selection
practices and employee fit. The scope of the MRes prevented thorough
investigation into both selection practices and fit. I chose to focus on creating
research hypotheses based on selection practices because I feel it has a more
immediate impact on helping to develop process and training initiatives for SME
employers. Additionally, my interest in exploring fit would have involved a more
in-depth qualitative study which would have exceeded the time frame, scope,
and participant access of this present study.
The goal for embarking on the MRes degree was to lay a foundation of research
practices and knowledge in anticipation of pursuing a PhD. Part of this process
was detaching myself from a previous corporate career and learning how to set
and measure goals that are different to the corporate world. Success is not
measured by a merit review, quarterly bonus, or positive customer feedback.
Instead, success is measured by the ability to communicate analytical
interpretations of existing knowledge, and the ability to contribute to knowledge.

89
The empirical knowledge gained in this study can hopefully be used by the
academic community, as well as potentially help develop training programmes
for organisations involved in developing small business owners and creating job
opportunities.
Another important goal was to understand the different philosophical
approaches to the social sciences, including each paradigms limitations and
criticism. As mentioned at the conclusion of chapter three, using multiple
paradigms can help provide deeper meaning to research, however, I am also
aware that as an American citizen who will most likely have an academic career
in the U.S., publication and statistical significance is valued more than lengthy
qualitative approaches. Hopefully by understanding what the contributions of a
constructionist approach can bring, such as helping develop new theory, I will be
able to better justify occasional deviation from the positivist paradigm.
Many of these skills were developed by conducting a self-designed research
project. Another lesson learned through the project was looking at companies
from the outside, instead of the inside, and realizing that as an outside
academic, certain initial barriers from the firms may arise. Understanding the
causes of this, such as limited trust, helps me know how to better prepare for
future research by being more realistic about the approach and time it takes to
gather quality data.
Working on the Master of Research project also helped me develop organized
and systematic note taking such as keeping a research journal. Learning how to
do this during a one year project will serve me well as I prepare to undertake a
PhD where the span of time can erode both memory and momentum. The
Master of Research program has served me well in preparing me to continue my
development as an academic researcher.

90
References
Altinay, L., Altinay, E., & Gannon, J. (2008). Exploring the relationship between the human
resource management practices and growth in small service firms. Service Industries Journal,
28(7), 919-937
Arthur Jr., W., Bell, S.T., Villado, A.J., & Doverspike, D. (2006). The use of person-organization
fit in employment decision making: An assessment of its criterion-related validity. Journal of
Applied Psychology, 91(4), 786-801
Arvey, R.D., & Renz, G. L. (1992). Fairness in the selection of employees. Journal of Business
Ethics, 11(5/6), 331-340
Ayalon, M. & Even, R. (2008) Deductive reasoning: in the eye of the beholder. Educational
Studies in Mathematics, 69(3), 235-247
Bacon, N., & Hoque, K. (2005). HRM in the SME sector: Valuable employees and coercive
networks. International Journal of Human Resource Management, 16(11), 1976-1999
Balnaves, M. & Caputi, P. (2007). Introduction to quantitative research methods: An investigative
approach. London: Sage Publishing
Barber, A.E., Wesson, M.J., Roberson, O.M., & Taylor, M.S. (1999). A tale of two job markets:
organizational size and its effects on hiring practices and job search behavior. Personnel
Psychology, 52(4), 841-867
Barczyk, C.C., Husain, J.H. & Green, S. (2007). Expertise of owners, investment of time, and
human resource outsourcing in very small businesses. Journal of Business Inquiry. 6(1), 39-50
Barrett, R., Neeson, R., & Bilington, L. (2007). Finding the ‘right staff’ in small firms. Education &
Training, 49(8/9), 686-697
Barrick, M. R., & Mount, M. K. (1991). The big five personality dimensions and job performance:
A meta-analysis. Personnel Psychology, 44(1), 1-26
Barrick, M. R., Stewart, G. L., & Piotrowski, M., (2002). Personality and job performance: Test of
the mediating effects of motivation among sales representatives. Journal of Applied Psychology,
87(1), 43-51.
Barrick, Murray R., & Mount, Michael K. (1996) “Effects of Impression Management and Self-
Deception on the Predictive Validity of Personality Constructs.” Journal of Applied Psychology,
81(3), p261-272
Bartram, D. (2004). Assessment in organizations. Applied Psychology: An International Review,
53(2), 237-259
Bartram, D. (2005). The great eight competencies: A criterion-centric approach to validation.
Journal of Applied Psychology, 90(6), 1185-1203
Bates, S. (2002). Personality counts. HR Magazine, 47(2), 28

91
Beauchamp, T.L., Faden, R.R., Wallace Jr., R.J. & Walters, L. (1982) Ethical issues in social
science research. The Johns Hopkins University Press: Baltimore MD
Bee, E. (2009). Coming full circle. Economic Development Journal. 8(1), 5-13
Behrends, T. (2007). Recruitment practices in small and medium sized enterprises. An empirical
study among knowledge-intensive professional service firms. Management Revue, 18(1), 55-74
Black, T.R. (1999) Doing quantitative research in the social sciences: An integrated approach to
research design, measurement and statistics. London: Sage Publishing
Boon, C., Den Hartog, D.N., Boselie, P., & Paauwe, J. (2011). The relationship between
perceptions of HR practices and employee outcomes; examining the role of person-organization
and person-job fit. International Journal of Human Resource Management, 22(1), 138-162
Bolton, D.G., & Bolton, Robert (1996) People Styles at Work: Making Bad Relationships Good
and Good Relationships Better. American Management Association, New York NY
Bryman, A. (1995) Quantity and quality in social research. London: Routledge
Bryman, A. (1989) Research methods and organization studies. London: Unwin Hyman Inc.
Carless, Sally A. (2009) Psychological Testing for Selection Purposes: A guide to evidence-
based practice for human resource professionals The International Journal of Human Resource
Management 20(12), P2517-2532
Carlson, D.S., Upton, N., & Seaman, S. (2006). The impact of human resource practices and
compensation design on performance: an analysis of family-owned SMEs. Journal of Small
Business Management, 44(4), 531-543
Commonwealth of Massachusetts http://www.malegislature.gov/Laws accessed Nov 11, 2011
Cook, M. (2004). Personnel selection: Adding value through people. Fourth edition Chichester:
John Wiley & Sons
Cooper, D. & Robertson, I.T. (1995). The psychology of personnel selection. Routledege:
London
Costa, P.T., JR., & McCrae, R.R. (1987). Validation of the five-factor model of personality across instruments and observers. Journal of Personality and Social Psychology, 52 (1), 81-90 Costa, R. E., and Shrimp, C. P. (2011). Methods courses and texts in psychology: “Textbook
science” and “tourist brochures”. Journal of Theoretical and Philosophical Psychology, 31(1), 25-
43
Coverdill, J.E., & Finlay, W. (1998). Fit and skill in employee selection: Insights from a study of
headhunters. Qualitative Sociology, 21(2), 105-127
Crotty, M. (2003). The foundations of social research. Sage publications: London
Cucina, J., Vasilopoulos, N., & Sheael, K. (2005). Personality-based job analysis and the self-
serving bias. Journal of Business & Psychology, 20(2), 275-290
De Grip, A. & Sieben, I. (2009). The effectiveness of more advanced human resource systems in
small firms. The International Journal of Human Resource Management, 20(9), 1914-1928

92
De Kok, J.M.P., Uhlaner, L.M., & Thurik, A. R. (2006) Professional HRM practices in family
owned-managed enterprises. Journal of Small Business Management, 44(3), 441-460
De Meijer, L.A., Born, M.P., Terlouw, G. & van der Molen, H.T. (2006). Applicant and method
factors related to ethnic score differences in personnel selection: A study at the Dutch police.
Human Performance, 19(3), 219-251
De Vaus, D. A. (1996) Surveys in social research. University College London: London
Davenport, T.H., Harris, J. & Shapiro, J. (2010) Competing on talent analytics. Harvard Business
Review, 88(10), 52-58
Davies, P. (2010). Sizing up job creation. Region, 24(3), 18-25
Delmar, F. & Wiklund, J. (2008). The effect of small business managers’ growth motivation on
firm growth: a longitudinal study. Entrepreneurship: Theory & Practice, 32(3), 437-457
Dunnette, M.D., Eaton, N. K.., Hough, L. M., Kamp, J.D., & McCloy R.A. (1990). Criterion-
related validities of personality constructs and the effect of response distorting validities. Journal
of Applied Psychology, 75(5), 581-595
Easterby-Smith, M., Thorpe, R., & Lowe, A. (2002). Management research: an introduction.
London: Sage
Essex, C., & Smythe, W.E. (1999). Between numbers and notions: A critique of psychological
Measurement” Theory & Psychology , 9(6), 739-767
Fay, B. (1996). Contemporary Philosophy of Social Science. Blackwell Publishers: Oxford
Fleetwood, S. & Hesketh, A. (2006). Prediction in social science: The case of research on the
human resource management organizational performance link. Journal of Critical Realism, 5(2),
228-250
Fraunheim, E. (2011). More companies go with online tests to fill in the blanks. Workforce
Management, 90(5), 12-13
Giddens, A. (1972). Emile Durkheim: Selected Writings. University of Cambridge: Cambridge
Giddens, A. (1975). Positivism and Sociology. London: Heinemann Educational Books Ltd
Guillin, V. (2004). Theodule Ribot’s ambiguous positivism: Philosophical and epistemological
strategies in the founding of French scientific psychology. Journal of the History of the
Behavioral Sciences, 40(2), 165-181
Guion, Robert. M., & Gottier, Richard. F. (1965). “Validity of Personality Measures in Personnel
Selection”. Personnel Psychology, 18(2), 135-164.
Guion, R.M., & Gibson, W.M. (1988). Personnel selection and placement. Annual Review of
Psychology, 39(1), 349-375
Guion, Robert. M. (1987). “Changing Views for Personnel Selection Research”. Personnel
Psychology, 40(2), 199-213

93
Haltiwanger, J., Jarmin, R.S. & Miranda, J. (2010). Who creates jobs? Small vs. Large vs.
Young. Working paper.
Hall, G. (1992). Reasons for insolvency amongst small firms – A review and fresh evidence.
Small Business Economics, 4(3), 237-250
Harris, M.M. & Dworkin, J.B. (1990). Preemployment screening procedures: How human
resource managers perceive them. Journal of Business and Psychology, 4(3), 279-292
Hausdorf, P. A., & Duncan, D. (2004). Firm size and Internet recruiting in Canada: A preliminary
investigation. Journal of Small Business Management, 42(3), 325-334
Headd, B. & Kirchhoff, B. (2009). The growth, decline and survival of small businesses: An
exploratory study of life cycles. Journal of Small Business Management, 47(4), 531-550
Hendry, C., & Pettigrew, A. (1992). Patterns of Strategic Change in the Development of Human
Resource Management. British Journal of Management, 3(3), 137
Hollenbeck, John R., & Whitener, Ellen. M. (1988). “Reclaiming Personality Traits for Personnel
Selection: Self--Esteem as an Illustrative Case.” Journal of Management, 14(1), 81-91.
Hough, L. (1992). The ‘Big Five’ personality variables – construct confusion: description versus
prediction. Human Performance, 5(1-2), 139-155
Howell, D.C. (2008). Fundamental statistics for the behavioral Sciences, sixth edition. Thomson
Wadsworth: Toronto, Ontario
Hoshmand, L.T. (2003). Can lessons of history and logical analysis ensure progress in
psychological science? Theory Psychology, 13(39), 39-44
Hurtz, G. M. & Donovan, J.J. (2000). Personality and job performance: The big five revisited.
Journal of Applied Psychology, 85(6), 869-879
Internal Revenue Service, Publication 538 (Rev March 2008), Accounting Periods and Methods.
Accessed December 11, 2011 http://www.irs.gov/pub/irs-pdf/p538.pdf
Janz, T. (1982). Initial comparisons of patterned behavior description interviews versus
unstructured interviews. Journal of Applied Psychology, 67(5), 577-580
Katunich, L. (2005). Pre-employment psychological and personality testing. Fair Employment
Practices Guidelines, 603, 1-4
Kim-Yin, C., Drasgow, F., and Sawin, L. L. (1999). What is the shelf life of a test? The effect of
time on the psychometrics of cognitive ability test battery. Journal of Applied Psychology, 84(4)
Kosso, P. (2009). The large-scale structure of scientific method. Science & Education, 18, 33-42
Kotey, B., & Slade, P. (2005). Formal Human Resource Management practices in small growing
firms. Journal of Small Business Management, 43(1), 16-40
Kristof-Brown, A.L., Zimmerman, R.D. & Johnson, E.C. (2005). Consequences of individual’s fit
at work: A meta-analysis of person-job, person-organization, person-group, and person-
supervisor fit. Personnel Psychology, 58(2), 281-342
Leung, A. (2003). Different ties for different needs: Recruitment practices of entrepreneurial firms
at different development stages. Human Resource Management, 42(4), 303-320

94
Lievens, F. & Peeters, H. (2008). Interviewer’s sensitivity to impression management tactics in
structured interviews. European Journal of Psychological Assessments, 24(3), 174-180
Litan, R.E. (2010). Entrepreneurial stimulus package can help U.S. Jobs Shortfall. Huffington
Post / Brookings Institute, June, 30, 2010
Matiaske, W. (2004). Pourquoi pas? Rational choice as a basic theory of HRM. Management
Revue, 15(2), 249-263
Mazzarol, T. (2003). A model of small business HR growth management. International Journal of
Entrepreneurial Behavior & Research, 9(1), 27-49
McDaniel, M.A., Whetzel, D.L., Schmidt, F.L., & Maurer, S.D. (1994). The validity of employment
interviews: A comprehensive review and meta-analysis. Journal of Applied Psychology, 79(4),
599-616
McCarthy, J.M., Van Iddekinge, C.H., & Campion, M.A. (2010). Are highly structured job
interviews resistant to demographic similarity effects? Personnel Psychology, 63(2), 325-359
Motowidlo, S.J., Carter, G.W., Dunnette, M.D., Tippins, N., Werner, S., Burnette, J.R., &
Vaughan, M.J. (1992). Studies of the structured behavioral interview. Journal of Applied
Psychology, 77(5), 571-587
Murphy, K.R. & Dziweczynski, J. (2005). Why don’t measures of broad dimensions of personality
perform better as predictors of job performance. Human Performance, 18(4), 343-357
Nelson, D. (1980). Frederick W. Taylor and the Rise of Scientific Management. Madison:
University of Wisconsin Press
Nga, E.S.W. & Sears, G.J. (2010). The effect of adverse impact in selection practices on
organizational diversity: a field study. International Journal of Human Resource Management,
21(9), 1454-1471
O’Connell, M. & Kung, M.C. (2007). The cost of employee turnover. Industrial Management,
49(1), 14-19
Ones, D. S., Schmidt, F. L., Viswesvaran, C., (1993). Comprehensive meta-analysis of integrity
test validities: Findings and implications for personnel selection and theories of job performance.
Journal of Applied Psychology 78(4), 679-703
Ordanini, A., & Silvestri, G. (2008). Recruitment and selection services: Efficiency and
competitive reasons in the outsourcing of HR practices. International Journal of Human
Resource Management, 19(2), 372-391
O’Reilly III, C.A., Caldwell, D.F., & Mirable, R. (1992). A profile comparison approach to person-
job fit: more than a mirage. Academy of Management Best Papers Proceedings, 237-241
Piotrowski, C, & Armstrong, T. (2006). Current recruitment and selection practices: A national
survey of fortune 1000 firms. North American Journal of Psychology, 8(3), 489-496
Rutherford, M.W., Buller, P.F., & McMullen, P.R. (2003). Human resource management
problems over the life cycle of small to medium-sized firms. Human Resource Management,
42(4), 321-335

95
Rynes, S.L., Colbert, A.E., & Brown, K.C. (2002). HR professionals’ beliefs about effective
human resource practices: Correspondence between research and practice. Human Resource
Management, 41(2), 149-174
Saari, L. (2007). Bridging the worlds. Academy of Management Journal 50(5), 1043-1045
Salkind, N.J. (2008). Statistics for people who (think they) hate statistics. London: Sage
Publishing
Schmidt, F.L. & Hunter, J.E. (1998). The validity and utility of selection methods in personnel
psychology: Practical and theoretical implications of 85 years of research findings. Psychology
Bulletin, 124(2), 262-274
Schminke, D. (2006). Hate firing people? Then hire them instead. Supervision, 67(12), 21-22
Searle, R.H. (2003). Selection & Recruitment: A critical text. Milton Keynes: The Open University
Sisson, K., & Storey, J. (2000) The Realities of Human Resource Management. Buckingham:
Open University Press
Silverman, D. (2001). Interpreting Qualitative Data: Methods for Analyzing Talk, Text and
Interaction London: Sage Publishing
The Small Business Economy: A report to the President – 2010 edition
http://www.sba.gov/sites/default/files/sb_econ2010.pdf
Teagarden, M.B., Von Glinow, M.A., Bowen, D.A., Frayne, C.A., Nason, S., Huo, Y.P., Milliman,
J., Arias, M.E., Butler, M.C., Geringer, J.M., Nam-Hyeon, K., Scullion, H., Lowe, K.B., & Drost,
E.A. (1995). Toward a theory of comparative management research: an idiographic case study
of the best international human resources management project. Academy of Management
Journal, 38(5), 1261-1287
Terpstra, D. E. (1996). The search for effective methods. HR Focus, 73(5), 16-17
Tippins, Nancy T., Beaty, James, Drasgow, Fritz, Gibson, Wade E., Pearlman, Kenneth, Seagll,
Daniel O., Shepherd, William (2006) “Unproctored Internet Testing in Employment Settings”
Personnel Psychology 59(1)
Walley, L., & Smith, M. (1998). Deception in selection. John Wiley & Sons, Ltc: West Sussex
Wanek, J., Sackett, P.R. & Ones, D.S. (2003). Towards an understanding of integrity test
similarities and differences: an item-level analysis of seven tests. Personnel Psychology, 56(4),
873-894
Woodall, J., Scott-Jackson, W., Newham, T., & Gurney, M. (2009). Making the decision to
outsource human resources. Personnel Review. 38(3), 236-252
Woods Jr., D.R. & Savino, D.M. (2007). Do you blush often? Questions on integrity and
personality tests that legally embarrass employers. Employee Relations Law Journal, 33(1), 3-31
Yigui, M. & Shumin, L. (2010). ‘Credit crunch’ and small- and medium-sized enterprises: Aspects
affecting survival. Journal of Financial Services Marketing, 14(4), 290-300
Shaffer & Schmidt 1999 Personality Testing in Employment
http://www.hiringstrategies.com/personality_testing.htm accessed Nov 14, 2011

96
Salary.com, http://www.salary.com/mysalary.asp accessed 11.16
EEOC http://www.eeoc.gov/employees/index.cfm accessed 11.16

97
Appendix
Appendix A: First ten questions of international fast food chain personality
questionnaire
1. How were you evaluated by your supervisor in your current or most recent job?
o Outstanding
o Above average
o Average
o Somewhat below average
o I have not been employed or evaluated
2. During the middle of a shift, you notice that your coworker Jim looks really upset.
What action would you take?
o Volunteer to work during your break so Jim can have extra time to cool off
o Ask Jim if he’s having family problems
o Leave Jim alone and give him time to cool off
o Let your supervisor know that Jim might not be okay
o Ask Jim if there is anything you can do to help
3. People say I always do things correctly and accurately
o Strongly agree
o Agree
o Neither agree nor disagree
o Disagree
o Strongly disagree
4. In school, how many of your teachers didn’t like you or gave you a difficult time?
o Most
o About half
o Some
o Very few
o None
5. While on a break, a customer spills a large drink in a busy area of the restaurant.
Cleaning the floors is the job another team member but he is taking a customer’s order.
What would you do?
o Tell the other team member about the spilled drink
o Ask the manager who should clean up the spill
o Clean up the spill as quickly as possible
o Talk to the team member and agree on a plan to clean up the spill
o Warn the customers about the spill until the team member has a chance to clean
it up
6. If asked, my most recent manager (or teacher) would say that I can work longer and
harder than most of my coworkers.
o Strongly agree
o Agree
o Neither agree nor disagree
o Disagree
o Strongly disagree

98
7. If you do not get this job, how easy will it be for you to get another one?
o Very easy
o Easy
o Difficult
o Very difficult
o I don’t know
8. How do you respond to a new team member?
o Immediately get them involved in team activities
o I have never been in this situation
o Ask them to socialize with the team outside of work
o Ask them to take a leadership role
o Talk with them about the team’s needs
9. How would you describe your grades in high school?
o I got mostly A’s
o I got mostly B’s
I got mostly C’s
o I got mostly D’s & F’s
o My school didn’t give grades
10. I dislike having several things to do on the same day.
o Strongly agree
o Agree
o Neither agree nor disagree
o Disagree
o Strongly disagree

99
Appendix B: Letter for informed consent
September 9, 2011
To Whom It May Concern:
I am a graduate student with the University of Gloucestershire specializing in work place
organizations. I am currently working on a research project regarding the selection
techniques that high impact small and medium-sized enterprises in the United States use
to hire future employees.
This study is aimed at reviewing the different selection techniques that small and quickly
growing firms use in the different regions throughout the United States. The results of
this study will be compared to recent research by Piotrowski & Armstrong (2007)
regarding selection techniques in large U.S. enterprises. Persons participating in this
study can expect to spend 10 – 15 minutes completing an eight question survey. The
study will compare the size, location and expansion rate of firms and the first four
questions pertain to the current nature of your organization. The remaining four
questions pertain to human resource functions, including selection techniques, within the
company. It is ideal that either the owner, head of human resources, or person
responsible for hiring decisions complete the survey.
The participant contact list will remain confidential and will be destroyed once the study
is completed. The survey link is hosted on SurveyMonkey. Responses will not be linked
to the contact list and will remain anonymous. The anonymous results will be published
in a year-end dissertation, requirements for obtaining a Masters of Research degree.
Your participation in this study is strictly voluntary. For answers to your question
regarding this research you may contact me directly at [email protected],
or phone at 07527209403. You may also contact my supervisor, Dr. Lynn Nichol at
If you would like an electronic copy of the dissertation, available February 1, 2012, you
may email me your interest and a copy will be emailed to you.
I appreciate your willingness to participate in this study.
Sincerely,
Heidi Hughes

100
Appendix C: Self administered questionnaire
Question / Variable Choice 1 Choice 2 Choice 3
1. What state is the company organized in? Open response n/a n/a
2. Please select the company’s industry: Forced drop down menu n/a n/a
3. How many full time employees do you currently have on pay roll?
Open response n/a n/a
4. In percentages, what has been the organization’s three year growth? (If the company is less than three years old, provide last full fiscal year.)
Open response n/a n/a
5. Does your company have a designated HR person / department?
Yes, full time Yes, part time No
6a. Does your company outsource any of the recruitment functions?
Yes, for all jobs Yes, for some No
6b. Does your company outsource any of the selection functions?
Yes, for all jobs Yes, for some No
7. Does your company use the following selection techniques for hiring new employees? Application / resume Biographical data General mental / cognitive assessment Integrity / honesty assessment Job description Personality assessment Reference checks Skills testing Structured interview Unstructured interview
Yes, for all jobs Yes, for all jobs Yes, for all jobs Yes, for all jobs Yes, for all jobs Yes, for all jobs Yes, for all jobs Yes, for all jobs Yes, for all jobs Yes, for all jobs
Yes, for some Yes, for some Yes, for some Yes, for some Yes, for some Yes, for some Yes, for some Yes, for some Yes, for some Yes, for some
No No No No No No No No No No
Person – organization fit is described as employees matching the culture and temperament of the organization. Person – job fit is described as an employee matching skill set and knowledge as it pertains to a specific job. In your organization, which is more important?
P – O fit
P – J fit
n/a
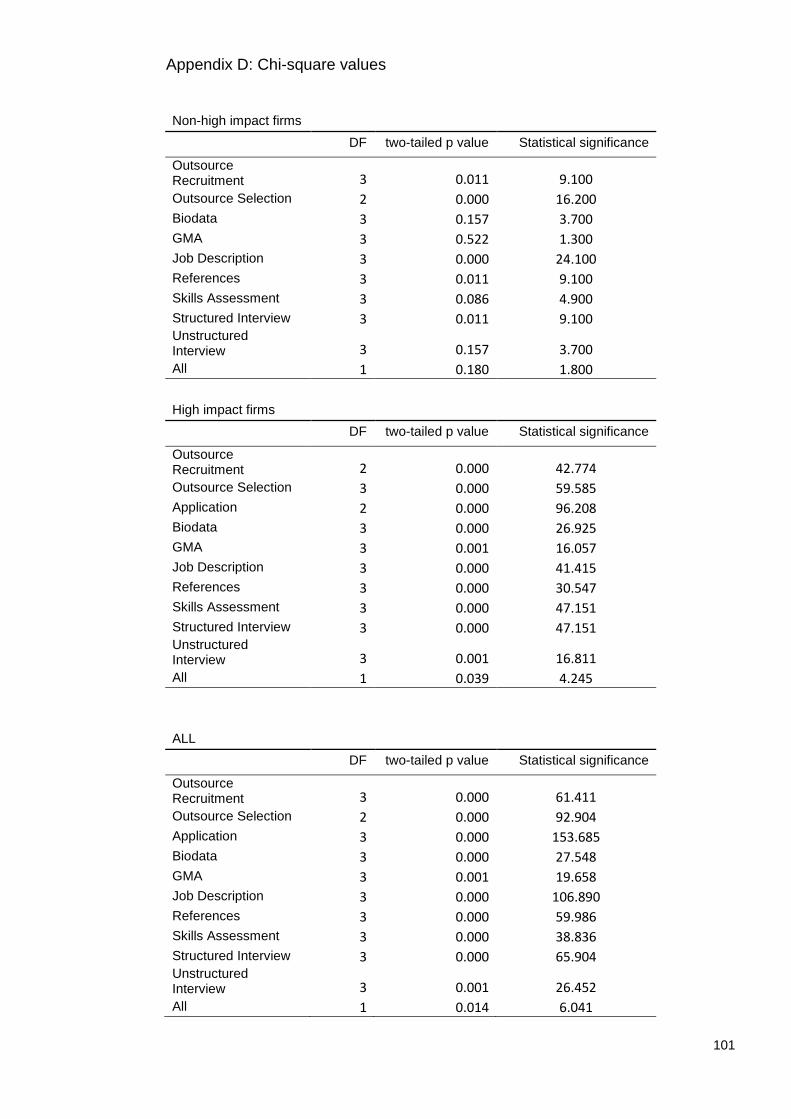
101
Appendix D: Chi-square values
Non-high impact firms
DF two-tailed p value Statistical significance
Outsource Recruitment 3 0.011 9.100
Outsource Selection 2 0.000 16.200
Biodata 3 0.157 3.700
GMA 3 0.522 1.300
Job Description 3 0.000 24.100
References 3 0.011 9.100
Skills Assessment 3 0.086 4.900
Structured Interview 3 0.011 9.100 Unstructured Interview 3 0.157 3.700
All 1 0.180 1.800
High impact firms
DF two-tailed p value Statistical significance
Outsource Recruitment 2 0.000 42.774
Outsource Selection 3 0.000 59.585
Application 2 0.000 96.208
Biodata 3 0.000 26.925
GMA 3 0.001 16.057
Job Description 3 0.000 41.415
References 3 0.000 30.547
Skills Assessment 3 0.000 47.151
Structured Interview 3 0.000 47.151 Unstructured Interview 3 0.001 16.811
All 1 0.039 4.245
ALL
DF two-tailed p value Statistical significance
Outsource Recruitment 3 0.000 61.411
Outsource Selection 2 0.000 92.904
Application 3 0.000 153.685
Biodata 3 0.000 27.548
GMA 3 0.001 19.658
Job Description 3 0.000 106.890
References 3 0.000 59.986
Skills Assessment 3 0.000 38.836
Structured Interview 3 0.000 65.904 Unstructured Interview 3 0.001 26.452
All 1 0.014 6.041