Embed Size (px)
Citation preview
REVIEW
The use of 3D face shape modelling in dysmorphologyPeter Hammond. . . . . . . . . . . . . . . . . . . . . . . . . . . . . . . . . . . . . . . . . . . . . . . . . . . . . . . . . . . . . . . . . . . . . . . . . . . . . . . . . . . . . . . . . . . . . . . . . . . . . . . . . . . . . . . . . . . . . . . . . . . . . . . . . . .
Arch Dis Child 2007;92:1120–1126. doi: 10.1136/adc.2006.103507
Facial appearance can be a significant clue in the initialidentification of genetic conditions, but their low incidence limitsexposure during training and inhibits the development of skillsin recognising the facial ‘‘gestalt’’ characteristic of manydysmorphic syndromes. Here we describe the potential ofcomputer-based models of three-dimensional (3D) facialmorphology to assist in dysmorphology training, in clinicaldiagnosis and in multidisciplinary studies of phenotype–genotype correlations.. . . . . . . . . . . . . . . . . . . . . . . . . . . . . . . . . . . . . . . . . . . . . . . . . . . . . . . . . . . . . . . . . . . . . . . . . . . . .
. . . . . . . . . . . . . . . . . . . . . . . .
Correspondence to:Professor Peter Hammond,Molecular Medicine Unit,UCL Institute of ChildHealth, 30 Guilford St,London WC1N 1EH, UK;[email protected]
Accepted 26 April 2007. . . . . . . . . . . . . . . . . . . . . . . .
Many genetic conditions involve character-istic facial features that are the first clue toa diagnosis. Skill in recognising the facial
‘‘gestalt’’ of some dysmorphic syndromes takestime to develop as rarity limits exposure duringtraining and expertise is typically perfected on thejob. Hence, published cases, textbooks and electro-nic databases such as OMIM and the LondonDysmorphology Database (LDDB) are importantresources when examining children whose appear-ance is dysmorphic. Even with adequate knowl-edge, there remains the problem of reconcilingsometimes imprecise descriptions of dysmorphicfeatures in the literature with a personal andpotentially subjective examination of an individualpatient. International experts in dysmorphologyare currently developing standardised terminologyto address issues of imprecision and inconsis-tency,1 and there are well documented approachesto recording craniofacial dysmorphology in a moreobjective fashion.2 In terms of future technologicalsupport, three-dimensional (3D) models of facialmorphology are showing potential in syndromedelineation and discrimination, in analysing indi-vidual dysmorphology, and in contributing tomulti-disciplinary and multi-species studies ofgenotype–phenotype correlations.
More than 30 years ago, Farkas pioneered tech-niques for studying facial morphology using directanthropometry.3 His approach, using a ruler, cali-pers, tape measure and protractor, has been appliedwidely in the analysis of facial dysmorphology.Many clinicians undertake such a manual craniofa-cial assessment and compare a patient’s phenotypeto the norms of a control population of comparableage and sex. Ethnic variation can sometimes betaken into account, but normative values exist forrelatively few dysmorphic syndromes.3 4 Anthro-pometry has the advantages of being low cost,simple to undertake (following appropriate train-ing) and relatively non-invasive. Disadvantagesinclude the need for co-operation from the subjectand the inability to make additional measurements
without recalling the patient.2 Although manualassessment of an individual can be quick, such anapproach would be prohibitively time consuming forcollecting normative sample data.
Conventional and digital two-dimensional (2D)photography offer rapid capture of facial images,almost permanent retention and opportunity forrepeated measurement. The 2D photographs, oroccasionally the subjects prior to imaging, areannotated with anatomical landmarks whosespatial co-ordinates can be acquired using 2Dand 3D digitising devices on the images or thesubjects themselves.5 Once landmark positions areknown, measurements can be derived automati-cally and compared to norms. Photography is lessinvasive than manual anthropometry but stillrequires co-operation from the patient and issubject to the skill of the camera operator andavailable lighting conditions. Furthermore, mea-surements derived directly from a single 2D imageare adversely affected by projection distortion andpose, for example, a backwardly tilted head maygive the illusion of low-set ears.
Three-dimensional surface imaging systems havethe potential to compensate for inadequacies of 2Dimaging by capturing an image that can be inspectedfrom any desired viewpoint (fig 1A). They havealready been successfully introduced to a range ofclinical situations such as dermatology,6 burns,7
forensic science,8 radiotherapy planning,9 orthodon-tics10 and maxillofacial surgery.11 Laser and photo-grammetric devices, the two most commonly used,capture meshes of tens to hundreds of thousands of3D points on a human face (fig 1B). The triangu-lated mesh of points constitutes a 3D surface(fig 1C). The fineness of the mesh, speed of imagecapture, surface coverage, accuracy and ease of usedepend on the underlying technology employed andthe features of the individual device. In parallel withdevice improvement, there has been considerabledevelopment of statistical techniques and computersoftware for modelling and analysing large sets offace images in both 2D and 3D. This short reviewdescribes how 3D face shape modelling can be usedin syndrome delineation and discrimination, in thecategorisation of individual facial dysmorphologyand in phenotype–genotype studies. Although thereview focuses on surface-based image capture, thereader is reminded that surfaces derived from CT,ultrasound and MRI modalities can be manipulatedin much the same way. Constraints on space haveforced the omission of descriptions of individualsurface imaging devices.
Abbreviations: 2D, two-dimensional; 3D, three-dimensional; DSM, dense surface model; PCA, principalcomponent analysis
1120
www.archdischild.com
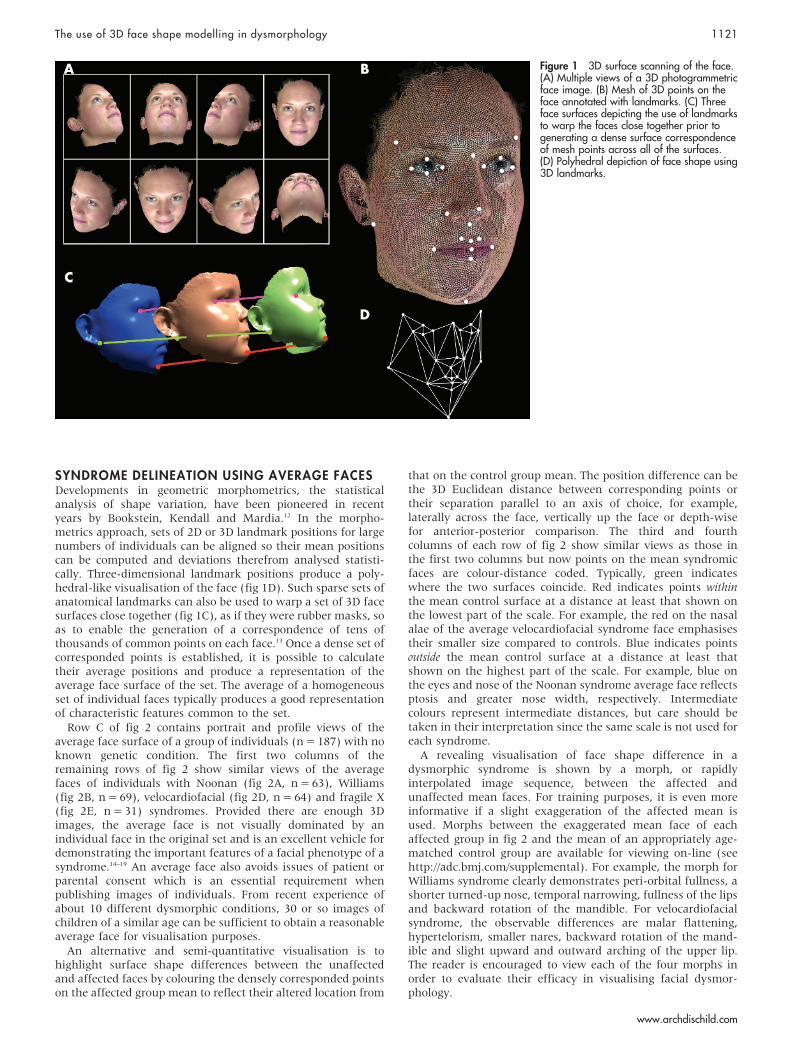
SYNDROME DELINEATION USING AVERAGE FACESDevelopments in geometric morphometrics, the statisticalanalysis of shape variation, have been pioneered in recentyears by Bookstein, Kendall and Mardia.12 In the morpho-metrics approach, sets of 2D or 3D landmark positions for largenumbers of individuals can be aligned so their mean positionscan be computed and deviations therefrom analysed statisti-cally. Three-dimensional landmark positions produce a poly-hedral-like visualisation of the face (fig 1D). Such sparse sets ofanatomical landmarks can also be used to warp a set of 3D facesurfaces close together (fig 1C), as if they were rubber masks, soas to enable the generation of a correspondence of tens ofthousands of common points on each face.13 Once a dense set ofcorresponded points is established, it is possible to calculatetheir average positions and produce a representation of theaverage face surface of the set. The average of a homogeneousset of individual faces typically produces a good representationof characteristic features common to the set.
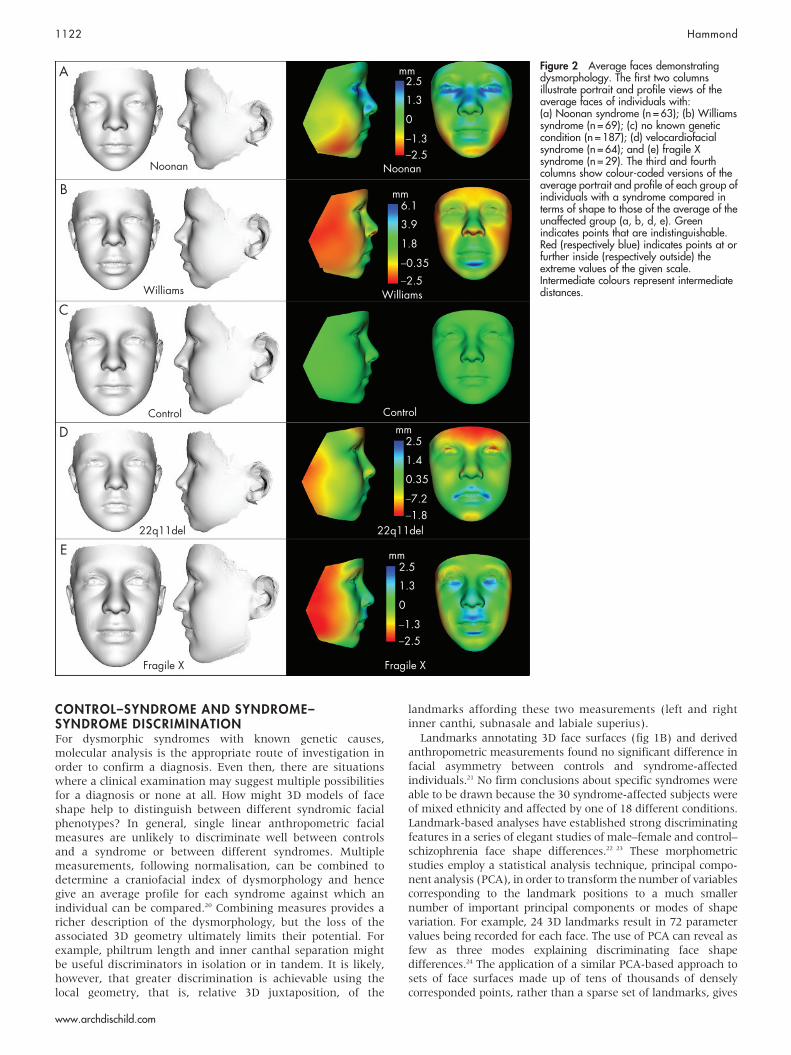
Row C of fig 2 contains portrait and profile views of theaverage face surface of a group of individuals (n = 187) with noknown genetic condition. The first two columns of theremaining rows of fig 2 show similar views of the averagefaces of individuals with Noonan (fig 2A, n = 63), Williams(fig 2B, n = 69), velocardiofacial (fig 2D, n = 64) and fragile X(fig 2E, n = 31) syndromes. Provided there are enough 3Dimages, the average face is not visually dominated by anindividual face in the original set and is an excellent vehicle fordemonstrating the important features of a facial phenotype of asyndrome.14–19 An average face also avoids issues of patient orparental consent which is an essential requirement whenpublishing images of individuals. From recent experience ofabout 10 different dysmorphic conditions, 30 or so images ofchildren of a similar age can be sufficient to obtain a reasonableaverage face for visualisation purposes.
An alternative and semi-quantitative visualisation is tohighlight surface shape differences between the unaffectedand affected faces by colouring the densely corresponded pointson the affected group mean to reflect their altered location from
that on the control group mean. The position difference can bethe 3D Euclidean distance between corresponding points ortheir separation parallel to an axis of choice, for example,laterally across the face, vertically up the face or depth-wisefor anterior-posterior comparison. The third and fourthcolumns of each row of fig 2 show similar views as those inthe first two columns but now points on the mean syndromicfaces are colour-distance coded. Typically, green indicateswhere the two surfaces coincide. Red indicates points withinthe mean control surface at a distance at least that shown onthe lowest part of the scale. For example, the red on the nasalalae of the average velocardiofacial syndrome face emphasisestheir smaller size compared to controls. Blue indicates pointsoutside the mean control surface at a distance at least thatshown on the highest part of the scale. For example, blue onthe eyes and nose of the Noonan syndrome average face reflectsptosis and greater nose width, respectively. Intermediatecolours represent intermediate distances, but care should betaken in their interpretation since the same scale is not used foreach syndrome.
A revealing visualisation of face shape difference in adysmorphic syndrome is shown by a morph, or rapidlyinterpolated image sequence, between the affected andunaffected mean faces. For training purposes, it is even moreinformative if a slight exaggeration of the affected mean isused. Morphs between the exaggerated mean face of eachaffected group in fig 2 and the mean of an appropriately age-matched control group are available for viewing on-line (seehttp://adc.bmj.com/supplemental). For example, the morph forWilliams syndrome clearly demonstrates peri-orbital fullness, ashorter turned-up nose, temporal narrowing, fullness of the lipsand backward rotation of the mandible. For velocardiofacialsyndrome, the observable differences are malar flattening,hypertelorism, smaller nares, backward rotation of the mand-ible and slight upward and outward arching of the upper lip.The reader is encouraged to view each of the four morphs inorder to evaluate their efficacy in visualising facial dysmor-phology.
Figure 1 3D surface scanning of the face.(A) Multiple views of a 3D photogrammetricface image. (B) Mesh of 3D points on theface annotated with landmarks. (C) Threeface surfaces depicting the use of landmarksto warp the faces close together prior togenerating a dense surface correspondenceof mesh points across all of the surfaces.(D) Polyhedral depiction of face shape using3D landmarks.
The use of 3D face shape modelling in dysmorphology 1121
www.archdischild.com
CONTROL–SYNDROME AND SYNDROME–SYNDROME DISCRIMINATIONFor dysmorphic syndromes with known genetic causes,molecular analysis is the appropriate route of investigation inorder to confirm a diagnosis. Even then, there are situationswhere a clinical examination may suggest multiple possibilitiesfor a diagnosis or none at all. How might 3D models of faceshape help to distinguish between different syndromic facialphenotypes? In general, single linear anthropometric facialmeasures are unlikely to discriminate well between controlsand a syndrome or between different syndromes. Multiplemeasurements, following normalisation, can be combined todetermine a craniofacial index of dysmorphology and hencegive an average profile for each syndrome against which anindividual can be compared.20 Combining measures provides aricher description of the dysmorphology, but the loss of theassociated 3D geometry ultimately limits their potential. Forexample, philtrum length and inner canthal separation mightbe useful discriminators in isolation or in tandem. It is likely,however, that greater discrimination is achievable using thelocal geometry, that is, relative 3D juxtaposition, of the
landmarks affording these two measurements (left and rightinner canthi, subnasale and labiale superius).
Landmarks annotating 3D face surfaces (fig 1B) and derivedanthropometric measurements found no significant difference infacial asymmetry between controls and syndrome-affectedindividuals.21 No firm conclusions about specific syndromes wereable to be drawn because the 30 syndrome-affected subjects wereof mixed ethnicity and affected by one of 18 different conditions.Landmark-based analyses have established strong discriminatingfeatures in a series of elegant studies of male–female and control–schizophrenia face shape differences.22 23 These morphometricstudies employ a statistical analysis technique, principal compo-nent analysis (PCA), in order to transform the number of variablescorresponding to the landmark positions to a much smallernumber of important principal components or modes of shapevariation. For example, 24 3D landmarks result in 72 parametervalues being recorded for each face. The use of PCA can reveal asfew as three modes explaining discriminating face shapedifferences.24 The application of a similar PCA-based approach tosets of face surfaces made up of tens of thousands of denselycorresponded points, rather than a sparse set of landmarks, gives
Figure 2 Average faces demonstratingdysmorphology. The first two columnsillustrate portrait and profile views of theaverage faces of individuals with:(a) Noonan syndrome (n = 63); (b) Williamssyndrome (n = 69); (c) no known geneticcondition (n = 187); (d) velocardiofacialsyndrome (n = 64); and (e) fragile Xsyndrome (n = 29). The third and fourthcolumns show colour-coded versions of theaverage portrait and profile of each group ofindividuals with a syndrome compared interms of shape to those of the average of theunaffected group (a, b, d, e). Greenindicates points that are indistinguishable.Red (respectively blue) indicates points at orfurther inside (respectively outside) theextreme values of the given scale.Intermediate colours represent intermediatedistances.
1122 Hammond
www.archdischild.com
rise to a similar set of modes of face shape variation. The surface ofeach face can be reconstructed using a linear weighted sum of thePCA modes. The term dense surface model (DSM) has beencoined for such a model of 3D face shape.13 A range of other shapemodelling techniques are described elsewhere.12 23 24
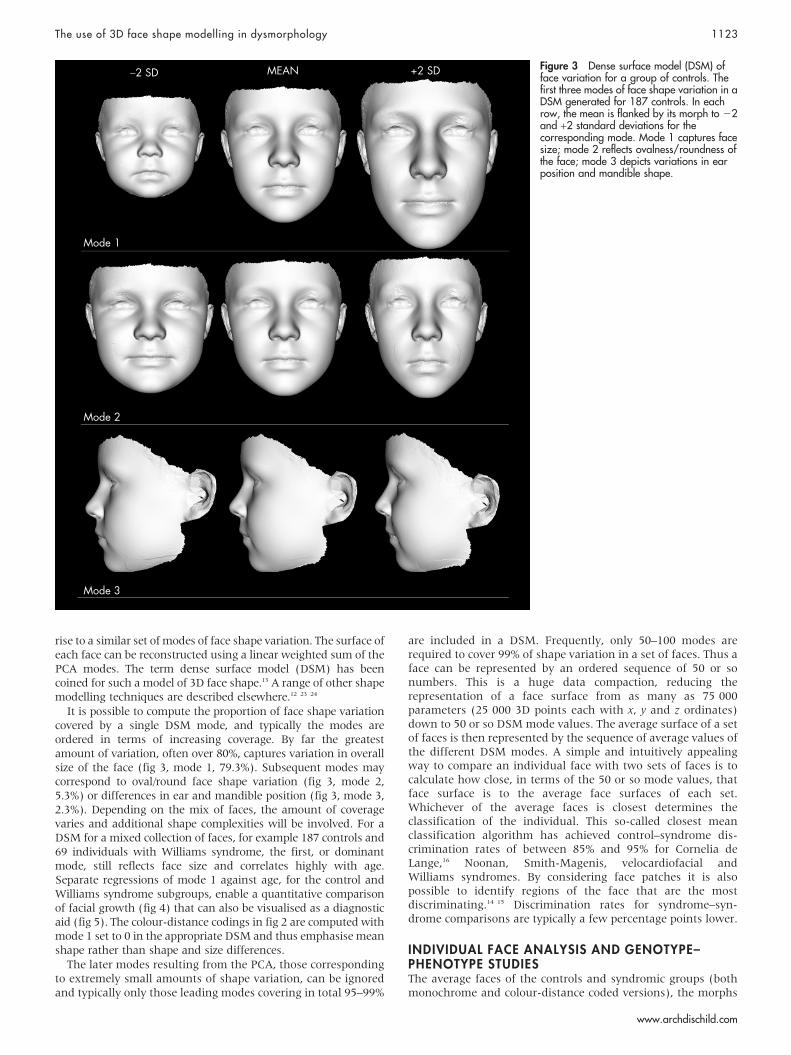
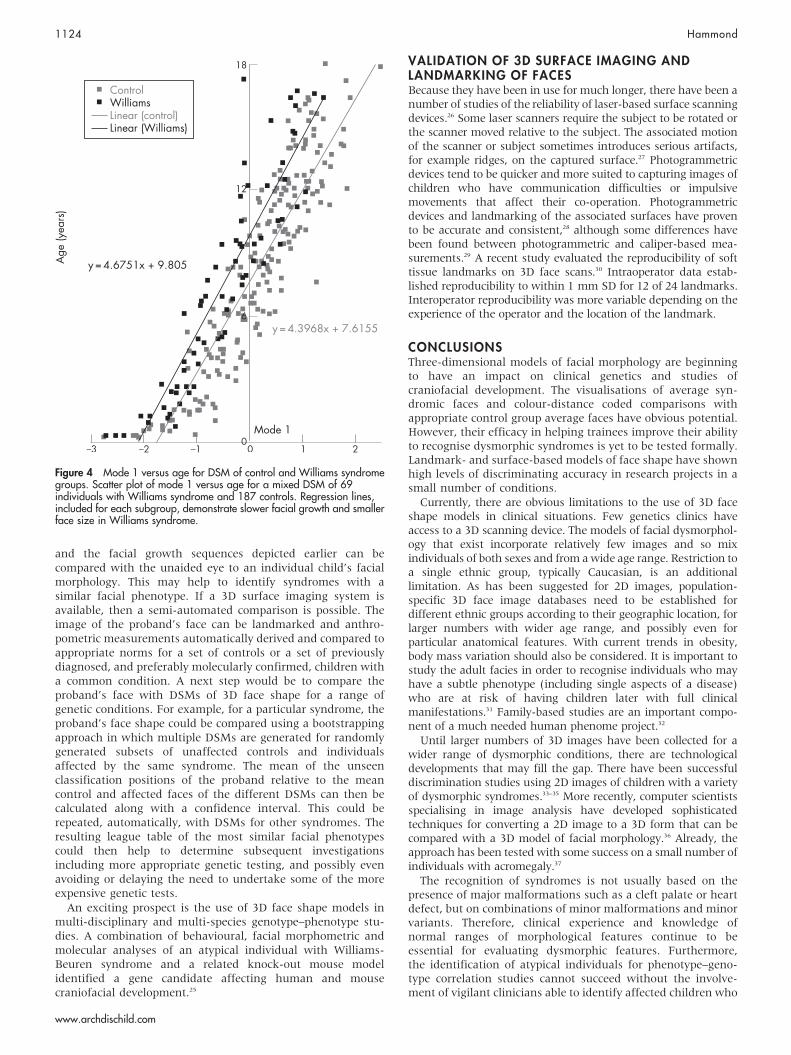
It is possible to compute the proportion of face shape variationcovered by a single DSM mode, and typically the modes areordered in terms of increasing coverage. By far the greatestamount of variation, often over 80%, captures variation in overallsize of the face (fig 3, mode 1, 79.3%). Subsequent modes maycorrespond to oval/round face shape variation (fig 3, mode 2,5.3%) or differences in ear and mandible position (fig 3, mode 3,2.3%). Depending on the mix of faces, the amount of coveragevaries and additional shape complexities will be involved. For aDSM for a mixed collection of faces, for example 187 controls and69 individuals with Williams syndrome, the first, or dominantmode, still reflects face size and correlates highly with age.Separate regressions of mode 1 against age, for the control andWilliams syndrome subgroups, enable a quantitative comparisonof facial growth (fig 4) that can also be visualised as a diagnosticaid (fig 5). The colour-distance codings in fig 2 are computed withmode 1 set to 0 in the appropriate DSM and thus emphasise meanshape rather than shape and size differences.
The later modes resulting from the PCA, those correspondingto extremely small amounts of shape variation, can be ignoredand typically only those leading modes covering in total 95–99%
are included in a DSM. Frequently, only 50–100 modes arerequired to cover 99% of shape variation in a set of faces. Thus aface can be represented by an ordered sequence of 50 or sonumbers. This is a huge data compaction, reducing therepresentation of a face surface from as many as 75 000parameters (25 000 3D points each with x, y and z ordinates)down to 50 or so DSM mode values. The average surface of a setof faces is then represented by the sequence of average values ofthe different DSM modes. A simple and intuitively appealingway to compare an individual face with two sets of faces is tocalculate how close, in terms of the 50 or so mode values, thatface surface is to the average face surfaces of each set.Whichever of the average faces is closest determines theclassification of the individual. This so-called closest meanclassification algorithm has achieved control–syndrome dis-crimination rates of between 85% and 95% for Cornelia deLange,16 Noonan, Smith-Magenis, velocardiofacial andWilliams syndromes. By considering face patches it is alsopossible to identify regions of the face that are the mostdiscriminating.14 15 Discrimination rates for syndrome–syn-drome comparisons are typically a few percentage points lower.
INDIVIDUAL FACE ANALYSIS AND GENOTYPE–PHENOTYPE STUDIESThe average faces of the controls and syndromic groups (bothmonochrome and colour-distance coded versions), the morphs
Figure 3 Dense surface model (DSM) offace variation for a group of controls. Thefirst three modes of face shape variation in aDSM generated for 187 controls. In eachrow, the mean is flanked by its morph to 22and +2 standard deviations for thecorresponding mode. Mode 1 captures facesize; mode 2 reflects ovalness/roundness ofthe face; mode 3 depicts variations in earposition and mandible shape.
The use of 3D face shape modelling in dysmorphology 1123
www.archdischild.com
and the facial growth sequences depicted earlier can becompared with the unaided eye to an individual child’s facialmorphology. This may help to identify syndromes with asimilar facial phenotype. If a 3D surface imaging system isavailable, then a semi-automated comparison is possible. Theimage of the proband’s face can be landmarked and anthro-pometric measurements automatically derived and compared toappropriate norms for a set of controls or a set of previouslydiagnosed, and preferably molecularly confirmed, children witha common condition. A next step would be to compare theproband’s face with DSMs of 3D face shape for a range ofgenetic conditions. For example, for a particular syndrome, theproband’s face shape could be compared using a bootstrappingapproach in which multiple DSMs are generated for randomlygenerated subsets of unaffected controls and individualsaffected by the same syndrome. The mean of the unseenclassification positions of the proband relative to the meancontrol and affected faces of the different DSMs can then becalculated along with a confidence interval. This could berepeated, automatically, with DSMs for other syndromes. Theresulting league table of the most similar facial phenotypescould then help to determine subsequent investigationsincluding more appropriate genetic testing, and possibly evenavoiding or delaying the need to undertake some of the moreexpensive genetic tests.
An exciting prospect is the use of 3D face shape models inmulti-disciplinary and multi-species genotype–phenotype stu-dies. A combination of behavioural, facial morphometric andmolecular analyses of an atypical individual with Williams-Beuren syndrome and a related knock-out mouse modelidentified a gene candidate affecting human and mousecraniofacial development.25
VALIDATION OF 3D SURFACE IMAGING ANDLANDMARKING OF FACESBecause they have been in use for much longer, there have been anumber of studies of the reliability of laser-based surface scanningdevices.26 Some laser scanners require the subject to be rotated orthe scanner moved relative to the subject. The associated motionof the scanner or subject sometimes introduces serious artifacts,for example ridges, on the captured surface.27 Photogrammetricdevices tend to be quicker and more suited to capturing images ofchildren who have communication difficulties or impulsivemovements that affect their co-operation. Photogrammetricdevices and landmarking of the associated surfaces have provento be accurate and consistent,28 although some differences havebeen found between photogrammetric and caliper-based mea-surements.29 A recent study evaluated the reproducibility of softtissue landmarks on 3D face scans.30 Intraoperator data estab-lished reproducibility to within 1 mm SD for 12 of 24 landmarks.Interoperator reproducibility was more variable depending on theexperience of the operator and the location of the landmark.
CONCLUSIONSThree-dimensional models of facial morphology are beginningto have an impact on clinical genetics and studies ofcraniofacial development. The visualisations of average syn-dromic faces and colour-distance coded comparisons withappropriate control group average faces have obvious potential.However, their efficacy in helping trainees improve their abilityto recognise dysmorphic syndromes is yet to be tested formally.Landmark- and surface-based models of face shape have shownhigh levels of discriminating accuracy in research projects in asmall number of conditions.
Currently, there are obvious limitations to the use of 3D faceshape models in clinical situations. Few genetics clinics haveaccess to a 3D scanning device. The models of facial dysmorphol-ogy that exist incorporate relatively few images and so mixindividuals of both sexes and from a wide age range. Restriction toa single ethnic group, typically Caucasian, is an additionallimitation. As has been suggested for 2D images, population-specific 3D face image databases need to be established fordifferent ethnic groups according to their geographic location, forlarger numbers with wider age range, and possibly even forparticular anatomical features. With current trends in obesity,body mass variation should also be considered. It is important tostudy the adult facies in order to recognise individuals who mayhave a subtle phenotype (including single aspects of a disease)who are at risk of having children later with full clinicalmanifestations.31 Family-based studies are an important compo-nent of a much needed human phenome project.32
Until larger numbers of 3D images have been collected for awider range of dysmorphic conditions, there are technologicaldevelopments that may fill the gap. There have been successfuldiscrimination studies using 2D images of children with a varietyof dysmorphic syndromes.33–35 More recently, computer scientistsspecialising in image analysis have developed sophisticatedtechniques for converting a 2D image to a 3D form that can becompared with a 3D model of facial morphology.36 Already, theapproach has been tested with some success on a small number ofindividuals with acromegaly.37
The recognition of syndromes is not usually based on thepresence of major malformations such as a cleft palate or heartdefect, but on combinations of minor malformations and minorvariants. Therefore, clinical experience and knowledge ofnormal ranges of morphological features continue to beessential for evaluating dysmorphic features. Furthermore,the identification of atypical individuals for phenotype–geno-type correlation studies cannot succeed without the involve-ment of vigilant clinicians able to identify affected children who
Figure 4 Mode 1 versus age for DSM of control and Williams syndromegroups. Scatter plot of mode 1 versus age for a mixed DSM of 69individuals with Williams syndrome and 187 controls. Regression lines,included for each subgroup, demonstrate slower facial growth and smallerface size in Williams syndrome.
1124 Hammond
www.archdischild.com
are inconsistent with expected behavioural or morphologicalphenotypes.38 This is yet further motivation for improving thegestalt recognition of facial dysmorphology.
ACKNOWLEDGEMENTSThe author is very grateful to Raoul Hennekam and Katrina Prescott forcommenting on an earlier draft of the paper. The families andvolunteers whose 3D images contributed to the average faces in fig 1are gratefully acknowledged, as are the family support groups andclinicians who provided the face scanning opportunities: France:Generation 22; Italy: Dr Francesca Faranelli, Dr Francesca Forzano,Professor Teresa Mattina; UK: NewLife, MaxAppeal, The Fragile XSociety, the Williams Syndrome Foundation; USA: TNSSG, VCFSEF,The National Fragile X Foundation, the Williams SyndromeAssociation.
Face animations are available at http://adc.bmj.com/supplemental.
Funding: Professor Hammond’s research is currently funded by the UKcharity NewLife and by the US organisations National Institutes of Health(P50 DE016215-01 and Fogarty/NIH R21TW06761-01), Autism Speaks/NAAR and the Angelman Syndrome Foundation.
Competing interests: None.
REFERENCES1 Biesecker LG. Mapping phenotypes to language: a proposal to organize and
standardize the clinical descriptions of malformations. Clin Genet 2005;68:320–6.2 Allanson JE. Objective techniques for craniofacial assessment: what are the
choices? Am J Med Genet 1997;70:1–5.3 Farkas LG. Anthropometry of the head and face. New York: Raven Press, 1998.4 Ferrario VF, Dellavia C, Serrao G, et al. Soft tissue facial angles in Down’s syndrome
subjects: a three-dimensional non-invasive study. Eur J Orthod 2005;27(4):355–62.5 Sforza C, Dellavia C, Tartaglia GM, et al. Morphometry of the ear in Down’s
syndrome subjects. A three-dimensional computerized assessment. Int J OralMaxillofac Surg 2005;34(5):480–6.
6 Ardehali B, Nouraei SAR, Van Dam H, et al. Objective assessment of keloid scarswith three-dimensional imaging: quantifying response to intralesional steroidtherapy. Plast Reconstr Surg 2007;119(2):556–61.
7 Kovacs L, Zimmermann A, Wawrzyn H, et al. Computer aided surgicalreconstruction after complex facial burn injuries – opportunities and limitations.Burns 2005;31:85–91.
8 March J, Schofield D, Evison M, et al. Three-dimensional computer visualizationof forensic pathology data. Am J Forensic Med Pathol 2004;25(1):60–70.
9 Bert C, Metheany KG, Doppke KP, et al. Clinical experience with a 3D surfacepatient setup for alignment of partial-breast irradiation patients. Int J RadiatOncol Biol Phys 2006;64(4):1265–74.
10 Hajeer MY, Millett DT, Ayoub AF, et al. Applications of 3D imaging inorthodontics: part 1. J Orthod 2004;31:62–70.
11 Ayoub AF, Siebert P, Moos KF, et al. A vision-based three-dimensional capturesystem for maxillofacial assessment and surgical planning. Br J Oral MaxıllofacSurg 1998;36:353–7.
12 Bookstein FL. Shape and information in medical images: a decade of themorphometric analysis. Computer Vision and Image Understanding1997;66(2):97–118.
13 Hutton TJ, Buxton BF, Hammond P, et al. Estimating average growth trajectoriesin shape-space using kernel smoothing. IEEE Trans Med Imag 2003;22:747–53.
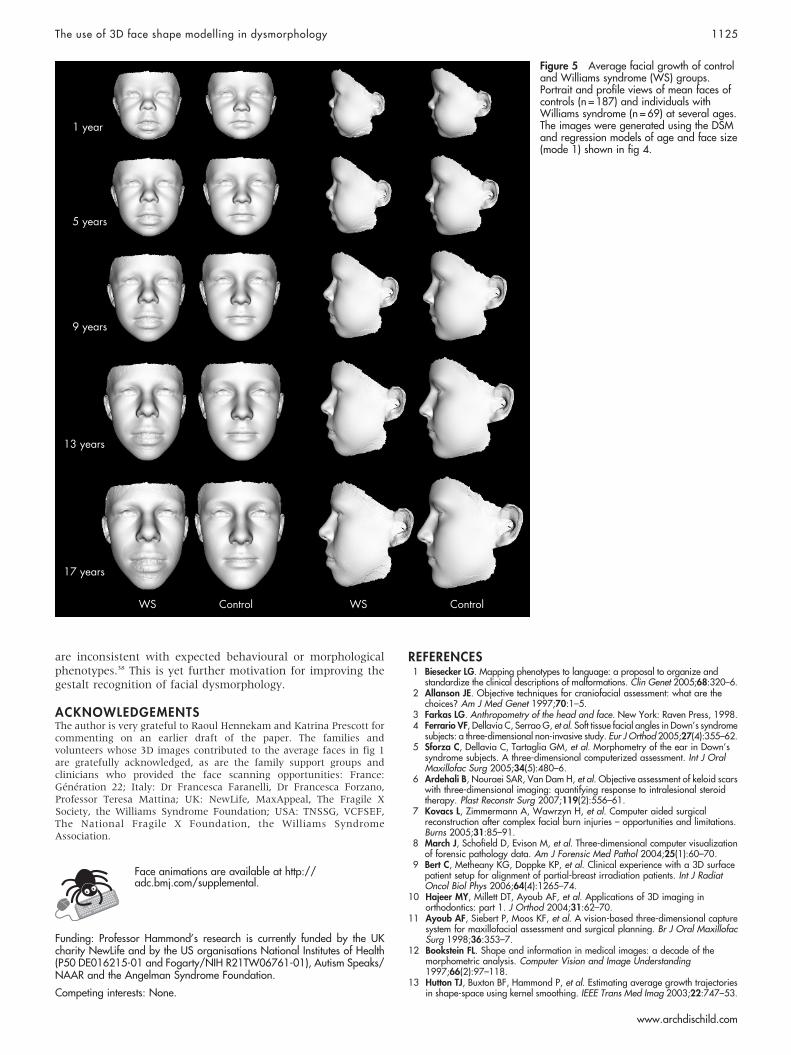
Figure 5 Average facial growth of controland Williams syndrome (WS) groups.Portrait and profile views of mean faces ofcontrols (n = 187) and individuals withWilliams syndrome (n = 69) at several ages.The images were generated using the DSMand regression models of age and face size(mode 1) shown in fig 4.
The use of 3D face shape modelling in dysmorphology 1125
www.archdischild.com

14 Hammond P, Hutton TJ, Allanson JE, et al. 3D analysis of facial morphology. AmJ Med Genet A 2004;126, (4):339–48.
15 Hammond P, Hutton TJ, Allanson JE, et al. Discriminating power of localizedthree-dimensional facial morphology. Am J Hum Genet 2005;77:999–1010.
16 Bhuiyan Z, Klein M, Hammond P, et al. Genotype-phenotype correlations of 39patients with Cornelia de Lange syndrome: the Dutch experience. J Med Genet2006;43:568–75.
17 Shaweesh AI, Thomas CDL, Bankier A, et al. Delineation of facial archetypes by3D averaging. Ann R Australas Coll Dent Surg 2004;17:73–9.
18 Kau CH, Zhurov A, Richmond S, et al. Facial templates: a new perspective inthree dimensions. Orthod Craniofac Res 2006;9(1):10–17.
19 Cox-Brinkman J, Vedder A, Hollak C, et al. Three-dimensional face shape inFabry disease. Eur J Hum Genet 2007;15(5):535–42.
20 Ward RE, Jamison PL, Farkas LG. Craniofacial variability index: a simplemeasure of normal and abnormal variation in the head and face. Am J MedGenet 1998;80:232–40.
21 Shaner DJ, Peterson AE, Beattie OB, et al. Assessment of soft tissue facialasymmetry in medically normal and syndrome-affected individuals by analysis oflandmarks and measurements. Am J Med Genet 2000;93(2):143–54.
22 Buckley PF, Dean D, Bookstein FL, et al. A three-dimensional morphometric studyof craniofacial shape in schizophrenia. Am J Psychiatry 2005;162(3):606–8.
23 Hennessy RJ, Lane A, Kinsella A, et al. 3D morphometrics of craniofacialdysmorphology reveals sex-specific asymmetries in schizophrenia. Schizophr Res2004;67:261–8.
24 Hennessy RJ, McLearie S, Kinsella A, et al. Facial shape and asymmetry by threedimensional laser surface scanning covary with cognition in a sexually dimorphicway. J Neuropsychiatry Clin Neurosci 2006;18:73–80.
25 Tassabehji M, Hammond P, Karmiloff-Smith A, et al. GTF2IRD1 in craniofacialdevelopment of humans and mice. Science 2006;310:1184–7.
26 Kau CH, Richmond S, Zhurov AI, et al. Reliability of measuring facial morphologywith a 3-dimensional laser scanning system. Am J Orthod Dentofacial Orthop2005;128(4):424–30.
27 Bush K, Antonyshyn O. Three-dimensional facial anthropometry using a lasersurface scanner: validation of the technique. Plast Reconstr Surg1995;98(2):226–35.
28 Aldridge K, Boyadjiev SA, Capone GT, et al. Precision and error of three-dimensional phenotypic measures acquired from 3dMD photogrammetricimages. Am J Med Genet 2005;3:247–53.
29 Shaner DJ, Bamforth JS, Peterson A, et al. Technical note: different techniques,different results – a comparison of photogrammetric and caliper-derivedmeasurements. Am J Phys Anthropol 1988;106:547–52.
30 Gwilliam JR, Cunningham SJ, Hutton TJ. Reproducibility of soft tissue landmarkson three-dimensional facial scans. Eur J Orthod 2006;28(5):408–15.
31 Kamath BM, Loomes KM, Oakey RJ, et al. Facial features in Alagille syndrome:specific or cholestasis facies? Am J Med Genet 2002;112:163–70.
32 Freimer N, Sabatti C. The human phenome project. Nat Genet 2003;34:15–21.33 Loos HS, Wieczorek D, Wurtz RP, et al. Computer-based recognition of
dysmorphic faces. Eur J Hum Genet 2003;11(8):555–60.34 Boehringer S, Vollmar T, Tassen C, et al. Syndrome identification based on 2D
analysis software. Eur J Hum Genet 2006;14:1082–9.35 Dalal AB, Phadke SR. Morphometric analysis of face in dysmorphology. Comput
Methods Programs Biomed 2007;85(2):165–72.36 Blanz V, Vetter T. Face recognition based on fitting a 3D morphable model. IEEE
Trans Pattern Anal Mach Intell 2003;25(9):1063–74.37 Learned-Miller E, Qifeng L, Paisley A, et al. Detecting acromegaly: screening for
disease with a morphable model. Med Image Comput Comp Assist Interv(MICCAI) 2006;2:495–503.
38 Carey J. A species not extinct: publication of case reports and scientificknowledge. Am J Med Genet 2006;140A:801–3.
Blogs from Archives of Disease in Childhood – more than just gossip
ADC has just launched Blogs from two of the journal’s associate editors who would love you tocontribute. Don’t forget to sign up for the Blog RSS feeds so you don’t miss anything.
The Precis BlogPrecis starts with the idea that any good paper can be summarised in one sentence. That sentencemay sometimes be complex, and should normally leave you wanting to know more, but it willcontain the core of what the paper is about. This is, by its nature, idiosyncratic, and hopefullysometimes controversial. The blog focuses on the online first part of ADC:
N You might like to leave informal comments on papers, as part of a conversation betweenreaders, or a real dialogue between authors and readers (note that comments are moderatedbut not routinely edited).
N You might like to comment on what has been written about your own paper.
N You might like to just read it every now and then as a way into the journal; to keep ahead ofyour colleagues, or your juniors, or your seniors.
The Precis blog can be found at: http://blogs.bmj.com/adc-precis
The Archimedes BlogYou’ll be familiar with Archimedes, the bimonthly section of evidence-based questions andanswers, and with the Archimedes blog you:
N Get to see the questions as they are being asked, and can comment on the answer you expectto see.
N Can argue about the interpretation of evidence from the published topic reports.
N Can add new information to older reports.
There are also Teaching tips, bite-sized explanations of EBM concepts and links to other placeswhere the practice of evidence-based child health can be discussed.
The Archimedes blog can be found at: http://blogs.bmj.com/adc-archimedes
Ian Wacogne and Bob Phillips explain why they think this is important in an editorial in theNovember issue of ADC (Arch Dis Child 2007;92:941–2).
1126 Hammond
www.archdischild.com


![Phase field modelling of fracture and fatigue in Shape …arXiv:2010.04390v1 [cs.CE] 9 Oct 2020 Phase field modelling of fracture and fatigue in Shape Memory Alloys Marlini Simoesa,](https://img.dokumen.tips/doc/110x75/609c4a1e809d7f5fd05aa23b/phase-field-modelling-of-fracture-and-fatigue-in-shape-arxiv201004390v1-csce.jpg)