Embed Size (px)
Citation preview
r--
1
I
\ ~, ~t L ' "j_~
\ii \
i ~;\() THE U.S. AUTOMOBILE INDUS'f~qy i t; '-/ MONTHL V REPORT ON SELECTED ! ECONOMIC INDICATORS
. - __ Report to _tbe __ SYbQ9ffil'Jljt1~~-on J!?.9~1 __ ·
Committee on Ways and Means,
1; on Investigation No. 332-207
Under Section 332 of the Tariff Act of 1930
i
! ~' ' I
i
I I I'
I :J
USITC PUBLICATION 2294 . !1
I) I . JUNE 1990
l 1- :: - . \ .
. ·\ ) United States International Trade Commission
Washington, DC 20436
1 .. ' .,,,_:· I .:;:7 ·- ·- -- - - -· - - - - - - - - - - - - - - - - - - - - - - - - - - -· - - - - - • - - .... - - -- - - • - - -- - - - . - - - - • - - ·- - - - . - - . - - - - -- ·- -!
! 'I! ;
UNITED SI'ATES INTERNATIONAL TRADE COMMISSION
COMMISSIONERS
Anne E. Brunsdale, Chairman Ronald A. Cass, Vice Chairman
Alfred E. Eckes
Seeley G. Lodwick David B. Rohr
Don E. Newquist
Office of Industries
Robert A. Rogowsky, Director
This report was prepared principally by
Juanita S. Kavalauskas
Transportation Branch
Machinery and Equipment Division
i
I ----- -- . . -------- --- -- - . ---·-:d --·;,:J
Address all communications to Kenneth R. Mason, Secretary to the Commission
United States International Trade ~ommission Washington, DC 20436
~ ,., ---------.-------· ... -_,_, _ _,,,_, ... _,.. __ ~_,.,..... ·-·--- .. --.. -.,_..--..,..._ .-.... ''.:"':'~-···- .. --~. -·. ,,_ ·- -.. . ......... ··-·········· .-·- -" ........... '. ,.
·~ I ;
C 0 N T E N T S - - - - - - - - - - - - - - - - - - - - - - - - - - - - - - - - -- - - - - - - - - - - - - - - - - -- - --- - -- ·- - - ·-- - - - - - ·- - -- - - -- - -
Tables
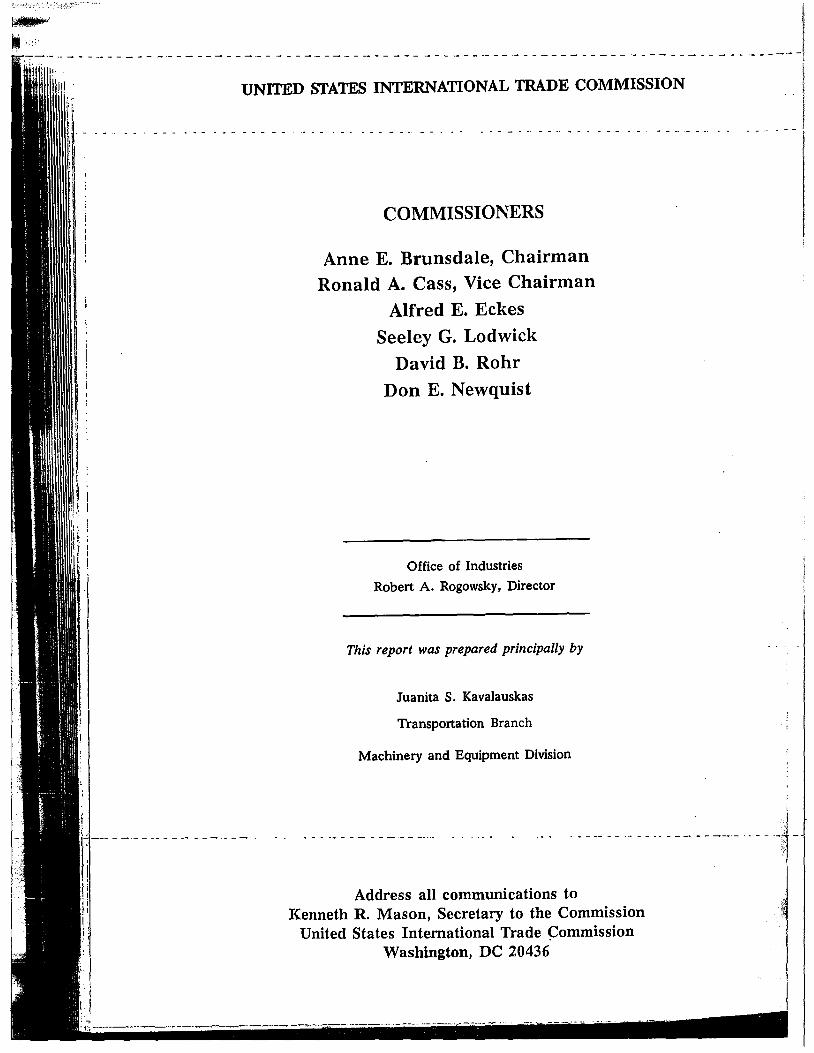
1. New passenger automobiles: U.S. retail sales of domestic production, production, inventory, days' supply, and employment, by specified periods, June 1988-May 1990 ••••.•.•••..
2 ,_ New passenger automobiles: U.S. imports, by principal sources and by specified periods, May 1988-April 1990 .....•...•.••••.••
3. Lightweight automobile trucks and bodies and cab/chassis for lightweight automobile trucks: U.S. imports, by principal sources. and by specified periods, May 1988-April 1990 ..•.•.•.•.
4~ New passenger automobiles: U.S. exports of domestic merchandise, by principal markets and by specified periods,
1
2
3
May 1988-April 1990............................................ 4 5. Lightweight automobile trucks and bodies and cab/chassis for
lightweight automobile trucks: U.S. exports of domestic merchandise, by principal markets and by specified periods, May f988-April 1990 ....•.....•...•..•......•.•.....•••.•..•..•.
6. New passenger automobiles: Sales of domestic and imported pass.enger automobiles and sales of imported passenger automobiles as a percent of total U.S. sales, by specified periods, 1989 and 1990 ••••.•. ~ •••••••.••••.•..•••••••.•••••••••
-7. New passenger automobiles: Price indexes, by specified periods, 1989 and 1990 ................................................. .
8. New passenger automobiles: Retail price changes in the U.S. market during May 1990 ........... o •••••••••••••••••••••••••••••
9. Manufacturers' suggested retail prices of selected U.S. and ~apanese automobiles, April 1981-June 1990 ••.•.•••.••••••••••••
5
6
6
7
8
J "I , r
I ~: :
I i!
I:
1
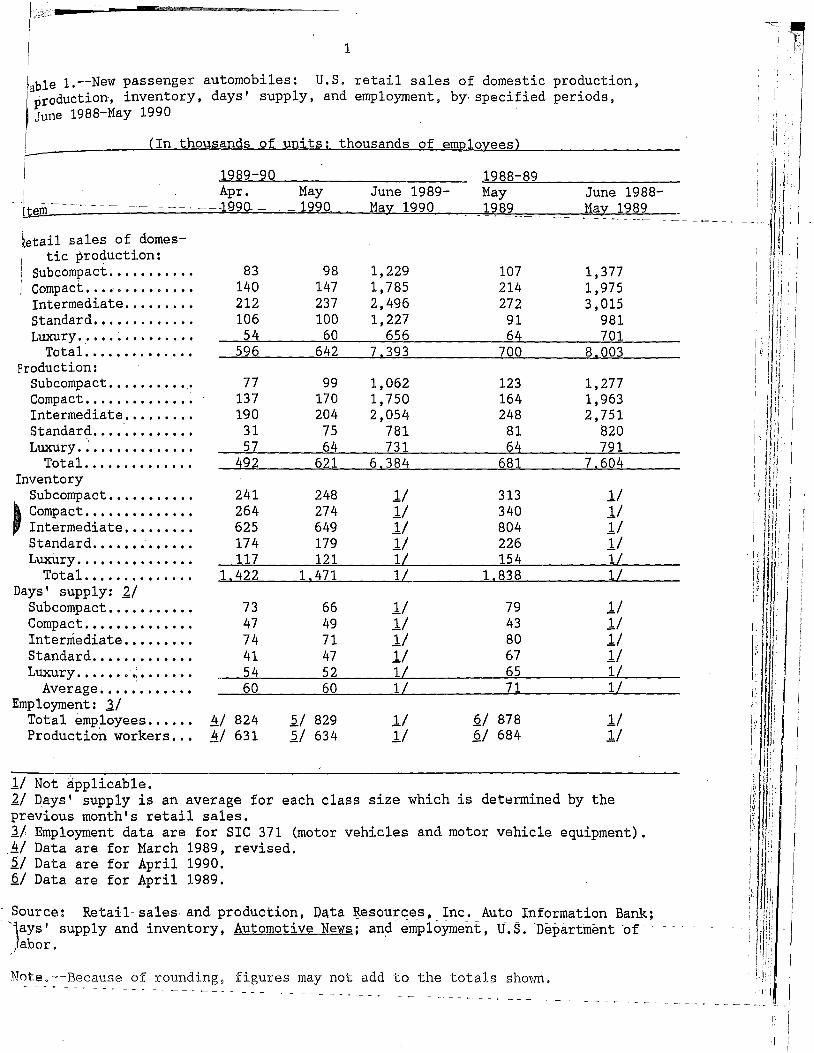
, ble 1.--New passenger automobiles: U.S. retail sales of domestic production,
laproduction, inventory, days' supply, and employment, by· specified periods, June 1988-May 1990
r (In thousands of units; thousands of employees)
1989-90 Apr. May
- Ltgrll--------------------1990.----1990
~etail sales of domes-/ tic production: ! subcomract •••••.••••• 83 98 ' 140 147 ! Compact ••••.•••••••• ••
Intermediate •••••.••• 212 237 Standard ............. 106 100 LllXUry . . • ....•.....•.. 54 60
Total . ............. 596 642 Production:
Subcompact .•.•.•••••. • 77 99 Compact •.••••.•••••.. 137 170 Intermediate ••••••••• 190 204 Standard . ... -......... 31 75 LllXllry. ~ ....•..•..... 57 64
Total .............. 492 621 Inventory
Subcompact •••••••.••. 241 248 ~ Compact •••.•••••••••• 264 274
Intermediate ••••••••• 625 649 Standard . ...... · ...... 174 179 L\lXUry . ..••.••••..... 117 121
Total . ............. 1.422 1.471 Days' supply: 2,./
Subcompact •.••••.•••. 73 66 Compact . ...........•. 47 49 Intermediate ••••••••• 74 71 Stand·ard . ............ 41 47 Luxury . ...... o~ o •••• ·• • 54 52
Average . ........... 60 60 Employment: :JI
Total employees •••..• !±/ 824 21 829 ProduGtioh workers .•• !±/ 631 21 634
1/ Not ~pplicable.
June 1989-May 1990
1,229 1,785 2,496 1,227
656 7 393
1,062 1,750 2,054
781 731
6 384
11 1/ 1/ 11 1/ 1/
1/ 11 1/ 1/ 1/ 1/
11 1/
1988-89 May 1989
107 214 272 91 64
700
123 164 248 81 64
681
313 340 804 226 154
1.838
79 43 80 67 65 71
§./ 878 §./ 684
1,377 1,975 3,015
981 701
8 003
1,277 1,963 2,751
B20 791
7 604
11 11 11 11 1/ 1/
1/ 1/ 1/ 1/ 1/ 1/
1/ 1/
2,/ D,ays' supply is an average for previous month's retail sales.
each class size which is determined by the
~/ Employment data are for SIC 371 (motor vehicles !±/ Data are for March 1989, revised. 2/ Data are for April 1990, §./ Data are for April 1989.
and motor vehicle equipment).
Source: Retail-sales-and production, Data_~epources, Inc. Auto Information Bank; '1ays' supply and inventory' Automotive News; and empio:Yment I ·u·. s .- 'Depaitinent 'of- -,' abor.
Note" ---Because of rounding 9 figures may not add to the totals sho\•m, -------------- - -- --- --- ---- ------ ---
I " '
--------- - - - - - - ---- - - - - - ---- - - - - -- - +
,; n
'
ii ; I
. ' '' ; I
.~ I
- - -- ---.. - - - - - - - - -- - - -- - - - - - - - - - -- -- - -- - - .... - - -~ - - - - - -- - - _...,. - - - - -
2
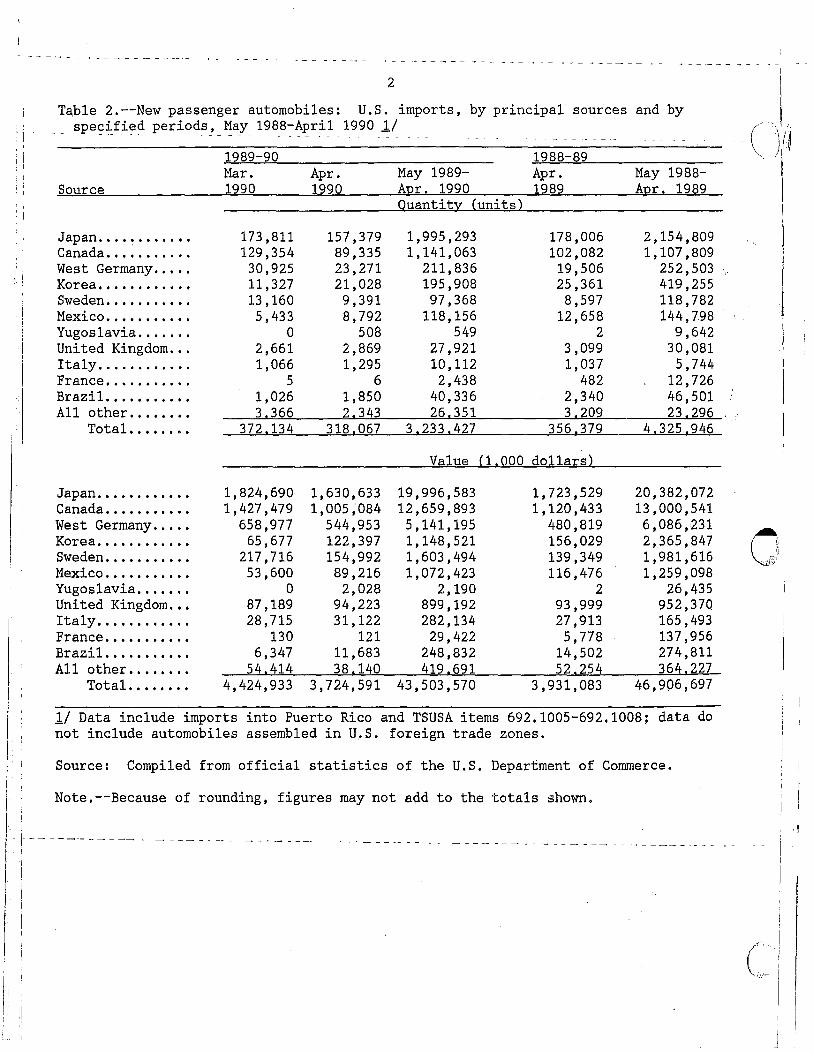
Table 2.--New passenger automobiles: U.S. imports, by principal sources and by sped._fie~ _p_e~~()dS ! __ May 1988-April 1990 1/
Source
Japan ........... . Canada ... ~ ...... . West Germany •.••• Korea . .......... . Sweden .......... . Mexico . ......... . Yugoslavia ..•.••• United Kingdom .•• Italy . .......... . France .......... . Brazil ••••••.•••• All other •••••••.
Total ••••••••
Japan ........... . Canada .......... . West Germany •.••• Korea . .......... . Sweden ••.•••••••. Mexico .......... . Yugoslavia ....••. United Kingdom ••• Italy . .......... . France .......... . Brazil ••••••••••• All other •••.••••
Total .•••••••
1989-90 Mar • 1990
173,811 129,354
30,925 11,327 13,160 5,433
0 2,661 1,066
5 1,026 3.366
372.134
1,824,690 1,427,479
658,977 65,677
217,716 53,600
0 87,189 28,715
130 6,347
54.414 4,424,933
Apr. 1990
157,379 89,335 23,271 21,028 9,391 8,792
508 2,869 1,295
6 1,850 2.343
318,067
1,630,633 1,005;084
544,953 122,397 154,992 89,216
2,028 94,223 31,122
121 11,683 38.140
3,724,591
May 1989-Apr. 1990 Quantity (units)
1,995,293 1,141,063
211,836 195,908 97,368
118,156 549
27,921 10,112
2,438 40,336 26.351
3,233.427
1988-89 ·Apr. 1989
178,006 102,082
19,506 25,361
8,597 12,658
2 3,099 1,037
482 2,340 3.209
356,379
Value (l.000 dollars)
19,996,583 12,659,893 5,141,195 1,148,521 1,603,494 1,072 ,423
2,190 899,192 282,134
29,422 248,832 419 '691
43,503,570
1,723,529 1,120,433
480,819 156,029 139,349 116,476
2 93,999 27,913 5, 778
14,502 52.254
3,931,083
May 1988-Apr. 1989
2,154,809 1, 107 ,809
252' 503 '· 419,255 118,782 144, n8
9,642 30,081
5,744 12,726 46,501 23.296
4.325.946
20,382,072 13,000,541 6,086,231 2,365,847 1,981,616 1,259,098
26,435 952,370 165,493 131,956 274,811 364.227
46,906,697
1/ Data include imports into Puerto Rico and TSUSA items 692.1005-692.1008; data do not include automobiles assembled in U.S. foreign trade zones.
Source: Compiled from official statistics of the U.S. Department of Commerce.
Note.--Because of rounding, figures may not a~d to the totals shown.
- I- - - - - --- - -- - -- - -- - - - - - ---- - - - - -- - - -· - - - - - - - - -·- - - -- - - -- - - -- - - - - - -- - - -- - - - -- - - - - --- - -- - - . -I
I
I
. ()~ii
I
0
c·I
3
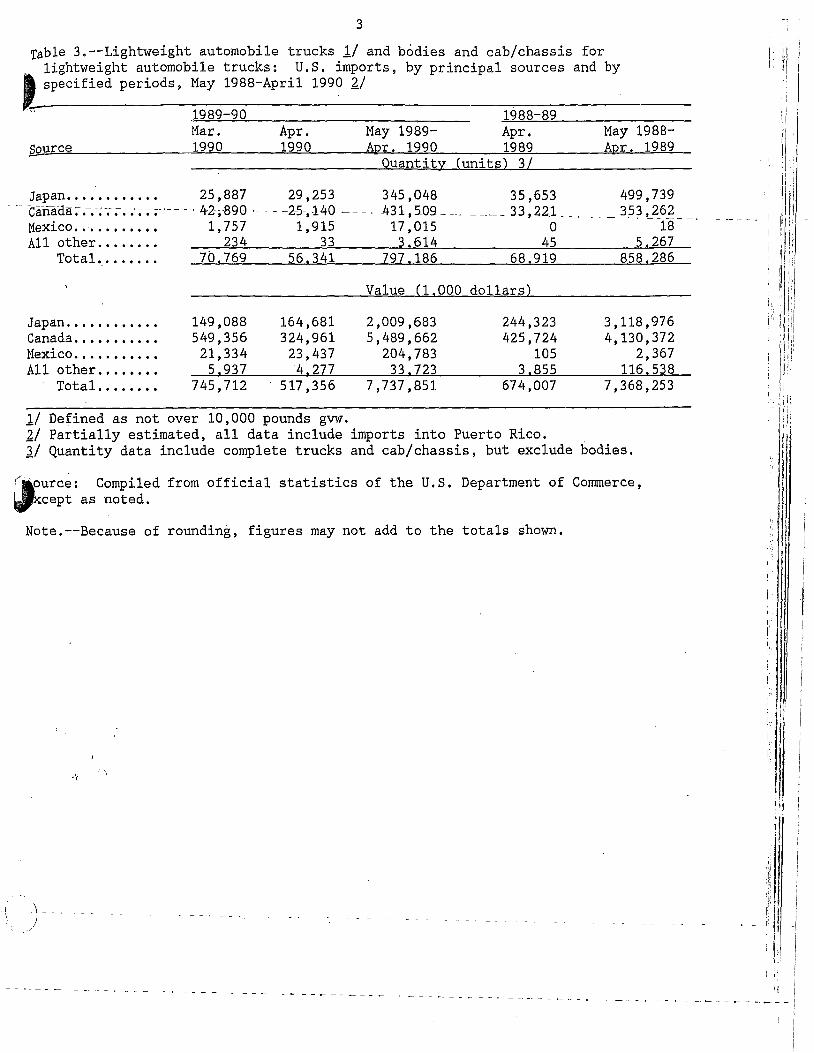
Table 3.--Lightweight automobile trucks 1/ and bodies and cab/chassis for lightweight automobile trucks: U.S. imports, by principal sources and by
~specified periods, May 1988-April 1990 21
29urce
1989-90 Mar. 1990
Apr. 1990
May 1989-Apr. 1990
Quantity
1988-89 Apr. 1989
(units) 3/
May 1988-Apr. 1989
I' 111 ' ii I
,11' 'i
,ii I 11
Japan............ 25,887 29,253 345,048 35,653 499,739 'i 1
1
1
1
) i --- canaaa :-.-. -; ·; ;- .-.-;~; ·- - - ·A2-,B90 -- - - -2s,140 - - - - -431, 509 ________ 33 ,2.2.L _____ J.23, 262 , 1
Mexico ........... _ 1,757 1,915 17,015 O ---19----------1
'-,I,: 1
] i All other........ 234 33 3 614 45 5 267 , , Total........ 70.769 56.341 797.186 68,919 858.286 l,
II' Value ( 1.000 dollars)
Japan . ........... 149,088 164,681 2,009,683 244,323 3,118,976 Canada . .......... 549,356 324,961 5,489,662 425,724 4,130,372 Mexico . .......... 21,334 23,437 204,783 105 2,367 All other •••••••• 5,937 4.277 33.723 3.855 116.538
Total •.•••••. 745,712 517,356 7,737,851 674,007 7,368,253
1/ Defined as not over 10,000 pounds gvw. 21 Partially estimated, all data include imports into Puerto Rico. ll Quantity data include complete trucks and cab/chassis, but exclude bodies.
(raourc~: Compiled from official statistics of the U.S. Department of Commerce, ~cept as noted.
Note.--Because of rounding, figures may not add to the totals shown.
(\
)--
- - -- - - - - - -- - - - - - - - - - - - - - - - - - - - - - - - -- - - .,__ - - - - - -- - - --
;
' i I
!, i : i, I :i
,11
i!
I!! I, /i
' ·1i
'
·,
I ! I
: f
! ' ! 1:· I l I '·
! I
I ! I .,
;·
- ------ - -- ,___ - - -- - - - - -------------------
'
--- ------ ------ --- ---~--- - - ---- - - - - - -- - - -- - - -- - - - - - -- - - - - - --- - - -- - - - --.. ___________ -------- --
4
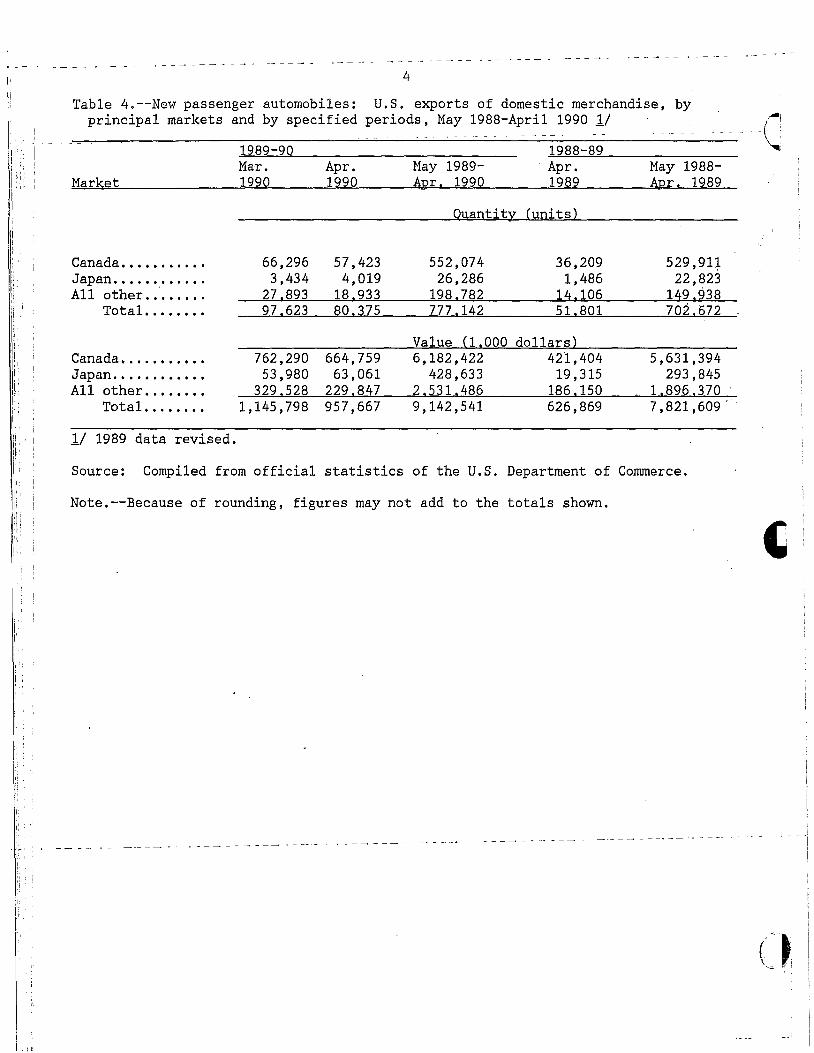
Table 4.--New passenger automobiles: U.S. exports of domestic merchandise, by
i, I
~ '.
' '
principal markets and by specified periods, May 1988-April 1990 1/
Market
Canada ............ Japan ............ All other .. · ......
Total ........
Canada ........... Japan ............ All other •••••••.
Total •..••.••
1989-90 Mar. 1990
66,296 3,434
27,893 97,623
762,290 53,980
329,528 1,145,798
11 1989 data revised.
Source: Compiled from official
Apr. 1990
May 1989-Apr. 1990
1988-89 , Apr.
1989
Quantity (units)
57,423 552,074 36,209 4,019 26,286 1,486
18,933 198 .782 1~,106 80,375 777, 142 51, 801
Value {1,000 dollars} 664,759 6,182,422 421,404
63,061 428,633 19,315 229,847 2,531,486 186,150 957,667 9,142,541 626,869
statistics of the U.S. Department of
Note.--Because of rounding, figures may not add to the totals shown.
' - ,-1 . - - - - - -· - - --- - --- - - - - - - - -- - ---- - -- - - -- - - -- - - - - - -- - - - - - -- - - - - - 4 --------
May 1988-Apr, 1989
529, 91,i 22,823
149,938 702.672'
5,631,394 293,845
1,896,370 7 ,821,609'
Commerce,
- -- - - -4 - - -4 - - -- - -
-(1
5
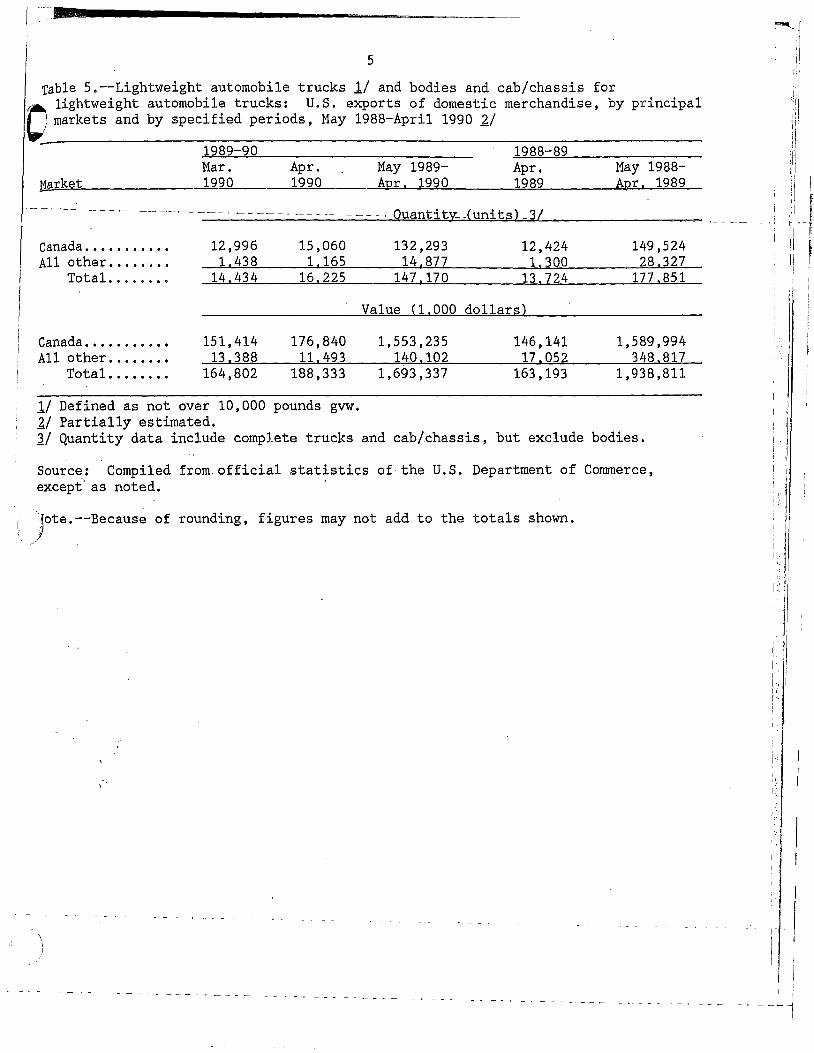
Table 5.--Lightweight automobile trucks 1/ and bodies and cab/chassis for
0 lightweight automobile trucks: U.S. exports of domestic merchandise, by principal markets and by specified periods, May 1988-April 1990 21
11.arket
1989-90 Mar. 1990
Apr. 1990
May 1989-Apr. 1990
1988-89 Apr. 1989
·- - - ·-- · -· - --- -- ---- -+--- - -- - --- - ·-- - -- --Quantity_ .(units) 3/
Canada . ......... . All other ••.•• ~ •.
Total ....... .
12,996 1 438
14.434
15,060 1 165
16.225
132,293 14 877
147.170
12,424 1 300
13' 724
·Value (1.000 dollars)
Canada .......... . All other ••••••••
Total ....... .
151,414 13.388
164,802
176,840 11. 493
188,333
1/ Defined as not over 10,000 pounds gvw. 11 Partially estimated.
1,553,235 140.102
1,693,337
146,141 17.052
163,193
May 1988-Apr. 1989
149,524 28.327
177 ,851
1,589,994 348.817
1,938,811
'JI Quantity data include complete trucks and cab/chassis, but exclude bodies.
Source: Compiled from official statistics of the U.S. Department of Commerce, except' as noted.
,)ote.--Because of rounding, figures may not add to the totals shown.
--- ------- --~---
:"""'--•.
..
I '.
I"
·: l I:
- -· ---- - - -- - - - - - - - - ---- - - - - - --
I
I t
-- - - - - - - - - -- ---- --------- ----------- ---------6
---- --- .,. __ --- -- - - ~ - - - - - -- - - - - - - - - - -
'
I
,
I I. I I
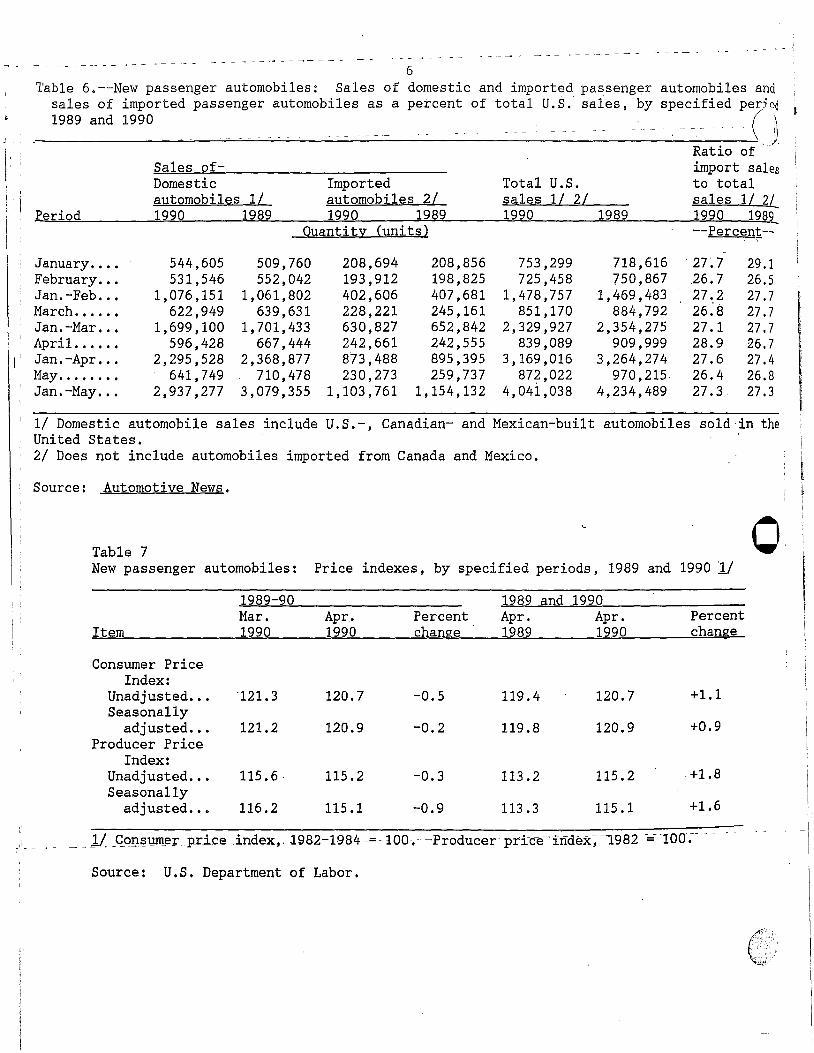
Table 6.--New passenger automobiles: Sales of sales of imported passenger automobiles as a 1989 and 1990
domestic and imported passenger automobiles and percent of total U.S. sales, by specified perjcd
1
.------------- __ · ----- . ( ~
Period
January •••. February ••. Jan.-Feb ••• March •••••• Jan.-Mar ••• April ••.••• Jan.-Apr ••• May •••••••• Jan. -May •••
Sales of-Domestic automobiles 1/ 1990 1989
Imported automobiles 2/ 1990 1989
Quantity (units)
544,605 509,760 208,694 208,856 531,546 552,042 193,912 198,825
1,076,151 1,061,802 402,606 407,681 622,949 639,631 228,221 245,161
1,699' 100 1,701,433 630,827 652,842 596,428 667,444 242,661 242,555
2,295,528 2,368,877 873,488 895,395 641,749 710,478 230,273 259,737
2,937,277 3,079,355 1,103,761 1,154,132
Total U.S. sales 1/ 2/ 1990
753,299 725,458
1,478,757 851,170
2,329,927 839,089
3,169,016 872,022
4,041,038
1989
718,616 750,867
1,469,483 884,792
2,354,275 909,999
3,264,274 970,215
4,234,489
~- J. Ratio of import sales to total sales 1/ 2/ 1990 198l --Percent--
I 27, 7 26. 7 27.2 26.'8 27.1 28.9 27.6 26.4 27.3
29.1 26.S 27.7 27.7 27.7 26.7 27.4 26.8 27.3
1/ Domestic automobile sales include U.S.-, Canadian- and Mexican-built automobiles sold in the 1 United States.
2/ Does not include automobiles imported from Canada and Mexico.
I Source: Automotive News.
Table 7 0 New passenger automobiles: Price indexes, by specified periods, 1989 and 1990 1/
1989-90 1989 and 1990
I: Mar. Apr. Percent Apr. Apr. Percent Item 1990 1990 change 1989 1990 change I
Consumer Price Index:
Unadjusted ••• ·121. 3 120.7 -0.5 119.4 120.7 +1.1 Seasonally
adjusted ••• 121.2 120.9 -0.2 119.8 120.9 +0.9 Producer Price
Index: Unadjusted ••• 115.6- 115 .2 -0.3 113 .2 115 .2 +1.8 Seasonally
adjusted ••• 116.2 115.1 -0.9 113.3 115.1 +1.6
)_ - _____ 1/ _C_o_!l,:;ilJm.er.p.rice _index,. 1982--1984 -=-100·,- -·Producer- p!'i-ce-·index~ 1982 -=-100. - -
Source: U.S. Department of Labor.
7
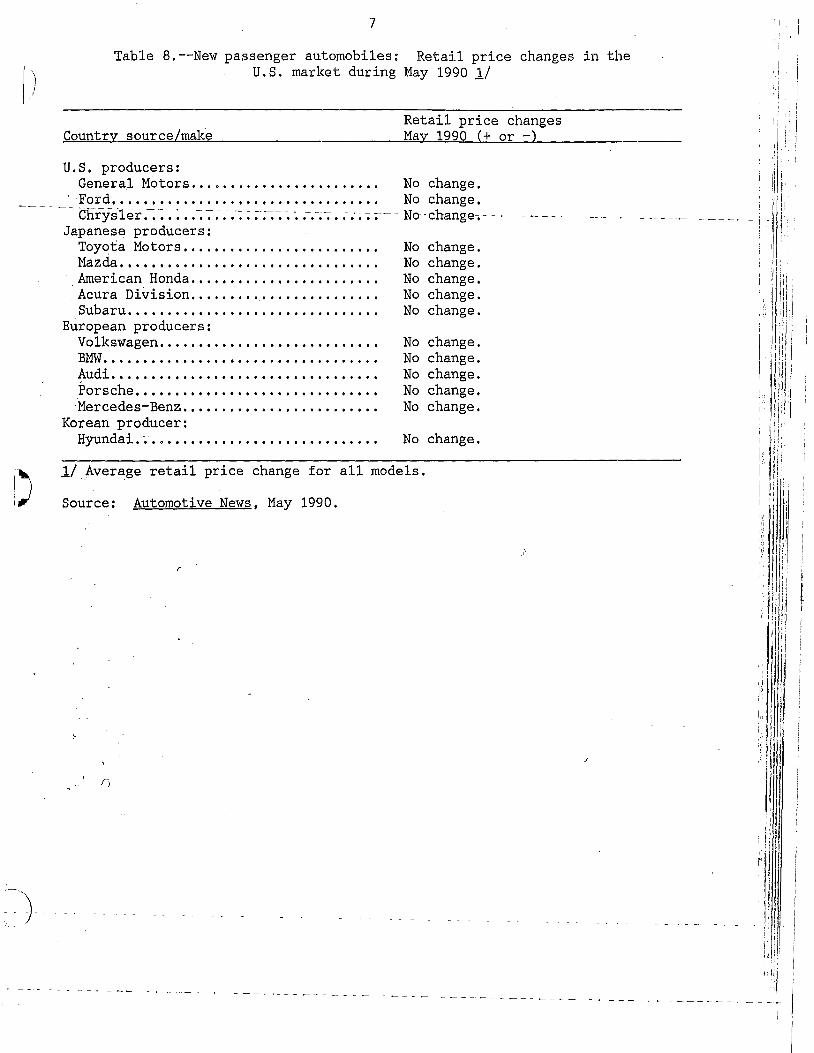
Table 8.--New passenger automobiles: Retail price changes in the U.S. market during May 1990 1/
Country source/make
U.S. producers:
Retail price changes May 1990 (+ or -)
Genera.1 Motors. • . • • • . • • • . • . • • • • • • . • • • . No change.
. I
~ I
:I
-- ___ ~·Ford.................................. No change. 1
1
- :Chrys-1er .~~ ~ :-.-.-~ :- ;.-~·:: ;-~~ ~ ;-.-.-~~-; .- .--;--; ;-- - No--change-.- - - - - --· ---- - -- - _ - __ . ____________ j -.~j Japanese producers: : :1
Toyot:a Motors......................... No change. i'
Mazda. • • . • . . • • . . . . . . . . . . . . . . • • . . • . . • . . No change. American Honda. • • . • • • • • • • • • • • • • • . • • • • . No change.
·Acura Di~ision........................ No change • . Subaru . .................. , . . . . . . . . . . . . No change.
European producers: Volkswagen ........................... . No change. BMW ••••••••••••••••••••••••••••••••••• No change. Audi . ................................ · Porsche . ........ , .................... . -'Mercedes-Benz • .•••••.••••••.••...•.•••
No change. No change. No change.
Korean producer: Hyundai . ~· . o ••••••••••••••••••••••••••• No change.
Source: Automotive News, May 1990. I) 1/~Average retail price change for all models.
-- -------------- ------
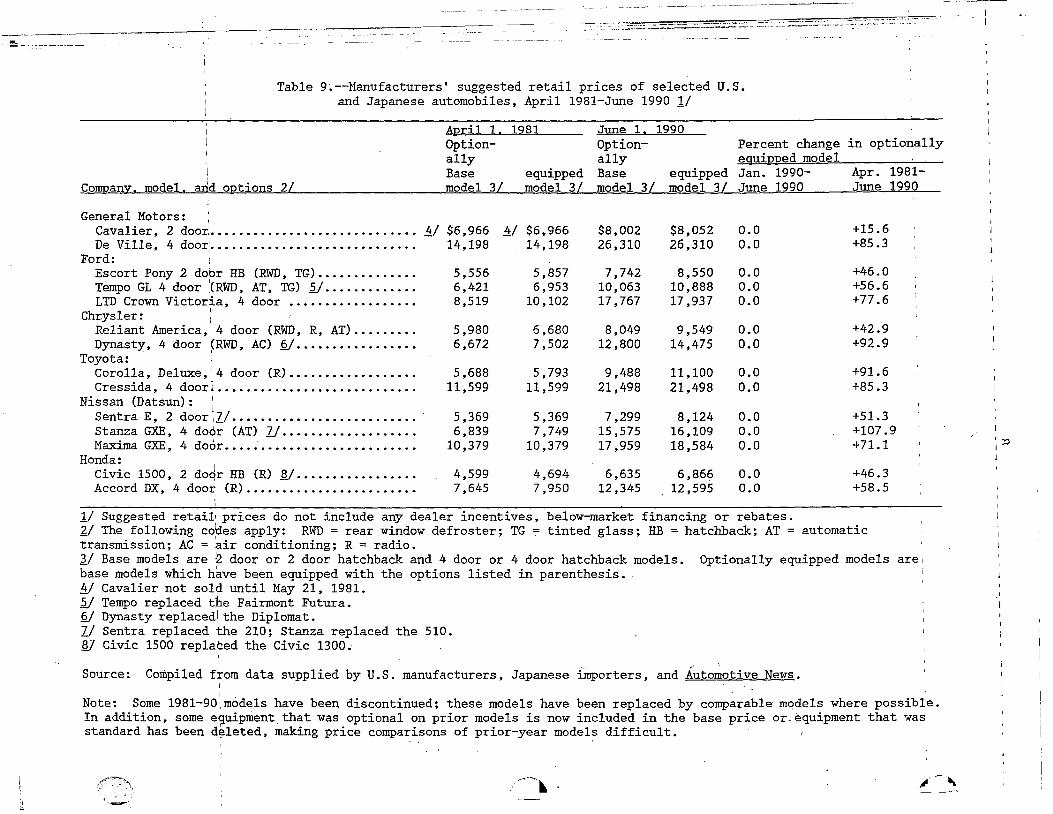
Table 9~--Manufacturers' suggested retail prices of selected U.S. and Japanese automobiles, April 1981-June 1990 1/
Co!!)Qany. model, a~d OI1tions 2L I
General Motors: , Cavalier, 2 door. ••••••••••••••••••••••••••••• De Ville, 4 door: •••••••••••••••••••••••••••••
Ford: · Escort Pony 2 dobr HB (RWD, TG) ••••••••••.••• Tempo GL 4 door '.CRWD, AT, TG) 5_/ ••••••••••••• LTD Crown Victoria, 4 door ••••••••.•••••••••
Chrysler: i Reliant America, 1 4 door (RWD, R, AT) •••••••.• Dynasty, 4 door ~RWD, AC) Q/ ................ .
Toyota: Corolla, Deluxe,j4 door (R) •••••••••••••••••• Cressida, 4 door ••••.••••••••••••••••••••••••
Nissan (Datsun) : , Sentra E, 2 door ;y . ......................... · Stanza GXE, 4 door (AT) l/ .................. . Maxima GXE, 4 doqr •••. : ••••••••••••••••••••••
Honda: 1
Civic 1500, 2 dodr HB (R) ?_! ••••••••••••••••• Accord DX, 4 door (R) ••••••••••••••••••••••••
I
April 1. 1981 Option-ally Base equipped model 3L model 3L
!±/ $6,966 !±I $6,966 14,198 14,198
5,556 5,857 6,421 6,953 8,519 10,102
5,980 6,680 6,672 7 ,502
5,688 5,793 11,599 ll ,599
5,369 5,369 6,839 7,749
10 ,379 10 ,379
4,599 4,694 7,645 7,950
June 1 1 1990 Option- Percent change ally egui12I1ed model Base equipped Jan. 1990-model 3L model 3l June 199a
$8,002 $8,052 a.o 26,310 26,310 o.a
7,742 8,550 a.o 10,063 10,888 0.0 17,767 17,937 a.a
8,049 9 ,549 0.0 12,8aa 14,475 a.a
9,488 11,100 o.o 21,498 21,498 a.a
7,299 8,124 a.o 15,575 16,109 o.o 17,959 18,584 a.a
6,635 6,866 o.o 12,345 12,595 o.o
in optiorially
Apr. June
+15.6 +85.3
+46.0 +56.6 +77.6
+42.9 +92.9
+91.6 +85.3
1981-1990
+51.3 +107.9 +71.1
+46.3 +58.5
11 Suggested retail1 prices do not include any dealer incentives, below-market financing or rebates. 21 The following co~es apply: RWD = rear window defroster; TG = tinted glass; HB = hatchback; AT = automatic transmission; AC = air conditioning; R = radio. , l/ Base models are Q door or 2 door hatchback and 4 door or 4 door hatchback models. Optionally equipped models are1 base models which have been equipped with the options listed in parenthesis. !±I Cavalier not sola until May 21, 1981. 5.1 Tempo replaced the Fairmont Futura. QI Dynasty replacedlthe Diplomat. II Sentra replaced the 21a; Stanza replaced the 510. ~ Civic 1500 replaced the Civic 1300.
I
I
Source: Compiled ftom data supplied by U.S. manufacturers, Japanese importers, and Automotive News. I
I ,
Note: Some 1981-90;models have been discontinued; these models have been replaced by comparable·mqdels where possible. In addition, some equipment_ that was optional on prior models is now included in the base price or-equipment that was standard has been d~leted, making price comparisons of prior-year models difficult.
J
' ::0 I
J
I
_I