Embed Size (px)
Citation preview
The United States and CanadaEconomic Geography
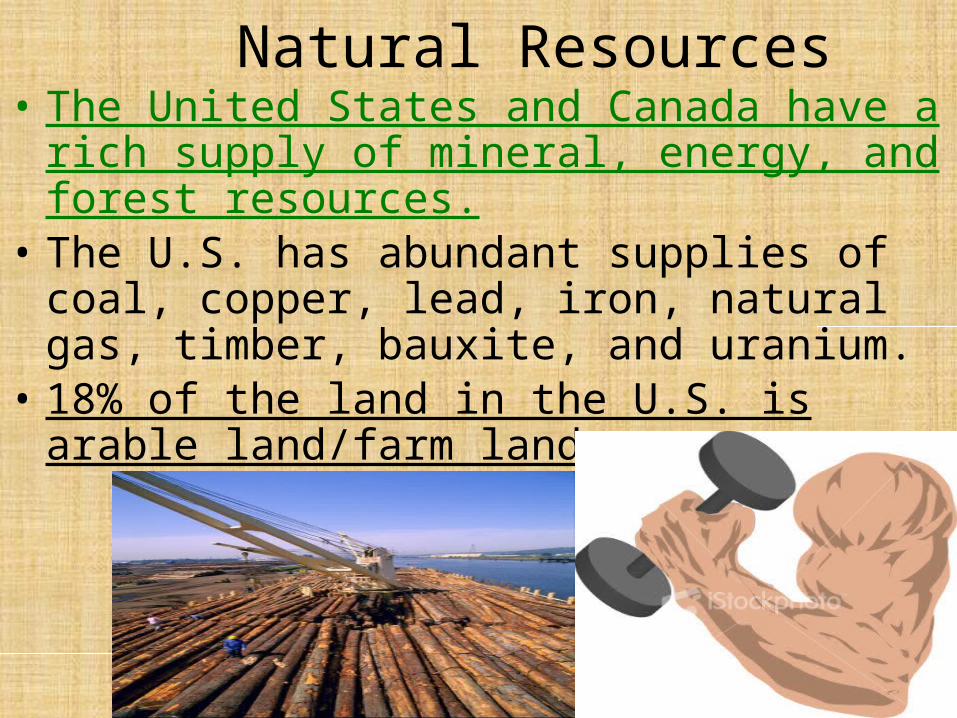
Natural Resources• The United States and Canada have a rich supply of
mineral, energy, and forest resources.• The U.S. has abundant supplies of coal, copper,
lead, iron, natural gas, timber, bauxite, and uranium.
• 18% of the land in the U.S. is arable land/farm land.

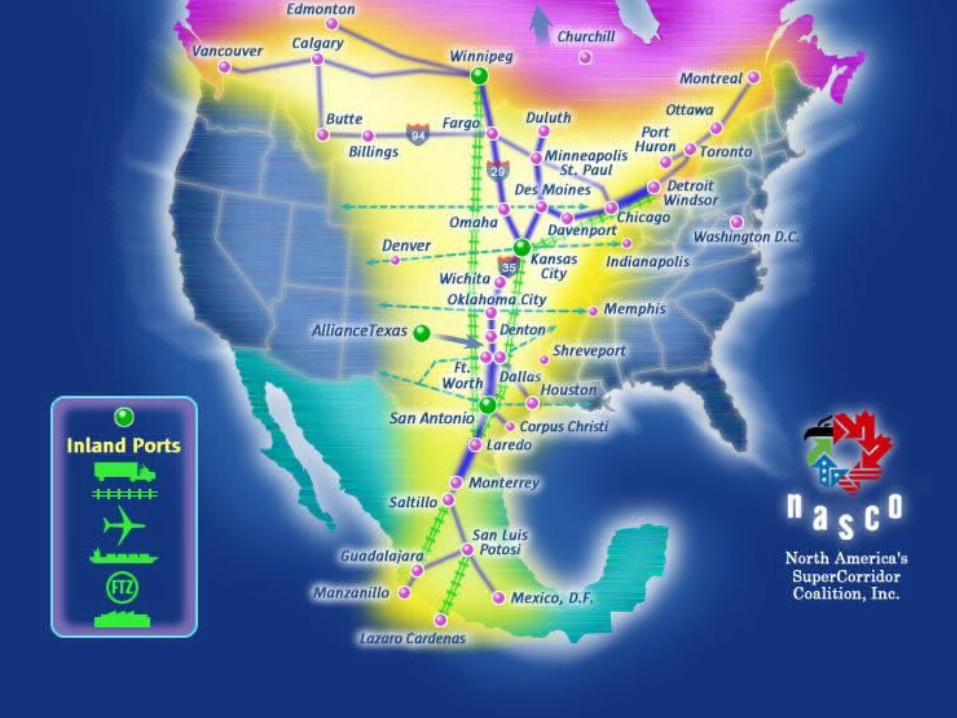
Infrastructure• The United States and
Canada have highly developed infrastructures that include:
• Modern road systems (interstates, freeways, bridges, tunnels)
• Telecommunications systems (internet connections, phone systems)
• Ports, railroads, educational systems
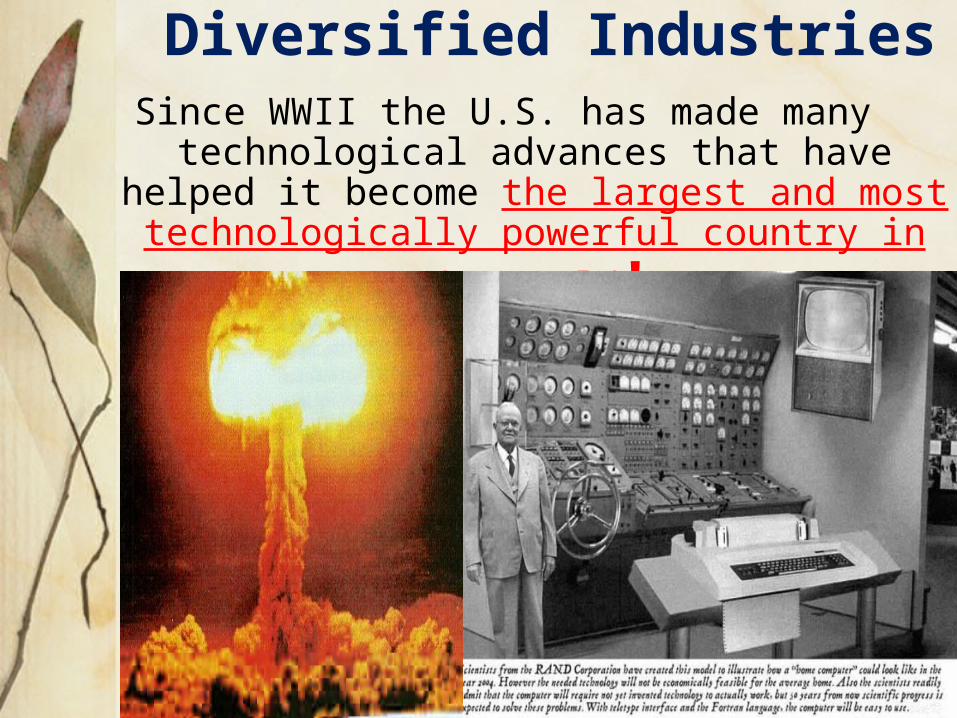
Diversified IndustriesSince WWII the U.S. has made many
technological advances that have helped it become the largest and most
technologically powerful country in the world!
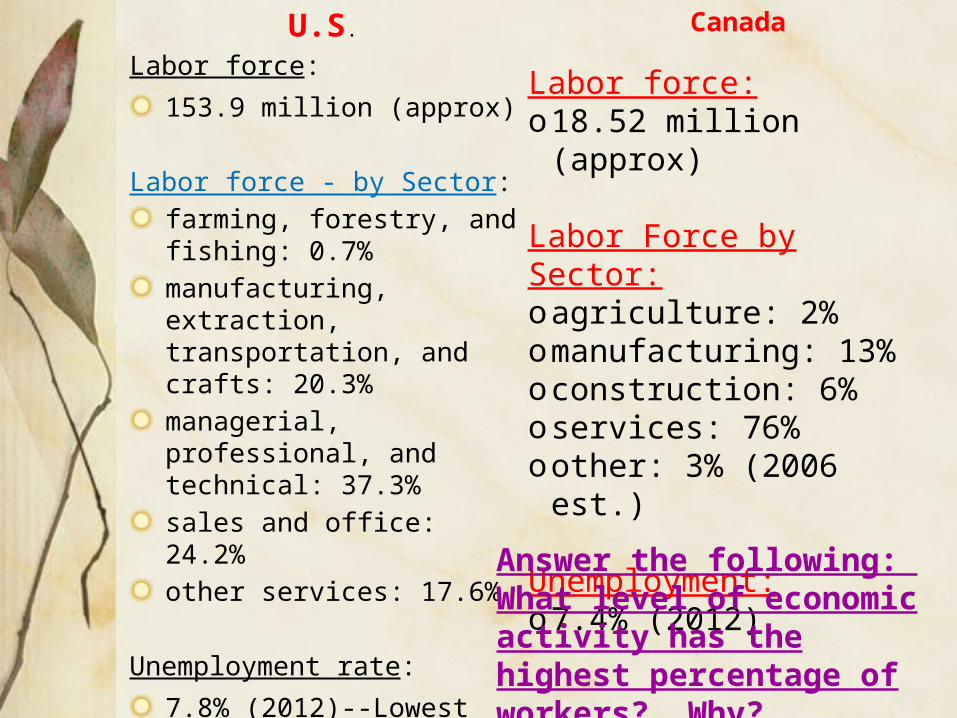
U.S.
Labor force: 153.9 million (approx)
Labor force - by Sector: farming, forestry, and fishing: 0.7%manufacturing, extraction, transportation, and crafts: 20.3%managerial, professional, and technical: 37.3%sales and office: 24.2%other services: 17.6%
Unemployment rate: 7.8% (2012)--Lowest since 2009!
Canada
Labor force:o18.52 million (approx)
Labor Force by Sector:oagriculture: 2%omanufacturing: 13%oconstruction: 6%oservices: 76%oother: 3% (2006 est.)
Unemployment:o7.4% (2012)
Answer the following: What level of economic activity has the highest percentage of workers? Why?
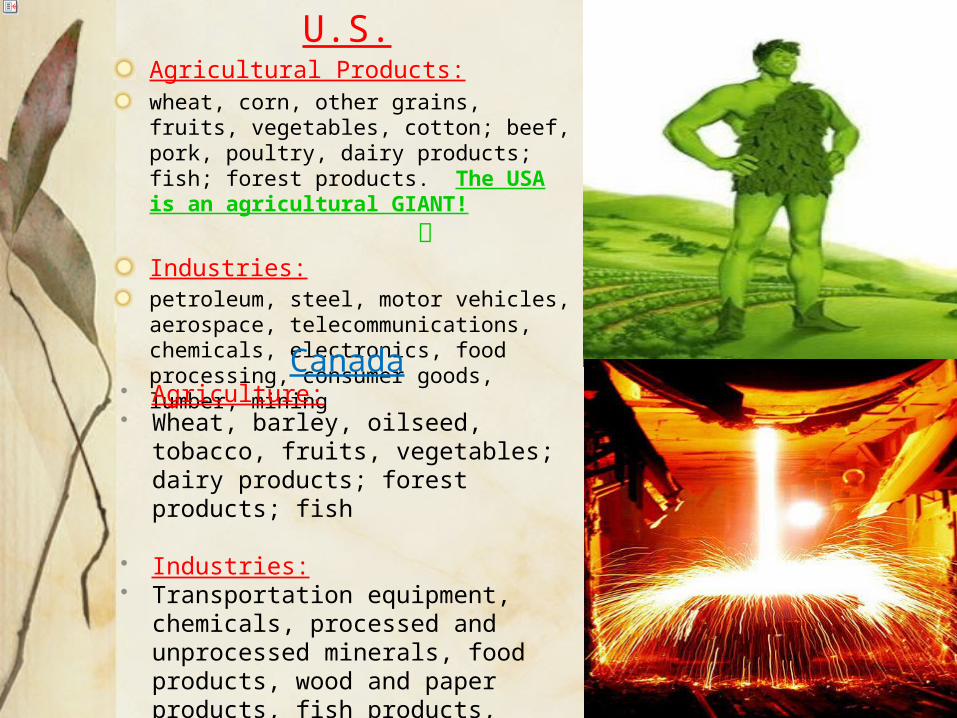
U.S.Agricultural Products:wheat, corn, other grains, fruits, vegetables, cotton; beef, pork, poultry, dairy products; fish; forest products. The USA is an agricultural GIANT! Industries:petroleum, steel, motor vehicles, aerospace, telecommunications, chemicals, electronics, food processing, consumer goods, lumber, miningCanada
Agriculture: Wheat, barley, oilseed, tobacco,
fruits, vegetables; dairy products; forest products; fish
Industries: Transportation equipment,
chemicals, processed and unprocessed minerals, food products, wood and paper products, fish products, petroleum and natural gas
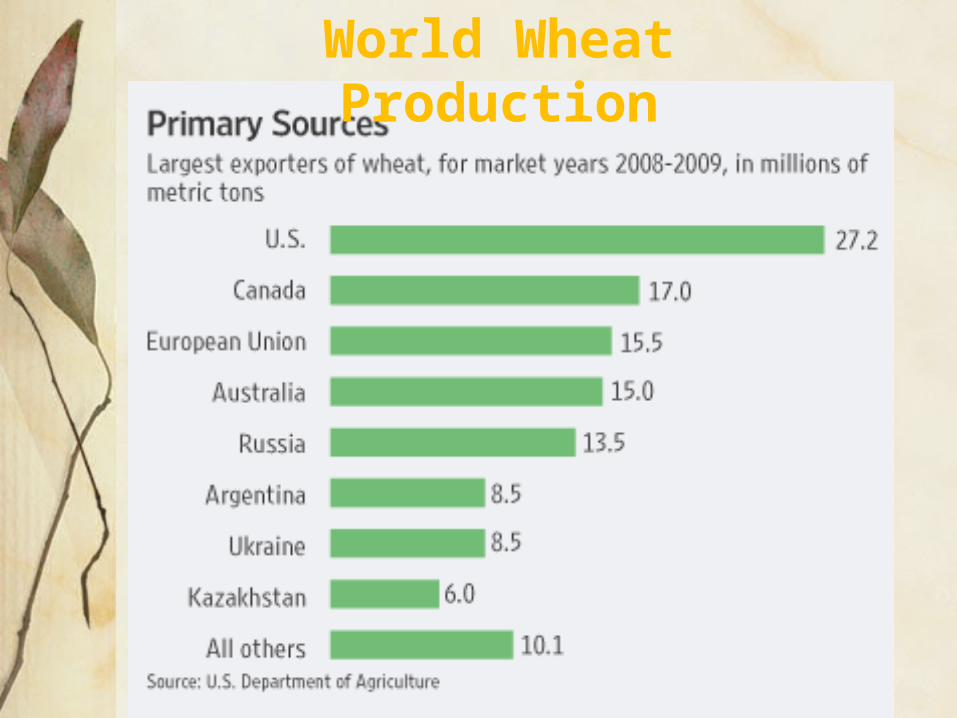
World Wheat Production
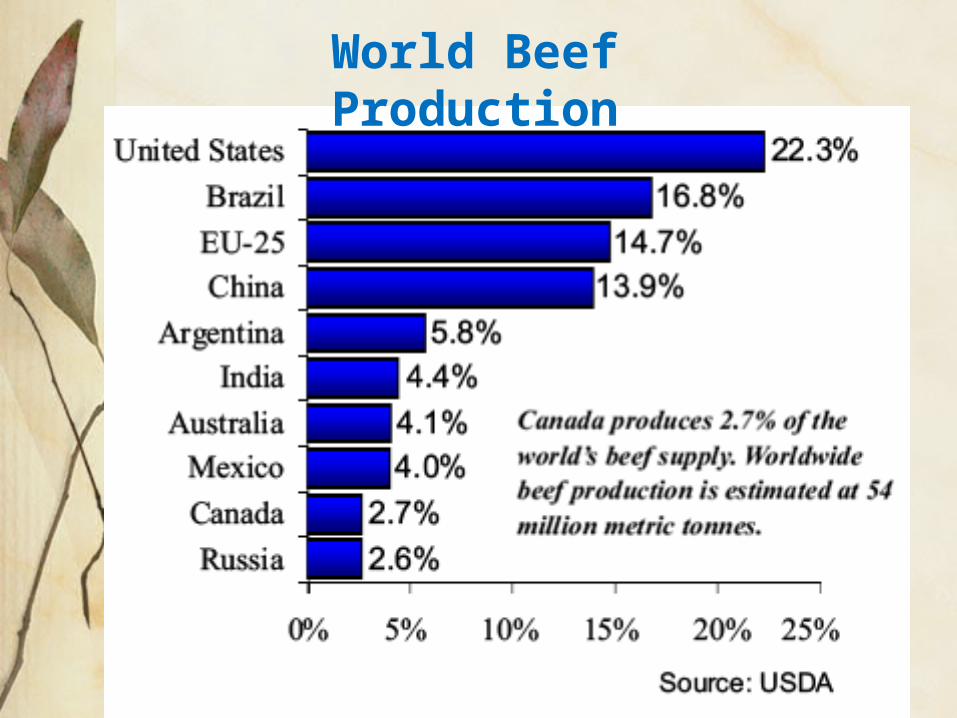
World Beef Production
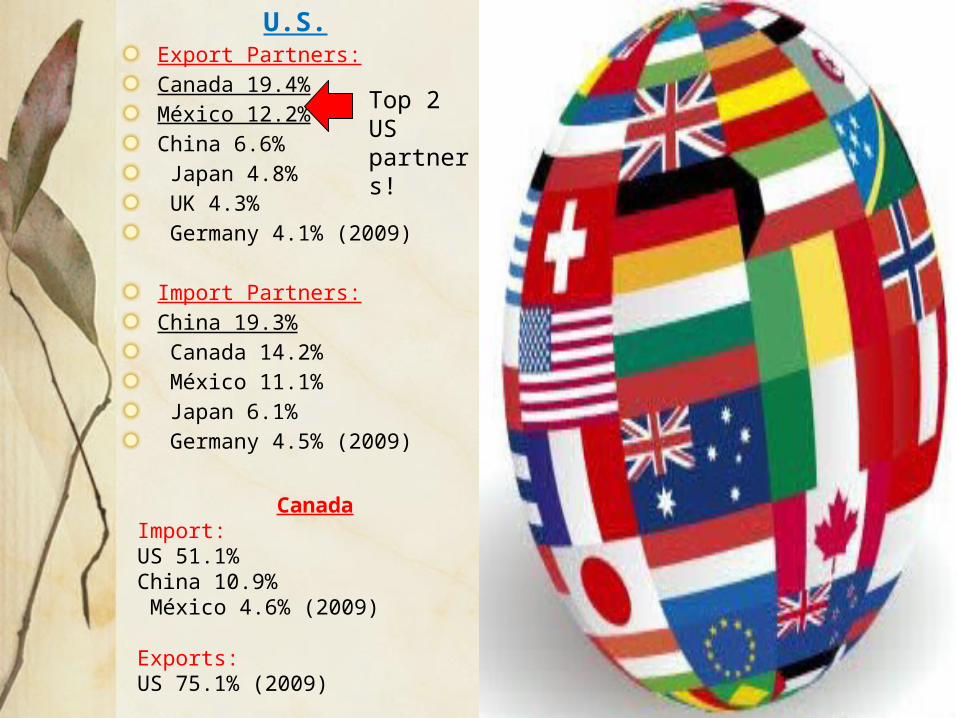
U.S.Export Partners:Canada 19.4%México 12.2%China 6.6% Japan 4.8% UK 4.3% Germany 4.1% (2009)
Import Partners:China 19.3% Canada 14.2% México 11.1% Japan 6.1% Germany 4.5% (2009)
CanadaImport:US 51.1%China 10.9% México 4.6% (2009)
Exports:US 75.1% (2009)
Top 2 US partners!
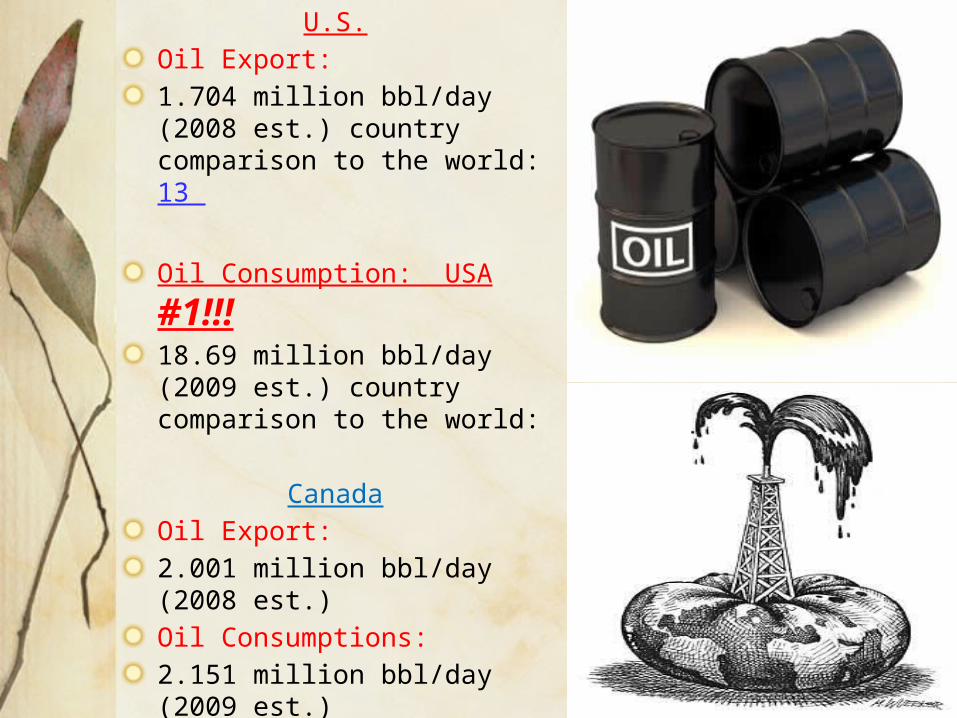
U.S.Oil Export:1.704 million bbl/day (2008 est.) country comparison to the world: 13
Oil Consumption: USA
#1!!!18.69 million bbl/day (2009 est.) country comparison to the world:
CanadaOil Export:2.001 million bbl/day (2008 est.)Oil Consumptions:2.151 million bbl/day (2009 est.)country comparison to the world: 11
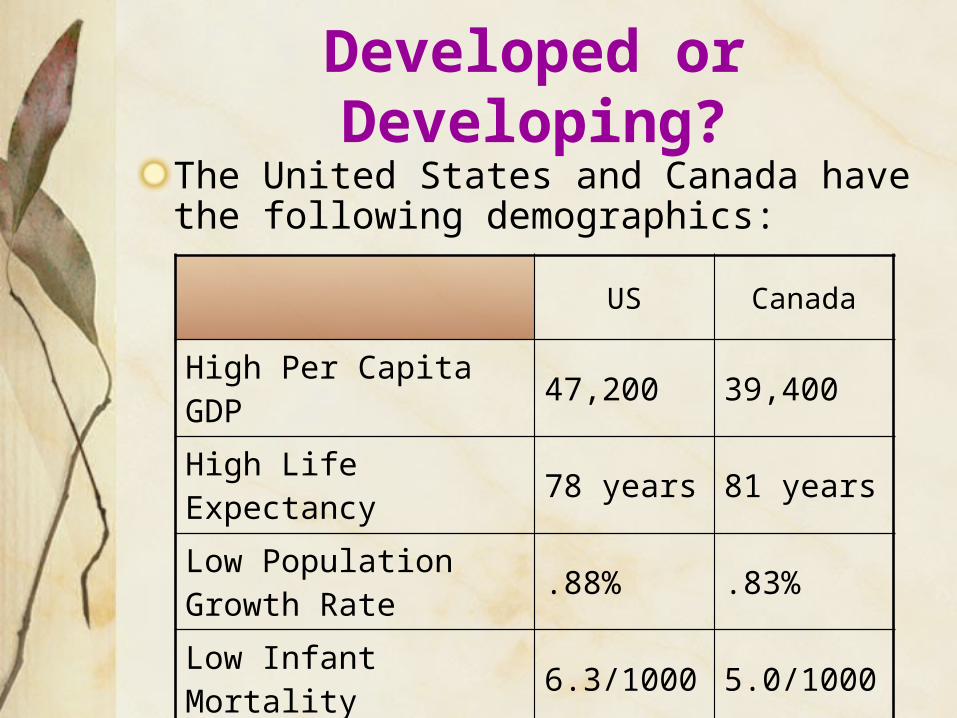
Developed or Developing?
The United States and Canada have the following demographics:
US Canada
High Per Capita GDP 47,200 39,400
High Life Expectancy 78 years 81 years
Low Population Growth Rate
.88% .83%
Low Infant Mortality 6.3/1000 5.0/1000

World Financial MarketsThe New York Stock Exchange is the center of
the world financial markets. Other countries have stock exchanges such as Japan, Germany, and England but due to the size and power of
the U.S. economy the NYSE affects all of them.

Economic Growth– The U.S. economy has experienced sustained economic growth
since WWII, but there is a widening gap between the rich and the poor. Basically, the richest people are getting richer and the poorest people are getting poorer.

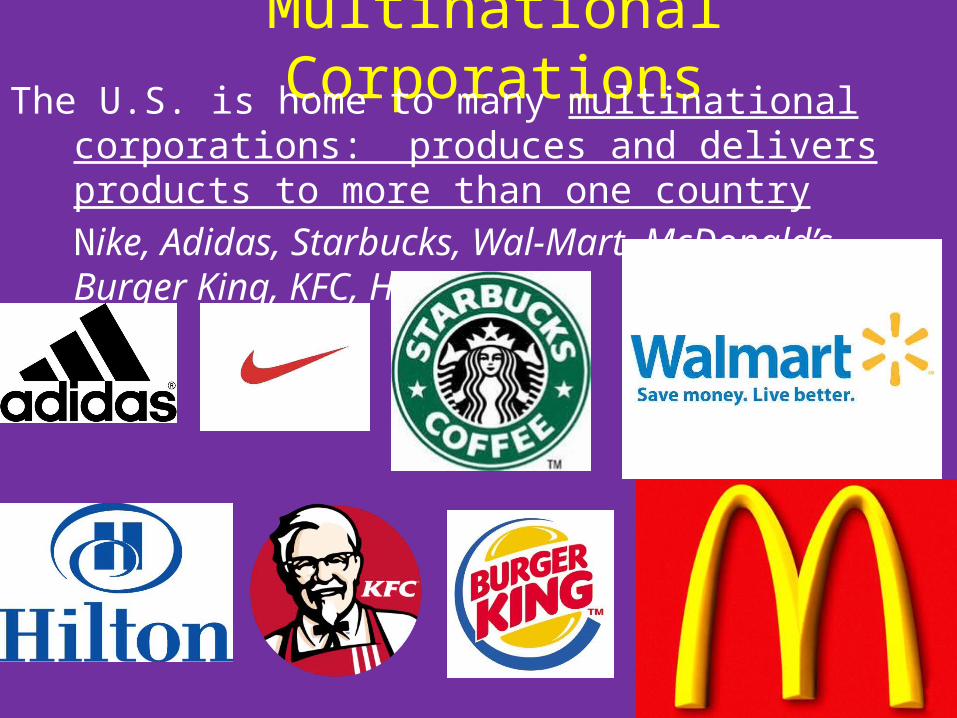
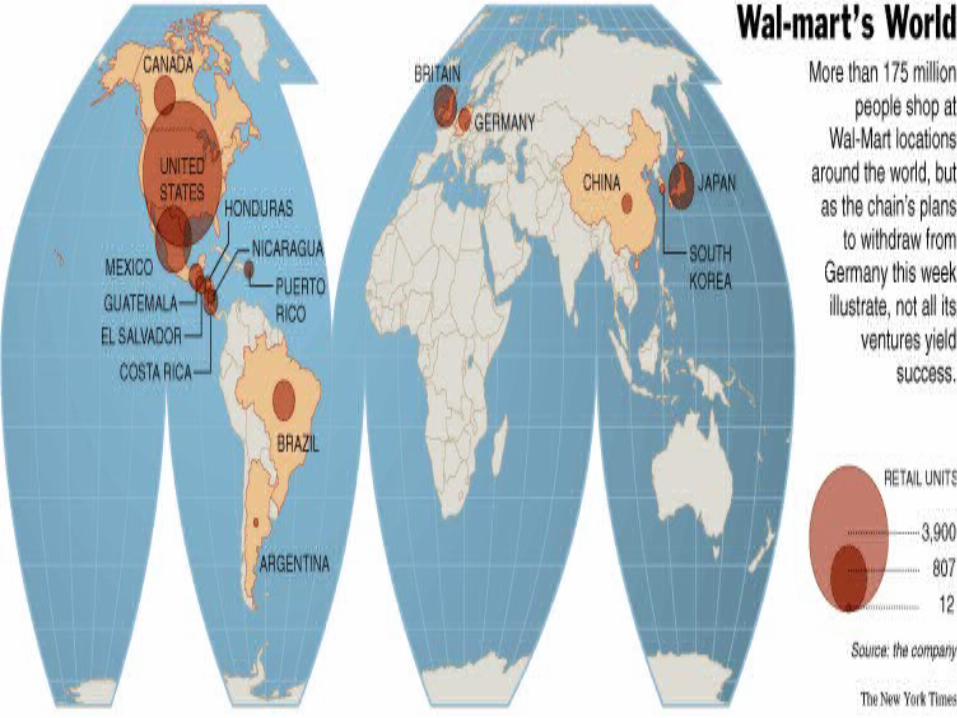
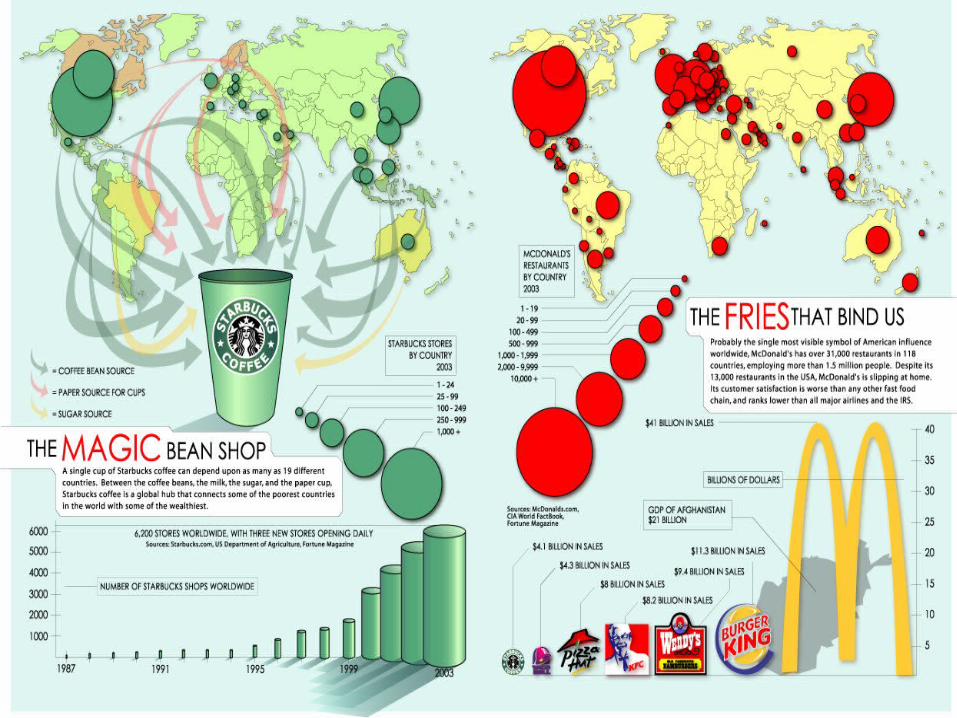
Multinational CorporationsThe U.S. is home to many multinational corporations:
produces and delivers products to more than one countryNike, Adidas, Starbucks, Wal-Mart, McDonald’s, Burger King, KFC, Hilton hotels
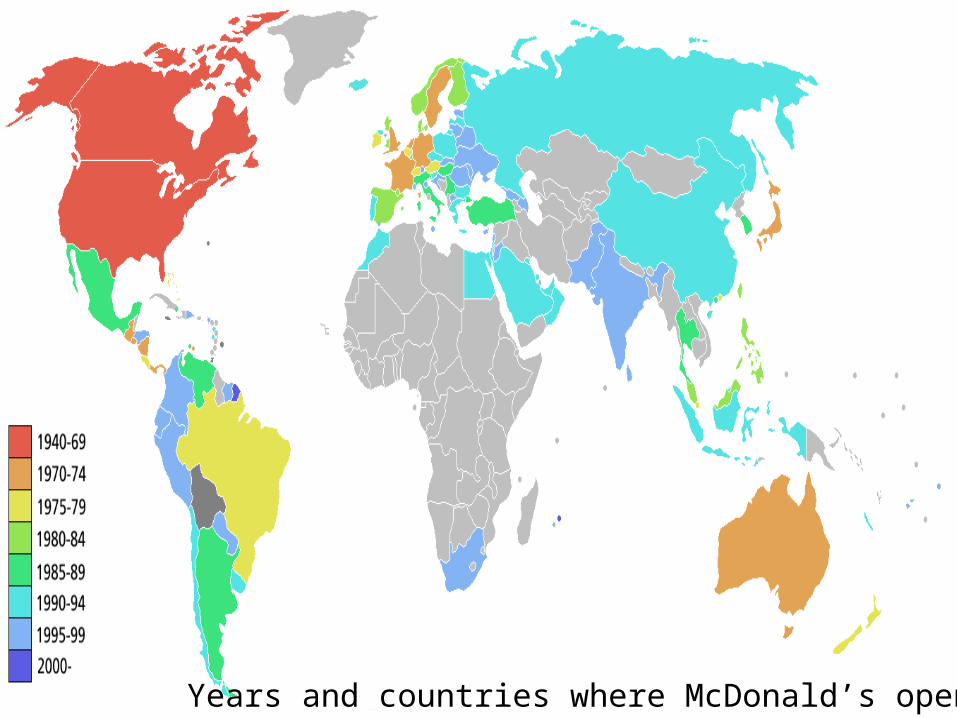
Years and countries where McDonald’s opened.
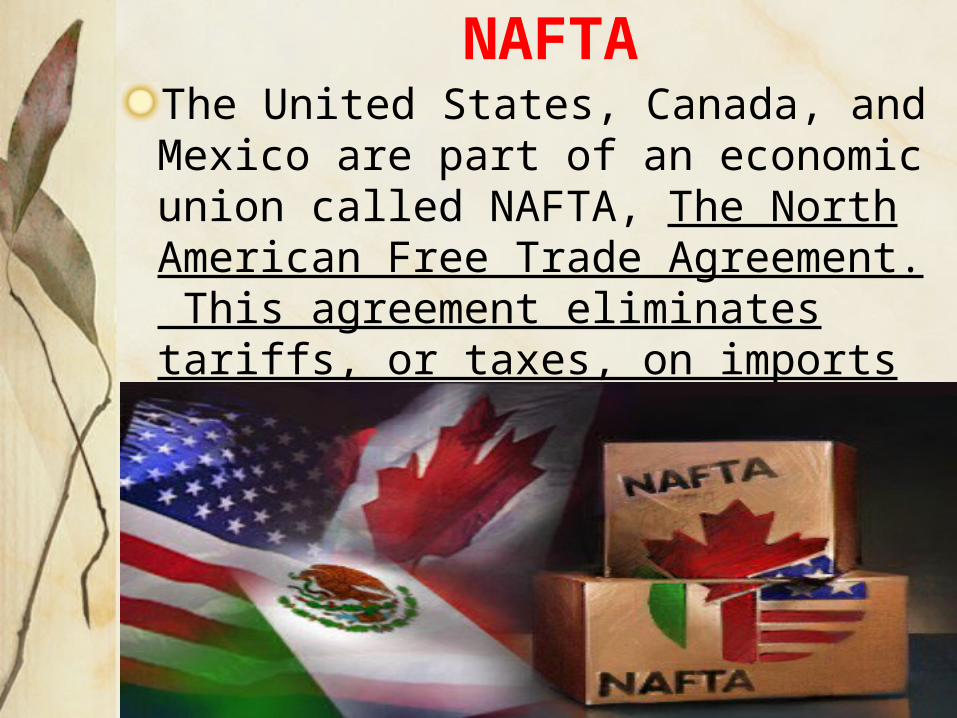
NAFTAThe United States, Canada, and Mexico are part of an economic union called NAFTA, The North American Free Trade Agreement. This agreement eliminates tariffs, or taxes, on imports between these three countries.