Embed Size (px)
Citation preview
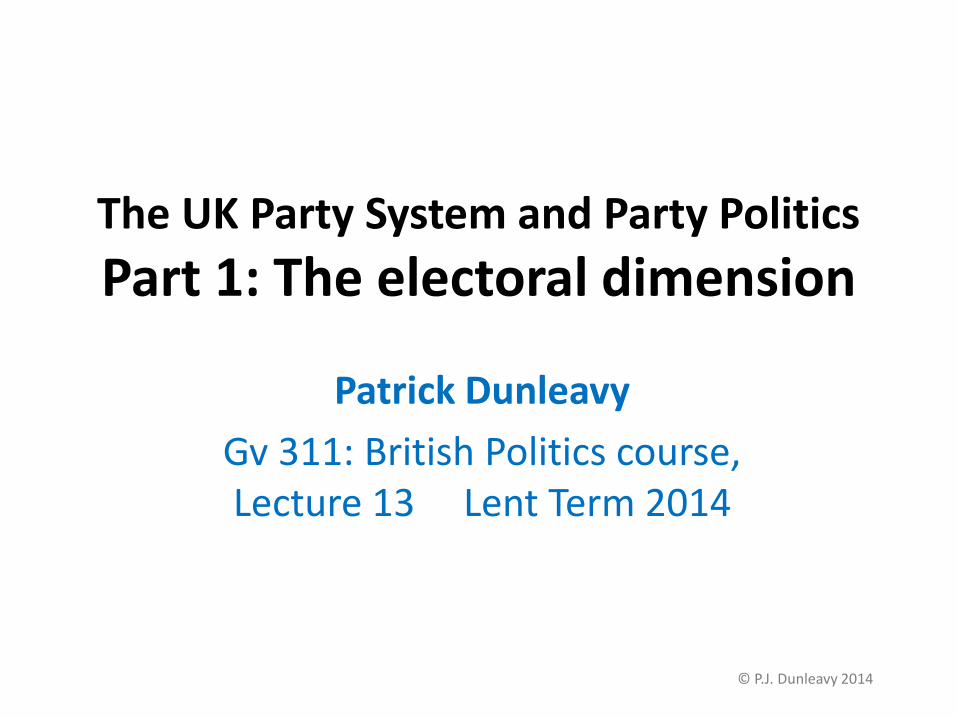
The UK Party System and Party Politics
Part 1: The electoral dimension
Patrick Dunleavy
Gv 311: British Politics course, Lecture 13 Lent Term 2014
© P.J. Dunleavy 2014
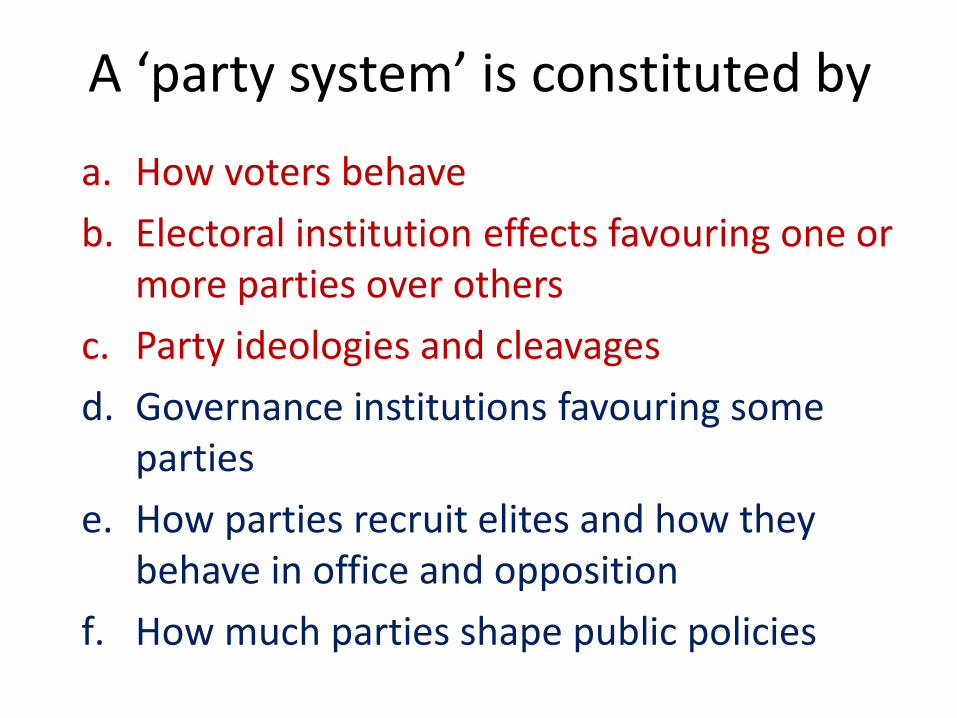
A ‘party system’ is constituted by
a. How voters behave
b. Electoral institution effects favouring one or more parties over others
c. Party ideologies and cleavages
d. Governance institutions favouring some parties
e. How parties recruit elites and how they behave in office and opposition
f. How much parties shape public policies
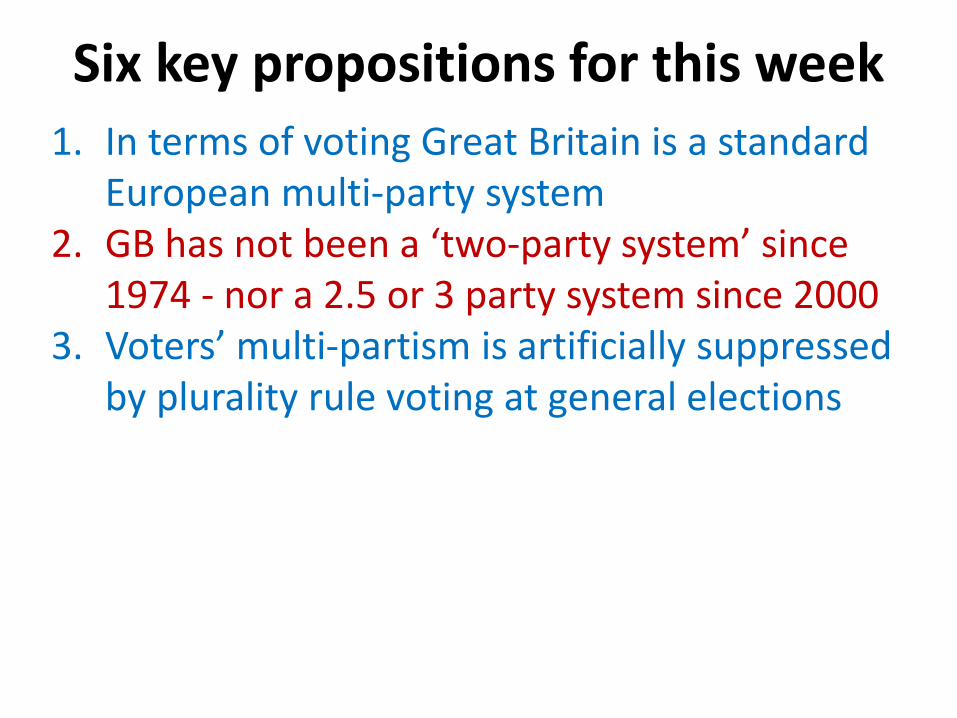
Six key propositions for this week
1. In terms of voting Great Britain is a standard European multi-party system
2. GB has not been a ‘two-party system’ since 1974 - nor a 2.5 or 3 party system since 2000
3. Voters’ multi-partism is artificially suppressed by plurality rule voting at general elections
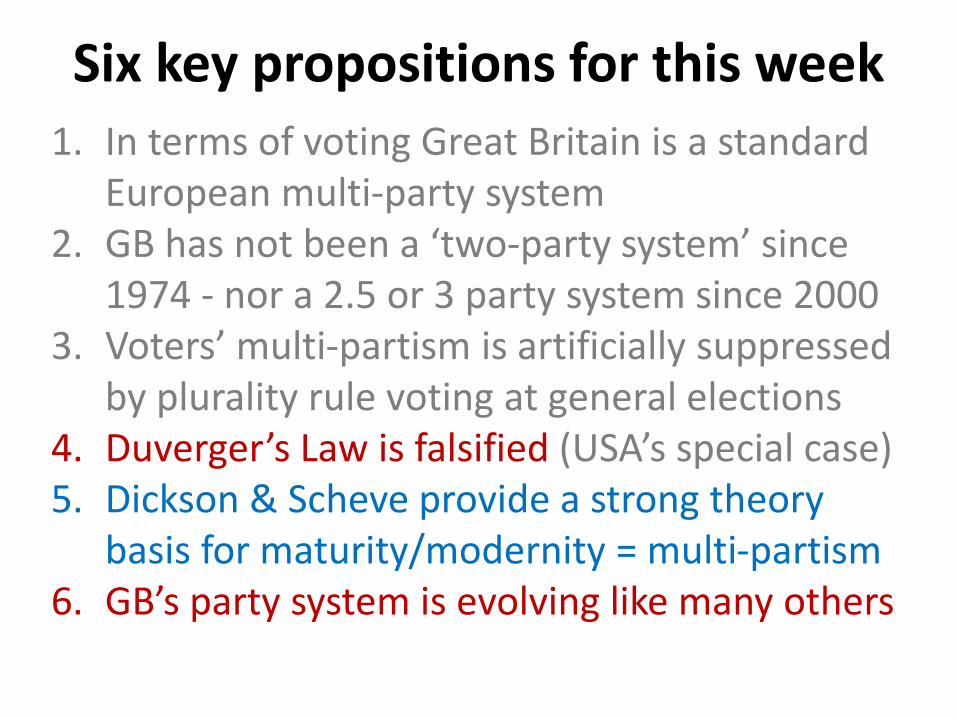
4. Duverger’s Law is falsified (USA’s special case)5. Dickson & Scheve provide a strong theory
basis for maturity/modernity = multi-partism6. GB’s party system is evolving like many others
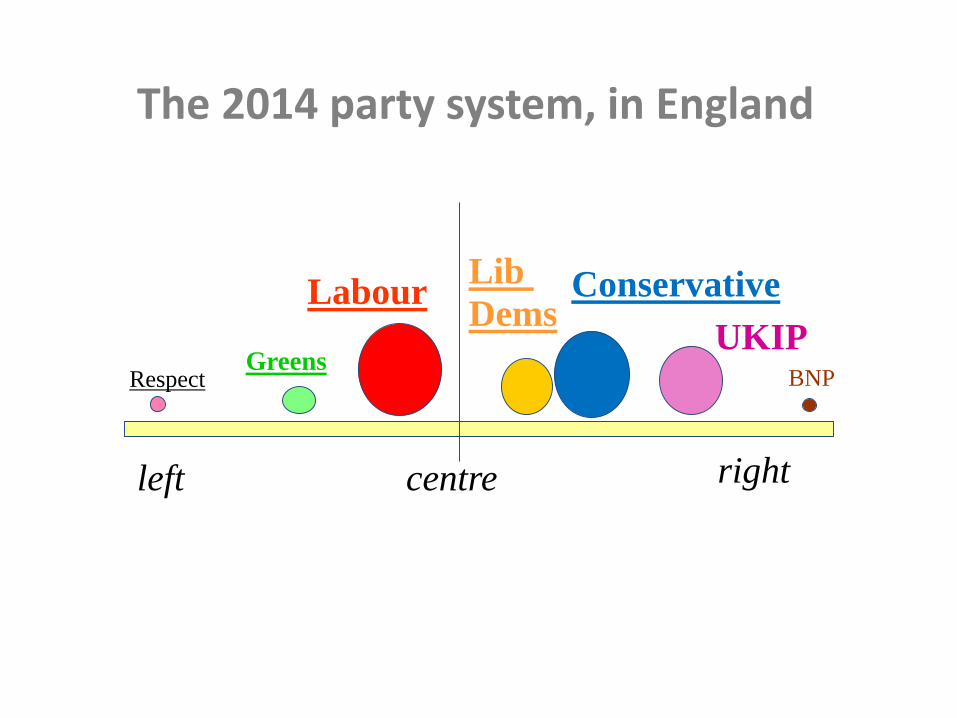
The 2014 party system, in England
Conservative
centre
LabourLib
Dems
BNPGreens
UKIP
left right
Respect
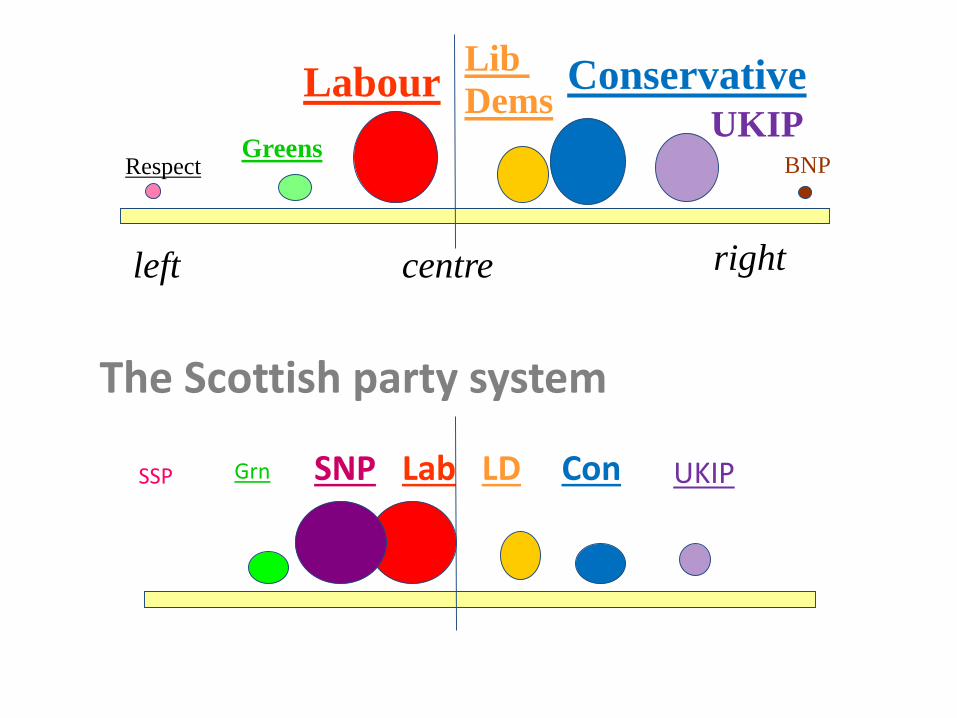
ConLab LDSNPSSP Grn
The Scottish party system
UKIP
Conservative
centre
LabourLib
Dems
BNPGreens
UKIP
left right
Respect
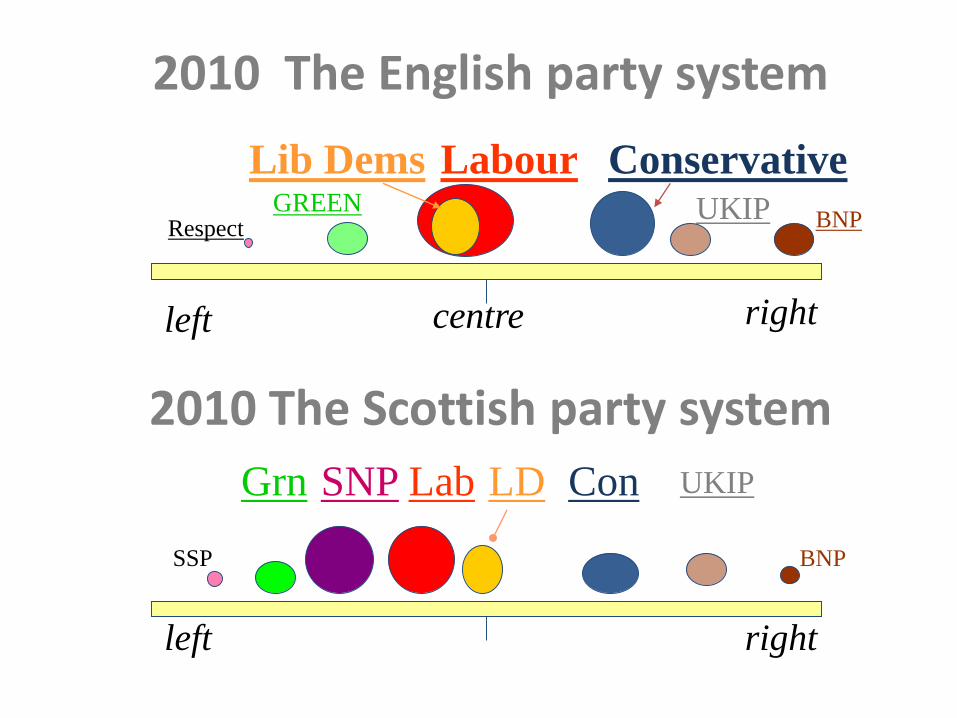
2010 The English party system
Conservative
centre
LabourLib Dems
ConLab LDSNPGrn
2010 The Scottish party system
BNPGREEN UKIP
UKIP
left
left
right
right
SSP
Respect
BNP
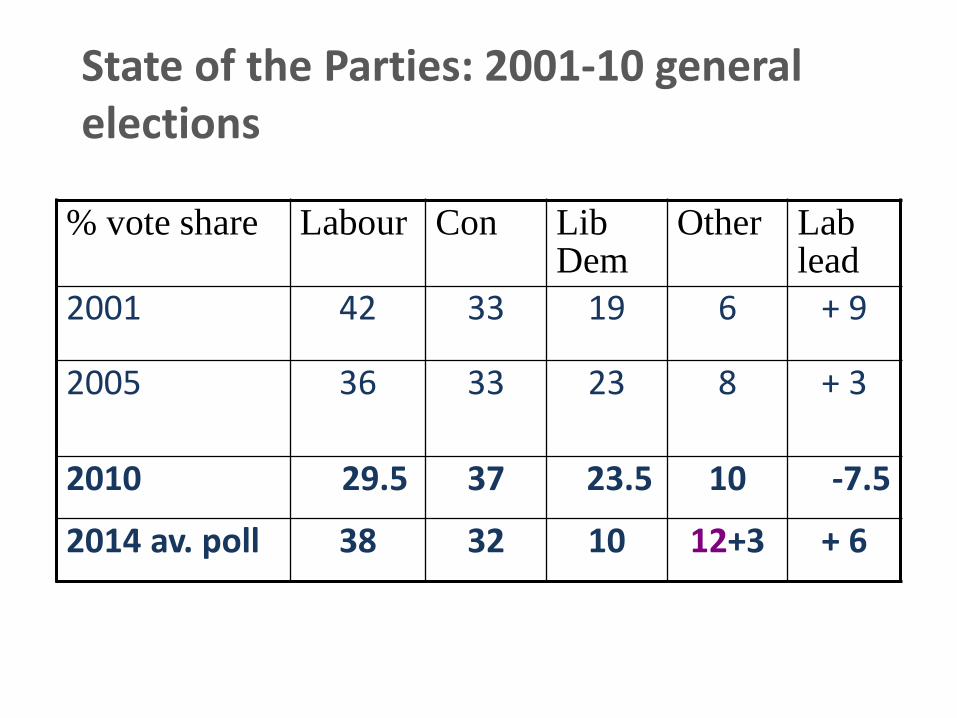
% vote share Labour Con Lib Dem
Other Lab lead
2001 42 33 19 6 + 9
2005 36 33 23 8 + 3
2010 29.5 37 23.5 10 -7.5
2014 av. poll 38 32 10 12+3 + 6
State of the Parties: 2001-10 general elections
Great Britain share of the
votes
%
votes
Change
in support
(% points)
since
2005
Compare
2005 %
vote
share
MPs in
2010
Other party
representation
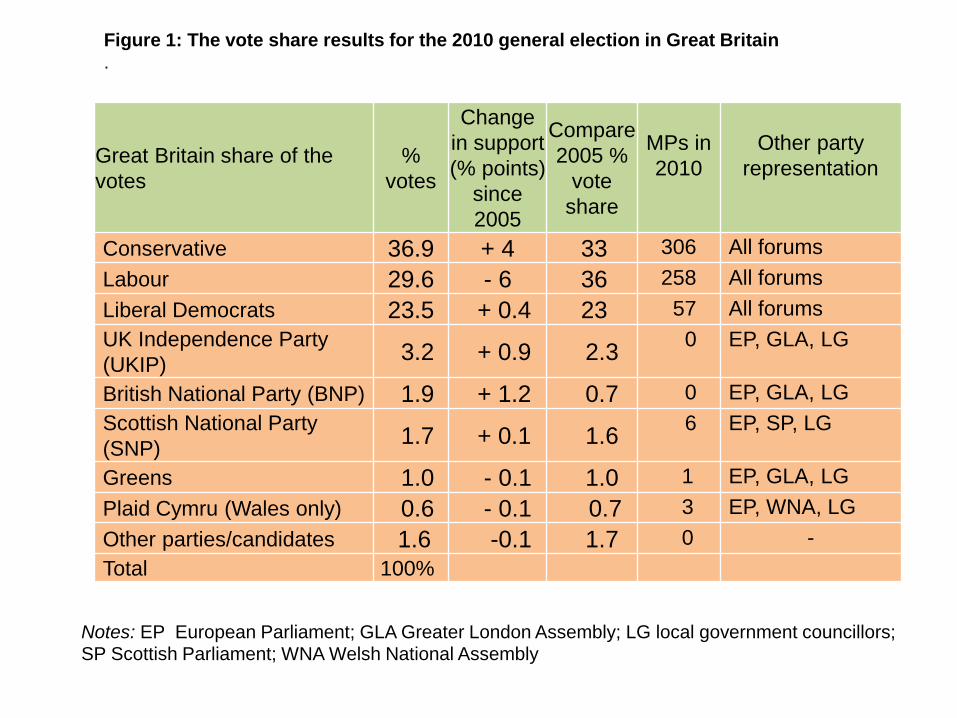
Conservative 36.9 + 4 33 306 All forums
Labour 29.6 - 6 36 258 All forums
Liberal Democrats 23.5 + 0.4 23 57 All forums
UK Independence Party
(UKIP)3.2 + 0.9 2.3
0 EP, GLA, LG
British National Party (BNP) 1.9 + 1.2 0.7 0 EP, GLA, LG
Scottish National Party
(SNP) 1.7 + 0.1 1.6
6 EP, SP, LG
Greens 1.0 - 0.1 1.0 1 EP, GLA, LG
Plaid Cymru (Wales only) 0.6 - 0.1 0.7 3 EP, WNA, LG
Other parties/candidates 1.6 -0.1 1.7 0 -
Total 100%
Figure 1: The vote share results for the 2010 general election in Great Britain
.
Notes: EP European Parliament; GLA Greater London Assembly; LG local government councillors; SP Scottish Parliament; WNA Welsh National Assembly
40
50
60
70
40
50
60
70
80
90
100
Com
bin
ed %
Con a
nd L
ab v
ote
s
1950 1955 1960 1965 1970 1975 1980 1985 1990 1995 2000 2005
Election year
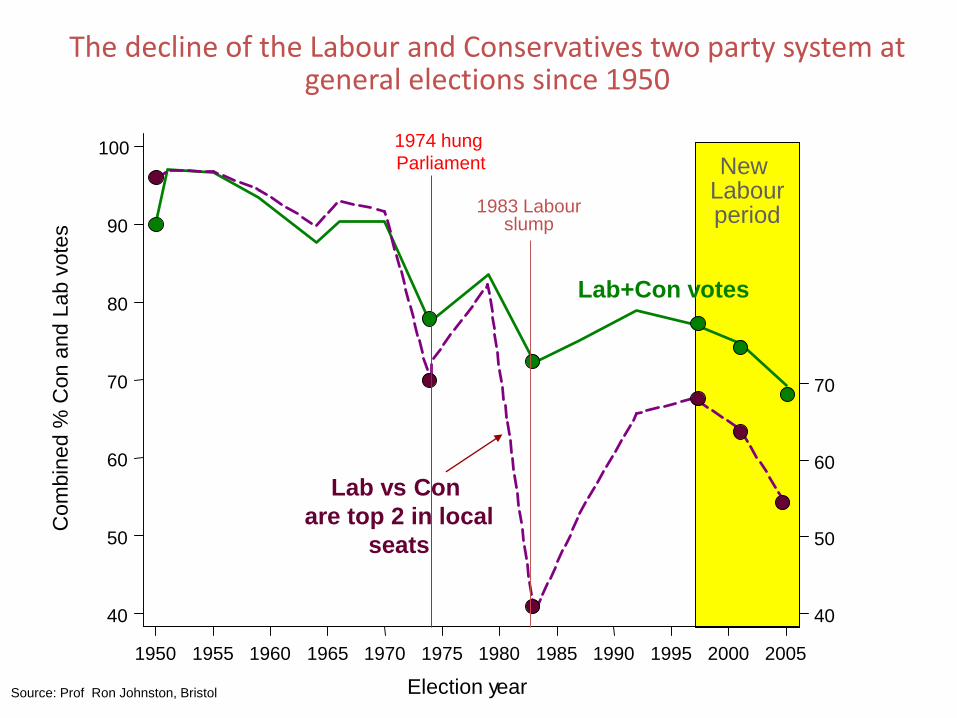
The decline of the Labour and Conservatives two party system at general elections since 1950
Lab vs Con
are top 2 in local
seats
Lab+Con votes
1974 hung
Parliament
1983 Labour slump
New Labourperiod
Source: Prof Ron Johnston, Bristol
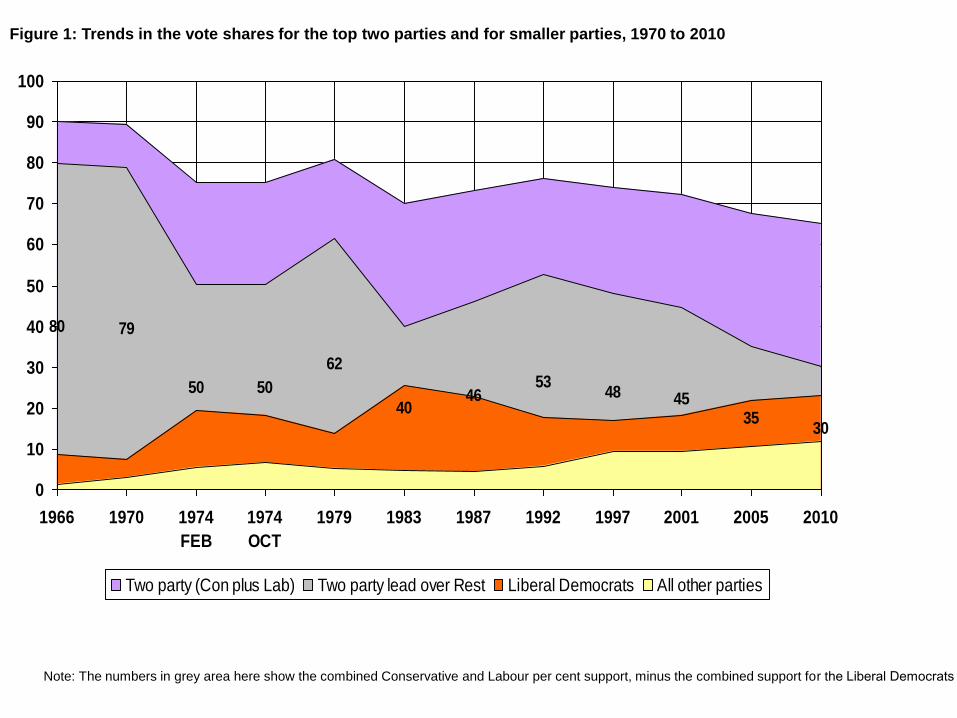
Figure 1: Trends in the vote shares for the top two parties and for smaller parties, 1970 to 2010
80 79
50 50
62
4046
5348 45
3530
0
10
20
30
40
50
60
70
80
90
100
1966 1970 1974
FEB
1974
OCT
1979 1983 1987 1992 1997 2001 2005 2010
Two party (Con plus Lab) Two party lead over Rest Liberal Democrats All other parties
Note: The numbers in grey area here show the combined Conservative and Labour per cent support, minus the combined support for the Liberal Democrats and all other parties, that is the ‘two party lead over the Rest’.
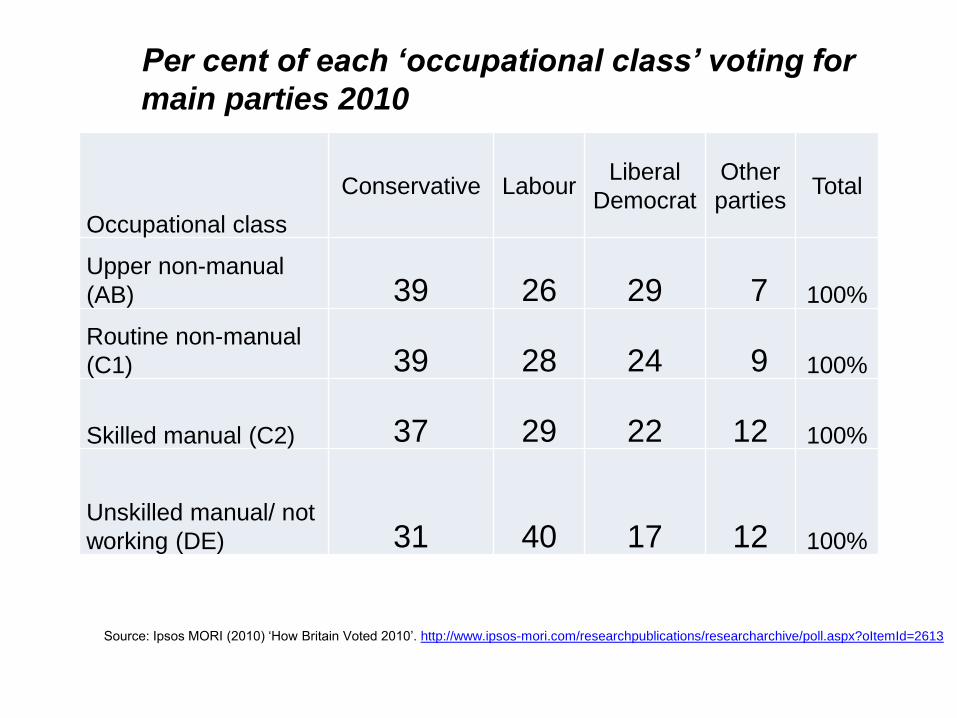
Occupational class
Conservative LabourLiberal
Democrat
Other
partiesTotal
Upper non-manual
(AB) 39 26 29 7 100%
Routine non-manual
(C1) 39 28 24 9 100%
Skilled manual (C2) 37 29 22 12 100%
Unskilled manual/ not
working (DE) 31 40 17 12 100%
Per cent of each ‘occupational class’ voting for
main parties 2010
Source: Ipsos MORI (2010) ‘How Britain Voted 2010’. http://www.ipsos-mori.com/researchpublications/researcharchive/poll.aspx?oItemId=2613
Institutional factors supporting the top two parties,despite voters’ changing view
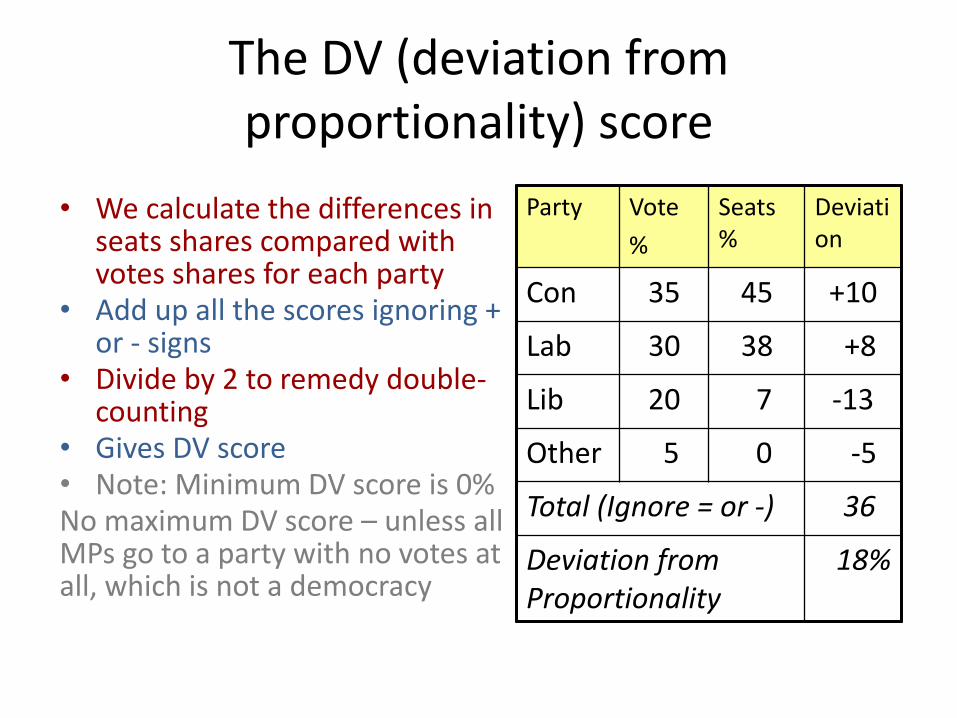
The DV (deviation from proportionality) score
• We calculate the differences in seats shares compared with votes shares for each party
• Add up all the scores ignoring + or - signs
• Divide by 2 to remedy double-counting
• Gives DV score• Note: Minimum DV score is 0%No maximum DV score – unless all MPs go to a party with no votes at all, which is not a democracy
Party Vote
%
Seats %
Deviation
Con 35 45 +10
Lab 30 38 +8
Lib 20 7 -13
Other 5 0 -5
Total (Ignore = or -) 36
Deviation from Proportionality
18%
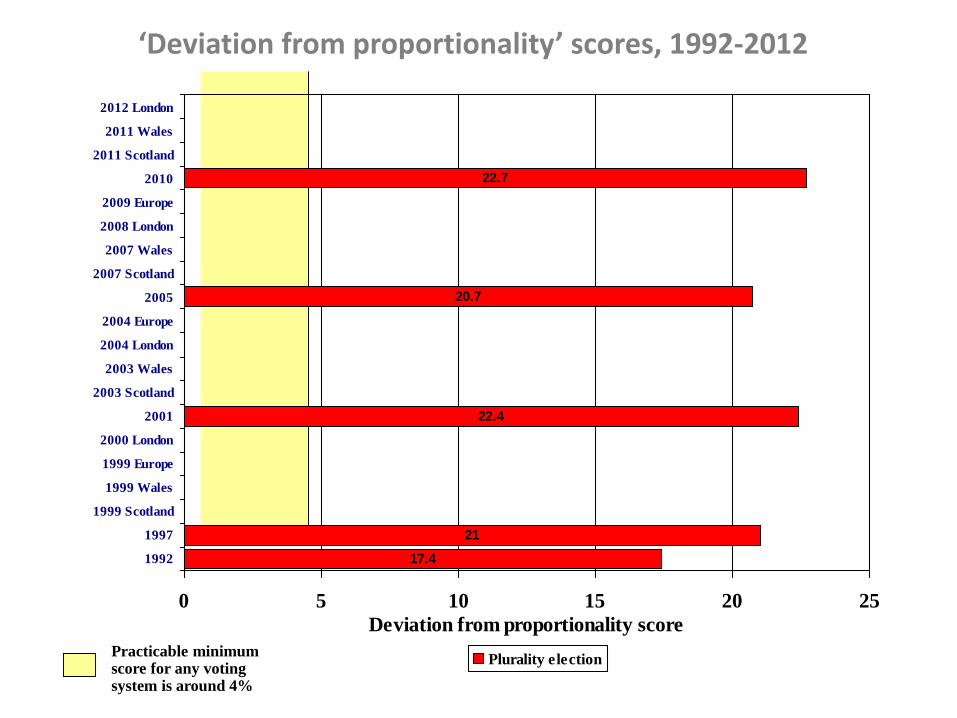
‘Deviation from proportionality’ scores, 1992-2012
Practicable minimum score for any votingsystem is around 4%
17.4
21
22.4
20.7
22.7
0 5 10 15 20 25
1992
1997
1999 Scotland
1999 Wales
1999 Europe
2000 London
2001
2003 Scotland
2003 Wales
2004 London
2004 Europe
2005
2007 Scotland
2007 Wales
2008 London
2009 Europe
2010
2011 Scotland
2011 Wales
2012 London
Deviation from proportionality score
Plurality election
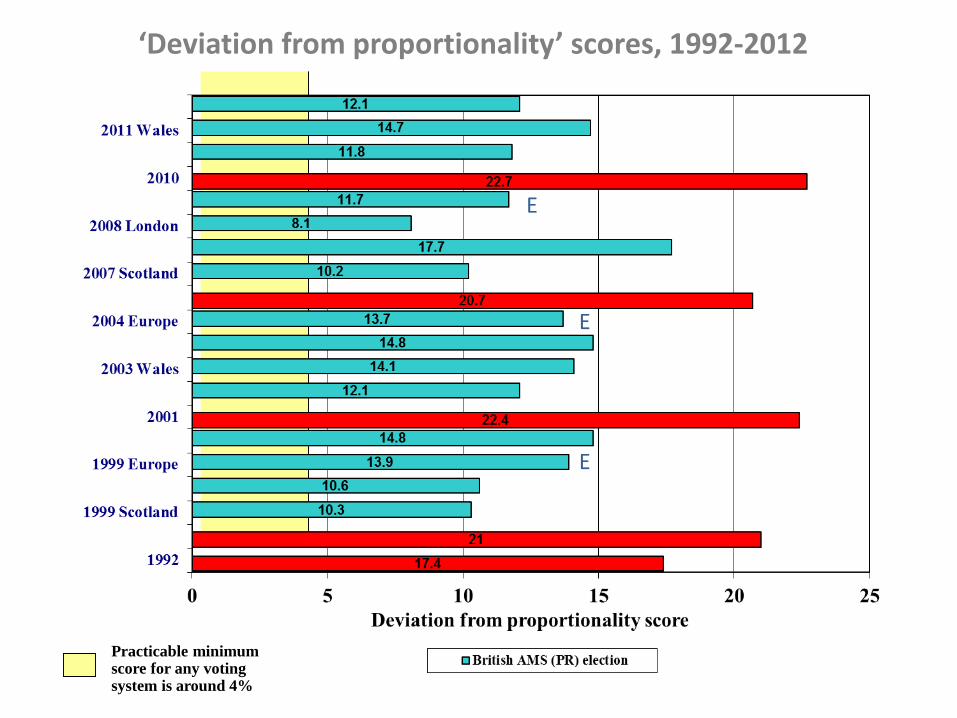
‘Deviation from proportionality’ scores, 1992-2012
Practicable minimum score for any votingsystem is around 4%
E
E
E
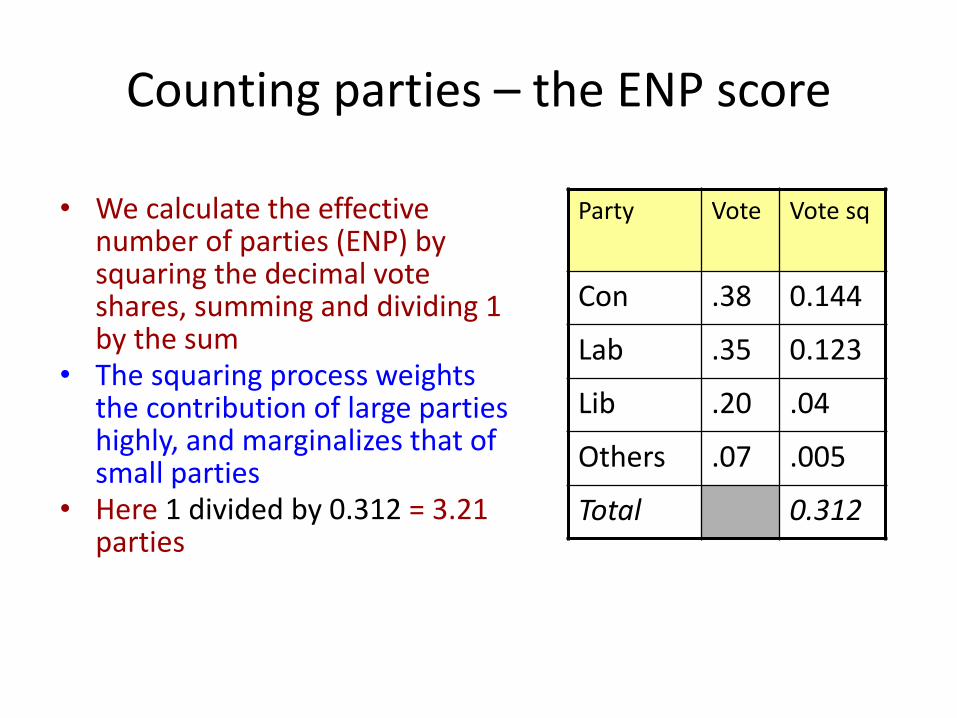
Counting parties – the ENP score
• We calculate the effective number of parties (ENP) by squaring the decimal vote shares, summing and dividing 1 by the sum
• The squaring process weights the contribution of large parties highly, and marginalizes that of small parties
• Here 1 divided by 0.312 = 3.21 parties
Party Vote Vote sq
Con .38 0.144
Lab .35 0.123
Lib .20 .04
Others .07 .005
Total 0.312
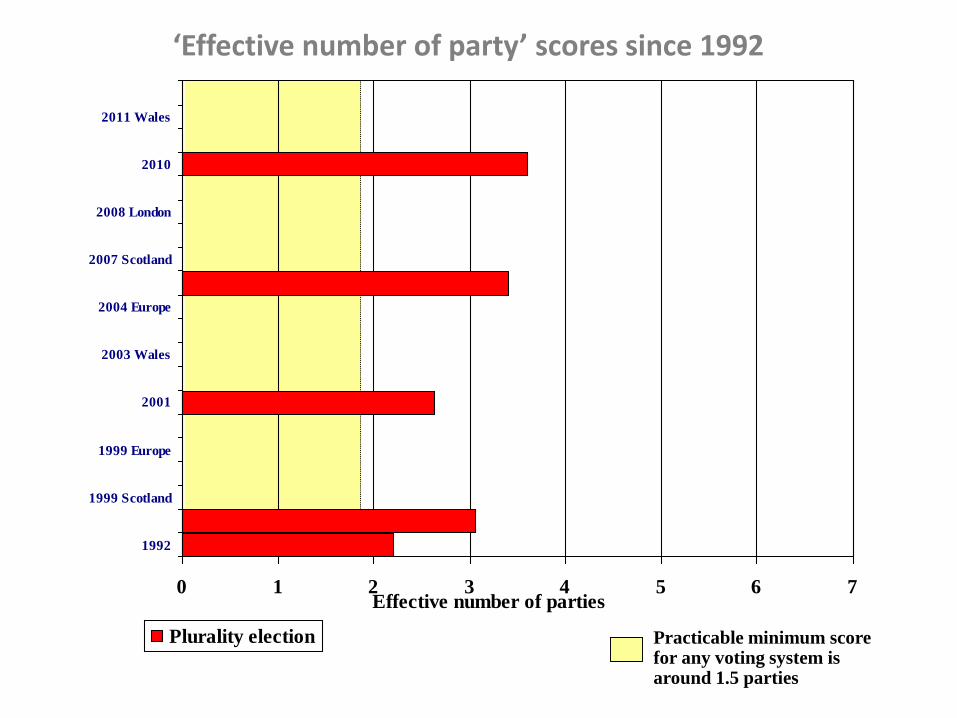
‘Effective number of party’ scores since 1992
Practicable minimum score for any voting system is around 1.5 parties
0 1 2 3 4 5 6 7
1992
1999 Scotland
1999 Europe
2001
2003 Wales
2004 Europe
2007 Scotland
2008 London
2010
2011 Wales
Effective number of parties
Plurality election
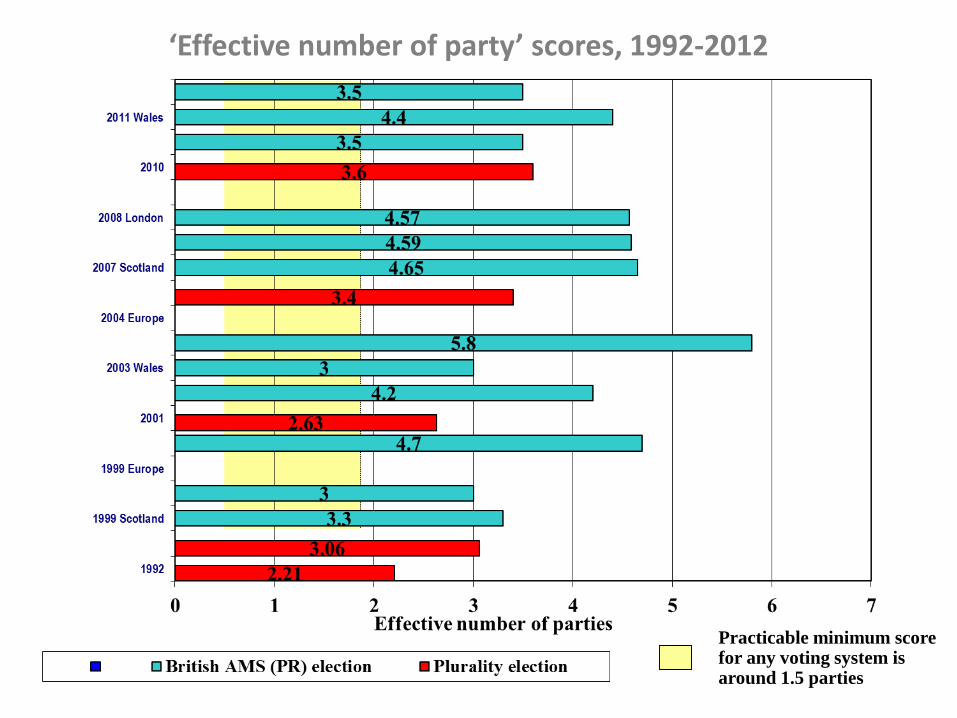
‘Effective number of party’ scores, 1992-2012
Practicable minimum score for any voting system is around 1.5 parties
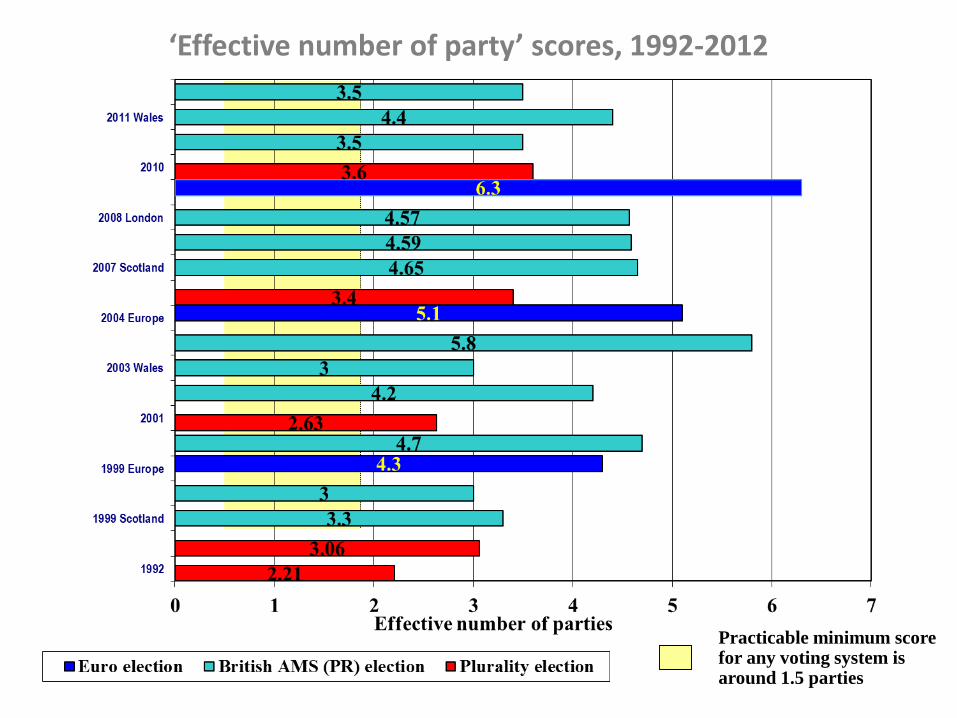
‘Effective number of party’ scores, 1992-2012
Practicable minimum score for any voting system is around 1.5 parties
Duverger’s Law and the modernization of party systems
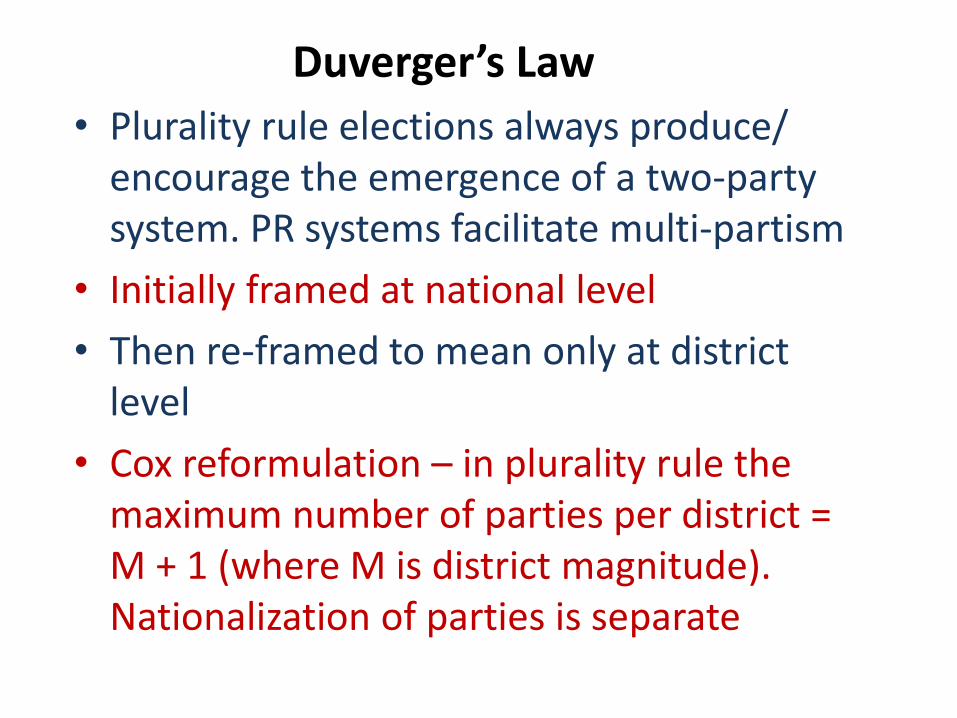
• Plurality rule elections always produce/ encourage the emergence of a two-party system. PR systems facilitate multi-partism
• Initially framed at national level
• Then re-framed to mean only at district level
• Cox reformulation – in plurality rule the maximum number of parties per district = M + 1 (where M is district magnitude). Nationalization of parties is separate
Duverger’s Law
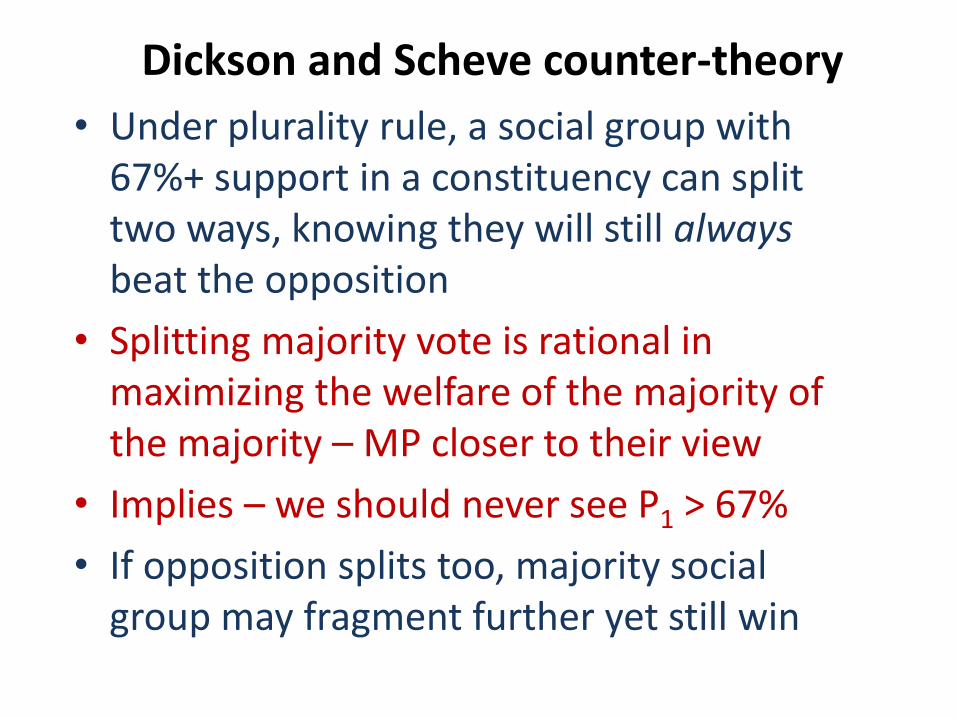
• Under plurality rule, a social group with 67%+ support in a constituency can split two ways, knowing they will still alwaysbeat the opposition
• Splitting majority vote is rational in maximizing the welfare of the majority of the majority – MP closer to their view
• Implies – we should never see P1 > 67%
• If opposition splits too, majority social group may fragment further yet still win
Dickson and Scheve counter-theory
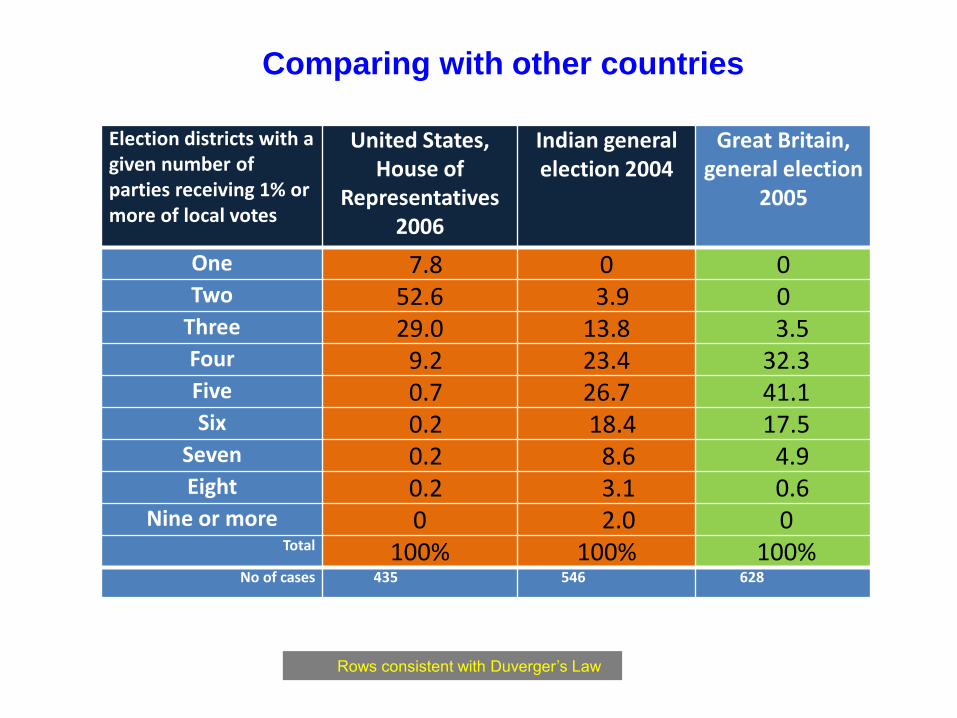
Rows consistent with Duverger’s Law
Comparing with other countries
Election districts with a given number of parties receiving 1% or more of local votes
United States, House of
Representatives 2006
Indian general election 2004
Great Britain, general election
2005
One 7.8 0 0Two 52.6 3.9 0
Three 29.0 13.8 3.5Four 9.2 23.4 32.3Five 0.7 26.7 41.1Six 0.2 18.4 17.5
Seven 0.2 8.6 4.9Eight 0.2 3.1 0.6
Nine or more 0 2.0 0Total 100% 100% 100%
No of cases 435 546 628
0
10
20
30
40
50
60
70
80
90
100
-100 -90 -80 -70 -60 -50 -40 -30 -20 -10 0 10 20 30 40 50 60 70 80 90 100To
tal vo
te f
or
all o
ther
part
ies in
each
ele
cto
ral
dis
tric
t
Top national party lead over second national party in each electoral district
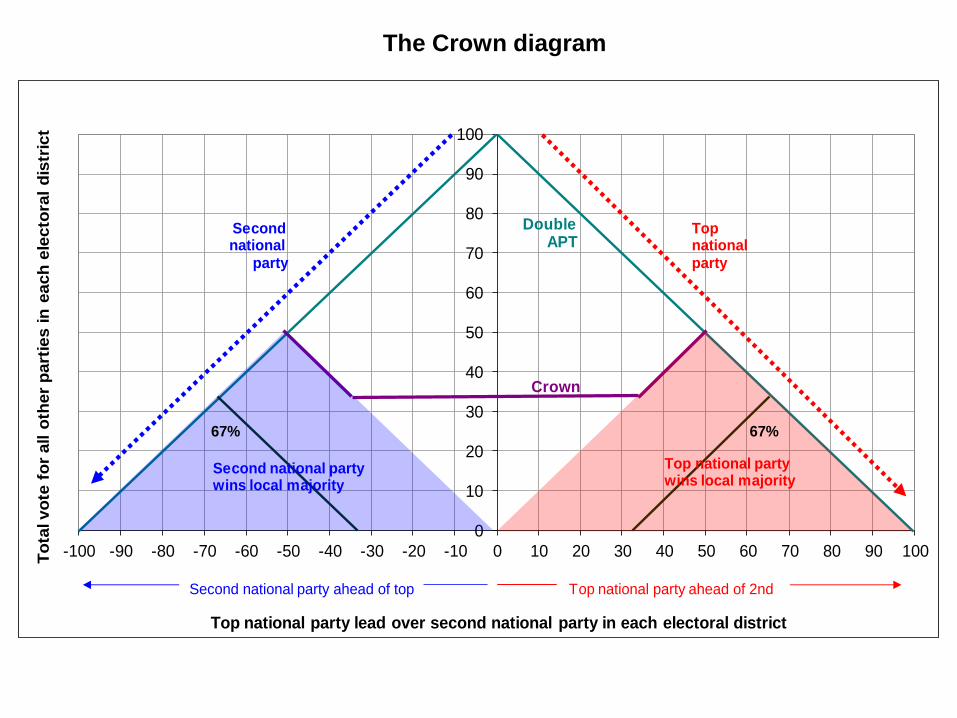
Double APT
Crown
Top national party ahead of 2nd Second national party ahead of top
67% 67%
Second national
party
Topnational party
Second national party wins local majority
Top national partywins local majority
The Crown diagram
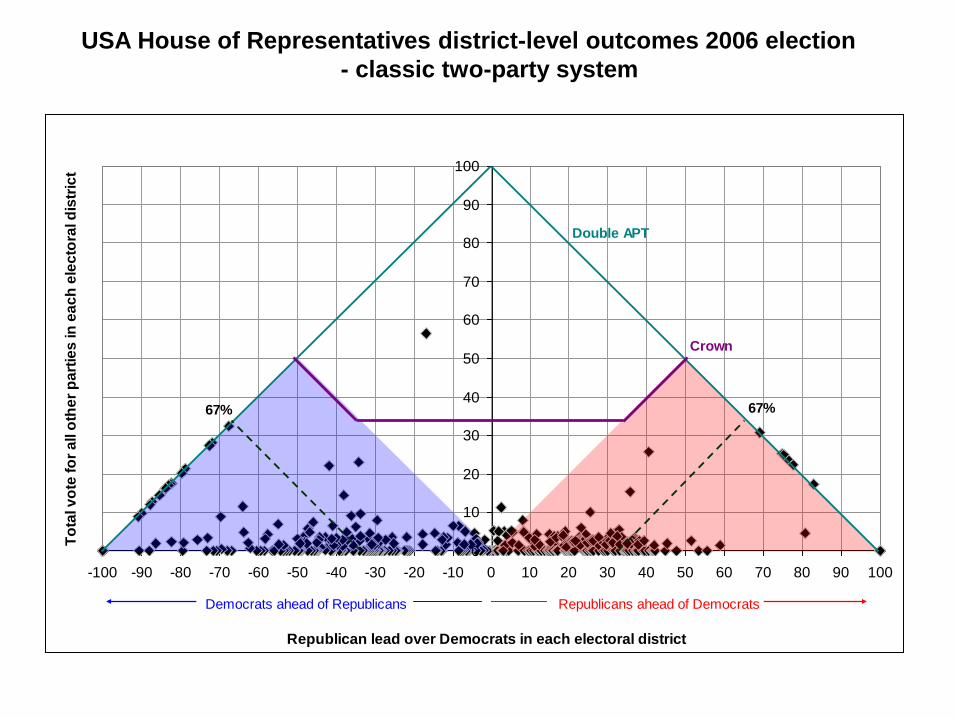
USA House of Representatives district-level outcomes 2006 election
- classic two-party system
0
10
20
30
40
50
60
70
80
90
100
-100 -90 -80 -70 -60 -50 -40 -30 -20 -10 0 10 20 30 40 50 60 70 80 90 100
Republican lead over Democrats in each electoral district
To
tal v
ote
fo
r a
ll o
the
r p
art
ies
in
ea
ch
ele
cto
ral d
istr
ict
Double APT
Crown
Republicans ahead of DemocratsDemocrats ahead of Republicans
67%67%
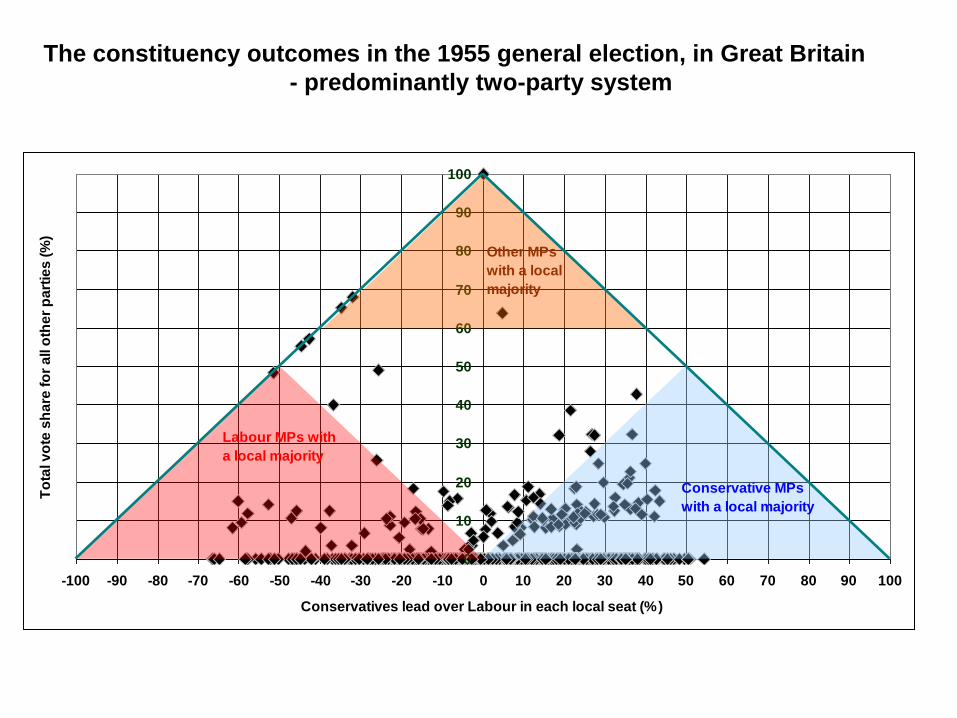
The constituency outcomes in the 1955 general election, in Great Britain
- predominantly two-party system
0
10
20
30
40
50
60
70
80
90
100
-100 -90 -80 -70 -60 -50 -40 -30 -20 -10 0 10 20 30 40 50 60 70 80 90 100
Conservatives lead over Labour in each local seat (%)
To
tal v
ote
sh
are
fo
r a
ll o
the
r p
art
ies
(%
)
Conservative MPs
with a local majority
Labour MPs with
a local majority
Other MPs
with a local
majority
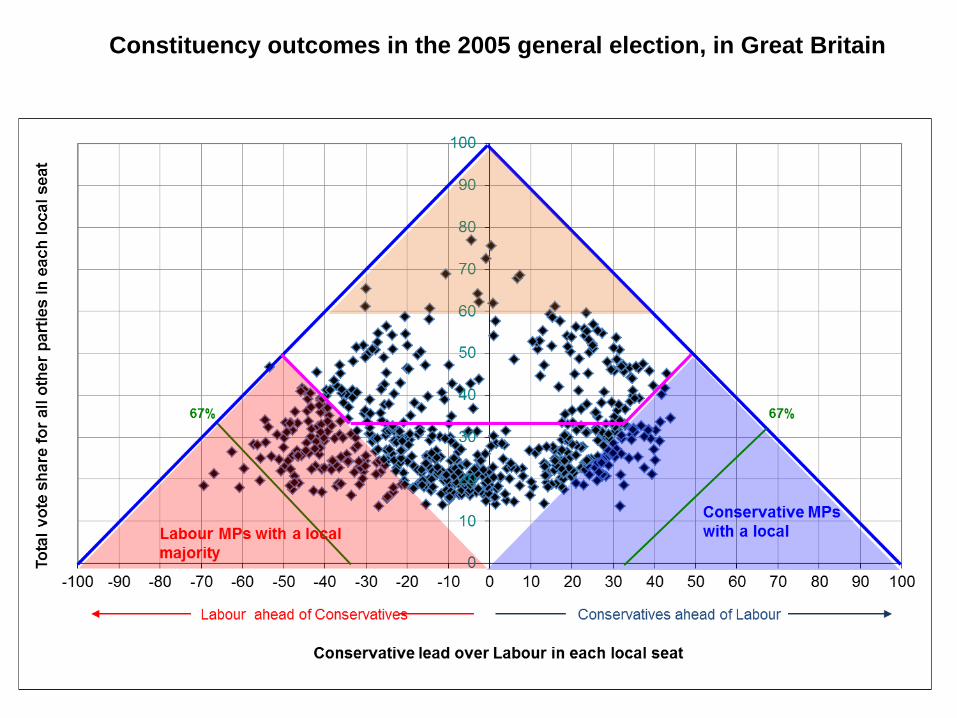
Constituency outcomes in the 2005 general election, in Great Britain
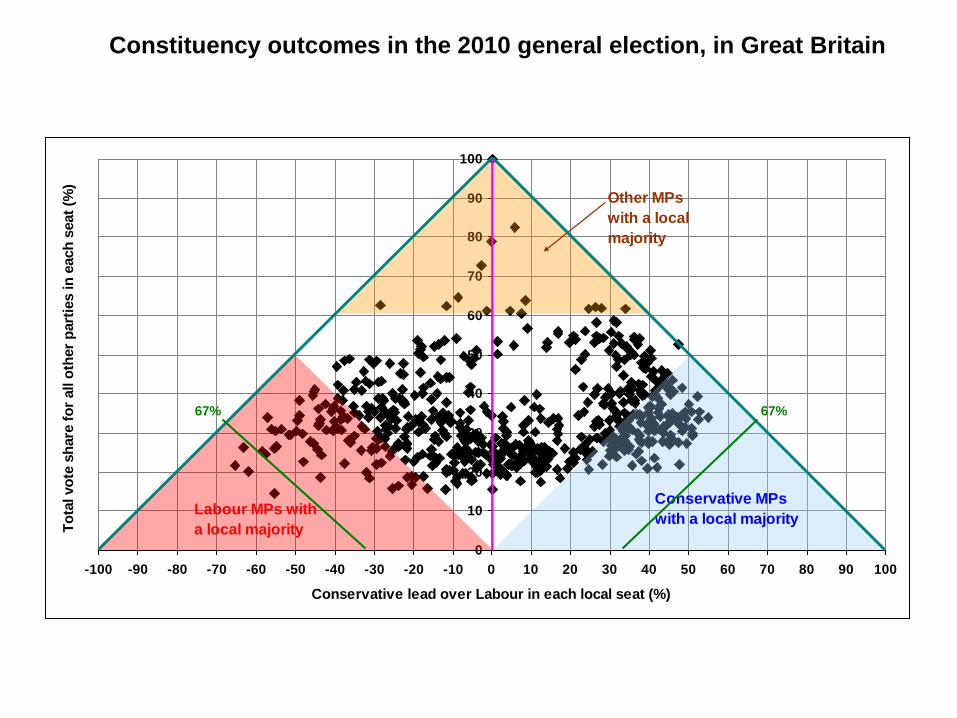
Constituency outcomes in the 2010 general election, in Great Britain
0
10
20
30
40
50
60
70
80
90
100
-100 -90 -80 -70 -60 -50 -40 -30 -20 -10 0 10 20 30 40 50 60 70 80 90 100
Conservative lead over Labour in each local seat (%)
To
tal vo
te s
hare
fo
r all o
ther
part
ies in
each
seat
(%)
Labour MPs with
a local majority
Conservative MPs
with a local majority
Other MPs
with a local
majority
67%67%
0
10
20
30
40
50
60
70
80
90
100
-100 -90 -80 -70 -60 -50 -40 -30 -20 -10 0 10 20 30 40 50 60 70 80 90 100
Conservative lead over Labour in each local seat (%)
on
serv
ati
ve lead
over
Lab
ou
r in
each
lo
cal seat
(%)
Conservative MPs
with a local majority
Labour MPs with
a local majority
0
10
20
30
40
50
60
70
80
90
100
-100 -90 -80 -70 -60 -50 -40 -30 -20 -10 0 10 20 30 40 50 60 70 80 90 100
Conservative MPs
with a local majority
Labour MPs with
a local majority
0
10
20
30
40
50
60
70
80
90
100
-100 -90 -80 -70 -60 -50 -40 -30 -20 -10 0 10 20 30 40 50 60 70 80 90 100
Conservative MPs
with a local majority
Labour MPs with
a local majority
0
10
20
30
40
50
60
70
80
90
100
-100 -90 -80 -70 -60 -50 -40 -30 -20 -10 0 10 20 30 40 50 60 70 80 90 100
Conservative MPs
with a local majority
Labour MPs with
a local majority
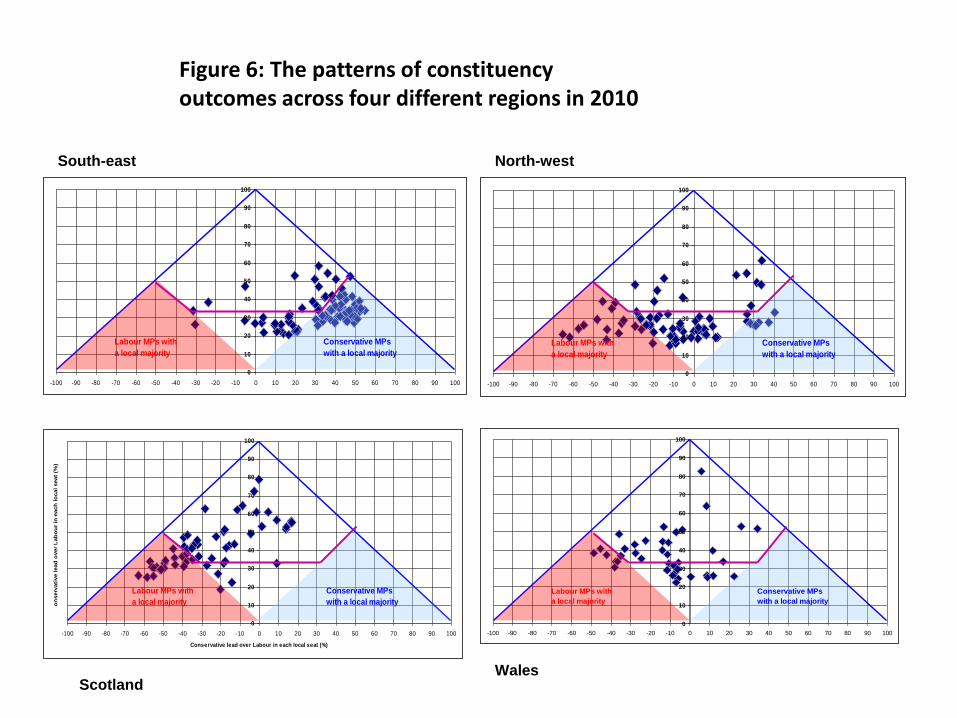
South-east North-west
ScotlandWales
Figure 6: The patterns of constituency outcomes across four different regions in 2010
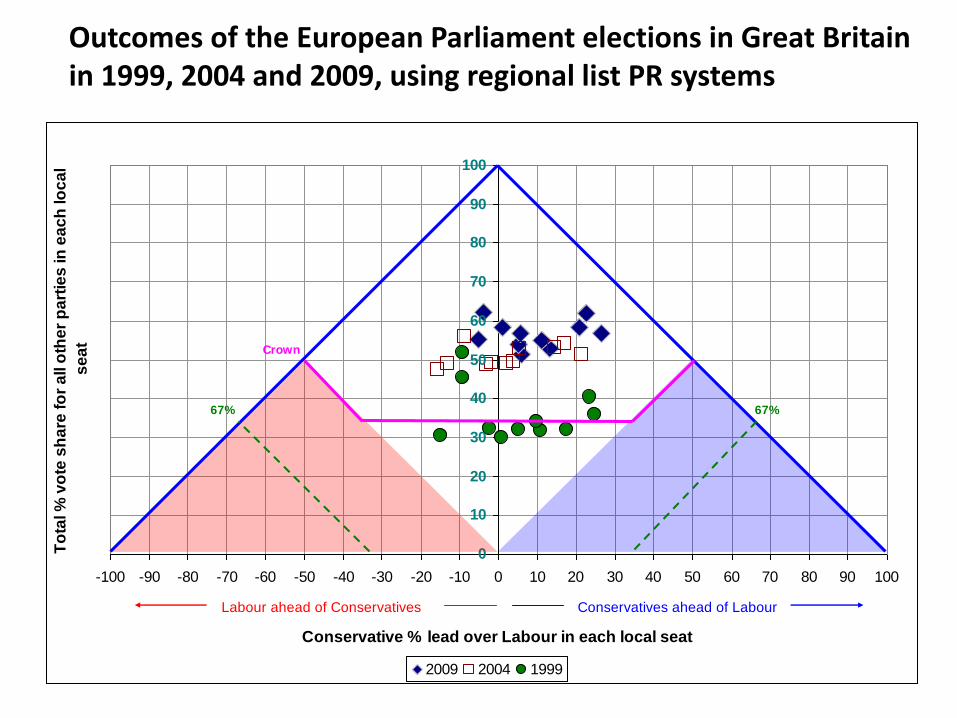
Outcomes of the European Parliament elections in Great Britain in 1999, 2004 and 2009, using regional list PR systems
0
10
20
30
40
50
60
70
80
90
100
-100 -90 -80 -70 -60 -50 -40 -30 -20 -10 0 10 20 30 40 50 60 70 80 90 100
Conservative % lead over Labour in each local seat
To
tal %
vo
te s
ha
re f
or
all o
the
r p
art
ies
in
ea
ch
lo
ca
l
se
at
2009 2004 1999
Conservatives ahead of Labour Labour ahead of Conservatives
67%67%
Crown
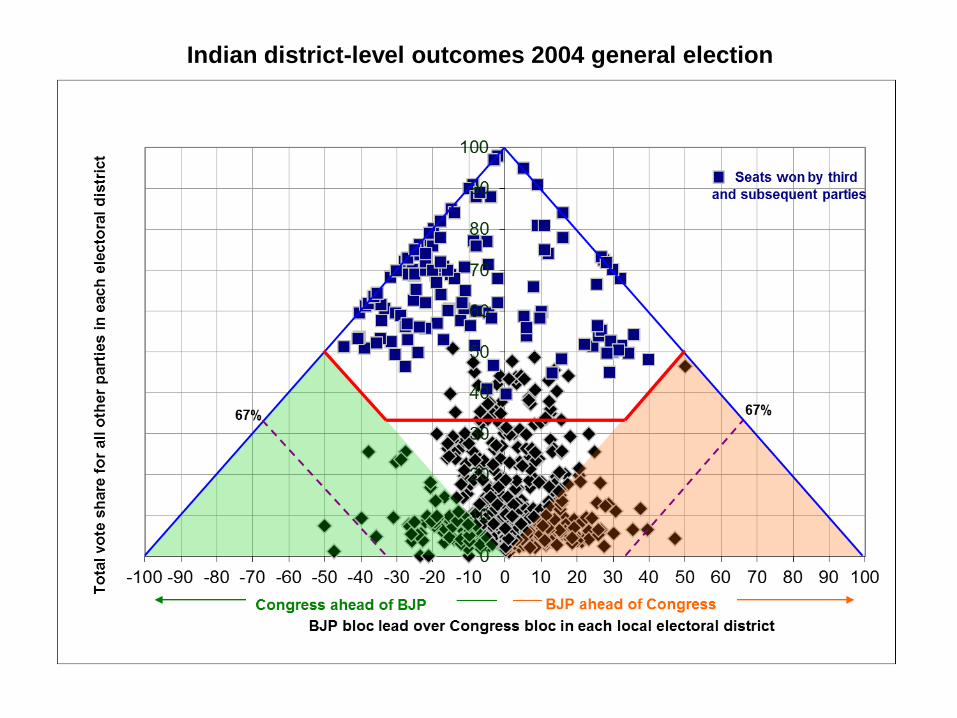
Indian district-level outcomes 2004 general election

Next week:Party System – Ideology, Strategy,
Governance and Policy-making aspects