Embed Size (px)
Citation preview
112 THE TORTOISE AND THE HARE: RISK PREMIUM VERSUS ALTERNATIVE ASSET PORTFOLIOS SPRING 2013
The Tortoise and the Hare: Risk Premium versus Alternative Asset PortfoliosRON BIRD, HARRY LIEM, AND SUSAN THORP
RON BIRD
is a professor of finance and director of the Paul Woolley Centre at the University of Technology, Sydney, and professor of finance at the University of Waikato in [email protected]
HARRY LIEM
is a research associate at the Paul Woolley Centre at the University of Technology, Sydney, in [email protected]
SUSAN THORP
is a professor of finance and superannuation at the University of Technology, Sydney, in [email protected]
In the old Aesop fable, a hare ridicules a slow-moving tortoise and is challenged by him to a race. The hare soon leaves the tortoise behind and, confident of win-
ning, decides to take a nap midway through the course. When he awakes, however, he finds that his competitor, crawling slowly but steadily, has finished before him.
In this article we compare two methods of portfolio diversification that have recently attracted interest. Investors increasingly allo-cate away from traditional investments, such as equity and bonds, into alternative invest-ments, with the promise of higher, less vola-tile returns. Spurred on as well by academic literature that supports the diversif ication benefits,1 15 to 20 percent of global institution-ally managed portfolios are already invested in alternative assets (Baldridge et al. [2010]), with some U.S. endowments allocating up to 80 percent to alternative assets.2
Yet, like the erratic hare, alternative investments carry certain risks as a trade-off to the promise of higher returns. Recent aca-demic evidence suggests that the majority of their returns come from exposure to risk premia (beta), as market timing and security selection is notoriously hard to consistently execute.3 In addition, alternative-investment managers charge high fees: a 2 percent man-agement fee and a 20 percent performance fee, on average. This fee structure assumes that the hare has a special talent (or alpha
potential) in, for example, market timing or investment selection. Indeed, Ang et al. [2009, p. 136] conclude that “arguably some recent alternative vehicles simply repackage certain systematic factors in much more expensive forms.”
Does diversif ication using a basket of the most common alternative investments (the hare) outperform diversification using low cost and liquid risk premia (the tortoise)? Perhaps diversification using risk factors (style tilts) such as exposure to credit, momentum, and value premia provides a more effective diversif ication strategy. Investment banks have recently begun offering such risk fac-tors at low cost.
We make three contributions to research into portfolio diversification. First, we con-firm that alternative assets may reduce port-folio risk, based on historical experience.4 Because we deal with investments with asym-metric and fat-tailed risk, we create efficient frontiers based on both standard deviation and conditional value at risk (CVaR).
Second, we compare the risk reduction benefits of alternative investments (the hare) and risk premium (the tortoise) portfolios out of sample, using equal-weighted and least-risk optimized portfolios. We find risk premia diversify more eff iciently than alternative asset portfolios.
Third, we suggest that an optimal port-folio combines the benefits of both risk pre-
JPM-BIRD.indd 112JPM-BIRD.indd 112 4/12/13 6:53:17 PM4/12/13 6:53:17 PM
IT IS IL
LEGAL TO REPRODUCE THIS A
RTICLE IN
ANY FORMAT
Copyright © 2013
THE JOURNAL OF PORTFOLIO MANAGEMENT 113SPRING 2013
mium and alternative-asset portfolios, as some alternative assets (such as managed futures or timber) continue to provide exposure to unique sources of return.
Our study has important implications for institu-tional investors: the current focus on diversification by asset classes may need to be reviewed in the light of an increasing body of evidence on the existence of various risk premia. To the best of our knowledge, we are among the first to directly compare the inclusion of alternative investments on a risk-premium basis.
NOT ALL ALTERNATIVE ASSETS ARE THE SAME
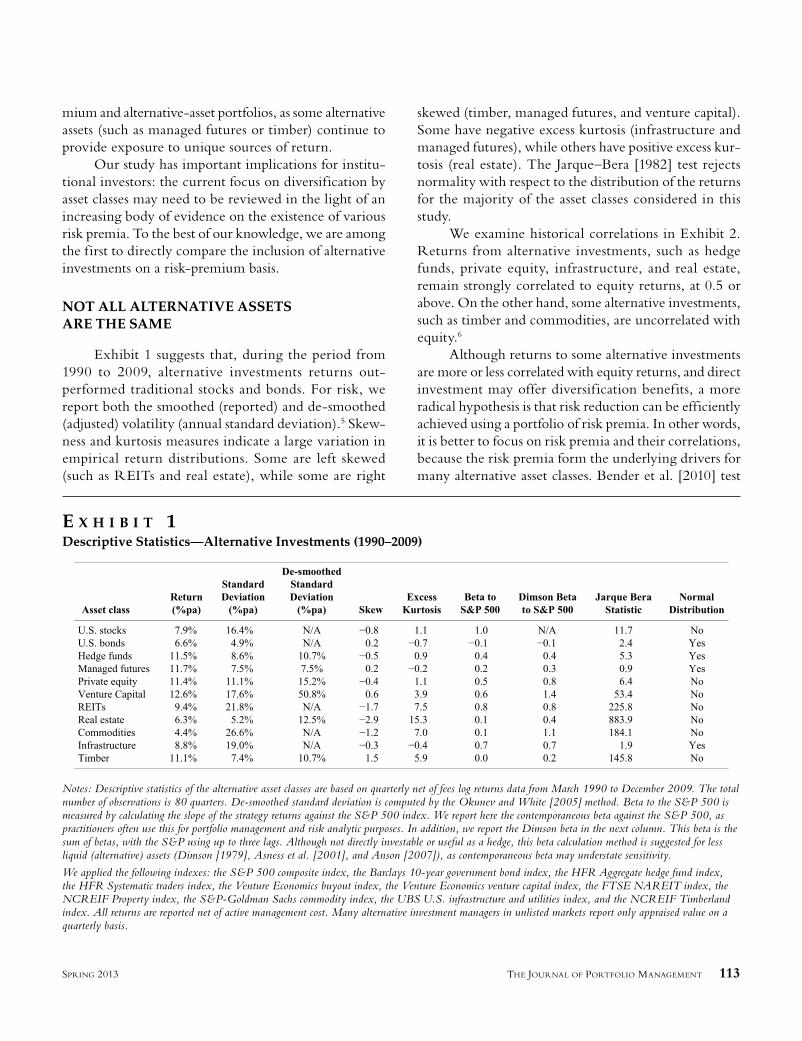
Exhibit 1 suggests that, during the period from 1990 to 2009, alternative investments returns out-performed traditional stocks and bonds. For risk, we report both the smoothed (reported) and de-smoothed (adjusted) volatility (annual standard deviation).5 Skew-ness and kurtosis measures indicate a large variation in empirical return distributions. Some are left skewed (such as REITs and real estate), while some are right
skewed (timber, managed futures, and venture capital). Some have negative excess kurtosis (infrastructure and managed futures), while others have positive excess kur-tosis (real estate). The Jarque–Bera [1982] test rejects normality with respect to the distribution of the returns for the majority of the asset classes considered in this study.
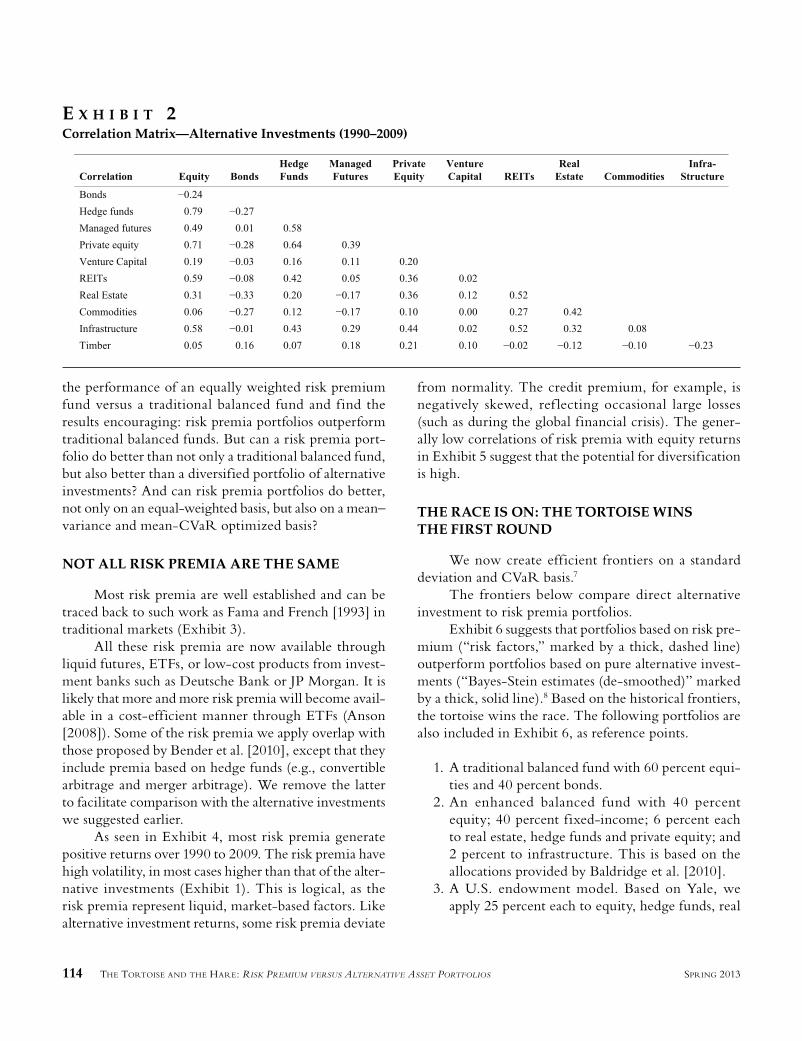
We examine historical correlations in Exhibit 2. Returns from alternative investments, such as hedge funds, private equity, infrastructure, and real estate, remain strongly correlated to equity returns, at 0.5 or above. On the other hand, some alternative investments, such as timber and commodities, are uncorrelated with equity.6
Although returns to some alternative investments are more or less correlated with equity returns, and direct investment may offer diversif ication benefits, a more radical hypothesis is that risk reduction can be efficiently achieved using a portfolio of risk premia. In other words, it is better to focus on risk premia and their correlations, because the risk premia form the underlying drivers for many alternative asset classes. Bender et al. [2010] test
E X H I B I T 1Descriptive Statistics—Alternative Investments (1990–2009)
Notes: Descriptive statistics of the alternative asset classes are based on quarterly net of fees log returns data from March 1990 to December 2009. The total number of observations is 80 quarters. De-smoothed standard deviation is computed by the Okunev and White [2005] method. Beta to the S&P 500 is measured by calculating the slope of the strategy returns against the S&P 500 index. We report here the contemporaneous beta against the S&P 500, as practitioners often use this for portfolio management and risk analytic purposes. In addition, we report the Dimson beta in the next column. This beta is the sum of betas, with the S&P using up to three lags. Although not directly investable or useful as a hedge, this beta calculation method is suggested for less liquid (alternative) assets (Dimson [1979], Asness et al. [2001], and Anson [2007]), as contemporaneous beta may understate sensitivity.
We applied the following indexes: the S&P 500 composite index, the Barclays 10-year government bond index, the HFR Aggregate hedge fund index, the HFR Systematic traders index, the Venture Economics buyout index, the Venture Economics venture capital index, the FTSE NAREIT index, the NCREIF Property index, the S&P-Goldman Sachs commodity index, the UBS U.S. infrastructure and utilities index, and the NCREIF Timberland index. All returns are reported net of active management cost. Many alternative investment managers in unlisted markets report only appraised value on a quarterly basis.
JPM-BIRD.indd 113JPM-BIRD.indd 113 4/12/13 6:53:18 PM4/12/13 6:53:18 PM
114 THE TORTOISE AND THE HARE: RISK PREMIUM VERSUS ALTERNATIVE ASSET PORTFOLIOS SPRING 2013
the performance of an equally weighted risk premium fund versus a traditional balanced fund and f ind the results encouraging: risk premia portfolios outperform traditional balanced funds. But can a risk premia port-folio do better than not only a traditional balanced fund, but also better than a diversified portfolio of alternative investments? And can risk premia portfolios do better, not only on an equal-weighted basis, but also on a mean–variance and mean-CVaR optimized basis?
NOT ALL RISK PREMIA ARE THE SAME
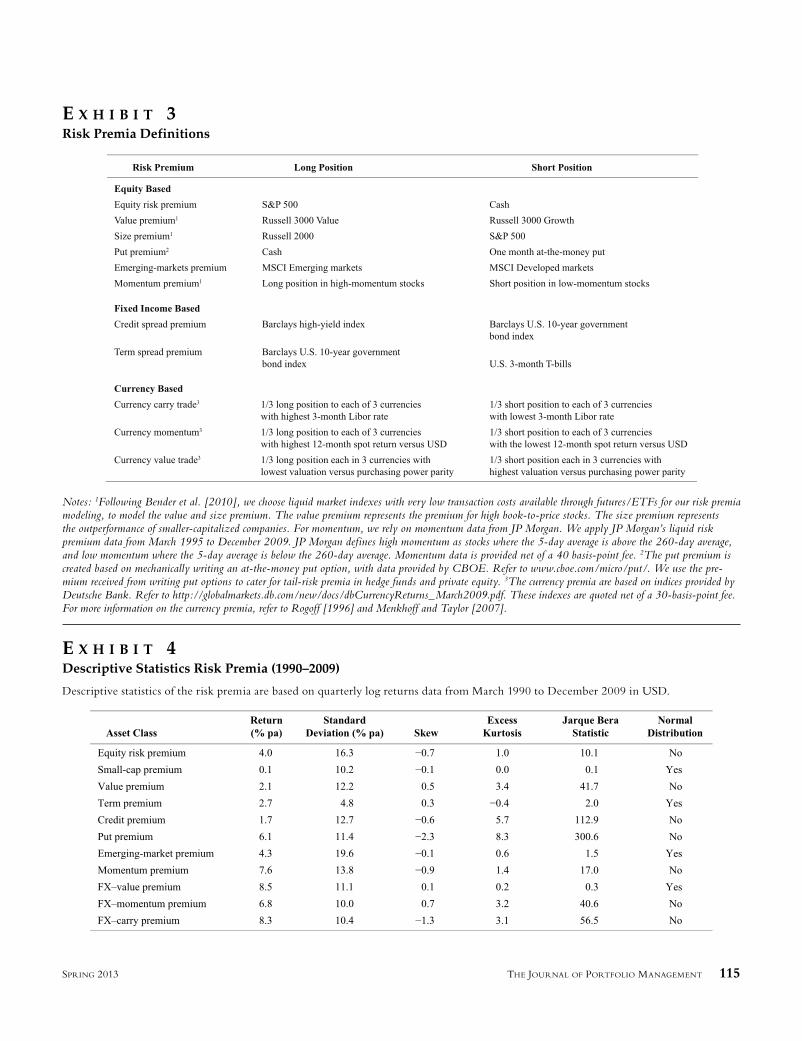
Most risk premia are well established and can be traced back to such work as Fama and French [1993] in traditional markets (Exhibit 3).
All these risk premia are now available through liquid futures, ETFs, or low-cost products from invest-ment banks such as Deutsche Bank or JP Morgan. It is likely that more and more risk premia will become avail-able in a cost-efficient manner through ETFs (Anson [2008]). Some of the risk premia we apply overlap with those proposed by Bender et al. [2010], except that they include premia based on hedge funds (e.g., convertible arbitrage and merger arbitrage). We remove the latter to facilitate comparison with the alternative investments we suggested earlier.
As seen in Exhibit 4, most risk premia generate positive returns over 1990 to 2009. The risk premia have high volatility, in most cases higher than that of the alter-native investments (Exhibit 1). This is logical, as the risk premia represent liquid, market-based factors. Like alternative investment returns, some risk premia deviate
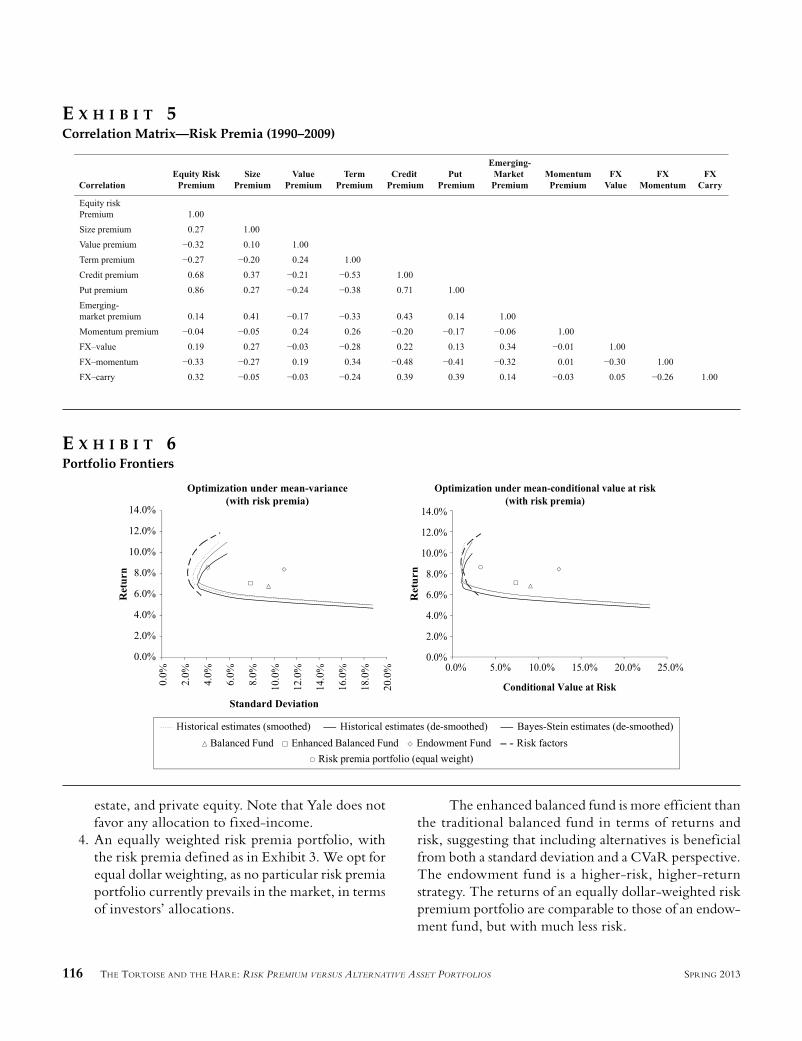
from normality. The credit premium, for example, is negatively skewed, ref lecting occasional large losses (such as during the global financial crisis). The gener-ally low correlations of risk premia with equity returns in Exhibit 5 suggest that the potential for diversification is high.
THE RACE IS ON: THE TORTOISE WINS THE FIRST ROUND
We now create eff icient frontiers on a standard deviation and CVaR basis.7
The frontiers below compare direct alternative investment to risk premia portfolios.
Exhibit 6 suggests that portfolios based on risk pre-mium (“risk factors,” marked by a thick, dashed line) outperform portfolios based on pure alternative invest-ments (“Bayes-Stein estimates (de-smoothed)” marked by a thick, solid line).8 Based on the historical frontiers, the tortoise wins the race. The following portfolios are also included in Exhibit 6, as reference points.
1. A traditional balanced fund with 60 percent equi-ties and 40 percent bonds.
2. An enhanced balanced fund with 40 percent equity; 40 percent fixed-income; 6 percent each to real estate, hedge funds and private equity; and 2 percent to infrastructure. This is based on the allocations provided by Baldridge et al. [2010].
3. A U.S. endowment model. Based on Yale, we apply 25 percent each to equity, hedge funds, real
E X H I B I T 2Correlation Matrix—Alternative Investments (1990–2009)
JPM-BIRD.indd 114JPM-BIRD.indd 114 4/12/13 6:53:22 PM4/12/13 6:53:22 PM
THE JOURNAL OF PORTFOLIO MANAGEMENT 115SPRING 2013
E X H I B I T 3Risk Premia Definitions
Notes: 1Following Bender et al. [2010], we choose liquid market indexes with very low transaction costs available through futures/ETFs for our risk premia modeling, to model the value and size premium. The value premium represents the premium for high book-to-price stocks. The size premium represents the outperformance of smaller-capitalized companies. For momentum, we rely on momentum data from JP Morgan. We apply JP Morgan’s liquid risk premium data from March 1995 to December 2009. JP Morgan defines high momentum as stocks where the 5-day average is above the 260-day average, and low momentum where the 5-day average is below the 260-day average. Momentum data is provided net of a 40 basis-point fee. 2The put premium is created based on mechanically writing an at-the-money put option, with data provided by CBOE. Refer to www.cboe.com/micro/put/. We use the pre-mium received from writing put options to cater for tail-risk premia in hedge funds and private equity. 3The currency premia are based on indices provided by Deutsche Bank. Refer to http://globalmarkets.db.com/new/docs/dbCurrencyReturns_March2009.pdf. These indexes are quoted net of a 30-basis-point fee. For more information on the currency premia, refer to Rogoff [1996] and Menkhoff and Taylor [2007].
E X H I B I T 4Descriptive Statistics Risk Premia (1990–2009)
Descriptive statistics of the risk premia are based on quarterly log returns data from March 1990 to December 2009 in USD.
JPM-BIRD.indd 115JPM-BIRD.indd 115 4/12/13 6:53:23 PM4/12/13 6:53:23 PM
116 THE TORTOISE AND THE HARE: RISK PREMIUM VERSUS ALTERNATIVE ASSET PORTFOLIOS SPRING 2013
estate, and private equity. Note that Yale does not favor any allocation to fixed-income.
4. An equally weighted risk premia portfolio, with the risk premia defined as in Exhibit 3. We opt for equal dollar weighting, as no particular risk premia portfolio currently prevails in the market, in terms of investors’ allocations.
The enhanced balanced fund is more efficient than the traditional balanced fund in terms of returns and risk, suggesting that including alternatives is beneficial from both a standard deviation and a CVaR perspective. The endowment fund is a higher-risk, higher-return strategy. The returns of an equally dollar-weighted risk premium portfolio are comparable to those of an endow-ment fund, but with much less risk.
E X H I B I T 5Correlation Matrix—Risk Premia (1990–2009)
E X H I B I T 6Portfolio Frontiers
JPM-BIRD.indd 116JPM-BIRD.indd 116 4/12/13 6:53:25 PM4/12/13 6:53:25 PM
THE JOURNAL OF PORTFOLIO MANAGEMENT 117SPRING 2013
REMATCH: USING OUT-OF-SAMPLE PERFORMANCE
In the previous section, we examined eff icient frontiers based on historical data. We now construct two types of portfolios designed to test ex ante performance for the tortoise and the hare.
The Equally Weighted Portfolio (EWP)
Bender et al. [2010] suggested that an equally weighted diversif ication into risk premia provides a robust out-of-sample test. An equally weighted portfolio approach completely ignores the question of which assets are invested. DeMiguel et al. [2009] tested 14 different
E X H I B I T 7Rolling Blanket Charts (out-of-sample)
JPM-BIRD.indd 117JPM-BIRD.indd 117 4/12/13 6:53:28 PM4/12/13 6:53:28 PM
118 THE TORTOISE AND THE HARE: RISK PREMIUM VERSUS ALTERNATIVE ASSET PORTFOLIOS SPRING 2013
asset allocation models and conclude that none of the approaches perform consistently better out-of-sample than the 1/n rule.
The Least-Risk Portfolio (LRP)
The alternative is to compare diversi-fied-alternative portfolios to risk-premium portfolios on a minimized portfolio-risk basis (the point on the frontier with the lowest risk, either defined as standard devi-ation or CVaR), and then re-optimize on an out-of-sample basis as each new quarter comes in.
The minimum-risk portfolio is unique, in that it is the only portfolio on the frontier without expected returns as inputs. Behr et al. [2008] and Clarke et al. [2006] reported that many least-risk portfolios outper-form market capitalization-weighted indices with higher realized returns and lower volatility. For the least-risk portfolio, we undertook the ex post analysis on the basis of an extending time window. The data from January 1990 to December 1997 serve as the initial in-sample period, with 32 data points. We then update the weights in the least-risk portfolios based on either variance or conditional value at risk and apply them to the next quar-ter’s data, to calculate the out-of-sample portfolio return. At the end of each quarter, we re-adjust the portfolio weights.
SECOND ROUND GOES TO THE TORTOISE
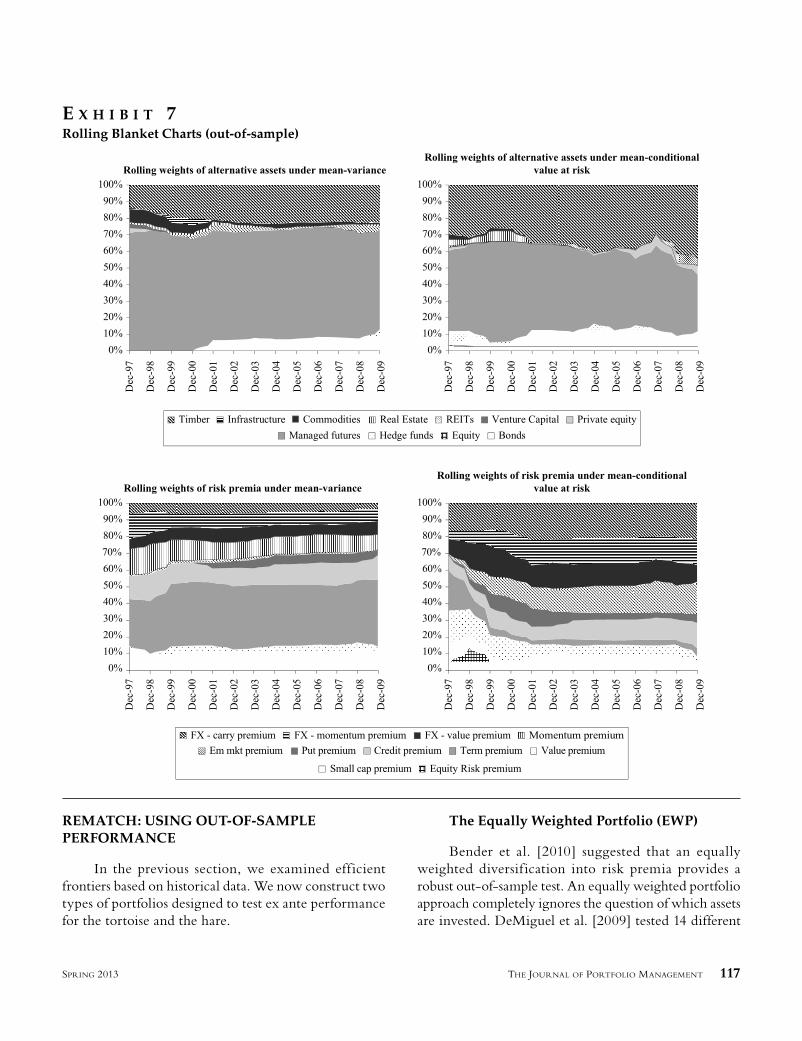
Exhibit 7 shows the rolling blanket charts for the optimized portfolios.
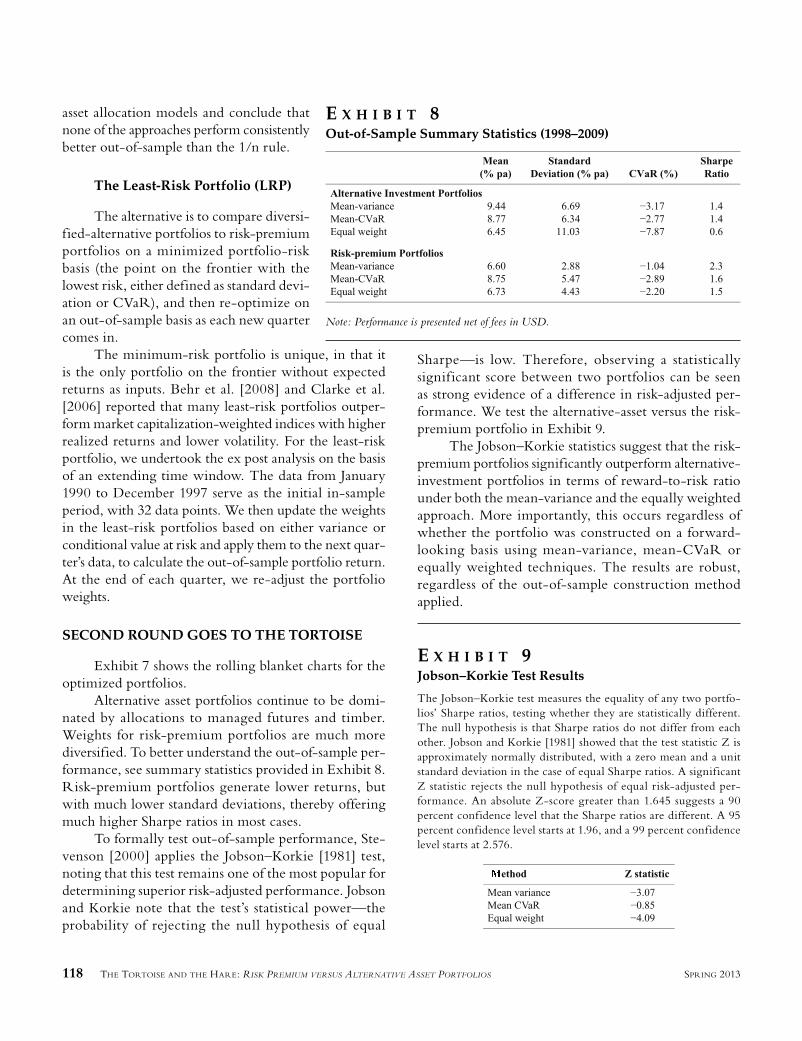
Alternative asset portfolios continue to be domi-nated by allocations to managed futures and timber. Weights for risk-premium portfolios are much more diversified. To better understand the out-of-sample per-formance, see summary statistics provided in Exhibit 8. Risk-premium portfolios generate lower returns, but with much lower standard deviations, thereby offering much higher Sharpe ratios in most cases.
To formally test out-of-sample performance, Ste-venson [2000] applies the Jobson–Korkie [1981] test, noting that this test remains one of the most popular for determining superior risk-adjusted performance. Jobson and Korkie note that the test’s statistical power—the probability of rejecting the null hypothesis of equal
Sharpe—is low. Therefore, observing a statistically significant score between two portfolios can be seen as strong evidence of a difference in risk-adjusted per-formance. We test the alternative-asset versus the risk-premium portfolio in Exhibit 9.
The Jobson–Korkie statistics suggest that the risk-premium portfolios significantly outperform alternative-investment portfolios in terms of reward-to-risk ratio under both the mean-variance and the equally weighted approach. More importantly, this occurs regardless of whether the portfolio was constructed on a forward-looking basis using mean-variance, mean-CVaR or equally weighted techniques. The results are robust, regardless of the out-of-sample construction method applied.
E X H I B I T 8Out-of-Sample Summary Statistics (1998–2009)
Note: Performance is presented net of fees in USD.
E X H I B I T 9Jobson–Korkie Test Results
The Jobson–Korkie test measures the equality of any two portfo-lios’ Sharpe ratios, testing whether they are statistically different. The null hypothesis is that Sharpe ratios do not differ from each other. Jobson and Korkie [1981] showed that the test statistic Z is approximately normally distributed, with a zero mean and a unit standard deviation in the case of equal Sharpe ratios. A significant Z statistic rejects the null hypothesis of equal risk-adjusted per-formance. An absolute Z-score greater than 1.645 suggests a 90 percent confidence level that the Sharpe ratios are different. A 95 percent confidence level starts at 1.96, and a 99 percent confidence level starts at 2.576.
JPM-BIRD.indd 118JPM-BIRD.indd 118 4/12/13 6:53:30 PM4/12/13 6:53:30 PM
THE JOURNAL OF PORTFOLIO MANAGEMENT 119SPRING 2013
THE BEST ELEMENTS OF BOTH ANIMALS
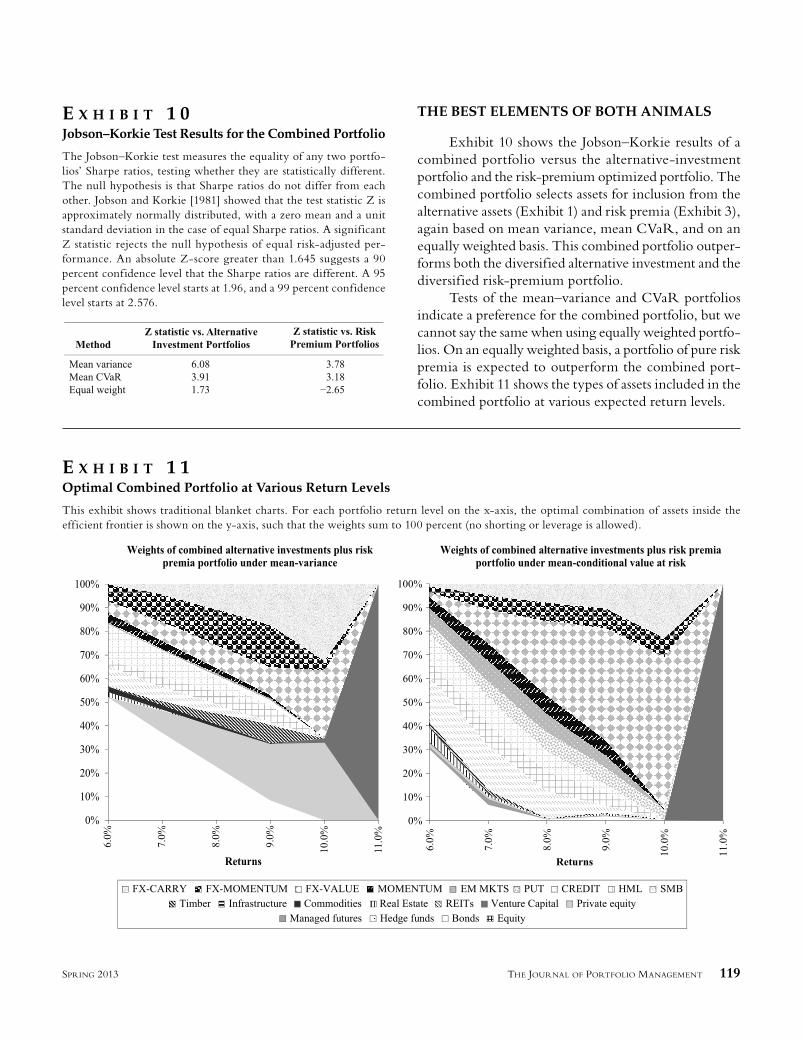
Exhibit 10 shows the Jobson–Korkie results of a combined portfolio versus the alternative-investment portfolio and the risk-premium optimized portfolio. The combined portfolio selects assets for inclusion from the alternative assets (Exhibit 1) and risk premia (Exhibit 3), again based on mean variance, mean CVaR, and on an equally weighted basis. This combined portfolio outper-forms both the diversified alternative investment and the diversified risk-premium portfolio.
Tests of the mean–variance and CVaR portfolios indicate a preference for the combined portfolio, but we cannot say the same when using equally weighted portfo-lios. On an equally weighted basis, a portfolio of pure risk premia is expected to outperform the combined port-folio. Exhibit 11 shows the types of assets included in the combined portfolio at various expected return levels.
E X H I B I T 1 0Jobson–Korkie Test Results for the Combined Portfolio
The Jobson–Korkie test measures the equality of any two portfo-lios’ Sharpe ratios, testing whether they are statistically different. The null hypothesis is that Sharpe ratios do not differ from each other. Jobson and Korkie [1981] showed that the test statistic Z is approximately normally distributed, with a zero mean and a unit standard deviation in the case of equal Sharpe ratios. A significant Z statistic rejects the null hypothesis of equal risk-adjusted per-formance. An absolute Z-score greater than 1.645 suggests a 90 percent confidence level that the Sharpe ratios are different. A 95 percent confidence level starts at 1.96, and a 99 percent confidence level starts at 2.576.
E X H I B I T 1 1Optimal Combined Portfolio at Various Return Levels
This exhibit shows traditional blanket charts. For each portfolio return level on the x-axis, the optimal combination of assets inside the efficient frontier is shown on the y-axis, such that the weights sum to 100 percent (no shorting or leverage is allowed).
JPM-BIRD.indd 119JPM-BIRD.indd 119 4/12/13 6:53:32 PM4/12/13 6:53:32 PM

120 THE TORTOISE AND THE HARE: RISK PREMIUM VERSUS ALTERNATIVE ASSET PORTFOLIOS SPRING 2013
As can be seen in Exhibit 11, a portfolio built under the mean-variance approach favors an allocation to assets that are truly uncorrelated to stocks: bonds, managed futures, timber, foreign exchange carry, for-eign exchange value, and foreign exchange momentum. Under the mean-conditional value at risk portfolio, which focuses specifically on the downside risk, foreign exchange strategies get an increased allocation at the expense of the other factors.
For practitioners, this is an important finding. It is possible that constructing a portfolio with the optimal balance of risk and reward consists of identifying the right elements from both the tortoise and the hare. The process used to derive the actual portfolio weights is secondary.
Exhibit 11 demonstrates that major shifts in asset allocation could occur, depending on the desired return level. It would be unrealistic to expect an investor to shift a portfolio so dramatically in response to model predictions. In the real world, other constraints need consideration.
For risk premia, investors would need to be com-fortable with the market conditions, as risk premia can trade at different values at various points in the business cycle. During the global financial crisis, investors allo-cated to the credit and volatility premia, as these were seen as cheap. One cannot invest directly in alternative assets, so additional constraints for this asset class would include fees, liquidity, capacity of desirable investment managers (general partners), as well as the monitoring costs and the comfort that the investor (the limited partner) would need to have with the specific asset class’s complexity.
CONCLUSIONS
While investing in risk premia may not be as exciting as some more recent alternative investments, the tortoise may in the long run outperform the hare. Although we conclude that portfolio risk reduction is more efficiently achieved by using a risk-premium port-folio (tortoise) than a diversified portfolio of alternative investments (hare), an optimal portfolio combines the best elements of both animals. This suggests a number of areas for further research.
First and foremost is the stability of the various risk premia. We only have access to a 20-year history for alternative investments and risk premia, and that history is mainly U.S.-based. In reality there have been a number
of cases where risk premia have been unrewarded, even over a 20-year period. Consider, for example, the equity risk premium in Japan, where investors have been faced with declining markets and f lattening yield curves since the stock market peak in 1990.
In addition, some risk premia, such as the small-cap and value premia, have their roots in behavioral finance (Fama and French [1993]). The magnitude of these premia may change going forward as more money gets invested in smaller and value stocks. In a similar vein, the emerging market premium may decline as more markets become developed and open to foreign investment, or the term premium may disappear during periods of f lat yield curves.
A second area of research could focus on the appli-cation of leverage, allowing for both negative asset-class weights and weights over 100 percent in portfolios. Removing constraints improves the efficient frontier; this method is proposed by supporters of risk-parity portfolios,9 using leverage to obtain more equal risk contributions. However, as the global f inancial crisis has shown, leverage in itself brings up a number of issues, such as counterparty risk, and needs to be applied on a carefully considered basis.
Finally, continued identif ication of risk premia considered unique to alternative asset classes and ways to efficiently capture them may prove to be a fruitful research area. Historically, academic research and behav-ioral finance has mainly focused on anomalies in public equity markets (Fama and French [1993]), although there is increased interest in capturing premia in hedge funds (Bender et al. [2010]), for example.
At the same time, many experts acknowledge that some risk premia may be less easily quantifiable or are inherent in an asset class. For example, consider the inherent risk in growing trees for timberland, com-modities’ supply and demand, or the trend-following premium in managed futures. Some types of alternative investments will continue to provide unique sources of diversification, as our combined portfolio indicates.
ENDNOTES
1See e.g., Lamm [1999], Amin and Kat [2002], Singer et al. [2003], Campbell [2005], Gorton and Rouwenhorst [2005], Huang and Zhong [2006], and Cumming et al. [2011].
2See www.yale.edu/investments/.
JPM-BIRD.indd 120JPM-BIRD.indd 120 4/12/13 6:53:34 PM4/12/13 6:53:34 PM
THE JOURNAL OF PORTFOLIO MANAGEMENT 121SPRING 2013
3Bender et al. [2010], Bhansali [2010], Page and Taborsky [2011], and Fischer and Lind-Braucher [2011].
4To reduce the possibility of forecast errors in our model, we apply Bayes–Stein statistical shrinkage [ Jorion, 1985], sug-gested by Stevenson [2000] for real estate, and Fischer and Lind-Braucher [2010] for alternative investments. In addition, we de-smooth return series provided by managers, based on the method proposed by Fisher–Geltner–Webb [1994] and Okunev and White [2003].
5See Okunev and White [2005] for the de-smoothing method. The formula is a variation of Fisher–Geltner–Webb [1994], but allows for de-smoothing of higher order auto-correlation. In the case of private markets, such as venture capital or real estate, the de-smoothed volatility substantially increases, as can be seen in the 2nd and 3rd output columns in Exhibit 1.
6In this exhibit, we report correlations using returns which have been de-smoothed (i.e., the autocorrelation resulting from appraisal-based valuations has been removed from the alternative asset return series). Removing the appraisal-based valuations results in somewhat higher corre-lations. However, it is possible that the diversification benefits remain overstated, as recent papers by Anson [2007, 2012] suggest somewhat higher correlations.
7Alexander and Baptista [2004] suggest CVaR is more effective than VaR for optimization purposes.
8Bayes–Stein estimators reduce the outliers in the return data, thereby offsetting possible upwards biases in return data created by voluntary manager reporting. Bayes–Stein esti-mators also serve to reduce the limitation in mean–variance optimization, with alternatives that tend to concentrate the weights in a few asset classes. See Fischer and Lind-Braucher [2010].
9A number of providers have marketed leveraged risk premium (risk parity) products that aim to balance expo-sures to risk premia, e.g., Bridgewater and AQR. In 1996, Bridgewater launched its All Weather fund and is considered the pioneer in the risk parity approach. Find details on risk parity at https://www.bwater.com/home/research--press/selected-research.aspx.
REFERENCES
Alexander, G.J., and A.M. Baptista. “A Comparison of VaR and CVaR Constraints on Portfolio Selection with the Mean-Variance Model.” Management Science, Vol. 50, No. 9 (2004), pp. 1261-1273.
Amin, G., and H. Kat. “Stocks, Bonds and Hedge Funds: Not a Free Lunch!” Working paper, ISMA Centre, University of Reading, 2002.
Ang, A., W.N. Goetzmann, and S.M. Schaeffer. “Evalua-tion of Active Management for the Norwegian Government Pension Fund (2009).” Available at www.regjeringen.no/upload/FIN/Statens%20pensjonsfond/rapporter/AGS%20Report.pdf
Anson, M.J.P. “The Beta Continuum: From Classic Beta to Bulk Beta.” The Journal of Portfolio Management, Vol. 34, No. 2 (2008), pp. 54-64.
Anson, M. “Performance Measurement in Private Equity: Another Look.” The Journal of Private Equity, Vol. 10, No. 3 (2007), pp. 7–21.
——. “Measuring Systematic Risk and Behavioral Biases in Real Estate Returns.” Alternative Investments Analyst Review, Forthcoming, 2012.
Asness, G., R. Krail, and J. Liew. “Do Hedge Funds Hedge?” The Journal of Portfolio Management, Vol. 28, No. 1 (2001), pp. 6-19.
Behr, O., A. Guttler, and F. Miebs. “Is Minimum-Variance Investing Really Worth the While? An Analysis with Robust Performance Inference.” Working paper, European Business School, 2008.
Bender, J., R. Briand, F. Nielsen, and D. Stefek. “Portfolio of Risk Premia: A New Approach to Diversification.” The Journal of Portfolio Management, Vol. 36, No. 2 (2010), pp. 17-25.
Bera, A.K., and C.M. Jarque. “Efficient Tests for Normality, Homoscedasticity and Serial Independence of Regres-sion Residuals.” Economics Letters, Vol. 6, No. 3 (1982), pp. 255-259.
Bhansali, V. Bond Portfolio Investing and Risk Management. New York: McGraw-Hill, 2010.
Campbell, R.A.J. “Art as an Alternative Asset Class.” Working paper, Maastricht University, 2005.
Clarke, R.G., H. De Silva, and S. Thorley. “Minimum-Vari-ance Portfolios in the U.S. Equity Market.” The Journal of Portfolio Management, Vol. 33, No. 1 (2006), pp. 10-24.
Cumming, D., L.H. Hass, and D. Schweizer. “Strategic Asset Allocation and the Role of Alternative Investments.” EFMA Toronto conference, 2011.
JPM-BIRD.indd 121JPM-BIRD.indd 121 4/12/13 6:53:34 PM4/12/13 6:53:34 PM
122 THE TORTOISE AND THE HARE: RISK PREMIUM VERSUS ALTERNATIVE ASSET PORTFOLIOS SPRING 2013
DeMiguel, V., L. Garlappi, and R. Uppal. “Optimal versus Naïve Diversification: How Inefficient Is the 1/N Portfolio Strategy?” Review of Financial Studies, Vol. 22, No. 5 (2009), pp. 1915-1953.
Dimson, E. “Risk Measurement When Shares are Subject to Infrequent Trading.” Journal of Financial Economics, Vol. 7, No. 2 (1979), pp. 197-226.
Fama, E.F., and K.R. French. “Common Risk Factors in the Returns on Stocks and Bonds.” Journal of Financial Economics, Vol. 33, No. 1 (1993), pp. 3-56.
Fisher, J.D., D. Geltner, and B. Webb. “Value Indices of Com-mercial Real Estate: A Comparison of Index Construction Methods.” Journal of Real Estate Finance and Economics, Vol. 9, No. 2 (1994), pp. 137-164.
Fischer, E.O., and S. Lind-Braucher. “Optimal Portfolios with Traditional and Alternative Investments: An Empirical Investigation.” The Journal of Alternative Investments, Vol. 13, No. 2 (2010), pp. 58-77.
Gorton, G.B., and G.K. Rouwenhorst. “Facts and Fantasies About Commodity Futures.” Yale ICF working paper, 2004, pp. 4-20.
Huang, J.Z., and Z.D. Zhong. “Time Variation in Diversifi-cation Benefits of Commodity, REITs and TIPS.” Working paper, Pennsylvania State University, 2006.
Jobson, J.D., and B. Korkie. “Performance Hypothesis Testing with the Sharpe and Treynor Measures.” Journal of Finance, 36, pp. 889-908.
Jorion, O. “International Portfolio Diversification with Esti-mation Risk.” Journal of Business, Vol. 58, No. 3 (1985), pp. 259-279.
Lamm, R.M. “Portfolios of Alternative Assets: Why Not 100 Percent Hedge Funds?” The Journal of Investing, Vol. 8, No. 4 (1999), pp. 87-97.
Okunev, J., and D.R. White. “Hedge Fund Risk Factors and Value at Risk of Credit Trading Strategies.” Working paper, University of New South Wales, 2003.
Page, S., and M.A. Taborsky. “The Myth of Diversification: Risk Factors versus Asset Classes.” The Journal of Portfolio Man-agement, Vol. 37, No. 4 (2011), pp. 1-2.
Sheikh, A.Z., and H.T. Qiao. “Non-Normality of Market Returns: A Framework for Asset Allocation Decision Making.” The Journal of Alternative Investments, Vol. 12, No. 3 (2010), pp. 8-35.
Singer, B., R. Staub, and K. Terhaar. “Appropriate Policy Allocation for Alternative Investments.” The Journal of Portfolio Management, Vol. 19, No. 3 (2003), pp. 101-110.
Stevenson, S. “Bayes Stein Estimators and International Real Estate Allocation.” Pacific Rim Real Estate Society Confer-ence, 2000.
To order reprints of this article, please contact Dewey Palmieri at [email protected] or 212-224-3675.
JPM-BIRD.indd 122JPM-BIRD.indd 122 4/12/13 6:53:34 PM4/12/13 6:53:34 PM