Embed Size (px)
Citation preview
*Corresponding author. Tel.: #44-1865-273333; fax: #44-1865-273418.E-mail address: [email protected] (N.A. Jelley).1Supported by the US Department of Energy.2Supported by Natural Sciences and Engineering Research Council of Canada.3Supported by the Swiss National Science Foundation in 1997.4Present address: Institut de Physique, UniversiteH de Neucha( tel, Neucha( tel CH-2000, Switzerland.5Present address: Los Alamos National Laboratory, Los Alamos, NM 87545, USA.6Present address: Physics Department, University of California, Berkeley, CA 94720, USA.7Present address: Penngrove, CA, USA.8Present address: Berkeley, CA, USA.9Deceased.10Supported by Particle Physics and Astronomy Research Council of the UK.11Present address: Physics Department, West Virginia University, Morgantown, WV 26505, USA.12Present address: Physics Department, Brookhaven National Laboratory, Upton, NY 11973, USA.13Present address: Membratec, Technopo( le, CH-3960 Sierre, Switzerland.
Nuclear Instruments and Methods in Physics Research A 449 (2000) 172}207
The Sudbury Neutrino Observatory
J. Boger!, R.L. Hahn!, J.K. Rowley!, A.L. Carter", B. Hollebone", D. Kessler",I. Blevis#, F. Dalnoki-Veress#, A. DeKok#, J. Farine#,3, D.R. Grant#,
C.K. Hargrove#, G. Laberge#, I. Levine#, K. McFarlane#, H. Mes#, A.T. Noble#,V.M. Novikov#, M. O'Neill#, M. Shatkay#, C. Shewchuk#, D. Sinclair#,
E.T.H. Cli!ord$, R. Deal$, E.D. Earle$, E. Gaudette$, G. Milton$, B. Sur$, J. Bigu%,J.H.M. Cowan%, D.L. Clu! %, E.D. Hallman%, R.U. Haq%, J. Hewett%, J.G. Hykawy%,
G. Jonkmans%,4, R. Michaud%, A. Roberge%, J. Roberts%, E. Saettler%,M.H. Schwendener%, H. Seifert%, D. Sweezey%, R. Ta"rout%, C.J. Virtue%, D.N. Beck&,
Y.D. Chan&, X. Chen&, M.R. Dragowsky &,5, F.W. Dycus&, J. Gonzalez&,M.C.P. Isaac&,6, Y. Kajiyama&, G.W. Koehler&, K.T. Lesko&, M.C. Moebus&,
E.B. Norman&, C.E. Okada&, A.W.P. Poon&, P. Purgalis&, A. Schuelke&, A.R. Smith&,R.G. Stokstad&, S. Turner&,7 , I. Zlimen&,8, J.M. Anaya', T.J. Bowles', S.J. Brice',Ernst-Ingo Esch', M.M. Fowler', Azriel Goldschmidt',6, A. Hime', A.F. McGirt',
G.G. Miller', W.A. Teasdale', J.B. Wilhelmy', J.M. Wouters', J.D. Anglin),M. Bercovitch), W.F. Davidson), R.S. Storey),9, S. Biller*, R.A. Black*,
R.J. Boardman*, M.G. Bowler*, J. Cameron*, B. Cleveland*, A.P. Ferraris*,G. Doucas*, H. Heron*, C. Howard*, N.A. Jelley*,*, A.B. Knox*, M. Lay*, W. Locke*,
J. Lyon*, S. Majerus*, M. Moorhead*, M. Omori*, N.W. Tanner*, R.K. Taplin*,M. Thorman*, D.L. Wark*, N. West*, J.C. Barton*, P.T. Trent*, R. Kouzes+,11,
M.M. Lowry+,12, A.L. Bell,, E. Bonvin,,13, M. Boulay,, M. Dayon,, F. Duncan,,
0168-9002/00/$ - see front matter ( 2000 Elsevier Science B.V. All rights reserved.PII: S 0 1 6 8 - 9 0 0 2 ( 9 9 ) 0 1 4 6 9 - 2

14Present address: Department of Physics, Princeton University, Princeton, NJ 08544, USA.15Present address: ESG Canada, 1 Hyperion Ct., Kingston, Ontario, Canada K7K 7G3.16Present address: CNEA, Av. del Libertador 8250, 1429 Buenos Aires, Argentina.17Permanent address: TRIUMF, Vancouver, British Columbia, Canada V6T 2A3.18Present address: Hewlett Packard Labs, Mail Stop 4A-D, 1501 Page Mill Road, Palo Alto, CA 94304, USA.19Present address: AT&T, Inc., Middletown, NJ 07748, USA.20Present address: Sienna Software Incorporated, Toronto, Ontario, CA.21Present address: Volt Services Group, Seattle, WA 98101, USA.22Present address: WRQ Inc., Seattle, WA 98109, USA.
L.S. Erhardt,, H.C. Evans,, G.T. Ewan,, R. Ford,,14, A. Hallin,, A. Hamer,,P.M. Hart,, P.J. Harvey,, D. Haslip,, C.A.W. Hearns,, R. Heaton,, J.D. Hepburn,,
C.J. Jillings,, E.P. Korpach,, H.W. Lee,, J.R. Leslie,, M.-Q. Liu,, H.B. Mak,,A.B. McDonald,, J.D. MacArthur,, W. McLatchie,, B.A. Mo!at,, S. Noel,,T.J. Radcli!e,,15, B.C. Robertson,, P. Skensved,, R.L. Stevenson,, X. Zhu,,
S. Gil-,16, J. Heise-, R.L. Helmer-,17, R.J. Komar-, C.W. Nally-, H.S. Ng-,C.E. Waltham-, R.C. Allen.,18, G. BuK hler.,19, H.H. Chen.,9, G. Aardsma/,
T. Andersen/,20, K. Cameron/, M.C. Chon/, R.H. Hanson/, P. Jagam/, J. Karn/,J. Law/, R.W. Ollerhead/, J.J. Simpson/, N. Tagg/, J.-X. Wang/, C. Alexander0,
E.W. Beier0, J.C. Cook0, D.F. Cowen0, E.D. Frank0, W. Frati0, P.T. Keener0,J.R. Klein0, G. Mayers0, D.S. McDonald0, M.S. Neubauer0, F.M. Newcomer0,R.J. Pearce0, R.G. Van de Water0, R. Van Berg0, P. Wittich0, Q.R. Ahmad1,
J.M. Beck1,21, M.C. Browne1,5, T.H. Burritt1, P.J. Doe1, C.A. Duba1, S.R. Elliott1,J.E. Franklin1, J.V. Germani1,22, P. Green1,17, A.A. Hamian1, K.M. Heeger1,M. Howe1, R. Meijer Drees1, A. Myers1, R.G.H. Robertson1, M.W.E. Smith1,
T.D. Steiger1, T. Van Wechel1, J.F. Wilkerson1
The SNO Collaboration
!Chemistry Department, Brookhaven National Laboratory, Upton, NY 11973-5000, USA1
"Carleton University, Ottawa, Ontario, Canada K1S 5B62
#Centre for Research in Particle Physics, Herzberg Laboratory, Carleton University, Ottawa, Ontario, Canada K1S 5B62
$Chalk River Laboratories, AECL Research, Chalk River, Ontario, Canada K0J 1J02
%Department of Physics and Astronomy, Laurentian University, Sudbury, Ontario, Canada P3E 2C62
&Lawrence Berkeley National Laboratory, Berkeley, CA 94720, USA1
'Los Alamos National Laboratory, Los Alamos, NM 87545, USA1
)National Research Council of Canada, Ottawa, Ontario, Canada K1A 0R6*Nuclear and Astrophysics Laboratory, Oxford University, Keble Road, Oxford OX1 3RH, UK10
+Department of Physics, Princeton University, Princeton, NJ 08544, USA,Department of Physics, Queen's University, Kingston, Ontario, Canada K7L 3N62
-Department of Physics and Astronomy, University of British Columbia, Vancouver, BC, Canada V6T 2A62
.Department of Physics, University of California, Irvine, CA 92717, USA/Physics Department, University of Guelph, Guelph, Ontario, Canada N1G 2W12
0Department of Physics and Astronomy, University of Pennsylvania, Philadelphia, PA 19104-6396, USA1
1Nuclear Physics Laboratory and Department of Physics, University of Washington, P.O. Box 351560, Seattle, WA 98195, USA1
Received 16 November 1999; accepted 14 December 1999
173J. Boger et al. / Nuclear Instruments and Methods in Physics Research A 449 (2000) 172}207
Abstract
The Sudbury Neutrino Observatory is a second-generation water Cherenkov detector designed to determine whetherthe currently observed solar neutrino de"cit is a result of neutrino oscillations. The detector is unique in its use of D
2O as
a detection medium, permitting it to make a solar model-independent test of the neutrino oscillation hypothesis bycomparison of the charged- and neutral-current interaction rates. In this paper the physical properties, construction, andpreliminary operation of the Sudbury Neutrino Observatory are described. Data and predicted operating parameters areprovided whenever possible. ( 2000 Elsevier Science B.V. All rights reserved.
PACS: 29.40.Ka; 29.40.Cs; 26.65; 14.60.Pq
Keywords: Solar neutrinos; Cherenkov detector; Heavy water; 3He-proportional counters; Water puri"cation
1. Introduction
The Sudbury Neutrino Observatory (SNO) hasbeen constructed to study the fundamental proper-ties of neutrinos, in particular the mass and mixingparameters. Neutrino oscillations between the elec-tron}#avor neutrino, m
%, and another neutrino #a-
vor have been proposed [1] as an explanation ofthe observed shortfall in the #ux of solar m
%reach-
ing the earth, as compared with theoretical ex-pectations [2]. SNO can test that hypothesis bymeasuring the #ux of m
%which are produced in the
sun, and comparing it to the #ux of all active#avors of solar neutrinos detected on earth in anappropriate energy interval. Observation of neu-trino #avor transformation through this compari-son would be compelling evidence of neutrinomass. Non-zero neutrino mass is evidence for phys-ics beyond the Standard Model of fundamentalparticle interactions [3}5].
The long distance to the sun makes the search forneutrino mass sensitive to much smaller mass split-tings than can be studied with terrestrial sources.Vacuum oscillations can change the ratio of neu-tral-current to charged-current interactions, pro-duce spectral distortions, and introduce timedependence in the measured rates. Furthermore,the matter density in the sun is su$ciently large toenhance the e!ects of small mixing between elec-tron neutrinos and mu or tau neutrinos. This mat-ter, or MSW [6}8], e!ect also applies when solarneutrinos traverse the earth, and may cause distinc-tive time and spectral modulations of the signal of
m%
in the SNO detector. Measurement of thesee!ects, made possible by the high counting rate andseparable m
%-speci"c and #avor-independent re-
sponses of the SNO detector, will permit the deter-mination of unique mass and mixing parameterswhen combined with the existing results of thelight-water Cherenkov detectors, 37Cl, and 71Gasolar neutrino experiments [9}17].
The SNO experiment is unique in that it utilizesheavy water, D
2O, in a spherical volume of 1 kt as
a target. The heavy water permits detection of neu-trinos through the reactions
mx#e~Pm
x#e~, (1)
m%#dPe~#p#p, (2)
mx#dPm
x#n#p, (3)
where mx
refers to any active #avor of neutrino.Each of these interactions is detected when one ormore electrons produce Cherenkov light that im-pinges on a phototube array. The elastic scattering(ES) of electrons by neutrinos (Eq. (1)) is highlydirectional, and establishes the sun as the source ofthe detected neutrinos. The charged-current (CC)absorption of m
%on deuterons (Eq. (2)) produces an
electron with an energy highly correlated with thatof the neutrino. This reaction is sensitive to theenergy spectrum of m
%and hence to deviations from
the parent spectrum. The neutral-current (NC) dis-integration of the deuteron by neutrinos (Eq. (3)) isindependent of neutrino #avor and has a thresholdof 2.2 MeV. To be detected, the resulting neutron
J. Boger et al. / Nuclear Instruments and Methods in Physics Research A 449 (2000) 172}207174
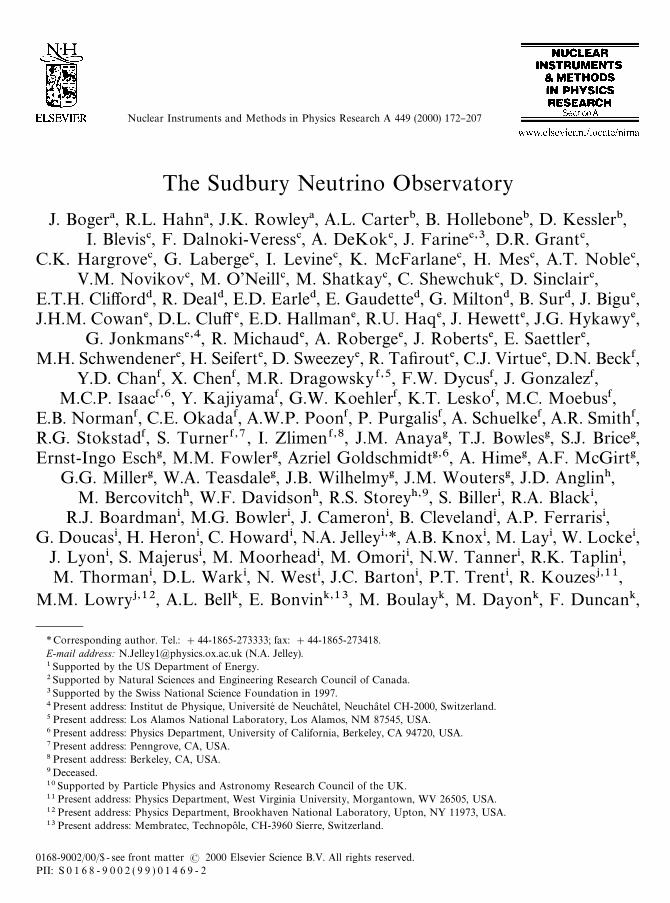
Fig. 1. General layout of the SNO Laboratory.
must be absorbed, giving a 6.25 MeV photon forabsorption on deuterium or photons totalling 8.6MeV for absorption on 35Cl with MgCl
2added to
the D2O. The photon subsequently Compton scat-
ters, imparting enough energy to electrons to createCherenkov light. (Once the special-purpose neu-tral-current detectors have been installed, they willprovide the primary neutron detection mechanism.See Section 8 for details.) Measurement of the rateof the NC reaction determines the total #ux of8B neutrinos, even if their #avor has been trans-formed to another active #avor (but not if to a ster-ile neutrino). The ability to measure the CC andNC reactions separately is unique to SNO andmakes the interpretation of the results of theexperiment independent of theoretical astrophysicscalculations.
All experiments performed to date have detectedfewer solar neutrinos than are expected from stan-dard solar models [18,19]. There are strong hintsthat this is the result of neutrino #avor transforma-tion between the production point in the sun andthe terrestrial detection point. However, these con-clusions are based on reference to a calculatedprediction. Through direct measurements of them%-speci"c CC reaction and the #avor-independent
NC reaction, the SNO detector will be the "rstexperiment to make a solar-model-independentmeasurement of the solar neutrino #ux.
SNO can make contributions, some of which areunique, in other areas of physics. An example of thelatter is a search for the relic supernova neutrinosintegrated over all past supernovae. For the relicsupernova neutrinos, the interaction of m6
%on pro-
tons in the deuterons produces a Cherenkov signalplus two neutrons, which makes a clean signature.Other topics that SNO will study include the #avorcomposition of the atmospheric neutrino #ux,searches for certain types of dark matter, and nuc-leon decay. The observatory is designed to handlethe high data rates induced by an intense burst ofneutrinos from a supernova explosion as close as1 kparsec away.
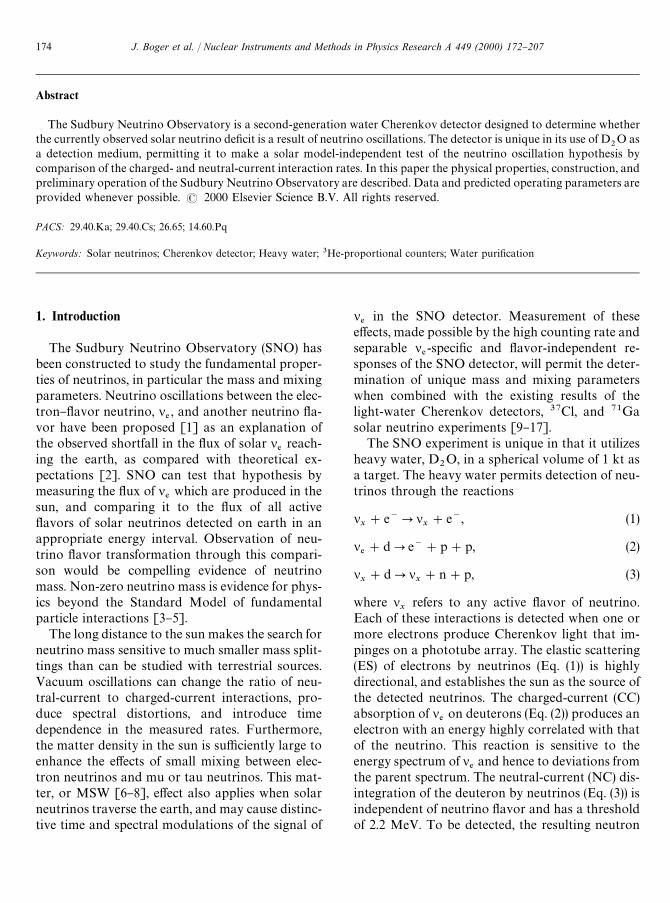
An overview of the SNO laboratory and detectoris given in Fig. 1. The detector consists of a trans-parent acrylic sphere 12 m in diameter, supportedfrom a deck structure by 10 rope loops made ofsynthetic "ber, as shown in Fig. 2. The sphere holds
1000 t of heavy water. Surrounding the acrylicvessel is a geodesic structure 17.8 m in diametermade of stainless-steel struts and carrying 9438inward-looking photomultiplier tubes. The barrel-shaped cavity, 22 m in diameter and 34 m in height,is "lled with puri"ed light water to provide supportand shielding.
The SNO detector is located at 46328@30A N,81312@04A W in the INCO, Ltd., Creighton minenear Sudbury, Ontario, Canada. The centre of thedetector vessel is 2039 m below the surface in a cav-ity excavated from the `6800-fta level of the mine.The surface is 309 m above sea level. The graniticrock overburden (mainly norite) corresponds toapproximately 6000 m water equivalent. At thisdepth, only about 70 muons pass through the de-tector (inside the photomultiplier array) per day.
The sections below detail the design criteria ofmany of the important aspects of the detector. Theextensive D
2O and H
2O puri"cation systems are
described in Section 2 and purity speci"cations aregiven there. Since SNO will add high purity MgCl
2to the D
2O to enhance the NC detection, a descrip-
tion of the system required to handle the heavywater brine is also given. The technically challeng-ing construction of the large acrylic vessel (`AVa)which holds the D
2O is described in Section 3. The
large array of PMTs and their basic operatingparameters are described in Section 4. The mater-ials and construction of the PMT support structureare described in Section 5.
175J. Boger et al. / Nuclear Instruments and Methods in Physics Research A 449 (2000) 172}207
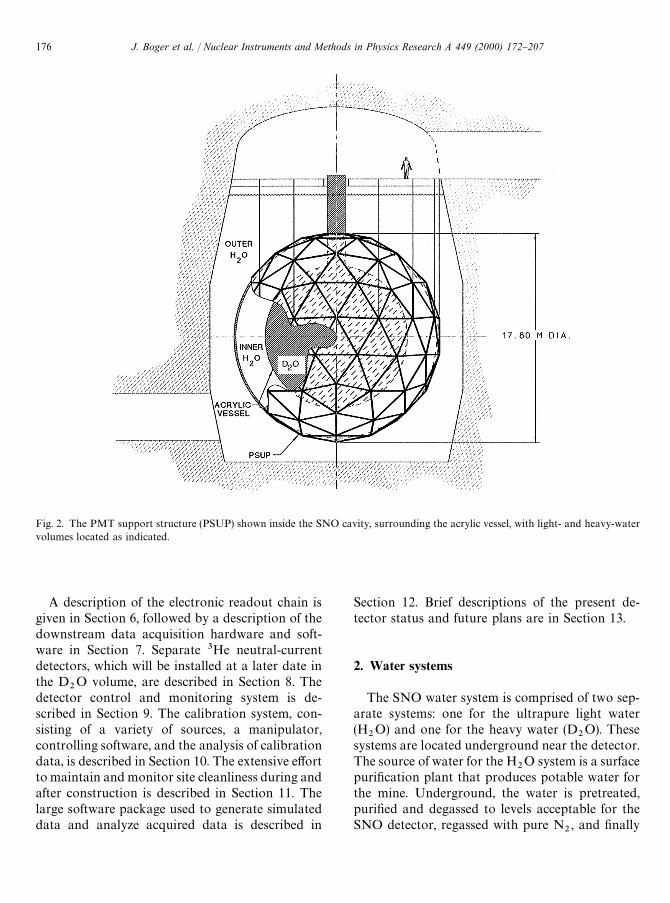
Fig. 2. The PMT support structure (PSUP) shown inside the SNO cavity, surrounding the acrylic vessel, with light- and heavy-watervolumes located as indicated.
A description of the electronic readout chain isgiven in Section 6, followed by a description of thedownstream data acquisition hardware and soft-ware in Section 7. Separate 3He neutral-currentdetectors, which will be installed at a later date inthe D
2O volume, are described in Section 8. The
detector control and monitoring system is de-scribed in Section 9. The calibration system, con-sisting of a variety of sources, a manipulator,controlling software, and the analysis of calibrationdata, is described in Section 10. The extensive e!ortto maintain and monitor site cleanliness during andafter construction is described in Section 11. Thelarge software package used to generate simulateddata and analyze acquired data is described in
Section 12. Brief descriptions of the present de-tector status and future plans are in Section 13.
2. Water systems
The SNO water system is comprised of two sep-arate systems: one for the ultrapure light water(H
2O) and one for the heavy water (D
2O). These
systems are located underground near the detector.The source of water for the H
2O system is a surface
puri"cation plant that produces potable water forthe mine. Underground, the water is pretreated,puri"ed and degassed to levels acceptable for theSNO detector, regassed with pure N
2, and "nally
J. Boger et al. / Nuclear Instruments and Methods in Physics Research A 449 (2000) 172}207176
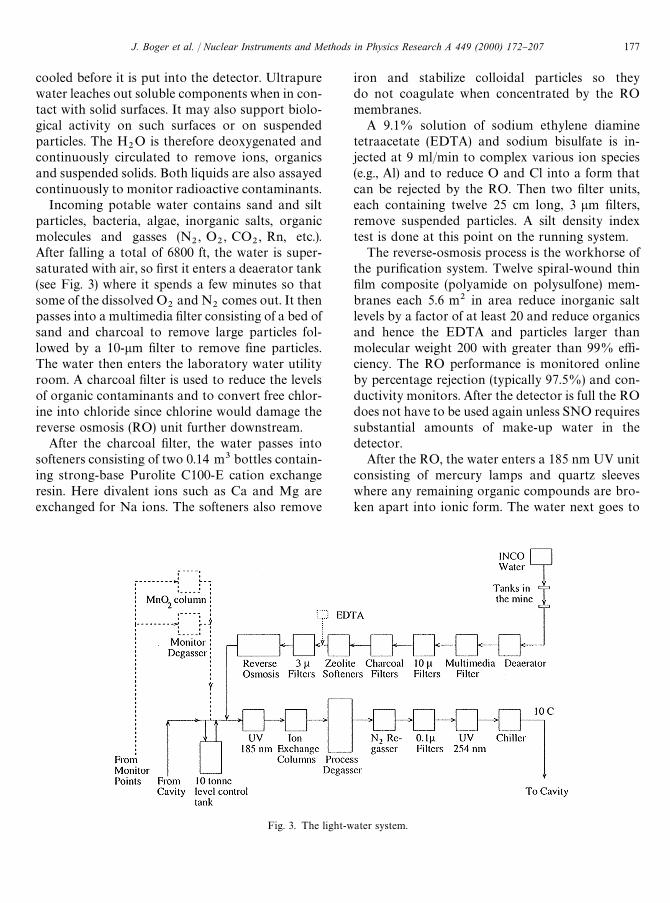
Fig. 3. The light-water system.
cooled before it is put into the detector. Ultrapurewater leaches out soluble components when in con-tact with solid surfaces. It may also support biolo-gical activity on such surfaces or on suspendedparticles. The H
2O is therefore deoxygenated and
continuously circulated to remove ions, organicsand suspended solids. Both liquids are also assayedcontinuously to monitor radioactive contaminants.
Incoming potable water contains sand and siltparticles, bacteria, algae, inorganic salts, organicmolecules and gasses (N
2, O
2, CO
2, Rn, etc.).
After falling a total of 6800 ft, the water is super-saturated with air, so "rst it enters a deaerator tank(see Fig. 3) where it spends a few minutes so thatsome of the dissolved O
2and N
2comes out. It then
passes into a multimedia "lter consisting of a bed ofsand and charcoal to remove large particles fol-lowed by a 10-lm "lter to remove "ne particles.The water then enters the laboratory water utilityroom. A charcoal "lter is used to reduce the levelsof organic contaminants and to convert free chlor-ine into chloride since chlorine would damage thereverse osmosis (RO) unit further downstream.
After the charcoal "lter, the water passes intosofteners consisting of two 0.14 m3 bottles contain-ing strong-base Purolite C100-E cation exchangeresin. Here divalent ions such as Ca and Mg areexchanged for Na ions. The softeners also remove
iron and stabilize colloidal particles so theydo not coagulate when concentrated by the ROmembranes.
A 9.1% solution of sodium ethylene diaminetetraacetate (EDTA) and sodium bisulfate is in-jected at 9 ml/min to complex various ion species(e.g., Al) and to reduce O and Cl into a form thatcan be rejected by the RO. Then two "lter units,each containing twelve 25 cm long, 3 lm "lters,remove suspended particles. A silt density indextest is done at this point on the running system.
The reverse-osmosis process is the workhorse ofthe puri"cation system. Twelve spiral-wound thin"lm composite (polyamide on polysulfone) mem-branes each 5.6 m2 in area reduce inorganic saltlevels by a factor of at least 20 and reduce organicsand hence the EDTA and particles larger thanmolecular weight 200 with greater than 99% e$-ciency. The RO performance is monitored onlineby percentage rejection (typically 97.5%) and con-ductivity monitors. After the detector is full the ROdoes not have to be used again unless SNO requiressubstantial amounts of make-up water in thedetector.
After the RO, the water enters a 185 nm UV unitconsisting of mercury lamps and quartz sleeveswhere any remaining organic compounds are bro-ken apart into ionic form. The water next goes to
177J. Boger et al. / Nuclear Instruments and Methods in Physics Research A 449 (2000) 172}207
an ion-exchange unit that removes remaining dis-solved ionized impurities left by the RO. These aretwo sets of six bottles in parallel containing 0.1 m3
of Purolite nuclear grade NWR-37 mixed (cationand anion) bed resins. The exiting water has a resis-tivity of 18.2 M) cm.
A custom-designed Process Degasser (PD) isused to reduce the O
2and Rn levels by factors of
about 1000 and 50, respectively, in the water [20].The PD consists of a large electropolished stainlesssteel vessel (81 cm diameter by 6 m high) containingshower heads, spherical polypropylene packing andheater elements and pumped with a mechanicalbooster pump (Edwards EH500A) backed bya four-stage positive displacement rotary pump(Edwards QDP80 Drystar). Vacuum is maintainedat 20 Torr and water vapour #ow rate at one kg/h.The PD removes all gases from the water and cancause, by di!usion, low pressures inside the under-water PMT connectors. Low pressure compro-mises the breakdown voltage of the connectors, andin a successful e!ort to reduce breakdowns thatoccurred with degassed water, the water was re-gassed with pure nitrogen to atmospheric pressureat the 2000 m depth using a gas permeable mem-brane unit. This unit is followed by 0.1 lm "lters toremove particulates. Then a 254 nm UV unit isused to kill bacteria. Finally a chiller cools thewater to 103C before water is put into the detectorat a rate of 150 l/min.
The water mass between the AV and the PMTs isabout 1700 t and the mass between the PMTs andthe cavity walls is 5700 t. Water enters the detectorbetween the AV and PMTs. Because this region hasto be cleaner than the region outside, a 99.99%leak-tight plastic barrier seals the back of thePMTs. Water in the outer region is dirtier due to itslarge content of submersed material (cables, steelsupport, cavity liner, etc.). Water is drawn from thisregion back to the utility room and into a recircula-tion loop. This loop consists of a 10 t polypropy-lene tank (used by the control loop to maintainconstant water level in the detector), the "rst UVunit, the ion exchange columns, the process de-gasser, the N
2regassing unit, the 0.1 lm "lters, the
second UV unit and the chiller. The recirculatedlight water is assayed regularly for pH, conductiv-ity, turbidity, anions, cations, suspended solids,
dissolved gases, and radioactivity. This is accom-plished by means of six sample pipes in the H
2O
volume.The heavy water system is designed to perform
the following functions:
f Receive the D2O and make an initial puri"ca-
tion to reduce the amount of contaminationreaching the main system.
f Purify the D2O with or without the MgCl
2addi-
tive.f Assay the D
2O or D
2O brine to make an accu-
rate background determination.f Manage the addition and removal of the MgCl
2additive on a time scale short relative to theexpected running times.
A diagram of the system is shown in Fig. 4.The source of D
2O was the Ontario Hydro
Bruce heavy water plant beside Lake Huron. TheD
2O was trucked to the SNO site and transported
underground. It was cleaned and stored tempora-rily before it was put into the acrylic vessel (AV).Heavy water delivered to the lab was "rst passedthrough ion-exchange columns to reduce its ioniccontent, in particular its K content. The D
2O then
went into a large polypropylene-lined tank. Duringthe "lling of the H
2O and D
2O, the D
2O was "lled
at such a rate as to maintain zero pressure dif-ferential across the bottom of the AV, which as-sured that the vessel surface was generally incompression.
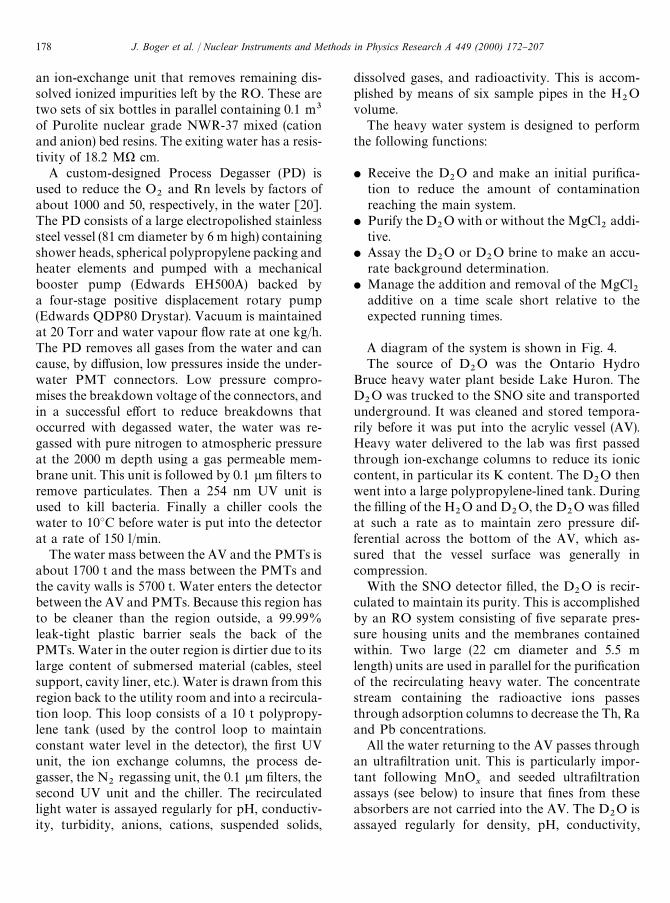
With the SNO detector "lled, the D2O is recir-
culated to maintain its purity. This is accomplishedby an RO system consisting of "ve separate pres-sure housing units and the membranes containedwithin. Two large (22 cm diameter and 5.5 mlength) units are used in parallel for the puri"cationof the recirculating heavy water. The concentratestream containing the radioactive ions passesthrough adsorption columns to decrease the Th, Raand Pb concentrations.
All the water returning to the AV passes throughan ultra"ltration unit. This is particularly impor-tant following MnO
xand seeded ultra"ltration
assays (see below) to insure that "nes from theseabsorbers are not carried into the AV. The D
2O is
assayed regularly for density, pH, conductivity,
J. Boger et al. / Nuclear Instruments and Methods in Physics Research A 449 (2000) 172}207178
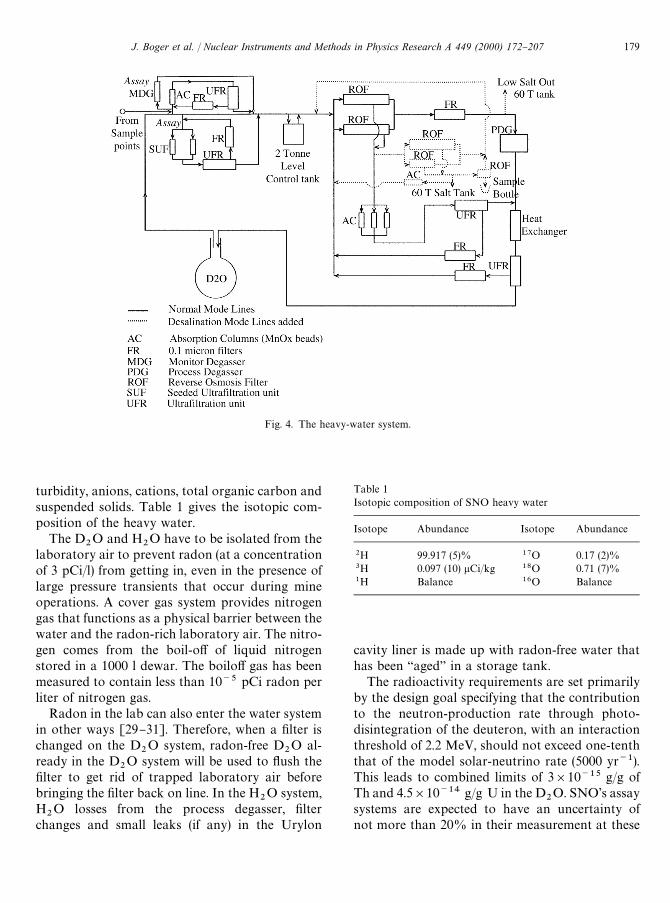
Fig. 4. The heavy-water system.
Table 1Isotopic composition of SNO heavy water
Isotope Abundance Isotope Abundance
2H 99.917 (5)% 17O 0.17 (2)%3H 0.097 (10) lCi/kg 18O 0.71 (7)%1H Balance 16O Balance
turbidity, anions, cations, total organic carbon andsuspended solids. Table 1 gives the isotopic com-position of the heavy water.
The D2O and H
2O have to be isolated from the
laboratory air to prevent radon (at a concentrationof 3 pCi/l) from getting in, even in the presence oflarge pressure transients that occur during mineoperations. A cover gas system provides nitrogengas that functions as a physical barrier between thewater and the radon-rich laboratory air. The nitro-gen comes from the boil-o! of liquid nitrogenstored in a 1000 l dewar. The boilo! gas has beenmeasured to contain less than 10~5 pCi radon perliter of nitrogen gas.
Radon in the lab can also enter the water systemin other ways [29}31]. Therefore, when a "lter ischanged on the D
2O system, radon-free D
2O al-
ready in the D2O system will be used to #ush the
"lter to get rid of trapped laboratory air beforebringing the "lter back on line. In the H
2O system,
H2O losses from the process degasser, "lter
changes and small leaks (if any) in the Urylon
cavity liner is made up with radon-free water thathas been `ageda in a storage tank.
The radioactivity requirements are set primarilyby the design goal specifying that the contributionto the neutron-production rate through photo-disintegration of the deuteron, with an interactionthreshold of 2.2 MeV, should not exceed one-tenththat of the model solar-neutrino rate (5000 yr~1).This leads to combined limits of 3]10~15 g/g ofTh and 4.5]10~14 g/g U in the D
2O. SNO's assay
systems are expected to have an uncertainty ofnot more than 20% in their measurement at these
179J. Boger et al. / Nuclear Instruments and Methods in Physics Research A 449 (2000) 172}207
Fig. 5. The SNO acrylic containment vessel.
impurity levels, although plating may give rise toa systematic uncertainty. There are six sample pipesin various locations inside the AV that allow D
2O
samples to be withdrawn for radioassay.For Th, Ra and Pb assay the seeded ultra"ltra-
tion [21,22] technique (SUF) will be used. The SUFunit contains four large micro"lters thinly coatedwith DTiO. One hundred tonnes of water at a rateof 150 l/min will be passed through them. Then the"lters are removed and the Th, Ra, and Pb strippedo! and counted. Acrylic beads coated with MnO
xhave been shown to be an excellent adsorber for Rawith an extraction e$ciency of about 90% [23,24].Water is passed at 20 l/min through a 1 l columncontaining the MnO
xwhich is removed o!-line for
counting of the Ra daughters using an electrostaticdevice in which charged ions are deposited on thesurface of a silicon detector [25].
The number of 222Rn (3.8 d half-life) is measuredin 6 t of liquid taken from one of six regions in theH
2O or one of six regions in the D
2O. The 6 t of
water are put through a small vacuum degasser[26,27] at 20 l/min. The gasses which are removedfrom the water are primarily N
2, O
2, Ar, CO
2and
a few hundred atoms of 222Rn, as well as 10 ml/minin the form of water vapour. Rn is subsequentlyfrozen out in a U-shaped trap cooled with liquidnitrogen (!1923C) and transferred to a ZnS-coatedscintillation cell [28] for counting.
To enhance the neutral-current detection,MgCl
2will be added to the water to take advan-
tage of the larger neutron-capture cross section ofCl relative to deuterium. A concentration of ap-proximately 0.2% will be used. A D
2O brine solu-
tion that has been puri"ed prior to transportunderground is put into a large polypropylene-lined tank. When it is time to add the MgCl
2to the
AV, this tank will slowly be emptied. At the sametime, an equivalent volume of salt-free D
2O will be
taken out of the AV and put into a second poly-propylene-lined tank.
To take the MgCl2
out of the AV, the thirdRO unit will be used in combination with thetwo main ones to desalinate the water to about100 parts per million (ppm). In a second desali-nation pass, a fourth, smaller RO unit will beadded to the process to desalinate the D
2O to
about 1 ppm.
3. Acrylic vessel
The D2O containment vessel must meet diverse
requirements, some of which present opposing de-sign constraints. The primary design criteria for thecontainment vessel are:
f Isolate 1000 t of D2O from surrounding H
2O.
f Maintain structural integrity and performanceover 10 yr while immersed in ultrapure D
2O and
H2O and subjected to the seismic activity ex-
pected in an operating mine.f Minimize the total mass of radioactive im-
purities.f Maximize optical performance.f Design for construction in the mine.
The design criteria listed above resulted in thecontainment vessel shown in Fig. 5.
A 12 m diameter sphere was chosen as the opti-mum shape for the containment vessel. A spherehas the largest volume-to-surface ratio, and optimum
J. Boger et al. / Nuclear Instruments and Methods in Physics Research A 449 (2000) 172}207180
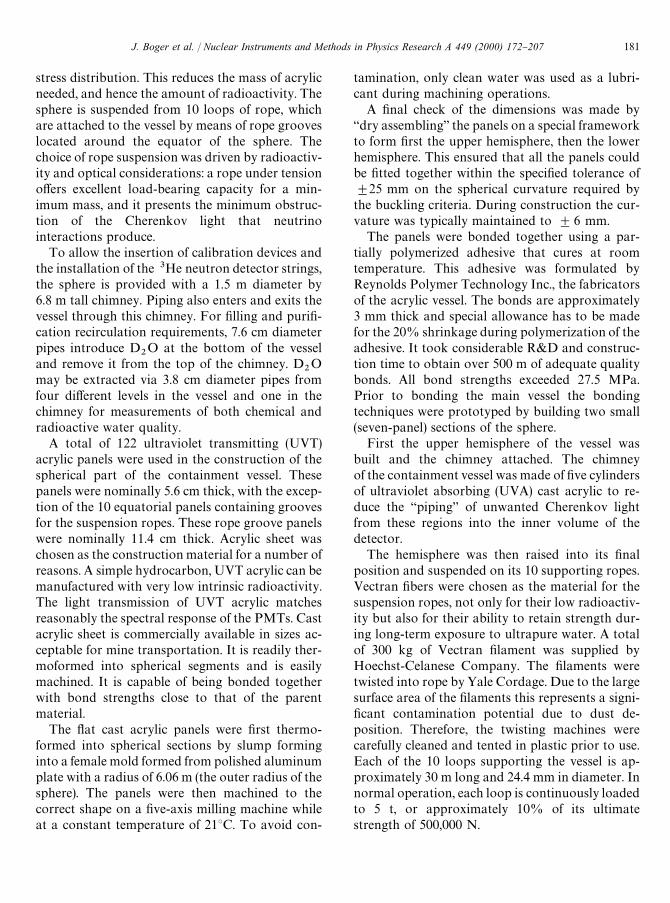
stress distribution. This reduces the mass of acrylicneeded, and hence the amount of radioactivity. Thesphere is suspended from 10 loops of rope, whichare attached to the vessel by means of rope grooveslocated around the equator of the sphere. Thechoice of rope suspension was driven by radioactiv-ity and optical considerations: a rope under tensiono!ers excellent load-bearing capacity for a min-imum mass, and it presents the minimum obstruc-tion of the Cherenkov light that neutrinointeractions produce.
To allow the insertion of calibration devices andthe installation of the 3He neutron detector strings,the sphere is provided with a 1.5 m diameter by6.8 m tall chimney. Piping also enters and exits thevessel through this chimney. For "lling and puri"-cation recirculation requirements, 7.6 cm diameterpipes introduce D
2O at the bottom of the vessel
and remove it from the top of the chimney. D2O
may be extracted via 3.8 cm diameter pipes fromfour di!erent levels in the vessel and one in thechimney for measurements of both chemical andradioactive water quality.
A total of 122 ultraviolet transmitting (UVT)acrylic panels were used in the construction of thespherical part of the containment vessel. Thesepanels were nominally 5.6 cm thick, with the excep-tion of the 10 equatorial panels containing groovesfor the suspension ropes. These rope groove panelswere nominally 11.4 cm thick. Acrylic sheet waschosen as the construction material for a number ofreasons. A simple hydrocarbon, UVT acrylic can bemanufactured with very low intrinsic radioactivity.The light transmission of UVT acrylic matchesreasonably the spectral response of the PMTs. Castacrylic sheet is commercially available in sizes ac-ceptable for mine transportation. It is readily ther-moformed into spherical segments and is easilymachined. It is capable of being bonded togetherwith bond strengths close to that of the parentmaterial.
The #at cast acrylic panels were "rst thermo-formed into spherical sections by slump forminginto a female mold formed from polished aluminumplate with a radius of 6.06 m (the outer radius of thesphere). The panels were then machined to thecorrect shape on a "ve-axis milling machine whileat a constant temperature of 213C. To avoid con-
tamination, only clean water was used as a lubri-cant during machining operations.
A "nal check of the dimensions was made by`dry assemblinga the panels on a special frameworkto form "rst the upper hemisphere, then the lowerhemisphere. This ensured that all the panels couldbe "tted together within the speci"ed tolerance of$25 mm on the spherical curvature required bythe buckling criteria. During construction the cur-vature was typically maintained to $6 mm.
The panels were bonded together using a par-tially polymerized adhesive that cures at roomtemperature. This adhesive was formulated byReynolds Polymer Technology Inc., the fabricatorsof the acrylic vessel. The bonds are approximately3 mm thick and special allowance has to be madefor the 20% shrinkage during polymerization of theadhesive. It took considerable R&D and construc-tion time to obtain over 500 m of adequate qualitybonds. All bond strengths exceeded 27.5 MPa.Prior to bonding the main vessel the bondingtechniques were prototyped by building two small(seven-panel) sections of the sphere.
First the upper hemisphere of the vessel wasbuilt and the chimney attached. The chimneyof the containment vessel was made of "ve cylindersof ultraviolet absorbing (UVA) cast acrylic to re-duce the `pipinga of unwanted Cherenkov lightfrom these regions into the inner volume of thedetector.
The hemisphere was then raised into its "nalposition and suspended on its 10 supporting ropes.Vectran "bers were chosen as the material for thesuspension ropes, not only for their low radioactiv-ity but also for their ability to retain strength dur-ing long-term exposure to ultrapure water. A totalof 300 kg of Vectran "lament was supplied byHoechst-Celanese Company. The "laments weretwisted into rope by Yale Cordage. Due to the largesurface area of the "laments this represents a signi-"cant contamination potential due to dust de-position. Therefore, the twisting machines werecarefully cleaned and tented in plastic prior to use.Each of the 10 loops supporting the vessel is ap-proximately 30 m long and 24.4 mm in diameter. Innormal operation, each loop is continuously loadedto 5 t, or approximately 10% of its ultimatestrength of 500,000 N.
181J. Boger et al. / Nuclear Instruments and Methods in Physics Research A 449 (2000) 172}207
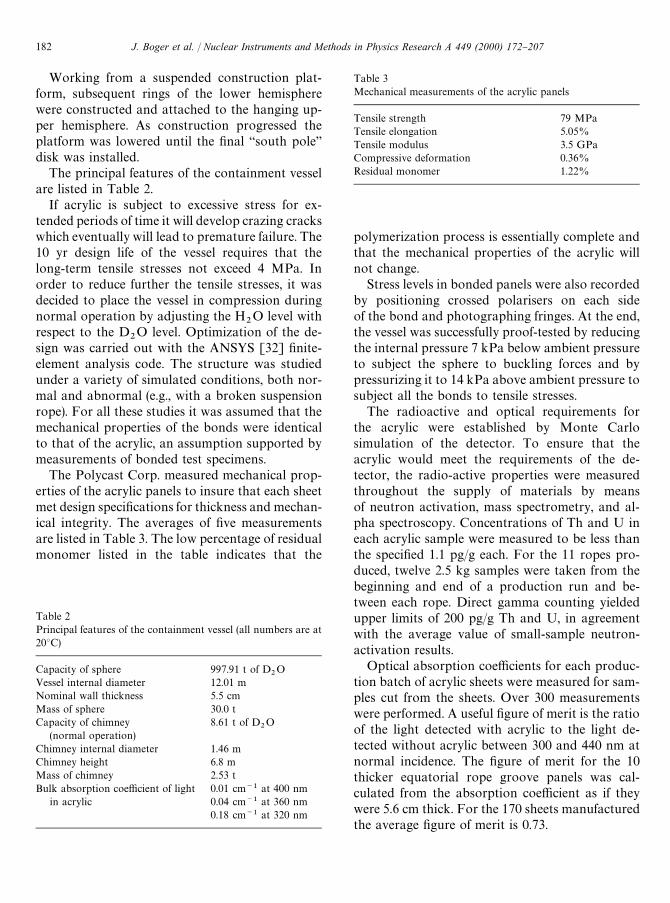
Table 2Principal features of the containment vessel (all numbers are at203C)
Capacity of sphere 997.91 t of D2O
Vessel internal diameter 12.01 mNominal wall thickness 5.5 cmMass of sphere 30.0 tCapacity of chimney 8.61 t of D
2O
(normal operation)Chimney internal diameter 1.46 mChimney height 6.8 mMass of chimney 2.53 tBulk absorption coe$cient of light 0.01 cm~1 at 400 nm
in acrylic 0.04 cm~1 at 360 nm0.18 cm~1 at 320 nm
Table 3Mechanical measurements of the acrylic panels
Tensile strength 79 MPaTensile elongation 5.05%Tensile modulus 3.5 GPaCompressive deformation 0.36%Residual monomer 1.22%
Working from a suspended construction plat-form, subsequent rings of the lower hemispherewere constructed and attached to the hanging up-per hemisphere. As construction progressed theplatform was lowered until the "nal `south poleadisk was installed.
The principal features of the containment vesselare listed in Table 2.
If acrylic is subject to excessive stress for ex-tended periods of time it will develop crazing crackswhich eventually will lead to premature failure. The10 yr design life of the vessel requires that thelong-term tensile stresses not exceed 4 MPa. Inorder to reduce further the tensile stresses, it wasdecided to place the vessel in compression duringnormal operation by adjusting the H
2O level with
respect to the D2O level. Optimization of the de-
sign was carried out with the ANSYS [32] "nite-element analysis code. The structure was studiedunder a variety of simulated conditions, both nor-mal and abnormal (e.g., with a broken suspensionrope). For all these studies it was assumed that themechanical properties of the bonds were identicalto that of the acrylic, an assumption supported bymeasurements of bonded test specimens.
The Polycast Corp. measured mechanical prop-erties of the acrylic panels to insure that each sheetmet design speci"cations for thickness and mechan-ical integrity. The averages of "ve measurementsare listed in Table 3. The low percentage of residualmonomer listed in the table indicates that the
polymerization process is essentially complete andthat the mechanical properties of the acrylic willnot change.
Stress levels in bonded panels were also recordedby positioning crossed polarisers on each sideof the bond and photographing fringes. At the end,the vessel was successfully proof-tested by reducingthe internal pressure 7 kPa below ambient pressureto subject the sphere to buckling forces and bypressurizing it to 14 kPa above ambient pressure tosubject all the bonds to tensile stresses.
The radioactive and optical requirements forthe acrylic were established by Monte Carlosimulation of the detector. To ensure that theacrylic would meet the requirements of the de-tector, the radio-active properties were measuredthroughout the supply of materials by meansof neutron activation, mass spectrometry, and al-pha spectroscopy. Concentrations of Th and U ineach acrylic sample were measured to be less thanthe speci"ed 1.1 pg/g each. For the 11 ropes pro-duced, twelve 2.5 kg samples were taken from thebeginning and end of a production run and be-tween each rope. Direct gamma counting yieldedupper limits of 200 pg/g Th and U, in agreementwith the average value of small-sample neutron-activation results.
Optical absorption coe$cients for each produc-tion batch of acrylic sheets were measured for sam-ples cut from the sheets. Over 300 measurementswere performed. A useful "gure of merit is the ratioof the light detected with acrylic to the light de-tected without acrylic between 300 and 440 nm atnormal incidence. The "gure of merit for the 10thicker equatorial rope groove panels was cal-culated from the absorption coe$cient as if theywere 5.6 cm thick. For the 170 sheets manufacturedthe average "gure of merit is 0.73.
J. Boger et al. / Nuclear Instruments and Methods in Physics Research A 449 (2000) 172}207182
4. Photomultiplier tubes
The primary design considerations for the PMTsystem are
f High photon detection e$ciency.f Minimal amount of radioactivities in all com-
ponents, (120 ng/g U, (90 ng/g Th,(0.2 mg/g K.
f Low failure rate for a 10 yr lifespan submerged inultrapure water at a pressure of 200 kPa and forthe seismic activity expected at the SNO site.
f Fast anode pulse rise time and fall time and lowphotoelectron transit time spread, for a single-photoelectron timing resolution standard devi-ation (1.70 ns.
f Low dark current noise rate, (8 kHz, ata charge gain of 107.
f Operating voltage less than 3000 V.f Reasonable charge resolution, '1.25 peak to
valley.f Low prepulse, late-pulse and after-pulse frac-
tions, (1.5%.f Low sensitivity of PMT parameters to external
magnetic "eld: at 100 mG, less than 10% gainreduction and less than 20% timing resolutiondegradation.
Raw materials from the manufacturers of the PMTcomponents, bases, cables, and housings were as-sayed for radioactivity [33]. The leach rates ofdi!erent types of glass and plastic were alsomeasured.
The photomultiplier tubes (PMTs) are immersedin ultrapure water to a maximum depth of 22 m,corresponding to a maximum water pressure of200 kPa above atmospheric pressure. The failurerate of the PMT components, which consist of thePMT, the resistor chain and the HV/signal cable,must be compatible with the expected approximate10 yr detector lifetime. This puts severe constraintson the choice of glass for the PMT envelope, theshape of the envelope, the type of cable, and thedesign of the waterproof enclosure that protectsthe resistor chain. Raw materials from all manufac-turers were assayed for radioactivity [33]. Thedominant contributor to the contaminant contentof the PMT is the glass which has a mass of 850 gand Th and U impurity levels of roughly 40 ppb.
The leach rates of di!erent types of glass and plasticwere also measured.
Following detailed stress analysis of the pro-posed glass envelopes, a mushroom-shapedenvelope was judged to be most suitable for thisunderwater application and least likely to deteri-orate under long-term hydraulic pressure in UPW.Schott Glaswerke produced a new borosilicateglass (Schott 8246) for SNO. The Th and Uimpurities in this glass are less than 40 ppb.Its water resistance is rated as class 1 (same asPyrex). In addition, this glass has outstanding op-tical transmission properties at short wavelengths,with a bulk light absorption coe$cient of betterthan 0.5 cm~1 at 320 nm wavelength, and lowHe permeability. Schott re"tted a furnace witha special low-radioactivity liner to produce16,000 mouthblown bulbs for SNO and the LSNDProject [34].
The most important PMT parameters are thenoise rate, the e$ciency, the transit-time spreadand the amount of K, U and Th in each PMT. Theenergy resolution and the event vertex spatial res-olution are largely determined by the "rst threeparameters and the detector energy threshold isstrongly a!ected by the radioactivities in the PMTcomponents.
The Hamamatsu R1408 PMT was selected foruse in SNO. A schematic drawing of the R1408 isshown in Fig. 6. From the measured U and Thconcentrations in the internal parts and glass envel-ope, the total weight of Th and U in each PMT isestimated to be about 100 lg, about a factor of 14below speci"cations. The 9438 inward facing PMTscollect the Cherenkov photons, providing a photo-cathode coverage at 31%. To improve the lightcollection e$ciency, a 27 cm diameter light concen-trator is mounted on each PMT, increasing thee!ective photocathode coverage to about 59%. There#ectivity of the concentrator reduces this "gure to54%. Of the inward facing tubes, 49 have a dynodetap and a second signal cable. These `low gainachannels extend the dynamic range of SNO at highlight intensities by about a factor of 100. Another91 PMTs without concentrators are mountedfacing outward to detect light from muons andother sources in the region exterior to the PMTsupport structure.
183J. Boger et al. / Nuclear Instruments and Methods in Physics Research A 449 (2000) 172}207
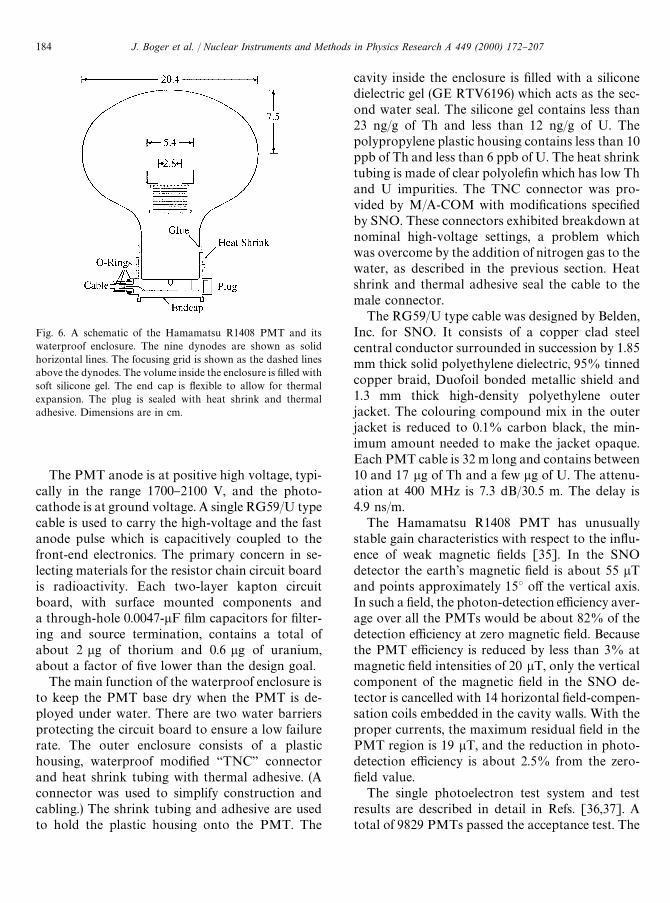
Fig. 6. A schematic of the Hamamatsu R1408 PMT and itswaterproof enclosure. The nine dynodes are shown as solidhorizontal lines. The focusing grid is shown as the dashed linesabove the dynodes. The volume inside the enclosure is "lled withsoft silicone gel. The end cap is #exible to allow for thermalexpansion. The plug is sealed with heat shrink and thermaladhesive. Dimensions are in cm.
The PMT anode is at positive high voltage, typi-cally in the range 1700}2100 V, and the photo-cathode is at ground voltage. A single RG59/U typecable is used to carry the high-voltage and the fastanode pulse which is capacitively coupled to thefront-end electronics. The primary concern in se-lecting materials for the resistor chain circuit boardis radioactivity. Each two-layer kapton circuitboard, with surface mounted components anda through-hole 0.0047-lF "lm capacitors for "lter-ing and source termination, contains a total ofabout 2 lg of thorium and 0.6 lg of uranium,about a factor of "ve lower than the design goal.
The main function of the waterproof enclosure isto keep the PMT base dry when the PMT is de-ployed under water. There are two water barriersprotecting the circuit board to ensure a low failurerate. The outer enclosure consists of a plastichousing, waterproof modi"ed `TNCa connectorand heat shrink tubing with thermal adhesive. (Aconnector was used to simplify construction andcabling.) The shrink tubing and adhesive are usedto hold the plastic housing onto the PMT. The
cavity inside the enclosure is "lled with a siliconedielectric gel (GE RTV6196) which acts as the sec-ond water seal. The silicone gel contains less than23 ng/g of Th and less than 12 ng/g of U. Thepolypropylene plastic housing contains less than 10ppb of Th and less than 6 ppb of U. The heat shrinktubing is made of clear polyole"n which has low Thand U impurities. The TNC connector was pro-vided by M/A-COM with modi"cations speci"edby SNO. These connectors exhibited breakdown atnominal high-voltage settings, a problem whichwas overcome by the addition of nitrogen gas to thewater, as described in the previous section. Heatshrink and thermal adhesive seal the cable to themale connector.
The RG59/U type cable was designed by Belden,Inc. for SNO. It consists of a copper clad steelcentral conductor surrounded in succession by 1.85mm thick solid polyethylene dielectric, 95% tinnedcopper braid, Duofoil bonded metallic shield and1.3 mm thick high-density polyethylene outerjacket. The colouring compound mix in the outerjacket is reduced to 0.1% carbon black, the min-imum amount needed to make the jacket opaque.Each PMT cable is 32 m long and contains between10 and 17 lg of Th and a few lg of U. The attenu-ation at 400 MHz is 7.3 dB/30.5 m. The delay is4.9 ns/m.
The Hamamatsu R1408 PMT has unusuallystable gain characteristics with respect to the in#u-ence of weak magnetic "elds [35]. In the SNOdetector the earth's magnetic "eld is about 55 lTand points approximately 153 o! the vertical axis.In such a "eld, the photon-detection e$ciency aver-age over all the PMTs would be about 82% of thedetection e$ciency at zero magnetic "eld. Becausethe PMT e$ciency is reduced by less than 3% atmagnetic "eld intensities of 20 lT, only the verticalcomponent of the magnetic "eld in the SNO de-tector is cancelled with 14 horizontal "eld-compen-sation coils embedded in the cavity walls. With theproper currents, the maximum residual "eld in thePMT region is 19 lT, and the reduction in photo-detection e$ciency is about 2.5% from the zero-"eld value.
The single photoelectron test system and testresults are described in detail in Refs. [36,37]. Atotal of 9829 PMTs passed the acceptance test. The
J. Boger et al. / Nuclear Instruments and Methods in Physics Research A 449 (2000) 172}207184
average RMS timing resolution is found to be1.7 ns, in line with the speci"cation. The meanrelative e$ciency, de"ned in Ref. [36], is 10% bet-ter than speci"cation. The mean noise rate is 2.3kHz at 203C. The cooler temperature in the de-tector (approximately 103C) reduces the mean noiserate to approximately 500 Hz, including signals dueto residual radioactivity in the detector. The meanoperating voltage is 1875 V.
5. Photomultiplier tube support structure
The photomultiplier tubes, their light concentra-tors and associated hardware are collectivelyreferred to as the PMT Support Structure or thePSUP. The geometry of this platform is funda-mentally established by maximizing photon collec-tion while minimizing background signals,fabrication costs, complexity, and transportationand installation intricacy. The D
2O target ge-
ometry, the PMT speci"cations, light concentratorperformance, and cavity geometry all a!ect the"nal PSUP con"guration.
The PSUP serves the additional function of pro-viding a barrier between the core of the experiment(the D
2O target and light collection surfaces) and
the outer regions of the experiment. This barriershields the PMTs from light generated in the outerregions of the experiment. These regions include thecavity walls and the support piping and cabling forthe experiment. Near the cavity walls the radio-activity in the surrounding rock creates a signi"-cant photon background. The complexity of thecabling and piping makes the outer region di$cultto clean and keep clean during construction andthe radioactive purity of the materials needed forsome of these functions could not be reasonablycontrolled to the same levels as other detector com-ponents. The PSUP also functions as a highly im-permeable barrier to waterborne contamination,ensuring that the highly puri"ed water in the sensi-tive region between the PMTs and the AV is e!ec-tively isolated from the dirtier water in the outerregions.
The PSUP also supports the outward lookingPMTs, LED calibration sources, and water-recir-culation and monitoring piping.
The design criteria for the PSUP include:
f Maximizing the collection of optical signals fromthe D
2O target while minimizing a variety of
background sources.f Maintaining performance and integrity of the
array, with no required maintenance, for at leasta 10 yr span submerged in ultrapure water andfor a variety of seismic conditions anticipated atthe SNO site.
f Minimizing the mass of the components to re-duce intrinsic backgrounds.
f Producing and fabricating the array fromdocumented low radioactivity materials.
f Maintaining a high impermeability water barrierbetween the inner and outer light water regions.
f Maintaining an e!ective barrier to light gener-ated in the outer regions.
f Minimizing the complications of transportingand installing the array at the underground site.
f Producing and fabricating the array from mater-ials inimical to biological growth with low leach-ing characteristics, low magnetic susceptibilityand low electrolytic characteristics.
f Utilizing materials and installation processescompatible with the underground (mining)environment.
f Installing the upper half of the geodesic sphereand supporting the loads of roughly half thedetector array during which time the AV isconstructed.
The PSUP is logically viewed as two systems} a geodesic sphere that functions as the mainsupport system and the panel arrays that house thePMTs and concentrators. The geodesic sphere, an889-cm radius three-frequency icosahedron, isshown in Fig. 2. Normally, this geodesic spherewould utilize 92 nodal connections between the 270struts. This choice of geodesic structure uses threedi!erent strut lengths with similar linear dimen-sions. The topmost node is replaced with a hollowtoroidal ring and the connecting struts shortened toaccommodate the acrylic vessel chimney. Addi-tional toroidal rings guide the acrylic vessel sup-port ropes through the PSUP. Ninety-one outwardviewing PMTs are supported on the PSUP struts.The design of the geodesic sphere and panel arraysis fully documented [38].
185J. Boger et al. / Nuclear Instruments and Methods in Physics Research A 449 (2000) 172}207
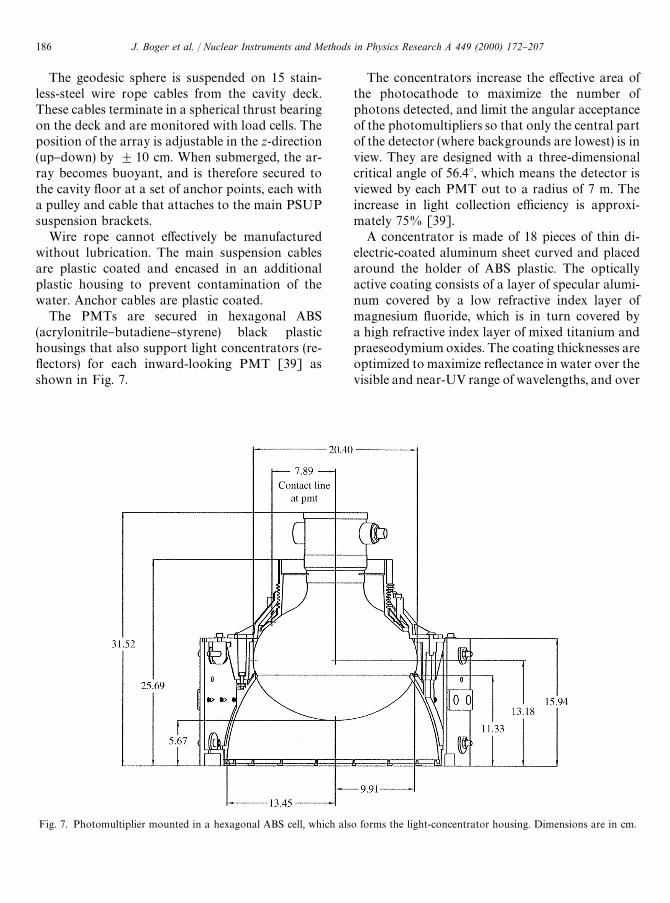
Fig. 7. Photomultiplier mounted in a hexagonal ABS cell, which also forms the light-concentrator housing. Dimensions are in cm.
The geodesic sphere is suspended on 15 stain-less-steel wire rope cables from the cavity deck.These cables terminate in a spherical thrust bearingon the deck and are monitored with load cells. Theposition of the array is adjustable in the z-direction(up}down) by $10 cm. When submerged, the ar-ray becomes buoyant, and is therefore secured tothe cavity #oor at a set of anchor points, each witha pulley and cable that attaches to the main PSUPsuspension brackets.
Wire rope cannot e!ectively be manufacturedwithout lubrication. The main suspension cablesare plastic coated and encased in an additionalplastic housing to prevent contamination of thewater. Anchor cables are plastic coated.
The PMTs are secured in hexagonal ABS(acrylonitrile}butadiene}styrene) black plastichousings that also support light concentrators (re-#ectors) for each inward-looking PMT [39] asshown in Fig. 7.
The concentrators increase the e!ective area ofthe photocathode to maximize the number ofphotons detected, and limit the angular acceptanceof the photomultipliers so that only the central partof the detector (where backgrounds are lowest) is inview. They are designed with a three-dimensionalcritical angle of 56.43, which means the detector isviewed by each PMT out to a radius of 7 m. Theincrease in light collection e$ciency is approxi-mately 75% [39].
A concentrator is made of 18 pieces of thin di-electric-coated aluminum sheet curved and placedaround the holder of ABS plastic. The opticallyactive coating consists of a layer of specular alumi-num covered by a low refractive index layer ofmagnesium #uoride, which is in turn covered bya high refractive index layer of mixed titanium andpraeseodymium oxides. The coating thicknesses areoptimized to maximize re#ectance in water over thevisible and near-UV range of wavelengths, and over
J. Boger et al. / Nuclear Instruments and Methods in Physics Research A 449 (2000) 172}207186

23The PSUP conforms to numerous construction codes andstandards. American Institute of Steel Construction Manual ofSteel Construction, Allowable Stress Design, 9th edition, 1989,American Society for Testing and Materials, American NationalStandards Institute, ANSI Y14.5M, American Welding Society,and Lawrence Berkeley Laboratory Health and Safety Manual(Pub. 3000).
a wide range of incident angles. The mean e!ectivere#ectance in water is 82$3%.
The top dielectric layer also forms a protectivebarrier against corrosion in water and was appliedto the back-exposed surface of the aluminum piecesas well. A protective layer of titanium oxide wasapplied to the edges. The material was subjected toextensive aging prior to construction. It was foundto have a useful life of many years under deoxygen-ated deionized water with a pH around 7, thenormal environment in SNO.
The hexagonal PMT assemblies are collectedtogether into #at arrays of between 7 and 21PMTs to form a set of repeating arrays used totessellate the spherical surface of the geodesic struc-ture. Each panel array is secured to the geodesicstructure with three adjustable mounts. Thesemounts permit the delicate panel arrays to accom-modate the geodesic structure struts #exing underchanging load conditions (most notably, when go-ing from a fully instrumented dry array to a fullysubmerged array). This alignment is critical to en-sure that each PMT views the full D
2O volume.
A total of 751 panel arrays tessellate the sphereproviding 9522 hexagonal cells. Of these locations,the "nal design used 60 cells to accomodate the 20AV ropes and six to provide access at six locationsfor calibration sources preserving the optical andwater #ow requirements for the array. During thewater "ll 18 PMTs were removed for diagnostictesting and their locations appropriately capped,leaving 9438 cells occupied with PMTs. The hexag-onal cells cover &85% of the surface area of thegeodesic sphere.
Water piping and sampling tubes as well as sev-eral pulsed blue LED calibration devices are ac-commodated in the small spaces between PMTpanel arrays.
The PMT support structure is subjected to a var-iety of loading conditions and stresses. Exposure toultrapure water is known to reduce the mechanicalperformance of many materials over time. The de-sign is optimized with the criteria listed above withboth hand calculations and a detailed ANSYS"nite element analysis of the PSUP under a varietyof conditions. A half-scale model, partial full-scalemodel and dry "t-up of the entire geodesic spherewere used to con"rm the design.
The analyses (both stress and buckling) studynumerous e!ects, such as the variation of mechan-ical and physical properties with time and im-mersion in water, the e!ects of water "ll on thede#ections and stresses in the PSUP in order toestablish acceptable "lling-rate limits, the conse-quences of one of the PSUP supports failing, thee!ects of various construction tolerances, and theresponse of the natural frequency of the PSUPunder dynamic conditions.23
Various stainless-steel alloys are used in the fab-rication of the geodesic sphere and panel arrays,primarily SS304L for welded components andSS304 for parts that are only machined. Thesealloys have an excellent documented history oflong-term exposure to deionized (ultrapure) water.Welding was accomplished with inert-gas pro-cesses. A vacuum-deposited Ag coat providesa clean antigalling agent for threaded fastenerswithout compromising water purity.
In order to reduce the likelihood of stress cor-rosion and cracking, plate and tube material ispickled and passivated. Steel fasteners are fab-ricated from raw materials meeting the samespeci"cations and are in addition heat-treated andquenched.
ABS plastic is used in the injection molded com-ponents of the PMT housings. General Electricresin GPX5600 colour 4500 was selected for themolding. This selection of plastic provides excellentimpact, thermal, chemical resistance, and injectionmolding characteristics. Since ABS plastic hasa limited documented history of exposure to de-ionized water, we conducted extensive acceleratedaging tests to con"rm the behavior of the ABSGPX5600 to long-term ultrapure water exposureand to insure an adequate safety factor for thedesign life [40]. Plastic components were injectionmolded using controlled raw materials and pro-cesses. The machines were thoroughly cleaned
187J. Boger et al. / Nuclear Instruments and Methods in Physics Research A 449 (2000) 172}207
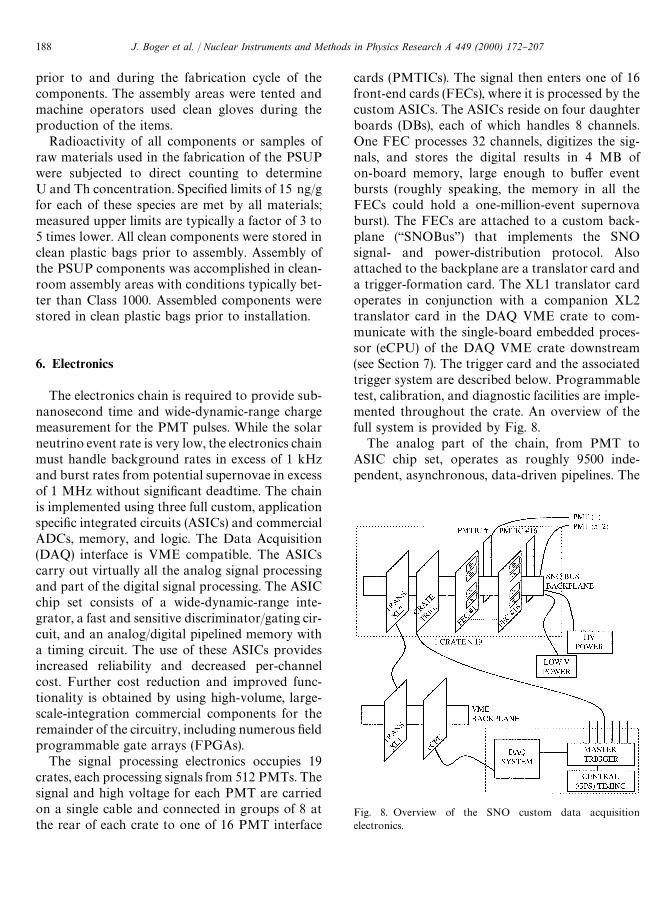
Fig. 8. Overview of the SNO custom data acquisitionelectronics.
prior to and during the fabrication cycle of thecomponents. The assembly areas were tented andmachine operators used clean gloves during theproduction of the items.
Radioactivity of all components or samples ofraw materials used in the fabrication of the PSUPwere subjected to direct counting to determineU and Th concentration. Speci"ed limits of 15 ng/gfor each of these species are met by all materials;measured upper limits are typically a factor of 3 to5 times lower. All clean components were stored inclean plastic bags prior to assembly. Assembly ofthe PSUP components was accomplished in clean-room assembly areas with conditions typically bet-ter than Class 1000. Assembled components werestored in clean plastic bags prior to installation.
6. Electronics
The electronics chain is required to provide sub-nanosecond time and wide-dynamic-range chargemeasurement for the PMT pulses. While the solarneutrino event rate is very low, the electronics chainmust handle background rates in excess of 1 kHzand burst rates from potential supernovae in excessof 1 MHz without signi"cant deadtime. The chainis implemented using three full custom, applicationspeci"c integrated circuits (ASICs) and commercialADCs, memory, and logic. The Data Acquisition(DAQ) interface is VME compatible. The ASICscarry out virtually all the analog signal processingand part of the digital signal processing. The ASICchip set consists of a wide-dynamic-range inte-grator, a fast and sensitive discriminator/gating cir-cuit, and an analog/digital pipelined memory witha timing circuit. The use of these ASICs providesincreased reliability and decreased per-channelcost. Further cost reduction and improved func-tionality is obtained by using high-volume, large-scale-integration commercial components for theremainder of the circuitry, including numerous "eldprogrammable gate arrays (FPGAs).
The signal processing electronics occupies 19crates, each processing signals from 512 PMTs. Thesignal and high voltage for each PMT are carriedon a single cable and connected in groups of 8 atthe rear of each crate to one of 16 PMT interface
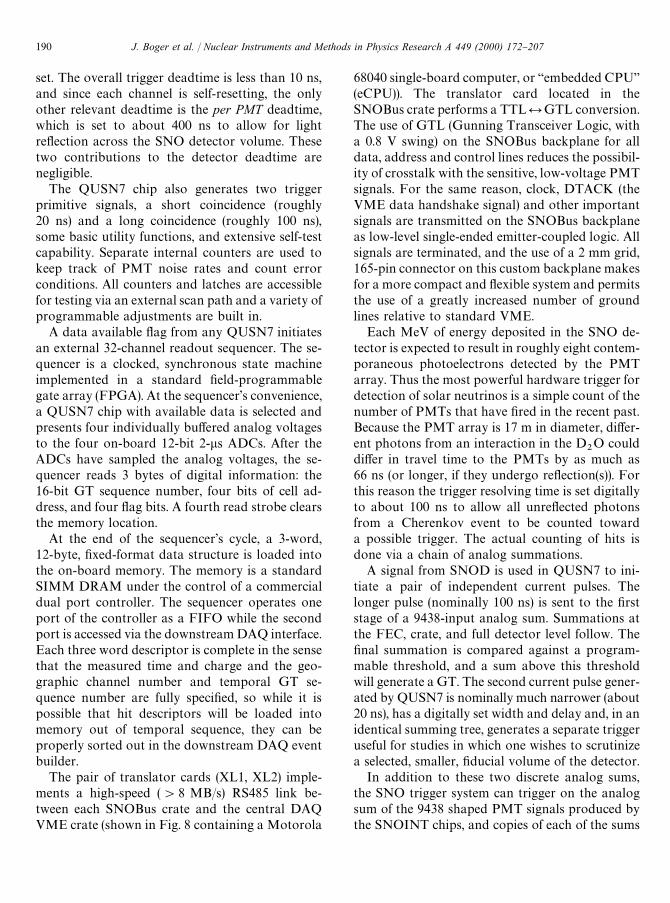
cards (PMTICs). The signal then enters one of 16front-end cards (FECs), where it is processed by thecustom ASICs. The ASICs reside on four daughterboards (DBs), each of which handles 8 channels.One FEC processes 32 channels, digitizes the sig-nals, and stores the digital results in 4 MB ofon-board memory, large enough to bu!er eventbursts (roughly speaking, the memory in all theFECs could hold a one-million-event supernovaburst). The FECs are attached to a custom back-plane (`SNOBusa) that implements the SNOsignal- and power-distribution protocol. Alsoattached to the backplane are a translator card anda trigger-formation card. The XL1 translator cardoperates in conjunction with a companion XL2translator card in the DAQ VME crate to com-municate with the single-board embedded proces-sor (eCPU) of the DAQ VME crate downstream(see Section 7). The trigger card and the associatedtrigger system are described below. Programmabletest, calibration, and diagnostic facilities are imple-mented throughout the crate. An overview of thefull system is provided by Fig. 8.
The analog part of the chain, from PMT toASIC chip set, operates as roughly 9500 inde-pendent, asynchronous, data-driven pipelines. The
J. Boger et al. / Nuclear Instruments and Methods in Physics Research A 449 (2000) 172}207188
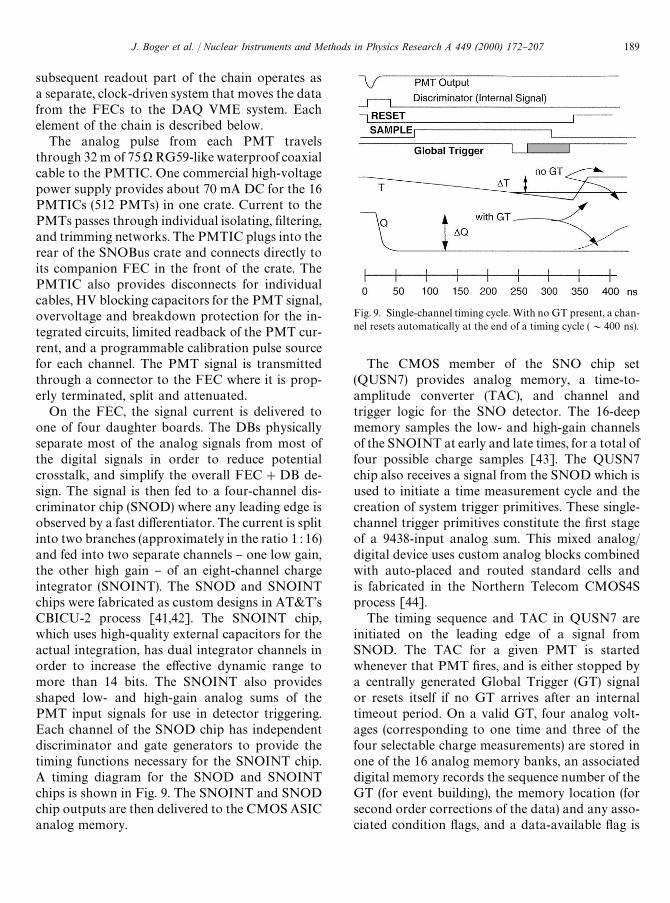
Fig. 9. Single-channel timing cycle. With no GT present, a chan-nel resets automatically at the end of a timing cycle (&400 ns).
subsequent readout part of the chain operates asa separate, clock-driven system that moves the datafrom the FECs to the DAQ VME system. Eachelement of the chain is described below.
The analog pulse from each PMT travelsthrough 32 m of 75) RG59-like waterproof coaxialcable to the PMTIC. One commercial high-voltagepower supply provides about 70 mA DC for the 16PMTICs (512 PMTs) in one crate. Current to thePMTs passes through individual isolating, "ltering,and trimming networks. The PMTIC plugs into therear of the SNOBus crate and connects directly toits companion FEC in the front of the crate. ThePMTIC also provides disconnects for individualcables, HV blocking capacitors for the PMT signal,overvoltage and breakdown protection for the in-tegrated circuits, limited readback of the PMT cur-rent, and a programmable calibration pulse sourcefor each channel. The PMT signal is transmittedthrough a connector to the FEC where it is prop-erly terminated, split and attenuated.
On the FEC, the signal current is delivered toone of four daughter boards. The DBs physicallyseparate most of the analog signals from most ofthe digital signals in order to reduce potentialcrosstalk, and simplify the overall FEC#DB de-sign. The signal is then fed to a four-channel dis-criminator chip (SNOD) where any leading edge isobserved by a fast di!erentiator. The current is splitinto two branches (approximately in the ratio 1 : 16)and fed into two separate channels } one low gain,the other high gain } of an eight-channel chargeintegrator (SNOINT). The SNOD and SNOINTchips were fabricated as custom designs in AT&T'sCBICU-2 process [41,42]. The SNOINT chip,which uses high-quality external capacitors for theactual integration, has dual integrator channels inorder to increase the e!ective dynamic range tomore than 14 bits. The SNOINT also providesshaped low- and high-gain analog sums of thePMT input signals for use in detector triggering.Each channel of the SNOD chip has independentdiscriminator and gate generators to provide thetiming functions necessary for the SNOINT chip.A timing diagram for the SNOD and SNOINTchips is shown in Fig. 9. The SNOINT and SNODchip outputs are then delivered to the CMOS ASICanalog memory.
The CMOS member of the SNO chip set(QUSN7) provides analog memory, a time-to-amplitude converter (TAC), and channel andtrigger logic for the SNO detector. The 16-deepmemory samples the low- and high-gain channelsof the SNOINT at early and late times, for a total offour possible charge samples [43]. The QUSN7chip also receives a signal from the SNOD which isused to initiate a time measurement cycle and thecreation of system trigger primitives. These single-channel trigger primitives constitute the "rst stageof a 9438-input analog sum. This mixed analog/digital device uses custom analog blocks combinedwith auto-placed and routed standard cells andis fabricated in the Northern Telecom CMOS4Sprocess [44].
The timing sequence and TAC in QUSN7 areinitiated on the leading edge of a signal fromSNOD. The TAC for a given PMT is startedwhenever that PMT "res, and is either stopped bya centrally generated Global Trigger (GT) signalor resets itself if no GT arrives after an internaltimeout period. On a valid GT, four analog volt-ages (corresponding to one time and three of thefour selectable charge measurements) are stored inone of the 16 analog memory banks, an associateddigital memory records the sequence number of theGT (for event building), the memory location (forsecond order corrections of the data) and any asso-ciated condition #ags, and a data-available #ag is
189J. Boger et al. / Nuclear Instruments and Methods in Physics Research A 449 (2000) 172}207
set. The overall trigger deadtime is less than 10 ns,and since each channel is self-resetting, the onlyother relevant deadtime is the per PMT deadtime,which is set to about 400 ns to allow for lightre#ection across the SNO detector volume. Thesetwo contributions to the detector deadtime arenegligible.
The QUSN7 chip also generates two triggerprimitive signals, a short coincidence (roughly20 ns) and a long coincidence (roughly 100 ns),some basic utility functions, and extensive self-testcapability. Separate internal counters are used tokeep track of PMT noise rates and count errorconditions. All counters and latches are accessiblefor testing via an external scan path and a variety ofprogrammable adjustments are built in.
A data available #ag from any QUSN7 initiatesan external 32-channel readout sequencer. The se-quencer is a clocked, synchronous state machineimplemented in a standard "eld-programmablegate array (FPGA). At the sequencer's convenience,a QUSN7 chip with available data is selected andpresents four individually bu!ered analog voltagesto the four on-board 12-bit 2-ls ADCs. After theADCs have sampled the analog voltages, the se-quencer reads 3 bytes of digital information: the16-bit GT sequence number, four bits of cell ad-dress, and four #ag bits. A fourth read strobe clearsthe memory location.
At the end of the sequencer's cycle, a 3-word,12-byte, "xed-format data structure is loaded intothe on-board memory. The memory is a standardSIMM DRAM under the control of a commercialdual port controller. The sequencer operates oneport of the controller as a FIFO while the secondport is accessed via the downstream DAQ interface.Each three word descriptor is complete in the sensethat the measured time and charge and the geo-graphic channel number and temporal GT se-quence number are fully speci"ed, so while it ispossible that hit descriptors will be loaded intomemory out of temporal sequence, they can beproperly sorted out in the downstream DAQ eventbuilder.
The pair of translator cards (XL1, XL2) imple-ments a high-speed ('8 MB/s) RS485 link be-tween each SNOBus crate and the central DAQVME crate (shown in Fig. 8 containing a Motorola
68040 single-board computer, or `embedded CPUa(eCPU)). The translator card located in theSNOBus crate performs a TTL%GTL conversion.The use of GTL (Gunning Transceiver Logic, witha 0.8 V swing) on the SNOBus backplane for alldata, address and control lines reduces the possibil-ity of crosstalk with the sensitive, low-voltage PMTsignals. For the same reason, clock, DTACK (theVME data handshake signal) and other importantsignals are transmitted on the SNOBus backplaneas low-level single-ended emitter-coupled logic. Allsignals are terminated, and the use of a 2 mm grid,165-pin connector on this custom backplane makesfor a more compact and #exible system and permitsthe use of a greatly increased number of groundlines relative to standard VME.
Each MeV of energy deposited in the SNO de-tector is expected to result in roughly eight contem-poraneous photoelectrons detected by the PMTarray. Thus the most powerful hardware trigger fordetection of solar neutrinos is a simple count of thenumber of PMTs that have "red in the recent past.Because the PMT array is 17 m in diameter, di!er-ent photons from an interaction in the D
2O could
di!er in travel time to the PMTs by as much as66 ns (or longer, if they undergo re#ection(s)). Forthis reason the trigger resolving time is set digitallyto about 100 ns to allow all unre#ected photonsfrom a Cherenkov event to be counted towarda possible trigger. The actual counting of hits isdone via a chain of analog summations.
A signal from SNOD is used in QUSN7 to ini-tiate a pair of independent current pulses. Thelonger pulse (nominally 100 ns) is sent to the "rststage of a 9438-input analog sum. Summations atthe FEC, crate, and full detector level follow. The"nal summation is compared against a program-mable threshold, and a sum above this thresholdwill generate a GT. The second current pulse gener-ated by QUSN7 is nominally much narrower (about20 ns), has a digitally set width and delay and, in anidentical summing tree, generates a separate triggeruseful for studies in which one wishes to scrutinizea selected, smaller, "ducial volume of the detector.
In addition to these two discrete analog sums,the SNO trigger system can trigger on the analogsum of the 9438 shaped PMT signals produced bythe SNOINT chips, and copies of each of the sums
J. Boger et al. / Nuclear Instruments and Methods in Physics Research A 449 (2000) 172}207190
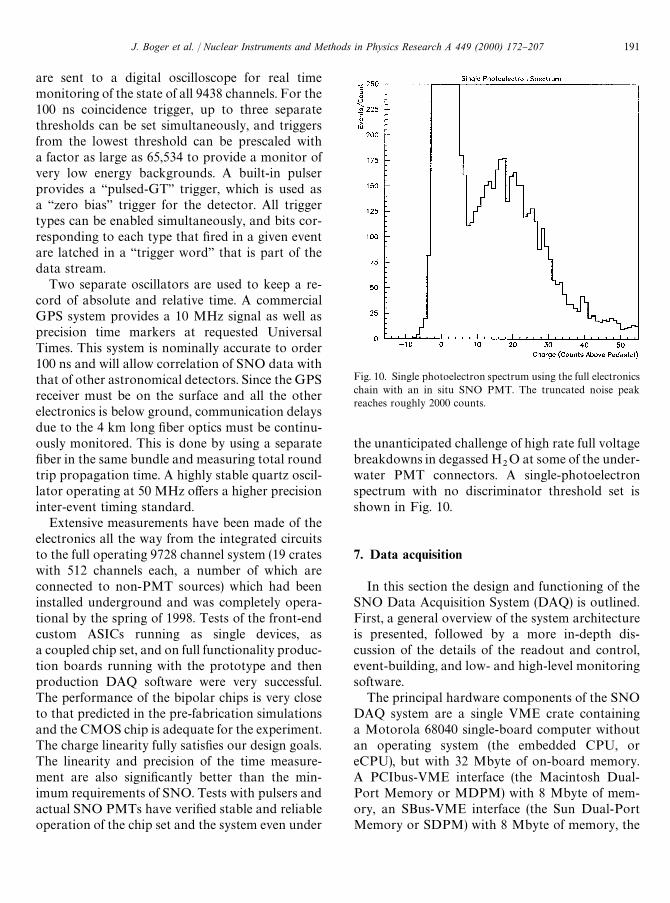
Fig. 10. Single photoelectron spectrum using the full electronicschain with an in situ SNO PMT. The truncated noise peakreaches roughly 2000 counts.
are sent to a digital oscilloscope for real timemonitoring of the state of all 9438 channels. For the100 ns coincidence trigger, up to three separatethresholds can be set simultaneously, and triggersfrom the lowest threshold can be prescaled witha factor as large as 65,534 to provide a monitor ofvery low energy backgrounds. A built-in pulserprovides a `pulsed-GTa trigger, which is used asa `zero biasa trigger for the detector. All triggertypes can be enabled simultaneously, and bits cor-responding to each type that "red in a given eventare latched in a `trigger worda that is part of thedata stream.
Two separate oscillators are used to keep a re-cord of absolute and relative time. A commercialGPS system provides a 10 MHz signal as well asprecision time markers at requested UniversalTimes. This system is nominally accurate to order100 ns and will allow correlation of SNO data withthat of other astronomical detectors. Since the GPSreceiver must be on the surface and all the otherelectronics is below ground, communication delaysdue to the 4 km long "ber optics must be continu-ously monitored. This is done by using a separate"ber in the same bundle and measuring total roundtrip propagation time. A highly stable quartz oscil-lator operating at 50 MHz o!ers a higher precisioninter-event timing standard.
Extensive measurements have been made of theelectronics all the way from the integrated circuitsto the full operating 9728 channel system (19 crateswith 512 channels each, a number of which areconnected to non-PMT sources) which had beeninstalled underground and was completely opera-tional by the spring of 1998. Tests of the front-endcustom ASICs running as single devices, asa coupled chip set, and on full functionality produc-tion boards running with the prototype and thenproduction DAQ software were very successful.The performance of the bipolar chips is very closeto that predicted in the pre-fabrication simulationsand the CMOS chip is adequate for the experiment.The charge linearity fully satis"es our design goals.The linearity and precision of the time measure-ment are also signi"cantly better than the min-imum requirements of SNO. Tests with pulsers andactual SNO PMTs have veri"ed stable and reliableoperation of the chip set and the system even under
the unanticipated challenge of high rate full voltagebreakdowns in degassed H
2O at some of the under-
water PMT connectors. A single-photoelectronspectrum with no discriminator threshold set isshown in Fig. 10.
7. Data acquisition
In this section the design and functioning of theSNO Data Acquisition System (DAQ) is outlined.First, a general overview of the system architectureis presented, followed by a more in-depth dis-cussion of the details of the readout and control,event-building, and low- and high-level monitoringsoftware.
The principal hardware components of the SNODAQ system are a single VME crate containinga Motorola 68040 single-board computer withoutan operating system (the embedded CPU, oreCPU), but with 32 Mbyte of on-board memory.A PCIbus-VME interface (the Macintosh Dual-Port Memory or MDPM) with 8 Mbyte of mem-ory, an SBus-VME interface (the Sun Dual-PortMemory or SDPM) with 8 Mbyte of memory, the
191J. Boger et al. / Nuclear Instruments and Methods in Physics Research A 449 (2000) 172}207
Master Trigger Card (MTC), and the seven XL1cards needed to access the 19 `SNO cratesa con-taining the front-end electronics also reside in thiscrate.
Each SNO crate is read out sequentially by theeCPU, which accesses one crate in turn through thetransparent XL1/XL2 interface bus. Within eachcrate, the FECs are read out sequentially, by pro-gramming the slot-select register on the crate'sXL2 card.
Once the contents of the FEC memory have beenread by the eCPU, they are transferred to a circularbu!er on the SDPM. The eCPU additionally hasaccess to the Master Trigger Card memory; once ithas checked every enabled FEC, it reads out theMTC memory and transfers the trigger data toa separate circular bu!er on the SDPM.
The SDPM is simultaneously and asyn-chronously accessed in read-only mode by a SunUltra Sparc 1/170 workstation, which is respon-sible for sorting the FEC and MTC data and build-ing them into events. The Sun writes full events todisk. A separate mechanism is responsible for copy-ing completed event "les to a tape drive located onthis Sun as well as copying, via Ethernet, these "lesto a Sun on the surface, where they are copied againto tape. The system also supports monitoring pro-grams running on a variety of platforms. Thesemonitoring programs access a sampled data streamin real time over the network.
The readout of the electronics is both controlledand monitored via a user interface Program, the`SNO Hardware Acquisition and Readout Control(SHARC)a, running on a Power Computing250 MHz PPC Macintosh compatible, which usesthe MDPM to communicate with the eCPU. A setof small, prede"ned data blocks transfer controland low-level monitoring information such as usercommands and eCPU status between SHARC andthe eCPU. SHARC initializes the hardware, takesindividual hardware elements (channels, cards,crates) in and out of the readout, stores the currenthardware con"guration (which elements are pre-sent and which are being read out), and ensuresthat this information is saved.
SHARC controls SNO's calibration sourcesthrough a manipulator computer that moves thesources around inside the detector, and also
receives information regarding individual sourcestatus from the various computers used to operatethe di!erent sources themselves. The manipulatoror `calibrationa computer inserts this slowly vary-ing data into the data stream by sending it toSHARC, which writes it to a calibration data blockin the MDPM. Source information that changesmore quickly (additional trigger information, moreprecise timing) is generated if necessary by routingthe relevant signals from the sources to spare FECsand integrating the resulting data into the datastream exactly as if it were coming from the PMTs.Interpretation of the data is left to the o!-lineanalysis.
The eCPU reads the current con"guration froma control block in the MDPM that has been loadedby SHARC during initialization. It loops over thedesired hardware, incrementing error registers inthe MDPM if read or write errors are detected, andattaching information identifying the bad crate orcard. The eCPU periodically checks the con"gura-tion block for changes, which if detected will alterthe readout loop. In this manner, individual cardsor even entire SNO crates can be removed from thereadout loop. A MDPM-resident control structurecontaining `starta and `stopa semaphores is alsopolled periodically, and enables global control ofthe readout.
Removing hardware from the readout loop orpausing the readout entirely does not prevent datafrom being stored in the FEC memory. Each FECholds up to &350,000 PMT hits, several hours ofdata under normal detector operation. Individualchannels (bad PMTs) are taken o!-line throughsoftware by writing to a FEC register that preventsthe channel data from going into the FEC memory.
The eCPU transfers the FEC and MTC memorycontents to two circular bu!ers in the SDPM, 7 and1 Mbyte in size, respectively. The eCPU updatesa bu!er write pointer, while the Sun updates abu!er read pointer, enabling the eCPU to track theSun's readout progress. The eCPU will pause thereadout of the hardware if either bu!er "lls up andwill wait until the Sun catches up.
Whenever it is changed, a copy of the con"gura-tion control block is written to a block in theSDPM by the eCPU, where it is read by the Sunand incorporated into the event data stream.
J. Boger et al. / Nuclear Instruments and Methods in Physics Research A 449 (2000) 172}207192
The Sun, once it has read out the SDPM, sortsthrough the MTC and FEC data and aggregatesPMT hits plus MTC trigger information intoevents. Events are stored in a bu!er for some periodof time to ensure that any late PMT hits can stillbe associated with the proper event. Once thelatency period expires, the events are passed to aFORTRAN process, which translates the data intoZEBRA format [45] for use by the o!-line analysisand writes the resulting "les to disk.
In order to monitor the state of the eCPUcode, the MDPM control block contains, in ad-dition to the start}stop semaphores, a pairof `heartbeatsa, counters that are incremented inturn when the eCPU is looping over the readout, orin a tight loop waiting for the start semaphore to beset. The user interface for SHARC displays theseheartbeats.
Data from the Sun, either in raw, pre-event-builtform or as completed events, are transmitted overthe network to a Sun resident process, called theDispatcher, which rebroadcasts the data to anyclients requesting it. As this rebroadcast is also overthe network, clients can be located anywhere. TheDispatcher also receives data regarding run condi-tions from the control Mac. The data are labelled,and di!erent clients can request data with di!erentlabels. Clients receive only as much data as they canprocess, and any data unsent by the Dispatcher isoverwritten after some time. For high-rate data,e.g., certain types of calibrations, the monitor sys-tem behaves as a sampling system. The system isextremely modular, and clients on various plat-forms can connect and disconnect from the Dis-patcher at will. Because of this separation betweenthe Dispatcher and the monitors, the Dispatcheritself is very stable.
Tools available for both UNIX and Mac plat-forms allow one to examine the raw PMT data,MTC data, or full event data, to check for dataintegrity, and to examine data either on a crate-by-crate basis or for the full complement of chan-nels. There are several tools for event displayin the SNO detector geometry. In addition, thereare web-based monitoring tools that updateHTML "les on a designated server for displayingmore static information of interest to the o!sitecollaborator.
8. Neutral current detector array
The detection of a free neutron is the signal thata neutral-current (NC) event has occurred, whilethe detection of a neutron (or two neutrons) incoincidence with a positron indicates a m6
%interac-
tion. Heavy water is an excellent moderator, anda number of possible strategies for detecting neu-trons can be devised. One such strategy, discussedin Sections 1 and 2, involves the addition of a chlor-ide salt to the D
2O. When a neutron captures on
75% abundant 35Cl, it emits 8.6 MeV in c rays,which mainly Compton scatter. The resultingCherenkov radiation emitted by the electron can bedetected by the PMT array in the same way CCevents are detected, and the Cherenkov-light pat-terns produced by c rays distinguished from thoseof electrons on the basis of their greater isotropy.
Alternatively, neutrons can be detected with highe$ciency in 3He-"lled proportional counters. Anarray of such counters, with a total length of 770 m,and constructed of highly puri"ed materials, hasbeen designed for SNO [46]. In this way, the NCand CC events can be recorded separately anddistinguished on an event-by-event basis. Event-by-event sorting makes optimum use of availablestatistics, and simpli"es interpretation of sparse sig-nals, such as from a distant supernova.
Detection of thermal neutrons by the reaction
3He#nPp#3H#764 keV
takes advantage of an enormous cross section,5330 b, and is a well-developed art that has in-cluded applications in neutrino physics [47}49].Nonetheless, the design of an array of 3He propor-tional counters for SNO poses unusual problems.
The neutron production rate in SNO is expectedto fall in the range 6}42 neutrons per day based onthe measurements by the SuperKamiokande Col-laboration [50] of the rate of m}e scattering, but notthe #avor composition. The rate predicted by re-cent solar-model calculations [18,19] is 13 per daywhen the cross-section calculated by Kubodera andNozawa [51] is used. The neutron signal must notbe overwhelmed by backgrounds from naturallyoccurring radioactivity in construction materials,nor can substances be allowed to leach signi"-cantly into the heavy water and interfere with water
193J. Boger et al. / Nuclear Instruments and Methods in Physics Research A 449 (2000) 172}207

Table 4Capture percentages of neutrons by isotope, for pure D
2O and
for pure D2O with NCDs installed
Pure D2O NCDs
3He 36.6Ni 1.6D
2O 66.9 36.9H in D
2O 16.5 9.1
D in D2O 32.0 17.7
O(n, c) in D2O 5.8 3.2
O(n, a) in D2O 12.6 6.9
Acrylic 28.4 20.9H
2O exterior to AV 4.7 4.0
puri"cation. Helium permeates readily throughmany otherwise acceptable materials. The countersare to survive under water at absolute pressures upto 3.1 atm for 10 yr or more, placing stringentdemands on detector longevity and stability.A counter array with high neutron e$ciency isneeded, but not at the cost of signi"cantly obscur-ing the Cherenkov light from CC events. Theseconditions severely constrain detector design,the materials employed in constructing the de-tector array, and the methods of handling anddeployment.
Backgrounds of several kinds can be present.Most serious is photodisintegration of deuteriumby gammas above 2.22 MeV, as the neutrons pro-duced are indistinguishable from the m-inducedsignal.
At the bottom of the natural Th and U decaychains are two su$ciently energetic gammas. Manycosmogenic activities also have high energygammas, but only one, 78-d 56Co, has a longenough half-life to be relevant. Energetic photonscan also be produced by capture of neutrons and by(a, pc) and (a, nc) reactions.
Alpha particles emerging from the wall of theproportional counter can leave the same amount ofionization in the gas as a 3He(n, p)T event, as canelectrons from b decay and Compton scattering.Even very low-energy events, such as the decay oftritium, can compromise the signal via randomsumming.
The principal defense against these backgroundsis to minimize radioactivity in construction mater-ials and to assure a high degree of cleanlinessduring assembly. To supplement those measures,techniques for pulse-shape discrimination and posi-tion encoding are used, both of which requiredigitizing the pulse ion-current pro"les event byevent. Spurious pulses from high-voltage break-down and electromagnetic interference must becontrolled. Backgrounds of all types must not onlybe minimized, but in addition there must be robusttechniques to measure them in situ.
Because of the e$ciency of heavy water as a neu-tron moderator and the high cross-section forneutron capture on 3He a rather sparse array ofneutral-current detectors (NCD) is su$cient. Anarray of 5.08 cm diameter proportional counters
with a total length of 770 m arranged on a squarelattice with 1 m spacing gives a neutron capturee$ciency of approximately 37% (see Table 4) withtolerable interference to Cherenkov light producedvia the charged current interaction. Approximately15% of uniformly generated optical photons areabsorbed.
At modest pressures of 1}3 atm of 3He, thecounters are essentially `blacka to thermal neu-trons. For 99.85% enriched heavy water, the meandistance from the point of generation to the point ofcapture for thermal neutrons is calculated to be110 cm and the mean time to capture 16 ms withthe NCD array, compared with 48 cm and 4 ms,respectively, for 0.2% MgCl
2.
The detectors are "lled with a gas mixture of85% 3He and 15% CF
4at a total pressure of
2.5 atm to provide a good compromise between gasgain and stopping power (to mitigate a `wall e!ectawherein either the proton or the triton strikes thewall before the end of its range). A lower pressure,and therefore operating voltage, would simplifymicrodischarge management and increase driftspeeds, but would require thick-walled counters toresist collapse. At the bottom of the SNO vessel, theabsolute pressure is that of a column of D
2O of
height 16.8 m plus 1.3 atm of air pressure, for a totalof 3.1 atm.
The copper anode wire of diameter 50 lm is lowin radioactivity and ohmic losses. At 1650 V the gasgain is approximately 100. For higher gas gainspositive-ion space charge at the wire causes theavalanche multiplication to depend increasingly ontrack orientation.
J. Boger et al. / Nuclear Instruments and Methods in Physics Research A 449 (2000) 172}207194

Fig. 11. SNO neutral-current detector.
Table 5Important physical parameters of the NCD detectors
Item Value Variation Units
Wall thickness 0.036 `0.012~0.000
cmLength 200, 250, and 300 cmDiameter 5.08 cmWire diameter 50 lmGas pressure 2.50 $0.03 atmWeight 510 g/m
Trace amounts of electronegative contaminantssuch as oxygen and water degrade severely theperformance of the gas in a sealed counter. Conse-quently, counter surfaces are electropolished, acid-etched, baked under vacuum, and purged withboilo!N
2prior to "ll. The chemical treatment also
removes surface debris stripped o! the mandrelduring the fabrication process.
The 3He gas from the Department of Energyfacility in Savannah River contains a small amountof tritium, about 0.5 mCi/l, which is reduced to5 nCi/l or less by passage through a charcoal-loaded cold trap and by recirculation through anSAES, Inc., St101 getter. At that level, randomcoincidences and pileup of tritium decay pulses areno longer a concern in the energy regime of interest.Some detectors, about 5% of the total by length,are "lled with 4He :CF
4to provide a check on
backgrounds.The NCDs are fabricated in three di!erent unit
lengths in order to "ll the sphere e$ciently. (Anupper limit is set by the dimensions of the cage inthe INCO Number 9 shaft, which permits an object3.7 m long to be brought down.) The active lengthis 13 cm less than the mechanical length. Fig. 11shows the main features. The important mechanicalparameters of the detectors are summarized inTable 5.
The bodies of the proportional counters aremade of ultrapure nickel tubes fabricated atMirotech (Toronto) Inc., by thermolysis ofNi(CO)
4vapor at the surface of an anodized alumi-
num mandrel heated to 2153C. A limited number ofelements (Pb, Ra, Th, and U not among them) reactwith CO to form carbonyls, and the metals formedby chemical vapor deposition (CVD) from thisprecursor can be expected to be free of the mosttroublesome radioisotopes. The nickel deposit hasproperties very similar to conventional metallurgi-cal products. Radiochemical neutron activationanalysis has shown Th levels in the bulk material oforder 10~12 (1 ppt) by weight or less.
Nickel is a relatively inert metal. The exposedmacroscopic surface area in SNO is 125 m2. In17.3 M) cm water the measured leach rate is)22 lgm~2 d~1, which is not expected to com-promise the operation of the water puri"cationplant.
Endcaps are also made by CVD, in this case onstainless steel mandrels, and are welded into thetubes with a Lumonics 50-W Nd-YAG laserwelder. Insulators are Heraeus-Amersil SuprasilT-21 synthetic fused-silica tubes. The insulators areinternally coated with a layer of pyrolytic graphiteat anode potential to eliminate electric "elds insidethem. They extend 2.5 cm into the gas volume toact as "eld tubes and prevent multiplication of
195J. Boger et al. / Nuclear Instruments and Methods in Physics Research A 449 (2000) 172}207
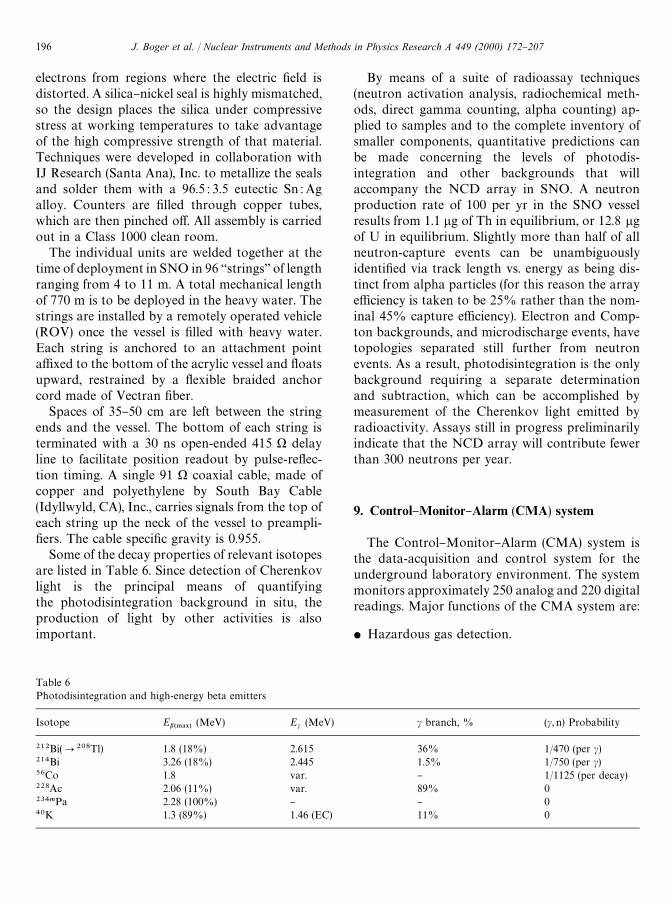
Table 6Photodisintegration and high-energy beta emitters
Isotope Eb(.!9)(MeV) Ec (MeV) c branch, % (c, n) Probability
212Bi(P208Tl) 1.8 (18%) 2.615 36% 1/470 (per c)214Bi 3.26 (18%) 2.445 1.5% 1/750 (per c)56Co 1.8 var. } 1/1125 (per decay)228Ac 2.06 (11%) var. 89% 0234mPa 2.28 (100%) } } 040K 1.3 (89%) 1.46 (EC) 11% 0
electrons from regions where the electric "eld isdistorted. A silica}nickel seal is highly mismatched,so the design places the silica under compressivestress at working temperatures to take advantageof the high compressive strength of that material.Techniques were developed in collaboration withIJ Research (Santa Ana), Inc. to metallize the sealsand solder them with a 96.5 : 3.5 eutectic Sn : Agalloy. Counters are "lled through copper tubes,which are then pinched o!. All assembly is carriedout in a Class 1000 clean room.
The individual units are welded together at thetime of deployment in SNO in 96 `stringsa of lengthranging from 4 to 11 m. A total mechanical lengthof 770 m is to be deployed in the heavy water. Thestrings are installed by a remotely operated vehicle(ROV) once the vessel is "lled with heavy water.Each string is anchored to an attachment pointa$xed to the bottom of the acrylic vessel and #oatsupward, restrained by a #exible braided anchorcord made of Vectran "ber.
Spaces of 35}50 cm are left between the stringends and the vessel. The bottom of each string isterminated with a 30 ns open-ended 415 ) delayline to facilitate position readout by pulse-re#ec-tion timing. A single 91 ) coaxial cable, made ofcopper and polyethylene by South Bay Cable(Idyllwyld, CA), Inc., carries signals from the top ofeach string up the neck of the vessel to preampli-"ers. The cable speci"c gravity is 0.955.
Some of the decay properties of relevant isotopesare listed in Table 6. Since detection of Cherenkovlight is the principal means of quantifyingthe photodisintegration background in situ, theproduction of light by other activities is alsoimportant.
By means of a suite of radioassay techniques(neutron activation analysis, radiochemical meth-ods, direct gamma counting, alpha counting) ap-plied to samples and to the complete inventory ofsmaller components, quantitative predictions canbe made concerning the levels of photodis-integration and other backgrounds that willaccompany the NCD array in SNO. A neutronproduction rate of 100 per yr in the SNO vesselresults from 1.1 lg of Th in equilibrium, or 12.8 lgof U in equilibrium. Slightly more than half of allneutron-capture events can be unambiguouslyidenti"ed via track length vs. energy as being dis-tinct from alpha particles (for this reason the arraye$ciency is taken to be 25% rather than the nom-inal 45% capture e$ciency). Electron and Comp-ton backgrounds, and microdischarge events, havetopologies separated still further from neutronevents. As a result, photodisintegration is the onlybackground requiring a separate determinationand subtraction, which can be accomplished bymeasurement of the Cherenkov light emitted byradioactivity. Assays still in progress preliminarilyindicate that the NCD array will contribute fewerthan 300 neutrons per year.
9. Control}Monitor}Alarm (CMA) system
The Control}Monitor}Alarm (CMA) system isthe data-acquisition and control system for theunderground laboratory environment. The systemmonitors approximately 250 analog and 220 digitalreadings. Major functions of the CMA system are:
f Hazardous gas detection.
J. Boger et al. / Nuclear Instruments and Methods in Physics Research A 449 (2000) 172}207196

Table 7Calibration devices for the SNO detector and their principal uses
Device Calibrations
Electronic pulsers Time slope (ns per count); time pedestal; charge slope (pC per count);charge pedestal
Laserball; sonoluminescent source; LED sources Common time reference (t0); D
2O absorption and scattering (j);
acrylic absorption and scattering (j, r, h); H2O absorption and scattering (j);
re#ection and scattering from structures; single photoelectron (pe) response;relative single pe e$ciency; multiple photoelectron response;walk (time vs. pulse amplitude)
Radioactive sources: 16N, 252Cf, 8Li, Th, U Gamma energy response; electron energy response; neutron-capture e$ciency;angular response
3H(p, c)3He accelerator source Gamma energy responseTagged sources: 252Cf, 24Na, 228Th Gamma energy response; neutron-capture e$ciencyRadioassay Backgrounds from construction materials; backgrounds from water
contaminants
f Environment monitoring (temperature, humid-ity, air pressure).
f Cooling and air-circulation control.f Load and position sensing on critical structural
elements.f Electrical system monitoring.f Control of the magnetic compensation coils for
reduction of the e!ect of the earth's "eld.f Monitoring of supply voltages and currents for
the electronics.f Logging of various monitored parameters.
The system uses Paragon TNT industrial auto-mation software from Nemasoft [52]. The hard-ware was furnished as a complete system bySciemetric Instruments [53]. Analog readings areconverted by a single multiplexed 20 kHz 12-bitADC. Voltages up to $10 VDC can be convertedin seven software selected ranges. Industrial4}20 mA signals are converted to voltages withprecision resistors. Digital inputs may be 24 VDCor 120 VAC. There are 32 solid-state relay channelsfor digital output. The input/output scan rate is upto 2 Hz. Systems with independent microprocessors(such as the cooling unit, and the uninterruptablepower supply) have serial links for ASCII output tothe CMA.
The CMA software is presently runningon a dual 200 MHz Pentium-Pro system with256 Mbytes of RAM running Windows NT 4.0.Remote systems running Paragon TNT softwarecan connect via TCP/IP with the underground
system. A remote monitoring system is kept run-ning in the SNO surface building. Critical alarmsare annunciated on the surface as well as under-ground.
Data are recorded continuously in a MicrosoftAccess database on the main CMA system, and areexported periodically to the custom SNO database.The data logging program enters a new record onlywhen a signi"cant change in a parameter hasoccurred.
10. Calibration
Accurate measurement of the physics processesin the SNO detector requires a chain of calibrationsand calculations to connect the raw measuredquantities of PMT charge and time to a full de-scription of the interaction in terms of energy, di-rection, and particle type. This set of calibrationsincludes built-in electronic calibrations, severaldedicated optical calibrators, various types oftagged and untagged radioactive sources and de-tailed radioassays of the detector materials. Takentogether with a comprehensive Monte Carlo simu-lation of the detector, this set of calibrations createsan overdetermined model of the detector that canbe used to interpolate energy scales and particleidenti"cation across the full response range of thedetector. The major calibration tools are listed inTable 7 and brie#y described in the followingsections.
197J. Boger et al. / Nuclear Instruments and Methods in Physics Research A 449 (2000) 172}207
The conversion of the digitized values for PMTcharge and time to photoelectrons (pe) andnanoseconds (ns) is a two-step process, involvingelectronic pulses and light #ashes from known posi-tions within the detector. The electronic pulser cal-ibration yields the transfer functions and o!sets(pedestals). The establishment of a common timereference for all channels (t
0) is performed with
optical sources.The charge o!sets (pedestals) are the values
digitized when there is no charge input from thePMT. The time o!set is found using a full timeramp. During calibration, each cell (there are 16analog memory cells per channel for each of thethree charge and one time measurement) is given 10event trigger pulses without any PMT input. Be-cause the pedestal calibration is done during nor-mal running there are occasional coincidences withnoise or detected light that must be removed duringthe analysis stage. In the o%ine analysis, two passesare made through the data. The "rst pass deter-mines the value of the digitization that occurs mostfrequently, and then events that are more than$10 units away from this peak digitized value arediscarded for a second pass that determines themean (pedestal) and RMS for each cell. Shouldmore than a certain number of events be rejectedwith this cut, the cell is #agged and not used againuntil recalibration or repair. The RMS is typicallyless than one ADC count and cells with an RMSgreater than three counts are #agged. The pedestalsare run constantly in background while solar-neu-trino data are being taken.
Individual voltage pulses of varying width andamplitude (and, thus, charge) are fed to the PMTinputs to measure the high-gain, long integration(QHL), high-gain, short integration (QHS), andlow-gain, selectable integration (QLx) signals. Eachcell is pulsed 10 times for a given injected charge(Q
*/+). The charge injection is incremented in steps
up to a maximum value. A low-order polynomial "tof digitized value vs. Q
*/+is performed for each cell
o%ine.The time calibration sends one pulse to the PMT
input and a delayed pulse to the event trigger; thetime di!erence between the pulses is varied bya known amount in steps as small as 100 ps. Theslope calibration procedure is similar to that of the
charge calibration. The relation between the timedigitized value and nanoseconds between two gen-erated pulses is monotonic over most of the range.
The rise time of the PMT pulses and leading-edge discrimination lead to a timing dependence onthe PMT anode charge. Calibration of this e!ect ismade by running the laserball at various intensitiesfrom a fraction of a pe per PMT to hundreds of peper PMT, and then creating charge versus time(QvT) histograms for each PMT.
Because many of the optical- and particle-cali-bration techniques are position dependent, a gen-eral-purpose manipulator has been developed toprovide source deployment at accurately knowno!-axis positions in two orthogonal planes in theD
2O. (In addition, six calibration access tubes run
from the deck to positions in the light water.) Thesource manipulator is a carriage located in a planeby two Vectran ropes (see Fig. 12) that run downthe vessel neck through pulleys on the carriage to"xed locations on the acrylic vessel. A third, centrerope connects directly to the source carriage. Thesource can be introduced at the neck and visit 70%of the plane with a position accuracy of better than5 cm.
At the deck interface the carriage is pulled upinto a glove box that is part of the cover-gas vol-ume. There a person can work on a source whilekeeping the detector isolated from light and air-borne radioactivity. The source can then be pulledthrough a gate valve into an interlock box where itcan be removed or serviced.
Some of the calibration sources require powercable, signal cable and/or gas capillary connectionsto equipment on deck. To provide uniform andreliable manipulator operation, these auxiliariesare cabled into a standard sized umbilical cable.The umbilical cable runs through the centre of thesource carriage to a compression "tting at the topof the source. The cable connections are then inter-nal to the source. The umbilical cables are storedand paid out from a pulley array mechanism heldunder tension, thereby avoiding twisting of theumbilical cable.
Optical sources are used in both the optical cal-ibration and the electronics calibration. Theyinclude a wavelength-selectable dye laser, a son-oluminescent source, and light-emitting diodes
J. Boger et al. / Nuclear Instruments and Methods in Physics Research A 449 (2000) 172}207198
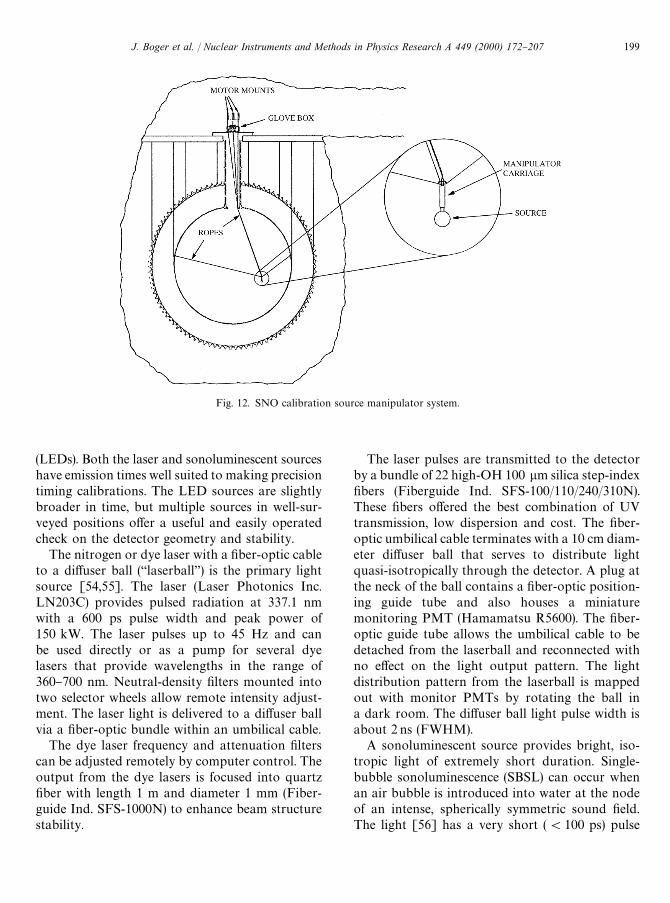
Fig. 12. SNO calibration source manipulator system.
(LEDs). Both the laser and sonoluminescent sourceshave emission times well suited to making precisiontiming calibrations. The LED sources are slightlybroader in time, but multiple sources in well-sur-veyed positions o!er a useful and easily operatedcheck on the detector geometry and stability.
The nitrogen or dye laser with a "ber-optic cableto a di!user ball (`laserballa) is the primary lightsource [54,55]. The laser (Laser Photonics Inc.LN203C) provides pulsed radiation at 337.1 nmwith a 600 ps pulse width and peak power of150 kW. The laser pulses up to 45 Hz and canbe used directly or as a pump for several dyelasers that provide wavelengths in the range of360}700 nm. Neutral-density "lters mounted intotwo selector wheels allow remote intensity adjust-ment. The laser light is delivered to a di!user ballvia a "ber-optic bundle within an umbilical cable.
The dye laser frequency and attenuation "lterscan be adjusted remotely by computer control. Theoutput from the dye lasers is focused into quartz"ber with length 1 m and diameter 1 mm (Fiber-guide Ind. SFS-1000N) to enhance beam structurestability.
The laser pulses are transmitted to the detectorby a bundle of 22 high-OH 100 lm silica step-index"bers (Fiberguide Ind. SFS-100/110/240/310N).These "bers o!ered the best combination of UVtransmission, low dispersion and cost. The "ber-optic umbilical cable terminates with a 10 cm diam-eter di!user ball that serves to distribute lightquasi-isotropically through the detector. A plug atthe neck of the ball contains a "ber-optic position-ing guide tube and also houses a miniaturemonitoring PMT (Hamamatsu R5600). The "ber-optic guide tube allows the umbilical cable to bedetached from the laserball and reconnected withno e!ect on the light output pattern. The lightdistribution pattern from the laserball is mappedout with monitor PMTs by rotating the ball ina dark room. The di!user ball light pulse width isabout 2 ns (FWHM).
A sonoluminescent source provides bright, iso-tropic light of extremely short duration. Single-bubble sonoluminescence (SBSL) can occur whenan air bubble is introduced into water at the nodeof an intense, spherically symmetric sound "eld.The light [56] has a very short ((100 ps) pulse
199J. Boger et al. / Nuclear Instruments and Methods in Physics Research A 449 (2000) 172}207
width and a frequency distribution correspond-ing to a blackbody at a temperature of over20,000 K [57], very similar to the Cherenkov spec-trum. The relatively high repetition rate(&25 kHz) o!ers a good test of the system's burstcapability. The short pulse width and isotropicoutput make the SBSL source useful for PMTtiming calibrations and some optical analysis. Inaddition, the SNO detector provided an opportun-ity to investigate a variety of fundamental proper-ties of SBSL [58].
The SNO SBSL source consists of a 250 mlspherical #ask with two cylindrical piezoelectrictransducers. The #ask is housed within a spheremade of two 15 cm radius hemispherical acrylicsections to provide an air bu!er. It is "lled withpure distilled water to the neck level, and driven atits natural monopole resonance (28.5 kHz) with aninductively matched circuit. A small microphonetransducer aids in scanning the frequency to "ndthe natural resonance.
A bubble is generated remotely with a nichromeheater wire within the water. The bubble stability ismonitored by observing the spikes on the micro-phone voltage trace. As sonoluminescence outputbegins, the light output is monitored with a smallPMT (Hamamatsu R5600) within the acrylicsource housing. The light output contains of ordera million blue photons which are isotropically dis-tributed in space when averaged over time scales ofseconds or longer. The heater wire also providessome control over the light intensity, which de-creases with increasing water temperature.
Light-emitting diodes provide a simple and ro-bust optical source for veri"cation of water trans-parency, acrylic vessel and source positions, andPMT response. During the "nal constructionstages of the PSUP, new LED products becameavailable from Nichia Corporation. These indium-gallium nitride single quantum well (NSPB500) anddouble hetero-structure (NLPB500) devices o!erhigh intensity blue radiation (420}480 nm), and thelatter device can even emit in the UV (380 nm)when strongly overdriven in pulse mode [59].A pulse of width approximately 7 ns is observed.Six of these devices have been packaged with apulser circuit and mounted at the locations, in cm(695, 248, 399), (!162, 681, !463), (!699, 49,
!462), (!8, !764, !346), (698, 54, !463), and(37, 1, !838) on the PSUP, where the centre of thePSUP is (0, 0, 0), the z-axis is up, and the x- andy-axis are de"ned with respect to construction co-ordinates.
The optical calibration process results in thedetermination of attenuation and scattering coe$-cients for the heavy water, light water, and acrylic[60,61]. By using the various measured opticalcoe$cients, it is possible to simulate via aMonte Carlo calculation the optical transport ofCherenkov light produced by a neutrino or back-ground particle. These simulations can then beused to interpolate (in space and amplitude) be-tween the various energy calibrations discussed inthe next session.
Most of the optical analysis is performed usingdata from the quasi-isotropic laserball at nearsingle photoelectron (spe) light intensity, and uti-lizes the detected light intensities as a function ofthe calibrated time between the fast laser triggerand the digitized time value of the PMT discrimi-nators. Light re#ected from various parts of thedetector produces substructure in the time distribu-tion. This substructure can be used to characterizethe optical properties of various parts of the de-tector, such as the PMT re#ectors and the acrylicvessel, and to determine the Rayleigh, Mie andlarge particulate contributions to the scattering oflight in the water volumes [62,63].
By moving the laserball to various o!-centrepositions, absorption coe$cients can be measured.Calibration source access ports into the H
2O vol-
ume within the PSUP will aid in determining thelight attenuation in the acrylic panels. The relativePMT anode e$ciencies and the overall optical`gaina of the detector are to be monitored at thespe level over time, and can be separated fromchanges in other optical constants by taking data atseveral source positions and at 400 nm where theacrylic transmission is high and uniform acrossacrylic sheets.
There are three gas transport sources:a 16N gamma ray source, a 17N neutron source anda 8Li beta source [64}70], of which the 16N is fullydeveloped. The gas transport sources consist ofa D-T generator neutron source, a neutron targetchamber, gas capillaries, and decay chambers that
J. Boger et al. / Nuclear Instruments and Methods in Physics Research A 449 (2000) 172}207200
can be deployed within the detector. The D-Tgenerator, producing 14 MeV neutrons, is en-closed in concrete 30 m from the detector. Varioustarget chambers can be moved into the neutron#ux by stepper-motor control. Gases from the tar-get chamber are routed via capillaries to the deckarea and down into the source umbilical cables.The decay chambers can attach to the manipulatorcarriage and connect to the umbilical cable gaslines.
The 16N is produced via (n, p) on the oxygenin CO
2gas and decays by a beta delayed 6.13 MeV
(66%) or 7.12 MeV (4.8%) gamma ray with 7.13 shalf-life. The decay chamber is 41.9 cm long and5.7 cm radius, and is made from 5 mm thickstainless steel so that the electrons (which havea 10 MeV endpoint energy) are absorbed. Abeta tag is provided by a 3 mm thick scintillatorsleeve on the inside of the chamber with a 5 cmPMT. The source has been tested in the SNOdetector and produced over 300 16N decays persecond.
To reach gamma energies above 6 MeV aminiature accelerator source drives the 3H(p, c)4Hereaction to produce 19.8 MeV gammas [71}73].The source consists of a cold-cathode Penningion source, electron optics for beam extractionand acceleration, and a "xed target. It is housedin a 25 cm diameter, 60 cm long stainless-steelcapsule and operates with a beam voltage of20}30 kV to produce approximately one photonper second.
Tagged sources have been developed that permitspeci"c kinds of events in SNO to be identi"ed bytime coincidence with a trigger, allowing one toacquire calibration data in an essentially back-ground-free manner. Such sources are valuable fortesting PMT response, particularly at low energies,for determining backgrounds, for checking neutrontransport simulation code, and for calibrating eventreconstruction.
Tagged neutron sources are fabricated using252Cf at several di!erent activity levels. The 2.64 yr252Cf decays with a spontaneous "ssion branch at3.09%, which provides neutrons and a trigger fromfragment betas and gammas.
Another tagged source is constructed froma NaI crystal coupled to a PMT. The crystal is
activated to produce 15 h 24Na. The triggercan be gated on the energy deposited in the NaIin order to tag the 1.37 MeV or the 2.75 MeVgammas in SNO to study the response to low-energy gammas, and to measure photodisintegra-tion neutrons. A third source [74}76] underdevelopment is a polycarbonate-housed propor-tional counter with a radioactive source (e.g.,228Th) deposited on the anode wire. The source isdesigned so that emitted betas will deposit littleenergy in the counter and will mimic the spectrumproduced by natural radioactivity present inSNO.
After correcting for relative response due to posi-tion and direction, an event is assigned an energyaccording to a calibrated NHIT scale. The 16Nsource sets the absolute scale and providesa measurement of the energy resolution for a6.13 MeV gamma ray. The energy response toelectrons will be inferred from this measurementsince the di!erence in response between gammarays and electrons is well modeled with the EGS4code and will not contribute signi"cantly to theuncertainty in the electron energy scale. For eachevent there is a signi"cant probability for recordingunrelated noise hits. The rate of background hits isdirectly measured by regularly sampling the de-tector using the pulsed-GT trigger. The high-energyend of the scale is calibrated with the acceleratorsource.
The detector angular resolution is primarily de-termined from theoretical treatment of electronscattering and production of Cherenkov light, to-gether with the geometry of the PMT array. Thetreatment can be veri"ed through the Monte Carloagainst data from the 16N gamma source. If the"tted event position is taken to be the point ofmomentum transfer from the gamma ray to theelectron, then the initial direction of electronmotion for single Compton interactions is the vec-tor to this position from the 16N source position.A cut on large radial distances reduces the sourceangle uncertainty, while a cut on the larger NHITevents will select mostly those events of large mo-mentum transfers to the electron in the "rst scatter.Deconvolution of the Compton scattering anglecan be accomplished with the Monte Carlosimulation.
201J. Boger et al. / Nuclear Instruments and Methods in Physics Research A 449 (2000) 172}207
24An application of this thickness monitoring technique hasrecently been patented and commercial development of themonitor is in progress.
11. Control of radioactive contaminants
The minimization of background events requiresa high intrinsic purity of materials and the reduc-tion of radioactivity on the surfaces of the detectorcomponents. The purity of materials was addressedat the time they were selected for fabrication bymeasuring the activity in samples. Low backgroundc-ray counting and neutron activation analysishave been used extensively for analysis of di!erentmaterials in the SNO detector. Since the detector islocated in an active mine where the rock andore dust contains typically 60 mg/g Fe, about1.1 lg/g U, and about 6.4 lg/g Th, while the innercomponents of the detector require at or below10~12 g/g U and Th, dust levels had to be keptvery low. A programme to keep contamination aslow as reasonably achievable during the construc-tion and operation of the detector was plannedfrom the inception of the experiment. This sectiondescribes the methods for controlling and reducingsurface contamination.
Radon (222Rn) is of special concern in the SNOdetector, since it can di!use from components, dustor the cavity walls into the water and move intocritical regions of the detector. Radon emanationfrom components depends on di!usion propertiesas well as the U content, and hence it varies withthe density, hardness and surface properties of thematerials [29}31]. Extensive measurements of ra-don emanation were carried out in both vacuumand water test chambers for all critical materials forthe SNO detector.
Because of the presence of small amounts ofradioactive contaminants } 1.1$0.2 lg/g U and5.5$0.5 lg/g Th in the host rock and 1.2$0.1 lg/g U and 2.4$0.2 lg/g Th in the concreteliner } in the SNO detector cavity, radon ingressfrom the cavity walls is a potentially serious back-ground source. Radon di!usion studies were car-ried out on several polyurethane-coating materials,both in the laboratory and in an underground testfacility, to determine the radon attenuation proper-ties of these sprayed-on coatings. To meet the de-sign maximum of 12 radon atoms per square meterper hour di!using into the cavity from rock, con-crete and liner materials, the coating material(Urylon HH453 and 201-25 polyurethanes) was
required to be 8$1 mm thick. The coating wasapplied to a smooth concrete base on the cavitywalls and #oor in nine separate layers (of alternat-ing white and gray colour). The coating thicknesswas monitored with a portable probe, developedespecially for this work, which measured theamount of backscattered X-rays from a radioiso-tope source mounted in the probe [77].24 Thisbackscatter signal was proportional to the coatingthickness and a standard calibration procedure wasdeveloped to give coating thicknesses directly. Thecoating is expected to attenuate radon from thewalls by a blocking factor of 2]10~7.
Contamination control at SNO has several ele-ments. At the beginning of assembly of the detectora clean environment (air and surfaces) was estab-lished in the underground laboratory and main-tained throughout construction. The entirelaboratory became, and continues to be, a cleanroom. Fresh air entering the laboratory and the airthat is cooled and circulated within much of thelaboratory passes through HEPA "lters. Detectorcomponents were cleaned above ground and ap-propriately packaged for shipment underground.Material and equipment enter the laboratorythrough an interlocked area with high-pressurewater cleaning equipment. Personnel take wetshowers and put on clean garments before enteringthe laboratory proper. These transition areas, thecar wash and the personnel entry, are indicated onthe general layout of the laboratory (see Fig. 1).
The surfaces of the laboratory (walls, #oors, andconstruction equipment) were cleaned repeatedlyas necessary during construction. Personnel passthrough air showers at critical locations. Compo-nents of the detector (such as the acrylic vessel)were given a "nal cleaning after assembly. Compo-nents that could not be accessed for cleaning orthat have topologically complicated surfaces, forexample, the PMTs and re#ectors, were coveredwherever possible with clean tarpaulins or plasticsheeting (dust covers), which were removed ata later time. Dust covers were used extensively inthe construction of the acrylic vessel and the PSUP.
J. Boger et al. / Nuclear Instruments and Methods in Physics Research A 449 (2000) 172}207202
Toward the end of construction, the infrastructure(platforms, ladder ways, ductwork, elevator, etc.)was removed in a manner that left the detectorcavity clean. Care was required as much of thisinfrastructure was installed before the cavity was"rst cleaned.
At the end of construction the cavity deck wassealed to inhibit the movement of radon, and a sep-arate clean room was established on the deck abovethe chimney of the acrylic vessel. This local cleanroom encloses the insertion points and devices thatare used in the calibration and operation of thedetector and subsequently in the installation of theneutral-current detectors.
To control surface contamination one must beable to measure it and to monitor the factors a!ect-ing it. Commercial air-particle counters are used tosample the number and sizes of "ne particles in theair. The number of particles larger than 0.5 lm indiameter in 28 l of ambient air de"nes the `classa ofthe air and of the clean room. Class values varydramatically depending on the work going on ina particular area. In general, the quality of the airwithin the laboratory has been in the range of class1000}10,000, depending on location and level ofactivity. The amount (mass) of dust that accumu-lates depends on the number versus size distribu-tion and on the density of the particulate. Massversus size distributions for mine dust were meas-ured with a cascade impactor, and number-versus-size distributions with an optical microscope.
The dust deposition rate and the total accumu-lated dust are the most relevant quantities. Severalmethods were used to measure the amount of con-tamination on a surface. A quick method is the`white glove testa, in which a white cloth, mountedon the sharp edge of an eraser, is wiped over a sur-face for a given distance. Through calibrationmeasurements and adoption of consistent proce-dures this test has been made semi-quantitative,and it is sensitive down to about 0.5 lg/cm2 of dust.
X-ray #uorescence spectrometry (XRF) was usedfor more sensitive and precise measurements. Inthis method, one detects elements in the rangeZ"20 to 45 by the characteristic X-rays emittedfollowing #uorescence of the sample with an X-raytube. A spectrometer was built for this purpose andlocated underground for convenient use.
In one type of XRF measurement, thin, spectro-scopically pure plastic "lms were used as `witnessplatesa to collect dust over a known period of time.The amount of mine dust deposited was inferred bymeasuring the amount of iron, which is present inthe local mine dust at the level of 7%. A sensitivityof about 0.1 lg/cm2 is possible in a counting timeof 20 min.
In a second type, dust is removed from a surfaceby placing a section of thin adhesive tape (low inFe) on the surface, pulling it o! and placing it in thespectrometer. When a single piece of tape is used toperform "ve lifts from adjacent areas on a surface,the sensitivity can be extended down to about0.015 lg/cm2. This method was used to monitorthe surface cleanliness of the acrylic vessel.
A few direct measurements of U and Th in depo-sited dust were made using neutron-activationanalysis to verify the correlation of Fe with U/Th.
During more than 3 yr of construction sinceclean conditions were "rst established, fairly regu-lar patterns and deposition rates emerged. Thequality of the air was characterized by an averageclass value of 2500$500. Average deposition ratesranged from 1 lg/cm2/month of mine dust in busyareas to one tenth that amount in inactive areas.(The air particle counts and mass deposition ratesare roughly consistent with the number-size distri-butions for airborne particulates measured insidethe laboratory.) The level of cleanliness on thesurface of the acrylic vessel at the time of water "llwas typically better than 0.1 lg/cm2. (Zinc was alsoregularly observed in the XRF spectra at a leveltypically 20% of the mine dust. Zinc comes mainlyfrom the use of galvanized sca!olding in construc-tion.) Since a mass deposition of 1 lg/cm2/monthintegrated over a 30-month period would exceedthe target contamination limits in any region of thedetector, periodic cleaning of accessible surfacesand the use of dust covers on inaccessible areas wasrequired to achieve target levels.
12. O4-line analysis and simulation code} SNOMAN
The o!-line software is required to perform twomajor functions: the analysis of SNO data, and
203J. Boger et al. / Nuclear Instruments and Methods in Physics Research A 449 (2000) 172}207
a detailed and complete simulation by MonteCarlo techniques of all signi"cant signals and back-grounds using as accurate a model of the detectorand its response as possible. Both of these functionsare combined in the SNO Monte Carlo and Analy-sis code, or SNOMAN. SNOMAN consists of a setof largely autonomous processors written primarilyin FORTRAN. In order to ease distributed devel-opment and maintenance (and to overcome thelack of dynamic memory allocation in FORTRAN)these processors communicate through a centraldata structure managed by the CERNLIB packageZEBRA. ZEBRA is also the basis for the manage-ment of banks of data, called `titlesa. Titles-management routines in SNOMAN insure that assuccessive events are analysed the constants de-scribing the detector response are the appropriateones for that time and detector con"guration. Theuse of autonomous processors working on a centraldata structure allowed staged development of theprocessors. Since at the time of this writing thereare over 25 processors in SNOMAN, only selectedones will be discussed.
In addition to SNOMAN there is another majoro!-line analysis tool: the SNO database, orSNODB, which is based on the CERNLIB packageHEPDB. SNODB is a distributed master-slavedatabase that runs collaboration wide via PERLinstallation and management scripts. The scriptsset up SNODB on the large variety of platforms inuse and manage the updates that keep the variousslave copies of the database in step with the mastercopy. SNODB contains ZEBRA banks that encodeall the information about calibrations and detectorstatus, con"guration, and performance which isneeded to interpret SNO data.
The basic units of the data structure for theMonte Carlo are the vertex and the track. A vertexrepresents any event of interest in the movement ofa particle (the origin of the particle, when it encoun-ters a boundary, any interactions it undergoes, etc.),while tracks specify how particles move from onevertex to the next. The Monte Carlo can then bedivided into generation (deciding what seed verticesto create), propagation (taking the initial seedvertices and creating successive tracks and verticesbased on the transport of that type of particle in theSNO detector, and creating any additional particle
such as Cherenkov photons which the initial par-ticle may spawn), detection (either of photons bythe PMTs or of neutrons by the NCDs), and elec-tronics simulation. In order to achieve accurate,usable code with the least time and e!ort well-established and tested software packages have beenused wherever possible. For example the propaga-tion of electrons, positrons, and gammas is handledby EGS4 [78] (modi"ed to produce tracks andvertices), the propagation of neutrons is handled byroutines lifted from MCNP [79], the muon physicsis largely taken from GEANT [80], and much ofthe code that describes how the spectra might bemodi"ed by the MSW e!ect is taken from the workof Hata [81]. Cross-sections doubly di!erentialwith respect to energy and angle for neutrino inter-actions with deuterium are those of Kubodera andNozawa [51]. A large amount of work has goneinto verifying several aspects of these modi"ed ex-ternal codes, which are particularly critical to SNOphysics but which may not have been extensivelytested in the past. In particular a considerableamount of e!ort has been expended on understand-ing the angular distribution of Cherenkov photonsproduced by an electron of a few MeV [82,83],which is important for some of the analysis tech-niques discussed below.
The Monte Carlo code for which reliable, pre-tested software like EGS4 was not available waswritten by the SNO collaboration. The photonpropagation includes the e!ects of attenuation, re-fraction, re#ection, and Rayleigh scattering (Miescattering is expected to be negligible for the levelsof cleanliness expected in SNO) as a function ofwavelength and polarization. The light concentra-tor/PMT response has been the focus of substantialsoftware development and experimental e!ort.A detailed stand-alone simulation of a concentratorand PMT was written [84] and tested againstexperiment [85], then installed as a SNOMANprocessor.
The geometry of the detector is a compromisebetween a totally data-driven system that would beslow but #exible and a completely hard-wiredstructure that would be fast but in#exible. Thegeometry consists of detector elements, each ofwhich is made up of primitives (such as spheres,cylinders, elliptical toroids, etc.) for which the
J. Boger et al. / Nuclear Instruments and Methods in Physics Research A 449 (2000) 172}207204
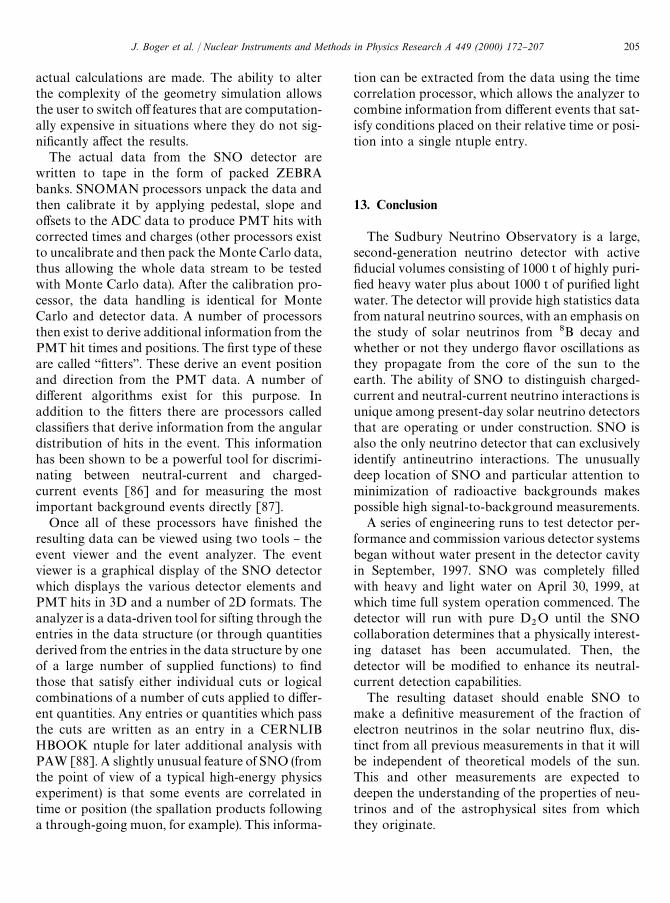
actual calculations are made. The ability to alterthe complexity of the geometry simulation allowsthe user to switch o! features that are computation-ally expensive in situations where they do not sig-ni"cantly a!ect the results.
The actual data from the SNO detector arewritten to tape in the form of packed ZEBRAbanks. SNOMAN processors unpack the data andthen calibrate it by applying pedestal, slope ando!sets to the ADC data to produce PMT hits withcorrected times and charges (other processors existto uncalibrate and then pack the Monte Carlo data,thus allowing the whole data stream to be testedwith Monte Carlo data). After the calibration pro-cessor, the data handling is identical for MonteCarlo and detector data. A number of processorsthen exist to derive additional information from thePMT hit times and positions. The "rst type of theseare called `"ttersa. These derive an event positionand direction from the PMT data. A number ofdi!erent algorithms exist for this purpose. Inaddition to the "tters there are processors calledclassi"ers that derive information from the angulardistribution of hits in the event. This informationhas been shown to be a powerful tool for discrimi-nating between neutral-current and charged-current events [86] and for measuring the mostimportant background events directly [87].
Once all of these processors have "nished theresulting data can be viewed using two tools } theevent viewer and the event analyzer. The eventviewer is a graphical display of the SNO detectorwhich displays the various detector elements andPMT hits in 3D and a number of 2D formats. Theanalyzer is a data-driven tool for sifting through theentries in the data structure (or through quantitiesderived from the entries in the data structure by oneof a large number of supplied functions) to "ndthose that satisfy either individual cuts or logicalcombinations of a number of cuts applied to di!er-ent quantities. Any entries or quantities which passthe cuts are written as an entry in a CERNLIBHBOOK ntuple for later additional analysis withPAW [88]. A slightly unusual feature of SNO (fromthe point of view of a typical high-energy physicsexperiment) is that some events are correlated intime or position (the spallation products followinga through-going muon, for example). This informa-
tion can be extracted from the data using the timecorrelation processor, which allows the analyzer tocombine information from di!erent events that sat-isfy conditions placed on their relative time or posi-tion into a single ntuple entry.
13. Conclusion
The Sudbury Neutrino Observatory is a large,second-generation neutrino detector with active"ducial volumes consisting of 1000 t of highly puri-"ed heavy water plus about 1000 t of puri"ed lightwater. The detector will provide high statistics datafrom natural neutrino sources, with an emphasis onthe study of solar neutrinos from 8B decay andwhether or not they undergo #avor oscillations asthey propagate from the core of the sun to theearth. The ability of SNO to distinguish charged-current and neutral-current neutrino interactions isunique among present-day solar neutrino detectorsthat are operating or under construction. SNO isalso the only neutrino detector that can exclusivelyidentify antineutrino interactions. The unusuallydeep location of SNO and particular attention tominimization of radioactive backgrounds makespossible high signal-to-background measurements.
A series of engineering runs to test detector per-formance and commission various detector systemsbegan without water present in the detector cavityin September, 1997. SNO was completely "lledwith heavy and light water on April 30, 1999, atwhich time full system operation commenced. Thedetector will run with pure D
2O until the SNO
collaboration determines that a physically interest-ing dataset has been accumulated. Then, thedetector will be modi"ed to enhance its neutral-current detection capabilities.
The resulting dataset should enable SNO tomake a de"nitive measurement of the fraction ofelectron neutrinos in the solar neutrino #ux, dis-tinct from all previous measurements in that it willbe independent of theoretical models of the sun.This and other measurements are expected todeepen the understanding of the properties of neu-trinos and of the astrophysical sites from whichthey originate.
205J. Boger et al. / Nuclear Instruments and Methods in Physics Research A 449 (2000) 172}207
Acknowledgements
This research has been "nancially supported inCanada by the Natural Sciences and EngineeringResearch Council, Industry Canada, NationalResearch Council of Canada, Northern OntarioHeritage Fund Corporation and the Province ofOntario, in the United States by the Department ofEnergy, and in the United Kingdom by the Scienceand Engineering Research Council and the ParticlePhysics and Astronomy Research Council. Furthersupport was provided by INCO, Atomic Energyof Canada Limited (AECL), Agra-Monenco, Cana-tom, Canadian Microelectronics Corporation andNorthern Telecom. The heavy water has beenloaned by AECL with the cooperation of OntarioHydro. The provision by INCO of an undergroundsite is greatly appreciated. The collaboration wishesto express gratitude for all the support provided tomake the experiment possible.
References
[1] V. Gribov, B. Pontecorvo, Phys. Lett. B 28 (1969) 493.[2] J.N. Bahcall, R. Davis Jr., Science 191 (1976) 264.[3] S. Weinberg, Phys. Rev. Lett. 19 (1967) 1264.[4] A. Salam, in: N. Svartholm (Ed.), Elementary Particle
Theory, 1969, p. 367.[5] S.L. Glashow, J. Iliopoulus, L. Maiani, Phys. Rev.
D 2 (1970) 1285.[6] L. Wolfenstein, Phys. Rev. D 17 (1979) 2369.[7] S.P. Mikheyev, A.Yu. Smirnov, Yad. Fiz. 42 (1985) 1441,
Sov. J. Nucl. Phys. 42 (1985) 913.[8] S.P. Mikheyev, A.Yu. Smirnov, Nuovo Cimento C 9 (1986)
17.[9] B.T. Cleveland et al., Astrophys. J. 496 (1998) 505.
[10] Kamiokande II Collaboration, K.S. Hirata et al., Phys.Rev. Lett. 65 (1990) 1297.
[11] Kamiokande II Collaboration, K.S. Hirata et al., Phys.Rev. Lett. 65 (1990) 1301.
[12] Kamiokande II Collaboration, K.S. Hirata et al., Phys.Rev. Lett. 66 (1991) 9.
[13] Kamiokande II Collaboration, K.S. Hirata et al., Phys.Rev. D 44 (1991) 2241.
[14] Superkamiokande Collaboration, Y. Fukuda et al., Phys.Rev. Lett. 81 (1998) 1158.
[15] SAGE Collaboration, J.N. Abdurashitov et al., Phys. Rev.Lett. 77 (1996) 4708.
[16] SAGE Collaboration, J.N. Abdirashitov et al., astro-ph/9907113 (1999).
[17] GALLEX Collaboration, W. Hampel et al., Phys. Lett.B 447 (1999) 127.
[18] J.N. Bahcall, S. Basu, M.H. Pinsonneault, Phys. Lett.B 433 (1998) 1.
[19] A.S. Brun, S. Turck-Chieze, P. Morel, Astrophys. J. 506(1998) 913.
[20] A. Dekok, MSc. Thesis, Department of Physics, CarletonUniversity, 1996.
[21] R.K. Taplin, Design description for the SNO SUFplant, Sudbury Neutrino Observatory, SNO-STR-96-033,1996.
[22] R.K. Taplin, D. Phil. Thesis, Department of Physics,Oxford University, 1996.
[23] J.-X. Wang, Data analysis of ESC counting for Raand Rn, Sudbury Neutrino Observatory, SNO-STR-95-066, 1996.
[24] T. Anderson, Recent results on extraction e$ciencies, sys-tematics, and "nes with MnO
2coated beads, Sudbury
Neutrino Observatory, SNO-STR-95-022, 1995.[25] J.-X. Wang, T. Anderson, J.J. Simpson, Nucl. Instr. and
Meth. A 421 (1999) 601.[26] X. Zhu, M.Sc. Thesis, Department of Physics, Queen's
University, 1993.[27] S. Noel, M.Sc. Thesis, Department of Physics, Queen's
University, 1995.[28] M.-Q. Liu, H.W. Lee, A.B. McDonald, Nucl. Instr. and
Meth. A 329 (1993) 291.[29] J. Bigu, E.D. Hallman, L. Kendrick, Permeability of di!er-
ent materials to Radon, SNO-STR-91-069, 1991.[30] M. Wojcik, Nucl Instr. and Meth. B 61 (1991) 8.[31] W. MuK ller, Thesis, University of Heidelberg, 1978.[32] ANSYS Inc., 275 Technology Drive, Connonsburge, PA
15317 (http://www.ansys.com).[33] P. Jagam, J.J. Simpson, Nucl. Instr. and Meth. A 324
(1993) 389.[34] C. Athanassopoulos et al., Phys. Rev. C 54 (1996) 2658.[35] R.W. MacLeod, Evaluation of large area photomultiplier
tubes for the Sudbury Neutrino Observatory, M.Sc. The-sis, Department of Physics, Queen's University, 1990.
[36] C.J. Jillings et al., Nucl. Instr. and Meth. A 373 (1996) 421.[37] C.J. Jillings, A photomultiplier tube evaluation system for
the Sudbury Neutrino Observatory, M.Sc. Thesis, Depart-ment of Physics, Queen's University, 1992.
[38] K.T. Lesko, Project Notebook, Sudbury Neutrino Obser-vatory, Lawrence Berkeley National Laboratory, Rev. B.
[39] G. Doucas et al., Nucl. Instr. and Meth. A 370 (1996) 579.[40] H. Leung, Tensile creep testing of ABS plastic "nal report,
SNO-STR-92-055.[41] AT&T Microelectronics, Allentown, Pennsylvania.[42] F.M. Newcomer, R. Van Berg, A wide dynamic range
integrator-discriminator-timer chip set for PMT applica-tions, IEEE Nucl. Sci. Symp. Trans. Nucl. Sci. NS-42 (4)(1995) 925.
[43] T. Ekenberg, R. Van Berg, A. Biman, R.L. Stevenson, Ananalog memory, time to amplitude converter, and triggerlogic chip for PMT applications, IEEE Nuclear ScienceSymposium and Medical Imaging Conference, IEEE Con-ference Record, Vol. 1, 1995, pp. 30}34.
[44] Northern Telecom, Ottawa, Ontario, Canada.
J. Boger et al. / Nuclear Instruments and Methods in Physics Research A 449 (2000) 172}207206

[45] ZEBRA, CERN Program Library Long WriteupQ100/101, CERN, Geneva, Switzerland.
[46] T.J. Bowles et al., in: Neutral-current detection in theSudbury Neutrino Observatory, Los Alamos National Lab-oratory, Appendix to FIN-94-ER-E324, January 31, 1992.
[47] E.L. Pasierb Ph.D., Dissertation, University of California,Irvine, 1979.
[48] I.I. Gurevich et al., I.V. Kurchatov Institute of AtomicEnergy Preprint IAE-4986/2, 1989.
[49] G.S. Vidyakin et al., JETP Lett. 59 (1994) 364.[50] Y. Fukuda et al., Phys. Rev. Lett. 81 (1998) 1185.[51] K. Kubodera, S. Nozawa, Int. J. Modern Phys. E 3 (1994)
101.[52] Nemasoft Corporation, 55 West Street, Walpole, MA
02081, USA.[53] Sciemetric Instruments Inc., 27 Northside Road, Nepean,
ON K2H 8S1, Canada.[54] R.J. Ford, SNO N
2/dye laser and "bre optic di!user ball
system manual, Sudbury Neutrino Observatory, SNO-STR-96-056, 1997.
[55] R.J. Ford, Nitrogen/dye laser system for the optical cali-bration of SNO, M.Sc. Thesis, Department of Physics,Queen's University, 1993.
[56] S. Hilgenfeldt, S. Grossman, D. Lohse, Nature 398 (1999)402.
[57] B.P. Barber et al., Phys. Rep. 281 (1997) 65.[58] Douglas McDonald, Studies of the Sudbury Neutrino
Observatory detector and sonoluminescence using a son-oluminescent source, Ph.D. Thesis, Department of Physicsand Astronomy, University of Pennsylvania, 1999.
[59] Y. Sato, N. Takahashi, S. Sato, Jpn. J. Appl. Phys. 35 (7A)(1996) L838.
[60] R.J. Ford, Fitting optical constants in SNO using a pulsedN
2/dye laser, Sudbury Neutrino Observatory, SNO-STR-
96-055, 1996.[61] S. Biller, R.J. Ford, Optical calibration strategies, Sudbury
Neutrino Observatory, SNO-STR-96-072, 1996.[62] C.F. Bohren, D.R. Hu!man, Absorption and Scattering of
Light by Small Particles, Wiley, New York, 1983.[63] C. Waltham et al., Appl. Opt. 33 (31) (1994) 7536.[64] B. Sur et al., Bull. Am. Phys. Soc. 39 (1994) 1389.[65] E.B. Norman, B. Sur, 17N: a tagged neutron source for SNO,
Sudbury Neutrino Observatory, SNO-STR-94-037, 1994.[66] B. Sur, E.D. Earle, Gas transport calibration system for
SNO: a preliminary design document, Sudbury NeutrinoObservatory, SNO-STR-95-053, 1995.
[67] B. Sur, E.D. Earle, R. Deal, E. Gaudette, 8Li: a betacalibration source for SNO, Sudbury Neutrino Obser-vatory, SNO-STR-95-054, 1995.
[68] J.N. Bahcall, E. Lisi, Phys. Rev. D 54 (1996) 5417.[69] A. Hamer, B. Sur, Targets for the 16N calibration source,
Sudbury Neutrino Observatory, SNO-STR-97-033, 1997.[70] G. Jonkmans, I.S. Towner, B. Sur, Phys. Rev. C 58 (1998)
1278.[71] A.W.P. Poon et al., in: E.N. Alexeev, V.A. Matveev, Kh.S.
Nirov, V.A. Rubakov (Eds.), Particles and Cosmology,World Scienti"c, Singapore, 1996, p. 248.
[72] A.W.P. Poon, Energy calibration of the Sudbury NeutrinoObservatory using monoenergetic gamma-ray sources,Ph.D. Thesis, Department of Physics, University of BritishColumbia, 1998.
[73] A.W.P. Poon et al., A compact 3H(p, c)4He 19.8-MeVgamma-ray source for energy calibration at the SudburyNeutrino Observatory, submitted to Nucl. Instr. Meth. A.
[74] F. Dalnoki-Veress, C.K. Hargrove, A proportionalcounter to calibrate SNO backgrounds, Sudbury NeutrinoObservatory, SNO-STR-97-052, 1997.
[75] F. Dalnoki-Veress, Investigation of the triggered sourcetechnique for the calibration of SNO, M.Sc. Thesis, De-partment of Physics, Carleton University, 1996.
[76] C.K. Hargrove, Ira Blevis, E. Bonvin, Coincidencemeasurements of SNO background spectra with a propor-tional counter, Sudbury Neutrino Observatory, SNO-STR-94-060, 1994.
[77] Method and apparatus for measuring thickness of paintlayers on substrates using backscattering of X-rays. U.S.Patent No. 5,862,199.
[78] W.R. Nelson, H. Hirayama, D.W.O. Rogers, The EGS4code system, SLAC report 265, 1985.
[79] MCNP4A, A Monte Carlo N-Particle transport code sys-tem, Radiation Shielding Information Center, Los AlamosNational Laboratory, Nov. 1993 (unpublished).
[80] CN/ASD, Geant detector description and simulation tool,CERN, 1994 (unpublished).
[81] N. Hata et al., Phys. Rev. D 50 (1994) 632.[82] M.G. Bowler, Nucl. Instr. and Meth. A 378 (1996) 463.[83] M.G. Bowler, M.D. Lay, Nucl. Instr. and Meth. A 378
(1996) 468.[84] M.D. Lay, D. Phil. Thesis, Department of Physics, Oxford
University, 1994.[85] M.J. Lyon, D. Phil. Thesis, Department of Physics, Oxford
University, 1996.[86] S.J. Brice, D. Phil. Thesis, Department of Physics, Oxford
University, 1996.[87] Xin Chen, D. Phil. Thesis, Department of Physics, Oxford
University, 1997.[88] CN/ASD, Physicist Analysis Workstation, CERN, 1998
(unpublished).
207J. Boger et al. / Nuclear Instruments and Methods in Physics Research A 449 (2000) 172}207