Embed Size (px)
Citation preview
The State's Operating Budget:
Critical Crossroads, Choices, and Opportunities
(Update)
A Commonwealth North Study Report
Cheryl Frasca and Eric Wohlforth
Study Group Co-Chairs
January 2017
Jim Egan and Aaron Weddle Staff
BOARD OF DIRECTORS
PRESIDENT Cheryl Frasca – Director, Office of Management and Budget (2002-2006)
PRESIDENT ELECT Mead Treadwell - President, Pt Capital, LLC
SECRETARY
Bob Cox - Vice President, Crowley Petroleum Distribution
TREASURER
Terry Smith - Unified Operations, LLC
PAST PRESIDENT Mary Ann Pease - Owner, MAP Consulting, LLC
Thea Agnew Bemben - Principal, Agnew::Beck Consulting
Tom Case - Chancellor, University of Alaska Anchorage
Bill Falsey - Municipal Attorney, Municipality of Anchorage
Max Hodel - Founding President of Commonwealth North †
Meera Kohler - President and CEO, Alaska Village Electric Cooperative
Scott Jepsen - Vice President for External Affairs, ConocoPhillips Alaska
Lee Leschper - Leschper Communications
Brad Osborne – President, NANA Oilfield Services, Inc.
Sean Parnell – Alaska Governor (2009-2014)
Karen Perdue – Commissioner, Alaska Department of Health and Social Services (1994-2001)
Tina Pidgeon - General Counsel, Chief Compliance Officer, and Senior VP, Governmental Affairs, GCI
Morton Plumb - Principal, Plumb Group
Alice Rogoff – Owner & Publisher, Alaska Dispatch
William Sheffield - Alaska Governor (1982-1986); founding board member †
Eric Wohlforth - Jermain, Dunnagan & Owens, P.C.
___________
Jim Egan - Executive Director, Commonwealth North
t Denotes Past President
The State Operating Budget:
Critical Crossroads, Choices, and Opportunities
Update
Table of Contents
and
Summary of Recommendations
Page
lntroduction ............................................................................................................. 1
Two Year Update‐What's Changed? .......................................................................3
Has Spending Been Cut Since 2015? ....................................................................... 4
Operating Budget Cost Drivers
State Employee Salary and Health Care Costs ............................................................................. 6 Recommendations: Given the state's fiscal reality, the Administration and unions re‐open negotiations to
identify savings in salary and other benefit costs.
Amend the Public Employee Relations Act to remove health care as a mandatory subject of bargaining.
State Health Care Spend ............................................................................................................... 8
Cost of Health Care in Alaska ...................................................................................................... 12 Recommendations: Review the findings of the state's health care authority feasibility study to be released in
January 2017. Based on its findings, evaluate the impact of removing barriers to formation of larger consolidated health coverage plans with a pool of members that could include public employees and retirees, individuals, and small business groups, and potentially Medicaid enrollees; two or three plan choices for this pool could be identified by possibly using the Medicaid benefit package as a base and varying levels of co‐pays and deductibles.
Work with diverse stakeholders, including payers and health care providers, to modify
the 80th percentile rule and increase consumer protections related to balance billing.
ii
Leverage "value‐based" payment reforms currently underway in Medicare that places physicians on a fee schedule for Medicare patients; provide bonus payments to providers who implement value‐based payment reforms for Medicaid as well as public and private employer coverage.
Identify Alaska Medicaid and Medicare top primary care and behavioral health providers that see the most Medicaid and Medicare enrolled patients and negotiate with those providers to pay per‐member‐per‐month payments for primary care case management for enrollees that would benefit from that level of care management; may require a subsidy for the cost for these providers to connect to Alaska's Health Information Exchange.
Review the reform initiatives proposed in the "Recommended Medicaid Expansion and Reform Strategies for Alaska" and consider implementation for Alaskans, including and beyond those covered by Medicaid, such as those with marketplace‐plans, large and small employers, and the individual market.
Enact a statewide smoke‐free workplace law to protect all Alaskans from secondhand smoke in the workplace and that implements proven approaches to reducing tobacco use among all Alaskans; include marijuana smoke and e‐cigarette vapor. A statewide law is necessary because many Alaska communities are in boroughs that lack health powers, or are located outside of a borough or municipality, so don't have the ability to make these changes.
Formula Driven Spending: Medicaid .................................................................................... 15 Recommendations:
The Administration and the Legislature immediately embark on a Medicaid reform initiative to ensure that the state can continue to provide services to those most in need. (2015)
The Legislature should reduce the number of Optional Services Alaska covers if necessary due to budget constraints. (2015)
Given the anticipated policy changes at the Federal level, the State needs to quickly assess these potential reforms on health coverage for Alaskans and identify challenges and opportunities that may arise.
Depending upon the magnitude and speed by which these initiatives may be implemented, the State should consider options such as adjusting Medicaid reimbursement rates by reducing Medicaid rates to a factor of Medicare rates (Medicaid rates are 20 to 30% above the rates for Medicare) to avoid an abrupt increase in State general fund spending.
iii
Formula Driven Spending: K‐12 Funding ............................................................................... 20 Education funding needs to refocus on direct instruction that yields measurable
improvements in student achievement. State K‐12 funding should be reduced by 1 to 3 percent per year for four years, during which funding would have to be reallocated from administrative/operations to maintain funding for direct instruction.
Prior to making investments in UA, teacher training programs, both in and outside Alaska, should be evaluated to identify those that have produced high quality teachers that have generated high student achievement results.
State Transportation and lnfrastructure .......................................................................... 23 Increase coordination of state road maintenance and snowplowing functions with local
governments, where it can result in improved performance and efficiency.
Develop and publish performance metrics for the Department of Transportation and Public Facilities' activities and results so its performance can be compared to that of other states as well as provide transparent accountability to Alaskans.
Increase the state motor fuel tax from 8 cents to 16 cents per gallon so an estimated $30 million in additional revenue can be available for maintenance and operation of transportation infrastructure.
Explore divestiture (privatize or restructure) of the Alaska International Airport System (AIAS) (Ted Stevens and Fairbanks Airports) to determine the benefits that might come from of a nimbler structure.
Reform and revitalize the Alaska Marine Highway System by converting it from long haul routes to short‐range ferry routes in combination with road segments.
Permanent Fund & Use of Earnings .................................................................................. 25 Recommendations:
Support a percent of market payout formula.
Use Permanent Fund earnings to help structurally address the state's revenue shortfall, while maintaining a dividend program.
Reducing the annual dividend is a fiscal necessity for the state‐Alaska needs to start using some level of Permanent Fund earnings to help meet the need for public services.
Continue to pay the Permanent Fund dividend from the fund's realized earnings.
The Permanent Fund's earnings reserve account should be invested in cash equivalents apart from the rest of the Fund.
Permanent Fund Corporation should open offices in Anchorage and out‐of‐state financial centers.
Strengthen and enlarge the Board of Trustees.
iv
More competitive compensation of board and staff members to attract and retain highly skilled individuals.
State Government Operational Efficiencies / Savings ................................................ 28 Recommendations: Fully implement the Universal Space Management Standards (2013) to achieve savings
through uniform procurement and office space consistency in all parts of the state. The Administration is realizing savings by reducing the amount of leased space and relocating programs to state‐owned buildings that now have space available. In 2013 it was estimated that application of uniform standards could save $125 million over 20 years.
Expand the Administration's Shared Services initiative to achieve efficiencies/savings by outsourcing, such as:
– Contract with the private sector for IT savings (i.e. shift email hosting from the State's mainframe to private sector providers).
– Consolidate/centralize payment collections for various permits, licenses, etc. that currently are spread throughout departments; use of technology to make on‐line payments eliminates the need for program subject matter "experts" be directly involved in payment process.
– Re‐consolidate Human Resources; over time some HR staff has been shifted back to departments thereby reducing the productivity savings in work load distribution and consistent interpretation of employee contracts/laws that have been/can be realized through consolidation;
– Centralize department administrative services functions into the Department of Administration instead of each department having a stand‐alone division.
Consolidate departments such as: – Labor with Commerce – Public Safety with Corrections – Environmental Conservation with Natural Resources
Budget Process & Practices (2015 Recommendations) ............................................... 29
The Governor should appoint, with legislative approval, a committee of experts to analyze, within a short period of time, what designated revenue accounts have no legal restriction on use and can be appropriated to the general fund, including any statutory changes that will be necessary.
v
The Legislature appropriate designated reserve balances to the general fund so these funds are available to fund priority State services.
Identify and Fund Appropriate, Effective Services: The Administration and Legislature should undertakes a review of state services to evaluate the following:
– Based on constitutional responsibilities, is a program or service something the State is required to do;
– If it is appropriate, analyze the results the program is getting‐how effective is it in achieving its intended purpose;
– Examine the cost to deliver current results‐what's the "return on investment" in terms of cost compared to results/effectiveness;
– Evaluate if the State is the only entity that can provide the service or if it would be more cost effective and responsive if the services were contracted out or shed through privatization; and/or
– If it is not a State responsibility, stop providing the service.
Increase the number of in‐depth performance reviews conducted to more than one department per year so increased information is available to identify potential savings.
Undertake an in‐depth review of performance frameworks and measures during the interim.
Integrate use of program performance measures into its budget review to ensure public dollars are spent on effective services.
Engage citizens in this review process, which will provide legislators and the Administration with differing perspectives and advance citizen understanding of state services.
The Governor appoint a citizen‐led commission to conduct a management review of state operations that engages the departments and citizens to identify savings and opportunities to improve service delivery.
Put in place an approval process, such as that used by Congress in the Base Realignment and Closure (BRAC) decision‐making, to increase the likelihood that comprehensive reforms will be enacted.
Engage Alaskans in Meeting the Challenge: The Governor and Legislature engage Alaskans in a series of community‐based dialogues in which they discuss the state's future; the responsibilities of the state and individual Alaskans in that future; and how achieving that vision will be funded.
vi
Develop a multiyear approach to communicate critical operating budget issues in cooperation with other public and private organizations. Such efforts must identify general "consumer level" messaging that attracts public interest in Alaska's budget and the challenges we face. It is critical to engage the public with social media‐sized bites of information that drive clicks to detail, and that helps to enhance an understanding of the needs and vision of the state.
Budget Development (2015 Recommendations) ......................................................... 34
The Governor should establish citizen advisory panels to provide input
during development of the Governor's proposed budget.
Require the Governor to submit the proposed budget to the Legislature by
November 15th each year to enable the Legislature to get an earlier start to its
review.
Establish Revenue Limit that limits the amount of savings that can be spent in any
one fiscal year to ensure prudent use and extend availability.
Use the appropriation structure to provide departments maximum flexibility to
identify and implement savings.
The Legislature revises its schedule to increase the time available for oversight of
state spending, such as:
– Returning to the Constitution's 120‐day session limit; – Increasing the number of interim meetings for
Finance Committee/subcommittee work; – Convening special session(s) devoted to budget issues; and/or
Extending the session by four weeks in odd‐years (two weeks added on each end).
Establish a Joint Ways and Means Committee tasked with:
– Introduction of a resolution at the start of each session that establishes the overall amount of revenue that will be available for the following fiscal year's budget (including the amount that will come from savings) on which the budget will be based;
– Review of the state's revenue forecasting methodology to ensure the degree of reliability for spending decision‐making and identify options that could improve reliability.
vii
The Legislature and Governor develop and implement a contingency plan that
identifies steps that will be taken to reduce current fiscal year spending due to a
dramatic drop in expected revenue.
Evaluate the potential benefits to forward fund the state budget based on prior
year revenue.
Deposit the CBR balance into the statutory budget reserve.
viii
The State Operating Budget:
Critical Crossroads, Choices, and Opportunities Update
Appendices
Page
A Fiscal Policy Study Group Participant List .................................................... 39
B Study Group Speakers & Presentations ....................................................... 41
C Prior CWN Fiscal Policy Studies 1980 ‐ 2015 ............................................. 44
D Personal Services Bargaining Unit Position Counts FY 17 ........................... 45
E FY 17 Operating Budgeted Health Care Costs ............................................. 47
F Reforms to Alaska Health Care Delivery System ......................................... 48
G FY 15 Medicaid Optional and Mandatory Services...................................... 50
H CWN Board Permanent Fund Resolution .................................................... 52
I Fund Source Codes ...................................................................................... 53
J House Bill 105 ‐ Operating Budget Legislation, 1983 ................................ 59
ix
The State Operating Budget: Critical Crossroads, Choices, and Opportunities
Update
Charts & Tables
Charts Page
1 Surpluses and Deficits ‐ FY 05 to 17 .......................................................... 3
2 General Fund Spending ‐ FY 15 ................................................................. 4
3 General Fund Spending ‐ FY 17 ................................................................. 4
4 Change in Spending FY 17 to 15 ................................................................... 5
5 K‐12, Medicaid Share of Budget .................................................................. 20
6 Permanent Fund Earnings and How We Use Them .................................... 26
7 1989 to 2013 RSB Production Forecast Tested Against Actual ................... 37
8 1989 to 2013 ANS Average Production Tested Against Actual ................... 37
Tables Page
1 Collective Bargaining Agreements Terms ..................................................... 7
2 SOA Operating Budget Health Care Costs .................................................... 8
3 Changes in Key Provisions of Health Benefit Plans ...................................... 8
4 Union Trust Member Premium Cost & Benefits ........................................... 9
5 Change in Number of Budgeted Positions FY 17 to 14 ................................ 11
6 Change in Amount Budgeted for Positions FY 17 to 14 .............................. 11
7 Medicaid Program Funding FY 18 v 15 ........................................................ 15
8 Trends in Population, Medicaid Enrollment, Utilization ............................. 17
9 Optional Medicaid Services Cost ................................................................. 18
The Operating Budget:
Critical Crossroads, Choices, and Opportunities Update ‐ January 2017
Introduction With Commonwealth North's (CWN) long commitment to a sound state fiscal policy and the state faced with a daunting gap between revenue and spending, CWN's Fiscal Policy Study Group was charged with an examination of the state's operating budget to identify recommendations to help reduce state spending.
This was the opening introduction for the initial report released in February 2015. This report is an update on state spending since then, as well as on its recommendations.
We hope that these reports assist Alaska's Governor and Legislature find new and different approaches that serve to strengthen resolve and help craft a new direction for the state in the years ahead.
Commonwealth North has been contributing to Alaska's fiscal policy dialogue since 1980, with reports addressing sustainable budgets, the Permanent Fund, additional revenue generation, and ways to better manage state spending. Over this period of time, Alaska has seen decline and growth, boom, bust, and change, with crises seemingly affecting the state every decade. Along the way, the scale of the challenge has only increased‐the state's dependence on volatile oil prices and decreasing production on the one hand, and the demand for public services and critical infrastructure development on the other, coupled, leave Alaska's future prosperity uncertain.
Between 2004 and 2014 the state's operating budget increased 105%.1 In 2013 Commonwealth North (CWN) released a study titled "Long Term Economic Sustainability for the State of Alaska" in which we noted that the "current level of spending is unsustainable and it's imperative that the state implement a long‐term fiscal plan, which will require spending restraints." Since 2014, events have made this recommendation much more important, as the state faces a dramatic drop in state revenue coupled with an unsustainable level of operating budget spending. In response, the general fund operating budget has decreased 7%.
Over the years, CWN studies have focused primarily on the revenue side of the state's ledger, working to find innovative solutions to generate increased revenue needed to provide essential services. We have learned along the way that it is not enough to just address revenue; instead, a thoughtful approach to rightsizing government is necessary. It's an uncomfortable
1 Based on general fund spending of $2.1 billion in FY 2004 to $4.4 billion in FY 2014 (inflation increased 30% and
population increased 11% during the ten years).
2
conversation for many, but critical if Alaska is to ensure choices and opportunity today and into the future.
We highlight "resolve" because the challenge is not as simple as manipulating spending scenarios on a spreadsheet. Resolve is necessary because state spending is directly tied to the people's interest. It is rare that legislators hear advocacy against spending on a program or project. Yet pro‐spending advocates are quite formidable. In the same manner, there few are calling for Alaskans to contribute to government revenue. Fingers point quickly elsewhere. Commonwealth North understands this challenge‐citizens are disconnected from the spending at the state level. Individual Alaskans don't have "skin in the game." If spending goes up, Alaskans don't pay more in taxes; if spending is reduced, citizens don't see the benefit. Compounding this challenge are general attitudes toward policymakers; legislators are highly regarded for the projects they fund in their districts and they also get the blame when services are diminished or eliminated. This results in a budget process Alaskans don't perceive as relevant to their lives and a system that rewards elected officials for decisions that increase spending.
It is difficult in this context to make hard decisions, or to even begin to reconcile clashing interests. Indeed, the effort to do so results in a new critical crossroad for Alaska. Meeting these challenges will require leaders who can negotiate and compromise when necessary, and sacrifice in the short term for long‐term prosperity. This crossroad will require difficult decision‐ making.
The initial Fiscal Policy Study Group began meeting in August 2014.2 At that time the State of Alaska had just begun a new fiscal year with a budget that required an average price of $105 per barrel of oil to fund it. Five months later the price of oil had plummeted and state revenue is estimated to be just half of what was expected when the Legislature adjourned in April 2014.
For the last two years, oil revenue has continued to decline. Finally, Alaska is teetering on what has been described as the state's "fiscal cliff." In earlier years, state revenue was plentiful due to the high oil prices in spite of declining oil production. The last decade has seen a drop in oil production from 932,000 barrels per day in 2005 to 547,000 barrels in 2014‐and to 490,300 projected for 2017. High oil prices masked the impact on the state treasury of declining oil production.
Commonwealth North recognizes that there are many approaches that can be used to address long‐term fiscal stability for the state as well as its citizens. Commonwealth North's Board of Directors believes that a crucial first step‐rightsizing state spending‐is a fundamental starting point for sustainable spending in the future, which will only be strengthened by stable and diverse revenue sources. We commend the Governor and Legislature for efforts to‐date‐but much more needs to be done.
2 Appendix A is a list of study group participants and speakers.
3
The Operating Budget:
Critical Crossroads, Choices, and Opportunities Update ‐ January 2017
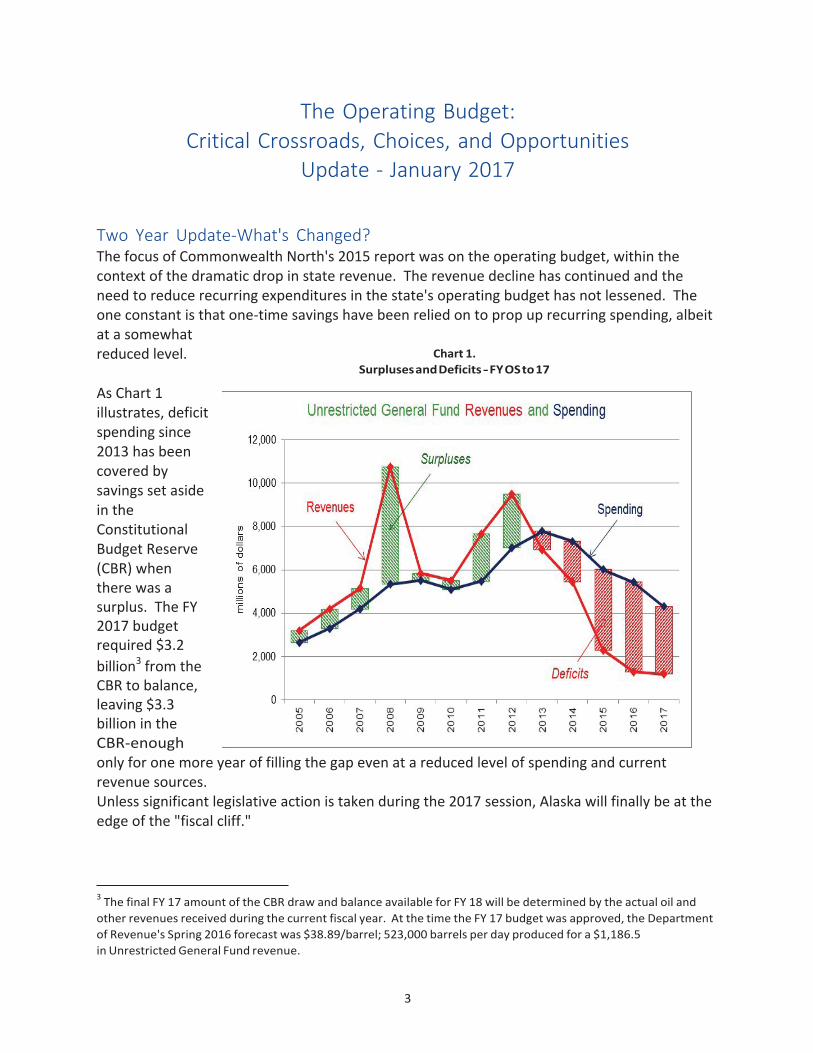
Two Year Update‐What's Changed? The focus of Commonwealth North's 2015 report was on the operating budget, within the context of the dramatic drop in state revenue. The revenue decline has continued and the need to reduce recurring expenditures in the state's operating budget has not lessened. The one constant is that one‐time savings have been relied on to prop up recurring spending, albeit at a somewhat reduced level. As Chart 1 illustrates, deficit spending since 2013 has been covered by savings set aside in the Constitutional Budget Reserve (CBR) when there was a surplus. The FY 2017 budget required $3.2
billion3 from the CBR to balance, leaving $3.3 billion in the CBR‐enough only for one more year of filling the gap even at a reduced level of spending and current revenue sources. Unless significant legislative action is taken during the 2017 session, Alaska will finally be at the edge of the "fiscal cliff."
3 The final FY 17 amount of the CBR draw and balance available for FY 18 will be determined by the actual oil and
other revenues received during the current fiscal year. At the time the FY 17 budget was approved, the Department
of Revenue's Spring 2016 forecast was $38.89/barrel; 523,000 barrels per day produced for a $1,186.5
in Unrestricted General Fund revenue.
Chart 1.
Surpluses and Deficits ‐ FY OS to 17
4
Has Spending Been Cut Since 2015? The short answer is yes.
The longer answer is that while the Legislature has reduced overall spending substantially, recurring obligations in the operating budget have not been reduced anywhere near a level that can be supported by existing recurring revenues.
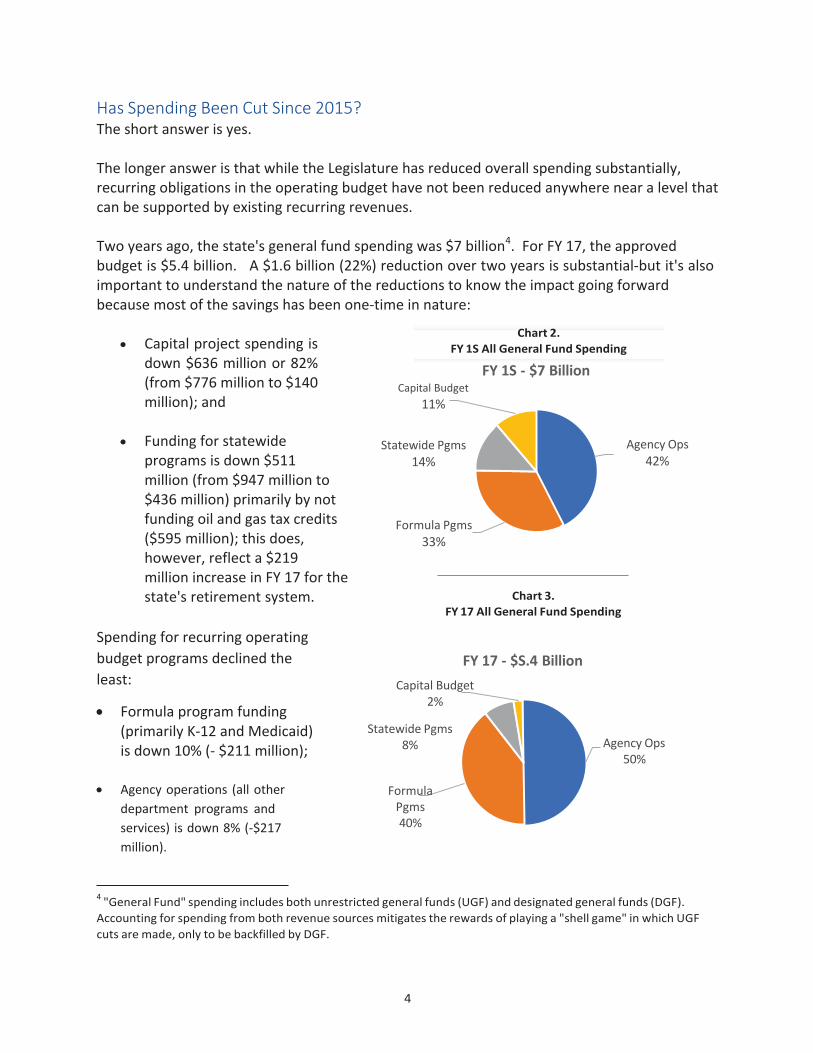
Two years ago, the state's general fund spending was $7 billion4. For FY 17, the approved budget is $5.4 billion. A $1.6 billion (22%) reduction over two years is substantial‐but it's also important to understand the nature of the reductions to know the impact going forward because most of the savings has been one‐time in nature:
Capital project spending is down $636 million or 82% (from $776 million to $140 million); and
Capital Budget
11%
Funding for statewide programs is down $511 million (from $947 million to $436 million) primarily by not funding oil and gas tax credits ($595 million); this does, however, reflect a $219 million increase in FY 17 for the state's retirement system.
Spending for recurring operating
budget programs declined the
least:
Formula program funding (primarily K‐12 and Medicaid) is down 10% (‐ $211 million);
Agency operations (all other
department programs and
services) is down 8% (‐$217
million).
Statewide Pgms
14%
Formula Pgms
33%
FY 17 ‐ $S.4 Billion
Capital Budget 2%
Statewide Pgms 8%
Formula Pgms 40%
Agency Ops
42%
Agency Ops
50%
4 "General Fund" spending includes both unrestricted general funds (UGF) and designated general funds (DGF).
Accounting for spending from both revenue sources mitigates the rewards of playing a "shell game" in which UGF
cuts are made, only to be backfilled by DGF.
Chart 2.
FY 1S All General Fund Spending
FY 1S ‐ $7 Billion
Chart 3.
FY 17 All General Fund Spending
5
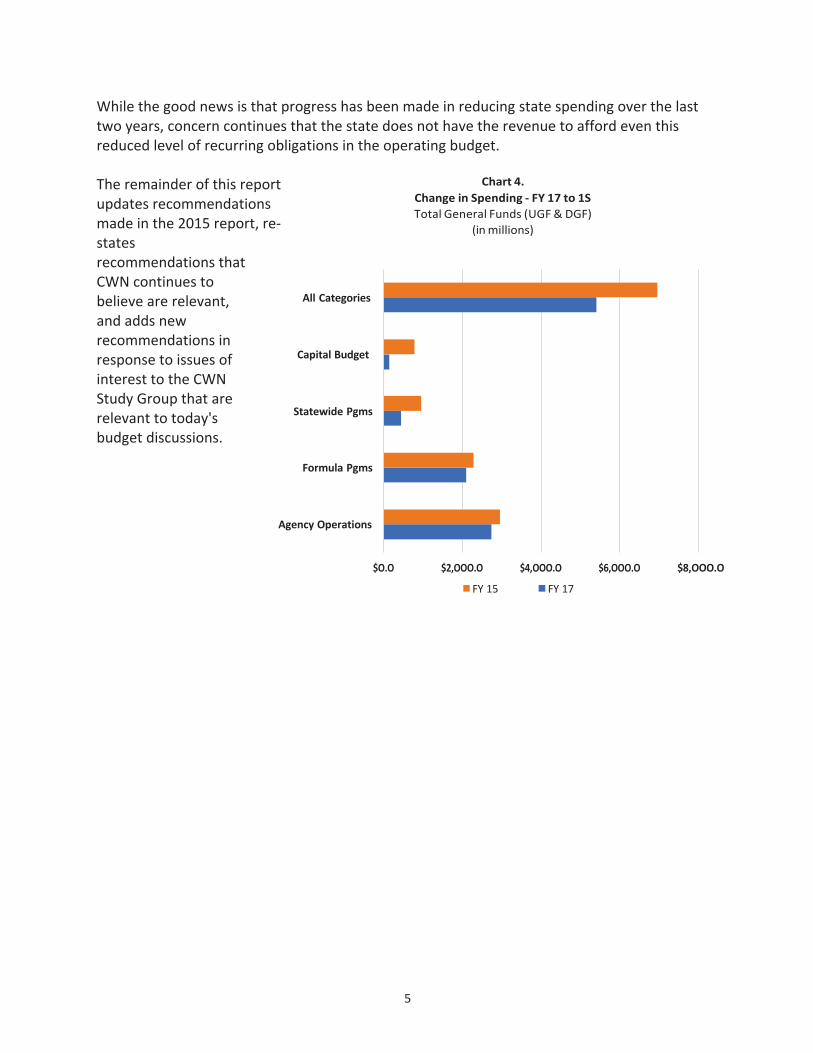
While the good news is that progress has been made in reducing state spending over the last two years, concern continues that the state does not have the revenue to afford even this reduced level of recurring obligations in the operating budget.
The remainder of this report updates recommendations made in the 2015 report, re‐ states recommendations that CWN continues to believe are relevant, and adds new recommendations in response to issues of interest to the CWN Study Group that are relevant to today's budget discussions.
All Categories
Capital Budget
Statewide Pgms
Formula Pgms
Agency Operations
$O.O $2,OOO.O $4,OOO.O $6,OOO.O $8,OOO.O
FY 15 FY 17
Chart 4.
Change in Spending ‐ FY 17 to 1S
Total General Funds (UGF & DGF)
(in millions)
6
Operating Budget: Major Cost Drivers
State Employee Salary and Health Care Costs 2O1S Recommendation:
Given the state's fiscal reality, the Administration and unions re‐open negotiations to identify savings in salary and other benefit costs.
Update: Most Contracts Have O% COLA The Administration has negotiated four collective bargaining agreements (CBA) with the unions representing more than 11,000 full‐time positions. In each case, unions agreed to a 0% cost‐of‐living adjustment for each year of their respective contract. Employees also are required to take 15 hours of furloughs each fiscal year for which they can use accrued leave, if available. Eligible employees will continue to receive a 3.25% "step" or
"merit" increase, which is set by state law.5 Update: New Contracts Require Employees Pay Toward Health Benefits
New CBAs require employees to contribute toward the cost of health insurance (although the contribution amount for some bargaining units still is minimal).
New Recommendation: Amend the Public Employee Relations Act to remove health care as a mandatory subject of bargaining.
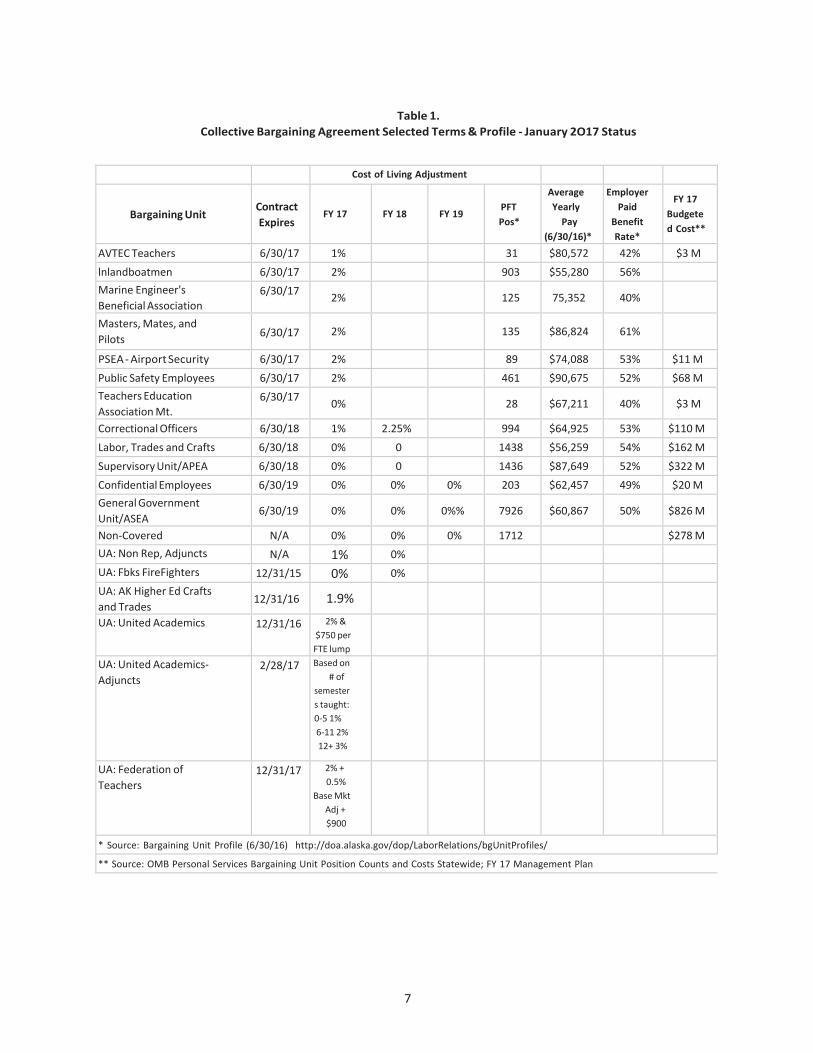
Discussion As outlined in Table 1, another 7 contracts expire on June 30, 2017 (representing 1,772 full time employees). The only "old" contract that expires in 2018 is the Correctional Officers (994 members) who will receive a 2.25% increase in FY 18.
5 Legislation was introduced (HB 379) in 2016 to suspend step increases until state revenue from oil
increased; the legislation was on the House Calendar but died when the Legislature failed to act prior to
adjournment.
7
Cost of Living Adjustment
Bargaining Unit
Contract
Expires
FY 17
FY 18
FY 19
PFT
Pos*
Average
Yearly
Pay
(6/30/16)*
Employer
Paid
Benefit
Rate*
FY 17
Budgete
d Cost**
AVTEC Teachers 6/30/17 1% 31 $80,572 42% $3 M
lnlandboatmen 6/30/17 2% 903 $55,280 56%
Marine Engineer's
Beneficial Association 6/30/17
2% 125 75,352 40%
Masters, Mates, and
Pilots
6/30/17 2%
135 $86,824 61%
PSEA ‐ Airport Security 6/30/17 2% 89 $74,088 53% $11 M
Public Safety Employees 6/30/17 2% 461 $90,675 52% $68 M
Teachers Education
Association Mt. 6/30/17
0% 28 $67,211 40% $3 M
Correctional Officers 6/30/18 1% 2.25% 994 $64,925 53% $110 M
Labor, Trades and Crafts 6/30/18 0% 0 1438 $56,259 54% $162 M
Supervisory Unit/APEA 6/30/18 0% 0 1436 $87,649 52% $322 M
Confidential Employees 6/30/19 0% 0% 0% 203 $62,457 49% $20 M
General Government
Unit/ASEA 6/30/19 0% 0% 0%% 7926 $60,867 50% $826 M
Non‐Covered N/A 0% 0% 0% 1712 $278 M
UA: Non Rep, Adjuncts N/A 1% 0% UA: Fbks FireFighters 12/31/15 0% 0% UA: AK Higher Ed Crafts
and Trades 12/31/16 1.9%
UA: United Academics 12/31/16 2% &
$750 per
FTE lump
UA: United Academics‐
Adjuncts 2/28/17 Based on
# of
semester
s taught:
0‐5 1%
6‐11 2%
12+ 3%
UA: Federation of
Teachers 12/31/17 2% +
0.5%
Base Mkt
Adj +
$900
* Source: Bargaining Unit Profile (6/30/16) http://doa.alaska.gov/dop/LaborRelations/bgUnitProfiles/
** Source: OMB Personal Services Bargaining Unit Position Counts and Costs Statewide; FY 17 Management Plan
Table 1.
Collective Bargaining Agreement Selected Terms & Profile ‐ January 2O17 Status
8
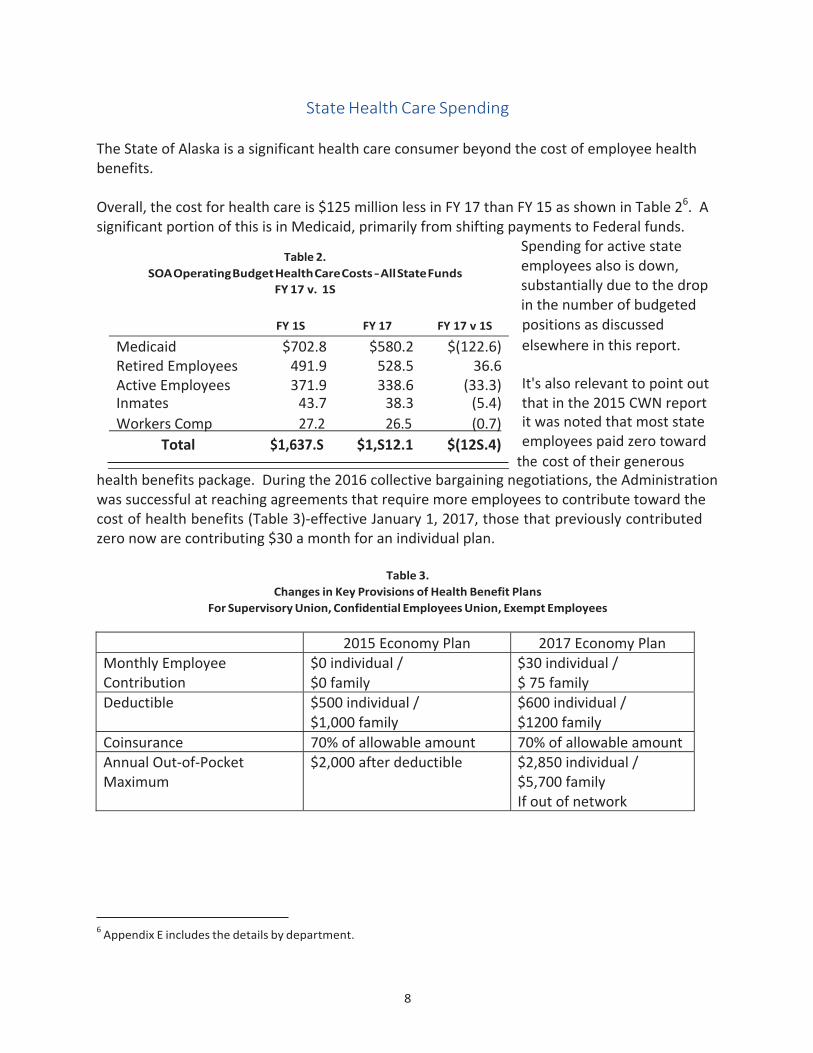
State Health Care Spending The State of Alaska is a significant health care consumer beyond the cost of employee health benefits.
Overall, the cost for health care is $125 million less in FY 17 than FY 15 as shown in Table 26. A significant portion of this is in Medicaid, primarily from shifting payments to Federal funds.
Spending for active state employees also is down, substantially due to the drop in the number of budgeted
FY 1S FY 17 FY 17 v 1S positions as discussed
Medicaid $702.8 $580.2 $(122.6) elsewhere in this report.
Retired Employees 491.9 528.5 36.6
Active Employees 371.9 338.6 (33.3) It's also relevant to point outInmates 43.7 38.3 (5.4) that in the 2015 CWN report
Workers Comp 27.2 26.5 (0.7)
Total $1,637.S $1,S12.1 $(12S.4)
it was noted that most state employees paid zero toward
the cost of their generous health benefits package. During the 2016 collective bargaining negotiations, the Administration was successful at reaching agreements that require more employees to contribute toward the cost of health benefits (Table 3)‐effective January 1, 2017, those that previously contributed zero now are contributing $30 a month for an individual plan.
Table 3.
Changes in Key Provisions of Health Benefit Plans
For Supervisory Union, Confidential Employees Union, Exempt Employees
2015 Economy Plan 2017 Economy PlanMonthly Employee Contribution
$0 individual / $0 family
$30 individual / $ 75 family
Deductible $500 individual / $1,000 family
$600 individual / $1200 family
Coinsurance 70% of allowable amount 70% of allowable amountAnnual Out‐of‐Pocket Maximum
$2,000 after deductible $2,850 individual / $5,700 family If out of network
6 Appendix E includes the details by department.
Table 2.
SOA Operating Budget Health Care Costs ‐ All State Funds
FY 17 v. 1S
9
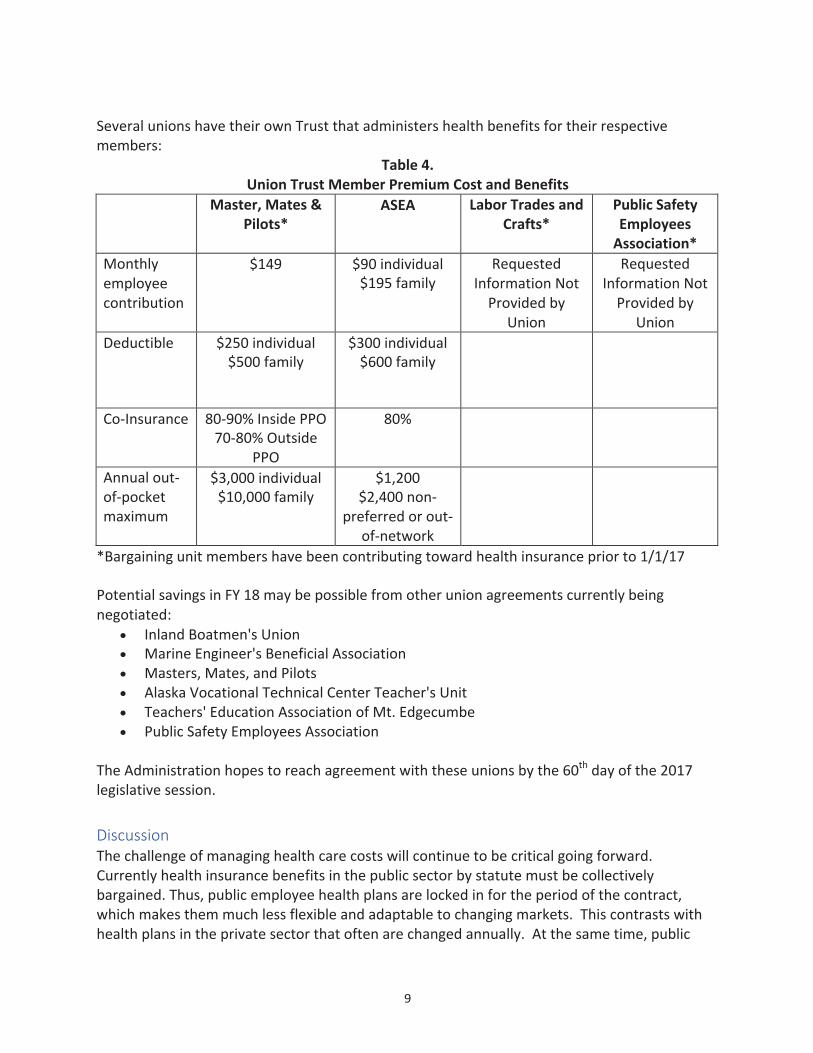
Several unions have their own Trust that administers health benefits for their respective members:
Table 4. Union Trust Member Premium Cost and Benefits
Master, Mates & Pilots*
ASEA Labor Trades and Crafts*
Public SafetyEmployees Association*
Monthly employee contribution
$149 $90 individual $195 family
Requested Information Not Provided by
Union
Requested Information Not Provided by
Union
Deductible $250 individual $500 family
$300 individual $600 family
Co‐Insurance 80‐90% Inside PPO 70‐80% Outside
PPO
80%
Annual out‐ of‐pocket maximum
$3,000 individual $10,000 family
$1,200 $2,400 non‐
preferred or out‐ of‐network
*Bargaining unit members have been contributing toward health insurance prior to 1/1/17
Potential savings in FY 18 may be possible from other union agreements currently being negotiated:
Inland Boatmen's Union Marine Engineer's Beneficial Association Masters, Mates, and Pilots Alaska Vocational Technical Center Teacher's Unit Teachers' Education Association of Mt. Edgecumbe Public Safety Employees Association
The Administration hopes to reach agreement with these unions by the 60th day of the 2017 legislative session.
Discussion The challenge of managing health care costs will continue to be critical going forward. Currently health insurance benefits in the public sector by statute must be collectively bargained. Thus, public employee health plans are locked in for the period of the contract, which makes them much less flexible and adaptable to changing markets. This contrasts with health plans in the private sector that often are changed annually. At the same time, public
10
employers often don't have the capacity, knowledge, or the will to aggressively bargain health care. As a result, public employee health plans are extremely rich compared to private sector plans, with very low premium shares and deductibles and the disparity between public and private sector benefits continues to grow.
The Kaiser Family Foundation, in its 2016 employee health benefits survey, found that for an average PPO plan, a family pays $5,569 out of pocket for premiums each year. Contrast this to the state economy plan for 2017, with $2000 for some bargaining units. The same study found that the average deductible for single coverage is $1,478 (compared to $500 in the state economy plan). Some teachers' plans are significantly richer than even the state employee plan.
This disparity causes distortions in the overall health care market, since public employees with low deductibles tend to be less aware of cost than employees in high‐deductible plans. The private sector is moving very quickly toward high deductible plans with employer‐funded health savings accounts. A total of 29% of all employees are now in high deductible plans, compared to only 4% a decade ago. A high deductible plan with an HSA turns employees into better consumers of health care.
To address the unprecedented cost of state employee health care, the state should have the opportunity and latitude to work with unions to explore these options beyond the customary boundaries of a collective bargaining process.
For these reasons, CWN recommends that the Public Employee Relations Act be amended so that the Administration can explore options to manage this ever‐increasing cost.
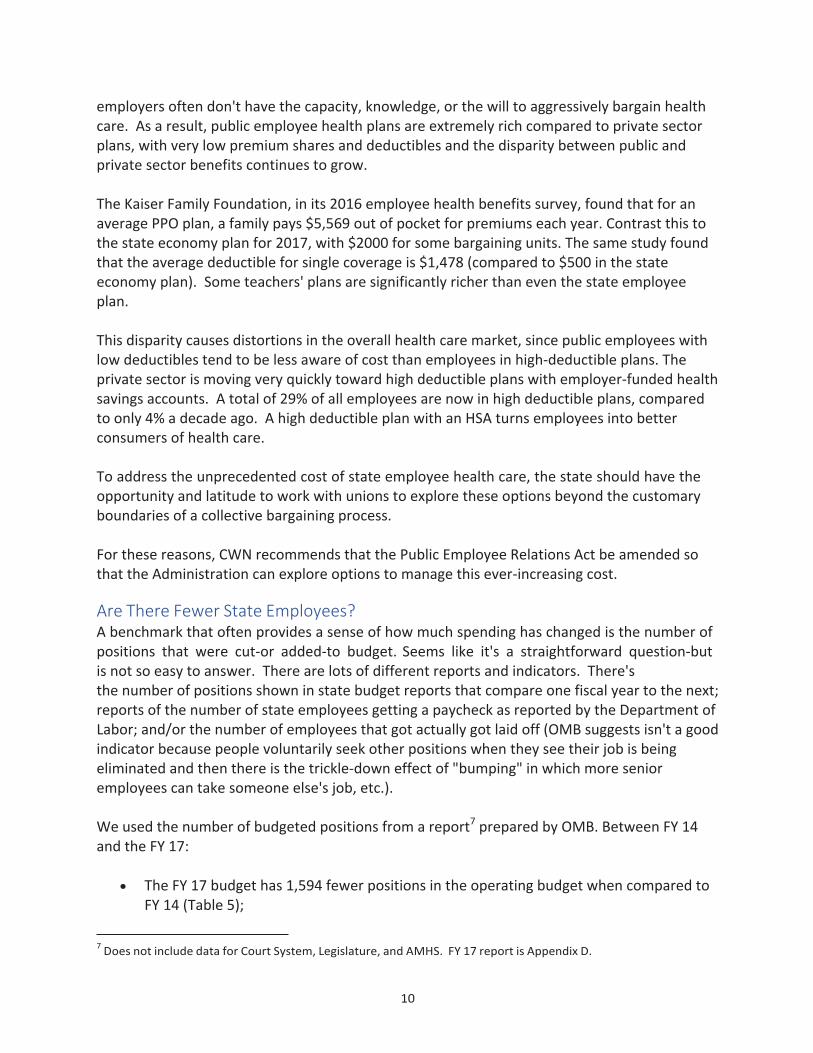
Are There Fewer State Employees? A benchmark that often provides a sense of how much spending has changed is the number of positions that were cut‐or added‐to budget. Seems like it's a straightforward question‐but is not so easy to answer. There are lots of different reports and indicators. There's the number of positions shown in state budget reports that compare one fiscal year to the next; reports of the number of state employees getting a paycheck as reported by the Department of Labor; and/or the number of employees that got actually got laid off (OMB suggests isn't a good indicator because people voluntarily seek other positions when they see their job is being eliminated and then there is the trickle‐down effect of "bumping" in which more senior employees can take someone else's job, etc.).
We used the number of budgeted positions from a report7 prepared by OMB. Between FY 14 and the FY 17:
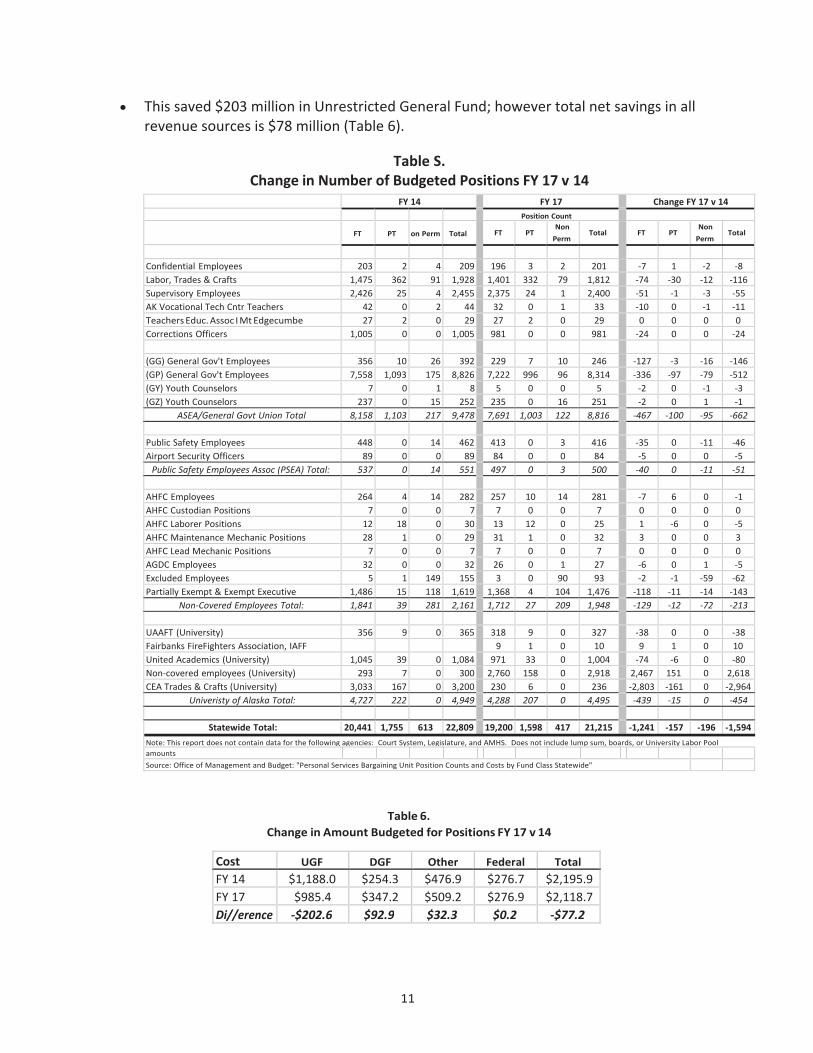
The FY 17 budget has 1,594 fewer positions in the operating budget when compared to FY 14 (Table 5);
7 Does not include data for Court System, Legislature, and AMHS. FY 17 report is Appendix D.
11
This saved $203 million in Unrestricted General Fund; however total net savings in all revenue sources is $78 million (Table 6).
FY 14 FY 17 Change FY 17 v 14
Position Count
FT
PT
on Perm
Total FT PT Non
Perm Total FT PT
Non
Perm Total
Confidential Employees 203 2 4 209 196 3 2 201 ‐7 1 ‐2 ‐8
Labor, Trades & Crafts 1,475 362 91 1,928 1,401 332 79 1,812 ‐74 ‐30 ‐12 ‐116
Supervisory Employees 2,426 25 4 2,455 2,375 24 1 2,400 ‐51 ‐1 ‐3 ‐55
AK Vocational Tech Cntr Teachers 42 0 2 44 32 0 1 33 ‐10 0 ‐1 ‐11
Teachers Educ. Assoc I Mt Edgecumbe 27 2 0 29 27 2 0 29 0 0 0 0
Corrections Officers 1,005 0 0 1,005 981 0 0 981 ‐24 0 0 ‐24
(GG) General Gov't Employees 356 10 26 392 229 7 10 246 ‐127 ‐3 ‐16 ‐146
(GP) General Gov't Employees 7,558 1,093 175 8,826 7,222 996 96 8,314 ‐336 ‐97 ‐79 ‐512
(GY) Youth Counselors 7 0 1 8 5 0 0 5 ‐2 0 ‐1 ‐3
(GZ) Youth Counselors 237 0 15 252 235 0 16 251 ‐2 0 1 ‐1
ASEA/General Govt Union Total 8,158 1,103 217 9,478 7,691 1,003 122 8,816 ‐467 ‐100 ‐95 ‐662
Public Safety Employees 448 0 14 462 413 0 3 416 ‐35 0 ‐11 ‐46
Airport Security Officers 89 0 0 89 84 0 0 84 ‐5 0 0 ‐5
Public Safety Employees Assoc (PSEA) Total: 537 0 14 551 497 0 3 500 ‐40 0 ‐11 ‐51
AHFC Employees 264 4 14 282 257 10 14 281 ‐7 6 0 ‐1
AHFC Custodian Positions 7 0 0 7 7 0 0 7 0 0 0 0
AHFC Laborer Positions 12 18 0 30 13 12 0 25 1 ‐6 0 ‐5
AHFC Maintenance Mechanic Positions 28 1 0 29 31 1 0 32 3 0 0 3
AHFC Lead Mechanic Positions 7 0 0 7 7 0 0 7 0 0 0 0
AGDC Employees 32 0 0 32 26 0 1 27 ‐6 0 1 ‐5
Excluded Employees 5 1 149 155 3 0 90 93 ‐2 ‐1 ‐59 ‐62
Partially Exempt & Exempt Executive 1,486 15 118 1,619 1,368 4 104 1,476 ‐118 ‐11 ‐14 ‐143
Non‐Covered Employees Total: 1,841 39 281 2,161 1,712 27 209 1,948 ‐129 ‐12 ‐72 ‐213
UAAFT (University) 356 9 0 365 318 9 0 327 ‐38 0 0 ‐38
Fairbanks FireFighters Association, IAFF 9 1 0 10 9 1 0 10
United Academics (University) 1,045 39 0 1,084 971 33 0 1,004 ‐74 ‐6 0 ‐80
Non‐covered employees (University) 293 7 0 300 2,760 158 0 2,918 2,467 151 0 2,618
CEA Trades & Crafts (University) 3,033 167 0 3,200 230 6 0 236 ‐2,803 ‐161 0 ‐2,964
Univeristy of Alaska Total: 4,727 222 0 4,949 4,288 207 0 4,495 ‐439 ‐15 0 ‐454
Statewide Total: 20,441 1,755 613 22,809 19,200 1,598 417 21,215 ‐1,241 ‐157 ‐196 ‐1,594
Note: This report does not contain data for the following agencies: Court System, Legislature, and AMHS. Does not include lump sum, boards, or University Labor Pool
amounts
Source: Office of Management and Budget: "Personal Services Bargaining Unit Position Counts and Costs by Fund Class Statewide"
Cost UGF DGF Other Federal Total
FY 14 $1,188.0 $254.3 $476.9 $276.7 $2,195.9
FY 17 $985.4 $347.2 $509.2 $276.9 $2,118.7
Di//erence ‐$202.6 $92.9 $32.3 $0.2 ‐$77.2
Table 6.
Change in Amount Budgeted for Positions FY 17 v 14
Table S. Change in Number of Budgeted Positions FY 17 v 14
12
Cost of Health Care in Alaska New Recommendations:
Review the findings of the state's health care authority feasibility study8 to be released in January 2017. Based on its findings, evaluate the impact of removing barriers to formation of larger consolidated health coverage plans with a pool of members that could include public employees and retirees, individuals, and small business groups, and potentially Medicaid enrollees; two or three plan choices for this pool could be identified by possibly using the Medicaid benefit package as a base and varying levels of co‐pays and deductibles.
Work with diverse stakeholders, including payers and health care providers, to modify
the 80th percentile rule9 and increase consumer protections related to balance billing.10
Leverage "value‐based"11 payment reforms currently underway in Medicare that places physicians on a fee schedule for Medicare patients; provide bonus payments to providers who implement value‐based payment reforms for Medicaid as well as public and private employer coverage.
Identify Alaska Medicaid and Medicare top primary care and behavioral health providers that see the most Medicaid and Medicare enrolled patients and negotiate with those providers to pay per‐member‐per‐month payments for primary care case management for enrollees that would benefit from that level of care management; may require a subsidy for the cost for these providers to connect to Alaska's Health Information Exchange.
Review the reform initiatives proposed in the "Recommended Medicaid Expansion and Reform Strategies for Alaska"12 and consider implementation for Alaskans, including and
8 The Medicaid reform package legislation required the Department of Administration to determine the feasibility
of creating a health care authority that could coordinate health care plans and consolidate purchasing
effectiveness for all state employees, retired state employees, retired teachers, medical assistance recipients,
University of Alaska, state corporations, and school district employees. The state contracted with PRM Consulting
Group to prepare the report, which is to be completed by June 30, 2017.Information about the HCA feasibility
study is available at: https://alaskahcastudy.com/ 9 The 80
th percentile rule is in regulation; it requires insurance companies to pay 80 percent of the reasonable
market rate (or UCR for "usual, customary, and reasonable" rate for a health care service. But in Alaska, that
market is small and there may be only specialties that have only one or two provider groups. The result is that the
80th percentile rule essentially allows specialists to name a price that insurers are then required to pay. The
Alaska Division of Insurance currently is reviewing the regulation. 10 "Balance billing" is when a healthcare provider bills a patient for the difference between what the patient's
health insurance chooses to reimburse and what the provider chooses to charge. 11
"Value‐based" reform is a strategy to promote quality and value of health care services by focusing on outcomes instead of fees-for-service that are purely volume-based. The goal is to slow the increase in the total cost of care by changing the current incentives of “overproduction” of health care services. 12 DHSS, January 22, 2016 (See Appendix F for summary of reforms)
13
beyond those covered by Medicaid, such as those with marketplace‐plans, large and small employers, and the individual market.
Enact a statewide smoke‐free workplace law to protect all Alaskans13 from secondhand smoke in the workplace and that implements proven approaches to reducing tobacco use among all Alaskans; include marijuana smoke and e‐cigarette vapor. A statewide law is necessary because many Alaska communities are in boroughs that lack health powers, or are located outside of a borough or municipality, so don't have the ability to make these changes.
Discussion Initially CWN's discussions focused on the skyrocketing cost of health insurance.
This "state of affairs" was highlighted during one of the 2016 legislative special sessions when the Legislature approved the Governor's "Reinsurance" program (House Bill 374) that appropriated $55 million14 to help pay for insurance provided on the Federal Exchange for 45015
Alaskans with a chronic illness for two years. The Alaska Division of Insurance reports that this action reduced a projected 40% increase in premiums for Alaskans covered by the individual market to a 7% increase. The Division is now pursuing a Federal 1332 waiver to secure Federal funds for the reinsurance program, but some reform watchers suggest it may be difficult to get the waiver approved.
While this step helped a very small number of Alaskans, it highlighted an even larger concern‐ the cost of health care in Alaska. The United States has the highest health care costs in the world; and Alaska has the highest in the United States.
What else can be done in response‐other than continuing to pay higher and higher insurance rates? That's the question that Commonwealth North members pondered and offer the following thoughts and observations for further discussion:
13 The 2015 update of "Alaska's Tobacco Facts" reports that among non‐Native adults age 25 to 64, those of low
socio‐economic status are nearly three times as likely as those of higher socio‐economic status to be smokers (38%
versus 14%); and, among those who work primarily indoors, men, younger adults age 18 to 29 and non‐Native
adults of low socio‐economic status are significantly less likely to be protected from secondhand smoke by a clean
indoor air policy. Individuals with low socioeconomic status are also more likely to be covered by Alaska's Medicaid
program. 14 This funding comes from a 2.7% tax paid by Alaskans on every insurance policy. These tax proceeds previously
went into the state's General Fund; now this revenue is being diverted to the "Alaska Comprehensive Health
Insurance Fund" established by this legislation (a designated funding source). 15 Based on the State's 1332 Waiver Application, the number of estimated insureds is 1,248 in FY 17 and 1,641 in
FY 18 because in promulgating regulations to implement the legislation, the State expanded the number of
conditions that will be covered by the Reinsurance Program.
14
Lack of consolidation among health care payers limits leverage to drive prices down and limits ability to push for reforms in health care delivery that would manage care to improve health and contain costs.
Current high cost, small, and fragmented health coverage populations increase the level of risk for managed care entities, making Alaska an unattractive market for provider‐led or other managed care operators to share risk and participate in managing care to bring down costs and improve health.
With a limited number of health care providers in most markets and specialties, the 80th
percentile rule and limits on insurance company contracting requirements, increase leverage for providers and limit payers' ability to reduce costs.
Efforts to combine health insurance pools have had only very limited success in gaining leverage over health care costs, frequently by bypassing local providers to seek care outside and have been unable to drive needed reforms to local health care delivery.
Low income Alaskans continue to experience health disparities including increased use of tobacco, increased obesity rates, and other factors that increase the risk for chronic disease. In 2015, 40% of low income Alaskans smoked cigarettes, compared to 15% of middle to high income Alaskans.
Fast growing senior population increases the need for primary care and other health care providers accepting Medicare. With current disparity between prices paid by private insurers compared to Medicare, many providers limit the number of Medicare patients they will accept. Limited primary care for seniors leads to worsening health conditions that may require more expensive care later.
Individual Market and High‐risk Pool: Alaska's individual health insurance market will have only one carrier, Premera Blue Cross Blue Shield of Alaska, in 2017 following the exit of Moda from that market. Premera received approval for an average rate increase of 7.3 percent. Approximately 20,000 Alaskans are covered through the individual market. As described previously, this modest rate increase was achieved only after a $55 million payment by the State of Alaska to the Reinsurance program, which avoided an increase in premiums close to 40%. The study group's projected cost going forward is estimated at $27 million in FY 2018 to $33 million in FY 2021.
For private sector employers, particularly small business, and public sector employers, the high cost of health care in Alaska drives cost increases for employee and retiree coverage, raising costs for public and private employers, as well as consumers.
15
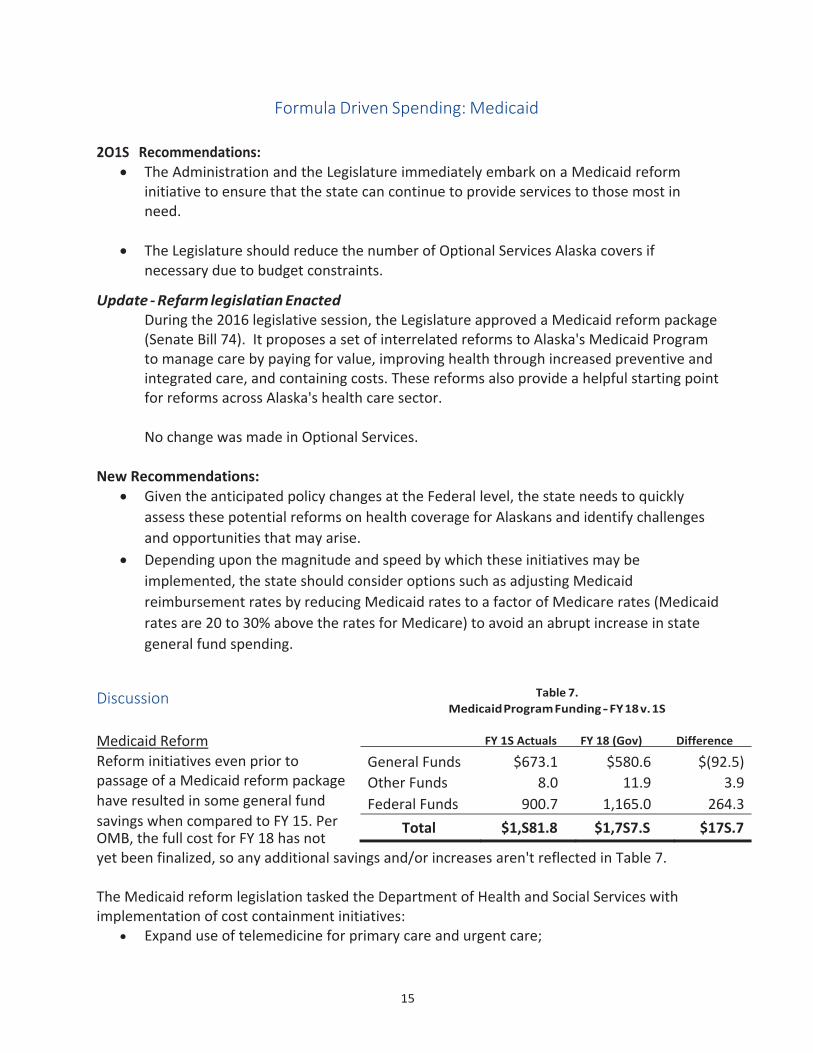
Formula Driven Spending: Medicaid 2O1S Recommendations:
The Administration and the Legislature immediately embark on a Medicaid reform initiative to ensure that the state can continue to provide services to those most in need.
The Legislature should reduce the number of Optional Services Alaska covers if necessary due to budget constraints.
Update ‐ Refarm legislatian Enacted During the 2016 legislative session, the Legislature approved a Medicaid reform package (Senate Bill 74). It proposes a set of interrelated reforms to Alaska's Medicaid Program to manage care by paying for value, improving health through increased preventive and integrated care, and containing costs. These reforms also provide a helpful starting point for reforms across Alaska's health care sector.
No change was made in Optional Services.
New Recommendations: Given the anticipated policy changes at the Federal level, the state needs to quickly
assess these potential reforms on health coverage for Alaskans and identify challenges
and opportunities that may arise.
Depending upon the magnitude and speed by which these initiatives may be
implemented, the state should consider options such as adjusting Medicaid
reimbursement rates by reducing Medicaid rates to a factor of Medicare rates (Medicaid
rates are 20 to 30% above the rates for Medicare) to avoid an abrupt increase in state
general fund spending.
Discussion
Medicaid Reform FY 1S Actuals FY 18 (Gov) Difference
OMB, the full cost for FY 18 has not yet been finalized, so any additional savings and/or increases aren't reflected in Table 7.
The Medicaid reform legislation tasked the Department of Health and Social Services with implementation of cost containment initiatives:
Expand use of telemedicine for primary care and urgent care;
Table 7.
Medicaid Program Funding ‐ FY 18 v. 1S
Reform initiatives even prior to General Funds $673.1 $580.6 $(92.5)passage of a Medicaid reform package Other Funds 8.0 11.9 3.9have resulted in some general fund Federal Funds 900.7 1,165.0 264.3savings when compared to FY 15. Per Total $1,S81.8 $1,7S7.S $17S.7
16
Enhance fraud prevention, enforcement, and recovery; Undertake additional pharmacy initiatives; Reduce cost of home and community‐based services through a new waiver program; Initiate managed care or case management demonstration projects; Streamline payment system and examine payment redesign (Alaska pay one of the
highest rates in the country); Explore privatization of the Alaska Psychiatric Institute, Alaska Pioneer Homes, and
select Juvenile Justice facilities through feasibility studies.
Savings from the legislation in FY 17 was estimated at $27 million in state General Funds and a $24 million increase in Federal funds. The fiscal note that accompanied the legislation projected a cumulative General Fund savings through FY 22 of $278 million and a $175 million increase in Federal Funds.
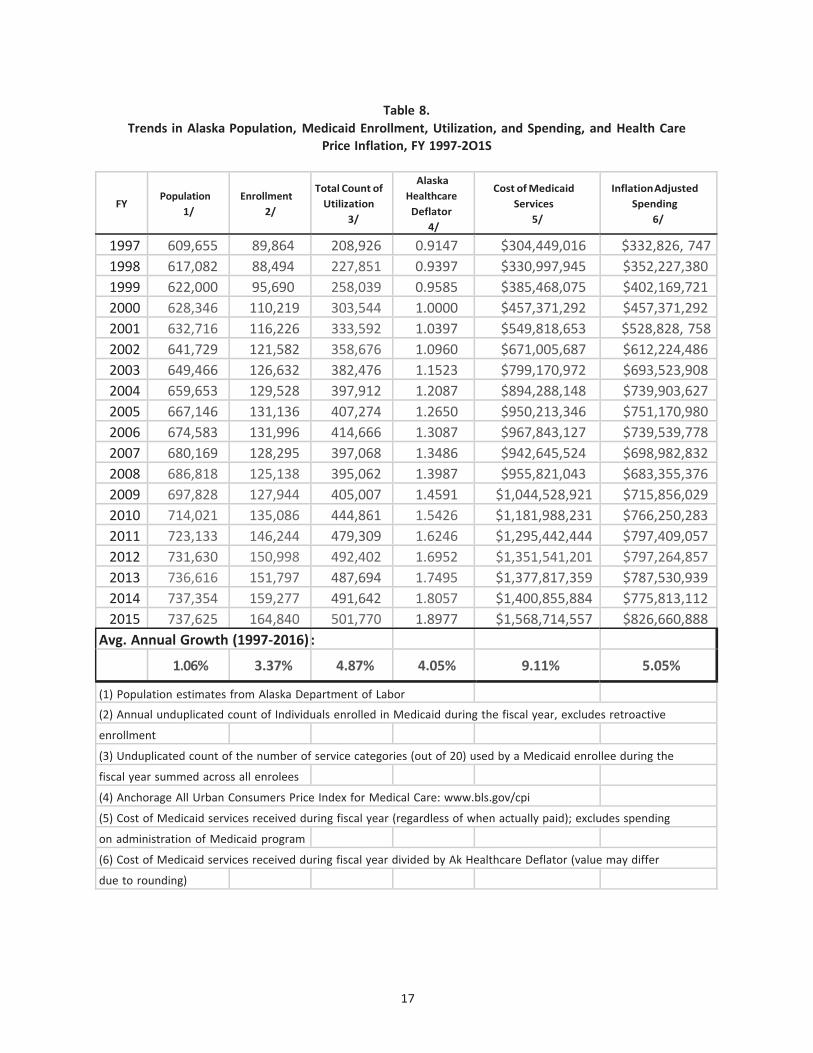
As a cautionary note, it might be helpful to lawmakers to note the historical trend in Medicaid cost growth and cost drivers as outlined in Table 8. To date much of the savings appears to have been based on cost shifting to the Federal governments. The potential policy shifts at the Federal level may make a very different forecast for state funding if the past is a predictor for the future.
17
FY
Population
1/
Enrollment
2/
Total Count of
Utilization
3/
Alaska
Healthcare
Deflator
4/
Cost of Medicaid
Services
5/
Inflation Adjusted
Spending
6/
1997 609,655 89,864 208,926 0.9147 $304,449,016 $332,826, 747
1998 617,082 88,494 227,851 0.9397 $330,997,945 $352,227,380
1999 622,000 95,690 258,039 0.9585 $385,468,075 $402,169,721
2000 628,346 110,219 303,544 1.0000 $457,371,292 $457,371,292
2001 632,716 116,226 333,592 1.0397 $549,818,653 $528,828, 758
2002 641,729 121,582 358,676 1.0960 $671,005,687 $612,224,486
2003 649,466 126,632 382,476 1.1523 $799,170,972 $693,523,908
2004 659,653 129,528 397,912 1.2087 $894,288,148 $739,903,627
2005 667,146 131,136 407,274 1.2650 $950,213,346 $751,170,980
2006 674,583 131,996 414,666 1.3087 $967,843,127 $739,539,778
2007 680,169 128,295 397,068 1.3486 $942,645,524 $698,982,832
2008 686,818 125,138 395,062 1.3987 $955,821,043 $683,355,376
2009 697,828 127,944 405,007 1.4591 $1,044,528,921 $715,856,029
2010 714,021 135,086 444,861 1.5426 $1,181,988,231 $766,250,283
2011 723,133 146,244 479,309 1.6246 $1,295,442,444 $797,409,057
2012 731,630 150,998 492,402 1.6952 $1,351,541,201 $797,264,857
2013 736,616 151,797 487,694 1.7495 $1,377,817,359 $787,530,939
2014 737,354 159,277 491,642 1.8057 $1,400,855,884 $775,813,112
2015 737,625 164,840 501,770 1.8977 $1,568,714,557 $826,660,888
Avg. Annual Growth (1997‐2016) :
1.06% 3.37% 4.87% 4.05% 9.11% 5.05%
(1) Population estimates from Alaska Department of Labor
(2) Annual unduplicated count of Individuals enrolled in Medicaid during the fiscal year, excludes retroactive
enrollment
(3) Unduplicated count of the number of service categories (out of 20) used by a Medicaid enrollee during the
fiscal year summed across all enrolees
(4) Anchorage All Urban Consumers Price Index for Medical Care: www.bls.gov/cpi
(5) Cost of Medicaid services received during fiscal year (regardless of when actually paid); excludes spending
on administration of Medicaid program
(6) Cost of Medicaid services received during fiscal year divided by Ak Healthcare Deflator (value may differ
due to rounding)
Table 8.
Trends in Alaska Population, Medicaid Enrollment, Utilization, and Spending, and Health Care
Price Inflation, FY 1997‐2O1S
18
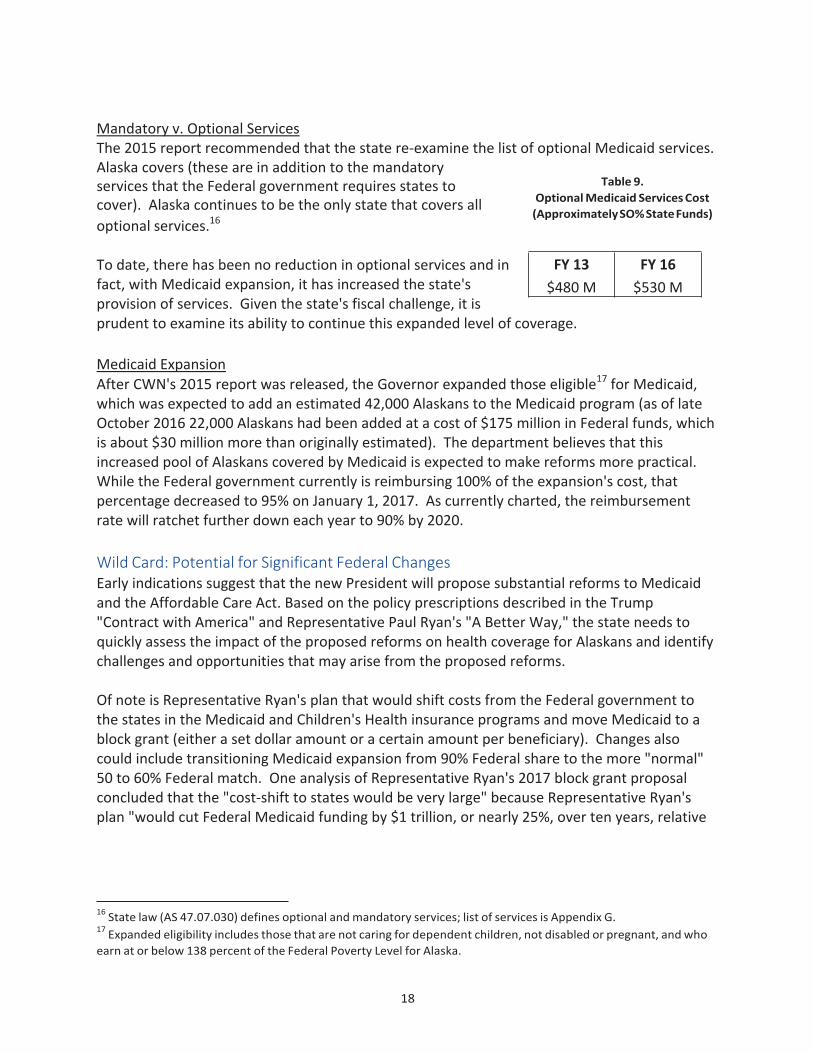
Mandatory v. Optional Services The 2015 report recommended that the state re‐examine the list of optional Medicaid services. Alaska covers (these are in addition to the mandatory services that the Federal government requires states to cover). Alaska continues to be the only state that covers all
optional services.16 To date, there has been no reduction in optional services and in fact, with Medicaid expansion, it has increased the state's provision of services. Given the state's fiscal challenge, it is prudent to examine its ability to continue this expanded level of coverage.
Medicaid Expansion After CWN's 2015 report was released, the Governor expanded those eligible17 for Medicaid, which was expected to add an estimated 42,000 Alaskans to the Medicaid program (as of late October 2016 22,000 Alaskans had been added at a cost of $175 million in Federal funds, which is about $30 million more than originally estimated). The department believes that this increased pool of Alaskans covered by Medicaid is expected to make reforms more practical. While the Federal government currently is reimbursing 100% of the expansion's cost, that percentage decreased to 95% on January 1, 2017. As currently charted, the reimbursement rate will ratchet further down each year to 90% by 2020.
Wild Card: Potential for Significant Federal Changes Early indications suggest that the new President will propose substantial reforms to Medicaid and the Affordable Care Act. Based on the policy prescriptions described in the Trump "Contract with America" and Representative Paul Ryan's "A Better Way," the state needs to quickly assess the impact of the proposed reforms on health coverage for Alaskans and identify challenges and opportunities that may arise from the proposed reforms.
Of note is Representative Ryan's plan that would shift costs from the Federal government to the states in the Medicaid and Children's Health insurance programs and move Medicaid to a block grant (either a set dollar amount or a certain amount per beneficiary). Changes also could include transitioning Medicaid expansion from 90% Federal share to the more "normal" 50 to 60% Federal match. One analysis of Representative Ryan's 2017 block grant proposal concluded that the "cost‐shift to states would be very large" because Representative Ryan's plan "would cut Federal Medicaid funding by $1 trillion, or nearly 25%, over ten years, relative
16 State law (AS 47.07.030) defines optional and mandatory services; list of services is Appendix G.
17 Expanded eligibility includes those that are not caring for dependent children, not disabled or pregnant, and who
earn at or below 138 percent of the Federal Poverty Level for Alaska.
FY 13
$480 M
FY 16
$530 M
Table 9.
Optional Medicaid Services Cost
(Approximately SO% State Funds)
19
to current law, on top of the cuts the plan would secure from repealing the ACA's Medicaid expansion."18 The combination of the cost shifting and conversion to a block grant could create considerable cost challenges for the state, which could create incentives to accelerate value‐based purchasing. Depending upon the magnitude and speed by which these initiatives may be implemented, the state should consider options such as adjusting Medicaid reimbursement rates by reducing Medicaid rates to a factor of Medicare rates (Medicaid rates are 20 to 30% above the rates for Medicare) to avoid an abrupt increase in state general fund spending.
18 Analysis by Center on Budget and Policy Priorities (CBPP), November 30, 2016,
http://www.cbpp.org/research/health/ CWN note: current CBO projections indicate Medicaid + CHIP will grow by
5.8% per year over the next ten years under baseline projections referenced by CBPP. The Ryan/Price block grant
proposal is expected to hold annual cost growth to 1.6% (CBPP) to 2.9% (Committee for a Responsible Budget)
over the next ten years [based on analysis of CBO, CBPP and CRFB cost estimates].
20
Formula Driven Spending: K‐12 Funding New Recommendations:
Education funding needs to refocus on direct instruction that yields measurable improvements in student achievement. State K‐12 funding should be reduced by 1 to 3 percent per year for four years, during which funding would have to be reallocated from administrative/operations to maintain funding for direct instruction.
Prior to making investments in UA, teacher training programs, both in and outside Alaska, should be evaluated to identify those that have produced high quality teachers that have generated high student achievement results.
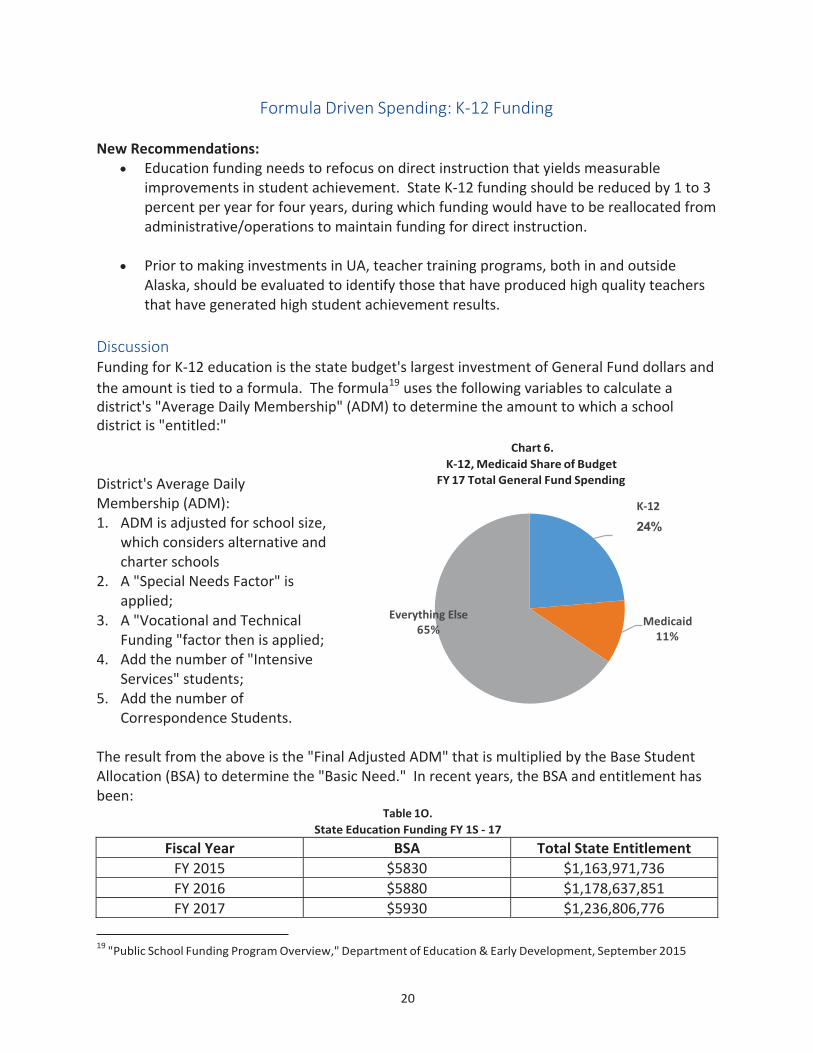
Discussion Funding for K‐12 education is the state budget's largest investment of General Fund dollars and
the amount is tied to a formula. The formula19 uses the following variables to calculate a district's "Average Daily Membership" (ADM) to determine the amount to which a school district is "entitled:" District's Average Daily Membership (ADM): 1. ADM is adjusted for school size,
which considers alternative and charter schools
2. A "Special Needs Factor" is applied;
3. A "Vocational and Technical Funding "factor then is applied;
4. Add the number of "Intensive Services" students;
5. Add the number of Correspondence Students.
Chart 6.
K‐12, Medicaid Share of Budget
FY 17 Total General Fund Spending
Everything Else
65%
K‐12
24%
Medicaid 11%
The result from the above is the "Final Adjusted ADM" that is multiplied by the Base Student Allocation (BSA) to determine the "Basic Need." In recent years, the BSA and entitlement has been:
Table 1O.
State Education Funding FY 1S ‐ 17
Fiscal Year BSA Total State Entitlement
FY 2015 $5830 $1,163,971,736
FY 2016 $5880 $1,178,637,851
FY 2017 $5930 $1,236,806,776
19 "Public School Funding Program Overview," Department of Education & Early Development, September 2015
21
Even after spending $3.6 billion (not including local funds) the last three years: Alaska continues to be among the bottom states in K‐12 achievement, including
National Assessment of Educational Progress (NAEP) test scores and advanced
placement (AP) scores of three or above per 100 students;20
Alaska remains below average among states for high school graduation rates;21
Alaska continues to be one of the top two states for spending on K‐12 education‐even after adjusting for regional differences in the cost of living;22
Despite having dramatically increased per pupil spending on K‐12 education over the
past dozen years compared to other states, Alaska student achievement on national normed tests, after adjusting for social and economic status relative to prior periods and compared to other states, remains flat to declining;23
The July 2015 "Review of Alaska's School Funding Program" by Augenblick, Palaich &
Associates for the Alaska State Legislature concluded that, among other things:
○ Overall spending on public education was not correlated with student performance
(page xi);
○ Spending on direct instruction (teachers in the classroom) was correlated with
student performance (even after controlling for demographics and teacher
characteristics) (page xi);
Taken together, this suggests that spending on functions other than direct instruction tends to diminish student performance.24 For these reasons, CWN recommends:
Education funding (both state and local) needs to refocus on direct instruction that works and stop spending on non‐essential administration, operations, and support that does not yield measurable improvements in student achievement.
The Governor/Legislature should reconstitute the public school education funding formula to focus investments in effective direct instruction and reduce investments in administration and support functions that have not yielded measurable improvements
in student achievement.
20 Education Week, Quality Counts Annual Report, K‐12 Achievement, 2016
21 (Education Week, Quality Counts Annual Report, K‐12 Achievement, 2016).
22 Education Week, Quality Counts Annual Report, School Finance, 2016.
23 (Education Week, Quality Counts Annual Reports, School Finance & K‐12 Achievement, 2002, 2016).
24 Based on the conclusion that positive correlation on direct instruction + negative correlation on other than direct
instruction = no correlation for overall spending
22
The state should require all districts to benchmark spending and performance of their administrative, operations, and support functions and provide districts with a strong incentive to reduce expenditures in these areas so that investment in direct instruction can be sustained. An approach would be to reduce state K‐12 funding by 1 to 3 percent per year for four years. During this time, benchmarks for administrative type operations would be expected to decrease in order to reallocate dollars to maintain funding for direct instruction. This pressure would provide an incentive to explore/implement consolidation of support functions, including facilities, student nutrition, and pupil transportation with local municipalities and boroughs as well as outsourcing and/or managed competition to reduce administration and support, thereby refocusing district investment in direct instruction. This also would provide an incentive to explore increased use of technology to deliver classroom instruction.
High quality direct instruction is well correlated with student performance25. Prior to making investments in UA teacher training under its "let's grow our own" initiative, it is recommended that the Board of Regents, the Governor, and Legislature evaluate teacher training programs, both in Alaska and outside Alaska, that have produced high quality teachers that have generated sustained above‐average student achievement results for Alaska students to ensure that limited financial, managerial, and recruitment resources are directed toward teacher training that is likely to yield positive results for Alaska's students.
25 Hanushek, Eric., "Valuing Teachers: How Much is a Good Teacher Worth?" Summer 2011
23
State Transportation and Infrastructure New Recommendations:
Increase coordination of state road maintenance and snowplowing functions with local governments, where it can result in improved performance and efficiency.
Develop and publish performance metrics for the Department of Transportation and Public Facilities' activities and results so its performance can be compared to that of other states as well as provide transparent accountability to Alaskans.
Increase the state motor fuel tax from 8 cents to 16 cents per gallon so an estimated
$30 million in additional revenue can be available for maintenance and operation of transportation infrastructure.
Explore divestiture (privatize or restructure) of the Alaska International Airport System (AIAS) (Ted Stevens and Fairbanks Airports) to determine the benefits that might come from of a nimbler structure.
Reform and revitalize the Alaska Marine Highway System by converting it from long haul routes to short‐range ferry routes in combination with road segments.
Discussion Administrative Efficiencies and Accountability The state should increase coordination of state road maintenance and snowplowing functions with local governments where it can result in improved performance and efficiency. In some communities, local and state roads are maintained by two or more levels of government. CWN recommends these crews be managed as one service group, which should result in lower overhead costs and other economies of scale (e.g. combined purchasing power for vehicles and materials).
The state and local communities should also consider alternate approaches such as "managed competition" in which the private and public sectors bid on the delivery of services.
The department should develop and publish performance metrics for DOT activities (i.e. "One DOT" initiative) so its performance can be compared to that of other states as well as provide transparent accountability to Alaskans. CWN's understanding is that DOT/PF currently has performance measures that track the cost of providing services and outcomes (e.g. road quality), but the measures and metrics are not released to the public‐and should be.
Increase Motor Fuel Tax The state tax should be increased from 8 cents to 16 cents per gallon so an estimated $30 million in additional revenue can be available to pay for maintenance and operation of the transportation infrastructure.
24
While some propose motor fuel tax revenue be earmarked in a designated fund (such as the Governor's proposed bill for the 2017 session), CWN recommends against such automatic earmarking and instead, the revenue should be deposited in the general fund. This revenue then is available for appropriation for road maintenance and operations and ultimately the Legislature and Governor are held accountable for how these funds are used each year.
Evaluate Restructure of Alaska International Airport System The state should explore divestiture (privatize or restructure) of the Alaska International Airport System (AIAS) (Ted Stevens and Fairbanks Airports) to determine the benefits that might come from of a nimbler structure.
The state operates 249 airports to move people and goods between communities. While many local communities don't have the resources to fully operate local airports, the AIAS is a self‐ sustaining enterprise. Privatizing or restructuring the two airports could transfer the state's obligations to a more nimble and separate entity (like the Alaska Railroad Corporation structure) and results in creating additional private sector jobs.
Alaska Marine Highway System (AMHS) Conversion CWN supports the current work between DOT and the Southeast Conference to develop a plan to reform and revitalize AMHS by converting it from long‐haul to short‐range ferry routes in combination with road segments. When fully implemented, this would enable AMHS to operate at a lower oval cost and standardize the fleet (from five different vessel designs to one or two designs that will result in associated savings and improved fleet efficiencies). Important to this implementation will be the transfer of easements through Federal land to allow construction of a marine access point at various locations. Alaska was given 250 such easements. To date, it has received two.
25
Permanent Fund and Use of Earnings Recommendations:
Support a percent of market payout formula.
Use Permanent Fund earnings to help structurally address the state's revenue shortfall, while maintaining a dividend program.
Reducing the annual dividend is a fiscal necessity for the state‐Alaska needs to start using some level of Permanent Fund earnings to help meet the need for public services.
Continue to pay the Permanent Fund dividend from the fund's realized earnings.
The Permanent Fund's earnings reserve account should be invested in cash equivalents apart from the rest of the Fund.
Permanent Fund Corporation should open an Anchorage and out‐of‐state offices in financial centers.
Strengthen and enlarge the Board of Trustees. More competitive compensation of board and staff members to attract and retain highly
skilled individuals.
Discussion While the 2015 CWN budget report did not discuss use of Permanent Fund earnings, certainly
prior CWN reports26 have. To update its information, the study group met with the Permanent Fund's executive director and convened an informal "Permanent Fund Review Group" composed of five former Fund trustees (Steve Frank, Steve Rieger, Bruce Botelho, John Shively, and Eric Wohlforth). The result of this work, as well as previous CWN study groups, as follows: Use of Permanent Fund Earnings
• CWN supports use of Permanent Fund earnings to help structurally address the state's revenue shortfall, while maintaining a dividend program, to advance long‐term fiscal
stability needed to secure the state's economy.27
• Alaska should continue to pay the Permanent Fund dividend from the fund's realized earnings as it has in the past.
The link between the size of the dividend and the performance of the fund is a critical element in protecting the Permanent Fund, and for this reason, would discourage basing the annual dividend calculation on state oil and gas royalties (as advocated in at least two pieces of legislation in the 2016 legislative session). The concern is that uncoupling the annual dividend from the fund could threaten the long‐term viability of the fund itself
26 These reports include: "Long Term Economic Sustainability for the State of Alaska (2013); "At a Crossroad: The
Permanent Fund, Alaskans, and Alaska's Future" (2007); "Permanent Fund Earnings‐Phase II: A Cornerstone for
Fiscal Certainty" (1999); "Budget Recommendations for Alaska: Breaking the Fall" (1994). All reports are available
at www.commonwealthnorth.org 27 See CWN Board resolution approved February 23, 2016 (Appendix H).
26
because the payments to the public would be detached from the earnings, management, and preservation of the fund.
• Reducing the annual dividend is a fiscal necessity for the state‐Alaska needs to start
using some level of Permanent Fund earnings to help meet the need for public services.
• The informal group did not settle on a specific formula regarding the size of the dividend needed to keep Alaskans focused on the integrity of fund, though it considered prior legislative efforts to limit the dividend to 30 or 40 percent of the fund's annual earnings calculated as an average of several years to reduce volatility. Regardless of the amount of earnings directed to the dividend, the group believed it would be appropriate for the Legislature to adopt a percent‐of‐market‐value cap on the total annual payout of fund earnings for dividends and public services, at a level consistent with the long‐term safety of the fund's principal.
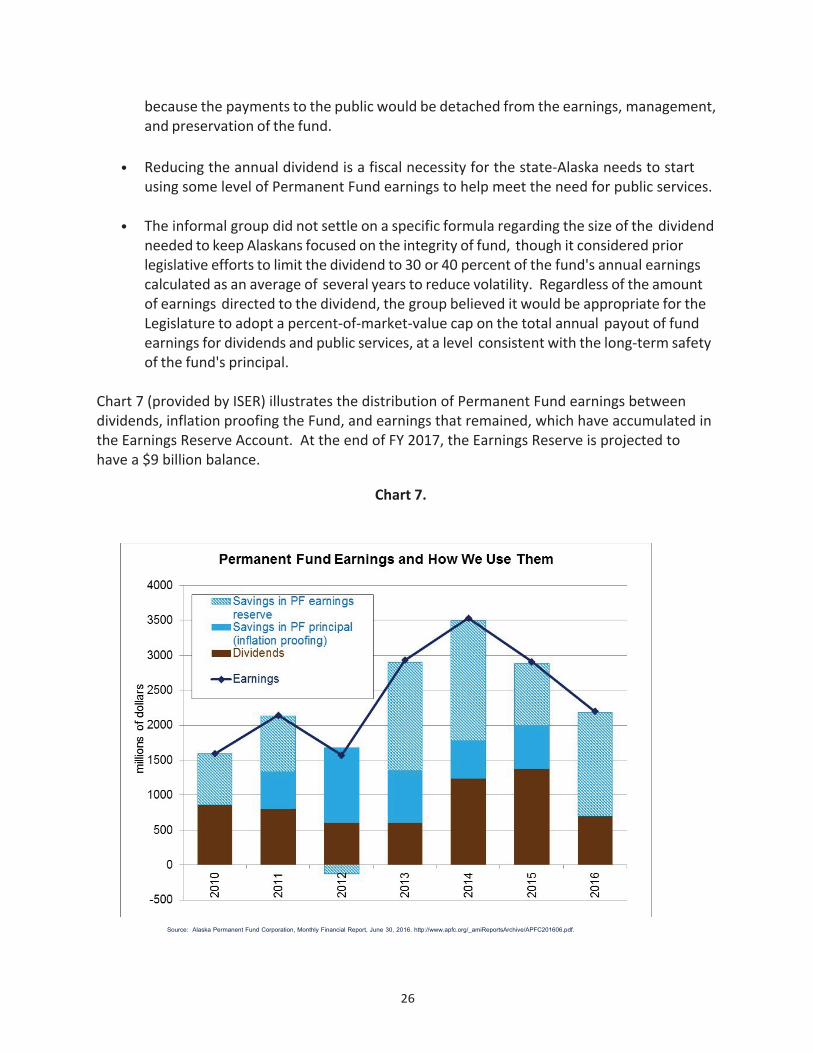
Chart 7 (provided by ISER) illustrates the distribution of Permanent Fund earnings between dividends, inflation proofing the Fund, and earnings that remained, which have accumulated in the Earnings Reserve Account. At the end of FY 2017, the Earnings Reserve is projected to have a $9 billion balance.
Source: Alaska Permanent Fund Corporation, Monthly Financial Report, June 30, 2016. http://www.apfc.org/_amiReportsArchive/APFC201606.pdf.
Chart 7.
27
Permanent Fund Management Continue support for a percent of market payout formula, as recommended in CWN's
2013 report. Currently the Constitution only permits earned or realized income to be paid out. Within this constraint a statutory percent of market value formula would provide for more consistent annual payouts available for distribution.
Regarding the investment policy for the Permanent Fund's earnings reserve account (this is the income account which may be spent by legislative action as opposed to the principal or corpus of the fund which is constitutionally inviolate), in light of the likely drawdown of amounts from the earnings reserve account in the near future by legislative appropriation, it is recommended that the reserve account be invested in cash equivalents apart from the rest of the Fund to ensure its availability for expenditure.
Permanent Fund Corporation
Open an Anchorage and out‐of‐state offices in financial centers in addition to the one Juneau office to maintain better contract with the larger investment world.
Strengthen and enlarge the Board of Trustees. The board selection process should be enhanced to ensure deeply qualified board members. This could be accomplished by ensuring that members have special "investment expertise" rather than simply "financial expertise." In addition, the process could include vetting of applicants by a committee and selection by the governor from a panel of qualified applicants by the committee. The current six‐person board allows only four members to be appointed from the public at large in addition to the two cabinet officers the governor can appoint. A larger board, say of nine members, will permit better statewide representation and an improved decision process with broader input.
More competitive compensation of board and staff members to attract and retain highly qualified individuals.
28
State Government Operational Efficiencies / Savings Just as tracking the change in the number of positions as an indicator of government growth or shrinkage, so is information about operational "efficiencies" and administrative‐type savings from consolidations and delivery of services at less cost.
The good news is that implementation of several technology solutions (finances/accounting, tax oversight) is being realized, hopefully resulting in some budget savings. But more is needed and to that end, CWN offers the following recommendations: New Recommendations:
• Fully implement the Universal Space Management Standards (2013) to achieve savings through uniform procurement and office space consistency in all parts of the state. The Administration is realizing savings by reducing the amount of leased space and relocating programs to state‐owned buildings that now have space available. In 2013 it was estimated that application of uniform standards could save $125 million over 20 years.
• Expand the Administration's Shared Services initiative to achieve efficiencies/savings by outsourcing, such as:
○ Contract with the private sector for IT savings (i.e. shift email hosting from the state's mainframe to private sector providers).
○ Consolidate/centralize payment collections for various permits, licenses, etc. that currently are spread throughout departments; use of technology to make on‐line payments eliminates the need for program subject matter "experts" be directly involved in payment process.
• Re‐consolidate Human Resources; over time some HR staff has been shifted back to
departments thereby reducing the productivity savings in work load distribution and consistent interpretation of employee contracts/laws that have been/can be realized through consolidation.
• Centralize department administrative services functions into the Department of Administration instead of each department having a stand‐alone division.
• Consolidate departments such as: – Departments of Labor with Commerce – Public Safety with Corrections – Environmental Conservation with Natural Resources
29
Budget Process and Practices CWN recognizes the challenge that the Governor and Legislature face in facing the politically difficult decisions that will need to be made to structurally change Alaska's finances. As noted in this report, some steps have been made‐but Alaska is far from having a state fiscal environment that will provide stability for state services, but also one in which the private sector can make business decisions to invest and provide the jobs critical to Alaska's future.
With that as the backdrop, the following recommendations include some that will "diversify" inputs into budget development by engaging Alaskans. 2O1S Recommendations: Stop Earmarking Revenue
• The Governor should appoint, with legislative approval, a committee of experts to
analyze, within a short period of time, what designated revenue accounts have no legal
restriction on use and can be appropriated to the general fund, including any statutory
changes that will be necessary.
The Legislature should appropriate designated reserve balances to the general
fund so these funds are available for priority state services.
Discussion Revenue Earmarks‐Designated Fund Sources "Fences" have been built around two categories of budget revenue: "designated general funds" and "other state funds." These fences limit how these revenues can be spent and are Alaska's version of revenue "earmarks." This is especially true for "designated general funds," which includes revenue such as park fees, occupational licensing fees, Marine Highway fares, revolving loan payments, and University tuition. The Legislature tends to have less latitude in spending "other state funds," which includes revenue generated by activities of state corporations (e.g., Permanent Fund, Alaska Housing Finance Corporation) and revenue that needs to be segregated for other legal reasons or obligations.
There are 112 different "designated general fund" accounts and 78 "other state fund" accounts.28 By practice, the Legislature has not scrutinized programs funded by these sources as much as those that are funded by Unrestricted General Funds. The practical result is that programs such as the State Troopers (funded by unrestricted general funds) get more scrutiny/cuts than the budgets for occupational licensing boards because these boards "pay their own way" (designated funds).
28 See Appendix I for a list of all fund source codes that are in use/have been used (source: Division of Legislative
Finance "Swiss Army Knife").
30
Alaska can no longer afford this practice of earmarking revenue, which limits access to funding for high priority state responsibilities. There would be an additional $1.1 billion in the general fund if these earmarks were eliminated.
When revenues were bountiful, the state set aside funds in designated reserves,29 the proceeds of which have been used to fund their respective programs each year. Just as with programs funded by "designated general funds," programs funded from these reserves are not subject to the same scrutiny and do not compete for scarce state dollars.
Due to the unrestricted general fund shortfall, Alaska no longer can afford to have these set‐ asides. The Legislature should amend state statutes if necessary and appropriate the reserve balances to the general fund.
Focus on Results 2O1S Recommendation: Identify and Fund Appropriate, Effective Services The Administration and Legislature should undertake a review of state services to
evaluate the following:
o Based on constitutional responsibilities, is a program or service something the state is required to do;
o If it is appropriate, analyze the results the program is getting‐how effective is it in achieving its intended purpose;
o Examine the cost to deliver current results‐what's the "return on investment" in terms of cost compared to results/effectiveness;
o Evaluate if the state is the only entity that can provide the service or if it would be more cost effective and responsive if the services were contracted out or shed through privatization; and/or
o If it is not a state responsibility, stop providing the service.
Update: In OMB's overview of the Governor's proposed FY 18 budget, several criteria identified above were said to have been used to develop their budget. However, missing from the Administration's list was evaluating if a program is effective‐is it achieving its intended results?
Increase the number of in‐depth performance reviews conducted to more than one department per year so increased information is available to identify potential savings.
Undertake an in‐depth review of performance frameworks and measures during the interim.
29 Source: "Summary of Appropriations FY 15," Division of Legislative Finance, page 4.
31
Integrate use of program performance measures into its budget review to ensure public dollars are spent on effective services.
Engage citizens in this review process, which will provide legislators and the Administration with differing perspectives and advance citizen understanding of state services.
The Governor should appoint a citizen‐led commission to conduct a management review of state operations that engages the departments and citizens to identify savings and opportunities to improve service delivery.
Put in place an approval process, such as that used by Congress in the Base Realignment and Closure (BRAC) decision‐making, to increase the likelihood that comprehensive reforms will be enacted.
Discussion Alaska's budget decision‐makers typically focus on the incremental change (both increases and decreases) in spending from one year to the next instead of examining the full budget, or base budget. The result is that the base continues from year to year with minimal scrutiny. Given the systemic nature of this current budget challenge, decision‐makers need to shift their attention to evaluating the effectiveness of state programs and the cost associated with getting those results. The answers to these questions will inform budget decision‐makers and identify ineffective and/or cost‐prohibitive programs for elimination.
State law (Executive Budget Act AS 37.07.014) requires that the Legislature review state programs based on performance, which it has done in varying and limited fashion. Some departments, such as the Department of Health and Social Services, has made significant progress in providing performance‐focused information as part of its budget presentations.
While performance‐based frameworks for many of the other state agencies currently exist,30
many still need additional work to ensure they include meaningful performance measures linked to program results and costs (versus activities and inputs). It also will be important for the Legislature to review the frameworks to ensure the information reflects results for programs that Alaskans value and are not selective information put forth by program advocates.
We commend the steps the Legislature has taken to acquire results‐based information. Recent efforts include:
30 See http://omb.alaska.gov/html/performance/department-key-indicators.html. Some departments are making progress in developing frameworks that strategically align programs with goals and identification of corresponding performance measures.
32
In‐depth performance reviews of departments (ch 19 SLA 13), sponsored by Rep. Mike Chenault, now are required.
Periodic review of expenditures such as tax credits (ch 61 SLA 14) by Rep. Steve Thompson provides the Legislature with a tool to evaluate the effectiveness of these expenditures in achieving public policy goals (i.e., results). The "Indirect Expenditures" report is an excellent tool to review the these programs.
We believe that the 90‐day session limits the ability for legislators to undertake the level of examination to ensure meaningful performance information informs its decision‐making. We would like to acknowledge that some Finance subcommittees have worked extensively during the interim with their assigned department and believe this should be an expectation of Finance Committee membership.
Another tool available to assist in review of the state's roles and responsibilities is a comprehensive management review of state services and methods of delivery. Governor Hammond created a citizen‐led Blue Ribbon Commission that reviewed state services; Governor Hickel used an in‐house team to examine state programs and operations.
Given the seriousness of the challenge that needs to be met, the Governor and Legislature may need alternate strategies to implement recommendations. One such process is the voting mechanism Congress uses to approve or reject the Base Realignment and Closure (BRAC) recommendations. The Federal process involves a panel that makes recommendations to the President who can approve or make changes; the list is sent to Congress, which has 45 days to enact a resolution of disapproval; if Congress fails to pass a resolution, the recommendations become final.
Recommendations: Engage Alaskans in Meeting the Challenge The Governor and Legislature engage Alaskans in a series of community‐based dialogues
in which they discuss the state's future; the responsibilities of the state and individual Alaskans in that future; and how achieving that vision will be funded.
Develop a multiyear approach to communicate critical operating budget issues in
cooperation with other public and private organizations. Such efforts must identify general "consumer level" messaging that attracts public interest in Alaska's budget and the challenges we face. It is critical to engage the public with social media‐sized bites of information that drive clicks to detail, and that helps to enhance an understanding of the needs and vision of the state.
Discussion To responsibly address the state's fiscal choices, it will be important that Alaskans also understand the fiscal challenge facing the state. For nearly 30 years Alaskans have periodically heard about the imminent "fiscal cliff" but events have always intervened
33
that re‐routed the state from falling. There's good reason for citizens to be skeptical of the problem and therefore, unwilling to accept solutions.
For these reasons Alaskans need to be engaged in a different type of discussion about the challenge and then, based on their understanding, have an opportunity to provide constructive input to political leaders on what steps they believe the state should take. If such an opportunity is provided, we believe Alaskans will be more willing to provide the "political permission" many elected officials may need to make the politically difficult budget decisions. Unlike most approaches to public testimony and participation, a dialogue is not about winning the argument or changing someone's mind. Instead, a dialogue provides participants with an opportunity to constructively discuss options with their neighbors and friends; weigh the choices; and offer recommendations on the choices and trade‐offs they would be willing to make. It enables common ground to be identified, which can assist elected officials in making decisions that are based on the values of local communities. Such a process increases participants' understanding of the challenge our leaders are facing. Important to good policy decision‐making are informed citizens. Effective communication of balanced, objective information is integral but is a challenge in this era of political gamesmanship that are immediately tweeted, posted, etc. Irrespective, CWN believes it is extremely important to convey budget information at a "consumer level."
We appreciate the Legislature's efforts (through www.AlaskaBudget.com) to provide objective budget information and encourage increased efforts to drive Alaskans to the website. We also appreciate the work that the Legislature's Division of Legislative Finance does, especially its annual overview of the Governor's proposed budget (but unfortunately its primary focus is on incremental changes). The Department of Revenue's Revenue Forecast also has come a long way over the years in presenting information so it is more "consumer friendly."
Commonwealth North has a longstanding history of addressing the fiscal policy needs of the state, and we have identified several organizations with similar concerns. These include the three‐legged stool campaign by First National Bank Alaska; the Alaskanomics blog by Northrim Bank; ISER supported works; Alaska Common Ground's continued efforts; and Commonwealth North's historical and current efforts.
Among the tools discussed to advance Alaskans understanding of the challenges is an easy‐to‐ use spreadsheet that allows a user to input adjustments to budget items to see the effect on other budget items.
CWN also encourages a review of past efforts to engage the public in drafting Alaska's fiscal future. A new effort to inform Alaskans on our fiscal challenges needs to treat Alaskans like stakeholders in the future of our state.
34
Budget Development Recommendation:
The Governor should establish citizen advisory panels to provide input during development of the Governor's proposed budget.31
Discussion During development of a Governor's proposed budget, the primary source of input is state departments, who are very effective members of the "spending lobby." CWN believes there would be value for the Governor to also solicit other points of view from citizens prior to submission of the budget to the Legislature.
Recommendation: Require the Governor to submit the proposed budget to the Legislature by
November 15th each year32 to enable the Legislature to get an earlier start to its review.
Discussion Currently the Governor is required by law to submit the proposed budget to the Legislature by
December 15th of each year. Given the budget challenges and limited session length, we believe it is important that the Legislature have additional time to scrutinize state spending and program results. This change also will require the Department of Revenue to move up release of its revenue forecast so as to inform budget decision‐makers. Recommendation:
Establish Revenue Limit that limits the amount of savings that can be spent in any one fiscal year to ensure prudent use and extend availability.
Discussion One of the most effective restraints on spending is the lack of revenue. While we commend past efforts to save surplus revenue in reserve accounts, ironically its availability can undermine the political will to make sustainable reductions. In other words, decide what you can afford to spend up‐front and base a budget on it.
Recommendation: Use the appropriation structure to provide departments maximum flexibility to identify and implement savings.
31 Oregon has “Citizen Program Funding Teams” that advise the Governor on budget priorities, rank programs in terms of priorities, and recommend funding levels. It is re-thinking this role for citizens because the initial task delegated an overwhelming responsibility to citizen volunteers in trying to understand complex programs. The thinking is to have citizens advise later in the process in order to limit the commitment of time and effort required for them to participate in the process. Of note is that state agencies were concerned that they would still have the opportunity to justify their budget to the Governor after the citizen groups made their recommendations. 32 An accommodation should be made in budget submission timeframe when a new governor is elected.
35
Discussion Recognizing the unusual nature of the challenge, CWN recommends that the Legislature take an
unusual step of structuring33 the operating budget so that the Administration has maximum flexibility to evaluate and implement changes that will result in significant savings. Two options that could provide this type of flexibility are:
Make one reduced‐level appropriation to the Executive Branch that is allocated to each
department34, and one appropriation to the Judiciary, and one to the Legislative branches as is currently done. For the Executive Branch, this would give maximum latitude to move funds within and between departments, as savings are identified; or
Make one reduced‐level appropriation to each department, the Judiciary, Legislature, and University. While this does not provide as much flexibility as the first option, it would still provide more latitude than the more typical appropriation/allocation structure.
We recognize this type of extraordinary step weakens the Legislature's fundamental role in the appropriation process. The Legislature also could include a "report back" mechanism by which the Administration would make periodic reports on changes made and/or proposed to achieve required savings; or the changes would need ratification the following session. Another option would be to provide partial‐year funding by which departments would then report progress/proposals to the Legislature the following session at which time legislative action would be taken on funding for the balance of the year.
Recommendation: More Time to Do Its Work The Legislature revises its schedule to increase the time available for oversight of state spending, such as:
Returning to the Constitution's 120‐day session limit; Increasing the number of interim meetings for Finance Committee/subcommittee work; Convening special session(s) devoted to budget issues; and/or Extending the session by four weeks in odd‐years (two weeks added on each end).
33 The importance of the level of "appropriation" is that a department does not have the authority to move money
between appropriations (only the Legislature has this power to set appropriation levels). Within an appropriation,
the Legislature "allocates" funds to different purposes; departments can move funds between allocations. 34 In 1983 the Governor proposed a department‐level appropriations structure bill for the operating and capital
budgets (HB 105; see Appendix J); final budget bill ultimately approved by the Legislature returned to the
traditional appropriations structure that limited management flexibility.
36
Discussion More Time for Budget Deliberations The study group examined the impact of the current 90‐day session limit on the Legislature's ability to address important issues. The Alaska Constitution limits the regular legislative session to 120 days. A statute, passed by initiative, further limits session length to 90 days. The Legislature could amend the statute and abide by the Constitutional maximum.
Recommendation: Establish a Joint Ways and Means Committee tasked with:
Introduction of a resolution at the start of each session that establishes the overall amount of revenue that will be available for the following fiscal year's budget (including the amount that will come from savings) on which the budget will be based;
Review of the state's revenue forecasting methodology to ensure the degree of reliability for spending decision‐making and identify options that could improve reliability.
Discussion A Joint Ways and Means Committee would bring focus to the revenue side of the Legislature's budget decision‐making. The joint committee would introduce a resolution that identifies the state revenue expected to be available from identified sources on which the Legislature will base the next fiscal year budget. If it is anticipated that additional revenue sources will be necessary, the resolution would identify potential sources and estimates. Earlier release of the fall revenue forecast will enable the Joint Ways and Means Committee to start meeting in November in order to prepare a resolution for introduction at the start of the Legislative session.
Given the importance of oil production to the state budget, the study group reviewed the reliability of Alaska North Slope oil production forecasts as presented in the Alaska Department of Revenue's (ADOR) Fall Revenue Sources Books.
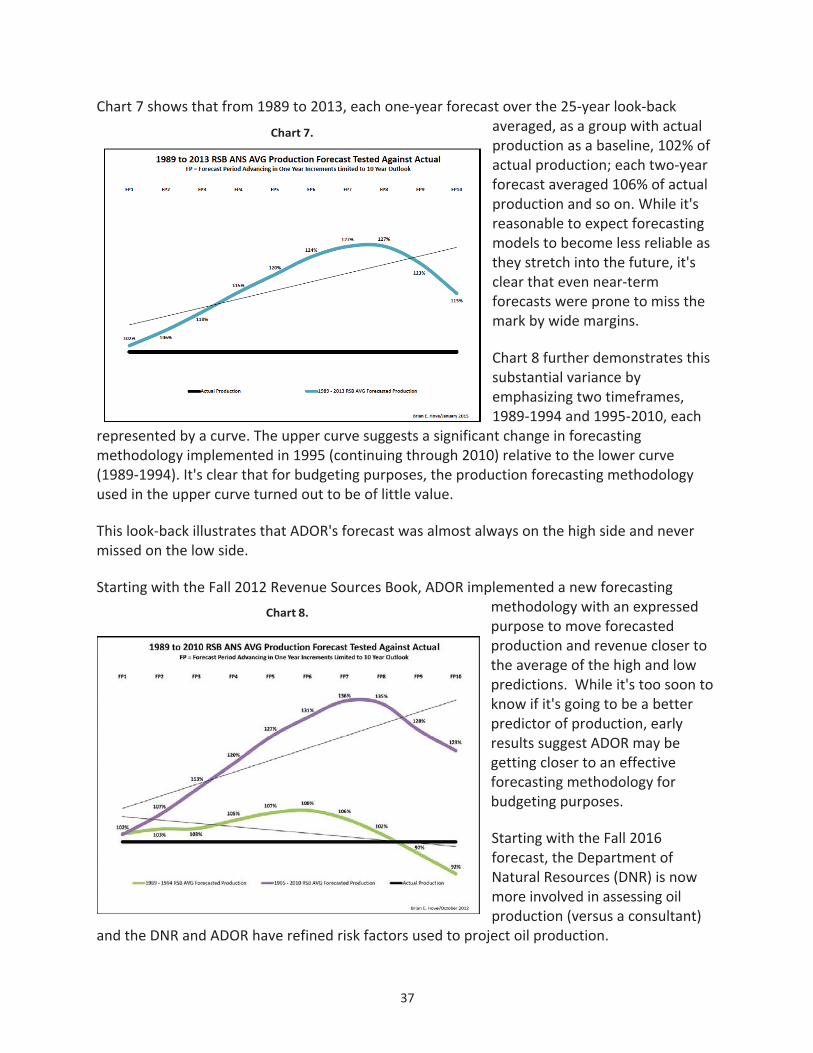
37
Chart 7 shows that from 1989 to 2013, each one‐year forecast over the 25‐year look‐back averaged, as a group with actual production as a baseline, 102% of actual production; each two‐year forecast averaged 106% of actual production and so on. While it's reasonable to expect forecasting models to become less reliable as they stretch into the future, it's clear that even near‐term forecasts were prone to miss the mark by wide margins.
Chart 8 further demonstrates this substantial variance by emphasizing two timeframes, 1989‐1994 and 1995‐2010, each
represented by a curve. The upper curve suggests a significant change in forecasting methodology implemented in 1995 (continuing through 2010) relative to the lower curve (1989‐1994). It's clear that for budgeting purposes, the production forecasting methodology used in the upper curve turned out to be of little value.
This look‐back illustrates that ADOR's forecast was almost always on the high side and never missed on the low side.
Starting with the Fall 2012 Revenue Sources Book, ADOR implemented a new forecasting
Chart 8. methodology with an expressed purpose to move forecasted production and revenue closer to the average of the high and low predictions. While it's too soon to know if it's going to be a better predictor of production, early results suggest ADOR may be getting closer to an effective forecasting methodology for budgeting purposes.
Starting with the Fall 2016 forecast, the Department of Natural Resources (DNR) is now more involved in assessing oil production (versus a consultant)
and the DNR and ADOR have refined risk factors used to project oil production.
Chart 7.
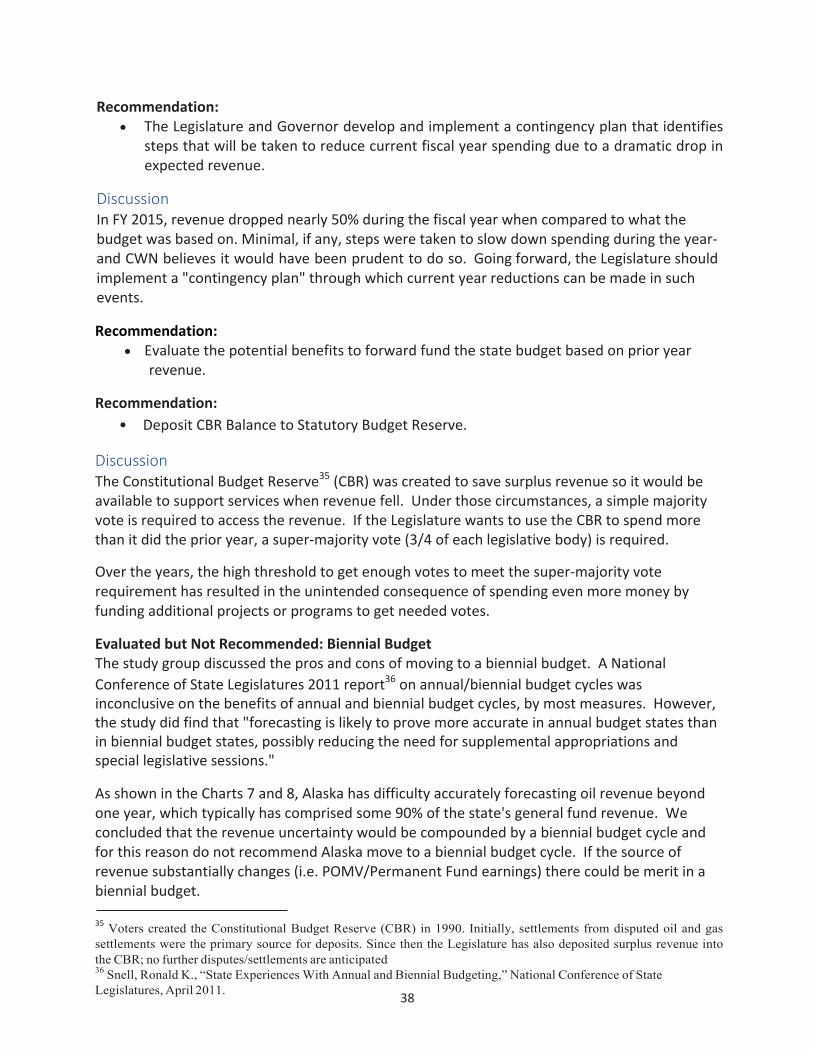
38
Recommendation: The Legislature and Governor develop and implement a contingency plan that identifies
steps that will be taken to reduce current fiscal year spending due to a dramatic drop in expected revenue.
Discussion In FY 2015, revenue dropped nearly 50% during the fiscal year when compared to what the budget was based on. Minimal, if any, steps were taken to slow down spending during the year‐and CWN believes it would have been prudent to do so. Going forward, the Legislature should implement a "contingency plan" through which current year reductions can be made in such events.
Recommendation: Evaluate the potential benefits to forward fund the state budget based on prior year
revenue.
Recommendation:
• Deposit CBR Balance to Statutory Budget Reserve.
Discussion The Constitutional Budget Reserve35 (CBR) was created to save surplus revenue so it would be available to support services when revenue fell. Under those circumstances, a simple majority vote is required to access the revenue. If the Legislature wants to use the CBR to spend more than it did the prior year, a super‐majority vote (3/4 of each legislative body) is required.
Over the years, the high threshold to get enough votes to meet the super‐majority vote requirement has resulted in the unintended consequence of spending even more money by funding additional projects or programs to get needed votes.
Evaluated but Not Recommended: Biennial Budget The study group discussed the pros and cons of moving to a biennial budget. A National
Conference of State Legislatures 2011 report36 on annual/biennial budget cycles was inconclusive on the benefits of annual and biennial budget cycles, by most measures. However, the study did find that "forecasting is likely to prove more accurate in annual budget states than in biennial budget states, possibly reducing the need for supplemental appropriations and special legislative sessions."
As shown in the Charts 7 and 8, Alaska has difficulty accurately forecasting oil revenue beyond one year, which typically has comprised some 90% of the state's general fund revenue. We concluded that the revenue uncertainty would be compounded by a biennial budget cycle and for this reason do not recommend Alaska move to a biennial budget cycle. If the source of revenue substantially changes (i.e. POMV/Permanent Fund earnings) there could be merit in a biennial budget.
35 Voters created the Constitutional Budget Reserve (CBR) in 1990. Initially, settlements from disputed oil and gas settlements were the primary source for deposits. Since then the Legislature has also deposited surplus revenue into the CBR; no further disputes/settlements are anticipated 36 Snell, Ronald K., “State Experiences With Annual and Biennial Budgeting,” National Conference of State Legislatures, April 2011.
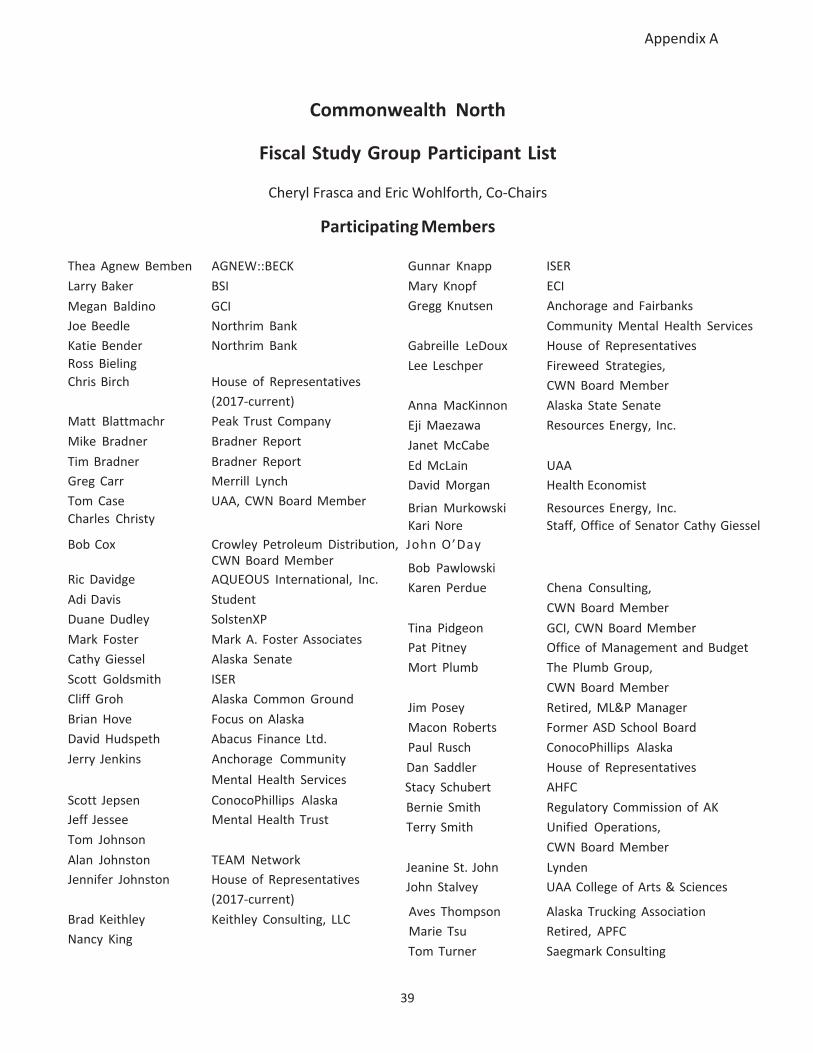
39
Appendix A
Commonwealth North
Fiscal Study Group Participant List
Cheryl Frasca and Eric Wohlforth, Co‐Chairs
Participating Members
Thea Agnew Bemben AGNEW::BECK
Larry Baker BSI
Megan Baldino GCI
Joe Beedle Northrim Bank
Katie Bender Northrim Bank
Ross Bieling
Chris Birch House of Representatives
(2017‐current)
Matt Blattmachr Peak Trust Company
Mike Bradner Bradner Report
Tim Bradner Bradner Report
Greg Carr Merrill Lynch
Tom Case UAA, CWN Board Member
Charles Christy
Gunnar Knapp ISER
Mary Knopf ECI
Gregg Knutsen Anchorage and Fairbanks
Community Mental Health Services
Gabreille LeDoux House of Representatives
Lee Leschper Fireweed Strategies,
CWN Board Member
Anna MacKinnon Alaska State Senate
Eji Maezawa Resources Energy, Inc.
Janet McCabe
Ed McLain UAA
David Morgan Health Economist
Brian Murkowski Resources Energy, Inc.
Kari Nore Staff, Office of Senator Cathy Giessel
Bob Cox Crowley Petroleum Distribution, John O’Day CWN Board Member
Ric Davidge AQUEOUS International, Inc.
Adi Davis Student
Duane Dudley SolstenXP
Mark Foster Mark A. Foster Associates
Cathy Giessel Alaska Senate
Scott Goldsmith ISER
Cliff Groh Alaska Common Ground
Brian Hove Focus on Alaska
David Hudspeth Abacus Finance Ltd.
Jerry Jenkins Anchorage Community
Mental Health Services
Scott Jepsen ConocoPhillips Alaska
Jeff Jessee Mental Health Trust
Tom Johnson
Alan Johnston TEAM Network
Jennifer Johnston House of Representatives
(2017‐current)
Brad Keithley Keithley Consulting, LLC
Nancy King
Bob Pawlowski
Karen Perdue Chena Consulting,
CWN Board Member
Tina Pidgeon GCI, CWN Board Member
Pat Pitney Office of Management and Budget
Mort Plumb The Plumb Group,
CWN Board Member
Jim Posey Retired, ML&P Manager
Macon Roberts Former ASD School Board
Paul Rusch ConocoPhillips Alaska
Dan Saddler House of Representatives
Stacy Schubert AHFC
Bernie Smith Regulatory Commission of AK
Terry Smith Unified Operations,
CWN Board Member
Jeanine St. John Lynden
John Stalvey UAA College of Arts & Sciences
Aves Thompson Alaska Trucking Association
Marie Tsu Retired, APFC
Tom Turner Saegmark Consulting
40
Appendix A
Jan Van den Top Alaska Mechanical Contractors
Liz Vasquez House of Representatives
(2014‐2017) Natasha von Imhof Alaska State Senate (2017‐current)
Kirk Wickersham FSBO System
Josh Wilson Alaska Correctional Officers Assn.
Rich Wilson Retired, Port of Anchorage
Sam Wolfe Morgan Stanley
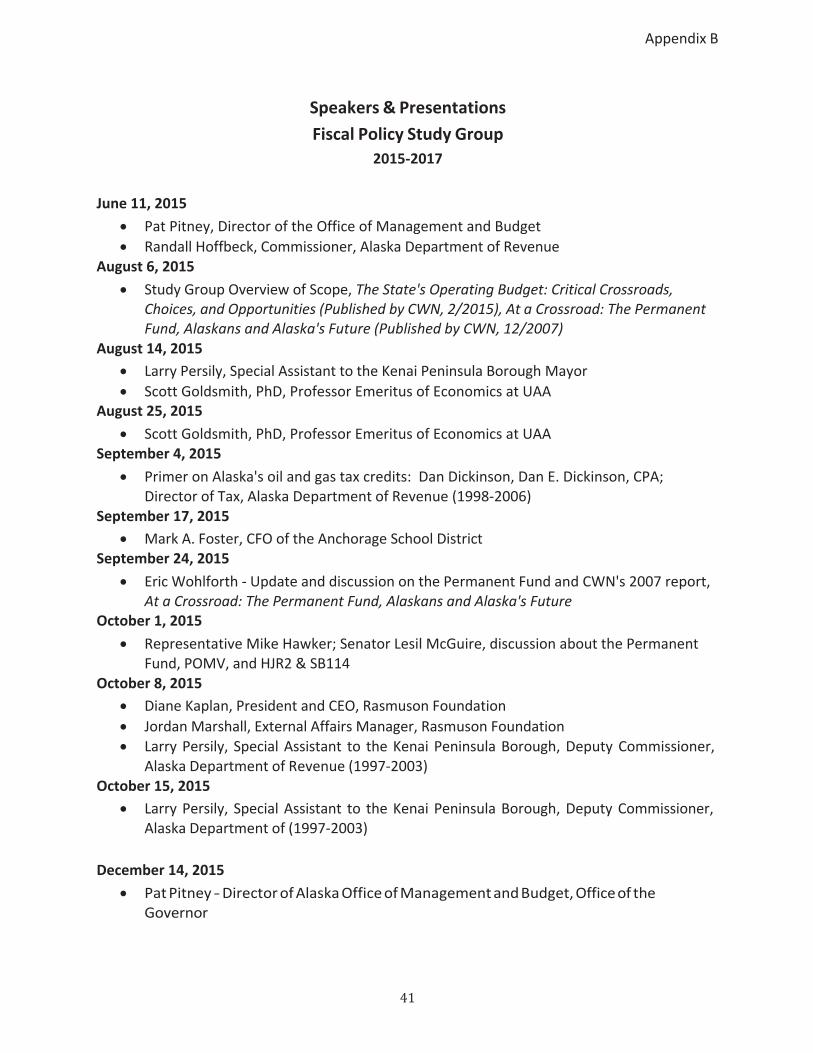
41
Appendix B
Speakers & Presentations
Fiscal Policy Study Group
2015‐2017
June 11, 2015
Pat Pitney, Director of the Office of Management and Budget
Randall Hoffbeck, Commissioner, Alaska Department of Revenue August 6, 2015
Study Group Overview of Scope, The State's Operating Budget: Critical Crossroads, Choices, and Opportunities (Published by CWN, 2/2015), At a Crossroad: The Permanent Fund, Alaskans and Alaska's Future (Published by CWN, 12/2007)
August 14, 2015
Larry Persily, Special Assistant to the Kenai Peninsula Borough Mayor
Scott Goldsmith, PhD, Professor Emeritus of Economics at UAA August 25, 2015
Scott Goldsmith, PhD, Professor Emeritus of Economics at UAA September 4, 2015
Primer on Alaska's oil and gas tax credits: Dan Dickinson, Dan E. Dickinson, CPA; Director of Tax, Alaska Department of Revenue (1998‐2006)
September 17, 2015
Mark A. Foster, CFO of the Anchorage School District September 24, 2015
Eric Wohlforth ‐ Update and discussion on the Permanent Fund and CWN's 2007 report, At a Crossroad: The Permanent Fund, Alaskans and Alaska's Future
October 1, 2015
Representative Mike Hawker; Senator Lesil McGuire, discussion about the Permanent Fund, POMV, and HJR2 & SB114
October 8, 2015
Diane Kaplan, President and CEO, Rasmuson Foundation
Jordan Marshall, External Affairs Manager, Rasmuson Foundation Larry Persily, Special Assistant to the Kenai Peninsula Borough, Deputy Commissioner,
Alaska Department of Revenue (1997‐2003) October 15, 2015
Larry Persily, Special Assistant to the Kenai Peninsula Borough, Deputy Commissioner, Alaska Department of (1997‐2003)
December 14, 2015
Pat Pitney ‐ Director of Alaska Office of Management and Budget, Office of the Governor
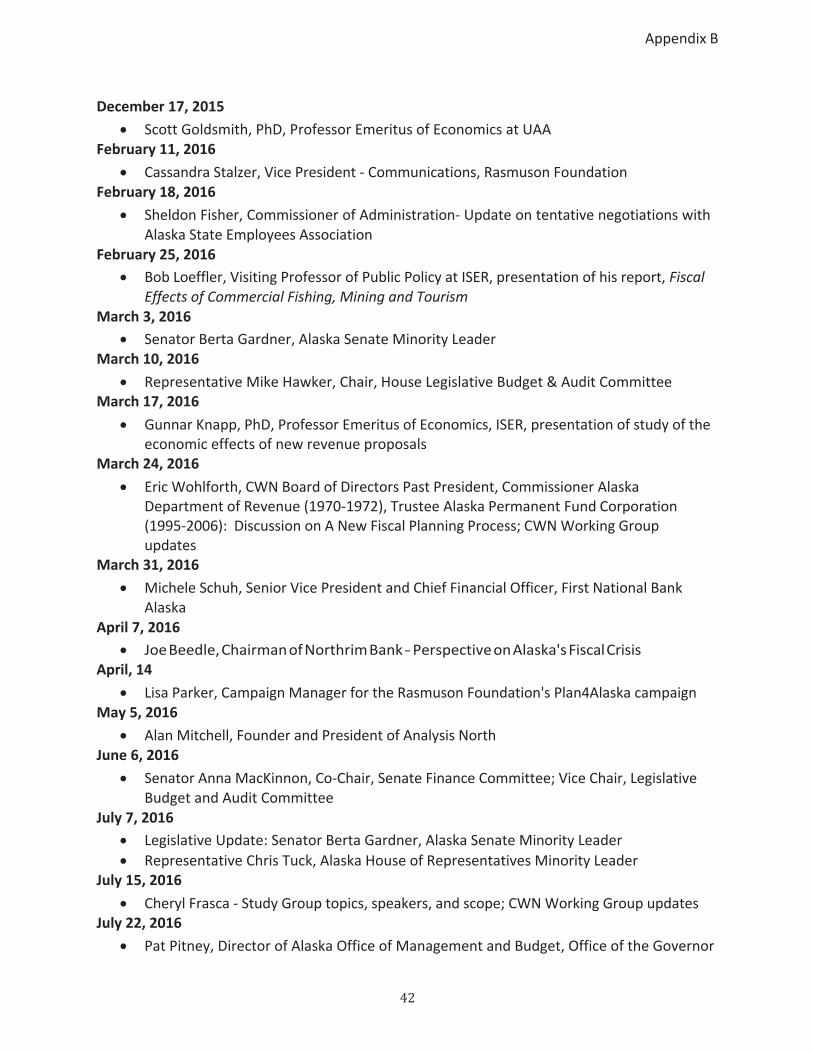
42
Appendix B
December 17, 2015
Scott Goldsmith, PhD, Professor Emeritus of Economics at UAA February 11, 2016
Cassandra Stalzer, Vice President ‐ Communications, Rasmuson Foundation February 18, 2016
Sheldon Fisher, Commissioner of Administration‐ Update on tentative negotiations with Alaska State Employees Association
February 25, 2016
Bob Loeffler, Visiting Professor of Public Policy at ISER, presentation of his report, Fiscal Effects of Commercial Fishing, Mining and Tourism
March 3, 2016
Senator Berta Gardner, Alaska Senate Minority Leader March 10, 2016
Representative Mike Hawker, Chair, House Legislative Budget & Audit Committee March 17, 2016
Gunnar Knapp, PhD, Professor Emeritus of Economics, ISER, presentation of study of the economic effects of new revenue proposals
March 24, 2016
Eric Wohlforth, CWN Board of Directors Past President, Commissioner Alaska Department of Revenue (1970‐1972), Trustee Alaska Permanent Fund Corporation (1995‐2006): Discussion on A New Fiscal Planning Process; CWN Working Group updates
March 31, 2016
Michele Schuh, Senior Vice President and Chief Financial Officer, First National Bank Alaska
April 7, 2016
Joe Beedle, Chairman of Northrim Bank ‐ Perspective on Alaska's Fiscal Crisis April, 14
Lisa Parker, Campaign Manager for the Rasmuson Foundation's Plan4Alaska campaign May 5, 2016
Alan Mitchell, Founder and President of Analysis North June 6, 2016
Senator Anna MacKinnon, Co‐Chair, Senate Finance Committee; Vice Chair, Legislative Budget and Audit Committee
July 7, 2016
Legislative Update: Senator Berta Gardner, Alaska Senate Minority Leader
Representative Chris Tuck, Alaska House of Representatives Minority Leader July 15, 2016
Cheryl Frasca ‐ Study Group topics, speakers, and scope; CWN Working Group updates July 22, 2016
Pat Pitney, Director of Alaska Office of Management and Budget, Office of the Governor
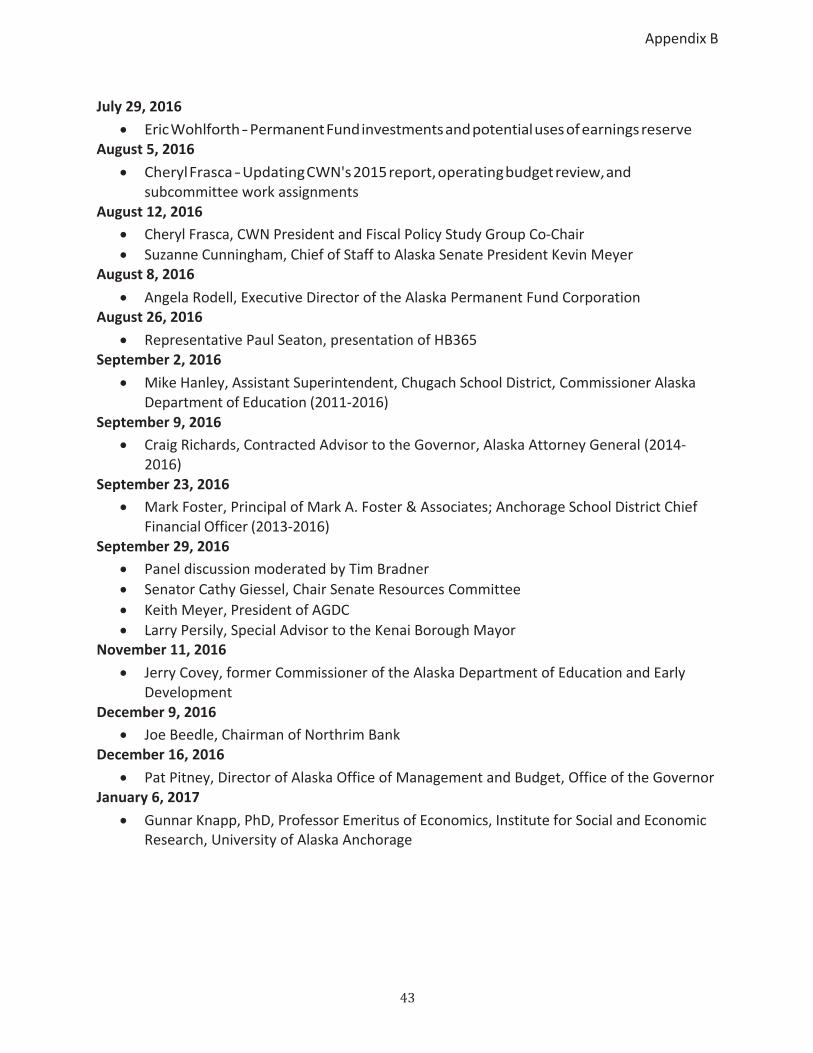
43
Appendix B
July 29, 2016
Eric Wohlforth ‐ Permanent Fund investments and potential uses of earnings reserve August 5, 2016
Cheryl Frasca ‐ Updating CWN's 2015 report, operating budget review, and subcommittee work assignments
August 12, 2016
Cheryl Frasca, CWN President and Fiscal Policy Study Group Co‐Chair
Suzanne Cunningham, Chief of Staff to Alaska Senate President Kevin Meyer August 8, 2016
Angela Rodell, Executive Director of the Alaska Permanent Fund Corporation August 26, 2016
Representative Paul Seaton, presentation of HB365 September 2, 2016
Mike Hanley, Assistant Superintendent, Chugach School District, Commissioner Alaska Department of Education (2011‐2016)
September 9, 2016
Craig Richards, Contracted Advisor to the Governor, Alaska Attorney General (2014‐ 2016)
September 23, 2016
Mark Foster, Principal of Mark A. Foster & Associates; Anchorage School District Chief Financial Officer (2013‐2016)
September 29, 2016
Panel discussion moderated by Tim Bradner
Senator Cathy Giessel, Chair Senate Resources Committee
Keith Meyer, President of AGDC
Larry Persily, Special Advisor to the Kenai Borough Mayor November 11, 2016
Jerry Covey, former Commissioner of the Alaska Department of Education and Early Development
December 9, 2016
Joe Beedle, Chairman of Northrim Bank December 16, 2016
Pat Pitney, Director of Alaska Office of Management and Budget, Office of the Governor January 6, 2017
Gunnar Knapp, PhD, Professor Emeritus of Economics, Institute for Social and Economic Research, University of Alaska Anchorage
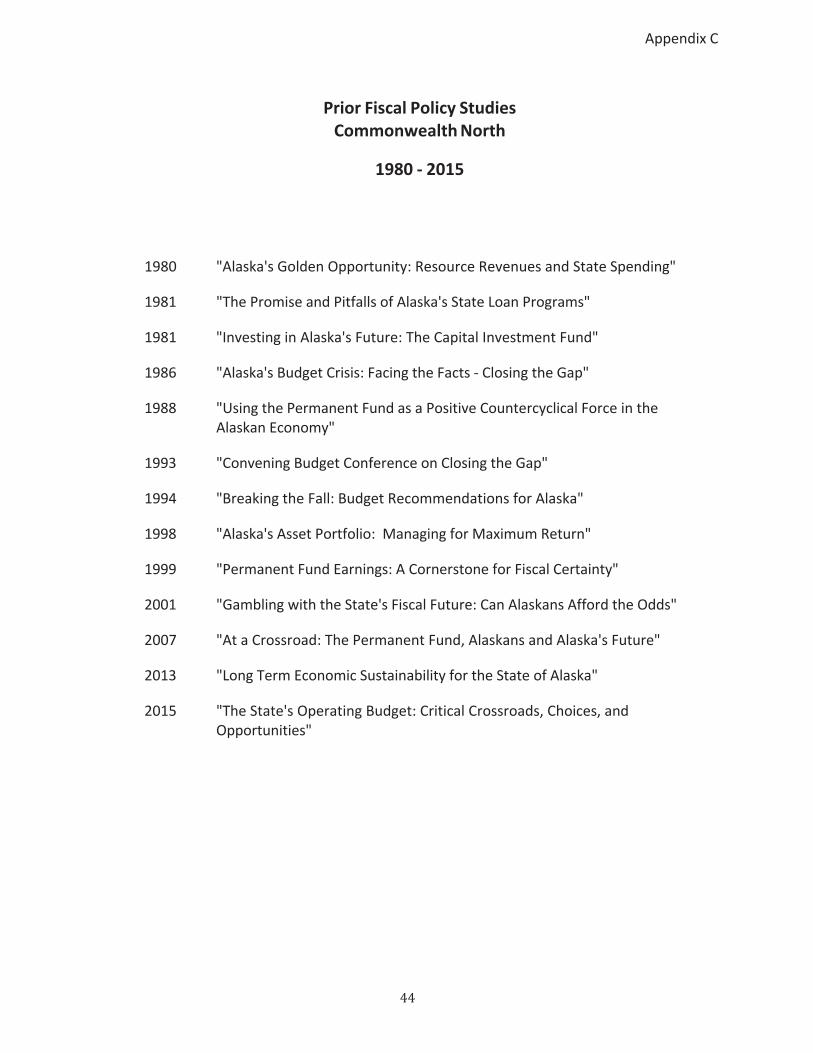
44
Appendix C
Prior Fiscal Policy Studies Commonwealth North
1980 ‐ 2015
1980 "Alaska's Golden Opportunity: Resource Revenues and State Spending"
1981 "The Promise and Pitfalls of Alaska's State Loan Programs"
1981 "Investing in Alaska's Future: The Capital Investment Fund"
1986 "Alaska's Budget Crisis: Facing the Facts ‐ Closing the Gap"
1988 "Using the Permanent Fund as a Positive Countercyclical Force in the Alaskan Economy"
1993 "Convening Budget Conference on Closing the Gap"
1994 "Breaking the Fall: Budget Recommendations for Alaska"
1998 "Alaska's Asset Portfolio: Managing for Maximum Return"
1999 "Permanent Fund Earnings: A Cornerstone for Fiscal Certainty"
2001 "Gambling with the State's Fiscal Future: Can Alaskans Afford the Odds"
2007 "At a Crossroad: The Permanent Fund, Alaskans and Alaska's Future"
2013 "Long Term Economic Sustainability for the State of Alaska"
2015 "The State's Operating Budget: Critical Crossroads, Choices, and Opportunities"
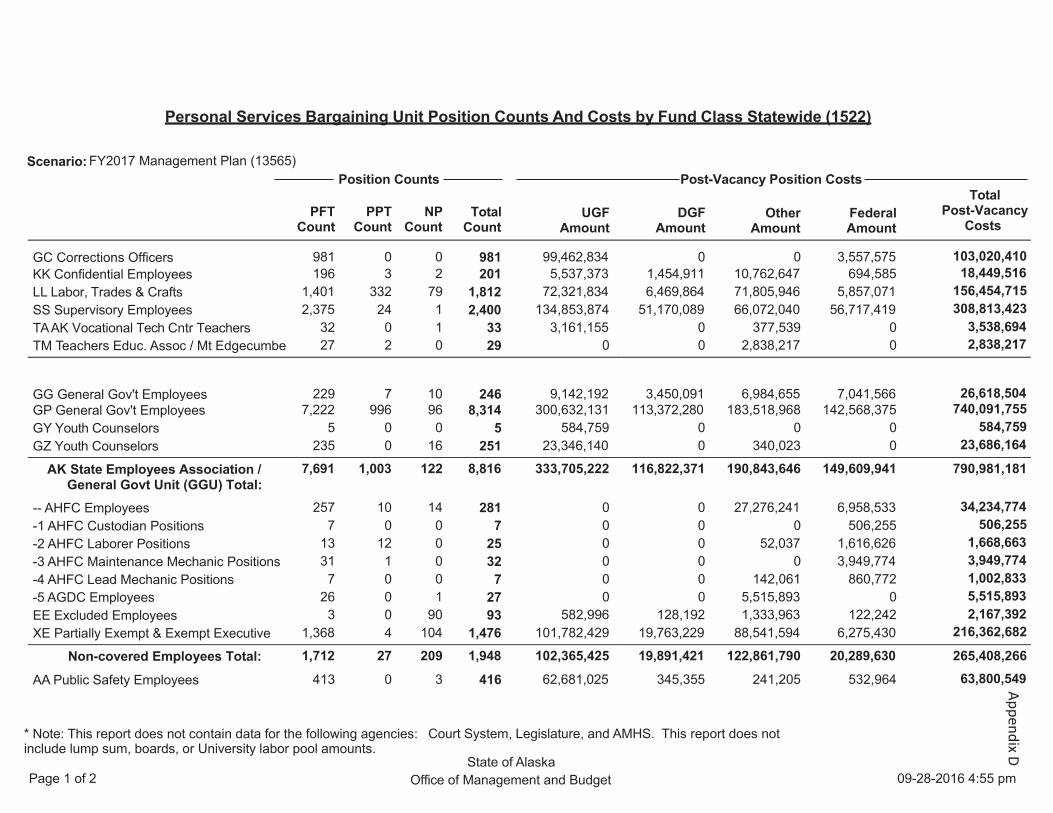
* Note: This report does not contain data for the following agencies:include lump sum, boards, or University labor pool amounts.
Court System, Legislature, and AMHS. This report does not
State of AlaskaPage 1 of 2 09-28-2016 4:55 pm Office of Management and Budget
Personal Services Bargaining Unit Position Counts And Costs by Fund Class Statewide (1522)
Scenario: FY2017 Management Plan (13565)
Position Counts
Post-Vacancy Position Costs
Total PFT
Count PPT
Count NP
Count Total
Count UGF
Amount DGF
Amount Other
Amount Federal Amount
Post-Vacancy Costs
GC Corrections Officers 981 0 0 981 99,462,834 0 0 3,557,575 103,020,410 KK Confidential Employees 196 3 2 201 5,537,373 1,454,911 10,762,647 694,585 18,449,516
LL Labor, Trades & Crafts 1,401 332 79 1,812 72,321,834 6,469,864 71,805,946 5,857,071 156,454,715
SS Supervisory Employees 2,375 24 1 2,400 134,853,874 51,170,089 66,072,040 56,717,419 308,813,423
TA AK Vocational Tech Cntr Teachers 32 0 1 33 3,161,155 0 377,539 0 3,538,694
TM Teachers Educ. Assoc / Mt Edgecumbe 27 2 0 29 0 0 2,838,217 0 2,838,217
GG General Gov't Employees
229
7
10
246
9,142,192
3,450,091
6,984,655
7,041,566
26,618,504 GP General Gov't Employees 7,222 996 96 8,314 300,632,131 113,372,280 183,518,968 142,568,375 740,091,755
GY Youth Counselors 5 0 0 5 584,759 0 0 0 584,759
GZ Youth Counselors 235 0 16 251 23,346,140 0 340,023 0 23,686,164
AK State Employees Association / General Govt Unit (GGU) Total:
7,691 1,003 122 8,816 333,705,222 116,822,371 190,843,646 149,609,941 790,981,181
-- AHFC Employees 257 10 14 281 0 0 27,276,241 6,958,533 34,234,774
-1 AHFC Custodian Positions 7 0 0 7 0 0 0 506,255 506,255
-2 AHFC Laborer Positions 13 12 0 25 0 0 52,037 1,616,626 1,668,663
-3 AHFC Maintenance Mechanic Positions 31 1 0 32 0 0 0 3,949,774 3,949,774
-4 AHFC Lead Mechanic Positions 7 0 0 7 0 0 142,061 860,772 1,002,833
-5 AGDC Employees 26 0 1 27 0 0 5,515,893 0 5,515,893
EE Excluded Employees 3 0 90 93 582,996 128,192 1,333,963 122,242 2,167,392
XE Partially Exempt & Exempt Executive 1,368 4 104 1,476 101,782,429 19,763,229 88,541,594 6,275,430 216,362,682
Non-covered Employees Total: 1,712 27 209 1,948 102,365,425 19,891,421 122,861,790 20,289,630 265,408,266
AA Public Safety Employees 413 0 3 416 62,681,025 345,355 241,205 532,964 63,800,549
Appen
dixD
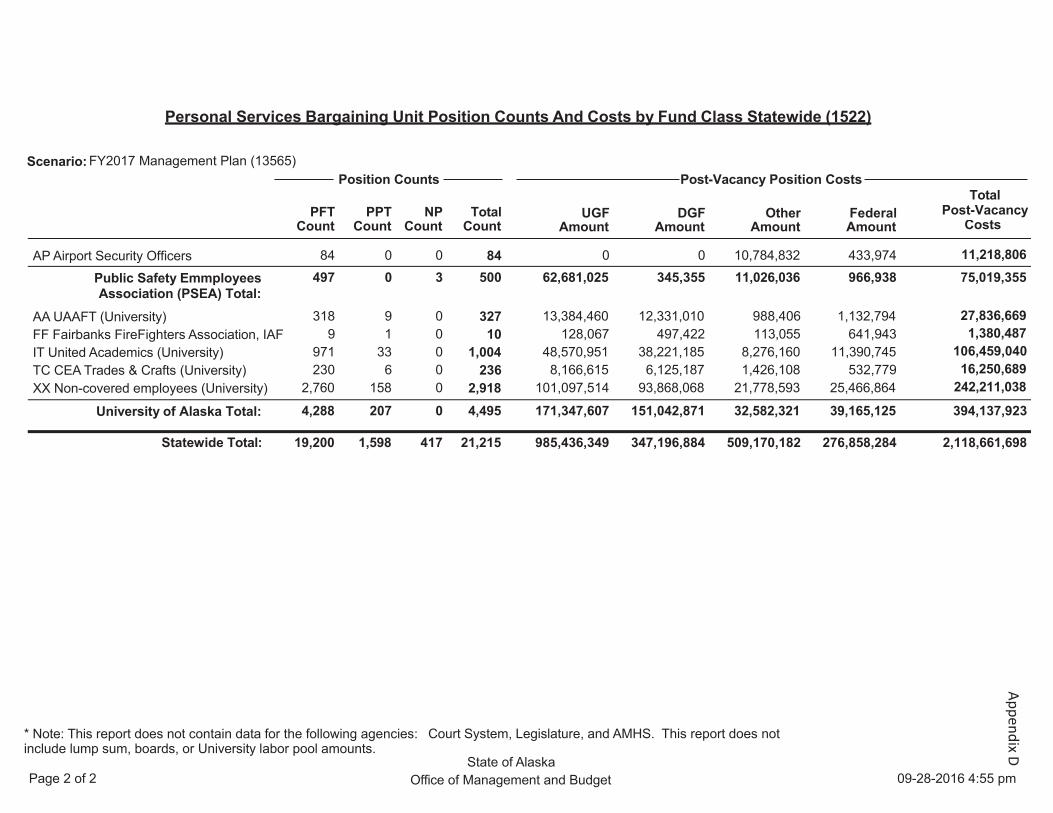
* Note: This report does not contain data for the following agencies:include lump sum, boards, or University labor pool amounts.
Court System, Legislature, and AMHS. This report does not
State of AlaskaPage 2 of 2 09-28-2016 4:55 pm Office of Management and Budget
Personal Services Bargaining Unit Position Counts And Costs by Fund Class Statewide (1522)
Scenario: FY2017 Management Plan (13565)
Position Counts
Post-Vacancy Position Costs
Total PFT PPT NP Total UGF DGF Other Federal Post-Vacancy
Count Count Count Count Amount Amount Amount Amount Costs
AP Airport Security Officers 84 0 0 84 0 0 10,784,832 433,974 11,218,806
Public Safety Emmployees Association (PSEA) Total:
497 0 3 500 62,681,025 345,355 11,026,036 966,938 75,019,355
AA UAAFT (University) 318 9 0 327 13,384,460 12,331,010 988,406 1,132,794 27,836,669
FF Fairbanks FireFighters Association, IAF 9 1 0 10 128,067 497,422 113,055 641,943 1,380,487
IT United Academics (University) 971 33 0 1,004 48,570,951 38,221,185 8,276,160 11,390,745 106,459,040
TC CEA Trades & Crafts (University) 230 6 0 236 8,166,615 6,125,187 1,426,108 532,779 16,250,689
XX Non-covered employees (University) 2,760 158 0 2,918 101,097,514 93,868,068 21,778,593 25,466,864 242,211,038
University of Alaska Total: 4,288 207 0 4,495 171,347,607 151,042,871 32,582,321 39,165,125 394,137,923
Statewide Total: 19,200 1,598 417 21,215 985,436,349 347,196,884 509,170,182 276,858,284 2,118,661,698
Appen
dixD
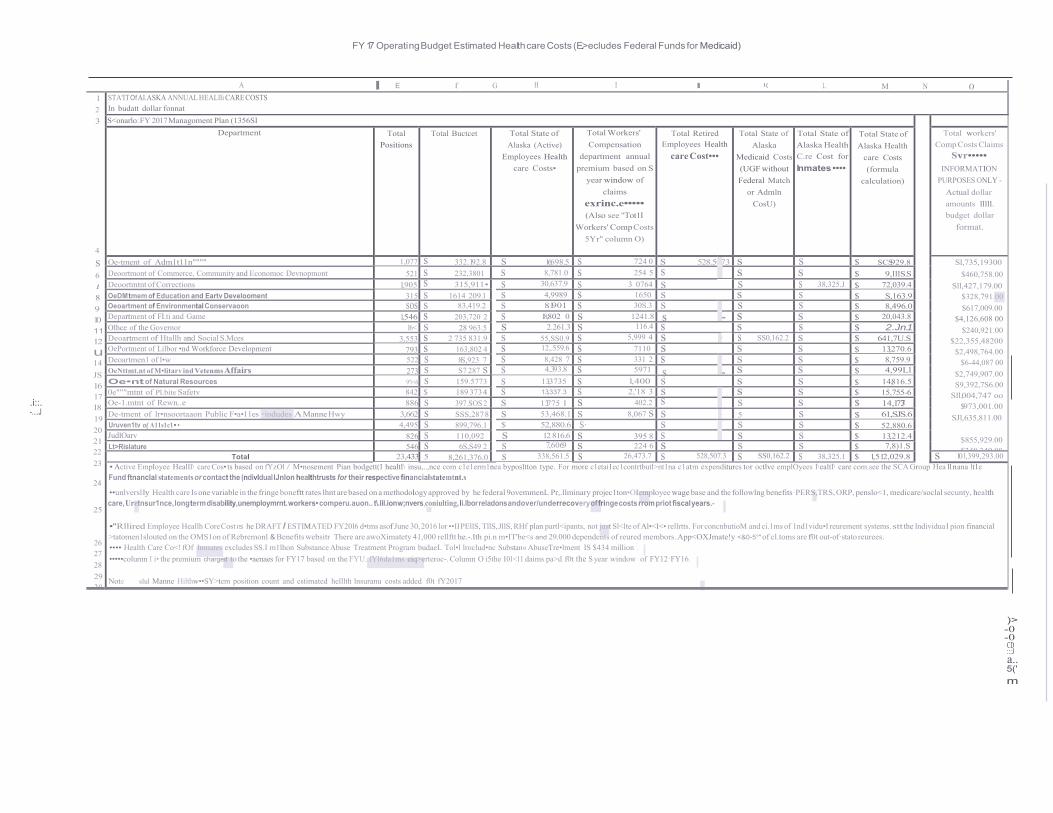
FY 17 Operating Budget Estimated Health care Costs (E.>ecludes Federal Funds for Medicaid)
A I E f G H I I I( L M N 0
s -
s -
.i::. -....J
)> -0 -0
CD :::J a.. 5('
m
1
2
3
4
s 6 1
8
9 10 11
12
u 14
JS 16 17 l8
19
20 21 22
23
24
25
26 27
28
29 30
STA'IT Of Al.ASKA ANNUAL HEALlli CARE COSTS In budatt dollar fonnat
S<onarlo: FY 2017 Managoment Plan (1356SI Department Total
Positions
Total Buctcet Total State of
Alaska (Active)
Employees Health
care Costs•
Total Workers'
Compensation
department annual
premium based on S
year window of
claims
exrinc.e••••• (Also see "Tot1I
Workers' Comp Costs
5Yr" column O)
Total Retired Employees Health
care Cost•••
Total State of
Alaska
Medicaid Costs
(UGF without
Federal Match
or Admln
CosU)
Total State of
Alaska Health
C.re Cost for
Inmates ••••
Total State of
Alaska Health
care Costs
(formula
calculation)
Total workers'
Comp Costs Claims
Svr••••• INFORMATION
PURPOSES ONLY -
Actual dollar
amounts lllll.
budget dollar
format.
Oe-tment of Adm1t11n"""" 1,077 s 332.192.8 s 16.698.5 s 724 0 s 528.5073 s s $ SCS,929.8 Sl,735,19300
$460,758.00
Sll,427,179.00 $328,791.00
$617,009.00 $4,126,608 00
$240,921.00 $22,355,48200
$2,498,764.00 $6-44,087 00
$2,749,907.00 S9,392,7S6.00
Sll,004,747 oo $973,001.00
SJl,635,811.00
$855,929.00 $348 349 00
Deoortmont of Commerce, Community and Economoc Devnopmont 521 s 232,3801 s 8,781.0 s 254 5 s s s $ 9,lllS.SDeoortmtnt of Corrections 1,905 s 315,911• s 30,637.9 s 3 0764 s s s 38,325.J $ 72,039.4OeDM tmem of Education and Eartv Develooment 315 s 1614 209.l s 4,9989 s 1650 s s s $ S,163.9Oeoartment of Environmental Conservaoon sos s 83,419.2 s 8,1901 s 30S.3 s s s $ 8,496.0Department of Fl.ti and Game 1,546 s 203,720 2 s 18,802 0 s 1241.8 s s $ 20,043.8
Olhce of the Governor 16< s 28 963.5 s 2.261.3 s 116.4 s s s $ 2.Jn.1Deoartment of Htallh and Social S.Mces 3,553 s 2 735 831.9 s 55,SS0.9 s 5,999 4 s - s SS0,162.2 s $ 641,7U.SOePortment of Lilbor •nd Workforce Development 793 s 163,802 4 s 12,.559.6 s 7110 s s s $ 13,270.6Deoartmen1 of l•w 522 s 8S,923 7 s 8,428 7 s 331 2 s s s $ 8,759.9OeNttmt.nt of M•litarv ind Vetenms Affairs 273 s S7 287 s s 4,393.8 s 5971 s s $ 4,99Ll
Oe•nt of Natural Resources 9'l<6 s 159.5773 s 13,3735 s 1,400 s s s $ 14,816.50e"""mtnt of Pl.bite Safetv 842 $ 189 373 4 s 13,337.3 s 2,'18 3 s s s $ 15,755-6Oe-1.mtnt of Rewn..e 886 s 397.SOS 2 s 13.775 I s 402.2 s s s $ 14,177.3 De-tment of lr•nsoortaaon Public F•a•11es •indudes A Manne Hwy 3,662 s SSS,287 8 s 53,468.1 s 8,067 s s - 5 s $ 61,SJS.6Uruven1tv o( A11s1c1 • • 4,495 s 899,796.1 $ 52,880.6 S· s s s $ 52,880.6JudlOarv 826 s 110,092 s 12 816.6 s 395 8 s s s $ 13,212.4Lt>Rislature 546 s 6S,S49 2 s 7,606.9 s 224 6 s s s $ 7,8)1.S
Total 23,433 5 8,261,376.0 s 338,561.5 s 26,473.7 s 528,507.3 s SS0,162.2 s 38,325.1 $ 1,512,029.8 s 101,399,293.00 • Active Employee Healll\ care Cos• ts based on fYzOl / M•nosement Pian bodgett(I healtl\ insu,..,nce com c1e1erm1nea byposltton type. For more c1etai1ec1contrtbutl>nt1na c1atm expenditures tor octlve emplOyees l\ealtl\ care com.see the SCA Group Hea11nana lt1e Fund ftnanclal statements or contact the (ndivldual lJnlon healthtrusts for their respective financialstatemtnt.s
••unlversl ly Health care Is one variable in the fringe boneftt rates lhnt are based on a methodology approved by he federal 9ovemmenL Pr,.llminary projec1ton•OIemployee wage base and the followlng benefits·PERS,TRS, ORP, penslo<1, medicare/soclal secunty, health care, Uretnsur1nce, long term disability,unemploymrnt. workers• comperu.auon.. t\.lil.ion w;nvers1coniulting, li.lbor reladons andover/underrecovery of fringe costs rrom priot fiscal years.- •''Rllired Employee Heallh Core Cost lS he DRAFT I ESTIMATED FY20l6 d•tms asof June 30, 2016 lor ••II PEllS, TllS, JllS, RHf plan partl<ipants, not just Sl<lte of Al•<I<• rellrtts. For concnbutioM and ci.1ms of 1nd1vidu•I reurement systems. stt the Individua l pion financial >tatomen1slouted on the OMS1on of Rebremonl & Benefits websitr There are awoXimatety 41,000 rellftt he.-.Ith pi.n m•IT'be<s and 29.000 dependents of reured membors. App<OXJmate!y <&0-5°" of cl.toms are f0t out-of·stato reurees. •••• Health Care Co<! fOf Inmates excludes SS.I m1lhon Substance Abuse Treatment Program budaeL Tol•l lroclud•nc Substan« AbuseTre•lment IS $434 million .
•••••column I i• the premium charged to the •aenaes for FY17 based on the FYU..fYl6da1ms eiq>erteroc-. Column O i5the 101<11 daims pa>d f0t the S year window of FY12·FY16.
Note slul Manne Hilthw••SY>tem position count and estimated helllth lnsuranu costs added f0t fY2017
48
Appendix F
Potential Reforms to Alaska's Health Care Delivery System Extracted from "Recommended Medicaid Expansion and Reform Strategies for Alaska" Department of Health and Social Services ‐ January 2016.
These are a package of five interconnected reform initiatives aimed at improving the health and well‐being of Alaskans while reducing overall costs to the State of Alaska:
Initiatives 1 through 3 propose foundational reforms that together are intended to create the incentives, services, management structures and controls, data analytics capacity, and technology infrastructure for a well‐functioning, sustainable Medicaid program; and
Initiatives 4 and 5 are pilots that would allow the Department of Health and Social Services (DHSS) to test value‐based payment mechanisms.
The first three initiatives propose engaging third‐party entities (two Administrative Services Organizations and an advanced data analytics firm) to enable DHSS to more quickly implement the systems changes needed to improve performance.
Initiative #1. Primary Care Improvement Initiative The Primary Care Improvement Initiative proposes activities to improve enrollee health status and reduce overall costs by supporting Primary Care Providers and engaging enrollees in improving their health. The initiative introduces Primary Care Case Management, a form of care management, in which every enrollee selects or is assigned to a Primary Care Provider who coordinates his or her care. An annual Health Risk Assessment identifies enrollees with higher health needs and risks. Health Homes and other care management programs would ensure that enrollee needs are addressed as early and appropriately as possible. Under this initiative, DHSS would contract with an Administrative Services Organization to conduct enrollee outreach and education, perform the Health Risk Assessment, manage the stratification and assignment of enrollees, develop and manage the primary care provider network.
Initiative #2. Behavioral Health Access Initiative The Behavioral Health Access Initiative identifies key strategies for integrating behavioral health and primary care services, improving access to needed Substance Use Disorder treatment and mental health services, and addressing gaps in the behavioral health continuum of care to strengthen the crisis response system. The initiative includes a recommendation that DHSS contract with an Administrative Services Organization to increase capacity within DHSS to manage a coordinated behavioral health system of care that improves health outcomes for Medicaid enrollees and controls costs.
49
Appendix F
Initiative #3. Data Analytics and Information Technology Infrastructure Initiative Through this initiative, DHSS would increase its capacity to appropriately collect and share health information among providers and analyze health data to improve outcomes and decrease costs. This initiative would increase the utility of Alaska's existing Health Information Exchange by connecting Alaska's hospitals, Emergency Departments and community based providers, and integrating the Prescription Drug Monitoring Program database. This initiative also proposes contracting with an advanced data analytics contractor to provide program‐level data analysis to DHSS and providers to drive quality improvement and cost containment. These improvements are foundational to support health reform efforts: to connect and coordinate care and to increase capacity to analyze program‐level data to improve outcomes and contain costs for Alaska Medicaid.
Initiative #4. Emergency Care Initiative This initiative is a private‐public partnership between DHSS, the Alaska State Hospital and Nursing Home Association and the Alaska Chapter of the American College of Emergency Physicians. This initiative proposes that Emergency Departments would use Alaska's Health Information Exchange, or a commercially available software package, to share necessary Medicaid enrollee patient data to improve patient care, reduce preventable Emergency Department use, and facilitate follow up with primary care and behavioral health providers. This initiative would increase appropriate service utilization, reduce costs for the Medicaid program, improve care for enrollees, and improve prescription monitoring to reduce opioid misuse.
The Emergency Care Initiative relies on the Information Technology infrastructure investments described in Initiative 3 and additionally proposes that DHSS pursue the authority to offer shared savings to support hospital efforts to drive down Emergency Department costs.
Initiative #5. Accountable Care Organizations Initiative: Shared Savings/Shared Losses Model The Accountable Care Organizations Initiative proposes that DHSS pilot value‐based payments for quality health care in regions by contracting with groups of providers who come together to form Accountable Care Organizations (ACO). An ACO is a group of health care providers that agrees to share responsibility for the cost and quality of health care for a defined patient population. In this model, a projection is established for the total cost of care and the ACO is eligible for a portion of the savings that results from improvements in health care delivery, if it also meets quality measures. If the total cost of care were exceeded, the ACO would be responsible for a portion of the overrun.
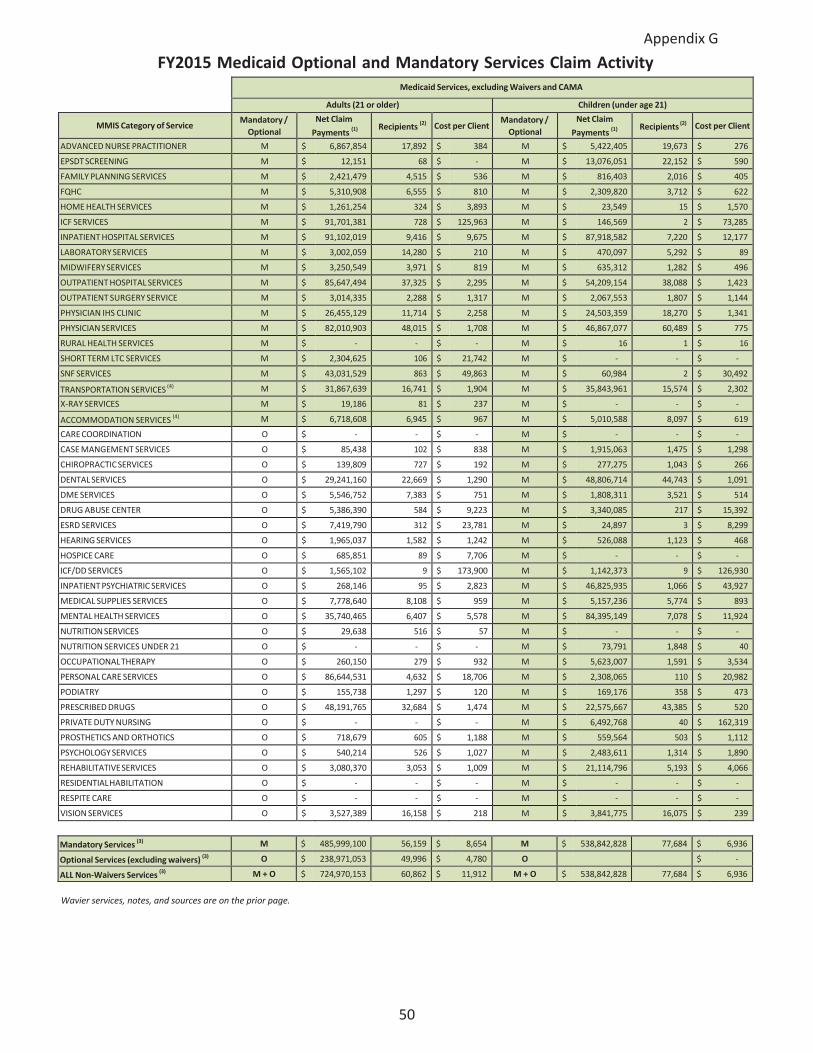
50
Appendix G
FY2015 Medicaid Optional and Mandatory Services Claim Activity
Medicaid Services, excluding Waivers and CAMA
Adults (21 or older) Children (under age 21)
MMIS Category of Service Mandatory /
Optional
Net Claim
Payments (1)
Recipients (2) Cost per ClientMandatory /
Optional
Net Claim
Payments (1) Recipients (2) Cost per Client
ADVANCED NURSE PRACTITIONER M $ 6,867,854 17,892 $ 384 M $ 5,422,405 19,673 $ 276
EPSDT SCREENING M $ 12,151 68 $ ‐ M $ 13,076,051 22,152 $ 590
FAMILY PLANNING SERVICES M $ 2,421,479 4,515 $ 536 M $ 816,403 2,016 $ 405
FQHC M $ 5,310,908 6,555 $ 810 M $ 2,309,820 3,712 $ 622
HOME HEALTH SERVICES M $ 1,261,254 324 $ 3,893 M $ 23,549 15 $ 1,570
ICF SERVICES M $ 91,701,381 728 $ 125,963 M $ 146,569 2 $ 73,285
INPATIENT HOSPITAL SERVICES M $ 91,102,019 9,416 $ 9,675 M $ 87,918,582 7,220 $ 12,177
LABORATORY SERVICES M $ 3,002,059 14,280 $ 210 M $ 470,097 5,292 $ 89
MIDWIFERY SERVICES M $ 3,250,549 3,971 $ 819 M $ 635,312 1,282 $ 496
OUTPATIENT HOSPITAL SERVICES M $ 85,647,494 37,325 $ 2,295 M $ 54,209,154 38,088 $ 1,423
OUTPATIENT SURGERY SERVICE M $ 3,014,335 2,288 $ 1,317 M $ 2,067,553 1,807 $ 1,144
PHYSICIAN IHS CLINIC M $ 26,455,129 11,714 $ 2,258 M $ 24,503,359 18,270 $ 1,341
PHYSICIAN SERVICES M $ 82,010,903 48,015 $ 1,708 M $ 46,867,077 60,489 $ 775
RURAL HEALTH SERVICES M $ ‐ ‐ $ ‐ M $ 16 1 $ 16
SHORT TERM LTC SERVICES M $ 2,304,625 106 $ 21,742 M $ ‐ ‐ $ ‐
SNF SERVICES M $ 43,031,529 863 $ 49,863 M $ 60,984 2 $ 30,492
TRANSPORTATION SERVICES (4) M $ 31,867,639 16,741 $ 1,904 M $ 35,843,961 15,574 $ 2,302
X‐RAY SERVICES M $ 19,186 81 $ 237 M $ ‐ ‐ $ ‐
ACCOMMODATION SERVICES (4) M $ 6,718,608 6,945 $ 967 M $ 5,010,588 8,097 $ 619
CARE COORDINATION O $ ‐ ‐ $ ‐ M $ ‐ ‐ $ ‐
CASE MANGEMENT SERVICES O $ 85,438 102 $ 838 M $ 1,915,063 1,475 $ 1,298
CHIROPRACTIC SERVICES O $ 139,809 727 $ 192 M $ 277,275 1,043 $ 266
DENTAL SERVICES O $ 29,241,160 22,669 $ 1,290 M $ 48,806,714 44,743 $ 1,091
DME SERVICES O $ 5,546,752 7,383 $ 751 M $ 1,808,311 3,521 $ 514
DRUG ABUSE CENTER O $ 5,386,390 584 $ 9,223 M $ 3,340,085 217 $ 15,392
ESRD SERVICES O $ 7,419,790 312 $ 23,781 M $ 24,897 3 $ 8,299
HEARING SERVICES O $ 1,965,037 1,582 $ 1,242 M $ 526,088 1,123 $ 468
HOSPICE CARE O $ 685,851 89 $ 7,706 M $ ‐ ‐ $ ‐
ICF/DD SERVICES O $ 1,565,102 9 $ 173,900 M $ 1,142,373 9 $ 126,930
INPATIENT PSYCHIATRIC SERVICES O $ 268,146 95 $ 2,823 M $ 46,825,935 1,066 $ 43,927
MEDICAL SUPPLIES SERVICES O $ 7,778,640 8,108 $ 959 M $ 5,157,236 5,774 $ 893
MENTAL HEALTH SERVICES O $ 35,740,465 6,407 $ 5,578 M $ 84,395,149 7,078 $ 11,924
NUTRITION SERVICES O $ 29,638 516 $ 57 M $ ‐ ‐ $ ‐
NUTRITION SERVICES UNDER 21 O $ ‐ ‐ $ ‐ M $ 73,791 1,848 $ 40
OCCUPATIONAL THERAPY O $ 260,150 279 $ 932 M $ 5,623,007 1,591 $ 3,534
PERSONAL CARE SERVICES O $ 86,644,531 4,632 $ 18,706 M $ 2,308,065 110 $ 20,982
PODIATRY O $ 155,738 1,297 $ 120 M $ 169,176 358 $ 473
PRESCRIBED DRUGS O $ 48,191,765 32,684 $ 1,474 M $ 22,575,667 43,385 $ 520
PRIVATE DUTY NURSING O $ ‐ ‐ $ ‐ M $ 6,492,768 40 $ 162,319
PROSTHETICS AND ORTHOTICS O $ 718,679 605 $ 1,188 M $ 559,564 503 $ 1,112
PSYCHOLOGY SERVICES O $ 540,214 526 $ 1,027 M $ 2,483,611 1,314 $ 1,890
REHABILITATIVE SERVICES O $ 3,080,370 3,053 $ 1,009 M $ 21,114,796 5,193 $ 4,066
RESIDENTIAL HABILITATION O $ ‐ ‐ $ ‐ M $ ‐ ‐ $ ‐
RESPITE CARE O $ ‐ ‐ $ ‐ M $ ‐ ‐ $ ‐
VISION SERVICES O $ 3,527,389 16,158 $ 218 M $ 3,841,775 16,075 $ 239
Mandatory Services (3) M $ 485,999,100 56,159 $ 8,654 M $ 538,842,828 77,684 $ 6,936
Optional Services (excluding waivers) (3) O $ 238,971,053 49,996 $ 4,780 O $ ‐
ALL Non‐Waivers Services (3) M + O $ 724,970,153 60,862 $ 11,912 M + O $ 538,842,828 77,684 $ 6,936
Wavier services, notes, and sources are on the prior page.
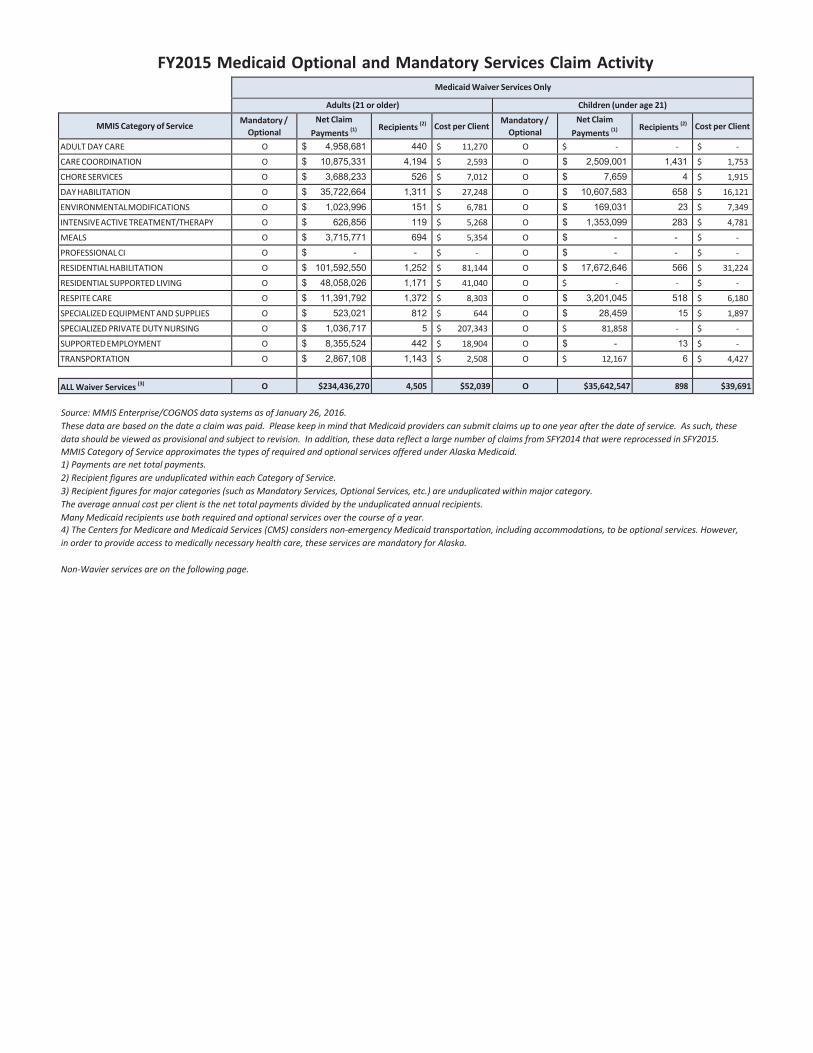
FY2015 Medicaid Optional and Mandatory Services Claim Activity
Medicaid Waiver Services Only
Adults (21 or older) Children (under age 21)
MMIS Category of Service Mandatory /
Optional
Net Claim
Payments (1)
Recipients (2) Cost per ClientMandatory /
Optional
Net Claim
Payments (1) Recipients (2) Cost per Client
ADULT DAY CARE O $ 4,958,681 440 $ 11,270 O $ ‐ ‐ $ ‐
CARE COORDINATION O $ 10,875,331 4,194 $ 2,593 O $ 2,509,001 1,431 $ 1,753
CHORE SERVICES O $ 3,688,233 526 $ 7,012 O $ 7,659 4 $ 1,915
DAY HABILITATION O $ 35,722,664 1,311 $ 27,248 O $ 10,607,583 658 $ 16,121
ENVIRONMENTAL MODIFICATIONS O $ 1,023,996 151 $ 6,781 O $ 169,031 23 $ 7,349
INTENSIVE ACTIVE TREATMENT/THERAPY O $ 626,856 119 $ 5,268 O $ 1,353,099 283 $ 4,781
MEALS O $ 3,715,771 694 $ 5,354 O $ - - $ ‐
PROFESSIONAL CI O $ - - $ ‐ O $ - - $ ‐
RESIDENTIAL HABILITATION O $ 101,592,550 1,252 $ 81,144 O $ 17,672,646 566 $ 31,224
RESIDENTIAL SUPPORTED LIVING O $ 48,058,026 1,171 $ 41,040 O $ ‐ ‐ $ ‐
RESPITE CARE O $ 11,391,792 1,372 $ 8,303 O $ 3,201,045 518 $ 6,180
SPECIALIZED EQUIPMENT AND SUPPLIES O $ 523,021 812 $ 644 O $ 28,459 15 $ 1,897
SPECIALIZED PRIVATE DUTY NURSING O $ 1,036,717 5 $ 207,343 O $ 81,858 ‐ $ ‐
SUPPORTED EMPLOYMENT O $ 8,355,524 442 $ 18,904 O $ - 13 $ ‐
TRANSPORTATION O $ 2,867,108 1,143 $ 2,508 O $ 12,167 6 $ 4,427
ALL Waiver Services (3) O $234,436,270 4,505 $52,039 O $35,642,547 898 $39,691
Source: MMIS Enterprise/COGNOS data systems as of January 26, 2016.
These data are based on the date a claim was paid. Please keep in mind that Medicaid providers can submit claims up to one year after the date of service. As such, these
data should be viewed as provisional and subject to revision. In addition, these data reflect a large number of claims from SFY2014 that were reprocessed in SFY2015.
MMIS Category of Service approximates the types of required and optional services offered under Alaska Medicaid.
1) Payments are net total payments.
2) Recipient figures are unduplicated within each Category of Service. 3) Recipient figures for major categories (such as Mandatory Services, Optional Services, etc.) are unduplicated within major category.
The average annual cost per client is the net total payments divided by the unduplicated annual recipients.
Many Medicaid recipients use both required and optional services over the course of a year. 4) The Centers for Medicare and Medicaid Services (CMS) considers non‐emergency Medicaid transportation, including accommodations, to be optional services. However,
in order to provide access to medically necessary health care, these services are mandatory for Alaska.
Non‐Wavier services are on the following page.
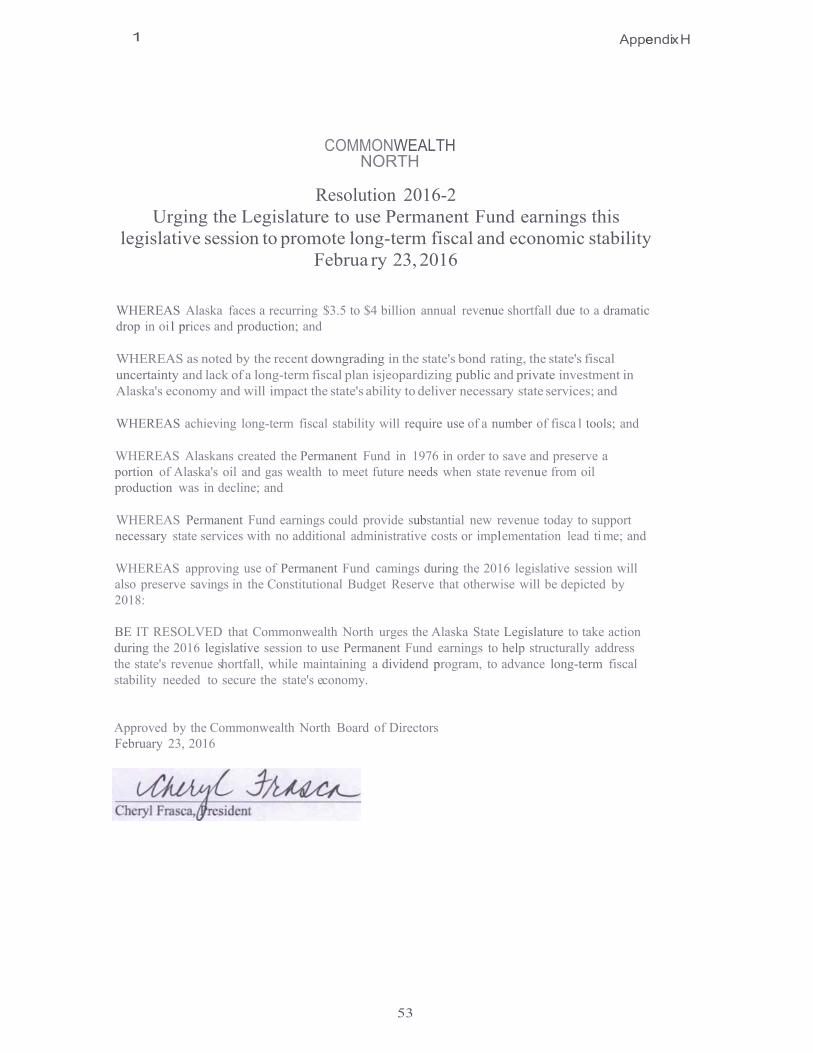
1 Appendix H
COMMONWEALTH
NORTH
Resolution 2016-2 Urging the Legislature to use Permanent Fund earnings this
legislative session to promote long-term fiscal and economic stability Februa ry 23, 2016
WHEREAS Alaska faces a recurring $3.5 to $4 billion annual revenue shortfall due to a dramatic drop in oi l prices and production; and
WHEREAS as noted by the recent downgrading in the state's bond rating, the state's fiscal uncertainty and lack of a long-term fiscal plan isjeopardizing public and private investment in Alaska's economy and will impact the state's ability to deliver necessary state services; and
WHEREAS achieving long-term fiscal stability will require use of a number of fisca l tools; and
WHEREAS Alaskans created the Permanent Fund in 1976 in order to save and preserve a portion of Alaska's oil and gas wealth to meet future needs when state revenue from oil production was in decline; and
WHEREAS Permanent Fund earnings could provide substantial new revenue today to support necessary state services with no additional administrative costs or implementation lead ti me; and
WHEREAS approving use of Permanent Fund camings during the 2016 legislative session will also preserve savings in the Constitutional Budget Reserve that otherwise will be depicted by 2018:
BE IT RESOLVED that Commonwealth North urges the Alaska State Legislature to take action during the 2016 legislative session to use Permanent Fund earnings to help structurally address the state's revenue shortfall, while maintaining a dividend program, to advance long-term fiscal stability needed to secure the state's economy.
Approved by the Commonwealth North Board of Directors February 23, 2016
53
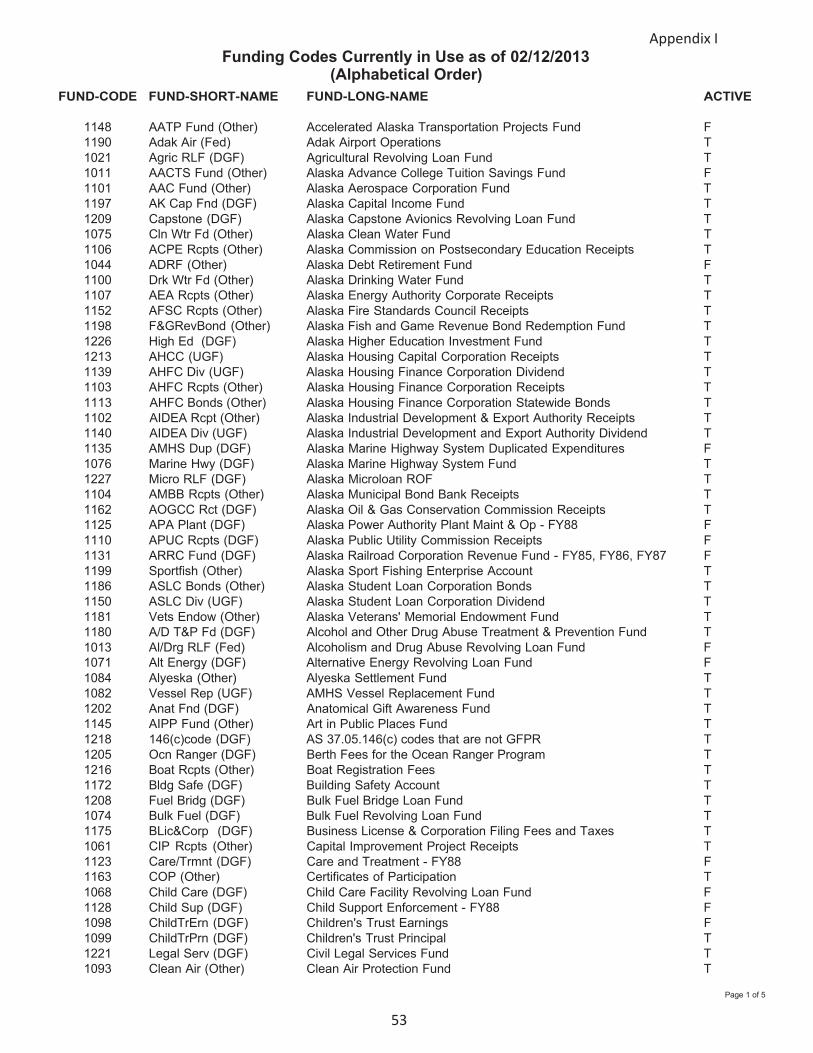
Funding Codes Currently in Use as of 02/12/2013
(Alphabetical Order)
Appendix I
FUND-CODE FUND-SHORT-NAME FUND-LONG-NAME ACTIVE
1148 AATP Fund (Other) Accelerated Alaska Transportation Projects Fund F 1190 Adak Air (Fed) Adak Airport Operations T 1021 Agric RLF (DGF) Agricultural Revolving Loan Fund T 1011 AACTS Fund (Other) Alaska Advance College Tuition Savings Fund F 1101 AAC Fund (Other) Alaska Aerospace Corporation Fund T 1197 AK Cap Fnd (DGF) Alaska Capital Income Fund T 1209 Capstone (DGF) Alaska Capstone Avionics Revolving Loan Fund T 1075 Cln Wtr Fd (Other) Alaska Clean Water Fund T 1106 ACPE Rcpts (Other) Alaska Commission on Postsecondary Education Receipts T 1044 ADRF (Other) Alaska Debt Retirement Fund F 1100 1107 1152 1198
Drk Wtr Fd (Other) AEA Rcpts (Other) AFSC Rcpts (Other) F&GRevBond (Other)
Alaska Drinking Water Fund T Alaska Energy Authority Corporate Receipts T Alaska Fire Standards Council Receipts T Alaska Fish and Game Revenue Bond Redemption Fund T
1226 High Ed (DGF) Alaska Higher Education Investment Fund T 1213 AHCC (UGF) Alaska Housing Capital Corporation Receipts T 1139 AHFC Div (UGF) Alaska Housing Finance Corporation Dividend T 1103 AHFC Rcpts (Other) Alaska Housing Finance Corporation Receipts T 1113 AHFC Bonds (Other) Alaska Housing Finance Corporation Statewide Bonds T 1102 AIDEA Rcpt (Other) Alaska Industrial Development & Export Authority Receipts T 1140 AIDEA Div (UGF) Alaska Industrial Development and Export Authority Dividend T 1135 AMHS Dup (DGF) Alaska Marine Highway System Duplicated Expenditures F 1076 Marine Hwy (DGF) Alaska Marine Highway System Fund T 1227 Micro RLF (DGF) Alaska Microloan ROF T 1104 1162
AMBB Rcpts (Other) AOGCC Rct (DGF)
Alaska Municipal Bond Bank Receipts T Alaska Oil & Gas Conservation Commission Receipts T
1125 APA Plant (DGF) Alaska Power Authority Plant Maint & Op - FY88 F 1110 APUC Rcpts (DGF) Alaska Public Utility Commission Receipts F 1131 ARRC Fund (DGF) Alaska Railroad Corporation Revenue Fund - FY85, FY86, FY87 F 1199 Sportfish (Other) Alaska Sport Fishing Enterprise Account T 1186 ASLC Bonds (Other) Alaska Student Loan Corporation Bonds T 1150 ASLC Div (UGF) Alaska Student Loan Corporation Dividend T 1181 Vets Endow (Other) Alaska Veterans' Memorial Endowment Fund T 1180 1013
A/D T&P Fd (DGF) Al/Drg RLF (Fed)
Alcohol and Other Drug Abuse Treatment & Prevention Fund T Alcoholism and Drug Abuse Revolving Loan Fund F
1071 Alt Energy (DGF) Alternative Energy Revolving Loan Fund F 1084 Alyeska (Other) Alyeska Settlement Fund T 1082 Vessel Rep (UGF) AMHS Vessel Replacement Fund T 1202 Anat Fnd (DGF) Anatomical Gift Awareness Fund T 1145 AIPP Fund (Other) Art in Public Places Fund T 1218 146(c)code (DGF) AS 37.05.146(c) codes that are not GFPR T 1205 1216
Ocn Ranger (DGF) Boat Rcpts (Other)
Berth Fees for the Ocean Ranger Program T Boat Registration Fees T
1172 Bldg Safe (DGF) Building Safety Account T 1208 Fuel Bridg (DGF) Bulk Fuel Bridge Loan Fund T 1074 Bulk Fuel (DGF) Bulk Fuel Revolving Loan Fund T 1175 1061 1123
BLic&Corp (DGF) CIP Rcpts (Other) Care/Trmnt (DGF)
Business License & Corporation Filing Fees and Taxes T Capital Improvement Project Receipts T Care and Treatment - FY88 F
1163 COP (Other) Certificates of Participation T 1068 Child Care (DGF) Child Care Facility Revolving Loan Fund F 1128 Child Sup (DGF) Child Support Enforcement - FY88 F 1098 1099
ChildTrErn (DGF) Children's Trust Earnings F ChildTrPrn (DGF) Children's Trust Principal T
1221 Legal Serv (DGF) Civil Legal Services Fund T 1093 Clean Air (Other) Clean Air Protection Fund T
Page 1 of 5
53
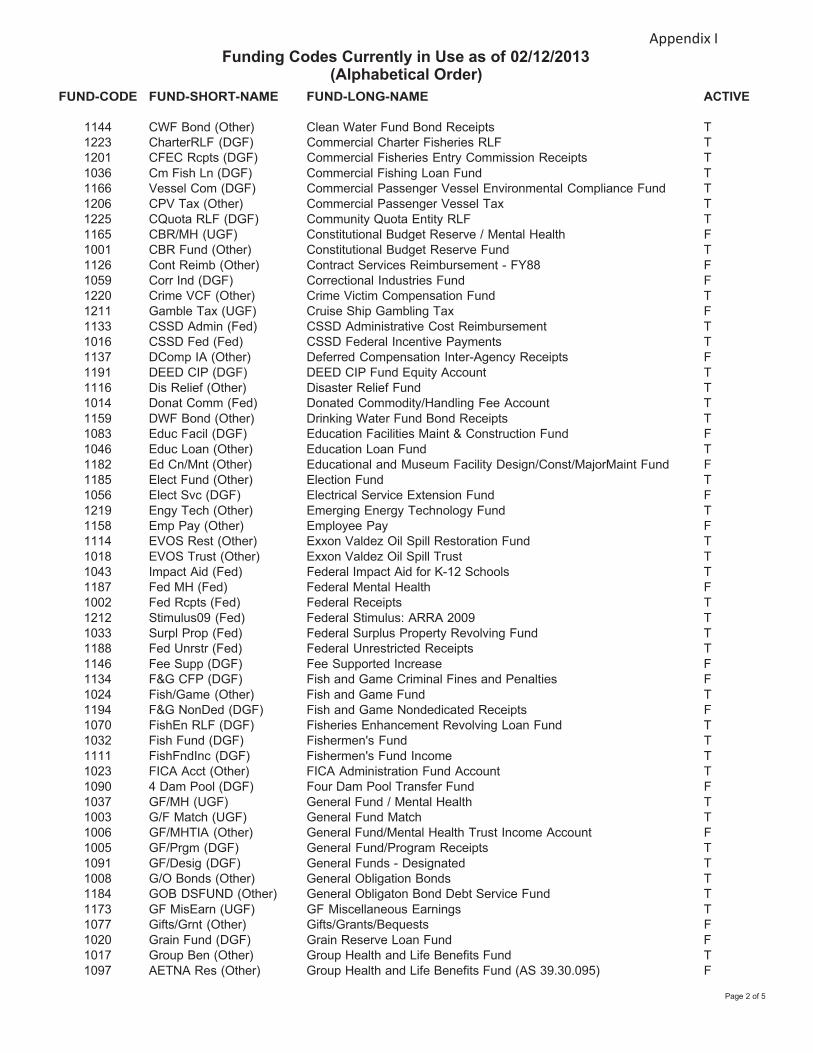
Page 2 of 5
Funding Codes Currently in Use as of 02/12/2013
(Alphabetical Order)
Appendix I
FUND-CODE
1144
FUND-SHORT-NAME CWF Bond (Other)
FUND-LONG-NAME
Clean Water Fund Bond Receipts
ACTIVE
T 1223 CharterRLF (DGF) Commercial Charter Fisheries RLF T 1201 CFEC Rcpts (DGF) Commercial Fisheries Entry Commission Receipts T 1036 Cm Fish Ln (DGF) Commercial Fishing Loan Fund T 1166 Vessel Com (DGF) Commercial Passenger Vessel Environmental Compliance Fund T 1206 CPV Tax (Other) Commercial Passenger Vessel Tax T 1225 CQuota RLF (DGF) Community Quota Entity RLF T 1165 CBR/MH (UGF) Constitutional Budget Reserve / Mental Health F 1001 CBR Fund (Other) Constitutional Budget Reserve Fund T 1126 Cont Reimb (Other) Contract Services Reimbursement - FY88 F 1059 Corr Ind (DGF) Correctional Industries Fund F 1220 Crime VCF (Other) Crime Victim Compensation Fund T 1211 Gamble Tax (UGF) Cruise Ship Gambling Tax F 1133 CSSD Admin (Fed) CSSD Administrative Cost Reimbursement T 1016 CSSD Fed (Fed) CSSD Federal Incentive Payments T 1137 DComp IA (Other) Deferred Compensation Inter-Agency Receipts F 1191 DEED CIP (DGF) DEED CIP Fund Equity Account T 1116 Dis Relief (Other) Disaster Relief Fund T 1014 Donat Comm (Fed) Donated Commodity/Handling Fee Account T 1159 DWF Bond (Other) Drinking Water Fund Bond Receipts T 1083 Educ Facil (DGF) Education Facilities Maint & Construction Fund F 1046 Educ Loan (Other) Education Loan Fund T 1182 Ed Cn/Mnt (Other) Educational and Museum Facility Design/Const/MajorMaint Fund F 1185 Elect Fund (Other) Election Fund T 1056 Elect Svc (DGF) Electrical Service Extension Fund F 1219 Engy Tech (Other) Emerging Energy Technology Fund T 1158 Emp Pay (Other) Employee Pay F 1114 EVOS Rest (Other) Exxon Valdez Oil Spill Restoration Fund T 1018 EVOS Trust (Other) Exxon Valdez Oil Spill Trust T 1043 Impact Aid (Fed) Federal Impact Aid for K-12 Schools T 1187 Fed MH (Fed) Federal Mental Health F 1002 Fed Rcpts (Fed) Federal Receipts T 1212 Stimulus09 (Fed) Federal Stimulus: ARRA 2009 T 1033 Surpl Prop (Fed) Federal Surplus Property Revolving Fund T 1188 Fed Unrstr (Fed) Federal Unrestricted Receipts T 1146 Fee Supp (DGF) Fee Supported Increase F 1134 F&G CFP (DGF) Fish and Game Criminal Fines and Penalties F 1024 Fish/Game (Other) Fish and Game Fund T 1194 F&G NonDed (DGF) Fish and Game Nondedicated Receipts F 1070 FishEn RLF (DGF) Fisheries Enhancement Revolving Loan Fund T 1032 Fish Fund (DGF) Fishermen's Fund T 1111 FishFndInc (DGF) Fishermen's Fund Income T 1023 FICA Acct (Other) FICA Administration Fund Account T 1090 4 Dam Pool (DGF) Four Dam Pool Transfer Fund F 1037 GF/MH (UGF) General Fund / Mental Health T 1003 G/F Match (UGF) General Fund Match T 1006 GF/MHTIA (Other) General Fund/Mental Health Trust Income Account F 1005 GF/Prgm (DGF) General Fund/Program Receipts T 1091 GF/Desig (DGF) General Funds - Designated T 1008 G/O Bonds (Other) General Obligation Bonds T 1184 GOB DSFUND (Other) General Obligaton Bond Debt Service Fund T 1173 GF MisEarn (UGF) GF Miscellaneous Earnings T 1077 Gifts/Grnt (Other) Gifts/Grants/Bequests F 1020 Grain Fund (DGF) Grain Reserve Loan Fund F 1017 Group Ben (Other) Group Health and Life Benefits Fund T 1097 AETNA Res (Other) Group Health and Life Benefits Fund (AS 39.30.095) F
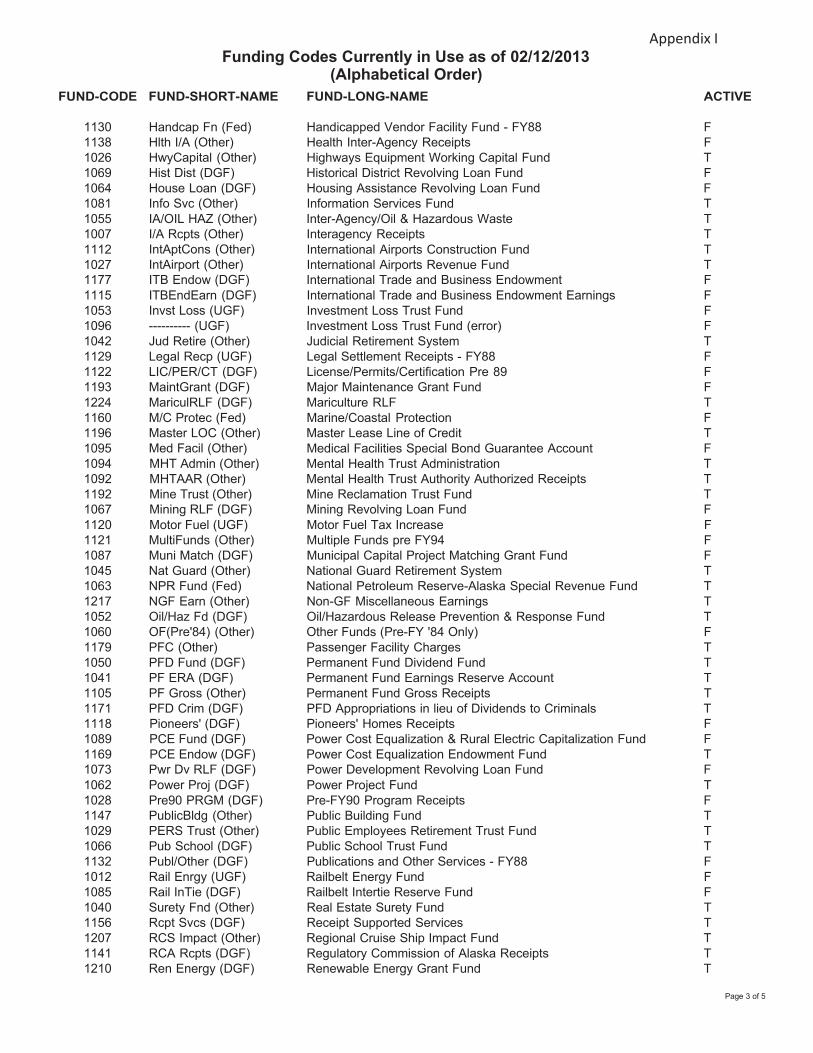
Page 3 of 5
Funding Codes Currently in Use as of 02/12/2013
(Alphabetical Order)
Appendix I
FUND-CODE FUND-SHORT-NAME FUND-LONG-NAME ACTIVE
1130 1138 1026
Handcap Fn (Fed) Hlth I/A (Other) HwyCapital (Other)
Handicapped Vendor Facility Fund - FY88 F Health Inter-Agency Receipts F Highways Equipment Working Capital Fund T
1069 Hist Dist (DGF) Historical District Revolving Loan Fund F 1064 House Loan (DGF) Housing Assistance Revolving Loan Fund F 1081 Info Svc (Other) Information Services Fund T 1055 IA/OIL HAZ (Other) Inter-Agency/Oil & Hazardous Waste T 1007 I/A Rcpts (Other) Interagency Receipts T 1112 1027
IntAptCons (Other) IntAirport (Other)
International Airports Construction Fund T International Airports Revenue Fund T
1177 ITB Endow (DGF) International Trade and Business Endowment F 1115 1053
ITBEndEarn (DGF) Invst Loss (UGF)
International Trade and Business Endowment Earnings F Investment Loss Trust Fund F
1096 ---------- (UGF) Investment Loss Trust Fund (error) F 1042 1129
Jud Retire (Other) Legal Recp (UGF)
Judicial Retirement System T Legal Settlement Receipts - FY88 F
1122 LIC/PER/CT (DGF) License/Permits/Certification Pre 89 F 1193 MaintGrant (DGF) Major Maintenance Grant Fund F 1224 MariculRLF (DGF) Mariculture RLF T 1160 M/C Protec (Fed) Marine/Coastal Protection F 1196 Master LOC (Other) Master Lease Line of Credit T 1095 Med Facil (Other) Medical Facilities Special Bond Guarantee Account F 1094 MHT Admin (Other) Mental Health Trust Administration T 1092 MHTAAR (Other) Mental Health Trust Authority Authorized Receipts T 1192 Mine Trust (Other) Mine Reclamation Trust Fund T 1067 Mining RLF (DGF) Mining Revolving Loan Fund F 1120 Motor Fuel (UGF) Motor Fuel Tax Increase F 1121 MultiFunds (Other) Multiple Funds pre FY94 F 1087 Muni Match (DGF) Municipal Capital Project Matching Grant Fund F 1045 Nat Guard (Other) National Guard Retirement System T 1063 NPR Fund (Fed) National Petroleum Reserve-Alaska Special Revenue Fund T 1217 NGF Earn (Other) Non-GF Miscellaneous Earnings T 1052 Oil/Haz Fd (DGF) Oil/Hazardous Release Prevention & Response Fund T 1060 OF(Pre'84) (Other) Other Funds (Pre-FY '84 Only) F 1179 PFC (Other) Passenger Facility Charges T 1050 PFD Fund (DGF) Permanent Fund Dividend Fund T 1041 PF ERA (DGF) Permanent Fund Earnings Reserve Account T 1105 PF Gross (Other) Permanent Fund Gross Receipts T 1171 PFD Crim (DGF) PFD Appropriations in lieu of Dividends to Criminals T 1118 Pioneers' (DGF) Pioneers' Homes Receipts F 1089 PCE Fund (DGF) Power Cost Equalization & Rural Electric Capitalization Fund F 1169 PCE Endow (DGF) Power Cost Equalization Endowment Fund T 1073 1062
Pwr Dv RLF (DGF) Power Proj (DGF)
Power Development Revolving Loan Fund F Power Project Fund T
1028 Pre90 PRGM (DGF) Pre-FY90 Program Receipts F 1147 PublicBldg (Other) Public Building Fund T 1029 PERS Trust (Other) Public Employees Retirement Trust Fund T 1066 Pub School (DGF) Public School Trust Fund T 1132 Publ/Other (DGF) Publications and Other Services - FY88 F 1012 1085
Rail Enrgy (UGF) Railbelt Energy Fund F Rail InTie (DGF) Railbelt Intertie Reserve Fund F
1040 1156
Surety Fnd (Other) Rcpt Svcs (DGF)
Real Estate Surety Fund T Receipt Supported Services T
1207 RCS Impact (Other) Regional Cruise Ship Impact Fund T 1141 1210
RCA Rcpts (DGF) Ren Energy (DGF)
Regulatory Commission of Alaska Receipts T Renewable Energy Grant Fund T
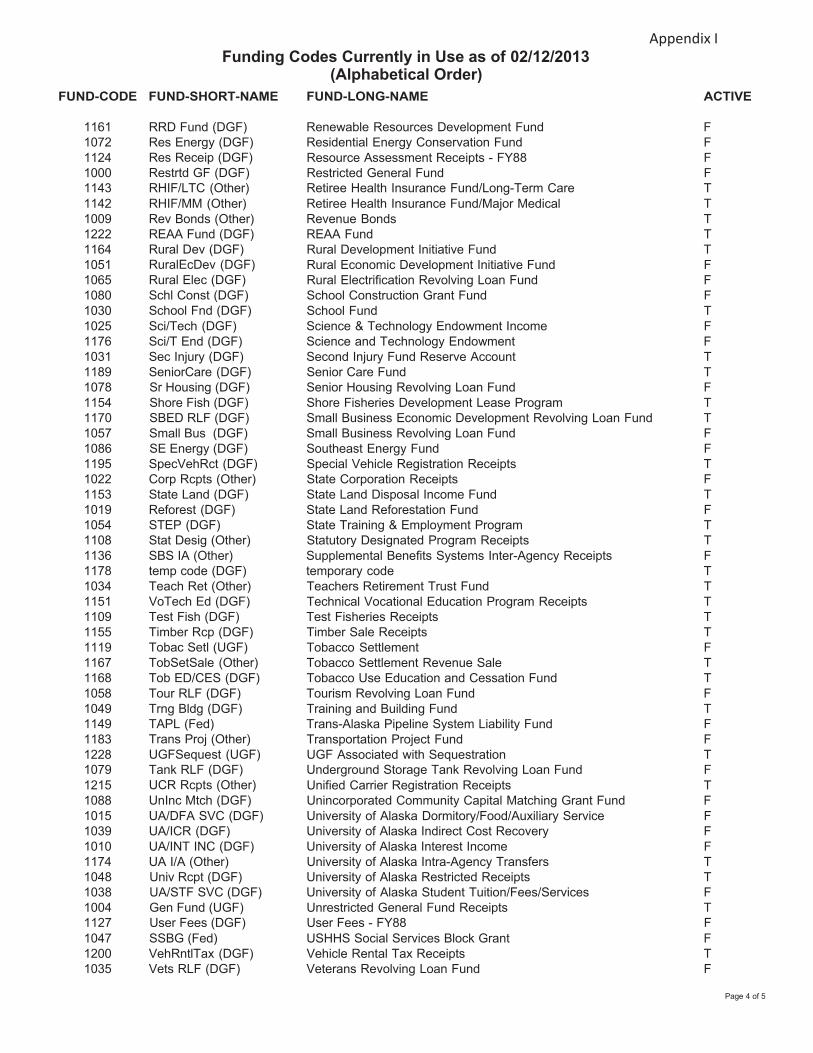
Page 4 of 5
Funding Codes Currently in Use as of 02/12/2013
(Alphabetical Order)
Appendix I
FUND-CODE FUND-SHORT-NAME FUND-LONG-NAME ACTIVE
1161 RRD Fund (DGF) Renewable Resources Development Fund F 1072 Res Energy (DGF) Residential Energy Conservation Fund F 1124 1000
Res Receip (DGF) Restrtd GF (DGF)
Resource Assessment Receipts - FY88 F Restricted General Fund F
1143 RHIF/LTC (Other) Retiree Health Insurance Fund/Long-Term Care T 1142 RHIF/MM (Other) Retiree Health Insurance Fund/Major Medical T 1009 Rev Bonds (Other) Revenue Bonds T 1222 REAA Fund (DGF) REAA Fund T 1164 1051 1065 1080 1030
Rural Dev (DGF) RuralEcDev (DGF) Rural Elec (DGF) Schl Const (DGF) School Fnd (DGF)
Rural Development Initiative Fund T Rural Economic Development Initiative Fund F Rural Electrification Revolving Loan Fund F School Construction Grant Fund F School Fund T
1025 Sci/Tech (DGF) Science & Technology Endowment Income F 1176 Sci/T End (DGF) Science and Technology Endowment F 1031 Sec Injury (DGF) Second Injury Fund Reserve Account T 1189 SeniorCare (DGF) Senior Care Fund T 1078 Sr Housing (DGF) Senior Housing Revolving Loan Fund F 1154 Shore Fish (DGF) Shore Fisheries Development Lease Program T 1170 SBED RLF (DGF) Small Business Economic Development Revolving Loan Fund T 1057 Small Bus (DGF) Small Business Revolving Loan Fund F 1086 SE Energy (DGF) Southeast Energy Fund F 1195 1022
SpecVehRct (DGF) Corp Rcpts (Other)
Special Vehicle Registration Receipts T State Corporation Receipts F
1153 State Land (DGF) State Land Disposal Income Fund T 1019 Reforest (DGF) State Land Reforestation Fund F 1054 STEP (DGF) State Training & Employment Program T 1108 Stat Desig (Other) Statutory Designated Program Receipts T 1136 SBS IA (Other) Supplemental Benefits Systems Inter-Agency Receipts F 1178 temp code (DGF) temporary code T 1034 1151
Teach Ret (Other) VoTech Ed (DGF)
Teachers Retirement Trust Fund T Technical Vocational Education Program Receipts T
1109 Test Fish (DGF) Test Fisheries Receipts T 1155 1119 1167 1168
Timber Rcp (DGF) Tobac Setl (UGF) TobSetSale (Other) Tob ED/CES (DGF)
Timber Sale Receipts T Tobacco Settlement F Tobacco Settlement Revenue Sale T Tobacco Use Education and Cessation Fund T
1058 Tour RLF (DGF) Tourism Revolving Loan Fund F 1049 Trng Bldg (DGF) Training and Building Fund T 1149 TAPL (Fed) Trans-Alaska Pipeline System Liability Fund F 1183 1228
Trans Proj (Other) UGFSequest (UGF)
Transportation Project Fund F UGF Associated with Sequestration T
1079 Tank RLF (DGF) Underground Storage Tank Revolving Loan Fund F 1215 1088
UCR Rcpts (Other) UnInc Mtch (DGF)
Unified Carrier Registration Receipts T Unincorporated Community Capital Matching Grant Fund F
1015 UA/DFA SVC (DGF) University of Alaska Dormitory/Food/Auxiliary Service F 1039 UA/ICR (DGF) University of Alaska Indirect Cost Recovery F 1010 UA/INT INC (DGF) University of Alaska Interest Income F 1174 UA I/A (Other) University of Alaska Intra-Agency Transfers T 1048 Univ Rcpt (DGF) University of Alaska Restricted Receipts T 1038 UA/STF SVC (DGF) University of Alaska Student Tuition/Fees/Services F 1004 Gen Fund (UGF) Unrestricted General Fund Receipts T 1127 User Fees (DGF) User Fees - FY88 F 1047 SSBG (Fed) USHHS Social Services Block Grant F 1200 VehRntlTax (DGF) Vehicle Rental Tax Receipts T 1035 Vets RLF (DGF) Veterans Revolving Loan Fund F
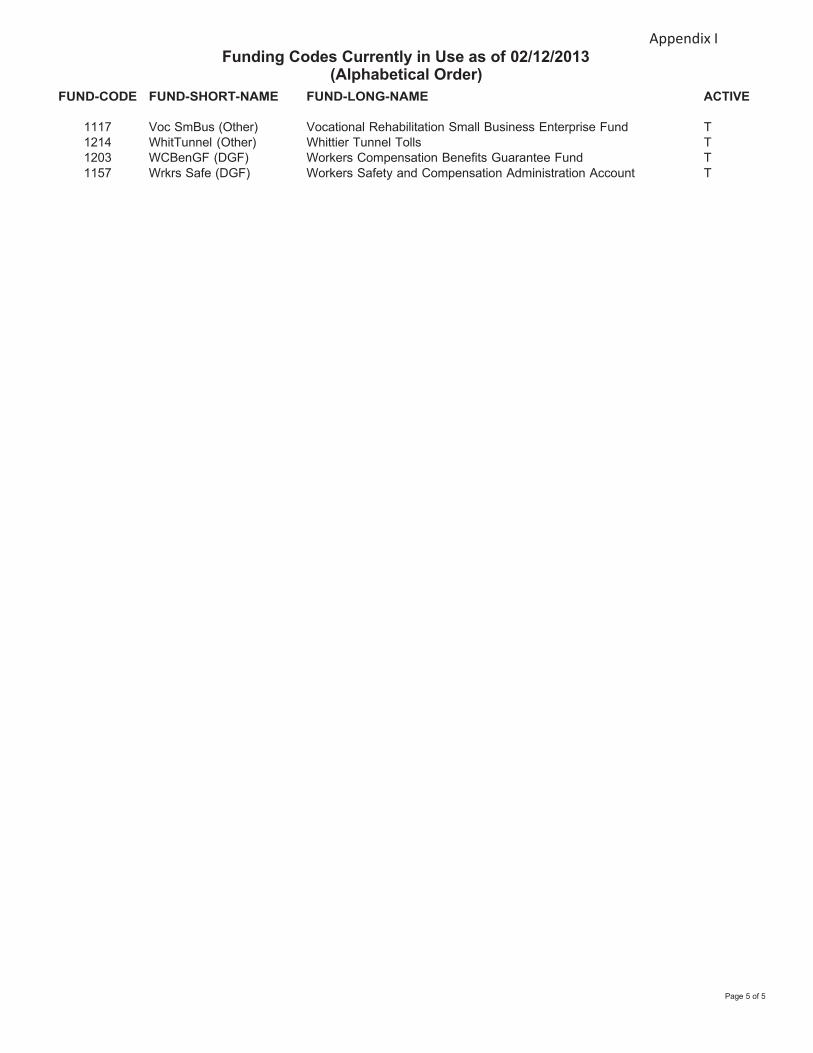
Page 5 of 5
Funding Codes Currently in Use as of 02/12/2013
(Alphabetical Order)
Appendix I
FUND-CODE FUND-SHORT-NAME FUND-LONG-NAME ACTIVE
1117 Voc SmBus (Other) Vocational Rehabilitation Small Business Enterprise Fund T 1214 WhitTunnel (Other) Whittier Tunnel Tolls T 1203 WCBenGF (DGF) Workers Compensation Benefits Guarantee Fund T 1157 Wrkrs Safe (DGF) Workers Safety and Compensation Administration Account T
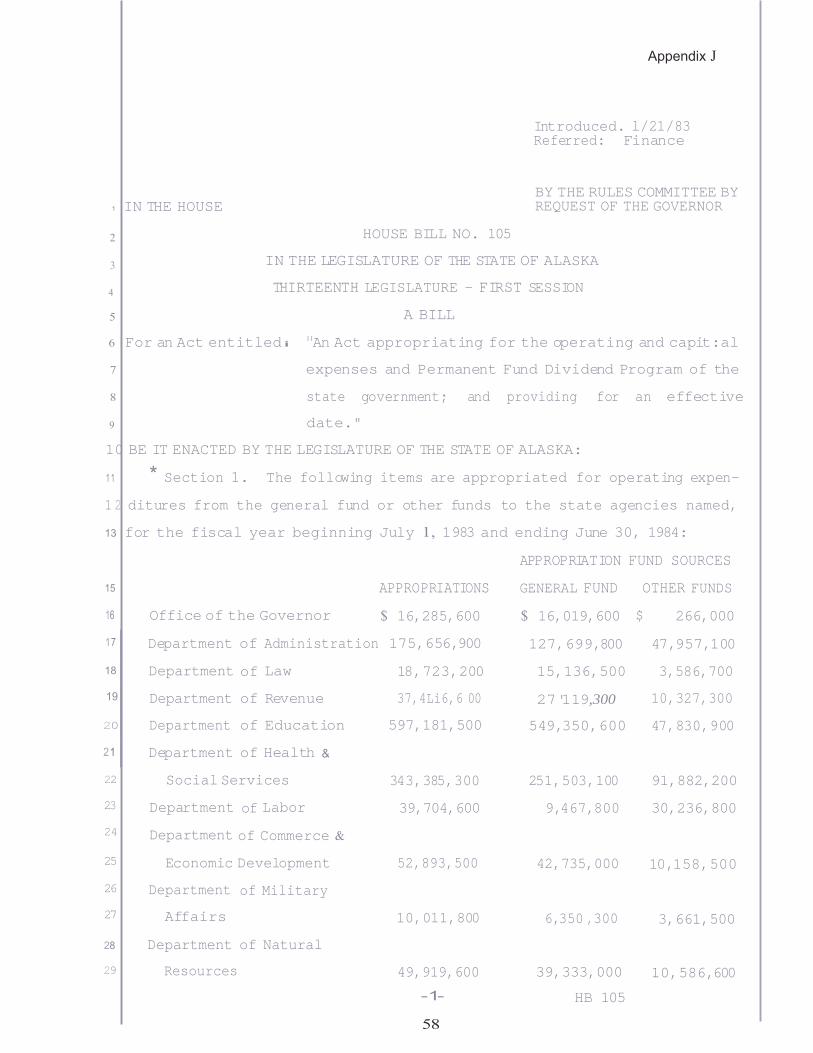
Appendix J
Introduced. l/21/83 Referred: Finance
1 IN THE HOUSE
2
HOUSE BILL NO. 105
BY THE RULES COMMITTEE BY REQUEST OF THE GOVERNOR
3 IN THE LEGISLATURE OF THE STATE OF ALASKA
4 THIRTEENTH LEGISLATURE - FIRST SESSION
5 A BILL
6 For an Act entitled i 11An Act appropriating for the operating and capit:al
7 expenses and Permanent Fund Dividend Program of the
8 state government; and providing for an effective
9 date."
10 BE IT ENACTED BY THE LEGISLATURE OF THE STATE OF ALASKA:
1 1 * Section 1. The following items are appropriated for operating expen-
1 2 ditures from the general fund or other funds to the state agencies named,
13 for the fiscal year beginning July 1, 1983 and ending June 30, 1984:
APPROPRIATION FUND SOURCES
15 APPROPRIATIONS GENERAL FUND OTHER FUNDS
16 Office of the Governor $ 16,285,600 $ 16,019,600 $ 266,000
17 Department of Administration 175,656,900 127,699,800 47,957,100
18 Department of Law 18,723,200 15,136,500 3,586,700
19 Department of Revenue 37,4Li6,6 00 27 '119,300 10,327,300
20 Department of Education 597,181,500 549,350,600 47,830,900
2 1 Department of Health &
22 Social Services
23 Department of Labor
24 Department of Commerce &
343,385,300
39,704,600
251,503,100
9,467,800
91,882,200
30,236,800
25 Economic Development
26 Department of Military
27 Affairs
52,893,500 42,735,000 10,011,800 6,350 ,300
10,158,500
3,661,500
28 Department of Natural
29 Resources 49,919,600
-1-
58
39,333,000
HB 105
10,586,600
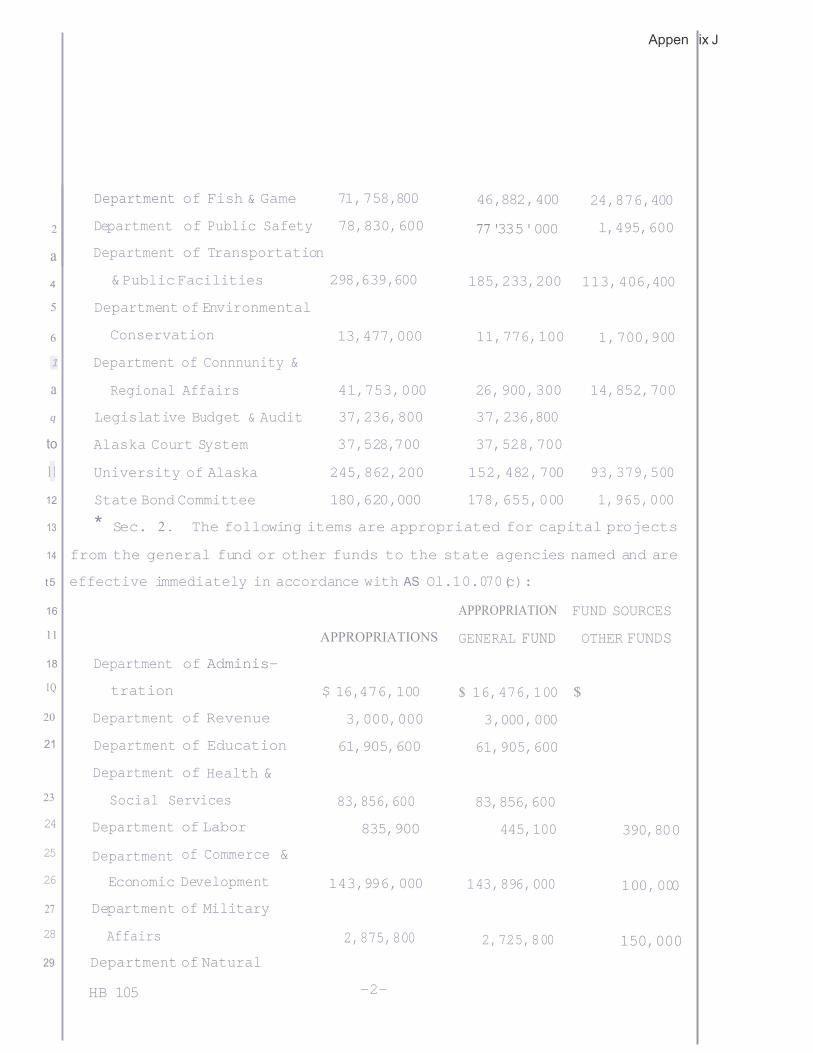
Appen ix J Department of Fish & Game 71,758,800 46,882,400 24,876,400
2
a
Department
Department
of
of
Public Safety
Transportation
78,830,600 77 '335'000 l,495,600
4 & Public Facilities 298,639,600 185,233,200 113,406,400
5 Department of Environmental
6 Conservation 13,477,000 11,776,100 1,700,900
1 Department of Connnunity &
a Regional Affairs 41,753,000 26,900,300 14,852,700
q Legislative Budget & Audit 37,236,800 37,236,800
to Alaska Court System 37,528,700 37,528,700
1 1 University of Alaska 245,862,200 152,482,700 93,379,500
12 State Bond Committee 180,620,000 178,655,000 1,965,000
13 * Sec. 2 . The following items are appropriated for capital projects
14 from the general fund or other funds to the state agencies named and are
t 5 effective immediately in accordance with AS Ol.10.070(c):
0
0
28 Affairs 2,875,800 2,725,800 150,000 29 Department of Natural
HB 105 -2-
16 APPROPRIATION FUND SOURCES
11 APPROPRIATIONS GENERAL FUND OTHER FUNDS
18 Department of Adminis-
I Q tration $ 16,476,100 $ 16,476,100 $
20 Department of Revenue 3,000,000 3,000,000
21 Department of Education 61,905,600 61,905,600
Department of Health &
23 Social Services 83,856,600 83,856,600 24 Department
25 Department
of Labor
of Commerce
&
835,900 445,100 390,80
26 Economic Development 143,996,000 143,896,000 100,00
27 Department of Military
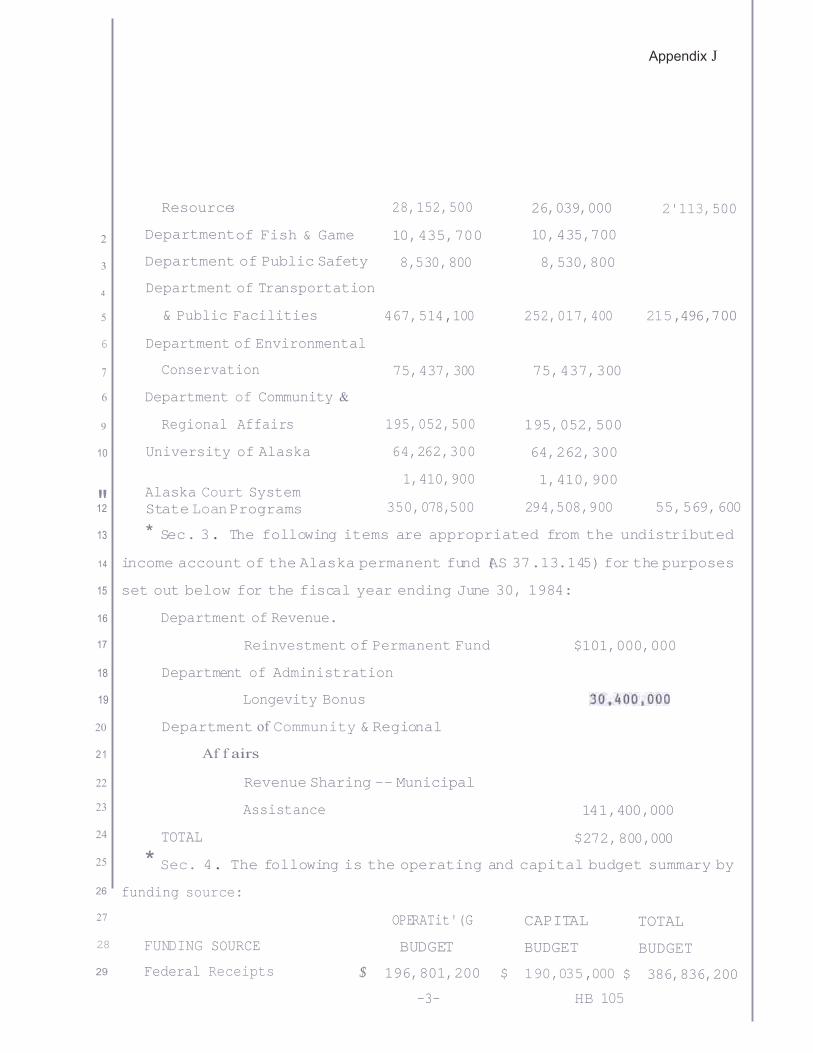
Appendix J
Resource
2 Department
3 Department of Public Safety
4 Department of Transportation
8,530,800
8,530,800
5 & Public Facilities 467,514,100 252,017,400 215,496,700
6 Department of Environmental
7 Conservation 75,437,300 75,437,300
6 Department of Community &
9 Regional Affairs
10 University of Alaska
" Alaska Court System 12 State Loan Programs
195,052,500
64,262,300
1,410,900
350,078,500
195,052,500
64,262,300
1,410,900
294,508,900 55,569,600
13 * Sec. 3. The following items are appropriated from the undistributed
1 4 income account of the Alaska permanent fund (AS 37.13.145) for the purposes
15 set out below for the fiscal year ending June 30, 1984:
16 Department of Revenue.
17 Reinvestment of Permanent Fund $101,000,000
18 Department of Administration
19 Longevity Bonus
20 Department of Community & Regional
2 1 Af f airs
22 Revenue Sharing -- Municipal
23
24 TOTAL
Assistance 141,400,000
$272,800,000
25 * Sec. 4 . The following is the operating and capital budget summary by 26 funding source:
27 OPERATit'(G CAPITAL TOTAL 28 29
FUNDING SOURCE
Federal Receipts
BUDGET
$ 196,801,200
BUDGET
$ 190,035,000
BUDGET
$ 386,836,200
-3- HB 105
s 28,152,500 26,039,000 2'113,500
of Fish & Game 10,435,700 10,435,700
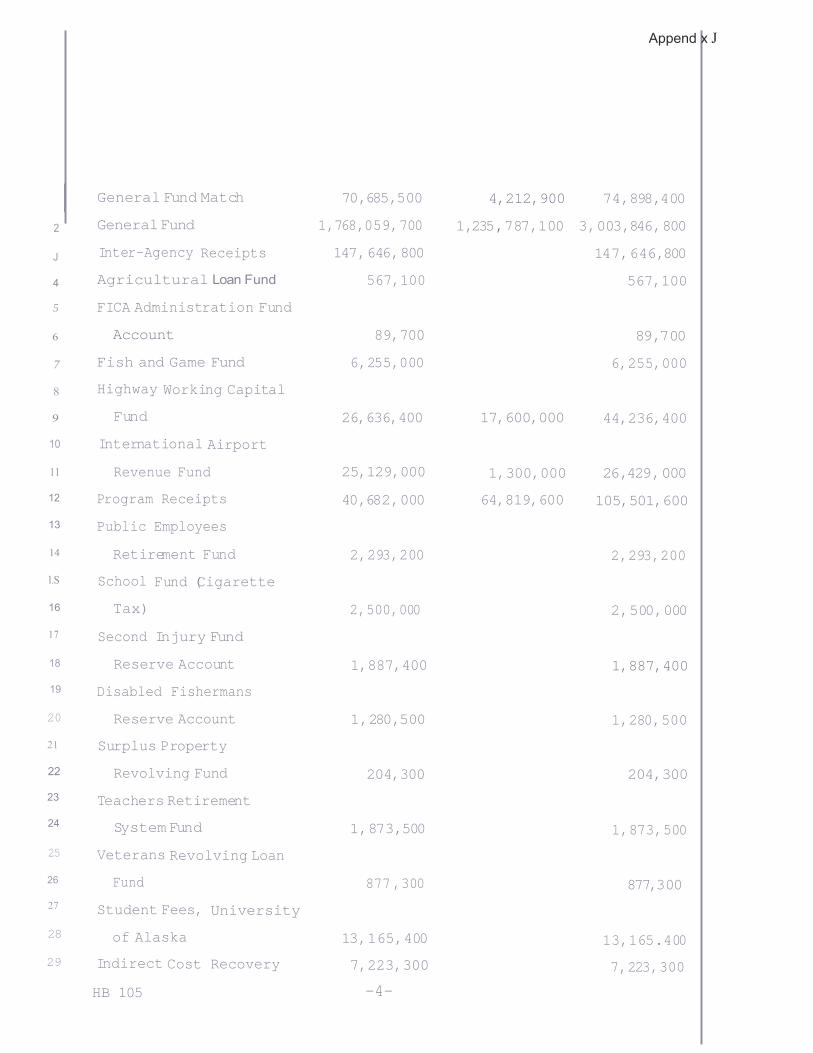
Append x J
2
J
4
General Fund Match 70,685,500 4,212,900 74,898,400
General Fund 1,768,059,700 1,235,787,100 3,003,846,800
Inter-Agency Receipts 147,646,800 147,646,800
Agricultural Loan Fund 567,100 567,100
5 FICA Administration Fund
6 Account 89,700 89,700
7 Fish and Game Fund 6,255,000 6,255,000
8 Highway Working Capital
9 Fund 26,636,400 17,600,000 44,236,400
10 International Airport
11 Revenue Fund 25,129,000 1,300,000 26,429,000
12 Program Receipts 40,682,000 64,819,600 105,501,600
13 Public Employees
14 Retirement Fund 2,293,200 2,293,200
l.S School Fund (Cigarette
16 Tax) 2,500,000 2,500,000
17 Second Injury Fund
18 Reserve Account 1,887,400 1,887,400
19 Disabled Fishermans
20 Reserve Account 1,280,500 1,280,500
21 Surplus Property
22 Revolving Fund 204,300 204,300
23 Teachers Retirement
24 System Fund 1,873,500 1,873,500
25 Veterans Revolving Loan
26 Fund 877 ,300 877,300 27
28
29
Student Fees, University
of Alaska 13,165,400 13,165.400
Indirect Cost Recovery 7,223,300 7,223,300
HB 105 -4-
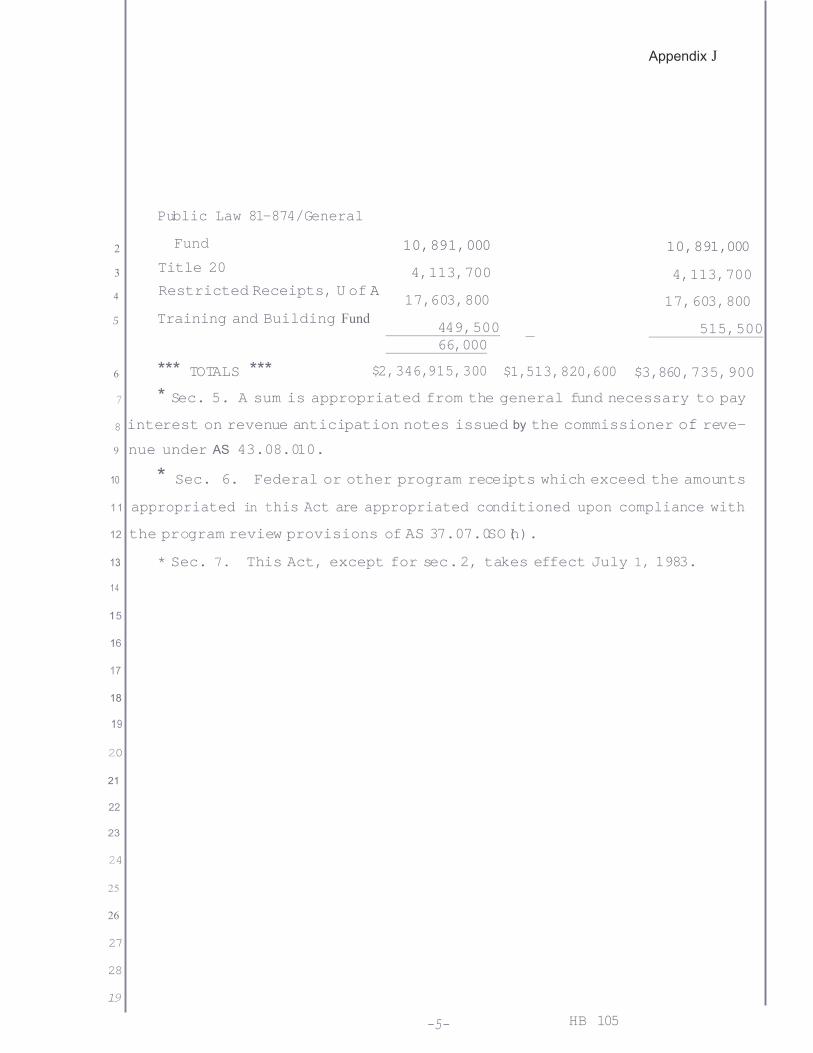
Appendix J
Public Law 81-874/General
2 Fund
3 Title 20
4 Restricted Receipts, U of A
5 Training and Building Fund
10,891,000
4,113,700
17,603,800
449,500 66,000
10,891,000
4,113,700
17,603,800
515,500
6 *** TOTALS *** $2,346,915,300 $1,513,820,600 $3,860,735,900
7 * Sec. 5. A sum is appropriated from the general fund necessary to pay
8 interest on revenue anticipation notes issued by the commissioner of reve-
9 nue under AS 43.08.010.
10 * Sec. 6. Federal or other program receipts which exceed the amounts
1 1 appropriated in this Act are appropriated conditioned upon compliance with
12 the program review provisions of AS 37.07.0SO (h).
13 * Sec. 7. This Act, except for sec. 2, takes effect July 1, 1983.
1 4
15
16
17
18
19
20
21
22
23
24
25
26
27
28
19
-5- HB 105
2
Commonwealth North is a non‐profit corporation, organized and existing under the laws of the State of Alaska. Non‐partisan in nature, its purpose is to inject
enlightened vitality into the world of commerce and public policy. As well as providing a forum for State and National speakers, working committees study critical issues facing Alaska and prepare well‐researched action papers, such as this one.
Commonwealth North
PO Box 240668 • Anchorage, Alaska 99524 Tel: (907) 258‐9522 • Fax: (907) 276‐6350 • [email protected]