Embed Size (px)
Citation preview

The Sicilian Expedition
Ancient Philosophy

The Sicilian Expedition
• 18.26 With this Nicias concluded, thinking that he should either disgust the Athenians by the magnitude of the undertaking, or, if obliged to sail on the expedition, would thus do so in the safest way possible.

The Sicilian Expedition
• The Athenians, however, far from having their taste for the voyage taken away by the burdensomeness of the preparations, became more eager for it than ever; and just the contrary took place of what Nicias had thought, as it was held that he had given good advice, and that the expedition would be the safest in the world.

The Sicilian Expedition
• All alike fell in love with the enterprise. The older men thought that they would either subdue the places against which they were to sail, or at all events, with so large a force, meet with no disaster; those in the prime of life felt a longing for foreign sights and spectacles, and had no doubt that they should come safe home again; while the idea of the common people and the soldiery was to earn wages at the moment, and make conquests that would supply a never-ending fund of pay for the future.

Sicilian Expedition
• With this enthusiasm of the majority, the few that liked it not, feared to appear unpatriotic by holding up their hands against it, and so kept quiet.

The Icarus Paradox
• The 'Icarus Paradox' was coined by Danny Miller who observed that great success often precedes severe decline.
• The Greek word for this was hubris, or pride.

The Icarus Paradox
• Icarus attached wings made of wax and feathers to his shoulders and flew up into the sky. He flew higher and higher, until he came close to the sun, which melted the wax and Icarus fell to his death in the Aegean sea. What made him soar was the very reason for his decline.

The Icarus Paradox
• The same happens to organizations. Successful organizations tend to give more funding, support and status to the people they perceive as the basis of their success (for instance, a technology department).

The Icarus Paradox
• People with other ideas, from other departments, lose funding and status and decrease in number, making the organization more homogenous, 'simple', and inert.

The Icarus Paradox
• The organization loses its sense of urgency and becomes blind to opportunities and threats from a changing environment.

The Icarus Paradox
• Eventually, performance declines, at which time the alerted organization begins watching the environment again only to find out that it is too late and dramatic restructuring is needed to get back on track.
The history of stock markets is one of long bull markets and long bear markets.
We believe that U.S. stocks are in a secular bear market - one that could last years, rather than months.
Secular bear market underway
Bull and bear market cyclesHere’s a quick overview of the last 100 years:
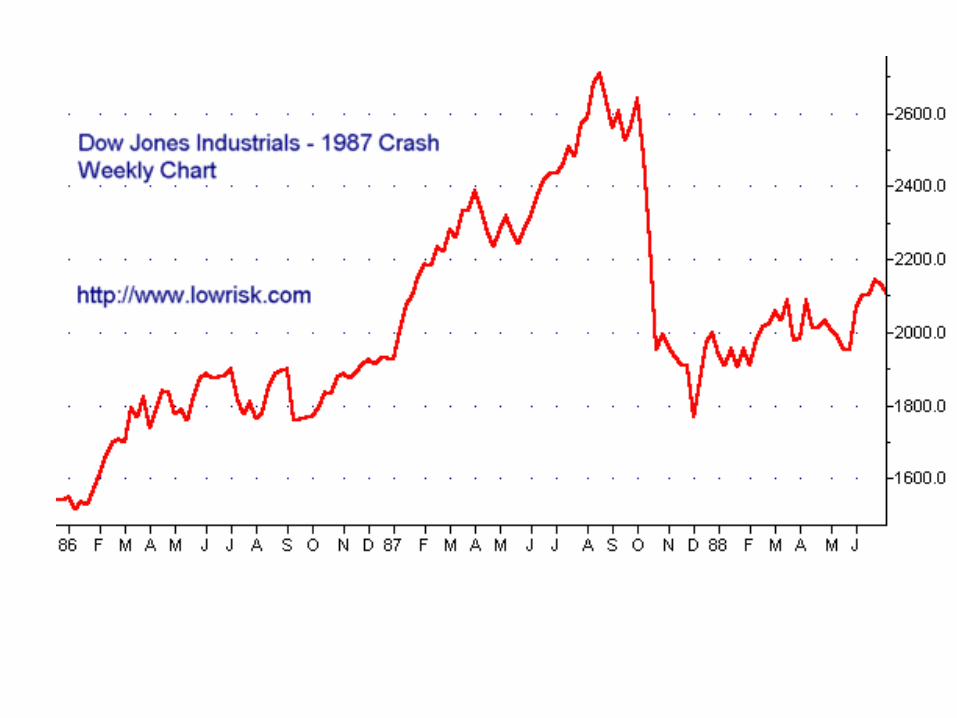
• 1909 - 1921: Stocks entered the 1900s trending higher, and rose 35% in less than three years. But stocks swung wildly, peaking in 1909. By August 1921, the broad market was 40% lower.
• 1921-1929: In the famous bull market of the Roaring ‘20s, stocks returned more than 400%.
• 1929 - 1948: Stocks plunged, recovered significantly by 1937, but by 1948, stocks were down more than 50% from the ’29 peak.
Bull and bear market cycles…
• 1948 - 1973: Stocks prices produced a six-fold increase, culminating in the Nifty-Fifty market of 1972.
• 1973 - 1982: The S&P 500 was lower in August 1982 than in January 1973. Adjusted for inflation, the results were far worse.
• 1982 - 1999: The S&P 500 index rose by a factor of 12. The NASDAQ ended the 90s at 21 times its 1982 level.
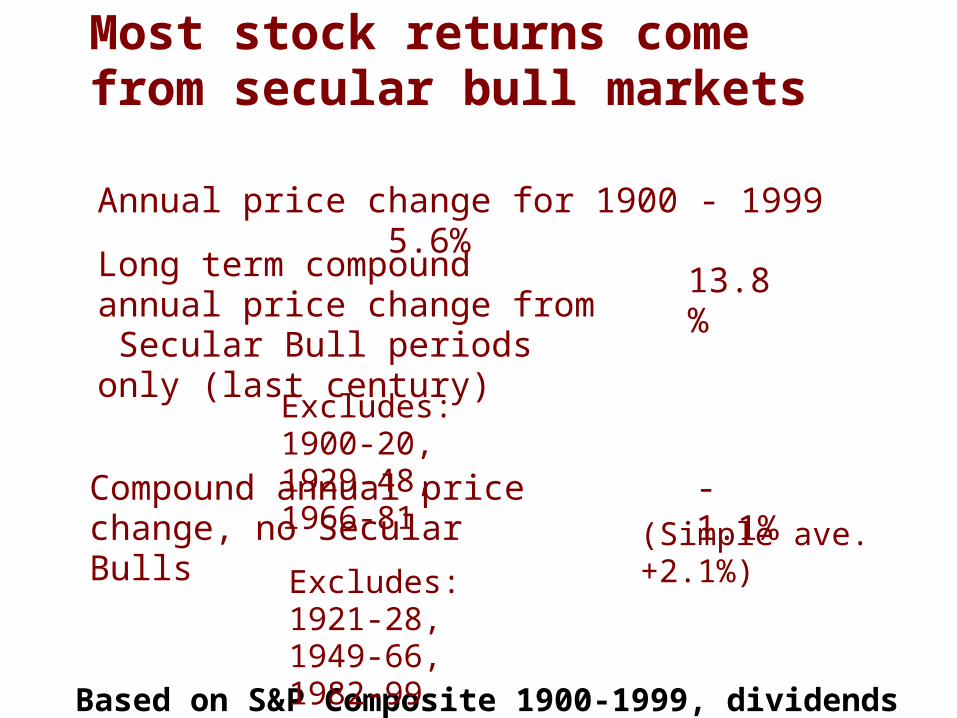
Most stock returns come from secular bull markets
Based on S&P Composite 1900-1999, dividends not included
Annual price change for 1900 - 1999 5.6%
Long term compound annual price change from Secular Bull periods only (last century)
Compound annual price change, no Secular Bulls
Excludes: 1921-28, 1949-66, 1982-99
Excludes: 1900-20, 1929-48, 1966-81
13.8%
-1.1%(Simple ave. +2.1%)
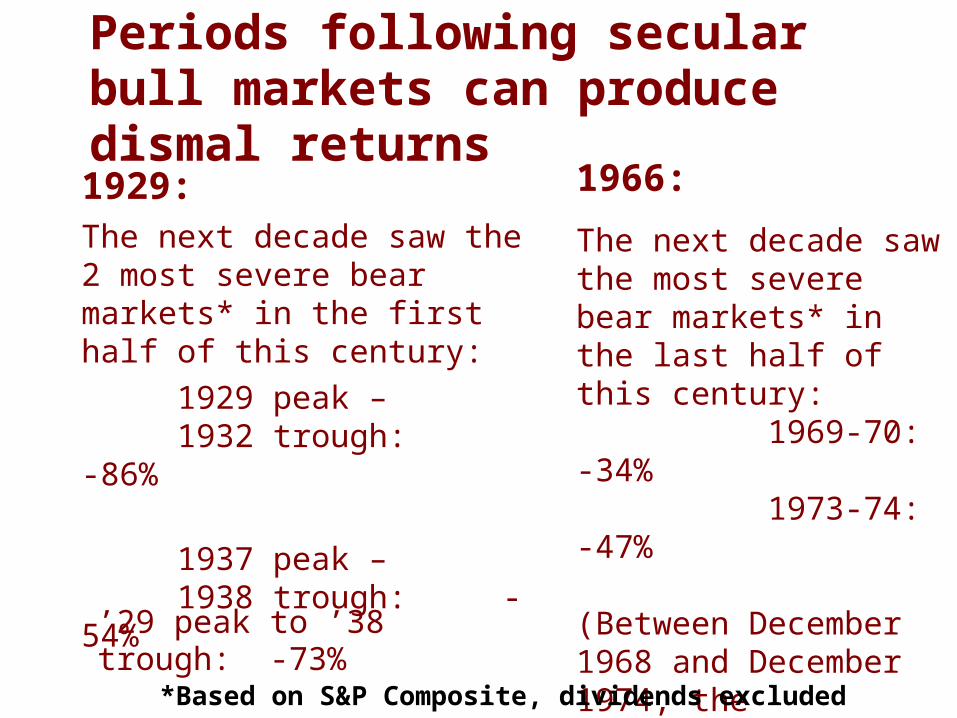
1966:
The next decade saw the most severe bear markets* in the last half of this century: 1969-70: -34% 1973-74: -47%
(Between December 1968 and December 1974, the unweighted Value Line Index of 1700 stocks lost more than 74%)
1929:The next decade saw the 2 most severe bear markets* in the first half of this century:
1929 peak –1932 trough: -86%
1937 peak –1938 trough: -54%
*Based on S&P Composite, dividends excluded
’29 peak to ’38 trough: -73%
Periods following secular bull markets can produce dismal returns
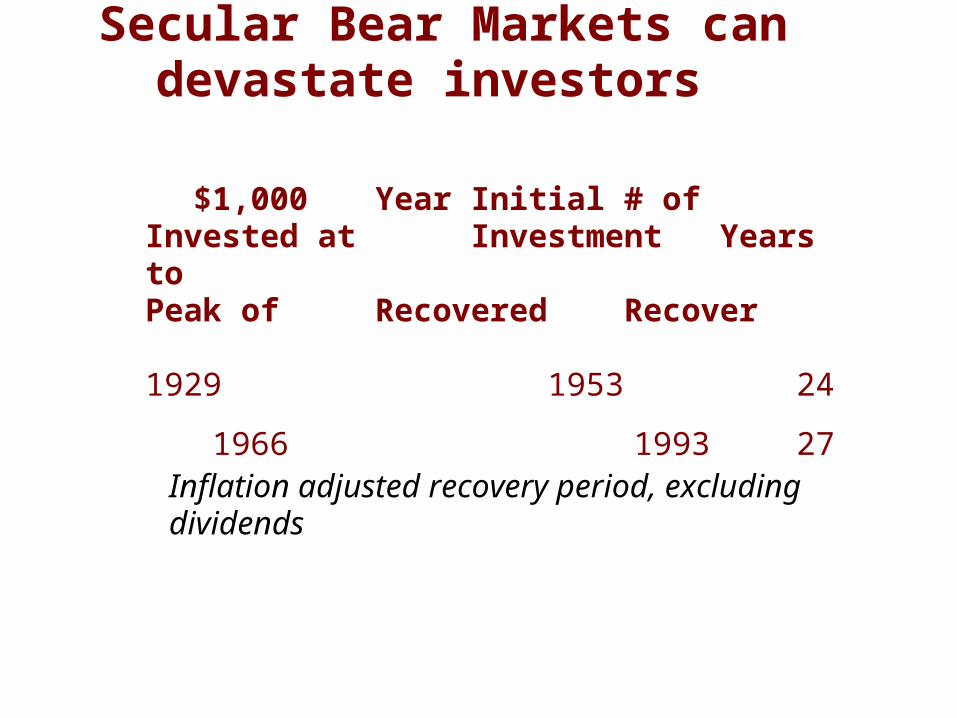
Secular Bear Markets can devastate investors
$1,000 Year Initial # of Invested at Investment Years toPeak of Recovered Recover
1929 1953 24
1966 1993 27
Inflation adjusted recovery period, excluding dividends
We can conclude:
Secular Bear Markets usually parallel the Secular Bull markets that precede them
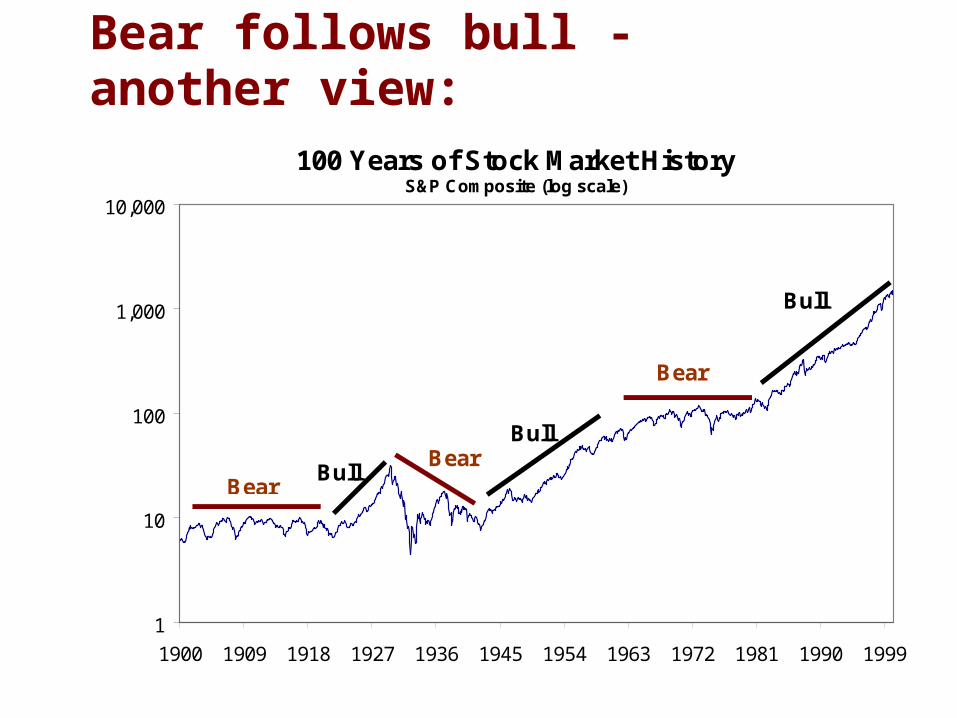
Bear follows bull - another view:
100 Years of Stock Market HistoryS&P Composite (log scale)
1
10
100
1,000
10,000
1900 1909 1918 1927 1936 1945 1954 1963 1972 1981 1990 1999
Bull
Bull
BearBear
Bear
Bull

What drives speculative manias?
Credit excesses fuel speculative asset bubbles. In fact, all great speculative manias have been associated with rapid credit growth.
The greater the credit excesses the wilder the speculation.
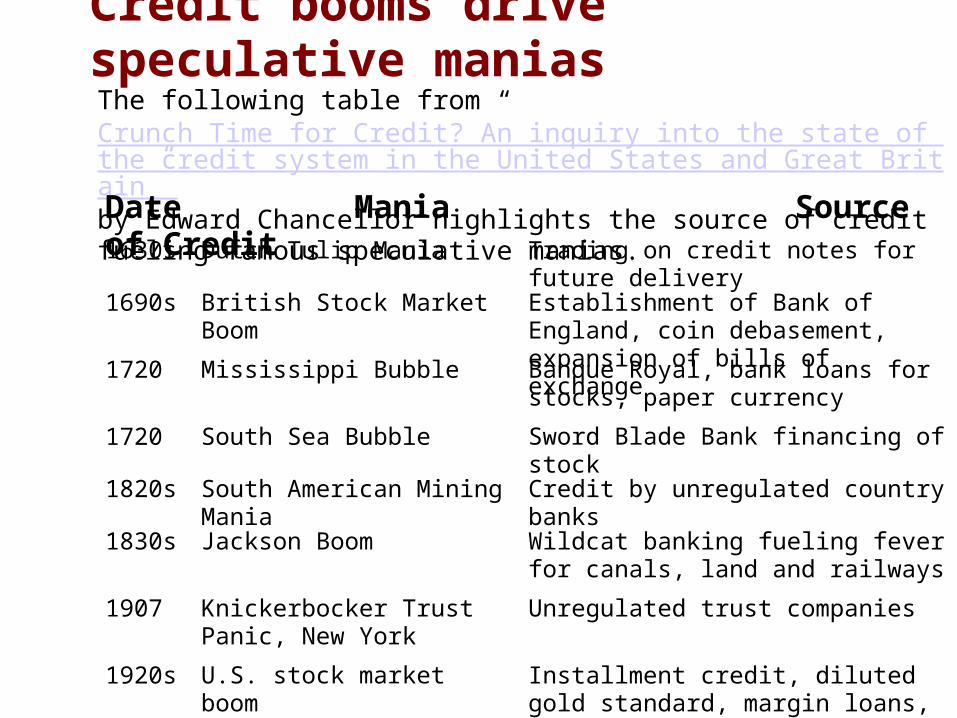
Installment credit, diluted gold standard, margin loans, lending against property
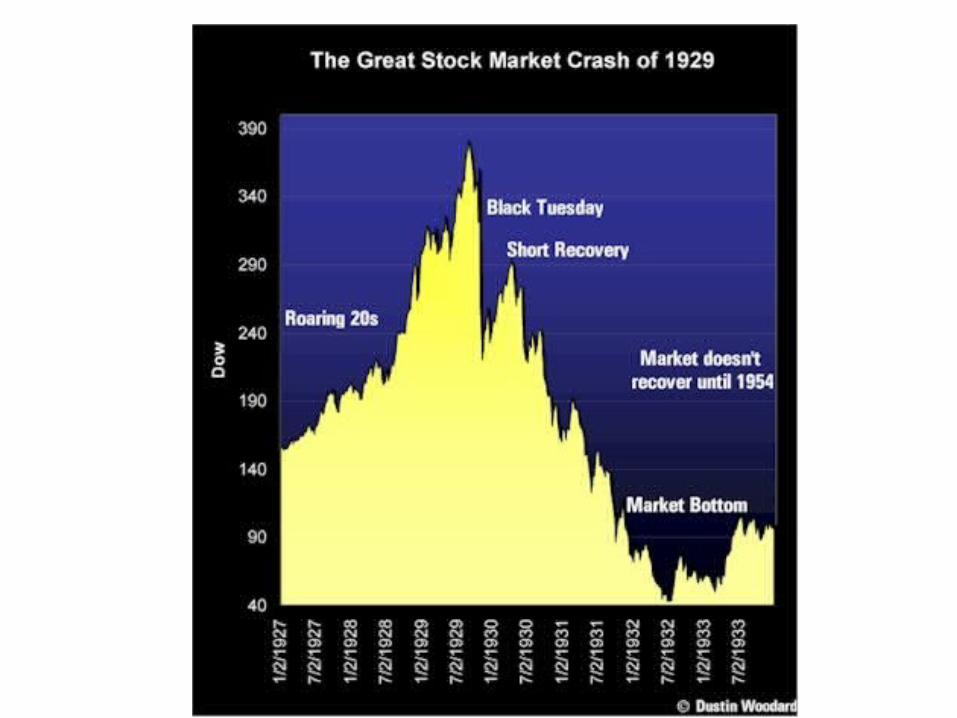
U.S. stock market boom1920s
Unregulated trust companiesKnickerbocker Trust Panic, New York
1907
Wildcat banking fueling fever for canals, land and railways
Jackson Boom1830s
Credit by unregulated country banksSouth American Mining Mania1820s
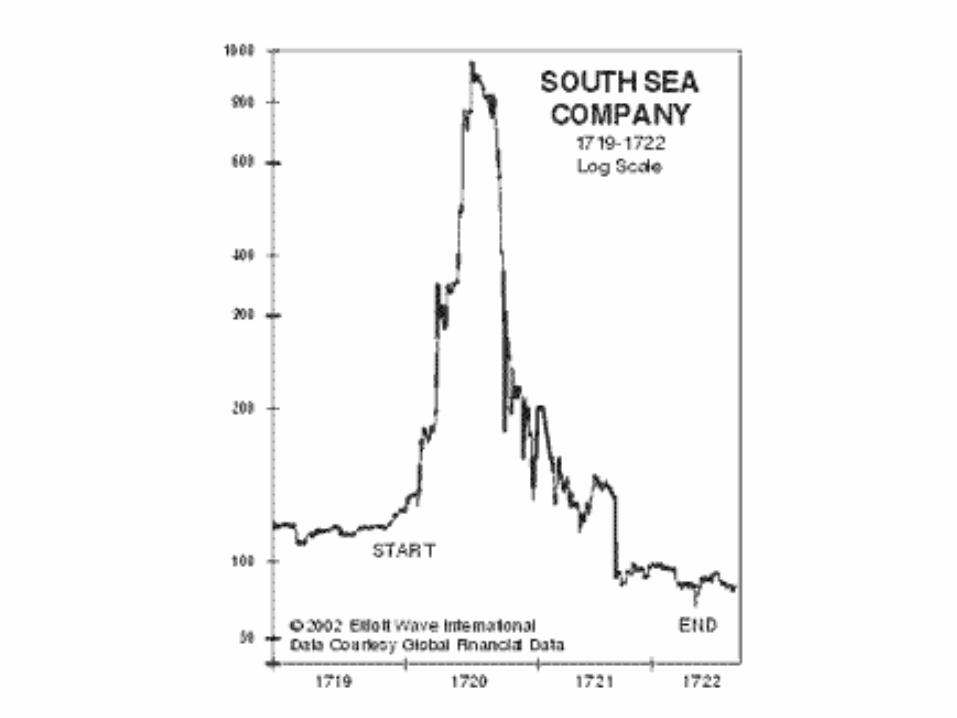
Sword Blade Bank financing of stockSouth Sea Bubble1720
Banque Royal, bank loans for stocks, paper currency
Mississippi Bubble1720
Establishment of Bank of England, coin debasement, expansion of bills of exchange
British Stock Market Boom1690s
Trading on credit notes for future deliveryDutch Tulip Mania1630s
The following table from “Crunch Time for Credit? An inquiry into the state of the credit system in the United States and Great Britain” by Edward Chancellor highlights the source of credit fueling famous speculative manias.
Credit booms drive speculative manias
Date Mania Source of Credit
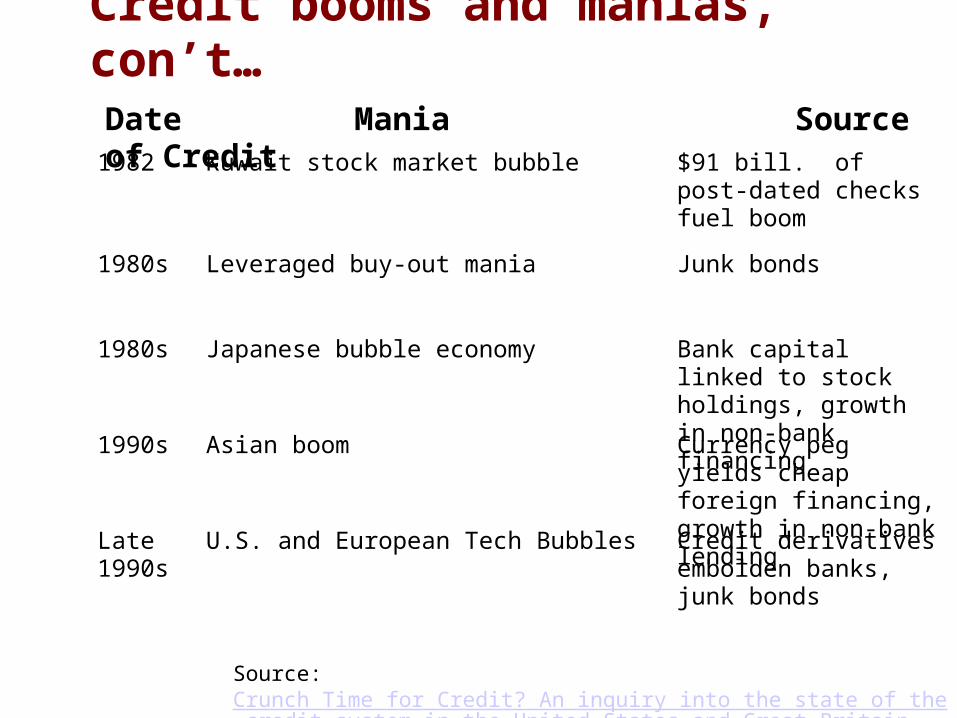
Source: Crunch Time for Credit? An inquiry into the state of the credit system in the United States and Great Britain
Credit booms and manias, con’t…
Credit derivatives embolden banks, junk bonds
U.S. and European Tech BubblesLate 1990s
Currency peg yields cheap foreign financing, growth in non-bank lending
Asian boom1990s
Bank capital linked to stock holdings, growth in non-bank financing
Japanese bubble economy1980s
Junk bondsLeveraged buy-out mania1980s
$91 bill. of post-dated checks fuel boom
Kuwait stock market bubble1982
Date Mania Source of Credit
Was the late ’90s stock market a credit-fueled mania?
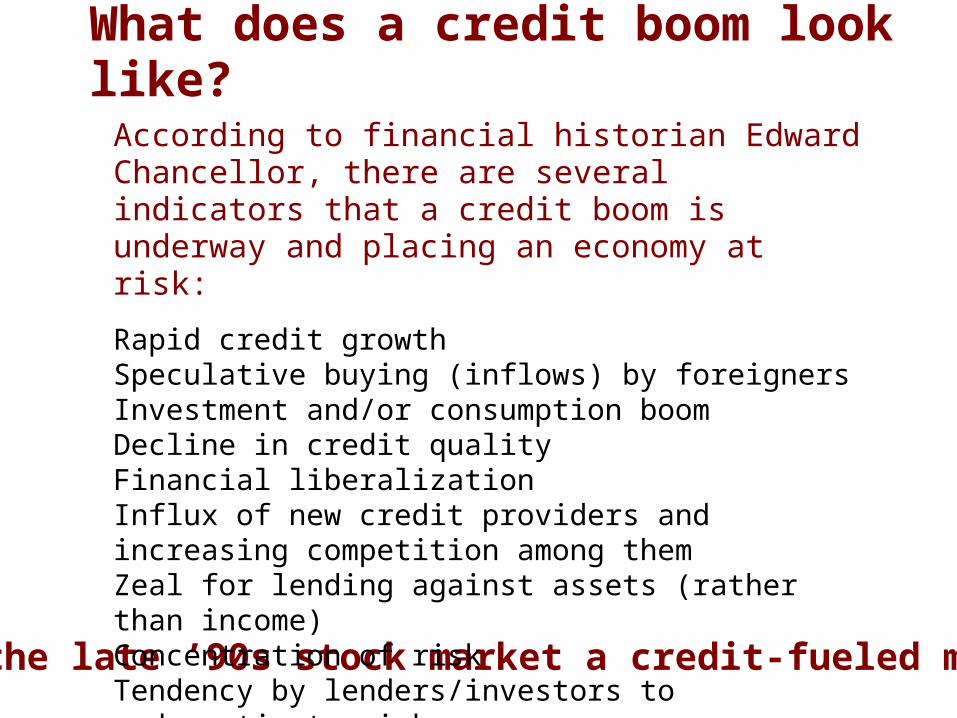
According to financial historian Edward Chancellor, there are several indicators that a credit boom is underway and placing an economy at risk:
Rapid credit growthSpeculative buying (inflows) by foreignersInvestment and/or consumption boomDecline in credit quality Financial liberalizationInflux of new credit providers and increasing competition among themZeal for lending against assets (rather than income)Concentration of riskTendency by lenders/investors to underestimate risk
What does a credit boom look like?
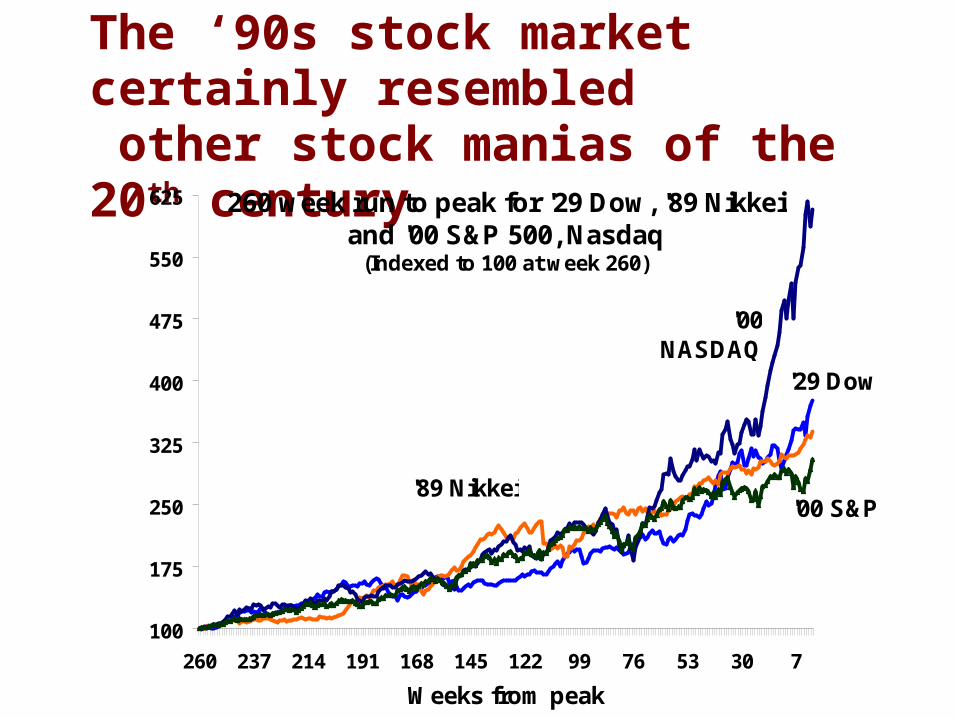
The ‘90s stock market certainly resembled other stock manias of the 20th century
260 week run to peak for '29 Dow, '89 Nikkei and '00 S&P 500, Nasdaq
(Indexed to 100 at week 260)
100
175
250
325
400
475
550
625
260 237 214 191 168 145 122 99 76 53 30 7
Weeks from peak
'00 NASDAQ
'89 Nikkei
'29 Dow
'00 S&P
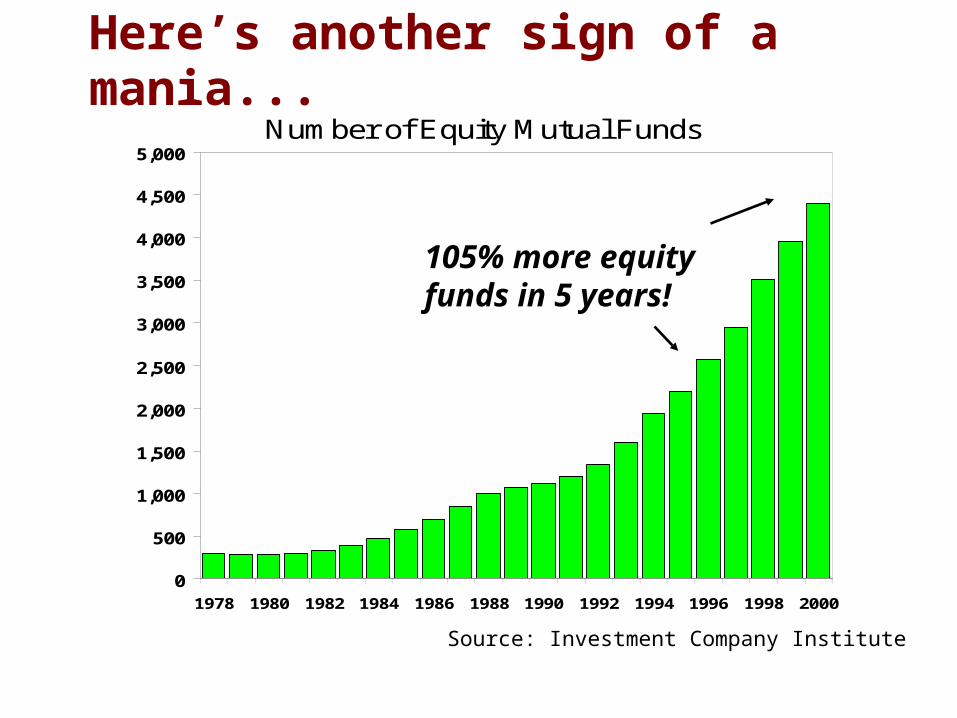
Here’s another sign of a mania...
Number of Equity Mutual Funds
0
500
1,000
1,500
2,000
2,500
3,000
3,500
4,000
4,500
5,000
1978 1980 1982 1984 1986 1988 1990 1992 1994 1996 1998 2000
105% more equity funds in 5 years!
Source: Investment Company Institute
In his book, “A Short History of Financial Euphoria,” Economist John Kenneth Galbraith outlines common features of a market mania. See if any of these sound familiar:
Brevity of financial memory, disaster is quickly forgotten (S&L debacle, junk bonds, Japanese bubble, Mexico collapse, Orange County, Asian collapse, LTCM)
Association of money with intelligence (Derision of those who question New Era market, elevation in status of CEOs, financial commentators, money managers)
Arrival, development of something new (Internet, telecom and myth of increased productivity)
Claims of financial innovation (Increased use of derivatives, Internet trading, home equity loans, minimum payment mortgages)
Sound familiar?
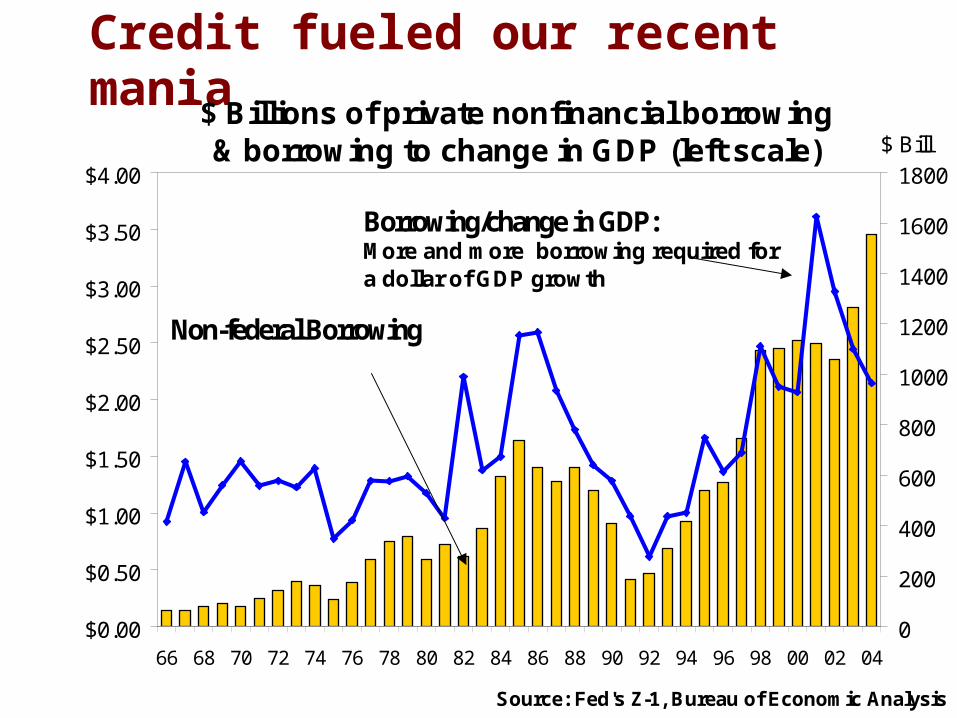
Credit fueled our recent mania
$ Billions of private nonfinancial borrowing & borrowing to change in GDP (left scale)
$0.00
$0.50
$1.00
$1.50
$2.00
$2.50
$3.00
$3.50
$4.00
66 68 70 72 74 76 78 80 82 84 86 88 90 92 94 96 98 00 02 04
Source: Fed's Z-1, Bureau of Economic Analysis
0
200
400
600
800
1000
1200
1400
1600
1800
$ Bill
Borrowing/change in GDP: More and more borrowing required for a dollar of GDP growth
Non-federal Borrowing
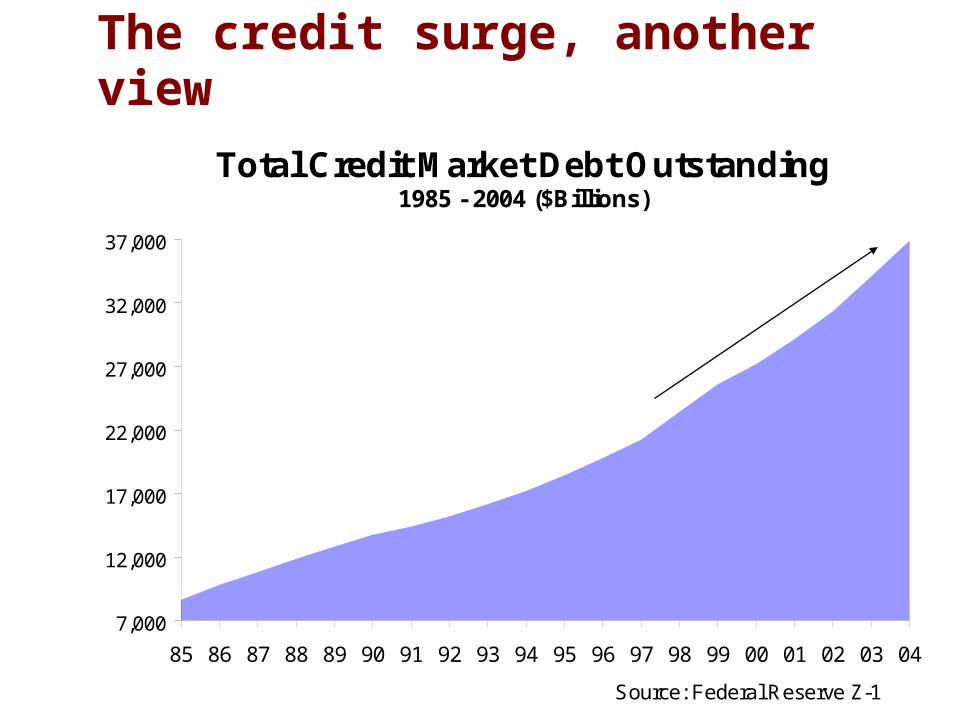
The credit surge, another view
Total Credit Market Debt Outstanding1985 - 2004 ($Billions)
7,000
12,000
17,000
22,000
27,000
32,000
37,000
85 86 87 88 89 90 91 92 93 94 95 96 97 98 99 00 01 02 03 04
Source: Federal Reserve Z-1
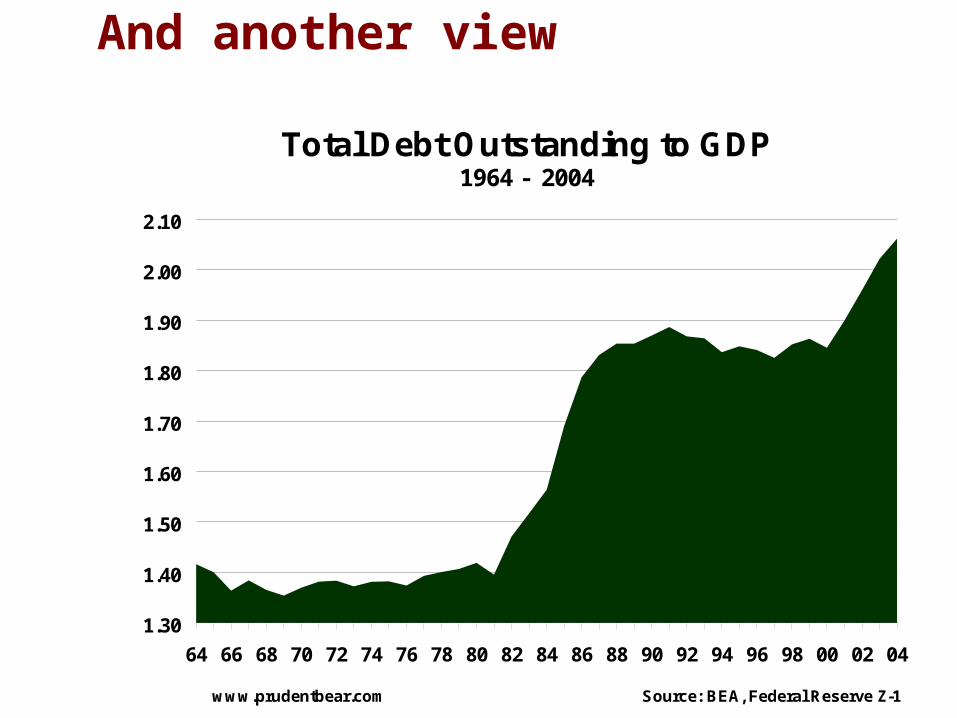
And another view
Total Debt Outstanding to GDP1964 - 2004
1.30
1.40
1.50
1.60
1.70
1.80
1.90
2.00
2.10
64 66 68 70 72 74 76 78 80 82 84 86 88 90 92 94 96 98 00 02 04
www.prudentbear.com Source: BEA, Federal Reserve Z-1
Credit flooded the corporate sector in the late ’90s, supplying financing to too many marginal companies and credit excess capacity, particularly in telecom.
When credit growth slowed in these sectors, the Federal Reserve tried to buoy the economy by easing monetary and credit conditions further. The result was a middling economy and a bubble in the home mortgage sector. For the first time in memory, rather than retrenching, consumers took on more debt during the recession.
Credit fueled our recent mania
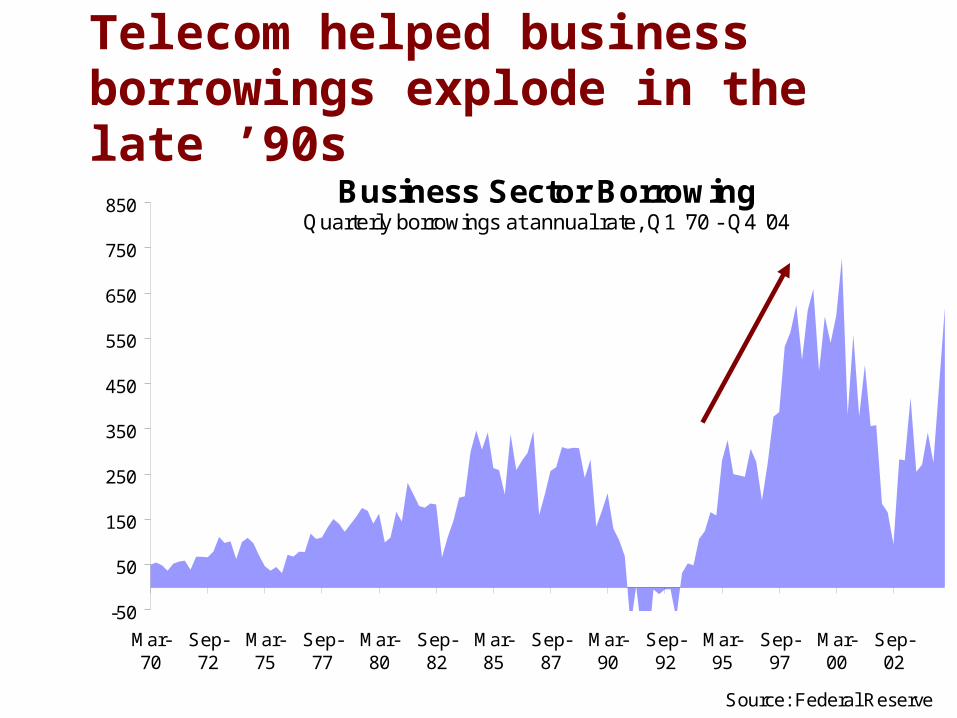
Business Sector BorrowingQuarterly borrowings at annual rate, Q1 '70 - Q4 '04
-50
50
150
250
350
450
550
650
750
850
Mar-70
Sep-72
Mar-75
Sep-77
Mar-80
Sep-82
Mar-85
Sep-87
Mar-90
Sep-92
Mar-95
Sep-97
Mar-00
Sep-02
Source: Federal Reserve
Telecom helped business borrowings explode in the late ’90s
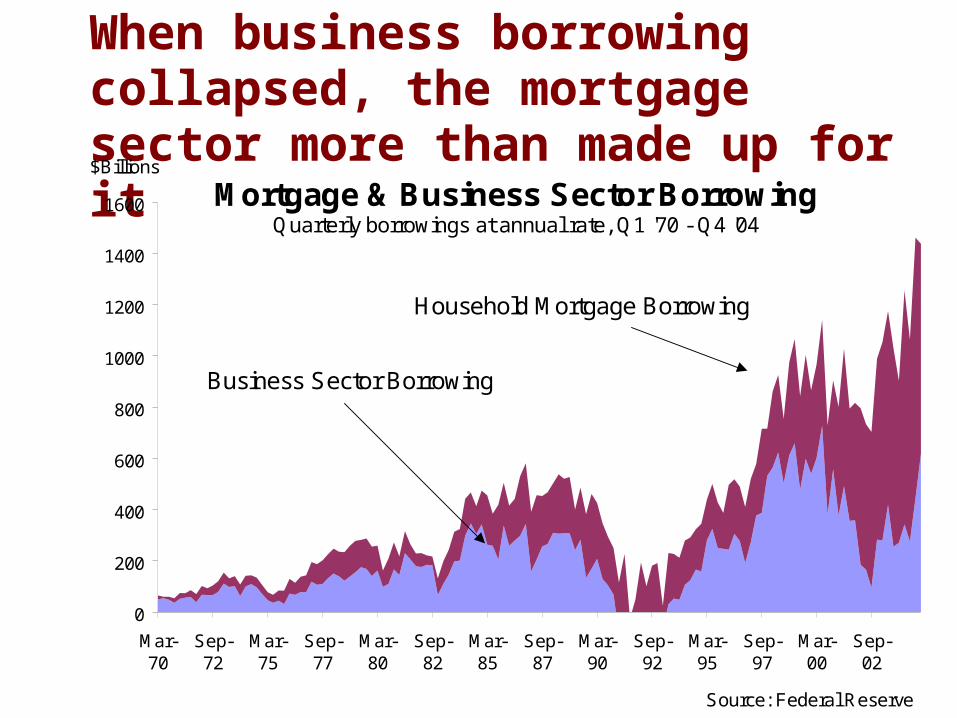
When business borrowing collapsed, the mortgage sector more than made up for it
Mortgage & Business Sector BorrowingQuarterly borrowings at annual rate, Q1 '70 - Q4 '04
0
200
400
600
800
1000
1200
1400
1600
Mar-70
Sep-72
Mar-75
Sep-77
Mar-80
Sep-82
Mar-85
Sep-87
Mar-90
Sep-92
Mar-95
Sep-97
Mar-00
Sep-02
Source: Federal Reserve
$Billions
Business Sector Borrowing
Household Mortgage Borrowing
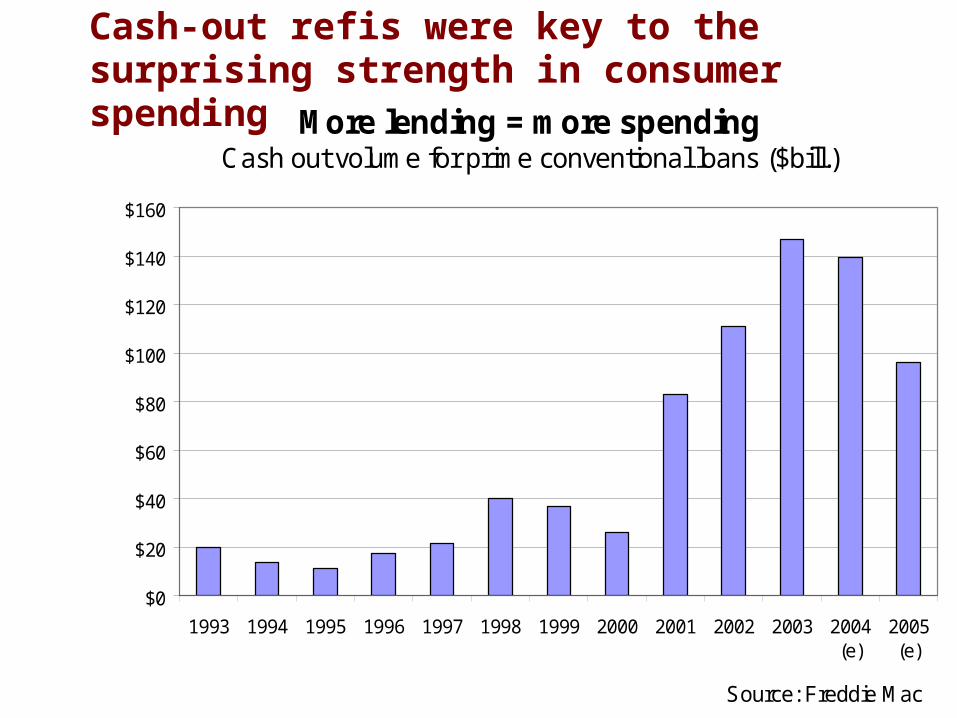
More lending = more spendingCash out volume for prime conventional loans ($bill.)
$0
$20
$40
$60
$80
$100
$120
$140
$160
1993 1994 1995 1996 1997 1998 1999 2000 2001 2002 2003 2004(e)
2005(e)
Source: Freddie Mac
Cash-out refis were key to the surprising strength in consumer spending
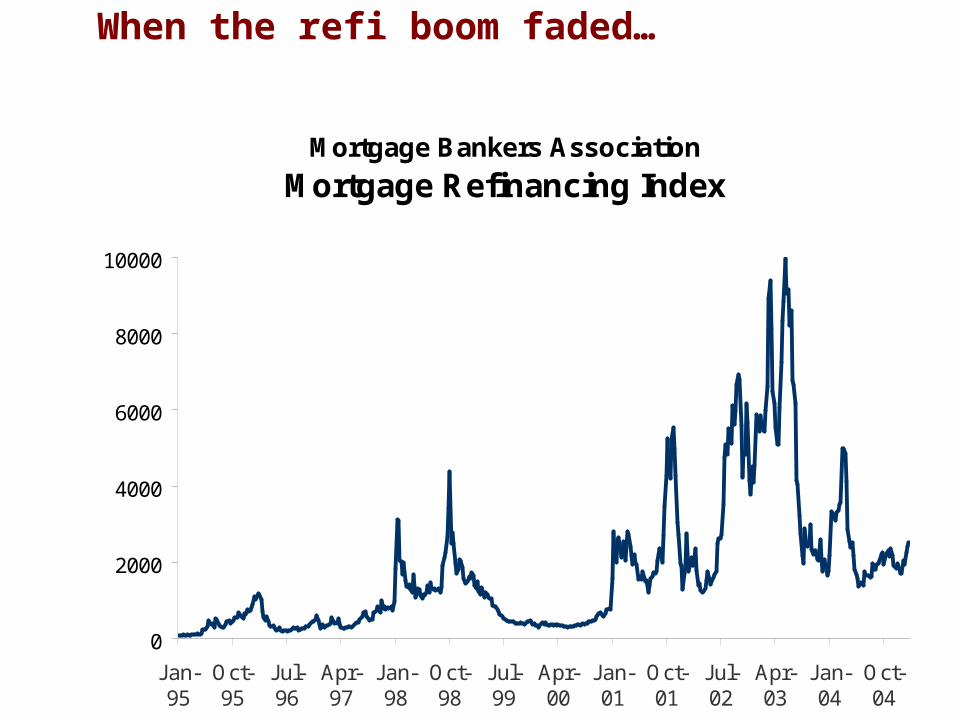
When the refi boom faded…
Mortgage Bankers Association
Mortgage Refinancing Index
0
2000
4000
6000
8000
10000
Jan-95
Oct-95
Jul-96
Apr-97
Jan-98
Oct-98
Jul-99
Apr-00
Jan-01
Oct-01
Jul-02
Apr-03
Jan-04
Oct-04
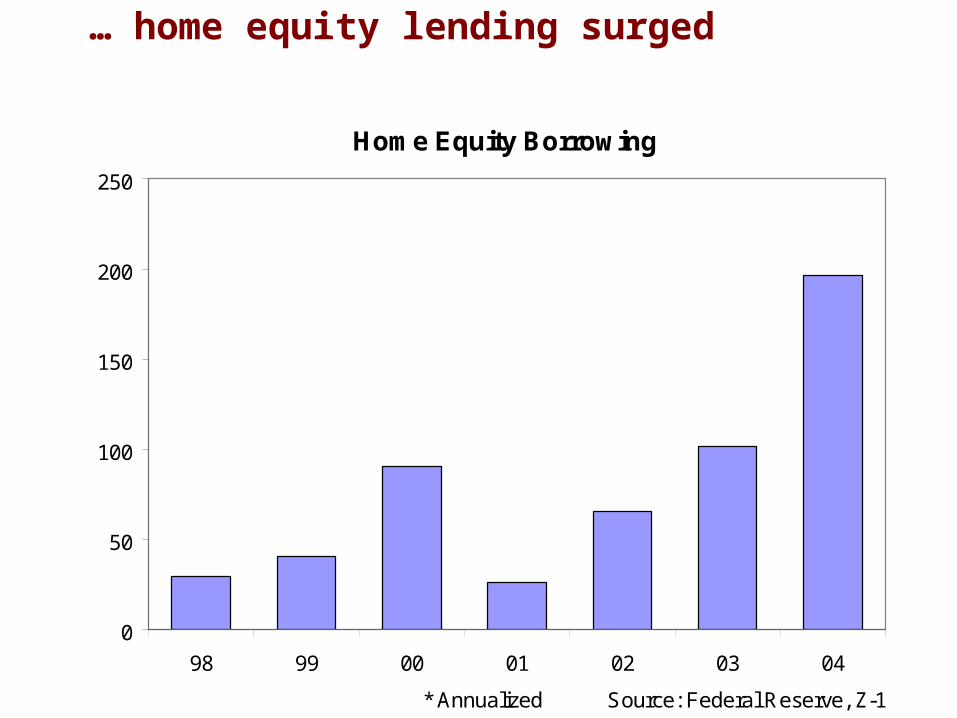
… home equity lending surged
Home Equity Borrowing
0
50
100
150
200
250
98 99 00 01 02 03 04
* Annualized Source: Federal Reserve, Z-1
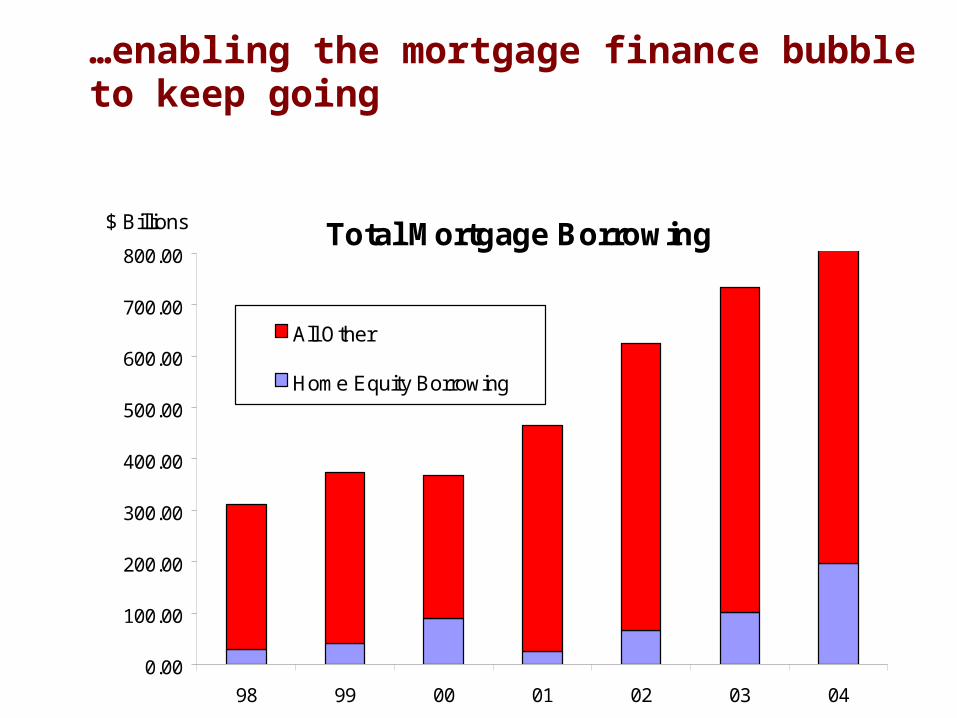
…enabling the mortgage finance bubble to keep going
Total Mortgage Borrowing
0.00
100.00
200.00
300.00
400.00
500.00
600.00
700.00
800.00
98 99 00 01 02 03 04
All Other
Home Equity Borrowing
Source: Federal Reserve, Z-1
$ Billions
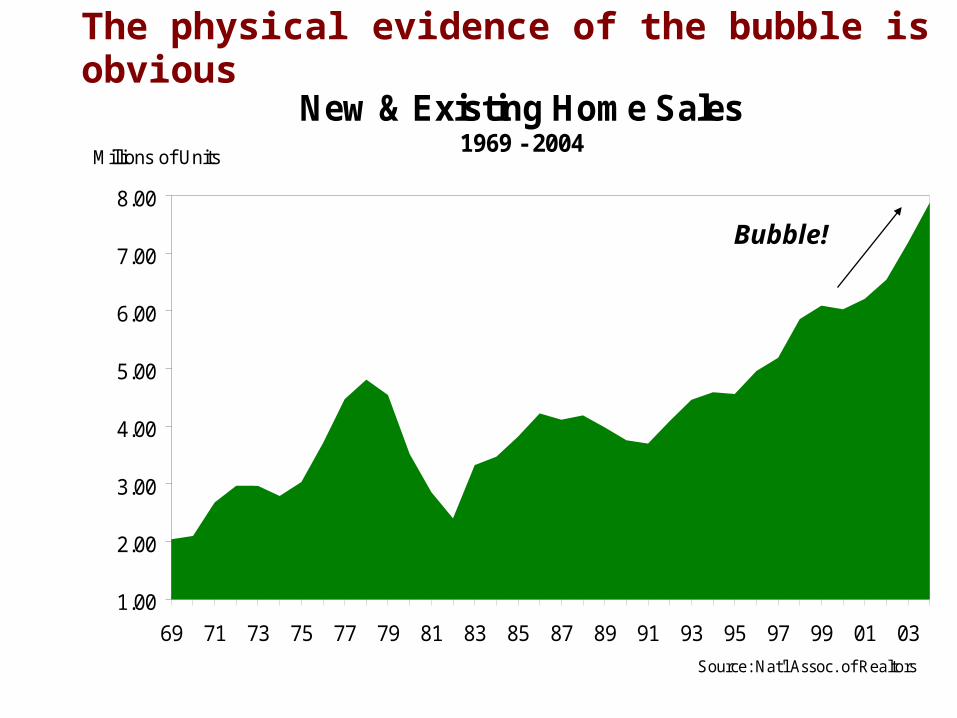
New & Existing Home Sales1969 - 2004
1.00
2.00
3.00
4.00
5.00
6.00
7.00
8.00
69 71 73 75 77 79 81 83 85 87 89 91 93 95 97 99 01 03
Source: Nat'l Assoc. of Realtors
Millions of Units
Bubble!
The physical evidence of the bubble is obvious
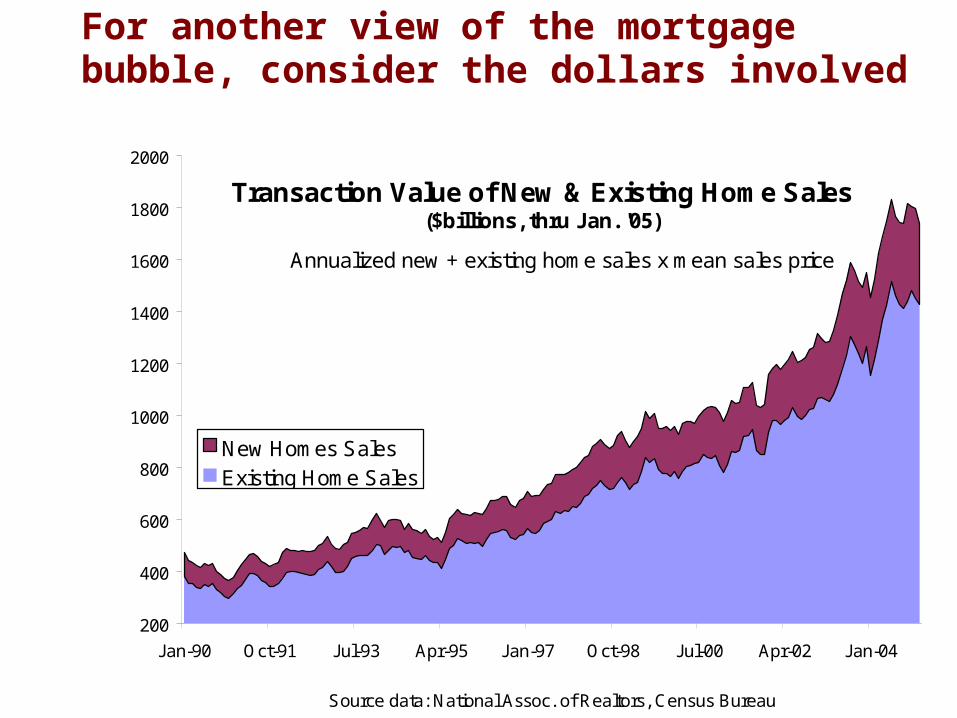
For another view of the mortgage bubble, consider the dollars involved
Transaction Value of New & Existing Home Sales ($billions, thru Jan. '05)
200
400
600
800
1000
1200
1400
1600
1800
2000
Jan-90 Oct-91 Jul-93 Apr-95 Jan-97 Oct-98 Jul-00 Apr-02 Jan-04
Source data: National Assoc. of Realtors, Census Bureau
New Homes SalesExisting Home Sales
Annualized new + existing home sales x mean sales price

Meanwhile, the mortgage bubble squeezes consumer income
Fed's Financial Obligation Ratio - HomeownersMarch '80 - Sept. '04
13
14
15
16
17
Mar-80
May-82
Jul-84
Sep-86
Nov-88
Jan-91
Mar-93
May-95
Jul-97
Sep-99
Nov-01
Jan-04
Includes consumer and mortgage debt. Source: Federal Reserve
Refi booms: a help, not a cure
Fed's estimate of debt service to disposable income
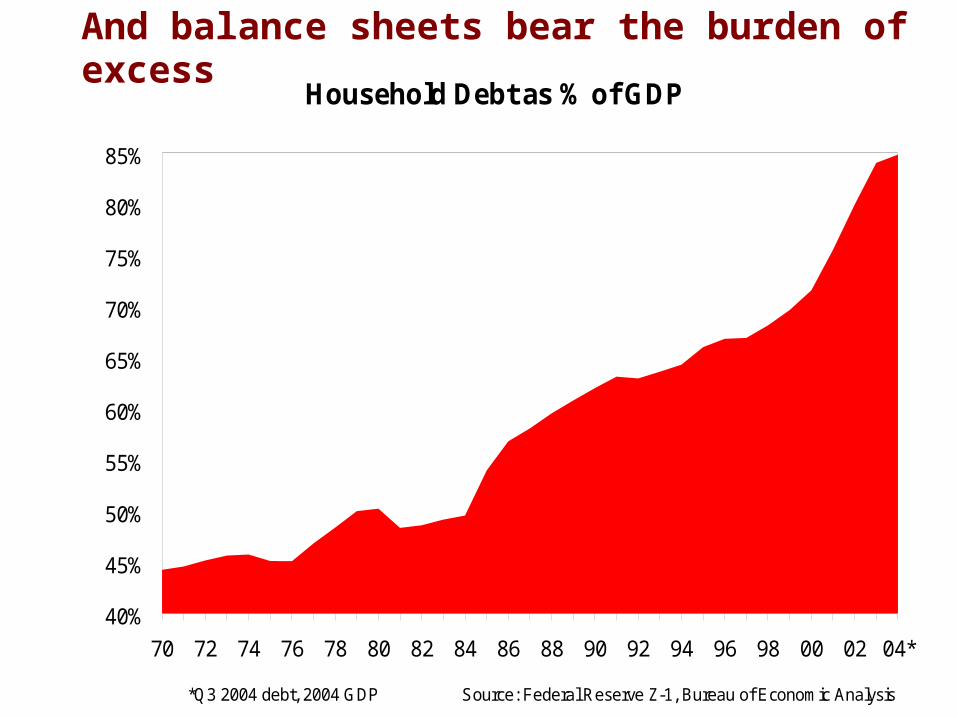
Household Debt as % of GDP
40%
45%
50%
55%
60%
65%
70%
75%
80%
85%
70 72 74 76 78 80 82 84 86 88 90 92 94 96 98 00 02 04*
*Q3 2004 debt, 2004 GDP Source: Federal Reserve Z-1, Bureau of Economic Analysis
And balance sheets bear the burden of excess

Despite credit-induced ‘wealth creation’ consumers are more leveraged to housing than ever
Home Equity as Percent of Home Market Value1965 - Q3 2004
50
55
60
65
70
75
65 67 69 71 73 75 77 79 81 83 85 87 89 91 93 95 97 99 01 03
Source: Fed's Z-1
%

From the previous pages it’s clear that the credit bubble is ongoing. The Fed’s aggressive posture simply shifted the stock bubble to new sectors. Asset price inflation, which is dependent on credit, continued and has crept back into the stock market as well.
What happens when the credit bubble bursts?

Savings RateSavings as % of disposable income, Q1 '90 - Q4 '04
0
2
4
6
8
Mar-90 Dec-91 Sep-93 Jun-95 Mar-97 Dec-98 Sep-00 Jun-02 Mar-04
Source: Bureau of Economic Analysis
%
What will drive the economy once the desire to save returns?
Greenspan once had it right about how credit booms can distort an economy: “The excess credit which the Fed pumped into the economy
spilled over into the stock market - triggering a fantastic speculative boom. Belatedly, Federal Reserve officials attempted to sop up the excess reserves and finally succeeded in braking the boom. But it was too late: by 1929 the speculative imbalances had become so overwhelming that the attempt precipitated a sharp retrenching and a constant demoralizing of business confidence.”
Alan Greenspan, Gold and Economic Freedom, 1966
Have we had our bear market?
Valuations never reached “bear market” levels
The following charts reveal that stocks remain expensive by a number of measures.
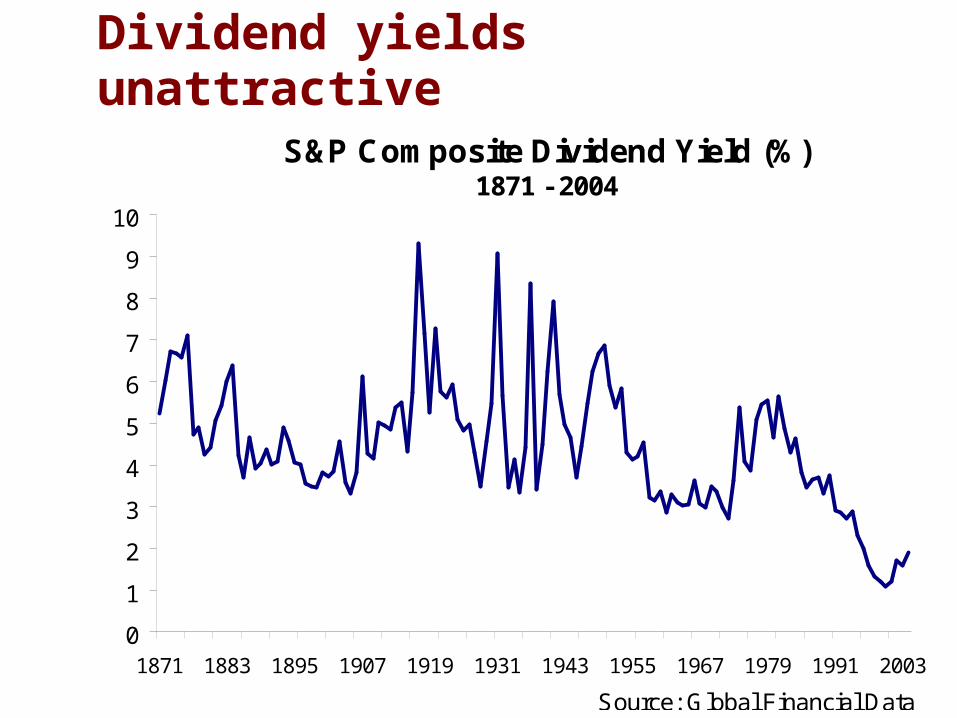
Dividend yields unattractive
S&P Composite Dividend Yield (%)1871 - 2004
0
1
2
3
4
5
6
7
8
9
10
1871 1883 1895 1907 1919 1931 1943 1955 1967 1979 1991 2003
Source: Global Financial Data
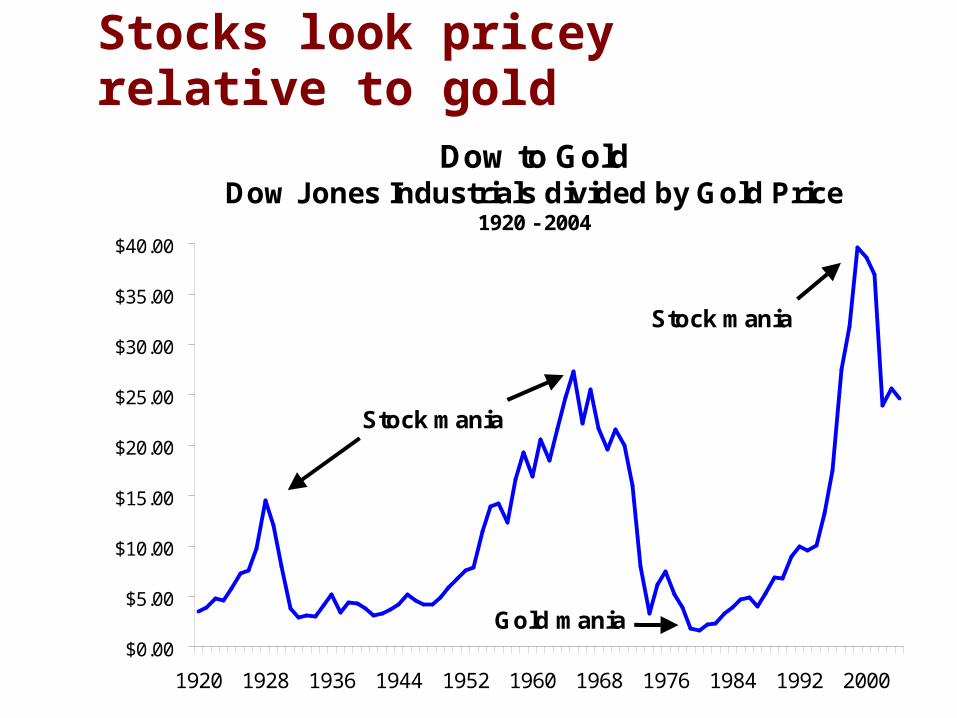
Stocks look pricey relative to gold
Dow to GoldDow Jones Industrials divided by Gold Price
1920 - 2004
$0.00
$5.00
$10.00
$15.00
$20.00
$25.00
$30.00
$35.00
$40.00
1920 1928 1936 1944 1952 1960 1968 1976 1984 1992 2000
Stock mania
Stock mania
Gold mania
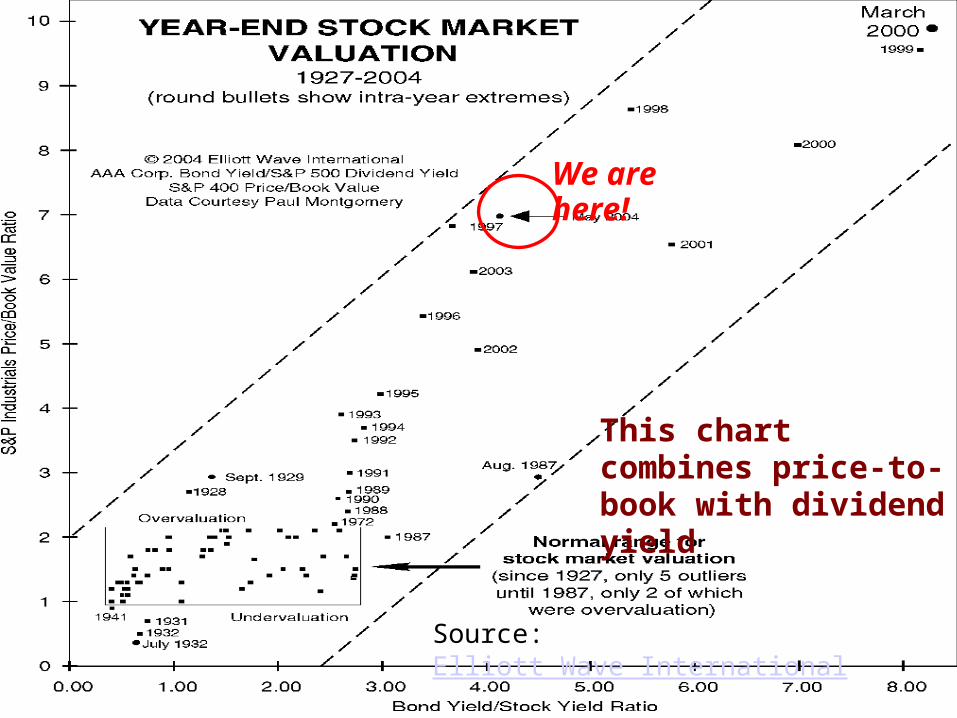
S&
P I
nd
ust
rial
s p
rice
to
boo
k v
alu
e
Bond yield/stock yieldSource: Elliott Wave International
We are here!
This chart combines price-to-book with dividend yield
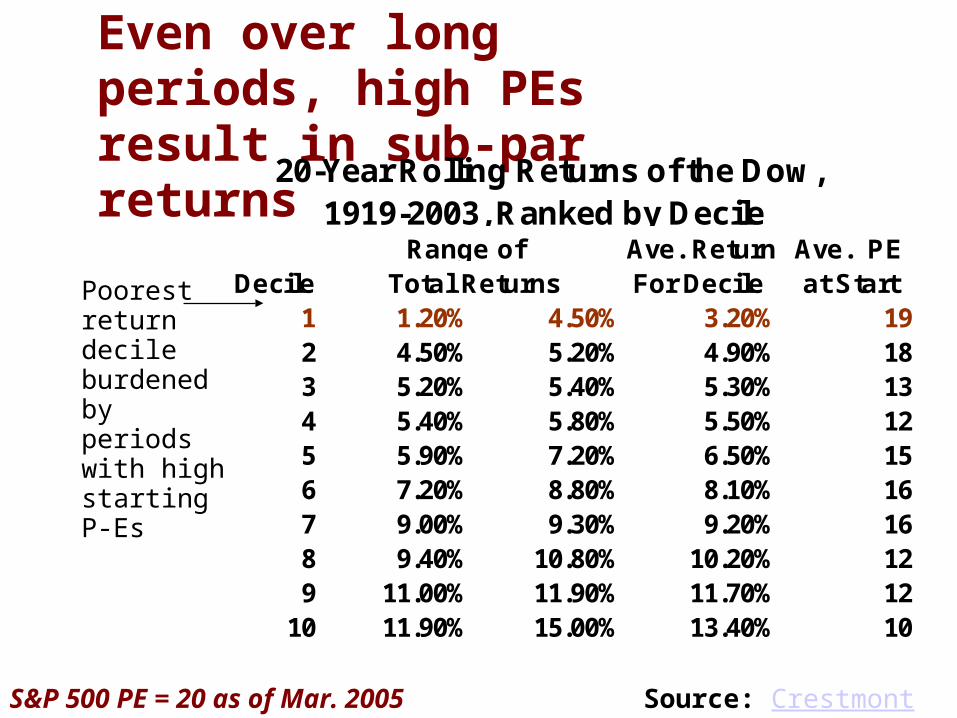
Even over long periods, high PEs result in sub-par returns
S&P 500 PE = 20 as of Mar. 2005 Source: Crestmont Research
Poorest return decile burdened by periods with high starting P-Es
20-Year Rolling Returns of the Dow,
Ave. Return Ave. PEDecile For Decile at Start
1 1.20% 4.50% 3.20% 192 4.50% 5.20% 4.90% 183 5.20% 5.40% 5.30% 134 5.40% 5.80% 5.50% 125 5.90% 7.20% 6.50% 156 7.20% 8.80% 8.10% 167 9.00% 9.30% 9.20% 168 9.40% 10.80% 10.20% 129 11.00% 11.90% 11.70% 12
10 11.90% 15.00% 13.40% 10
1919-2003, Ranked by Decile
Total ReturnsRange of
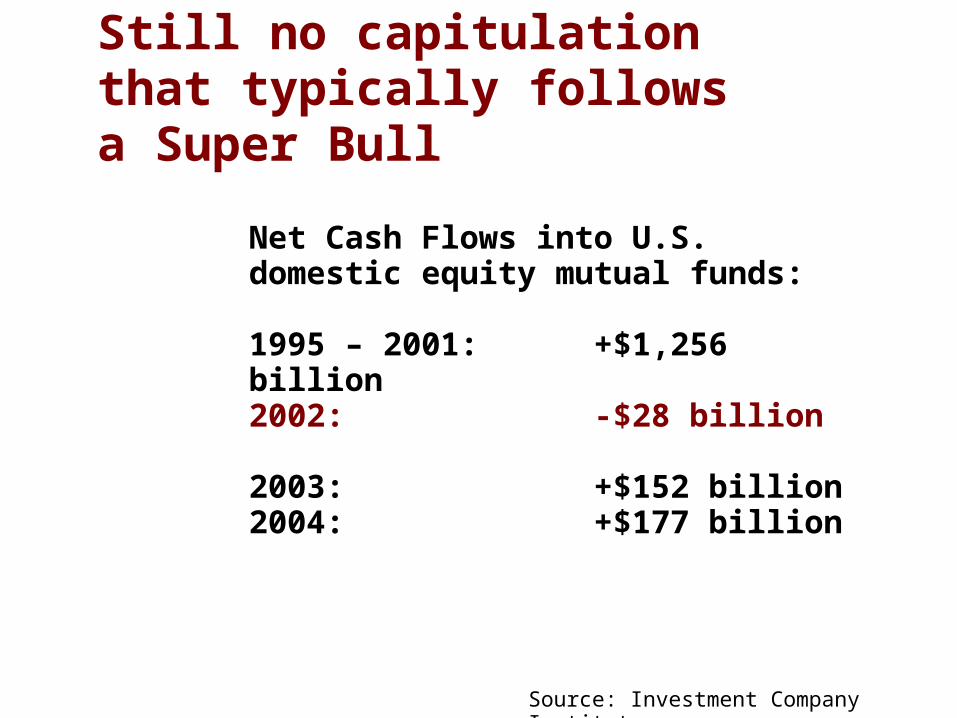
Net Cash Flows into U.S. domestic equity mutual funds:
1995 – 2001: +$1,256 billion2002: -$28 billion 2003: +$152 billion2004: +$177 billion
Still no capitulation that typically follows a Super Bull
Source: Investment Company Institute
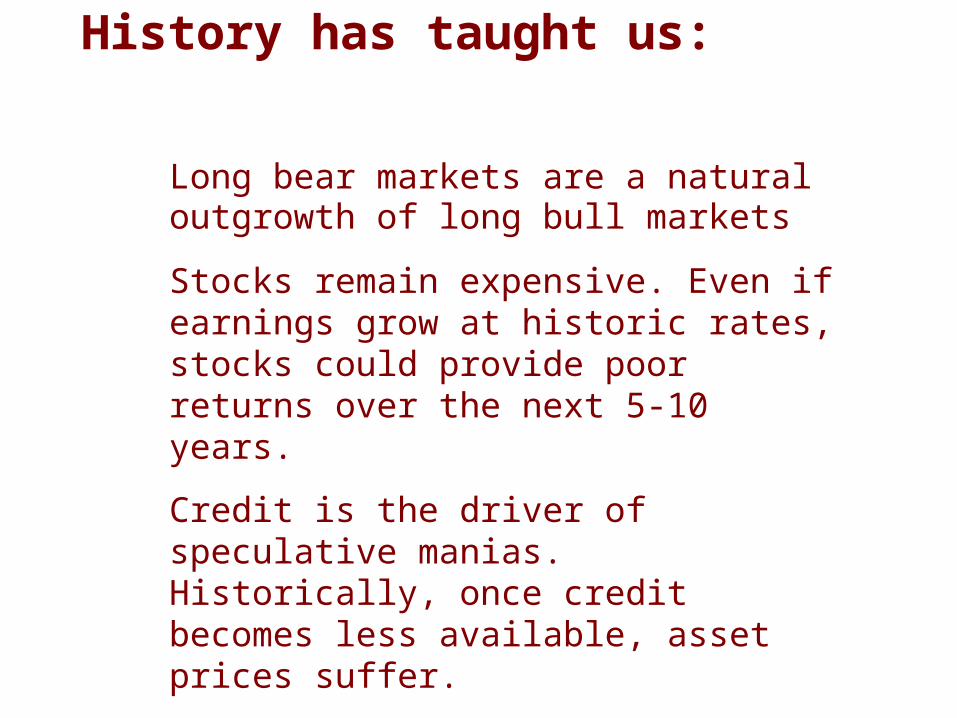
History has taught us:
Long bear markets are a natural outgrowth of long bull markets
Stocks remain expensive. Even if earnings grow at historic rates, stocks could provide poor returns over the next 5-10 years.
Credit is the driver of speculative manias. Historically, once credit becomes less available, asset prices suffer.
The Bubble Trouble Remains
“Since early 2000, the US has gone through a mild recession and the most anemic recovery on record. Over that same period, America’s net national saving rate has plunged to a record low, the household sector debt ratio has risen to an all-time high, and the US current account has gone deeper into deficit than ever. All this smacks of a US economy that is living far beyond its means, as those means are delineated by domestic income generation. Far from purging the excesses of the late 1990s, the United States has upped the ante on structural imbalances as never before.”
Stephen Roach, Morgan Stanley 9/2/03