Embed Size (px)
Citation preview
Revised Draft: December 22th, 2005
The short forms of the Empathy
Quotient (EQ-short) and the Systemizing Quotient (SQ-short)
Akio Wakabayashi (1,2), Simon, Baron-Cohen (2), Sally Wheelwright (2), Nigel Goldenfeld (3), Joe Delaney (2), Debra Fine (2),
Richard Smith (2), and Leonora Weil (2)
1) Department of Psychology, Chiba University, 1-33 Yayoi-cho, Inage, Chiba 263-8522 Japan
2) Autism Research Centre, Departments of Experimental Psychology and Psychiatry, University of Cambridge,
Douglas House 18b Trumpington Road, Cambridge, CB2 2AH, UK
3) Department of Physics, University of Illinois at Urbana-Champaign,
1110 West Green Street, Urbana, IL 61801, USA.
1
Abstract The empathizing–systemizing (E–S) theory has previously been tested using the Empathy Quotient (EQ) and the Systemizing Quotient (SQ). This study tested n = 1761 students with these instruments, to determine if short versions of these scales could be constructed. This would be desirable both for faster assessment and to establish which are the key items on each scale. Principal component analysis and factor analysis suggested that a 23 item version of each instrument was highly correlated with the full scale versions. The reliability of each short scale was reasonable. Results showed that females scored significantly higher than males on the EQ-Short, whilst males scored higher than females on the SQ-Short. Additionally, scores were analyzed according to the degree the student was studying. On the EQ-Short, students studying humanities scored higher than students studying sciences, whereas on the SQ-Short, the results were the opposite. Finally, distributions of the population who showed ‘brain types’ based on the scores on two scales were examined. The pattern of distribution of the brain types was consistent with the E-S theory. These results suggest that the EQ-Short and SQ-Short are useful instruments for measuring fundamental cognitive styles. Key words: Empathizing, systemizing, E-S theory, EQ-Short, SQ-Short, cognitive style
2

1. Introduction
1.1. The empathizing-systemizing theory
Understanding (intentional) agency and understanding non-agentive (causal) events
appear to be two fundamental aspects of human cognition (Tomasello, 1999).
Baron-Cohen (2002) proposed the Empathizing–Systemizing (E-S) theory that consists
of two psychological dimensions. This theory was developed from the folk
psychology–folk physics model, which corresponded to two fundamental causal
cognitions. The concept of empathizing extends the scope of folk-psychology, or theory
of mind, by including an emotionally reactive dimension. Similarly, the concept of
systemizing includes a wider range of systems, such as mechanical (e.g., machines),
abstract (e.g., mathematics), organizable (e.g., taxonomy) and so on. Empathizing is
used for making sense of an agent’s behaviour, and systemizing is used for predicting
the behaviour of non-agentive events or objects. Empathizing is defined as the drive to
identify emotions and thoughts in others and to respond to these with an appropriate
3

emotion. Systemizing refers to the drive to construct systems, which allows people to
predict the behaviour of a system, and to control it. According to the E-S theory, there
are certain individual differences in both empathizing and systemizing, for example, sex
differences in the mind are found in empathizing (stronger in females) and systemizing
(stronger in males). A growing body of evidence suggests males spontaneously
systemize to a greater degree than do females, whilst females spontaneously empathize
to greater degree than do males (for example, Baron-Cohen, Richler, Bisarya,
Gurunathan, & Wheelwright, 2003; Lawson, Baron-Cohen, & Wheelwright, 2004).
1.2. The Empathy Quotient (EQ) and the Systemizing Quotient (SQ)
The Empathy Quotient (EQ) and the Systemizing Quotient (SQ) were constructed as
instruments with which to test the E-S theory (Baron-Cohen et al., 2003; Baron-Cohen
& Wheelwright, 2004). The EQ was developed as a new measure of empathy because
several instruments that purport to measure empathy only tap part of empathy. Empathy
has an affective component (for example, feeling an appropriate emotion triggered by
4

another’s emotion), a cognitive component (for example, understanding and/or
predicting what someone else might think, feel, or do), and a mixed component
(cognitive and affective). The SQ was constructed by using examples from everyday life
in which systemizing is used. The assumption was that an individual with high
systemizing would be drawn to use their systemizing skills across the range of examples
more often than an individual with low systemizing. Systemizing involves figuring out
the rules of a system and is held to involve monitoring input-operation-output relations
(e.g., If I do A, then X occurs).
According to the E-S theory, it is possible to plot on two dimensional coordinate, which
is constructed by empathizing and systemizing. Baron-Cohen et al. (2003) have used the
terms “brain types” to describe the three basic cognitive types which are generated from
this theory. Individuals in whom empathizing is at a higher level than their systemizing
are referred to as having a brain of type E (the Empathizing brain type: E>S).
Individuals in whom systemizing is at a higher level than their empathizing are said to
have a brain of type S (the Systemizing brain type: S>E). Individuals in whom
5

empathizing and systemizing are equally balanced are said to be type B (the Balanced
brain type: E=S). It could be said that these brain types are kinds of cognitive styles. On
average, more males than females have a brain of type S, and more females than males
have a brain of type E (Goldenfeld, Baron-Cohen, Wheelwright, Ashwin, & Chakrabarti,
in press). Evidence supporting these sex differences in the E-S theory includes the
findings that mathematics, physics and engineering (which all require a high degree of
systemizing) are largely male in sex ratio (for example, Benbow, 1988; Geary, 1996),
and that women are better at decoding non-verbal communication, picking up subtle
nuances from tone of voice or facial expression, or judging a person’s character (for
example, Hall, 1978). However, a fundamental problem is remained, that is, it is not
clear whether all items in each scale are needed to measure the hypothesized two
constructs.
The aims of the present study are: (1) To examine the psychometric properties of the EQ
and SQ as instruments. (2) To produce short versions of the EQ and SQ for increasing
their reliabilities, based on the results of item analyses, and to compare with those
6
original scales. (3) To test if the EQ-Short is independent of the SQ-Short. (4) To
examine the sex differences and the differences between students in the humanities and
students in the sciences on the E-S theory. (5) To test the hypotheses about the
postulated types of brain, using these short versions of the scales.
2. Method
2.1. Participants
Participants consisted of 1,761 students of Cambridge University, comprising 723 males
and 1,038 females. Their mean age was 21.0 yrs (SD = 2.58, range = 18.2 – 26.3). They
were recruited via several routes including e-mail, post, newspaper adverts and notices
around the university. An incentive to participate was offered, in that everyone who
completed all questionnaires was entered into a draw to win a prize. Only participants
who replied to all items were included in the final analysis. Participants indicated their
undergraduate degree subject and these were classified as sciences and humanities.
7

2.2. Procedure
All participants completed the EQ and SQ online, using a custom-designed website.
After registering on the website and providing some basic information, such as sex, age
and their degree/area of study, participants were invited to fill out the two questionnaires.
For each questionnaire, participants were instructed to read each statement carefully and
judge how strongly they agreed or disagreed by selecting the appropriate option of each
item.
2.3. Instruments
The EQ and SQ have a forced-choice format, and are self-administered. Both the EQ
and SQ comprise 60 questions, 40 assessing empathizing or systemizing respectively,
and 20 filler items. Approximately half the items are worded to produce a “disagree”
response, and half an “agree” response, and items are randomized to avoid a response
8
bias. An individual scores 2 points if they strongly display a systemizing/empathizing
response, and 1 point if they slightly display a systemizing/empathizing response (i.e.,
each item being scored 2,1,0,0) (Baron-Cohen et al., 2003; Baron-Cohen &
Wheelwright, 2004).
3. Results
3.1. Psychometric properties of the original 40-item EQ and SQ
The mean EQ scores and mean SQ scores and their SDs of the participants are shown in
Table 1. The skewnesses and kurtosis were calculated. On the EQ, skewness = - 0.149
and kurtosis = - 0.284. On the SQ, skewness = 0.426 and kurtosis = - 0.081. Pearson’s
product moment correlation coefficients between EQ score and SQ score was r = -
0.171 (p<0.01). To examine the internal consistency of the EQ and SQ, Cronbach’s
alphas were calculated, these being 0.884 for the EQ and 0.881 for the SQ.
9

Table 1 about here
3.2. Constructing the short versions of the EQ and SQ
It is unclear whether all items in each scale are needed to measure the hypothesized two
constructs. No statistical item analyses for each scale were reported in the earlier studies
using the EQ and SQ, so the two scales might contain some unnecessary items.
Therefore, we carried out multivariate analyses on the two scales to confirm their
factorial consistency, and to construct short versions of the EQ and SQ to measure each
cognitive style.
First, we applied a principal component analysis to both scales respectively, because the
EQ and SQ were originally conceptualized as being independent of each other. The 40
items of the EQ were considered via principal component analysis, and the scree plot
suggested that the EQ scale consisted of one-component (Eigenvalues were 8.46, 3.01,
1.96, etc.) but the first principal component showed that 22 of 40 items loaded above
10

0.40. In the SQ, the scree plot of PCA also suggested one-component (Eigenvalues were
7.92, 2.54, 1.82, etc.), and the first component showed that 25 of 40 items loaded above
0.40 (Table 2). The internal consistencies (Cronbach’s alpha) of these high loaded items
were 0.900 in the EQ (22 items) and 0.894 in the SQ (25 items).
Table 2 about here
In order to confirm the validities of these high loaded items as the shortened versions of
the EQ and SQ, the correlations between original 40-item versions of the EQ/SQ and
the EQ-Short/SQ-Short were calculated. The correlations between scores in the 40-item
EQ and 22-item EQ-Short was r = 0.932 (r =0.927 in males, and r = 0.926 in females).
The correlation between scores in the 40-item SQ and 25-item SQ-Short was r = 0.953
(r = 0.942 in males, and r = 0.950 in females).
Then, we administered a factor analysis by combining the original EQ and SQ (80
items) in order to confirm the validity of the EQ/SQ-Short and independence of two
11

scales. A principal factor analysis was carried out on the inter item correlation matrix
obtained from 1761 students’ responses to the 80 items. The result of the initial factor
analysis revealed that three factors had Eigenvalues greater than one. However, the
scree plot showed that the two factor solution was adequate (Eigenvalues: Factor I was
7.88, Factor II was 5.65, and Factor III was 1.31). The result of the Varimax rotated two
factor solution showed that the highly loaded items of each factor were perfectly
identical with the items of each short version. These items are shown in Table 3.
Table 3 about here
The mean EQ-Short scores and mean SQ-Short scores and their SDs of the participants
are shown in Table 4. The skewnesses and kurtosis of them were calculated. On the
EQ-Short, skewness = - 0.110 and kurtosis = - 0.448. On the SQ-Short, skewness =
0.364 and kurtosis = - 0.536. These results suggest that the score distributions of the two
scales are not skewed, and the kurtoses show that the distributions are slightly
platykurtic but not so problematic. Pearson’s product moment correlation coefficients
12

between EQ-Short score and SQ-Short score was r = - 0.149 (p<0.01) (r = 0.031, p = n.s.
in males and r = - 0.069, p<0.05 in females).
Table 4 about here
3.3. Investigating the E – S theory by using the EQ-Short and SQ-Short
The results obtained in multivariate analyses and internal consistencies suggest that the
EQ-Short and the SQ-Short are reliable and adequate to measure individual differences
in empathizing and systemizing.
In addition to testing for sex differences, we analyzed the results according to
degree/area of study to compare students between studying humanities vs. sciences,
using definitions from former studies (Baron-Cohen, Wheelwright, Skinner, Martin, &
Clubley, 2001; Wakabayashi et al., in press) in order to examine the validity of the E–S
13
theory. 1
Mean EQ-Short and SQ-Short scores for each degree type are also shown in Table 4.
Comparing groups using an ANOVA on the EQ-Short score by Sex and Degree, there
was a main effect of Sex (F (1, 1757) = 177.623, p<0.001), female students scoring
higher than male students. There was also a main effect of Degree (F (1, 1757) = 53.669,
p<0.001), the students studying humanities scoring higher than students studying
sciences. There was no Degree by Sex interaction. Similarly, comparing groups using an
ANOVA on the SQ-Short score by Sex and Degree, there was a main effect of Sex (F (1,
1757)= 472.649, p<0.001), male students scoring higher than female students. There
was again a main effect of Degree (F (1, 1757) = 388.156, p<0.001), the sciences
students scoring higher than the humanities students. There was no interaction of Sex by
Degree on the SQ-Short either.
3.4. Brain types
1 Footnote
14

Finally, we examined the differences of numbers in each ‘brain type’ in terms of males
and females, and humanities vs. sciences students. We transformed the raw EQ-Short
and SQ-Short scores from each participant into standard (T) scores. Then we subtracted
the standard EQ-Short (T) score from the standard SQ-Short (T) score for each
participant. We call this difference score ‘D’. A high D score can be attained either by a
high SQ-Short score with a low EQ-Short score, or vice versa. A low D score means the
difference between scores in the EQ-Short and SQ-Short is small. The greater the D
score in a positive direction, the stronger is one’s systemizing, and the greater the D
score in a negative direction, the stronger one’s empathizing.
A D score falling below plus/minus ten (-10<D<10: within plus/minus 1 SD) is termed a
brain of type B (Balanced brain), from ten to below twenty (10<D<20) is type S, and
twenty and over (D>20) is the extreme type S. A D score falling from minus ten to above
minus twenty (-10>D>-20) is a brain of type E, and minus twenty and below (D<-20) is
an extreme type E. The percentages of participants fitting each brain type are shown in
15
Table 5. The distribution of extreme type E and type E was greater in females than in
males, whilst the proportion of extreme type S and type S was greater in males than in
females. The proportion of extreme type E and type E were greater in students studying
humanities than among students studying sciences, whilst the proportion of extreme type
S and type S were greater in sciences students than those studying humanities. These
results were confirmed by a chi-square by sex (chi-square = 46.131, df = 4, p<0.001),
and by degree (chi-square = 24.203, df = 4, p<0.001).
Table 5 about here
4. Discussion
In this study, we examined the psychometric properties of the EQ and SQ, and
shortened the scales in order to reduce them to their essential items. Then, we tested the
E-S theory of sex differences (Baron-Cohen, 2002) using the revised EQ (EQ-Short)
and SQ (SQ-Short). Results of principal component analyses suggested that about half
16

the items were adequate to measure empathizing and systemizing respectively. The
EQ-Short and SQ-Short were therefore constructed from 22 items and 25 items
respectively. The internal consistency of each scale rose compared with their original
40-item scales, suggesting that the original scales contained some unnecessary items.
The result of factor analysis by combining the EQ-Short and SQ-Short revealed that two
factors corresponded to the empathizing and systemizing, and confirmed their
independence.
As expected from the E–S theory, females scored significantly higher than males on the
EQ-Short, and males scored significantly higher than females on the SQ-Short. This
result replicates other studies using the original EQ and SQ (Baron-Cohen et al., 2003;
Lawson, Baron-Cohen & Wheelwright, 2004). Regarding the area of study among the
students, students in the humanities scored higher than students in the sciences on the
EQ-Short, and reverse was shown on the SQ-Short. Although the EQ-Short and
SQ-Short were inversely correlated (r = - 0.149), the size of the correlation coefficient
was very low, suggesting the two scales are almost independent of each other. In support
17

of this view, the correlations between the two scales calculated in males and females
separately were close to zero (r = 0.031 in males, and r = - 0.069 in females). However,
there may be some trade-off between these two cognitive styles. This is suggested from
the results comparing the degrees of the students participating. Students in the
humanities scored significantly higher on the EQ-Short, and significantly lower on the
SQ-Short, compared with the students in the sciences.
There were also clear sex differences, and effects of degree type, on the 5 brain types.
41% of females showed types E (type E or extreme type E) and 12% of females showed
types S (type S or extreme type S). In contrast, 47% of males showed types S whilst
about 7% of males showed types E (type E or extreme type E). 38% of humanities
students showed types E and 13% of them showed types S. In contrast, 17% of science
students studying sciences showed types E, and 40% of them showed types S. These
patterns of distribution are very similar to those found in the original EQ and SQ
(Goldenfeld, et al., in press).
18
It might be suggested that empathizing has been amply investigated under the name of
“emotional intelligence” and shares large parts of variance with this concept, and
systemizing relates to the mental capacity of reasoning as measured by many
intelligence tests. However, the SQ is uncorrelated with the Raven’s Matrices as an
index of IQ (Billington, Wheelwright, Baron-Cohen, Parekh, & Hoxley, submitted). We
plan to test the relationship between the EQ and emotional intelligence measures in
future studies.
This study suggests that it is important to investigate individual differences in cognitive
styles as well as those in personality. Future studies will need to test the external validity
for the EQ and SQ, such as comes from the relation between the SQ and mathematical
ability or mental rotation and between the EQ and the theory of mind task. These studies
have been proceeding in our lab. We conclude that the EQ-Short and the SQ-Short may
be more useful methods for testing such individual differences in cognitive styles.
Finally, some limitations are remained. This study has been administered within
19

university students, and Cambridge University students could not be the representative
sample as normal population. It would need further investigation in different
populations.
20
Acknowledgements
This study was supported by research grant (Grant-in-Aid for Scientific Research) to the
first author from the Japan Society for the Promotion of Science. SBC and SW were
supported by the MRC and the Nancy Lurie Marks Family Foundation during the period
of this work.
Footnote 1
Sciences included Physical Sciences (mathematics, physics, chemistry, computer
science, engineering, etc.) and Biological Sciences (biology, neuroscience, physiology,
medicine, genetics, pharmacology, etc.). Humanities included Humanities (classics,
languages, education, law, history, philosophy, etc.) and Social Sciences (economics,
commerce, social and political sciences, archaeology, etc.). We acknowledge that some
Humanities (such as law or linguistics) or Social Sciences (such as economics) involve
more systemizing than others, but these ways of dividing degree subjects may still
capture some important differences between the highly lawful physical sciences and less
lawful domains.
21
References
Baron-Cohen, S. (2002). The extreme male brain theory of autism. Trends in
Cognitive Sciences, 6, 248-254.
Baron-Cohen, S., & Wheelwright, S. (2004). The Empathizing Quotient (EQ): an
investigation of adults with Asperger Syndrome and high-functioning autism, and
normal sex differences. Journal of Autism and Developmental Disorders, 34, 163-
175.
Baron-Cohen, S., Richler, J., Bisarya, D., Gurunathan, N., & Wheelwright, S. (2003).
The systemizing quotient: an investigation of adults with Asperger Syndrome or high-
functioning autism, and normal sex differences. In U. Frith & E. Hill (Eds.),
Autism: mind and brain. (Pp.161-186.) Oxford: Oxford University Press.
Baron-Cohen, S., Wheelwright, S., Skinner, R., Martin, J, & Clubley, E. (2001). The
Autism-Spectrum Quotient (AQ): evidence from Asperger Syndrome/high-
functioning autism, males and females, scientists and mathematicians. Journal of
Autism and Developmental Disorders, 31, 5-17.
22
Benbow, C.P. (1988). Sex differences in mathematical reasoning ability in intellectually
talented preadolescents: their nature, effects, and possible causes. Behavioral Brain
Sciences, 11, 169-232.
Billington, J., Wheelwright, S., Baron-Cohen, S., Parekh, A., & Hoxley, C. (submitted).
The Systemizing Quotient-Revised (SQ-R) correlates with performance measures of
systemizing and is independent of IQ.
Geary, D. (1996). Sexual selection and sex differences in mathematical abilities.
Behavioral Brain Sciences, 19, 229-284.
Goldenfeld, N., Baron-Cohen. S., Wheelwright, S., Ashwin, C.,& Chakrabarti, B. (in
press). Empathizing and systemizing in males and females, and in autism spectrum
conditions. In T. Farrow (Ed.), Empathy and mental illness. Cambridge: Cambridge
University Press.
Hall, J.A. (1978). Gender effects in decoding nonverbal cues. Psychological Bulletin,
85, 845-858.
Lawson, J., Baron-Cohen, S.,& Wheelwright, S. (2004). Empathizing and systemizing
in adults with and without Asperger Syndrome. Journal of Autism and
23
Developmental Disorders, 34, 301-310.
Wakabayashi, A., Baron-Cohen, S., Wheelwright, S., & Tojo, Y. (in press). The Autism-
Spectrum Quotient in Japan: Cross-cultural comparison. Journal of Autism and
Developmental Disorders.
24

Table 1 Mean scores (and SDs) of the EQ and SQ in original items N EQ SQ All participants 1761 44.3 (12.23) 27.5 (12.43) Males 723 39.0 (11.56) 33.1 (11.78) Females 1038 48.0 (11.28) 23.7 (11.37)
1

Table 2 Loadings of PCA of the EQ and SQ EQ-item loadings SQ-item loadings 34 0.751 8 0.736 14 0.711 10 0.642 22 0.702 22 0.623 28 0.642 12 0.602 36 0.634 3 0.599 15 0.633 39 0.588 35 0.613 5 0.584 13 0.605 14 0.580 26 0.582 35 0.568 12 0.579 34 0.558 29 0.566 25 0.554 1 0.557 6 0.530 11 0.552 27 0.523 38 0.534 23 0.508 31 0.517 28 0.504 4 0.505 30 0.490 8 0.505 21 0.483 9 0.460 32 0.480 3 0.449 9 0.479 18 0.448 16 0.443 21 0.427 20 0.434 39 0.419 37 0.416 7 0.377 33 0.412 20 0.364 7 0.410 27 0.359 24 0.410 19 0.329 25 0.340 33 0.327 15 0.328 32 0.312 38 0.317 40 0.306 36 0.309 16 0.296 13 0.277 30 0.269 11 0.260 2 0.264 1 0.254 5 0.253 2 0.232 24 0.249 29 0.215 23 0.226 40 0.191
2

17 0.166 4 0.145 10 0.156 26 0.128 37 0.137 12 0.102 25 0.112 17 0.100 6 0.042 31 0.051 The items of the EQ-Short and SQ-Short were shown in italics
3

Table 3 Rotated factor loadings of the items in the EQ-Short and SQ-Short Item Factor I Factor II EQ 1 0.564 0.082 EQ 3 0.441 - 0.097 EQ 4 0.509 0.030 EQ 8 0.499 - 0.028 EQ 9 0.459 - 0.003 EQ11 0.567 0.104 EQ12 0.566 - 0.150 EQ13 0.603 - 0.028 EQ14 0.711 - 0.022 EQ15 0.639 0.036 EQ18 0.434 - 0.082 EQ21 0.429 0.040 EQ22 0.705 - 0.014 EQ26 0.594 0.118 EQ28 0.641 - 0.043 EQ29 0.576 0.077 EQ31 0.499 - 0.115 EQ34 0.754 0.006 EQ35 0.617 0.005 EQ36 0.644 0.042 EQ38 0.541 0.121 EQ39 0.406 - 0.167 SQ14 - 0.091 0.570 SQ33 - 0.026 0.404 SQ 3 - 0.027 0.601 SQ10 - 0.060 0.634 SQ25 - 0.080 0.544 SQ39 - 0.140 0.564 SQ28 - 0.109 0.492 SQ23 - 0.145 0.491 SQ 7 - 0.091 0.406 SQ 8 - 0.224 0.702 SQ16 0.007 0.446
4

SQ21 - 0.074 0.463 SQ37 - 0.019 0.407 SQ 5 - 0.161 0.567 SQ 6 - 0.142 0.507 SQ34 - 0.063 0.556 SQ27 - 0.045 0.524 SQ30 0.011 0.492 SQ12 - 0.122 0.587 SQ24 0.107 0.420 SQ27 - 0.062 0.615 SQ32 0.001 0.477 SQ 9 - 0.159 0.451 SQ20 0.057 0.448 SQ35 - 0.117 0.548 Cont. 8.747 8.213
5

Table 4 Mean score (and SDs) of the EQ-Short and SQ-Short Group (N) N EQ-Short SQ-Short All participants 1761 23.8 (8.75) 19.0 (10.05) Males 723 20.7 (8.46) 24.1 (9.55) Females 1038 26.0 (8.27) 15.4 (8.77) Humanities 867 25.3 (8.32) 15.0 (8.84) Sciences 894 22.4 (8.92) 22.8 (9.68) Males: 304 Humanities and 419 Sciences; Females: 563 Humanities and 475 Sciences.
6

Table 5 The distribution of the five cognitive styles (brain types) (%) Extreme E Type E Type B Type S Extreme S Males 1.4 5.8 45.9 24.1 22.8 Females 15.4 25.9 46.6 8.5 3.6 Humanities 14.8 22.8 49.7 9.5 3.2 Sciences 4.7 12.6 43.1 20.1 19.5
7

Appendix: List of items of EQ-Short and SQ-Short Empathy Quotient 1. I can easily tell if someone else wants to enter a conversation. 3. I really enjoy caring for other people. 4. I find it hard to know what to do in a social situation.* 8. I often find it difficult to judge if something is rude or polite.* 9. In a conversation, I tend to focus on my own thoughts rather than on what my listener might be thinking.* 11. I can pick up quickly if someone says one thing but means another. 12. It is hard for me to see why some things upset people so much.* 13. I find it easy to put myself in somebody else’s shoes. 14. I am good at predicting how someone will feel. 15. I am quick to spot when someone in a group is feeling awkward or uncomfortable. 18. I can’t always see why someone should have felt offended by a remark.* 21. I don’t tend to find social situations confusing. 22. Other people tell me I am good at understanding how they are feeling and what they are thinking. 26. I can easily tell if someone else is interested or bored with what I am saying. 28. Friends usually talk to me about their problems as they say that I am very understanding. 29. I can sense if I am intruding, even if the other person doesn’t tell me. 31. Other people often say that I am insensitive, though I don’t always see why.* 34. I can tune into how someone else feels rapidly and intuitively. 35. I can easily work out what another person might want to talk about. 36. I can tell if someone is masking their true emotion. 38. I am good at predicting what someone will do. 39. I tend to get emotionally involved with a friend’s problems. Systemizing 3. If I were buying a car, I would want to obtain specific information about its engine capacity. 5. If there was a problem with the electrical wiring in my home, I’d be able to fix it myself. 6. I rarely read articles or web pages about new technology.* 7. I do not enjoy games that involve a high degree of strategy.* 8. I am fascinated by how machines work. 9. In math, I am intrigued by the rules and patterns governing numbers. 10. I find it difficult to understand instruction manuals for putting appliances together.*
8
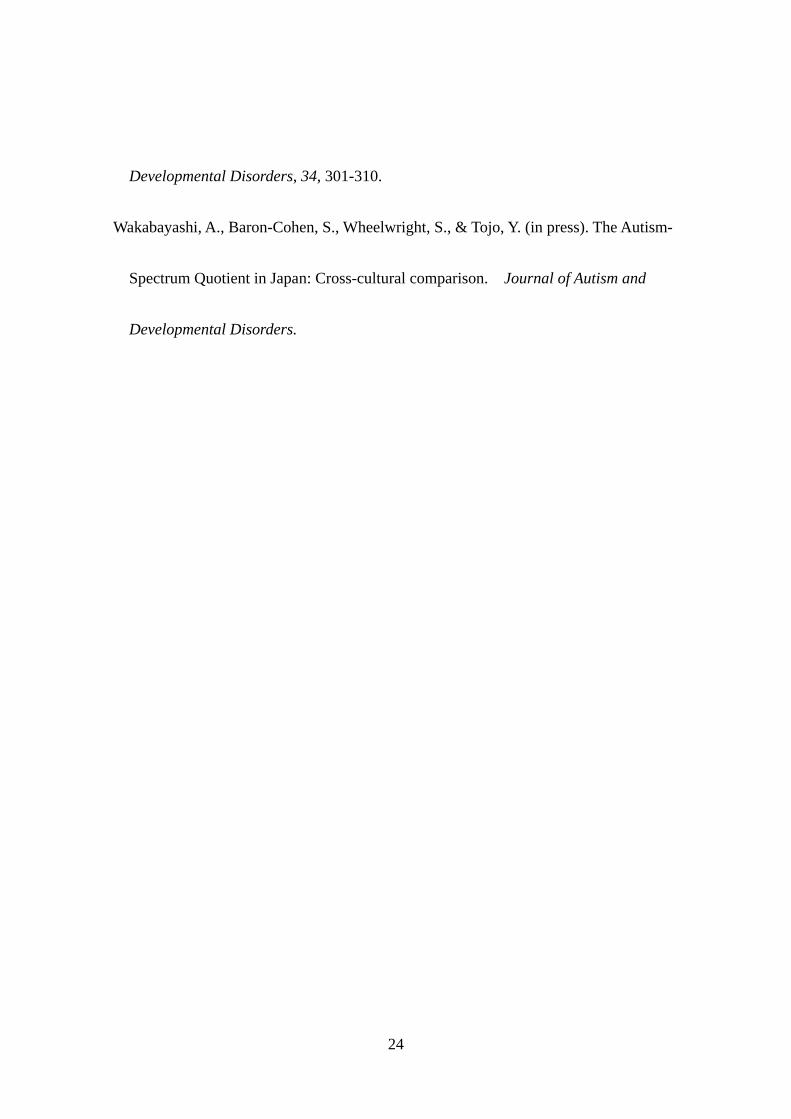
12. If I were buying a computer, I would want to know exact details about its hard disc drive capacity and processor speed. 14. I find it difficult to read and understand maps.* 16. When I look at a piece of furniture, I do not notice the details of how it was constructed.* 20. I find it difficult to learn my way around a new city.* 21. I do not tend to watch science documentaries on television or read articles about science and nature.* 22. If I were buying a stereo, I would want to know about its precise technical features. 23. I find it easy to grasp exactly how odds work in betting. 24. I am not very meticulous when I carry out D.I.Y.* 25. When I look at a building, I am curious about the precise way it was constructed. 27. I find it difficult to understand information the bank sends me on different investment and saving systems.* 28. When travelling by train, I often wonder exactly how the rail networks are coordinated. 30. If I were buying a camera, I would not look carefully into the quality of the lens.* 32. When I hear the weather forecast, I am not very interested in the meteorological patterns.* 33. When I look a mountain, I think about how precisely it was formed. 34. I can easily visualize how the motorways in my region link up. 35. When I’m in a plane, I do not think about the aerodynamics.* 37. I am interested in knowing the path a river takes from its source to the sea. 39. I am not interested in understanding how wireless communication works.* Nos. of items are in original versions. * reversal items
9


![Adaptive Mesh Refinement Computation of Solidification ...guava.physics.uiuc.edu › ~nigel › REPRINTS › 1999 › Provatas Adaptiv… · theoretical progress [4–6]. These](https://img.dokumen.tips/doc/110x75/5f04081d7e708231d40bfaa4/adaptive-mesh-reinement-computation-of-solidiication-guava-a-nigel-a.jpg)