Embed Size (px)
Citation preview

İNAN / Okul Öncesi Öğretmen Adaylarının Bilimsel Süreç Becerilerine İlişkin Alan Bilgileri... • 2001
The Sampling Issues in Quantitative Research
Ali DELİCE*
AbstractA concern for generalization dominates quantitative research. For generalizability and re-peatability, identification of sample size is essential. The present study investigates 90 qu-alitative master’s theses submitted for the Primary and Secondary School Science and Mathematics Education Departments, Mathematic Education Discipline in 10 universi-ties in Turkey between 1996 and 2007, in terms of “Population and Sample” using docu-ment analysis. Coding is used to analyze the data and results are presented by using desc-riptive statistics. Most of the theses were found to include a few lines of information on population and sample, and a few presented the characteristics of the sample in detailed tables, though without any information on the selection criteria were given. Randomiza-tion in random sampling, which is frequently used, was usually limited to unbiased assign-ment of two classes out of four within a school. No attention was paid to the appropria-teness of the sample size and to the analysis techniques employed. Effect size was calcu-lated in only one dissertation, but was not taken into account in the identification of the sample size. Normality tests also indicated some challenges. The effects of sample size on
reliability assessment were not taken into account.
Key WordsSampling Technique, Sample Size, Effect Size, Mathematics Education, Examining Dis-
sertations.
**Correspondence: Assist. Prof. Ali DELİCE, Marmara University Faculty of Atatürk Education, Department of Secondary Science and Mathematics Education, Mathematics Education 34722 Kadıköy-İstanbul/Tur-
key. E-mail: [email protected]
Kuram ve Uygulamada Eğitim Bilimleri / Educational Sciences: Theory & Practice10 (4) • Autumn 2010 • 2001-2018
© 2010 Eğitim Danışmanlığı ve Araştırmaları İletişim Hizmetleri Tic. Ltd. Şti.

2002 • EDUCATIONAL SCIENCES: THEORY & PRACTICE
Quantitative research predominantly assumes a positivist world view (Henn, Weinstein & Foard, 2006, p. 27) which are called paradigms and tied to research techniques firmly (Hughes, 1990, s. 11). Moreover, Guba and Lincoln (1994, s. 105) think that paradigms are superior to methods of enquiry in research. Quantitative research paradigm em-phasizes the importance of generalizability and reliability (Henn et al., 2006, p. 16). The aim is to apply the relationship obtained among vari-ables to the general, i.e. the population. That is why the selection of a sample representative of the population is essential (Karasar, 1999).
Master thesis is one of the first places where scientific studies conducted by provisional academicians. Therefore, analyzing these theses may re-veal weak parts and also develop conducting research by definite princi-ples such as defining research techniques and population and sampling. The research studies on Turkish theses are usually about their structures. Aksoy and Dilek (2005) investigated the dissertations/theses with re-spect to the order given in contents of the theses and found that title is not reflecting the chapters/sections. Türer (2005) highlights the scien-tific quality of theses and the responsibility of the supervisors for their students to be a researcher. Özdemir and Arı (2005) examined 20 theses which are randomly chosen with respect to their topics, contents, and methodologies to reveal what is studied most and what is not. Ramazan, Öztuna and Dibek (2005) examined 91 dissertations/theses in terms of sections and their titles whether there is any coherency or not and they found that no criteria used to define population and sampling of the study. Moreover, they also revealed that researchers misused reliability and validity in their dissertations. Demirel, Ayvaz and Köksal (2005) investigated all doctoral dissertations finished between 1995 and 2005 in terms of their topic and methodologies. They found that researchers prefer to use quantitative rather than qualitative approaches in their studies.
The reliability of research is closely related to its repeatability (Altunışık, Coşkun, Bayraktaroğlu & Yıldırım, 2004). When writing up, the re-searcher should pay special attention to present information about the characteristics of the sample including details on sampling strategies which would enable others to repeat the research (Henn et al., 2006, p. 238). Based on the research findings of Uğurlu, Delice and Kork-maz (2007) and Uğurlu and Delice (2008) this study qualitatively ex-amines quantitative master’s theses in mathematics education in terms

DELİCE / The Sampling Issues in Quantitative Research • 2003
of the appropriateness of (1) the characteristics of the population, (2) the sampling technique used, (3) the size of the sample and selection criteria, and (4) the characteristics of the population and data analysis techniques used.
Method
To investigate quantitative master theses conducted in Turkey “written documents” (Robson, 2002, p. 348) are examined by document analyz-ing techniques and using qualitative approaches (Cohen, Manion & Morrison, 2000, p. 102). The most significant difference of document analysis compared to other research techniques is the analysis of “writ-ten documents”, which avoids researcher influence on the data as in questionnaires, observations and interviews. Documents are by no means affected by the researcher’s inference and are ready resources which could always be revisited. The frequently used techniques into analyze the written documents is content analysis (Robson, 1993, p. 272; Robson, 2002, p. 349).
Sampling
The present study evaluates 90 master’s level theses submitted for the Primary and Secondary School Science and Mathematics Education Departments, Mathematic Education Discipline of 10 universities in Turkey between 1996 and 2007. The evaluation consists of the “Popu-lation and Sampling” sections of these theses in terms of the research population, sampling technique, sample size, selection rationale and re-lated references with a qualitative perspective which allows a thorough analysis. The distribution of theses in relation to universities and years are presented in Table 1 and 2. Due to the rearrangement of Education Faculties in 1996 (Sılay & Gök, 2005) theses submitted prior to this date were not included in the analysis. In line with the recommenda-tions of Uğurlu et al. (2007) only master’s theses and again with that of Uğurlu and Delice (2008) only theses with a quantitative paradigm were included. Thus, the present research comprises all quantitative master’s theses in mathematics education which could be accessed via the National Thesis Center1. Therefore, the study employs a purposeful sampling technique for non-probability sampling (Patton, 1990).
1 Random sampling was not possible because author permission was yet to be received for many of the dissertations. Again due to the same reason, the number of accessible dissertations might have changed since then.
The Sampling Issues in Quantitative Research

2004 • EDUCATIONAL SCIENCES: THEORY & PRACTICE
Table 1. Distribution of Theses According to Years
1996
1997
1998
1999
2000
2001
2002
2003
2004
2005
2006
2007
Number of Theses
2 2 5 2 10 8 13 12 8 9 16 3
Table 2. Distribution of Theses According to UniversityUniversity Number of Theses
Boğaziçi University 18
Middle East Technical University 3
Hacettepe University 8
Gazi University 17
Dokuz Eylül University 9
Marmara University 12
Selçuk University 11
Erzurum Atatürk University 2
Yüzüncü Yıl University 5
Balıkesir University 5
Total 90
Data Analysis
The qualitative data collected by written documents (theses) need to be analyzed to make sense about the situation, noting patterns and catego-ries (Cohen et al., 2000, p. 147). Coding is one of the ways to analyze the qualitative data, so that data gathered by theses were categorized in terms of themes relevant to research aims which are; population, sam-pling technique, sample size, research design, effect size. Descriptive statistics was utilized to analyze and present the findings. All docu-ments are examined with respect to each theme and then by using main and well known sources from the relevant literature (Baykul, 1999; Co-hen et al., 2000; Karasar, 1999; Patton, 1990) all categorizations are constructed under each theme. Since, in some theses, a section need to be in methodology chapter can be found in some other chapters each dissertation is read from first page to last page to categories the data.

DELİCE / The Sampling Issues in Quantitative Research • 2005
The reliability of a research instrument concerns the extent to which the instrument yields the same results on repeated trials by different people. The tendency toward consistency found in repeated measure-ments is referred to as reliability (Miles & Hubberman, 1994). To categories the data main and well known sources from the relevant literature are used and non applicable data are coded as “not given” or “not described” to prevent to subjectivity of the researcher. Reli-ability of the research was calculated almost 100 percent and since it is greater than 90 % consistency was accepted for reliability (Miles & Hubberman, 1994).
Findings
The findings could be grouped as selection of the “population”, “sam-pling technique” preferred, “sample size” on which the research was conducted, “research design” which affects the sample size, “effect size”, “data analysis methods”, “normality tests” and “reliability tests” especial-ly as part of data analysis methods and “references”. Findings on refer-ences were in line with the findings of Uğurlu and Delice (2008) and Uğurlu, Delice and Korkmaz (2007) and thus were not included here in order to avoid repetition.
Population
The distribution of the investigated theses in terms of their popula-tion is presented in Table 3. As Table 3 shows, almost one third of the theses (29%) do not include any information on the population leaving it unclear how and in relation to what the population was identified. Although a lack of explicit specification of the concept of population, which could be defined as the set to which the findings will be general-ized, is not a shortcoming for a qualitative dissertation; it is crucial in identifying the sampling technique, the sample size and the members of the sample for a quantitative dissertation. Frequently (16%), the re-search population was a year group in a school and the sample was 1-2 classes in that year group.
2006 • EDUCATIONAL SCIENCES: THEORY & PRACTICE
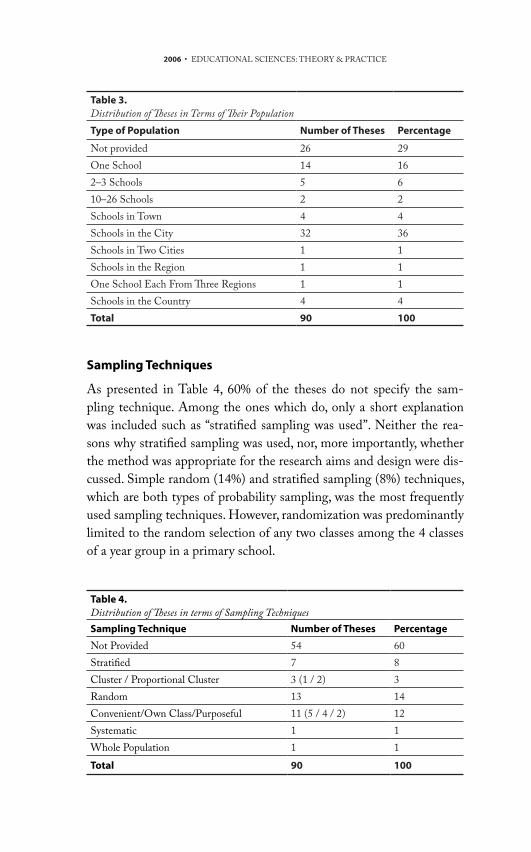
Table 3.Distribution of Theses in Terms of Their PopulationType of Population Number of Theses Percentage
Not provided 26 29One School 14 162–3 Schools 5 610–26 Schools 2 2Schools in Town 4 4Schools in the City 32 36Schools in Two Cities 1 1Schools in the Region 1 1One School Each From Three Regions 1 1Schools in the Country 4 4Total 90 100
Sampling Techniques
As presented in Table 4, 60% of the theses do not specify the sam-pling technique. Among the ones which do, only a short explanation was included such as “stratified sampling was used”. Neither the rea-sons why stratified sampling was used, nor, more importantly, whether the method was appropriate for the research aims and design were dis-cussed. Simple random (14%) and stratified sampling (8%) techniques, which are both types of probability sampling, was the most frequently used sampling techniques. However, randomization was predominantly limited to the random selection of any two classes among the 4 classes of a year group in a primary school.
Table 4. Distribution of Theses in terms of Sampling TechniquesSampling Technique Number of Theses Percentage
Not Provided 54 60Stratified 7 8Cluster / Proportional Cluster 3 (1 / 2) 3Random 13 14Convenient/Own Class/Purposeful 11 (5 / 4 / 2) 12Systematic 1 1Whole Population 1 1Total 90 100

DELİCE / The Sampling Issues in Quantitative Research • 2007
The Size of the Sample
The distribution of the investigated theses in terms of their sample sizes are presented in Table 5. In an effort to increase reliability, 30% of the theses keep sample sizes as big as possible (more than 250). On the other hand, the sample size in 40% of the theses is under 50. Sam-ple size is important especially for data analysis methods to be used. For this purpose, readily available tables have been developed to meet a number of criteria (for example: Research Advisor, 2007). However, these criteria were not considered and no reference to tables was ob-served in the theses.
Table 5. Distribution of Theses in terms of Sample Sizes 2
Minimum Maximum Number of Theses Percentage
1 14 3 3
15 29 16 18
30 50 17 19
51 100 12 13
101 250 12 13
251 500 12 13
501 1000 11 12
1001 2500 3 3
>2501 1 1
Not Provided 3 3
Total 90 100
The2 criteria for sample size are determined by the studies of Krejcie and Morgan (1970) and Cochran (1977) (cited in Cohen et al., 2000; Lodico, Spaulding & Voegtle, 2006). There are also software (Morse, 1999) and spreadsheets which calculates the needed sample size with respect to analysis techniques and defined significant values. The re-searcher should decide on an appropriate size for sample depending on the research topic, population, aim of the research, analysis tech-niques, sample size in similar research, the number of the subgroups in the sample (Davies, Williams & Yanchar, 2004), population variability and research design (Hedeker, Gibbons & Waterneux, 1999; Davies et
2 In experimental research where groups are compared the number of participants in the smallest group was accepted as the sample size.

2008 • EDUCATIONAL SCIENCES: THEORY & PRACTICE
al., 2004). Although sample size between 30 and 500 at 5% confidence level is generally sufficient for many researchers (Altunışık et al., 2004, s. 125), the decision on the size should reflect the quality of the sample in this wide interval (Morse, 1991, 2000; Thomson, 2004).
Research Design
Decision on design in accordance with the research aims would have an impact on the size of the sample. Borg and Gall (1979) simply present the following criteria in determining sample size in relation to the re-search method (cited in Cohen et al., 2000, p. 93):
• If the research has a relational survey design, the sample size should not be less than 30.
• Causal-comparative and experimental studies require more than 50 samples.
• In survey research, 100 samples should be identified for each major sub-group in the population and between 20 to 50 samples for each minor sub-group.
These suggestions are necessary requirements and should not be consid-ered as sufficient requirements. For example, if the smallest sub-group constitutes 5% of the entire population and if a relational survey is to be conducted, then the study should include at least 30 samples within this group and 600 in total (cited in Cohen et al., 2000, p. 93).
The distribution of the investigated theses in terms of their research de-sign is presented in Table 6. Most of the theses are experimental (47%) and only a quarter use appropriate sample size whilst the suggested sample size in these studies is minimum 50. Second most widely used research design was survey research (20%). Despite a flexible analysis in which the studies were considered to have met the above criteria if more than 50 participants in total took part, 4 theses were identified as insuf-ficient. Finally, one in four theses with a causal-comparative research design, where the suggested sample size is more than 50, was observed not to meet the criteria.

DELİCE / The Sampling Issues in Quantitative Research • 2009
Table 6. Distribution of Theses in Terms of Research Design 3
Research Design
Correct Incorrect Unknown Total
No % No % No % No %
Experimental Designs 11 12 31 34 - - 42 47
Relational Survey 4 4 - - - - 4 4
General Survey 12 13 4 4 24 2 18 20
Causal-Comparative 3 3 1 1 - - 4 4
Design not Provided - - - - - - 5 6
Effect Size
Effect3 size4 is a measurement of the difference between two groups inde-pendent of the variance between these two groups. In a study in which two teaching methods are compared, a difference of 1 in grades be-tween the two groups does not mean that every participating student’s mark increased 1 grade. Effect size is an expression of the effectiveness of the method used independent of this variability (inter-group vari-ance). That is why it is important to report effect size in social sciences research. However, in only one of the theses investigated in the current study was effect size calculated. Hinkle and Oliver (1983) state that ef-fect size should be specified prior to the specification of the sample size. Still, none of the theses were found to consider effect size in determin-ing the sample size.
The Appropriateness of Sample Size for Data Analysis Methods
In research, as well as data analysis methods, the qualities of the data also influence sample size. For example, if the data is distributed nor-mally, in a situation where a t-test would require 955 observations, a Wilcoxon signed-ranks test, at the same significance level, would re-quire 1000 observations (Kwam & Vidakovic, 2007, p. 3).
3 In experimental research which compare groups, the number of members of the smallest group was considered as the sample size.
4 In these dissertations, as the sample size was not reported quantitatively, appropriate-ness checks were not carried out.

2010 • EDUCATIONAL SCIENCES: THEORY & PRACTICE
Each data analysis method has requirements of its own (such as nor-mality). The findings of the central limit theory (Kwam & Vidakovic, 2007) are frequently interpreted to suggest that a group of 30 or more members selected from a given population would be normally distrib-uted (Baykul, 1999). However, this cannot be taken for granted. Wilcox (2010, p. 40) states that this number could reach 100 in certain contexts. Most frequently employed analysis techniques in the theses included in this study are presented in Table 7.
Table 7.Analysis Techniques Used in the Theses 5 Data Analysis Methods Number of Theses
t-test 52
Chi-square 6
F-test 5
ANOVA/ANCOVA/MANOVA 30 (26 / 3 / 1)
Pearson Correlation Coefficient 6
Regression Analysis 4
Factor Analysis 2
Effect Size 1
Kolmogorov-Smirnov 8
Kruskall-Wallis 5
Mann-Whitney 2
As5 shown in Table 7, the t-test is used in more than half of the theses (58%). Latest research regarding t-tests suggests that even minimal devi-ations from the normal distribution could cause unreliable results (Wil-cox, 2010, p. 79). Still, only 15 theses reported testing for normal distri-bution. One of the most widely used normality tests is the Kolmogorov-Smirnov normality test. A sample size of more than 50 is recommended for this test (Köklü, Büyüköztürk, & Çokluk-Bökeoğlu, 2006). However, only two of the theses satisfy this requirement. Moreover, literature in the area emphasizes that Kolmogorov-Smirnov normality test is out of date and should not be used anymore (D’Agostino & Stephens, 1986 cited in Kwam & Vidakovic, 2007, p. 96; Seier, 2002; Thode, 2002).
5 As more than one technique could be used in one dissertation, the general total is more than the number of dissertations. Some less known techniques which are used only once were not included in the list in order to avoid a long table. Similarly, post-hoc analysis techniques were removed from the table.
DELİCE / The Sampling Issues in Quantitative Research • 2011
In relation to the effect of sample size in data analysis; although cal-culations for the specification of the sample size required for a desired power or a specific sensitivity (for example, Cohen (1988) for Pearson correlation (1988); Donner and Elisaziw (1987) for within-group cor-relations; Bonett & Wright (2000) for Pearson, Spearman and Kendall correlations, Feldt & Ankenmann (1998, 1999) to check the equality of two alpha coefficients, etc. cited in Bonett, 2002) were carried out, the calculations were not taken into account in any of the theses investi-gated in this study.
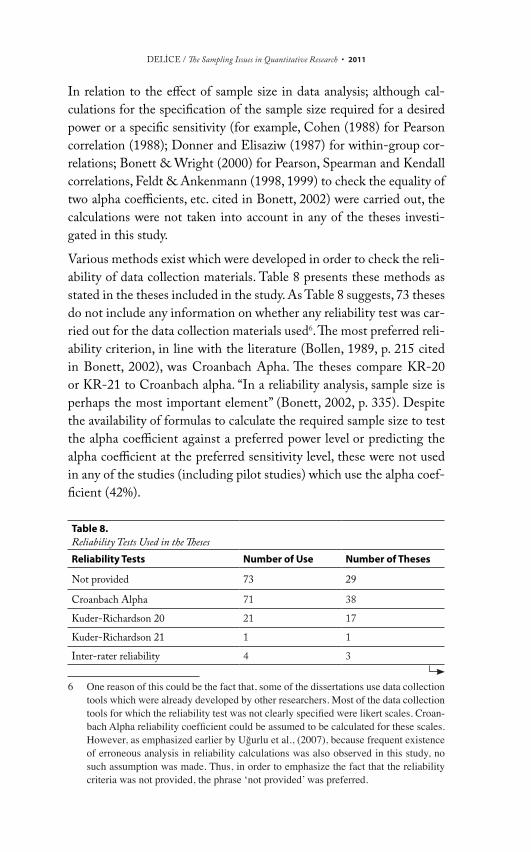
Various methods exist which were developed in order to check the reli-ability of data collection materials. Table 8 presents these methods as stated in the theses included in the study. As Table 8 suggests, 73 theses do not include any information on whether any reliability test was car-ried out for the data collection materials used6. The most preferred reli-ability criterion, in line with the literature (Bollen, 1989, p. 215 cited in Bonett, 2002), was Croanbach Apha. The theses compare KR-20 or KR-21 to Croanbach alpha. “In a reliability analysis, sample size is perhaps the most important element” (Bonett, 2002, p. 335). Despite the availability of formulas to calculate the required sample size to test the alpha coefficient against a preferred power level or predicting the alpha coefficient at the preferred sensitivity level, these were not used in any of the studies (including pilot studies) which use the alpha coef-ficient (42%).
Table 8. Reliability Tests Used in the ThesesReliability Tests Number of Use Number of Theses
Not provided 73 29
Croanbach Alpha 71 38
Kuder-Richardson 20 21 17
Kuder-Richardson 21 1 1
Inter-rater reliability 4 3
6 One reason of this could be the fact that, some of the dissertations use data collection tools which were already developed by other researchers. Most of the data collection tools for which the reliability test was not clearly specified were likert scales. Croan-bach Alpha reliability coefficient could be assumed to be calculated for these scales. However, as emphasized earlier by Uğurlu et al., (2007), because frequent existence of erroneous analysis in reliability calculations was also observed in this study, no such assumption was made. Thus, in order to emphasize the fact that the reliability criteria was not provided, the phrase ‘not provided’ was preferred.

2012 • EDUCATIONAL SCIENCES: THEORY & PRACTICE
Parallel Test 1 1
Test-Retest 1 1
Pearson Correlation Coefficient 2 2
Spearman-Brown 2 2
Discussions
Not only constructing research questions, deciding on the paradigms and best research techniques to answer the research questions but also sampling is vital for the quality of a research. Population and Sample, Sampling Technique, Sample Size, Effect Size, Research Design, Data Analysis, Normality Tests and Reliability Calculations are discussed in this subsection with respect to results and in addition to discussions in results.
Population and Sample
The identification of the minimum/most appropriate sample size de-pends on a careful and detailed planning of all stages of the research from its paradigm, to data collection materials and to data analysis tech-niques. Bailey (1978) states that experienced researchers initially iden-tify the population and then specify the particular study group to work with; inexperienced researchers, on the other hand, start with identify-ing the minimum study group size and then move towards the popula-tion (cited in Cohen et al., 2000). The latter orientation was observed in the theses.
Sampling Technique
According to Karasar (1999, p.116) the following steps should be fol-lowed “for good sampling; (1) description of the study population, (2) listing the members of the population, (3) identification of sampling type, (4) determining the sample size, (5) selecting the sample, and (6) testing the representation power of the sample”. However, the theses were observed not to follow this sequence.
One of the most important factors that indicate the quality of a research study is its repeatability (McNeil & Chapman, 2005, p. 9). And one cru-cial condition for repeatability is the selection of a similar sample (Henn et al., 2006). And this is only possible when detailed sample selection

DELİCE / The Sampling Issues in Quantitative Research • 2013
procedures are reported. However, the theses examined in the present study did not provide sufficient information on the sampling technique.
Muijs (2004, p. 38-41) lists the following points of caution in sampling7 : (1) “An unbiased selection of the sample is important in quantitative research which has a concern for generalization.” (2) “Unbiased sam-pling techniques are the ones which are random.” (3) “Sampling tech-niques, except simple random sampling, cannot be considered totally unbiased even if they are random.” For example, when using the cluster sampling technique, the researcher should also discuss the effects of the sampling technique. Most of the theses were conducted in one school. (4) However, “the schools are generally homogeneous in terms of the students registered at the school.” This results in a biased sample. This “makes it difficult to predict the characteristics of the population by statistical calculations.” The researcher should be aware of these issues.
Sample Size
The population size is neglected in “Population and Sampling” sections of the theses. In some theses, the sample size are bigger than it is sup-posed to be for the sake of reliability of the research, however there is no need to keep the sample size very high in terms of accessibility. It is possible to get more reliable results with better planning and smaller sample size. However in theses researchers do not take this into account and they do not use any criteria to describe sample size.
The population size is an important factor in sample size (Cohen et al., 2000; Lodico, Spaulding & Voegtle, 2006). Cochran (1977) and Kre-jcie & Morgan (1970) prepared tables which present the sample size in line with a certain degree of reliability and population size. Based on these tables, many researchers (for example, Yıldırım & Şimşek, 2006; Baykul, 1999; Ross, 2004) suggest that if parametric tests are to be em-ployed 30-500 subjects would be the necessary sample size; otherwise non-parametric analysis techniques should be used. These numbers are valid for the selection of a sample using random sampling techniques. However, in educational research, this is not always possible and rand-omization requirement cannot always be met, thus a heavy reliance on numbers may not be a sufficient representation. This is also an impor-tant point the researcher should be aware of.
7 The sections between the quotation marks are quoted from the relevant paper directly or without any meaning chances.
2014 • EDUCATIONAL SCIENCES: THEORY & PRACTICE
Effect Size
Another factor which affects the sample size is the effect size. When the effect size, the significance of which is to be presented, decreases; the required sample size increases (StatSoft, 2010). Harris (2001, p.7) states that for most of the widely used statistical calculations, tables have been created which provide the necessary sample size for a given power. However, Harris (2001) further notes that researchers rarely consult these tables and try to justify this with the complexity of the calculations required.
Research Design
Research design is another factor that influences sample size. Some rec-ommended numerical data for sample size exist in line with the research design (Cohen et al., 2000). If the researcher is to divert from these suggestions, s/he should provide the rationale behind it and should con-sider the emerging limitations.
Data Analysis
Generally in terms of data analysis, for example for correlation analysis, for Pearson, Spearman and Kendall correlation calculations, formulas or tables which provide what the number of members in a sample should be for a preferred power level are readily available (Cohen, 1988; Bonett & Wright, 2000; Donner & Elisaziw, 1987 cited in Bonett, 2002). Re-searchers should work with samples as recommended in these tables.
Normality Tests
Insufficient Turkish literature on normality (Genceli, 2006, 2007) was reflected in the theses. In fact, it is not possible for a sample selected from a population to be normal. What is important here is its prox-imity to the normal distribution (Thode, 2002). And this can only be revealed by normality tests. However, it is obvious that the two most frequently consulted normality tests (Kolmogorov-Smirnov and chi-square) are insufficient (Kwam & Vidakovic, 2007; Romao, Delgado & Costa, 2010; Thode, 2002). This study reveals that although the prob-lems are already known about the normality tests researchers seem to
DELİCE / The Sampling Issues in Quantitative Research • 2015
think standard analysis techniques are reliable and sufficient (Wilcox, 2005). National literature on normality tests needs to be improved. Re-searchers should apply the most powerful normality test appropriate for their own research.
Reliability Calculations
The most used techniques in reliability calculations are Croanbach al-pha and KR-20, which, however, may give pretty different results (0.98 and 0.55 respectively) (Vural, 1999; cited in Erkuş, 2007). Interestingly, there is no technique given in reliability calculations in less than half of the theses. Bonett (2002) developed formulas in relation to required sample sizes necessary to calculate the Croanbach alpha coefficient at a given power level or predicting it at a certain sensitivity level. However, none of the theses investigated in this study took these criteria into ac-count. These should be paid special attention especially in pilot studies.
Suggestions
This study showed that the new statistical techniques are rarely used in the methodology chapters. So, supervisors are suggested to help their students update themselves with the new approaches of statistical analysis techniques. Moreover, effect size is not very much known and used in theses so that it may be taken into account in new research. It is also suggested that a similar study may be conducted for the qualitative Ph.D./Ed.D. theses and M.Ed. theses and quantitative Ph.D./Ed.D. dissertations to see what is going on in methodology chapters and in “population and sampling techniques” to reveal the weak and strong parts and to update the analyze part of the methodology chapters.
2016 • EDUCATIONAL SCIENCES: THEORY & PRACTICE
References/KaynakçaAksoy, M. & Dilek, D. (2005, Eylül). Lisansüstü tezlerde kullanılan yöntemler hakkında bir eleştiri: Marmara Üniversitesi Eğitim Bilimleri Enstitüsü örneği. II. Lisansüstü Eğitim Sempozyumunda sunulan bildiri, Marmara Üniversitesi, İstanbul.
Altunışık, R., Coşkun R., Bayraktaroğlu S. & Yıldırım E. (2004). Sosyal bilimlerde araştırma yöntemleri (3. bs). İstanbul: Sakarya Kitabevi.
Baykul, Y. (1999). İstatistik metotlar ve uygulamalar (3. bs). Ankara: Anı Yayıncılık.
Bonett, D. G. (2002). Sample size requirements for testing and estimating coefficient alpha. Journal of Educational and Behavioral Statistics, 27 (4), 335-340.
Cochran, W. G. (1977). Sampling techniques (3rd ed.). New York: Wiley.
Cohen, L., Manion, L. & Morrison, K. (2000). Reserch methods in education (5th ed.). London: Routledge/Falmer.
Davies, R. S., Williams, D. D. & Yanchar, S. C. (2004, November). The use of randomization in educational research and evaluation: A critical analysis of underlying assumptions. Paper presented at the annual meeting of the American Evaluation Association, Atlanta, GA.
Demirel, Ö., Ayvaz, Z. & Köksal, N. (2005, Eylül). Eğitim programları ve öğretim alanında yapılan tez çalışmaları. II. Lisansüstü Eğitim Sempozyumunda sunulan bildiri, Marmara Üniversitesi, İstanbul.
Erkuş, A. (2007). İstatistik paket programlarını doğru kullanabiliyor muyuz? Birkaç uyarı. http://www.psikolog.org.tr/articles_detail.asp?cat=4&id=21 adresinden 20 Eylül 2007 tarihinde edinilmiştir.
Genceli M. (2006). Tek değişkenli dağılımlarda normallik testleri: Sigma, YTÜ. Fen Bilimleri Dergisi, 4, 69-91. http://www.sigma.yildiz.edu.tr/2006-4-6-tam.pdf adresinden 23 Mayıs 2010 tarihinde edinilmiştir.
Genceli M. (2007). Tek değişkenli dağılımlar için Kolmogorov-Smirnov, Lilliefors ve Shaphiro-Wilk normallik testleri: Sigma, YTÜ. Fen Bilimleri Dergisi, 25 (4), 306-328. http://www.yildizgundem.com/wp-content/uploads/2009/11/2007-4-1-tam.pdf adresinden 23 Mayıs 2010 tarihinde edinilmiştir.
Guba E. G., & Lincoln Y. S. (1994). Competing paradigms in qualitative research. In N. Denzin & Y. Lincoln (Eds.), Handbook of Qualitative Research (p. 105-117). Thousand Oaks, CA: Sage.
Harris, R. J. (2001). A primer of multivariate statistics (3rd ed.). London: Lawrence Erlbaum Associates, Publishers.
Hedeker, D., Gibbons, R. D. & Waterneux, C. (1999). Sample size estimation for longitudinal designs with attrition: Comparing time-related contrasts between two groups. Journal of Educational and Behavioral Statistics, 24 (1), 70-93.
Henn, M., Weinstein, M. & Foard, N. (2006). A short ıntroduction to social research. London: Sage.
Hinkle, D. E. & Oliver, J. D. (1983). How large should the sample be? A question with no simple answer? or... Educational and Psychological Measurement, 43, 1051-1060.

DELİCE / The Sampling Issues in Quantitative Research • 2017
Hughes, J. (1990). The philosophy of social research. (Second Edition) London: Longman.
Karasar, N. (1999). Bilimsel araştırma yöntemi (9. bs). Ankara: Nobel.
Köklü, N., Büyüköztürk, Ş. & Çokluk-Bökeoğlu, Ö., (2006). Sosyal bilimler için istatistik (2. bs.). Ankara: PegemA Yayıncılık.
Krejcie, R. V. & Morgan, D. W. (1970). Determining sample size for research activities. Educational and Psychological Measurement, 30, 607-610.
Kwam, P. H. & Vidakovic, B. (2007). Nonparametric statistics with applications to science and engineering. New Jersey: A John Wiley & Sons, Inc.
Lodico M. G., Spaulding, D. T. & Voegtle K. H. (2006). Methods in educational research: From theory to practice. San Francisco, CA: Jossey-Bass Wiley.
McNeil, P. & Chapman, S. (2005). Research methods (3rd ed). NewYork: Routledge.
Miles, M. B. & Huberman, A. M. (1994). Qualitative data analysis: An expanded sourcebook (2nd ed.). London: Sage.
Morse, J. M. (1991). Strategies for sampling. In J. M. Morse (Ed.). Qualitative nursing research: A contemporary dialogue (pp. 127-145). Newbury Park, CA: Sage.
Morse, J. M. (1999). MINSIZE2: A computer program for determining effect size and minimum sample size for statistical significance for Univariate, Multivariate, and Nonparametric tests. Educational and Psychological Measurement, 59 (3), 518-531.
Morse, J. (2000). Determining sample size. Qualitative Health Research, 10 (1), 3-5.
Muijs, D. (2004). Doing quantiative research in education with SPSS. London: Sage.
Özdemir, M. Ç. & Arı, A. (2005, Eylül). Eğitim programları ve öğretimi bilim dalında yapılmış bazı doktora tezlerinin incelenmesi. II. Lisansüstü Eğitim Sempozyumunda sunulan bildiri, Marmara Üniversitesi, İstanbul.
Patton, M. Q. (1990). Qualitative evaluation and research methods (2nd ed.). Newbury Park, Calif: Sage Publication.
Ramazan, O., Öztuna, A. & Dibek, E. (2005, Eylül). Marmara Üniversitesi Eğitim Bilimleri Enstitüsü İlköğretim ABD’da yapılan yüksek lisans tezlerinin araştırma yöntem ve teknikleri açısından incelenmesi. II. Lisansüstü Eğitim Sempozyumunda sunulan bildiri, Marmara Üniversitesi, İstanbul.
Research Advisor (2007). Sample size table. http://www.research-advisors.com/documents/SampleSize-web.xls adresinden 17 Eylül 2007 tarihinde edinilmiştir.
Robson, C. (1993). Real world research: A resource for social scientists and practitioner-researchers (1st ed.). Oxford: Blackwell.
Robson, C. (2002). Real world research: A resource for social scientists and practitioner-researchers (2nd ed.). Oxford: Blackwell.
Romao, X., Delgado, R. & Costa, A. (2010). An empirical power comparison of univariate goodness-of-fit tests for normality. Journal of Stattistical Computation and Smilation, 80 (5), 545-591.
Ross, M. R. (2004). Introduction to probability and statistics for engineers and scientists. San Diego: Elsevier Academic Press.

2018 • EDUCATIONAL SCIENCES: THEORY & PRACTICE
Seier, E. (2002). Comparison of tests for univariate normality. Interstat 17. http://interstat.stat.vt.edu/InterStat/ARTICLES/2002/articles/J02001.pdf adresinden 24 Mayıs 2010 tarihinde edinilmiştir.
Sılay, İ. & Gök, T. (2005, Eylül). Fen ve Matematik eğitimi lisansüstü tezlerinin incelenmesi üzerine bir çalışma (Dokuz Eylül Üniversitesi örneği). II. Lisansüstü Eğitim Sempozyumunda sunulan bildiri, Marmara Üniversitesi, İstanbul.
StatSoft Inc. (2010). Electronic statistics textbook. Tulsa, OK: StatSoft. http://www.statsoft.com/textbook/ adresinden 25 Mayıs 2010 tarihinde edinilmiştir.
Thode, H. C. (2002). Testing for normality. New York: Marcel Dekker, Inc.
Thomson, S. B. (2004, September). Qualitative research: Grounded theory - sample size and validity. Paper presented at the meeting of the 8. Faculty Research Conference. Monash University, Marysville, Victoria. Retrieved September 17, 2004, from http://www.buseco.monash.edu.au/research/studentdocs/mgt.pdf.
Türer, C. (2005, Eylül). Yüksek lisans tezlerinin planlanması ve değerlendirilmesi. II. Lisansüstü Eğitim Sempozyumunda sunulan bildiri, Marmara Üniversitesi, İstanbul.
Uğurlu, R. & Delice, A. (2008, Ağustos). Araştırmalarda evren ve örneklem sorunu: Kimlerle ve kaç kişiyle çalışılmalı? VIII. Ulusal Fen Bilimleri ve Matematik Eğitimi Kongresinde sunulan bildiri, Abant İzzet Baysal Üniversitesi, Bolu.
Uğurlu, R., Delice, A. & Korkmaz, H. (2007, Ekim). Yöntem araştırmaların neresinde? III. Lisansüstü Eğitim Sempozyumunda sunulan bildiri, Anadolu Üniversitesi, Eskişehir.
Wilcox, R. R. (2005). Introduction to robust estimation and hypothesis testing (2nd ed.). London: Elsevier Academic Press.
Wilcox, R. R. (2010). Fundamentals of modern statistical methods: Substantially ımproving power and accuracy (2nd ed.). London: Springer.
Yıldırım, A. & Şimşek, H. (2006). Sosyal bilimlerde nitel araştırma yöntemleri (6. bs.). Ankara: Seçkin.