Embed Size (px)
Citation preview
Introducing
The SAES Getters GroupThe SAES Getters Group
LainateLainate, November 2004, November 2004
! World Market Leadership: in getter technology and gas purification
! Technology: focused core competencies supported by world class research
! Intellectual Property: since its foundation more than 300 basic international patents related to different technologies
! New Product Development: ongoing both internally and in cooperation with blue chip customers
! Vertical Integration
! Global Presence
The SAES Getters GroupThe SAES Getters Group
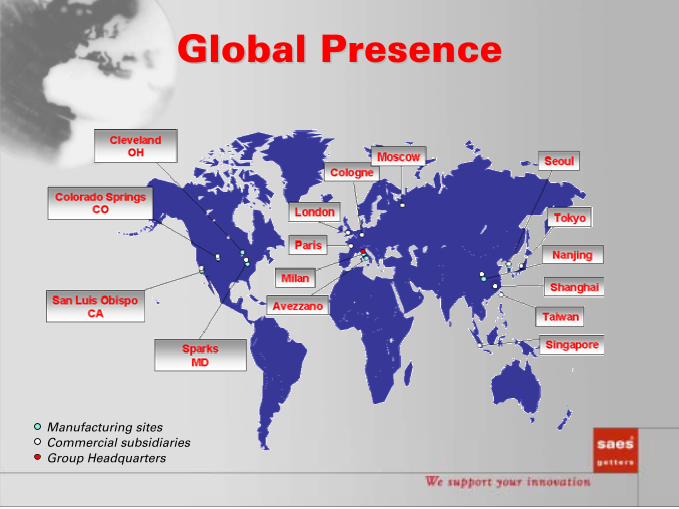
Global PresenceGlobal Presence
Manufacturing sitesCommercial subsidiariesGroup Headquarters
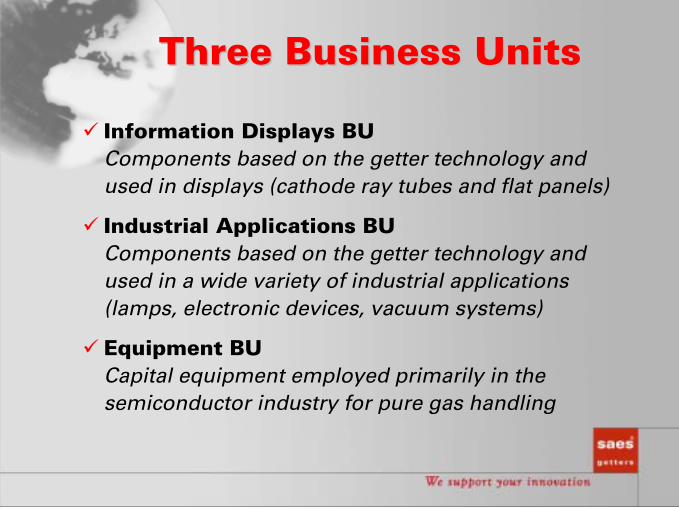
Three Business UnitsThree Business Units
! Information Displays BU Components based on the getter technology and used in displays (cathode ray tubes and flat panels)
! Industrial Applications BUComponents based on the getter technology and used in a wide variety of industrial applications (lamps, electronic devices, vacuum systems)
! Equipment BUCapital equipment employed primarily in the semiconductor industry for pure gas handling
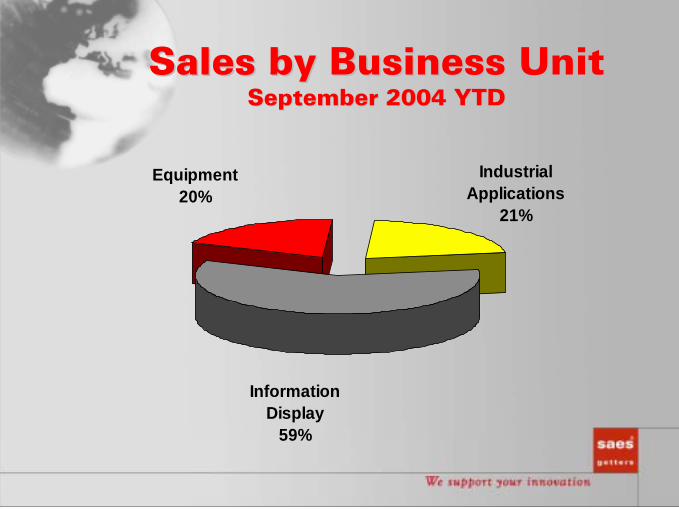
Industrial Applications
21%
Information Display
59%
Equipment20%
Sales by Business UnitSales by Business UnitSeptember 2004 YTDSeptember 2004 YTD
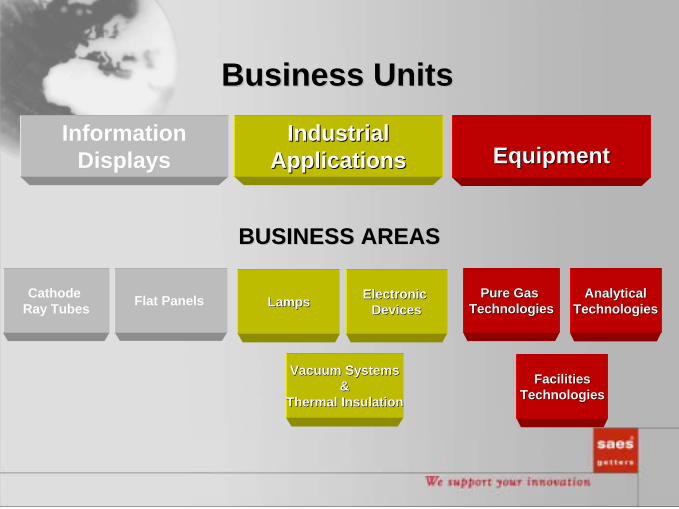
Cathode Cathode Ray TubesRay Tubes Flat Panels Flat Panels Electronic Electronic
DevicesDevices
Vacuum SystemsVacuum Systems&&
Thermal InsulationThermal Insulation
AnalyticalAnalyticalTechnologiesTechnologies
Pure Gas Pure Gas TechnologiesTechnologiesLampsLamps
BUSINESS AREASBUSINESS AREAS
Information Information Displays Displays EquipmentEquipment
Business UnitsBusiness Units
Industrial Industrial ApplicationsApplications
FacilitiesFacilitiesTechnologiesTechnologies
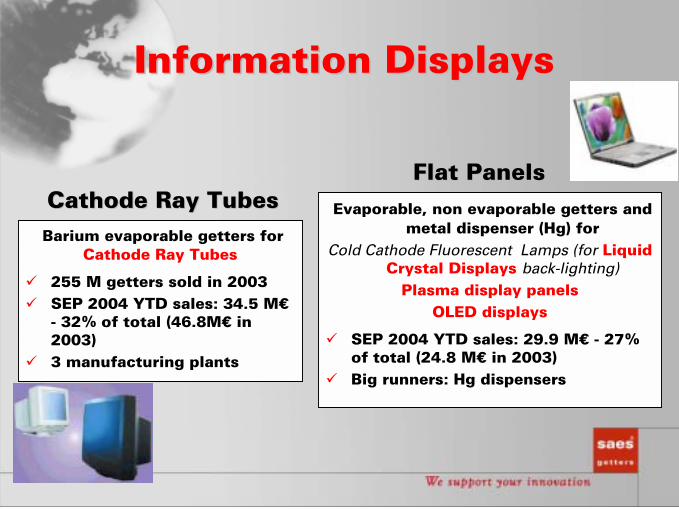
Information DisplaysInformation Displays
Barium evaporable getters forCathode Ray Tubes
! 255 M getters sold in 2003! SEP 2004 YTD sales: 34.5 M€
- 32% of total (46.8M€ in 2003)
! 3 manufacturing plants
Evaporable, non evaporable getters and metal dispenser (Hg) for
Cold Cathode Fluorescent Lamps (for Liquid Crystal Displays back-lighting)
Plasma display panelsOLED displays
! SEP 2004 YTD sales: 29.9 M€ - 27% of total (24.8 M€ in 2003)
! Big runners: Hg dispensers
Cathode Ray TubesCathode Ray TubesFlat PanelsFlat Panels
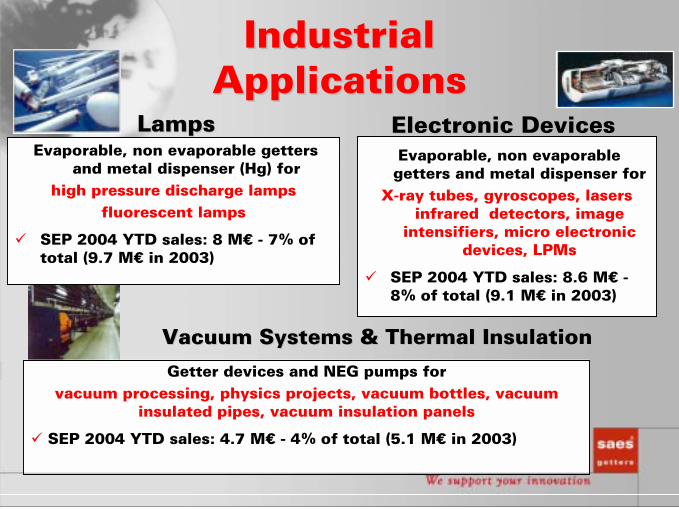
Industrial Industrial ApplicationsApplications
Evaporable, non evaporable getters and metal dispenser (Hg) for
high pressure discharge lampsfluorescent lamps
! SEP 2004 YTD sales: 8 M€ - 7% of total (9.7 M€ in 2003)
Getter devices and NEG pumps forvacuum processing, physics projects, vacuum bottles, vacuum
insulated pipes, vacuum insulation panels
! SEP 2004 YTD sales: 4.7 M€ - 4% of total (5.1 M€ in 2003)
Vacuum Systems & Thermal InsulationVacuum Systems & Thermal Insulation
LampsLampsEvaporable, non evaporable getters and metal dispenser for
X-ray tubes, gyroscopes, lasers infrared detectors, image
intensifiers, micro electronic devices, LPMs
! SEP 2004 YTD sales: 8.6 M€ -8% of total (9.1 M€ in 2003)
Electronic DevicesElectronic Devices
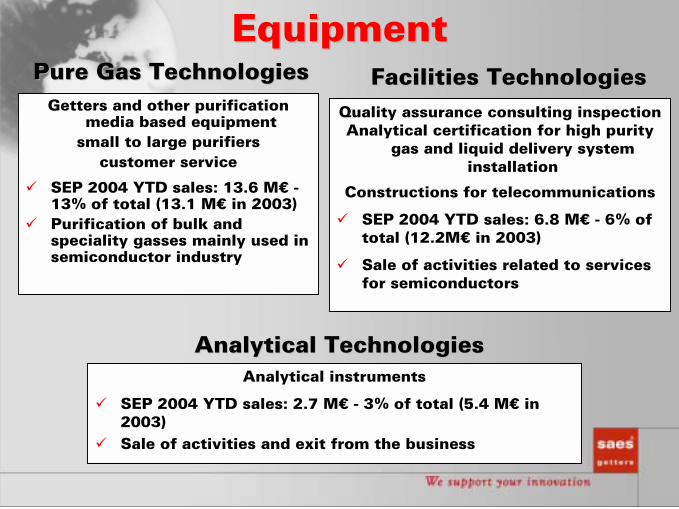
EquipmentEquipment
Getters and other purification media based equipment
small to large purifierscustomer service
! SEP 2004 YTD sales: 13.6 M€ -13% of total (13.1 M€ in 2003)
! Purification of bulk and speciality gasses mainly used in semiconductor industry
Quality assurance consulting inspection Analytical certification for high purity
gas and liquid delivery system installation
Constructions for telecommunications
! SEP 2004 YTD sales: 6.8 M€ - 6% of total (12.2M€ in 2003)
! Sale of activities related to services for semiconductors
Facilities TechnologiesFacilities TechnologiesPure Gas TechnologiesPure Gas Technologies
Analytical instruments
! SEP 2004 YTD sales: 2.7 M€ - 3% of total (5.4 M€ in 2003)
! Sale of activities and exit from the business
Analytical TechnologiesAnalytical Technologies

Consolidated RevenuesConsolidated Revenues
89.1 93.9
115.9
95.2
115.7
172.6160.2
141.2
126.2108.8
0
20
40
60
80100
120
140
160
180
M€
1995 1996 1997 1998 1999 2000 2001 2002 2003SEP04YTD
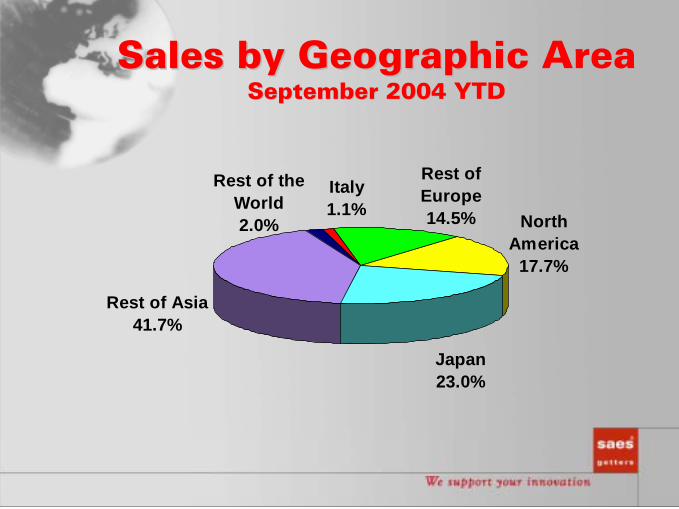
Sales by Geographic AreaSales by Geographic AreaSeptember 2004 YTDSeptember 2004 YTD
North America
17.7%
Rest of Asia41.7%
Italy1.1%
Rest of Europe14.5%
Japan23.0%
Rest of the World2.0%
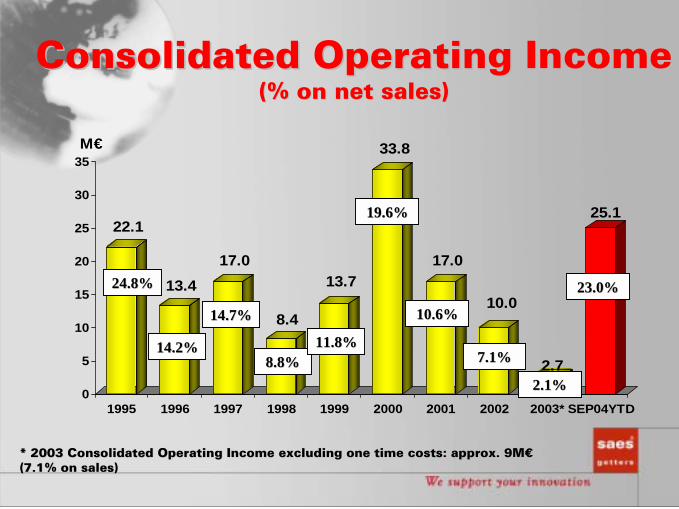
Consolidated Operating IncomeConsolidated Operating Income(% on net sales)(% on net sales)
22.1
13.417.0
8.4
13.7
33.8
17.0
10.0
2.7
25.1
0
5
10
15
20
25
30
35M€
1995 1996 1997 1998 1999 2000 2001 2002 2003* SEP04YTD
14.7%14.7%
24.8%24.8%
8.8%8.8%14.2%14.2% 11.8%11.8%
19.6%19.6%
10.6%10.6%
7.1%7.1%
2.1%2.1%
* * 2003 Consolidated Operating Income excluding one time costs: app2003 Consolidated Operating Income excluding one time costs: approx. 9M€ rox. 9M€ (7.1% on sales)(7.1% on sales)
23.0%23.0%
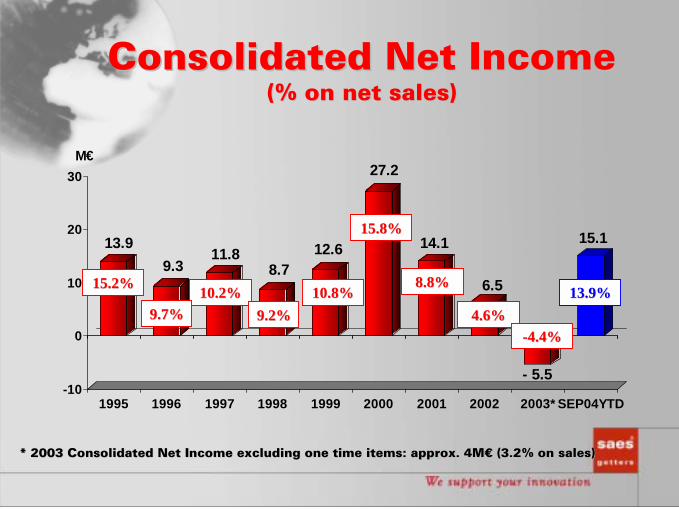
Consolidated Net IncomeConsolidated Net Income(% on net sales)(% on net sales)
13.99.3
11.88.7
12.6
27.2
14.1
6.5
- 5.5
15.1
-10
0
10
20
30M€
1995 1996 1997 1998 1999 2000 2001 2002 2003* SEP04YTD
10.2%10.2%9.7%9.7%
15.2%15.2%
9.2%9.2%10.8%10.8%
15.8%15.8%
8.8%8.8%
4.6%4.6%--4.4%4.4%
* 2003 * 2003 Consolidated Net Income excluding one time items: approx. 4M€ (3Consolidated Net Income excluding one time items: approx. 4M€ (3.2% on sales).2% on sales)
13.9%13.9%

Thanksfor your attention
For more information: For more information: www.saesgetters.comwww.saesgetters.com
EE--mail: mail: investor_relations@[email protected]