Embed Size (px)
Citation preview
The Role of Epidemiology in Air
Quality Public Policy Decision-making
Ronald White, M.S.T.Department of Epidemiology
Johns Hopkins Bloomberg School of Public HealthNorthern Transportation and Air Quality Summit
August 14, 2008
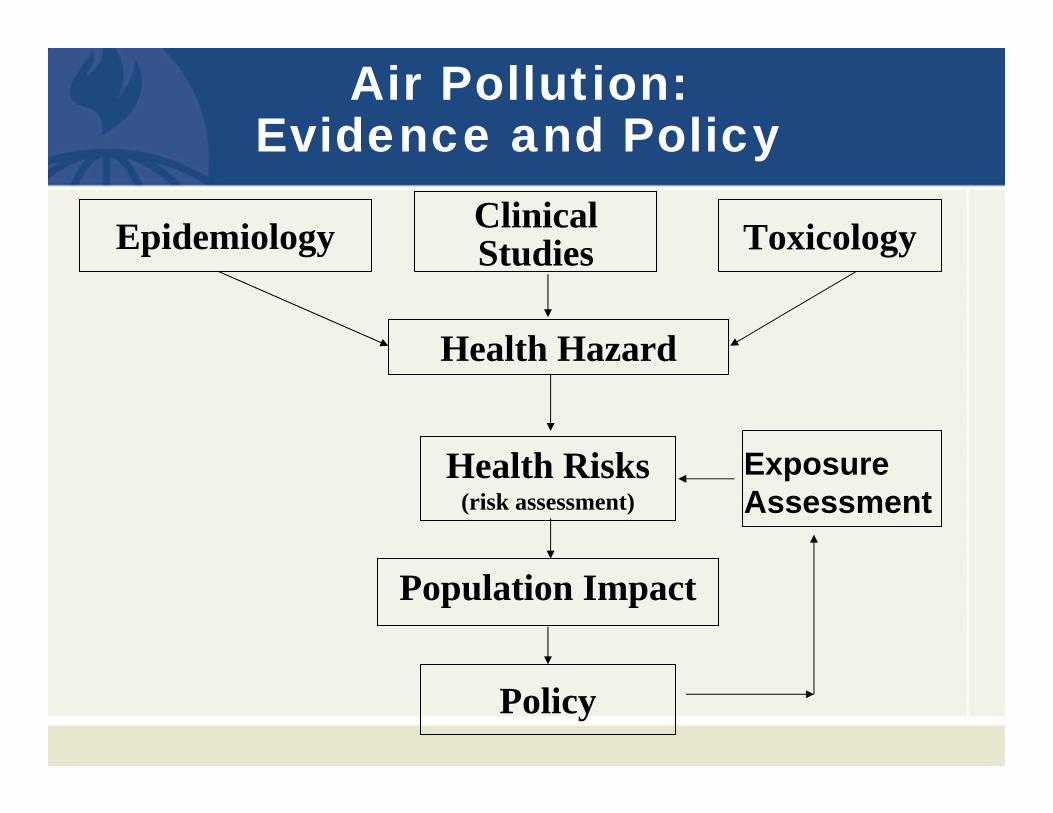
Air Pollution: Evidence and Policy
Policy
Population Impact
Health Risks (risk assessment)
Health Hazard
Epidemiology Clinical Studies Toxicology
ExposureAssessment

How Do We Investigate the Relationship Between
Environment and Health?
ObservationCross-sectional
Case-control
Cohort• “Panel”• Long-term
– Prospective– Retrospective
ExperimentClinical Studies
Animal (In vivo) Studies
Cellular (In vitro)Studies
hypotheses
mechanisms

ExtrapolationCause-effect mechanism of response
Biochemical systems
Threshold of human response?
Rapid acquisition of Data
Cells
Realistic models of human disease?
Maximal dose-response data
AnimalsToxicology
Public acceptanceCause-effect
HazardsVulnerable persons
Acute effects onlyFew covariates
Artificial ExposureControlled exposureExperimental Healthy or Diseased Subjects
Clinical Studies
Association versus causation
Long-term, low-level effects
Minimal dose-response data
Susceptible Groups
Many covariates and confounders
No ExtrapolationsDiseased Groups
Difficulty of Quantifying Exposure
Natural ExposureCommunitiesEpidemiology
WeaknessesStrengthsPopulationDiscipline
Three Disciplinary Approaches for Obtaining Health Information
(modified from Vallero, Fundamentals of Air Pollution, 4th ed.)
Air Pollution Health Study Methodologies
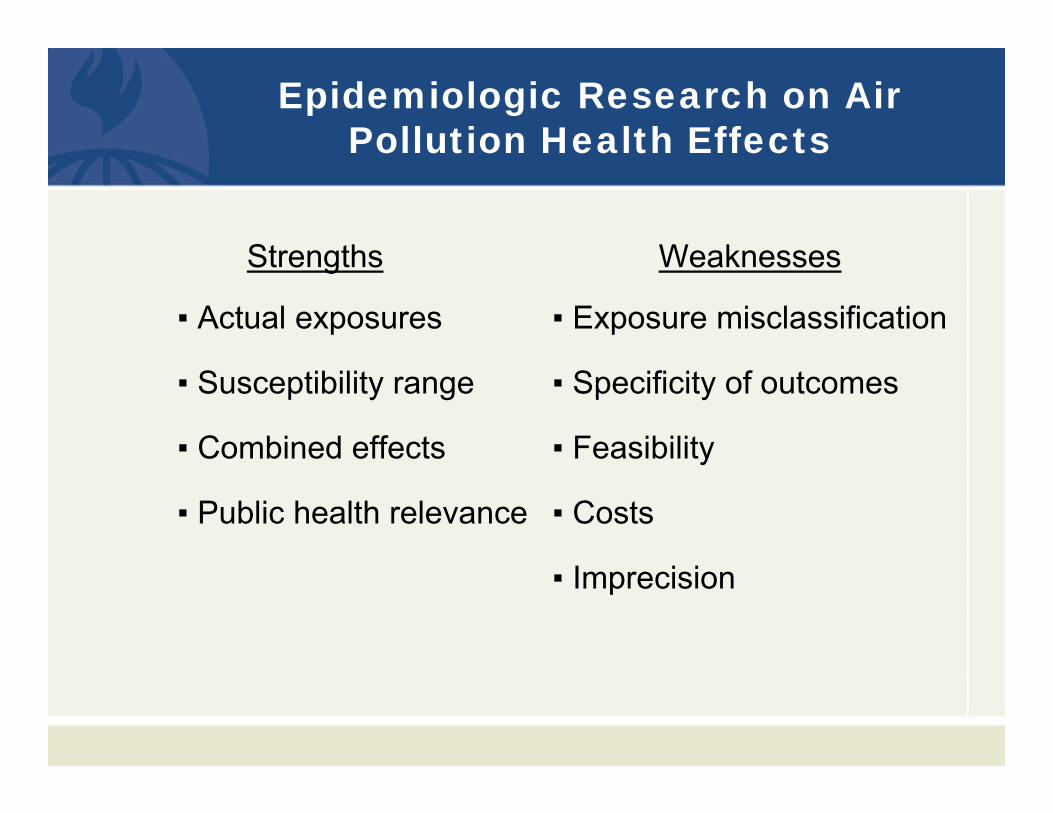
Epidemiologic Research on Air Pollution Health Effects
Strengths
▪ Actual exposures
▪ Susceptibility range
▪ Combined effects
▪ Public health relevance
Weaknesses
▪ Exposure misclassification
▪ Specificity of outcomes
▪ Feasibility
▪ Costs
▪ Imprecision
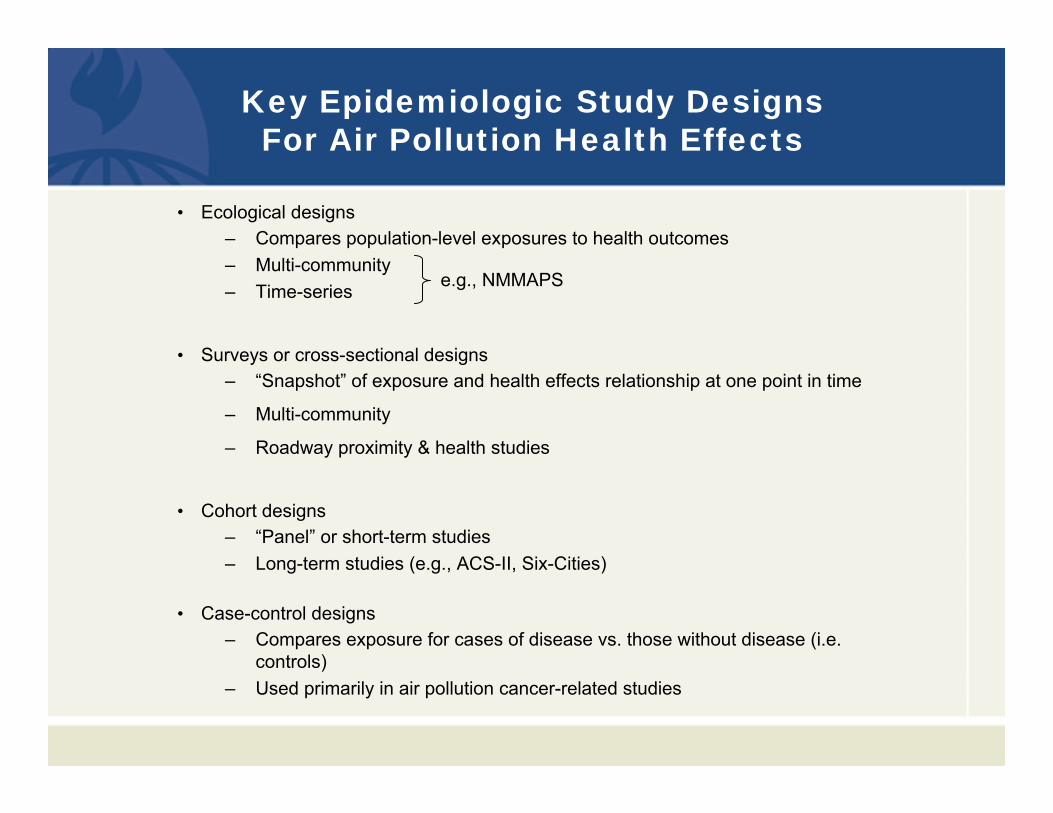
Key Epidemiologic Study Designs For Air Pollution Health Effects
• Ecological designs– Compares population-level exposures to health outcomes– Multi-community – Time-series
• Surveys or cross-sectional designs– “Snapshot” of exposure and health effects relationship at one point in time
– Multi-community
– Roadway proximity & health studies
• Cohort designs– “Panel” or short-term studies– Long-term studies (e.g., ACS-II, Six-Cities)
• Case-control designs– Compares exposure for cases of disease vs. those without disease (i.e.
controls)– Used primarily in air pollution cancer-related studies
e.g., NMMAPS

Potential Confounders in Epidemiological Studies of Air Pollution
Confounding factor: Associated with health outcome and exposure factor (but not caused by exposure)
• Active and passive smoking
• Socioeconomic status
• Demographic characteristics
• Occupational exposures
• Access to medical care
• Nutrition

Potential Effect Modifiers inEpidemiological Studies of Air Pollution
• Active cigarette smoking
• Airways responsiveness
• Symptom status
• Other environmental exposures
• Other host factors
What Do Regulators Want From Epidemiologic Research?
• Evidence of effects based on “actual human exposures”
• Determination of hazard
• Quantification of risk
• Magnitude of effects on “susceptible” or “sensitive” persons
• Evidence of improved health from interventions (Accountability)

Application of EpidemiologicalEvidence to Air Pollution Policy
• NAAQS Reviews; Risk Assessments based on epi studies:– 2005 PM: total, CV, respiratory, C-P, lung cancer mortality; C-P hospital
admissions; respiratory symptoms– 2007 Ozone: total, respiratory, C-P mortality; respiratory hospital admissions;
symptoms in asthmatic children– 2007 Lead: neurological, hematological and immune effects in children;
neurological, hematological, renal and CV effects in adults
• ∆ Air Quality Studies– Six Cities– Atlanta Olympics
• Regulatory Intervention Studies– Dublin– Hong Kong
• Roadway Proximity and Health Studies– Policy applications
Air Quality Improvement StudiesSix Cities Follow-up Study
• 8,000+ white adults
• Portage, WI; Topeka, KS; Louisville, KY; Kingston, TN; Watertown, MA; Steubenville, OH.
• Extended 1993 Dockery et al. study: 1974 – 1989 (period 1) to 1990 – 1998 (period 2)
• Ability to examine effect of fine PM reductions over study period
Laden et al., AJRCCM, 2006
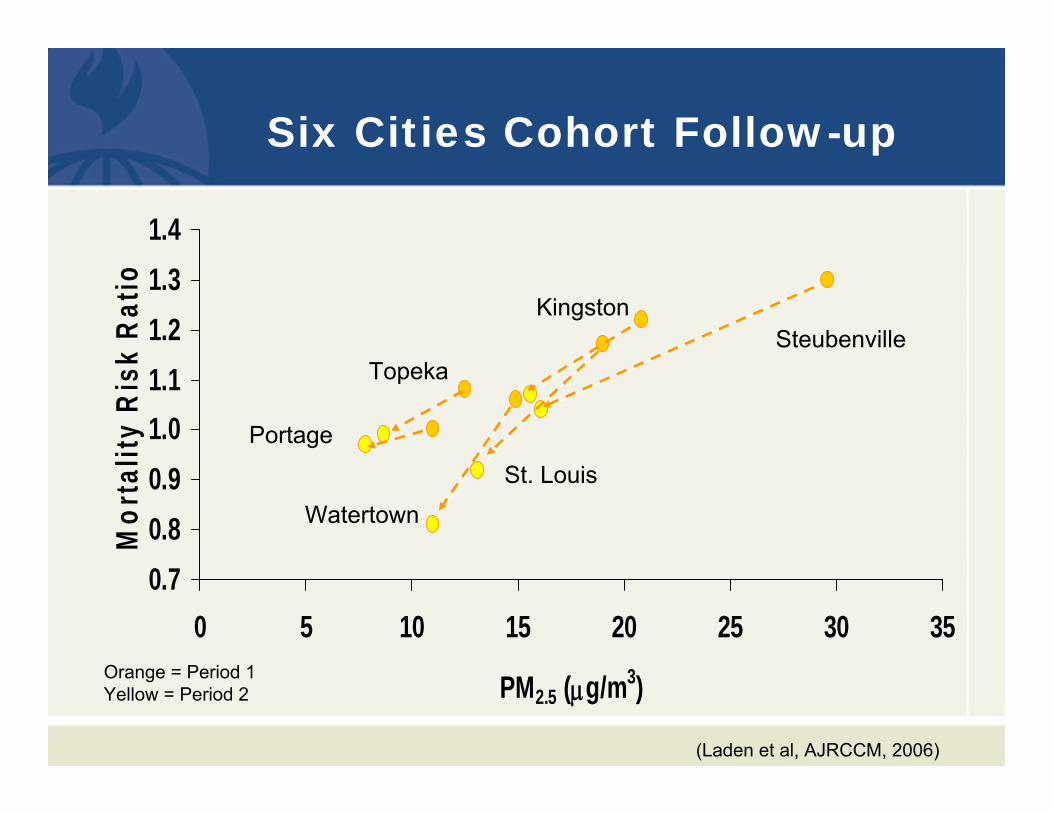
Six Cities Cohort Follow-up
0.70.80.91.01.11.21.31.4
0 5 10 15 20 25 30 35
PM2.5 (μg/m3)
Mor
talit
y R
isk
Rat
io
SteubenvilleTopeka
Watertown
Kingston
St. Louis
Portage
(Laden et al, AJRCCM, 2006)
Orange = Period 1Yellow = Period 2

Air Quality Improvement Studies1996 Atlanta Olympics Study
– Downtown Atlanta closed to traffic; 24-hr public transit; 1,000 extra park & ride buses provided; altered downtown delivery schedule; flex and telecommute work
– Daily peak ozone levels < ~28% compared to pre and post-Olympics period (one month each); daily traffic counts <22.5%
– Acute care childhood asthma events• < 42% Medicaid• < 44% HMO• < 11% Pediatric ER• < 19% Hospitalizations
Freidman et al., JAMA, 2001

Regulatory Intervention StudiesDublin Coal Study
– Coal use banned September 1990
– Compared daily air pollution, weather, and deaths for 6 year period before and after the ban
– Avg. reductions: BS = ~36µg/m3 (71%)SO2 = ~11µg/m3 (34%)
– Reductions in mortality rates:• total non-trauma deaths - ~ 6%• respiratory deaths - 15.5%• cardiovascular deaths - ~10%• but not for accidental deaths
Clancy et al., Lancet, 2002

Regulatory Intervention StudiesHong Kong Fuel Sulfur Study
– July 1990: Sulfur in fuel limit of 0.5%
– Immediate reductions in SO2 (80%) and Sulfate PM10(41%) for most highly polluted areas. Avg. 45% reduction in ambient SO2 levels over 5 years
– 2 years post intervention: reductions in chronic bronchitis symptoms and bronchial hyper-responsiveness in children
– Reductions in all cause (2%), respiratory (~4%), and cardiovascular (2%), but not neoplasm (cancer) deaths
Hedley et al., Lancet, 2002

Roadway Traffic Proximityand Health Studies
• Growing body of studies assessing exposures and health effects associated with close residential proximity to high traffic roadways
• Epidemiological health studies conducted in Europe, Japan and Scandinavian countries, with increasing number in U.S.
• Risk gradients in a 0-200 meter buffer– Distance from roadway (traffic volumes)– Traffic density in proximity buffer – Traffic density with neighborhood background matching– NO2 home/outdoor levels (assuming distance is fixed)
Roadway Proximity/Traffic Density and Health Study Outcomes
– Respiratory symptoms– Asthma outcomes– Allergic sensitization– Immunologic effects– Respiratory function– Respiratory disease– Adult and childhood cancers– Cardiovascular outcomes– Birth outcomes– Mortality

Traffic-related ExposuresAsthma and Respiratory Symptoms/Lung Disease
Type Local TrafficIncidence +
Exacerbation/Prevalence +
Acute Care Visits +
ED Visits/Hospitalization +/-
Medication Use +/-
Respiratory Symptoms + CoughPhlegmWheezeShortness of Breath
COPD + (women)

Traffic-related ExposuresCardiovascular Effects
Type
Blood Pressure
Acute MI
Atherosclorosis
CHD prevalence
ED Visits/Hospitalizations
Cardiac Function
Local Traffic
+
+
+
+
+
+/-
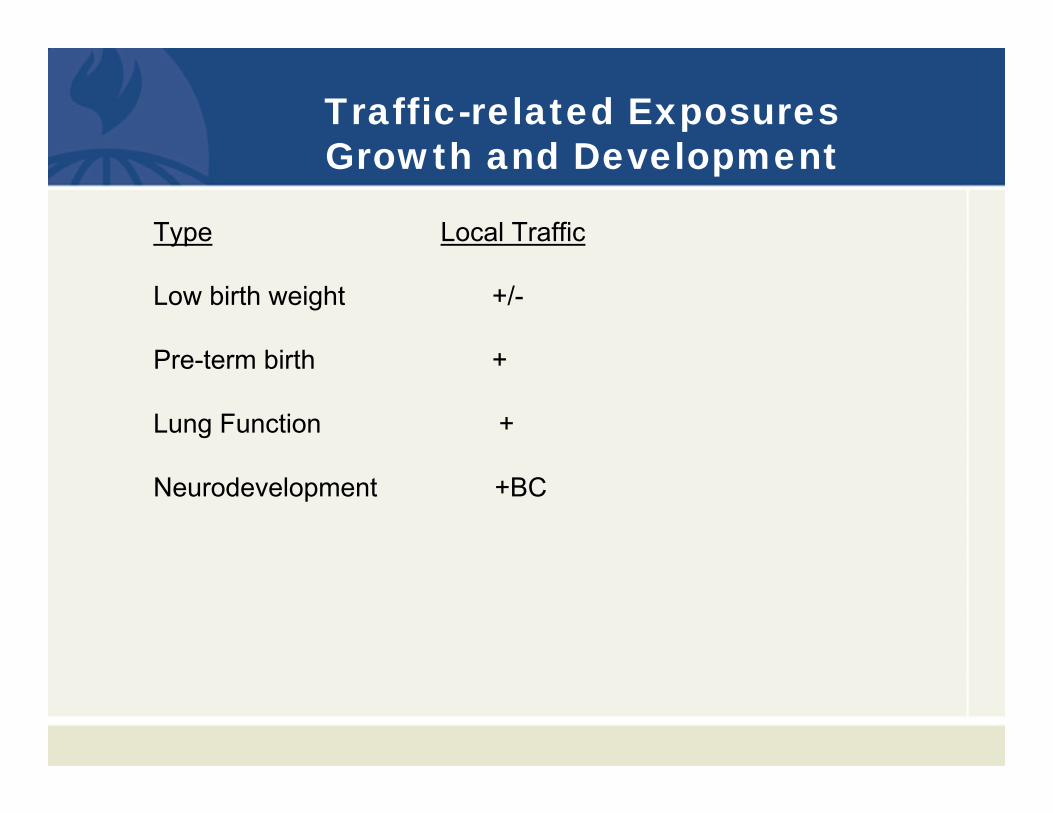
Traffic-related Exposures Growth and Development
Type Local Traffic
Low birth weight +/-
Pre-term birth +
Lung Function +
Neurodevelopment +BC
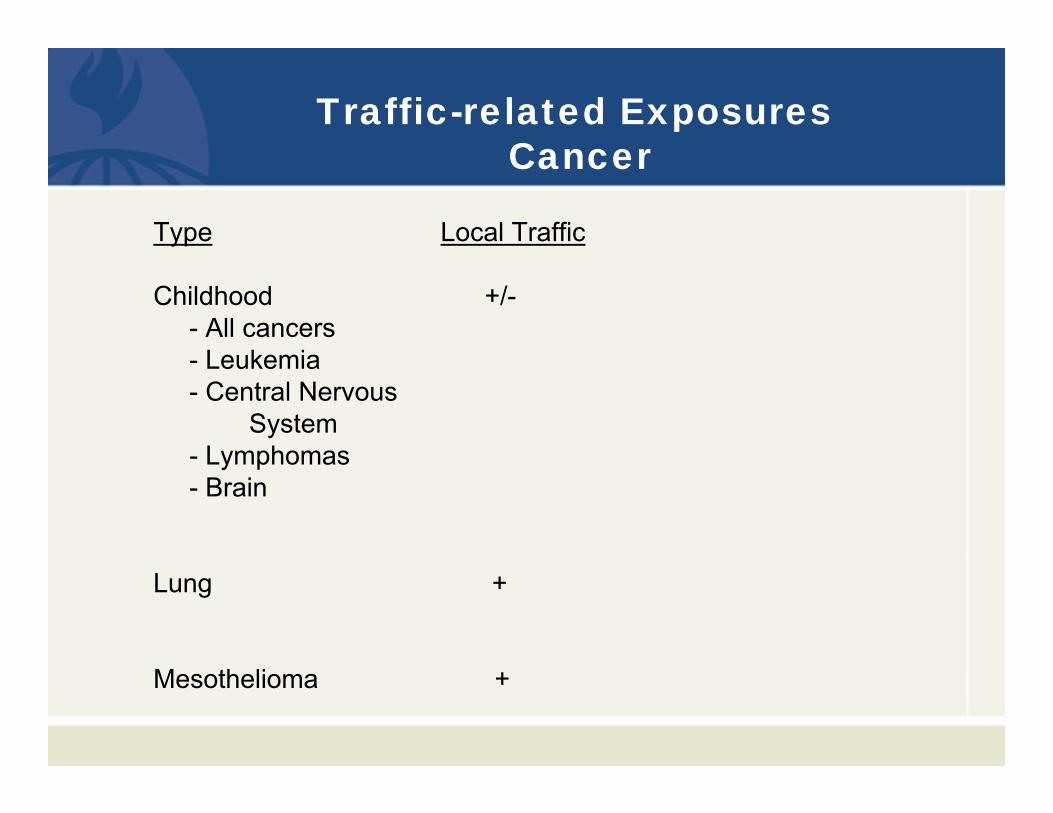
Traffic-related ExposuresCancer
Type Local Traffic
Childhood +/-- All cancers- Leukemia- Central Nervous
System- Lymphomas- Brain
Lung +
Mesothelioma +

Traffic-related ExposuresMortality
Type
Total Mortality
Cardiopulmonary Mortality
Stroke Mortality
Local Traffic
+
+
+

Potential Issues in Near RoadwayStudy Interpretation
• Proximity: proxy for what pollutant(s) ?
• Subjective exposure and/or outcomes
• Self-selection of residence
• Exposure Assessment– Measurement error - temporal and spatial
• street canyons, wind– Complex mixture - local and regional input
• Confounding– Social and demographic factors– Roadway-associated exposures
• noise, power lines
• Susceptible populations– Age, Sex, Asthma, SES, Diet, Genetic

Policy Applications – School Siting
CA school siting law (SB352, 2004)
• Prohibits siting of new schools within 500ft of freeway or major traffic corridor unless negative short and long-term air pollution health risk determination
• Negative health risk determination required for sites after identification of sources of hazardous pollutants (including freeways and major traffic corridors) within ¼ mile of school site
AADT = Avg. Annual Daily Traffic

Policy Applications –Sensitive Uses Siting Guidelines
• CARB Land Use and Air Quality Handbook: A Community Health Perspective (2005 Land Use Handbook)
– guidance on siting sensitive land uses in proximity to sources of air toxics (e.g., diesel PM from freeways & high traffic roads)
– sensitive land uses include residential communities, schools and school yards, day care centers, parks and playgrounds, hospitals and medical facilities
– recommends that sensitive land uses be sited no closer than 500 feet from a freeway or other high traffic roadway
• Sacramento Metropolitan Air Quality Management District “Recommended Protocol for Evaluating the Location of Sensitive Land Uses Adjacent to Major Roadways (Draft - June 2008)”
– assists local land use jurisdictions in assessing the potential cancer risk of siting sensitive land uses adjacent to major roadways (health risk assessment)
– potential mitigation measures


Emerging Traffic and Health IssuesIntelligence Effects
Increases in Black Carbon (traffic pollution marker) associated with3-4 point lower IQ and cognitive function test scores
Suglia et al., AJE, 2008

Emerging Traffic and Health IssuesMental Health Effects
Traffic, Air Pollution and Schizophrenia
Pedersen et al; Schizophr Res. 2004 Jan 1;66(1):83-5.
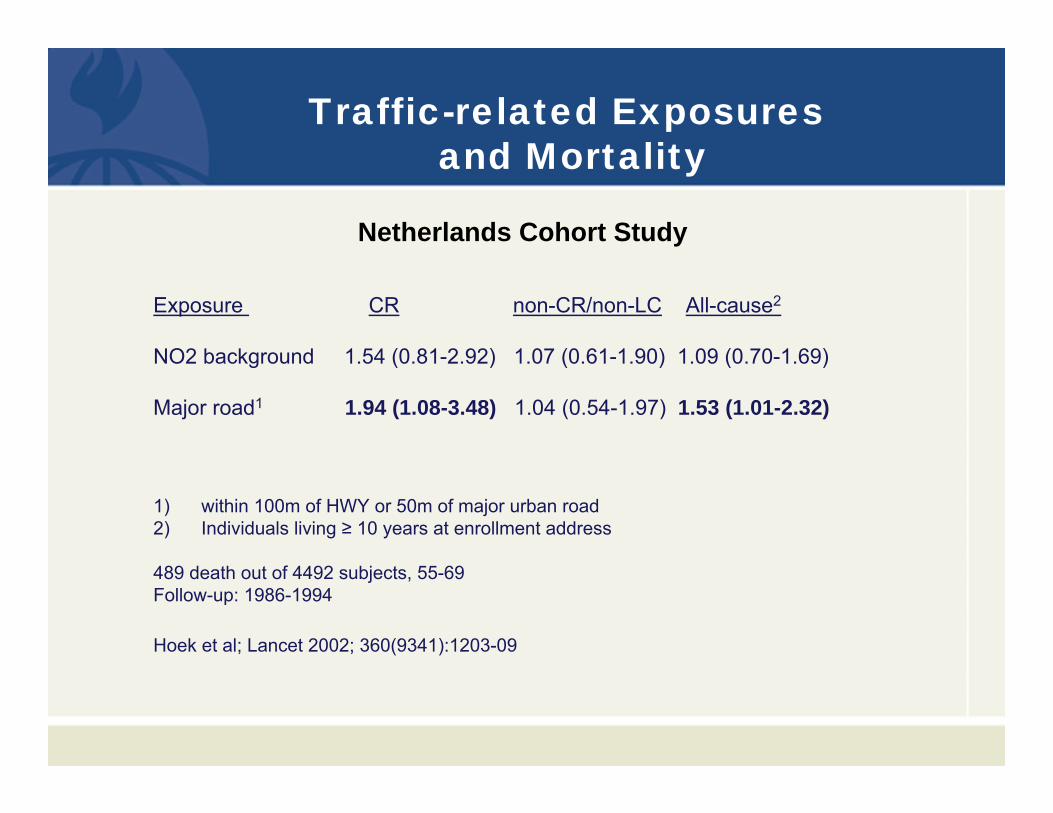
Traffic-related Exposuresand Mortality
Netherlands Cohort Study
Exposure CR non-CR/non-LC All-cause2
NO2 background 1.54 (0.81-2.92) 1.07 (0.61-1.90) 1.09 (0.70-1.69)
Major road1 1.94 (1.08-3.48) 1.04 (0.54-1.97) 1.53 (1.01-2.32)
1) within 100m of HWY or 50m of major urban road2) Individuals living ≥ 10 years at enrollment address
489 death out of 4492 subjects, 55-69Follow-up: 1986-1994
Hoek et al; Lancet 2002; 360(9341):1203-09

Traffic Proximity and Respiratory Symptoms
Parent-reported wheeze in secondary school children (150 meter distance buffer)
Venn et al. AJRCCM 2001
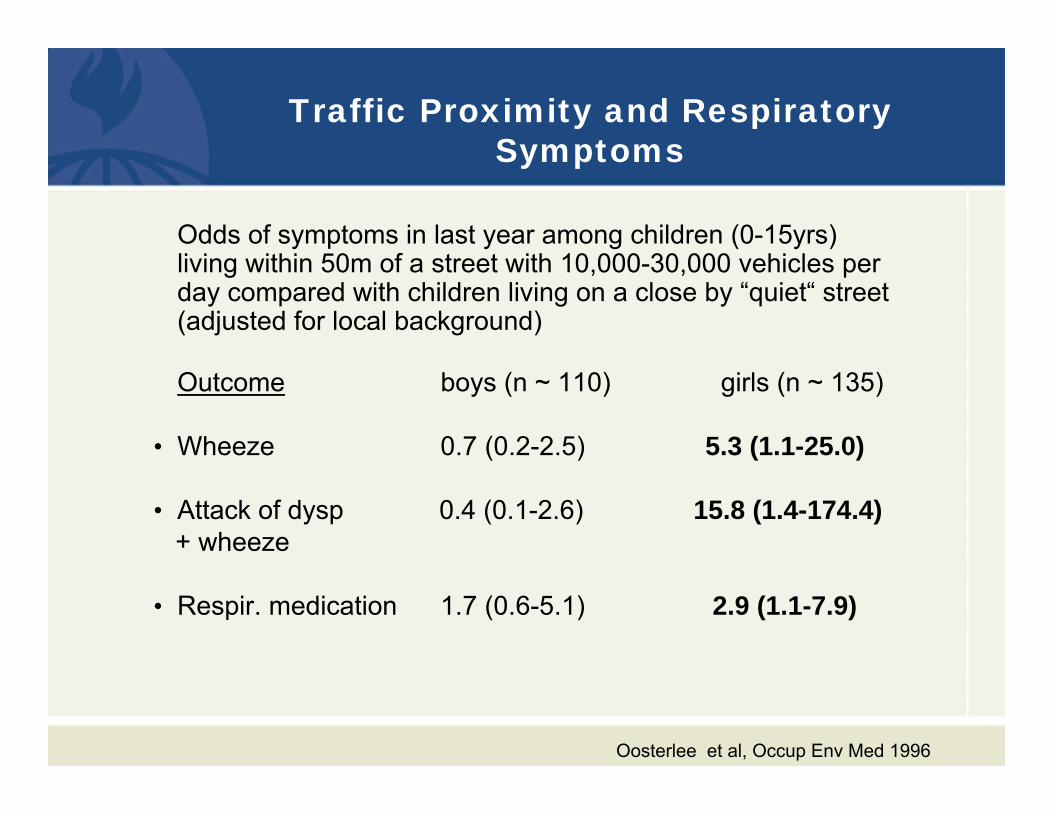
Traffic Proximity and Respiratory Symptoms
Odds of symptoms in last year among children (0-15yrs) living within 50m of a street with 10,000-30,000 vehicles per day compared with children living on a close by “quiet“ street (adjusted for local background)
Outcome boys (n ~ 110) girls (n ~ 135)
• Wheeze 0.7 (0.2-2.5) 5.3 (1.1-25.0)
• Attack of dysp 0.4 (0.1-2.6) 15.8 (1.4-174.4)+ wheeze
• Respir. medication 1.7 (0.6-5.1) 2.9 (1.1-7.9)
Oosterlee et al, Occup Env Med 1996

Traffic and Asthma
• LA & San Diego Cos.
• “Poorly controlled asthma” – weekly asthma symptoms or hospitalization during past year
Meng et al., AAAI, 2007
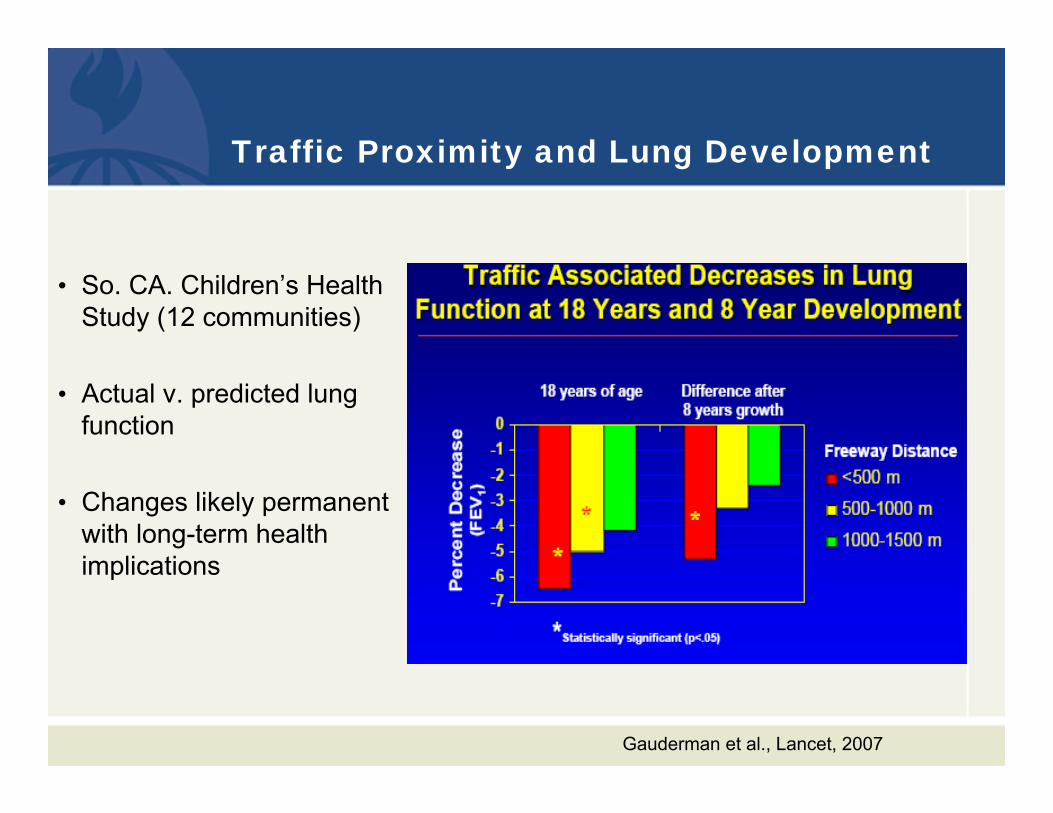
Traffic Proximity and Lung Development
• So. CA. Children’s Health Study (12 communities)
• Actual v. predicted lung function
• Changes likely permanent with long-term health implications
Gauderman et al., Lancet, 2007

Traffic-related Exposures and Growth and Development
Wilhelm M and Ritz B; EHP, 2003

More Information• EPA Control of Hazardous Air Pollutants from Mobile
Sources (2007); Regulatory Impact Analysis; Chapter 3, Section 3.5. http://www.epa.gov/otaq/regs/toxics/420r07002.pdf.
• JHU Workshop on Traffic, Health & Infrastructure Planning (2004)
– Background information documents http://www.jhsph.edu/RiskSciences/Research/TrafficProximity.html
– White RH, Spengler JD, Dilwali KM, Barry BE, Samet JM; Report of Workshop on Traffic, Health and Infrastructure Planning; Archives of Environmental and Occupational Health, 60: 2, 2005.

Additional References
• Boothe V and Shendell D; Potential health effects associated with residential proximity to freeways and primary roads: review of scientific literature, 1999-2006. J Environ Health, 2008 Apr; 70(8): 33-41.
• Meng Y-Y et al.; Living Near Heavy Traffic Increases Asthma Severity. UCLA Health Policy Research Brief. 2006.
• Salam M, Islam T, and Gilliland F; Recent evidence for adverse effects of residential proximity to traffic sources on asthma. Curr Opin Pulm Med; 2008 Jan; 14:3-8.
• Samet J; Traffic, Air Pollution, and Health. Inhal Tox, 2007 Sept; 19:12, 1021-1027.