Embed Size (px)
Citation preview
Economic Modernization through Efficient Reforms and Governance Enhancement (EMERGE) Unit 2003, 139 Corporate Center, 139 Valero St., Salcedo Village, Makati City 1227, Philippines
Tel. No. (632) 752 0881 Fax No. (632) 752 2225
Final Report
THE ROAD-RORO TERMINAL SYSTEM: Bicol Mainland-Masbate-Cebu Connection by Ruperto Alonzo, Team Leader, Gudmund Rognstad, RoRo Shipping Expert, Asaf Ashar, Ports Specialist, and Adoracion Navarro, Research Associate
Prepared for
Marietto A. Enecio, Sr. Vice President Development Bank of the Philippines (DBP) Republic of the Philippines
Submitted for review to USAID/Philippines OEDG January 9, 2007
Preface
This report is the result of technical assistance provided by the Economic Modernization through Efficient Reforms and Governance Enhancement (EMERGE) Activity, under contract with the CARANA Corporation, Nathan Associates Inc. and The Peoples Group (TRG) to the United States Agency for International Development, Manila, Philippines (USAID/Philippines) (Contract No. AFP-I-00-00-03-00020 Delivery Order 800). The EMERGE Activity is intended to contribute towards the Government of the Republic of the Philippines (GRP) Medium Term Philippine Development Plan (MTPDP) and USAID/Philippines’ Strategic Objective 2, “Investment Climate Less Constrained by Corruption and Poor Governance.” The purpose of the activity is to provide technical assistance to support economic policy reforms that will cause sustainable economic growth and enhance the competitiveness of the Philippine economy by augmenting the efforts of Philippine pro-reform partners and stakeholders. This report, an investment folio, was written by Dr. Ruperto Alonzo, Team Leader, Gudmund Rognstad, RoRo Shipping Expert, Asaf Ashar, Ports Specialist, and Adoracion Navarro, Research Associate, after several months of analysis beginning in May 2006 at the request of Marietto A. Enecio, Senior Vice President, Development Bank of the Philippines. Brief biographies of the team members are included on the following page. The views expressed and opinions contained in this publication are those of the authors and are not necessarily those of USAID, the GRP, EMERGE or the latter’s parent organizations.
Biographical Sketch of the Study Team Ruperto Alonzo – Team Leader
Ruperto Alonzo has conducted several studies over the past three decades on the Philippines’ infrastructure sector, including transport. His first experience as transport economist dates back to 1973, in the preparation of the feasibility study of the EDSA interchanges. In 1995 he was with the team that conducted an economic evaluation of liberalization and deregulation in the domestic shipping industry for USAID. He is currently Professor of Economics at the University of the Philippines: As NEDA Deputy Director-General in August 1998-January 2001, he chaired the technical boards of the Investment Coordination Committee and Infrastructure Committee and represented NEDA in the Toll Regulatory Board. He holds an M.A. in Economics from the University of the Philippines and has completed Ph.D. coursework at the University of Chicago. Gudmund Rognstad – RoRo Shipping Expert
Gudmund Rognstad specializes in transport analysis and logistics, shipping, and ferry operation and management. He is the president and owner of SHIPDECO, a Norwegian shipping development company that was formed to assist the Norwegian Aid Agency and other donor organizations in shipping and shipyard projects in developing countries. His experience in Philippine projects dates back to 1987, when he became a project manager for two shipping-related projects. In 1995, he worked as project manager for the technical assistance component of the Domestic Shipping Modernization Program loan by DBP from Japan. He has been doing collaborative work with DBP since then. He holds an M.Sc. in Physics and Operations Research from the Technical University of Trondheim, Norway. Asaf Ashar – Ports Specialist
Asaf Ashar has extensive international experience with multi-modal transportation systems for containerized, breakbulk and bulk cargoes, with an emphasis on the linkage between ships, barges, trains, and trucks. He has directed numerous planning projects, including master plans for ocean and inland waterway ports, intermodal railyards, inland distribution centers (dry ports), and rail-to-barge transfer facilities. He has been involved in a wide array of port-related feasibility studies, including: productivity enhancement systems and handling technologies for containerized, bagged and neo-bulk cargoes. He is currently Professor at the University of New Orleans and Research and Group Manager for Port and Intermodal Systems of the university’s National Ports and Waterways Institute. He holds a Ph.D. in Maritime Studies and International Transport from the University of Wales and an M.S. in Marine Systems Management from the Massachusetts Institute of Technology. Adoracion Navarro – Research Associate
Adoracion Navarro has evaluated several transport projects for the Philippine government while at the NEDA-Infrastructure Staff and the Build-Operate-Transfer Center. She has produced infrastructure-related research papers for the University of the Philippines-Law Center and the Philippine Institute for Development Studies. She has also conducted research in a multilateral setting, as Summer Scholar at the International Monetary Fund. She currently works as Transport Economist for WBG Consulting Services International and Project Economics Consultant for the Asian Development Bank. She holds an M.A. in Economics from the University of the Philippines and an M.P.A. in Economic Policy Management from Columbia University.
THE ROAD-RORO TERMINAL SYSTEM
Bicol Mainland-Masbate-Cebu Connection
Executive Summary
The Road-RoRo Terminal System (RRTS) is one of the flagship programs of the Arroyo administration. Executive Order (EO) 170 and subsequent issuances set the policy that the RRTS be integrated into the national highway system. The RRTS can be made to work with significant private sector participation, as presented by this study in its viability analysis of the Bicol Mainland-Masbate-Cebu connections.
In practice, roll-on-roll-off (RoRo) vessel operation and RoRo terminal operation
in the Philippines are often viewed as separate activities—the government through the Philippine Ports Authority (PPA) or the local governments provide the port services and the private sector supplies the vessel services. However, this study points out that in principle, for any defined route, the two are actually interdependent and complementary investments (one cannot operate without the other), and there is merit in “bundling” both into a single business if integration proves to be viable. For the case at hand, i.e., the Bicol Mainland-Masbate-Cebu connections, integrated operation, even under the new RRTS paradigm of charging only passage and terminal fees and eliminating certain other passenger and vehicle fees and charges, is financially viable, offering sufficient returns to attract private sector interest not just in vessel but in port operations as well. Macro and Micro Perspectives
The 2004-2010 Medium-Term Philippine Development Plan (MTPDP) lays out the blueprint for a nautical highway system in the archipelago by identifying the road-RoRo links that need to be developed, namely, the Western Nautical Highway (also called the Strong Republic Nautical Highway or SRNH), the Central Nautical Highway, and the Eastern Nautical Highway. The 919-kilometer SRNH was promoted in 2003 to enhance the accessibility of local destinations in the western part of the country; since then, it is reputed to have reduced travel costs by 40 percent for passengers and 30 percent for cargo.
A visit to Roxas, Oriental Mindoro—one of the links in the SRNH—provides an
interesting perspective on the impact of the SRNH on the local economy. The Roxas-Caticlan route became part of the SRNH when RoRo vessels started operating in the route in June 2003. With the opening of the route, the municipality of Roxas in Oriental Mindoro was transformed from a sleepy village into a town with steadily growing commercial activities. The RRTS Concept
The RRTS concept regards ferries as part of the road network. Thus, traveling along an RRTS sea route is similar to crossing a bridge (like San Juanico). RRTS is not to be regarded as part of regular shipping. When crossing a bridge or using an expressway, one may have to pay a toll fee, but under no circumstances is one asked to declare what he or she carries in the vehicle. One just pays for the passage or, in other words, the use of that facility.
The RRTS concept suggested by this study is based on criteria and conditions that are distinct and separate from regular shipping, namely:
1. Only self-driven vehicles and passengers are allowed. There is therefore no
need for cargo handling. 2. No manifests are required for cargo inside the vehicles. 3. The passage rate for vehicles is based on occupancy of lane meters onboard. 4. A given RoRo terminal is dedicated to a single ferry operator, with no other
users than the operator himself. 5. The ferry operator is given a special franchise and may enjoy no direct
competition for that particular terminal. 6. The ferry operator is responsible for compliance with safety regulations. 7. The ferry operator is selected (ideally) based on an open bidding for the
franchise. 8. The franchise may be given to the one who offers the highest fee (either lump
sum or present value at a specified discount rate) to the franchise issuer, with lane meter charges fixed, or to the one who offers the lowest lane meter charges to the users.
This concept is largely consistent with the policies laid down by EO 170, issued
in January 2003, and its subsequent amendments. EO 170 spells out the elements and principles of the RRTS. It defines RRTS as a network of RoRo terminals all over the country, separated by a distance of not more than 50 nautical miles and linked by RoRo vessels. It also defines the RRTS toll as consisting of the terminal fee, passage fee, and berthing fee. EO 170-A, issued in June 2003, amended EO 170 and abolished the 50-nautical mile distance qualification. A second amendment, issued in September 2005, EO 170-B, calls for an increase in the number of RoRo-capable ports and the conversion of more private noncommercial port operations to private commercial port operations. It also directs the port authorities and MARINA to ensure that cargo handling charges are not retained in any form or manner (e.g., by changing the nomenclature of the fee or charge), and that RRTS charges are applied uniformly in all ports.
Profile of the Bicol Mainland-Masbate-Cebu Connection The Bicol Mainland-Masbate-Cebu Connection has been identified as one of the missing links in the Central Nautical Highway. In 2005, the Maritime Industry Authority (MARINA) and the Japan International Cooperation Agency (JICA) examined in The Study on Domestic Shipping Development Plan in the Philippines the possible routes for this connection and recommended the Pilar-Masbate City-Cataingan-Bogo route as an “RRTS Pilot Project.” In May 2006, the Development Bank of the Philippines (DBP) accessed a technical assistance grant from the USAID-funded Economic Modernization through Efficient Reforms and Governance Enhancement (EMERGE) Project to finance a viability study for the Bicol Mainland-Masbate-Cebu Connection that can be used in its promotion of RRTS investments.
The RRTS routes pre-identified by DBP for this study are Pilar-Aroroy for the southern Sorsogon-northern Masbate connection and Cawayan-Daan Bantayan for the southern Masbate-northern Cebu connection. Sorsogon province in the Bicol mainland is a second-class province. It had a total population of 650,535 and a population density of 304 persons per sq. km. in the 2000 census. According to the Bicol Medium-Term Regional Development Plan, the priority crops and commodities in the province are coffee, abaca, fimbriated herring, seaweeds, and mussels. The municipality of Pilar is located at the northwestern part of Sorsogon province. It is 57 kilometers away from the
2
provincial capital of Sorsogon and 47 kilometers away (about one hour by car) from Legazpi City in nearby Albay province.
The province of Masbate lies south of Sorsogon and is at the center of the
Philippine archipelago. In 2000, Masbate’s population was 707,668 and the population density was 175 persons per sq. km. Masbate is the biggest cattle raising province in the Bicol region. Fishing is also a major industry in the province, which produces over a quarter of the fishery production in the region. Masbate City is the capital of Masbate province. The municipality of Aroroy is in the northernmost part of the province and can be reached from Masbate City within 2 to 3 hours by road. The municipality of Cawayan lies southeast of the province and can be reached from Masbate City within 1½ to 2 hours by road.
Cebu province, a first-class province, consists of the main Cebu Island and
smaller groups of islands. It lies 365 miles south of Manila. In census year 2000, the province posted a population of 3,356,137 and a population density of 693.9 persons per sq. km. Cebu City is the hub of economic activity and the center for trade and commerce in the Central Visayas Region. Most domestic shipping companies in the Philippines have their central offices in Cebu City. The Port of Cebu handles more ships carrying more domestic cargo and passengers than the domestic port in Manila. The municipality of Daan Bantayan lies about 128 km. from Cebu City and is located at the northernmost tip of the island. It can be reached by road from Cebu City in about three hours. Required Investments and Results of the Viability Analysis
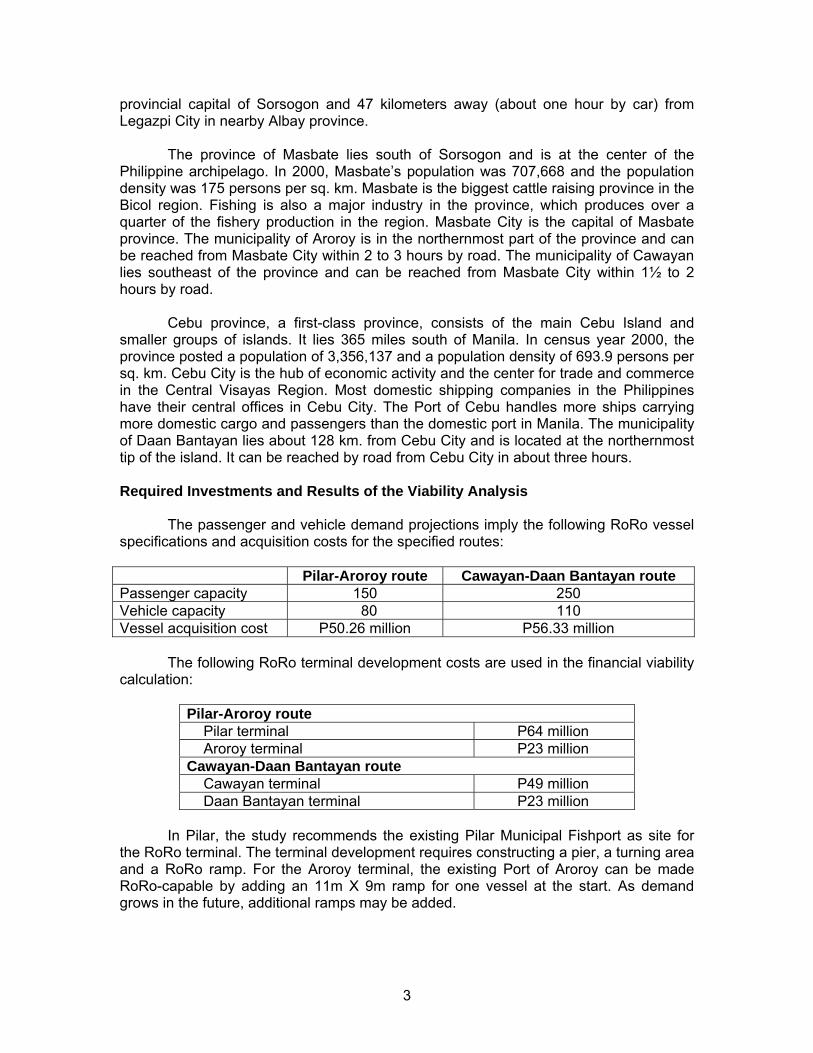
The passenger and vehicle demand projections imply the following RoRo vessel specifications and acquisition costs for the specified routes:
Pilar-Aroroy route Cawayan-Daan Bantayan route Passenger capacity 150 250 Vehicle capacity 80 110 Vessel acquisition cost P50.26 million P56.33 million
The following RoRo terminal development costs are used in the financial viability
calculation:
Pilar-Aroroy route Pilar terminal P64 million Aroroy terminal P23 million
Cawayan-Daan Bantayan route Cawayan terminal P49 million Daan Bantayan terminal P23 million
In Pilar, the study recommends the existing Pilar Municipal Fishport as site for
the RoRo terminal. The terminal development requires constructing a pier, a turning area and a RoRo ramp. For the Aroroy terminal, the existing Port of Aroroy can be made RoRo-capable by adding an 11m X 9m ramp for one vessel at the start. As demand grows in the future, additional ramps may be added.
3
In Cawayan, the PPA is about to start constructing the Cawayan Port and thus the agency’s cost estimate is adopted for this study. In Daan Bantayan, the local government’s preparations for the capital investment are already in an advanced stage. The cost estimate of the Cebu provincial government for the Daan Bantayan Port is P15 million. The Cebu Ports Authority estimate for the same port is P20 million. Both of these estimates seem unrealistically low, especially because the site is covered with coralline bed and needs dredging. Thus, for a more realistic financial model, this study adopts the higher P23 million basic cost of a RoRo terminal reflected in the Aroroy cost estimate. This figure, and consequently the financial viability analysis, will have to be adjusted once the Cebu provincial government’s cost estimate has been firmed up.
The financial analysis first examines the viability of vessel and RoRo terminal
operations separately, then looks at the two as an integrated project. For each operation taken separately and for both operations viewed as a single enterprise, the financial analysis is conducted from two viewpoints: that of all the capital invested in the project and that of equity capital only, after taking account of leveraging, especially since DBP offers relatively soft terms for both vessel acquisition and terminal development.
A 20-year projection period is used to coincide with the life of the vessels. In the financial viability indicators for the vessel component, the computations consider the operator deploying only one vessel, even though the projected traffic growth dictates that an additional vessel be added by the sixth year of operation. This simplifying assumption is adopted because the study’s interest is basically to see if RoRo vessel service is indeed feasible for the routes concerned. For the RoRo terminal component, however, the growth in traffic throughout the 20-year projection period is assumed to be accommodated by an additional vessel in year 6 onwards. The operator of the additional vessel need not be the same as the original one. Thus, additional port and terminal revenues are considered throughout the life of the terminal operations.
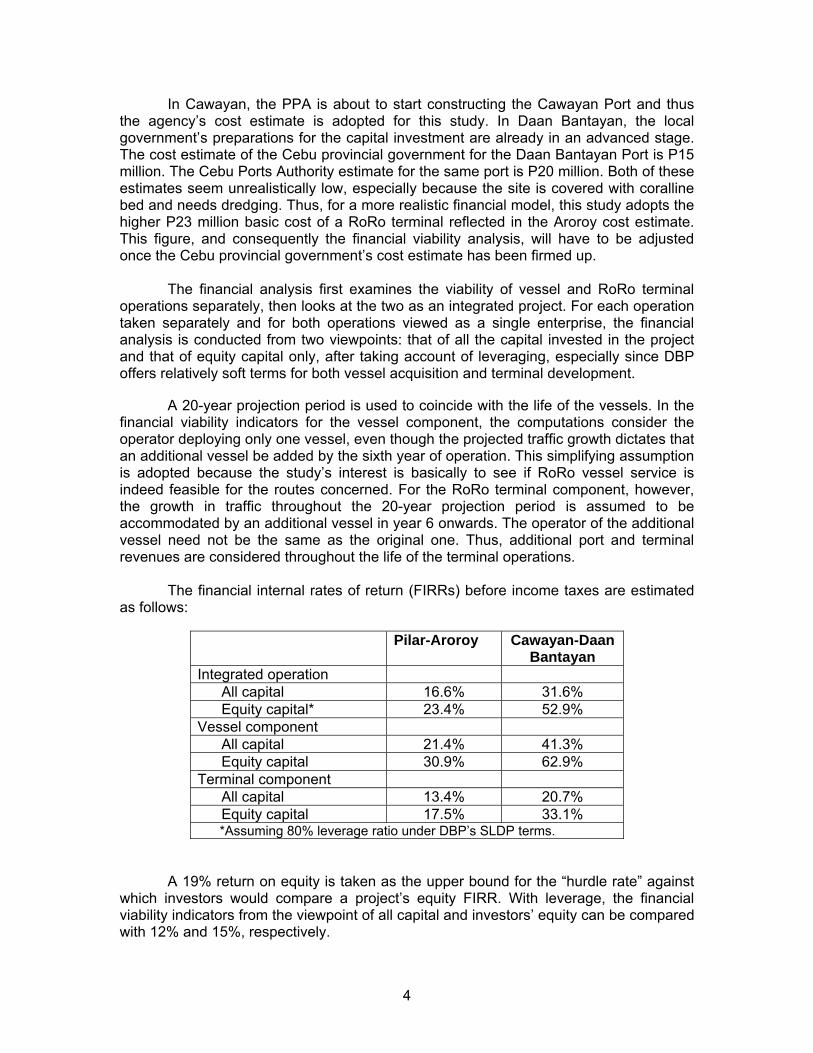
The financial internal rates of return (FIRRs) before income taxes are estimated as follows:
Pilar-Aroroy Cawayan-Daan Bantayan
Integrated operation All capital 16.6% 31.6% Equity capital* 23.4% 52.9%
Vessel component All capital 21.4% 41.3% Equity capital 30.9% 62.9%
Terminal component All capital 13.4% 20.7% Equity capital 17.5% 33.1%
*Assuming 80% leverage ratio under DBP’s SLDP terms. A 19% return on equity is taken as the upper bound for the “hurdle rate” against
which investors would compare a project’s equity FIRR. With leverage, the financial viability indicators from the viewpoint of all capital and investors’ equity can be compared with 12% and 15%, respectively.
4
It is obvious from the FIRRs above that while the vessel operations are highly remunerative, the terminal operations are only marginally so. One reason for the low FIRRs in the terminals considered is the high investment cost. While the FIRRs for vessel operations look very attractive, it should be noted that one cannot operate the vessel along a given route without the RoRo terminals at either end of the route. In other words, the two are interdependent or complementary activities.
The MARINA Domestic Shipping Development Plan (2005) concedes that domestic port projects have always been pursued based on their social desirability and very rarely are domestic ports developed based on their financial viability. Thus, domestic port projects have often relied on government subsidy. In the case here, a government subsidy may not be necessary if investors would pursue an integrated vessel and port operation and let the commercially viable vessel component cross-subsidize the less profitable port component.
Viewed as integrated operations, the Pilar-Aroroy link gets to look more viable with an FIRR of 16.6%, while the Cawayan-Daan Bantayan route yields a high 31.6%. Focusing on returns to the investors’ equity alone (with 80% leverage), the feasibility indicators look even more attractive: 23.4% for Pilar-Aroroy and 52.9% for Cawayan-Daan Bantayan.
The feasibility of the proposed routes from the economy’s viewpoint is also
examined in this study. The methodology for the economic analysis adopts an integrated approach where the benefits and costs to the economy are estimated as the aggregate of the benefits and costs to the different stakeholders directly affected by the project: the users, the vessel operators, the terminal operators, the financiers, and the government. Spillovers (or externalities) to other stakeholders indirectly affected are then added on.
For the Pilar-Aroroy link, the EIRR for the integrated vessel and RoRo terminal operations is 19.9%; for the Cawayan-Daan Bantayan link, it is 37.9%. These numbers compare favorably against the opportunity cost of capital from the economy’s viewpoint, which would be about 16% in nominal terms (12% real rate plus 4% inflation). Conclusions and Recommendations
For the cases at hand, all the four local governments (Pilar, Aroroy, Cawayan, and Daan Bantayan) express the desire to invest in RoRo terminals, but tight fiscal positions coupled with the difficulty of having two local governments at either end of a potential connection coordinate with each other have kept the investment opportunities from materializing. This study has shown that these investments are financially and economically worthwhile, even in the context of the new RRTS paradigm whereby there would be port facilities dedicated to RoRo operations that do away with the arrastre charges for services that are not even needed. At the same time, an implication flowing from the financial analysis is that, in the absence of any port or terminal development that dedicates a ramp for RoRo services, it would pay for the vessel operators to invest in the facilities themselves. The present policy environment allows this arrangement, as both PPA and local governments have the mandate to engage the private sector in long-term concession agreements.
There are also significant policy and institutional considerations. One important policy matter is the separation of the RRTS from the regular ports operated by either
5
PPA or the Cebu Ports Authority (CPA). Most of the existing RRTS connections today have terminals within the jurisdiction of PPA (CPA in the case of Cebu province), with the contracts between PPA and the arrastre companies still in force. This is why PPA, despite EO 170, has to pay to the arrastre companies a part of the terminal fees. For the intentions of EO 170 t be realized, it is crucial that the RRTS is to be looked at differently from the regular shipping and port operations. There should be no cargo handing in the RRTS; only the terminal fee and the passage fee have to be paid for so that the seamless travel for vehicles and passengers can be achieved.
An important step towards the creation of a truly nautical highway is to relieve both MARINA and PPA of the overall responsibility over the RRTS. A separate regulatory body (a “Nautical Highway Regulatory Board” or NHRB) is perhaps needed to implement the RRTS concept. EO 170 says that the RRTS shall be considered as part of the national highways. It is therefore natural that DPWH should be given a clear mandate and should take a leading role in developing the RRTS. MARINA’s role should simply be to assure the riding public that the RoRo vessels are seaworthy and safe while the PPA should confine its role to that of leasing out the terminals to private operators. It may take some time before such a regime is put in place; meanwhile, in the short run, the policies of MARINA and PPA should be aligned with the RRTS concept.
One recommendation emanating from the financial and economic analysis in this study is the formation of a joint venture corporation (JVC) between local governments that would competitively bid out either a concession agreement or a solicited BOT. The role of DBP, aside from the offer of financing to both the LGUs and the private sector partners, is to assist the LGUs concerned in the creation of the JVC and the formulation of the terms of reference for the competitive tender in either mode.
In conclusion, the routes have sufficiently high yields when viewed as an integrated operation, even from a private sector perspective. The challenge then is how to design the institutional arrangements that would encourage more private sector participation in the development of RoRo terminals.
For the specific connections that are the subject of this study, practically all of the four prospective terminals have recently gotten the commitment of either the national government or the provincial government for financial assistance in RoRo-enabled port development (PPA for Pilar, Aroroy, and Cawayan, the Cebu provincial government for Daan Bantayan). While this is very much welcome for the concerned municipalities, the possible downside is that support from above may cause project implementation to diverge from the RRTS framework.
Nevertheless, it is hoped that this study shall have helped stimulate private sector interest not only in vessel operations but in terminal operations as well, and shall have enlightened the stakeholders from government, both national and local, on the benefits of keeping faithful to the RRTS concept.
6
THE ROAD-RORO TERMINAL SYSTEM
Bicol Mainland-Masbate-Cebu Connection
Table of Contents I. BACKGROUND
A. Macro Perspectives: The Philippine Nautical Highway System 1 B. Micro Perspectives: Progress in the Roxas-Caticlan Route 3
II. THE RRTS CONCEPT 4
A. How RRTS Differs from Regular RoRo Services 4 B. Policy Initiatives: Executive and Legislative 7
III. THE BICOL MAINLAND-MASBATE-CEBU CONNECTION:
A MISSING LINK IN THE CENTRAL NAUTICAL HIGHWAY 8
A. Regional Characteristics 9 B. The Local Economies 13
IV. THE PROJECT PROFILE 21
A. Market Aspects – Demand and Supply Analysis 21 B. Technical Aspects – Vessel and Terminal Operations 35 C. Financial Analysis – Vessel and Terminal Operations 43 D. Economic Analysis – Accounting for Spillover Effects 54
V. ISSUES AND CONCERNS 56
A. Policy Considerations 56 B. Implementation Concerns 58 C. Possible Institutional Arrangements 59
VI. CONCLUDING REMARKS 60 Appendix A: Projected Cash Flows: Pilar-Aroroy 61
Appendix B: Projected Cash Flows: Cawayan-Daan Bantayan 65
I. BACKGROUND A. Macro Perspectives: The Philippine Nautical Highway System
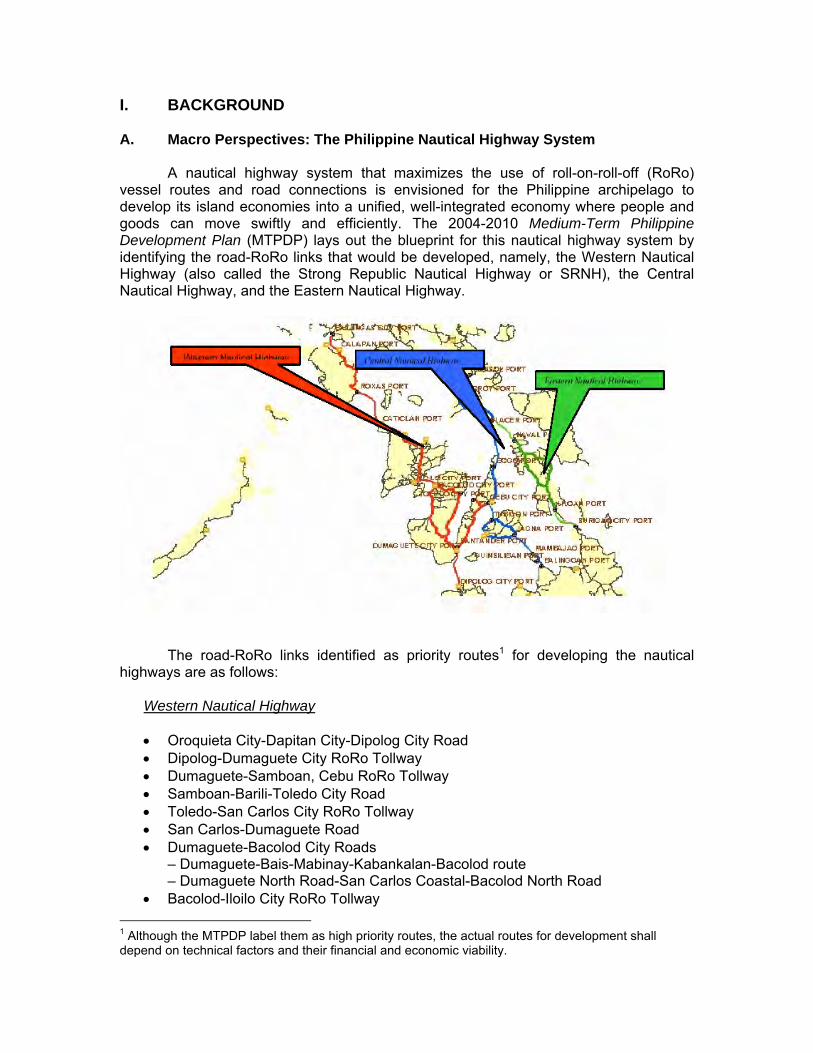
A nautical highway system that maximizes the use of roll-on-roll-off (RoRo) vessel routes and road connections is envisioned for the Philippine archipelago to develop its island economies into a unified, well-integrated economy where people and goods can move swiftly and efficiently. The 2004-2010 Medium-Term Philippine Development Plan (MTPDP) lays out the blueprint for this nautical highway system by identifying the road-RoRo links that would be developed, namely, the Western Nautical Highway (also called the Strong Republic Nautical Highway or SRNH), the Central Nautical Highway, and the Eastern Nautical Highway.
The road-RoRo links identified as priority routes1 for developing the nautical highways are as follows:
Western Nautical Highway
• Oroquieta City-Dapitan City-Dipolog City Road • Dipolog-Dumaguete City RoRo Tollway • Dumaguete-Samboan, Cebu RoRo Tollway • Samboan-Barili-Toledo City Road • Toledo-San Carlos City RoRo Tollway • San Carlos-Dumaguete Road • Dumaguete-Bacolod City Roads
– Dumaguete-Bais-Mabinay-Kabankalan-Bacolod route – Dumaguete North Road-San Carlos Coastal-Bacolod North Road
• Bacolod-Iloilo City RoRo Tollway 1 Although the MTPDP label them as high priority routes, the actual routes for development shall depend on technical factors and their financial and economic viability.
• Iloilo City-Caticlan (Aklan) Roads – Iloilo City-Passi-Calinog-Ivisan-Kalibo-Nabas-Caticlan Road – Iloilo East Coast-Capiz Road
• Caticlan, Aklan-Roxas, Mindoro Oriental RoRo Tollway • Roxas-Calapan, Mindoro Oriental Road • Calapan-Batangas City RoRo Tollway
Central Nautical Highway
• Calinan, Davao-Buda, Bukidnon-Misamis Oriental Road • Butuan City-Agusan del Norte-Misamis Oriental Road • Balingoan, Misamis Oriental-Guinsiliban, Camiguin RoRo Tollway • Guinsiliban-Mambajao Road, Camiguin • Mambajao, Camiguin-Jagna, Bohol RoRo Tollway • Jagna-Tubigon Roads, Bohol
– Bohol Circumferential Road – [Loay Interior Road] Jagna-Sierra Bullones-Clarin-Tubigon Road
• Tubigon, Bohol-Cebu City RoRo Tollway • Cebu City-Toledo Road • Toledo-San Carlos RoRo Tollway • San Carlos-Dumaguete Road • Dumaguete-Samboan RoRo Tollway • Samboan-Cebu City Road • Cebu City-San Remigio, Cebu Road • San Remigio-Placer, Masbate RoRo Tollway • Placer, Masbate-Aroroy, Masbate Road • Aroroy, Masbate-Boca Engano, Masbate RoRo Tollway • Boca Engano, Masbate-Claveria, Masbate Road • Claveria, Masbate-Pantao, Albay RoRo Tollway • Claveria, Masbate-San Pascual, Masbate Road • San Pascual, Masbate-Pasacao, Camarines Sur RoRo Tollway
Eastern Nautical Highway
• Davao-Compostela Valley-(Alegria-Santiago, Bayugan-San Francisco-Trento-
Monkayo)-Agusan-Surigao Road • Surigao City-Liloan, Southern Leyte RoRo Tollway • Liloan, Southern Leyte-Naval, Biliran Highway • Naval, Biliran-Cataingan, Masbate RoRo Tollway
Cataingan-Aroroy, Masbate Highway
The Department of Agriculture also recognizes the significant economic benefits from the nautical highway system and lists the following as components of what it calls the “RoRo Food Highway”: (a) the main route, which uses the nautical highway from Manila to Dapitan/Dipolog/Iligan; (b) the Grains Highway from Cagayan de Oro to Batangas, which involves the use of bulk-handling ships and facilities in transporting grains, principally corn; and (c) the Cagayan de Oro-Dumaguete-Batangas-Manila Long Haul Route, which involves the use of super ferries with RoRo ramps in transporting agricultural and fishery commodities from Mindanao to Luzon.
2
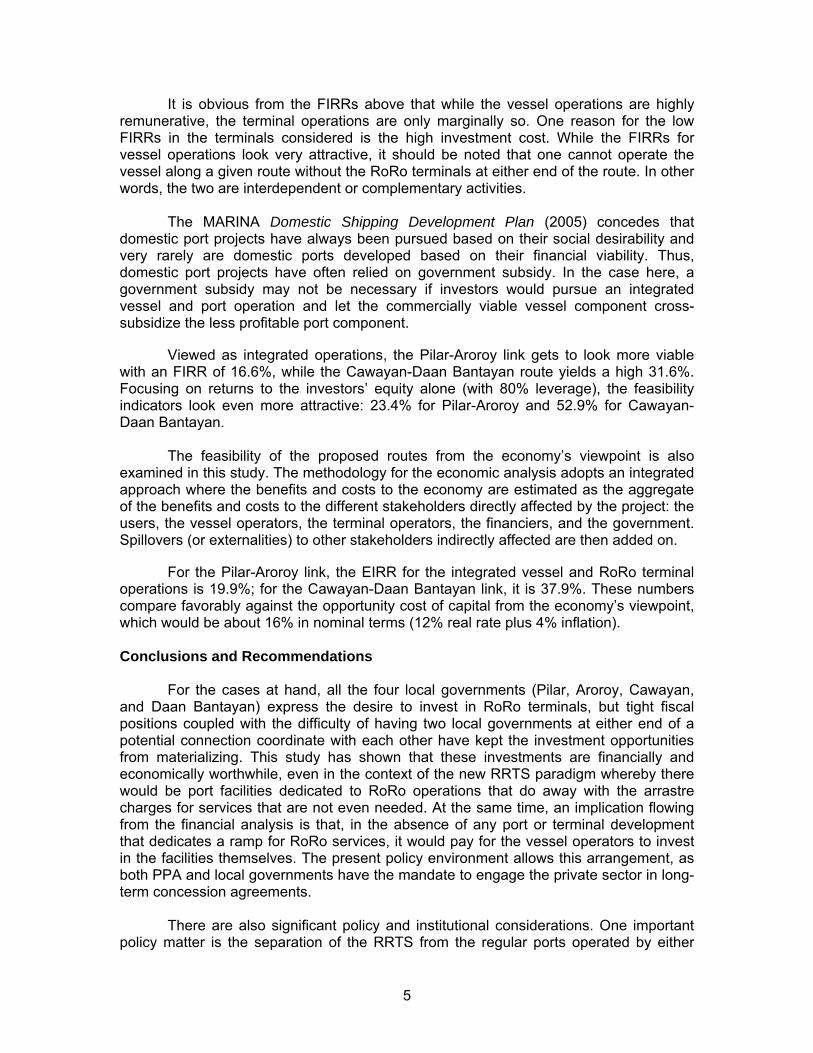
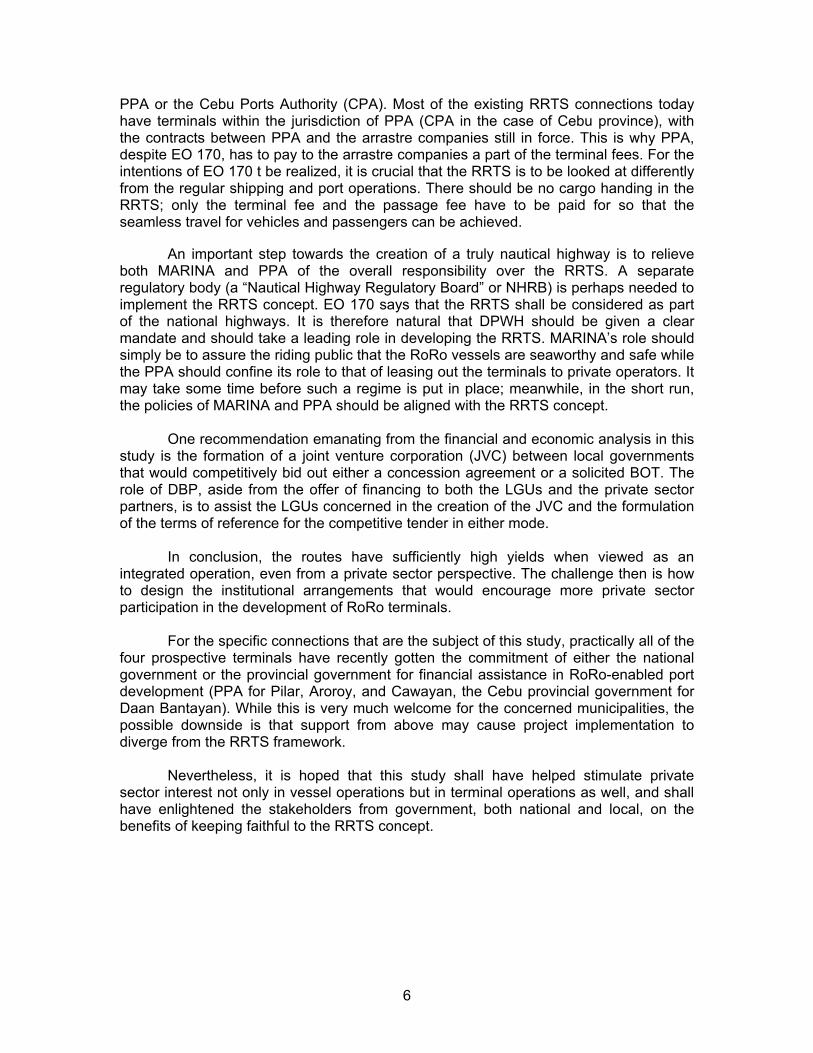
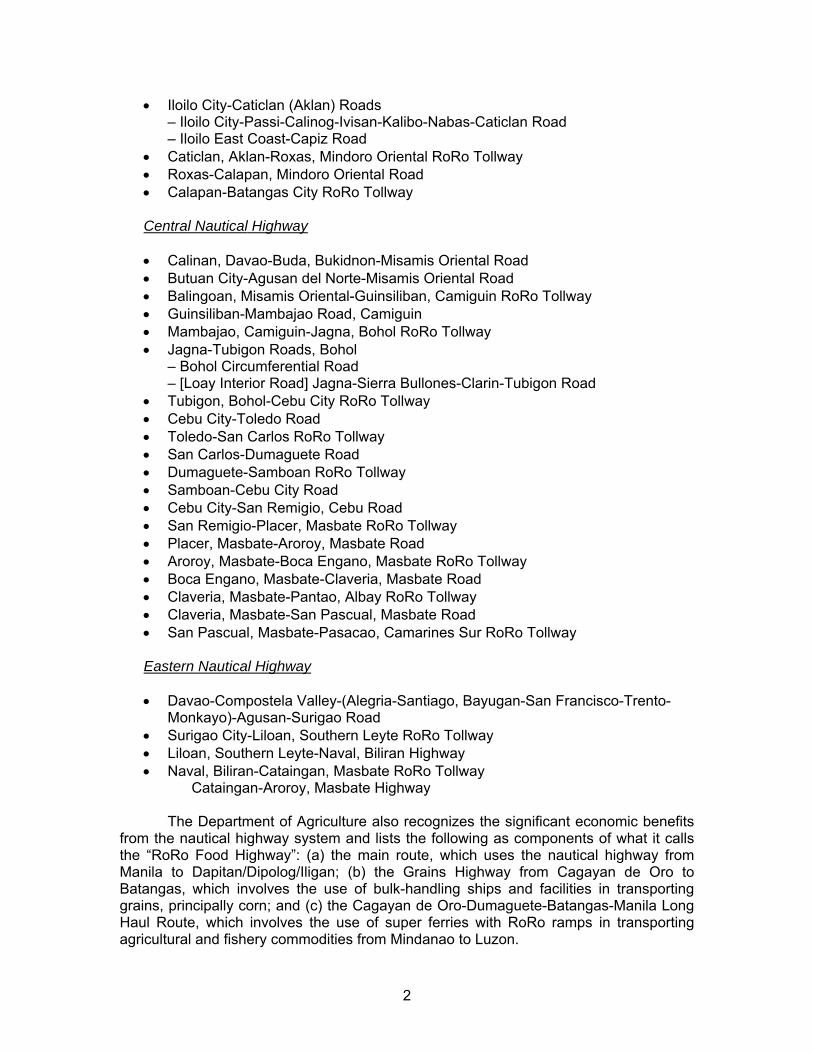
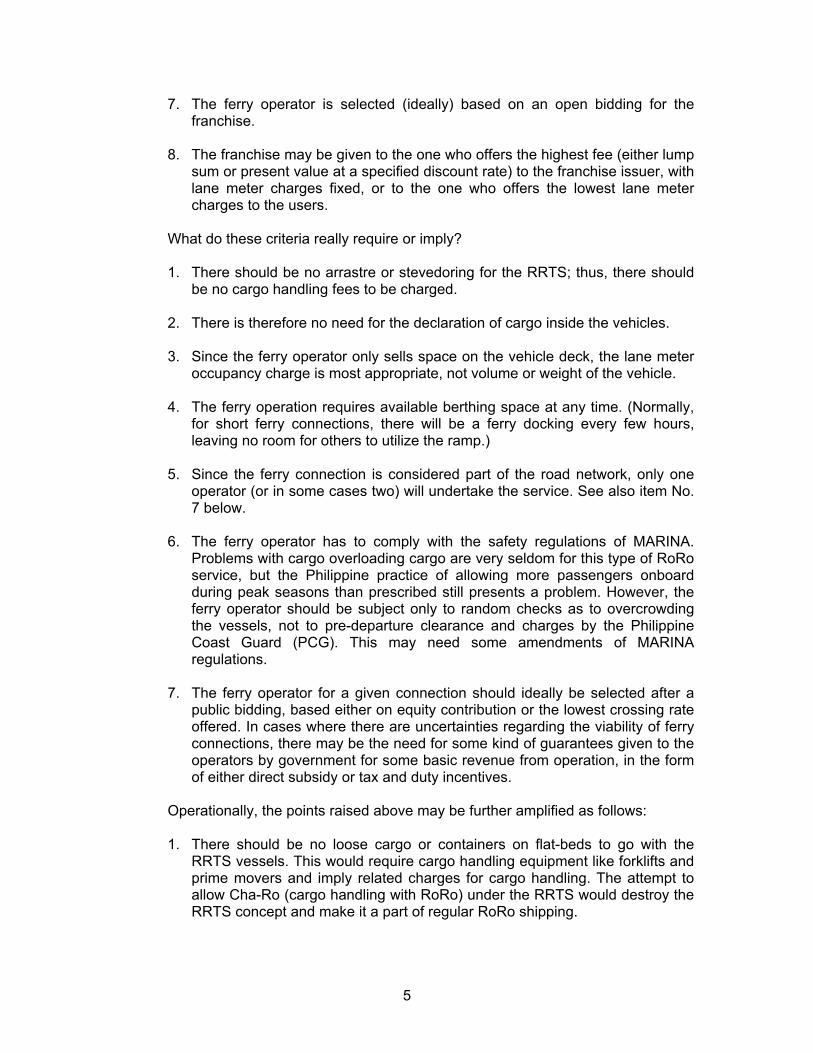
The 919-kilometer SRNH was promoted in 2003 to enhance the accessibility of local destinations west of the Philippines and accelerate the development of the country's southern islands by opening an alternative and low-cost trade, travel, and tourism route through Oriental Mindoro as gateway to and from Metro Manila. The SRNH covers Oriental Mindoro, Marinduque, Romblon, and Batangas in Luzon; Aklan, Antique, Iloilo, Capiz, Negros Oriental, Negros Occidental, Bohol, Cebu, Guimaras, and Siquijor in the Visayas; and Misamis Occidental, Misamis Oriental, Lanao del Norte, and Dapitan City in Mindanao. B. Micro Perspectives: Progress in the Roxas-Caticlan Route Studies have shown that the SRNH has enhanced investment opportunities in agro-industries, commerce, trade, and tourism, and has provided cheaper, efficient, and convenient travel movement of local and international tourists and investors. The MTPDP 2005 Update in particular claims that the SRNH introduced in 2003 has reduced travel costs by 40 percent for passengers and 30 percent for cargo. Although no formal study of the benefits of the whole SRNH route has been made yet, a visit to Roxas, Oriental Mindoro—one of the links in the SRNH—provides interesting perspectives on the impact of the SRNH on the local economy. The Roxas-Caticlan route became part of the SRNH when RoRo vessels started operating in the route in June 2003. With the opening of the route, the municipality of Roxas in Oriental Mindoro was transformed from a sleepy village into a town with steadily growing commercial activities. Barangay Dangay, the port site in Roxas, used to be the loading site for wooden motor bancas (batels) which were the only service to the Visayas during the time. What used to be a loading area for bancas is now a terminal facility for RoRo passengers. In Dangay Port, where rice fields and nipa huts stood before, there are now port facilities like the marshalling area and access road. In the nearby areas, commercial establishments like restaurants, general merchandise stores, small hotels, lending institutions, and gas stations have sprouted. The University of Asia and the Pacific (UA&P) study on the “Economic Impact of RoRo Shipping on the Development of the Municipality of Roxas, Oriental Mindoro” describes the socio-economic effects in terms of new establishments that have been set up in Roxas ever since the RoRo operations began in 2003: two small hotels, four gasoline stations, five lending institutions, and a number of restaurants.
North portion of Dangay Port: passenger terminal (with blue roof), PPA building, port road and
port gate (far right); to the right of the port is the marshalling area (not visible)
3
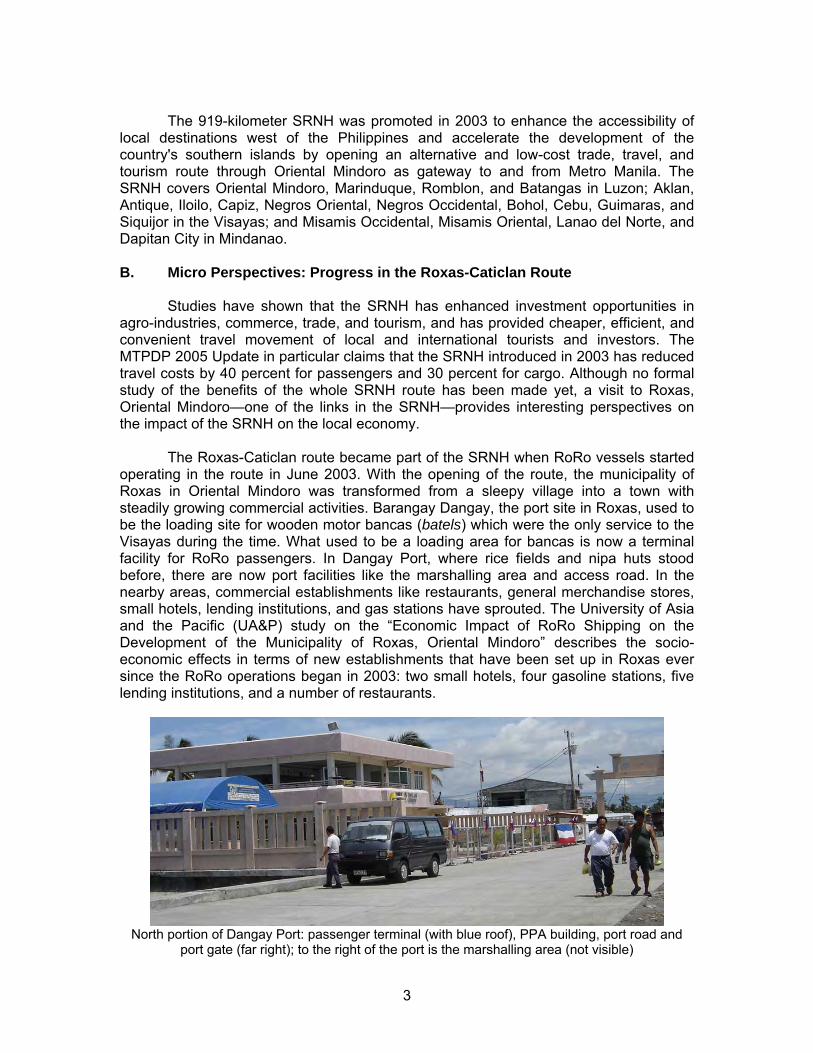
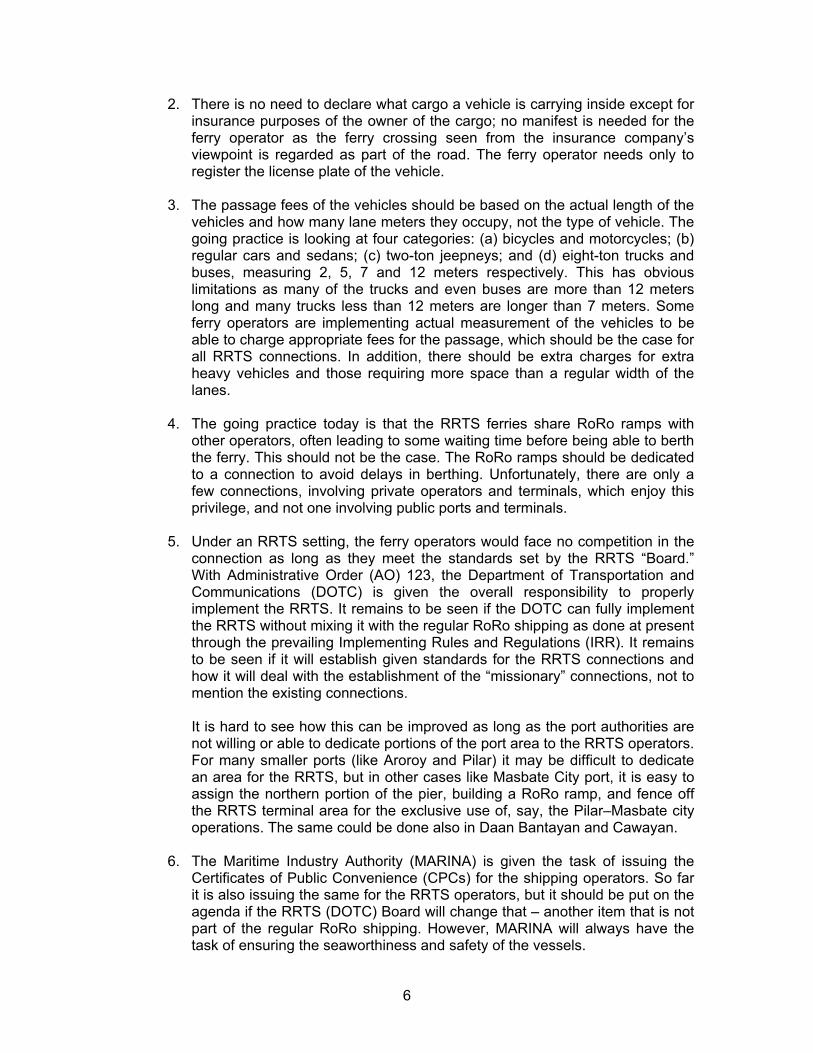
South portion of Dangay Port: pier and RoRo vessels
II. THE RRTS CONCEPT A. How the RRTS Differs from Regular RoRo Services At the outset, it is important to distinguish the RRTS from regular RoRo services. The RRTS concept is based on the ferries being a part of the road network and thereby similar to crossing a bridge (like San Juanico). It is not to be regarded a part of the regular shipping. When crossing a bridge or using an expressway, one may have to pay a toll fee, but under no circumstances is one asked to declare what he or she carries in the vehicle. One just pays for the passage or, in other words, the use of that facility. The RRTS concept is based on criteria and conditions that are distinct and separate from regular shipping:
1. Only self-driven vehicles and passengers are allowed. There is therefore no
need for cargo handling. 2. No manifests are required for cargo inside the vehicles. 3. The passage rate for vehicles is based on occupancy of lane meters
onboard. 4. A given RoRo terminal is dedicated to a single ferry operator, with no other
users than the operator himself. 5. The ferry operator is given a special franchise and may enjoy no direct
competition for that particular terminal. 6. The ferry operator is responsible for compliance with safety regulations.
4
7. The ferry operator is selected (ideally) based on an open bidding for the franchise.
8. The franchise may be given to the one who offers the highest fee (either lump
sum or present value at a specified discount rate) to the franchise issuer, with lane meter charges fixed, or to the one who offers the lowest lane meter charges to the users.
What do these criteria really require or imply?
1. There should be no arrastre or stevedoring for the RRTS; thus, there should be no cargo handling fees to be charged.
2. There is therefore no need for the declaration of cargo inside the vehicles. 3. Since the ferry operator only sells space on the vehicle deck, the lane meter
occupancy charge is most appropriate, not volume or weight of the vehicle. 4. The ferry operation requires available berthing space at any time. (Normally,
for short ferry connections, there will be a ferry docking every few hours, leaving no room for others to utilize the ramp.)
5. Since the ferry connection is considered part of the road network, only one
operator (or in some cases two) will undertake the service. See also item No. 7 below.
6. The ferry operator has to comply with the safety regulations of MARINA.
Problems with cargo overloading cargo are very seldom for this type of RoRo service, but the Philippine practice of allowing more passengers onboard during peak seasons than prescribed still presents a problem. However, the ferry operator should be subject only to random checks as to overcrowding the vessels, not to pre-departure clearance and charges by the Philippine Coast Guard (PCG). This may need some amendments of MARINA regulations.
7. The ferry operator for a given connection should ideally be selected after a
public bidding, based either on equity contribution or the lowest crossing rate offered. In cases where there are uncertainties regarding the viability of ferry connections, there may be the need for some kind of guarantees given to the operators by government for some basic revenue from operation, in the form of either direct subsidy or tax and duty incentives.
Operationally, the points raised above may be further amplified as follows:
1. There should be no loose cargo or containers on flat-beds to go with the RRTS vessels. This would require cargo handling equipment like forklifts and prime movers and imply related charges for cargo handling. The attempt to allow Cha-Ro (cargo handling with RoRo) under the RRTS would destroy the RRTS concept and make it a part of regular RoRo shipping.
5
2. There is no need to declare what cargo a vehicle is carrying inside except for insurance purposes of the owner of the cargo; no manifest is needed for the ferry operator as the ferry crossing seen from the insurance company’s viewpoint is regarded as part of the road. The ferry operator needs only to register the license plate of the vehicle.
3. The passage fees of the vehicles should be based on the actual length of the
vehicles and how many lane meters they occupy, not the type of vehicle. The going practice is looking at four categories: (a) bicycles and motorcycles; (b) regular cars and sedans; (c) two-ton jeepneys; and (d) eight-ton trucks and buses, measuring 2, 5, 7 and 12 meters respectively. This has obvious limitations as many of the trucks and even buses are more than 12 meters long and many trucks less than 12 meters are longer than 7 meters. Some ferry operators are implementing actual measurement of the vehicles to be able to charge appropriate fees for the passage, which should be the case for all RRTS connections. In addition, there should be extra charges for extra heavy vehicles and those requiring more space than a regular width of the lanes.
4. The going practice today is that the RRTS ferries share RoRo ramps with
other operators, often leading to some waiting time before being able to berth the ferry. This should not be the case. The RoRo ramps should be dedicated to a connection to avoid delays in berthing. Unfortunately, there are only a few connections, involving private operators and terminals, which enjoy this privilege, and not one involving public ports and terminals.
5. Under an RRTS setting, the ferry operators would face no competition in the
connection as long as they meet the standards set by the RRTS “Board.” With Administrative Order (AO) 123, the Department of Transportation and Communications (DOTC) is given the overall responsibility to properly implement the RRTS. It remains to be seen if the DOTC can fully implement the RRTS without mixing it with the regular RoRo shipping as done at present through the prevailing Implementing Rules and Regulations (IRR). It remains to be seen if it will establish given standards for the RRTS connections and how it will deal with the establishment of the “missionary” connections, not to mention the existing connections.
It is hard to see how this can be improved as long as the port authorities are
not willing or able to dedicate portions of the port area to the RRTS operators. For many smaller ports (like Aroroy and Pilar) it may be difficult to dedicate an area for the RRTS, but in other cases like Masbate City port, it is easy to assign the northern portion of the pier, building a RoRo ramp, and fence off the RRTS terminal area for the exclusive use of, say, the Pilar–Masbate city operations. The same could be done also in Daan Bantayan and Cawayan.
6. The Maritime Industry Authority (MARINA) is given the task of issuing the
Certificates of Public Convenience (CPCs) for the shipping operators. So far it is also issuing the same for the RRTS operators, but it should be put on the agenda if the RRTS (DOTC) Board will change that – another item that is not part of the regular RoRo shipping. However, MARINA will always have the task of ensuring the seaworthiness and safety of the vessels.
6
7. In relation to these items concerning the RRTS, many of the indicated ferry
connections are already serviced by shipping operators with various degrees of real RoRo vessels and service, some very close to the RRTS operation described above. This goes among others for Regina Shipping operating between Albay and Catanduanes as well as for Daima Shipping operating across Pangil Bay, Osamis to Lanao del Norte as well as several operators for the Batangas to Calapan connection.
For missionary connections, ideally the franchise should be based on competitive bidding, realizing there might be a need for some kind of subsidies. Being a part of the road network, the RRTS should be subject to government appropriations similar to what it comes to building a bridge or maintaining a road. The bill being deliberated on in Congress aims at P20 billion in appropriations. That amount should be adequate for most remote places to secure access to proper transport means – not the least a RoRo ferry connecting the area to the adjacent island or market place, thus spurring economic activities in the area.
B. Policy Initiatives: Executive and Legislative
The policy initiative that jumpstarted the SRNH is Executive Order (EO) 170 issued on January 22, 2003, which aims to promote private sector participation and investment in the development and operation of the road-RoRo terminal system (RRTS). In EO 170, the elements and principles of the RRTS are spelled out. The RRTS is defined as a network of RoRo terminals all over the country, separated by a distance of not more than 50 nautical miles and linked by RoRo vessels. The RRTS toll is defined as consisting of the terminal fee, passage fee, and berthing fee. The EO also stipulates that the RRTS shall be considered part of the national highway system. After EO 170 was issued, it became apparent that there is a need to expand the coverage of the RRTS to include long-haul RoRo vessels so as to support further the agri-fisheries modernization and food security programs of government and to reduce the cost of inter-island transportation. Thus, EO 170 was amended by EO 170-A, issued on June 9, 2003. The 50-nautical mile distance qualification is abolished by the amendment and the RRTS is then defined as a network of terminals all over the country, regardless of the distance covered and linked by RoRo vessels. The different government entities tasked by EOs 170 and 170-A to contribute to the development of a nationwide RRTS have subsequently issued implementing orders and policy clarifications. In support of the RRTS and consistent with the mandate of EOs 170 and 170-A, the Philippine Ports Authority (PPA) issued Administrative Order No. 03-2004 prescribing the guidelines on the development, construction, management, and operations of ferry terminals under the RRTS. The AO also stipulates the procedures for the privatization of PPA-owned RoRo Terminals listed under the identified links.2 MARINA, on the other hand, has clarified that the rolling vehicle fee based on lane meter, and the passage fee, except for third class accommodation, are deregulated. However, the procedures and conditions for the adoption and subsequent upward or downward adjustment of deregulated rates must comply with MARINA Memorandum 2 Philippine Ports Authority 2004 Annual Report
7
Circular No. 153 which provides the rules for implementing the deregulation of domestic shipping rates.3 The Development Bank of the Philippines (DBP) has made accessible its Sustainable Logistics Development Program (SLDP) financing facility for RRTS investments. The SLDP is an investment financing program designed to bring about cost-effective ways of moving people and goods, particularly grains and perishables like fish, meat, fruits, and vegetables. The program has three components: the Grains Highway, the RRTS, and the Cold Chain. One of the sources of funds for the SLDP is the Domestic Shipping Modernization Program II, a program loan from the Japan Bank for International Cooperation (JBIC). The aims of EO 170 were further expanded through the issuance of Administrative Order (AO) 123 on July 4, 2005 and EO 170-B on September 19, 2005. With AO 123, the DOTC is tasked to be the lead agency for the implementation of the RoRo system including RRTS. AO 123 also formed an inter-agency group with private sector representatives for the implementation of the RoRo system. EO 170-B calls for an increase in the number of RoRo-capable ports and the conversion of more private non-commercial port operations to private commercial port operations. It is expected that the latter will reduce the investment requirements in expanding the country’s port system. EO 170-B also directs the port authorities and MARINA to ensure that cargo handling charges are not retained in any form or manner (e.g., by changing the nomenclature of the fee or charge), and that RRTS charges are applied uniformly in all ports. The policy environment continues to evolve. At present, there is a pending House Bill No. 335 on RRTS sponsored by Representative Imee Marcos. The House Bill aims to institutionalize via legislation the spirit of RRTS as contained in EOs 170, 170-A, and 170-B. The bill is currently being discussed and improved upon by a technical working group set up by Representative Augusto Bacullo. III. THE BICOL MAINLAND-MASBATE-CEBU CONNECTION:
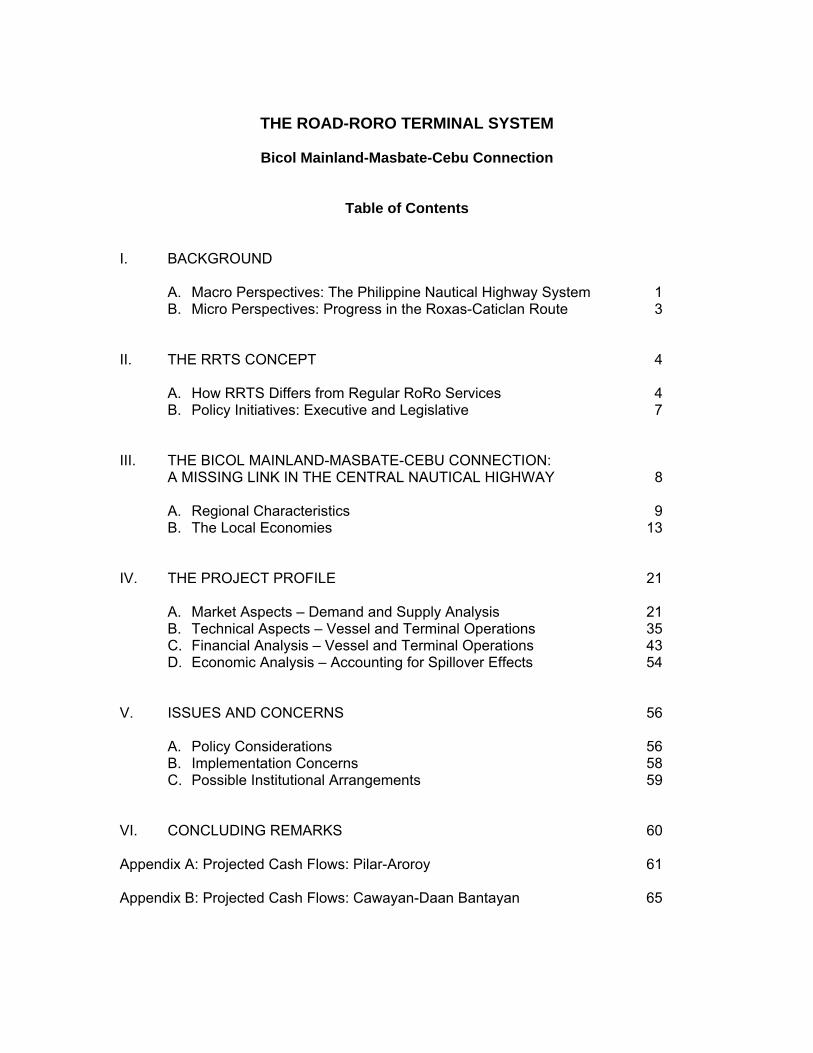
A MISSING LINK IN THE CENTRAL NAUTICAL HIGHWAY
The RRTS as a whole can be fully functional once the missing links are connected. For the Central Nautical Highway, one such missing link that has been identified is the connection from Luzon to Cebu via Masbate Island. In 2005, MARINA and the Japan International Cooperation Agency (JICA) examined the possible routes for this connection and recommended the Pilar-Masbate City-Cataingan-Bogo route as an “RRTS Pilot Project.” The “RRTS Pilot Project” is part of a much bigger study by JICA/MARINA, The Study on Domestic Shipping Development Plan in the Philippines.
The DBP approached the USAID-funded Economic Modernization through
Efficient Reforms and Governance Enhancement (EMERGE) Project to finance a study on the viability of the Bicol Mainland-Masbate-Cebu Connection that can be used in its promotion of RRTS investments. The existing JICA/MARINA study was then adopted as source of secondary information for this EMERGE project.
3 Speech by MARINA Deputy Administrator Gloria Banas, SRNH Conference, October 22, 2003
8
Masbate Province
Bicol Mainland
Cebu Province
A. Regional Characteristics A.1 The Bicol Region
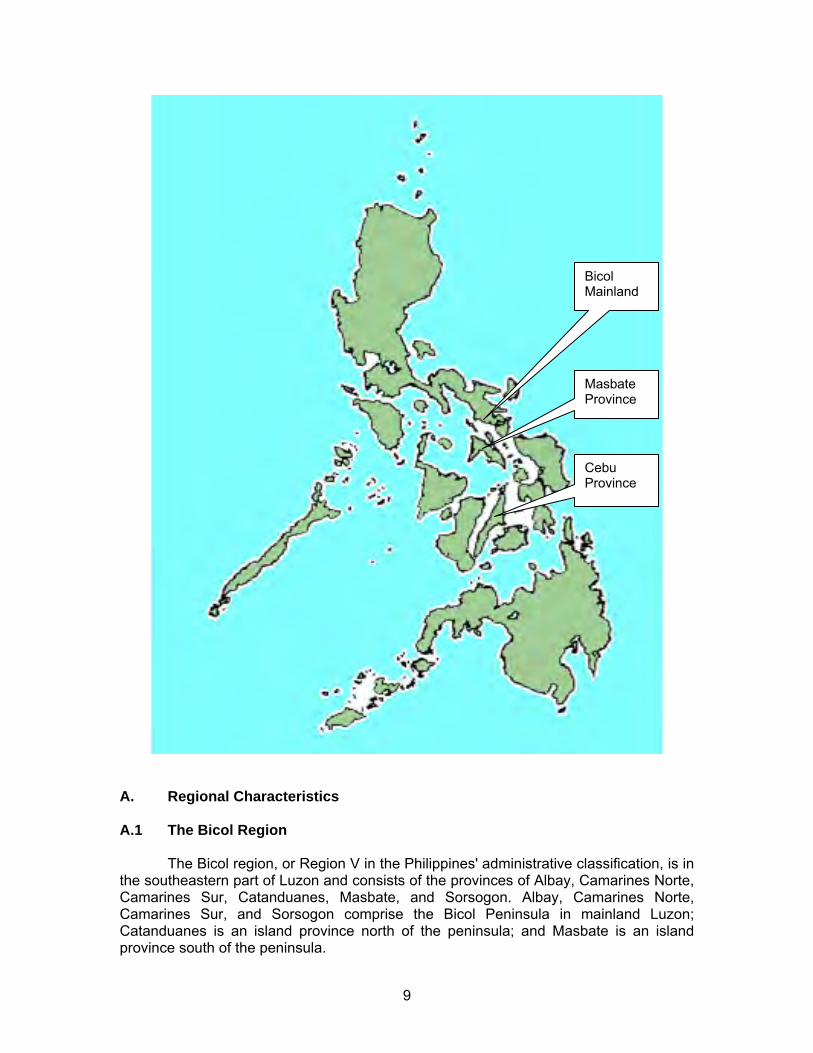
The Bicol region, or Region V in the Philippines' administrative classification, is in the southeastern part of Luzon and consists of the provinces of Albay, Camarines Norte, Camarines Sur, Catanduanes, Masbate, and Sorsogon. Albay, Camarines Norte, Camarines Sur, and Sorsogon comprise the Bicol Peninsula in mainland Luzon; Catanduanes is an island province north of the peninsula; and Masbate is an island province south of the peninsula.
9
As of 2000 (latest census), the population in the region stood at 4.67 million. The
region’s population growth rate is 1.68% annually (based on 1995-2000 data). Although lower than the national growth rate of 2.36%, it is still considered a high growth rate. Its net migration rate (immigration minus outmigration) of -24.9 per 1000 people indicates that Bicol is an outmigration region. Despite this, however, the region’s population continues to grow because of a high crude birth rate of 29.6 per 1000 population. Seventy-two percent of the regional population reside in rural areas. Poverty incidence has improved between the estimation periods by the National Statistical Coordination Board (NSCB)—40.6% of families in the region were poor in 2003, down from 45.3% in 2000. These numbers nevertheless are way above the national poverty incidence of 24.4% in 2003 and 27.5% in 2000.
According to the Medium-Term Regional Development Plan (MTRDP) for 2004-2010, the following are the roles of the Bicol region in relation to the rest of Luzon and the Philippines:
• geothermal energy producer • agri-industrial production center • mineral-based production center • food basket of Luzon • ecotourism destination • South Luzon’s gateway to the Visayas, Mindanao and the Pacific
For 2005, the Bicol region registered a gross regional domestic product (GRDP)
of P136.6 billion. The 2005 GRDP per capita is P26,316, which is way below the GRDP per capita of P63,556 for the whole country. Annual regional economic growth was at 5% from 2004-2005. The region is predominantly agriculture-based. In 2005, gross value added of the agriculture and fishery sector to the local economy was P27.4 billion or 20% of total GRDP.
Bicol is basically a resource-based economy where products exported utilize raw
materials indigenous to its provinces. The region’s exports are classified as traditional and nontraditional. Traditional exports include copra, abaca fiber, and coconut oil, whereas nontraditional exports include giftware, holiday decors, and garments.
The major agricultural produce in the region are coconut, abaca, cassava,
pineapple, pili nuts, rice and corn. About 21% of the country’s coconut plantations are found in Bicol—651,571 hectares or 37% of the total regional land area are planted with coconuts. The export value of coconut products for 1997-2003 amounted to US$198.5 million, or 5.22% of the country’s coconut product exports. There is a high demand from China and Japan for coconut oil as fuel additive. The region has six operating oil mills or refineries, eight decorticating plants, one virgin coconut oil plant and one nata de coco producer. However, the production level of 38 coconuts per tree per year indicates a low productivity of coconut farms in the region.
The Bicol region contributes 25% to the national abaca production. Abaca fiber is
the leading raw material for export-oriented handicrafts and is also an input to the pulp and paper industries. The major abaca-producing provinces are Albay, Catanduanes,
10
Sorsogon, and Camarines Sur. However, the average yield in abaca production is low at 0.45 MT per hectare as against the 0.7 MT per hectare national average.
Bicol is the second major cassava-producing region in the country. Camarines
Norte and Camarines Sur are the leading cassava-producing provinces. A high demand for cassava tubers was registered in 2004: a Batangas exporter-manufacturer required 20 tons of cassava per week; B-MEG needed 300 tons of dried cassava chips per month; four manufacturing plants for noodles required two tons of cassava starch per month.
It is also the third largest pineapple-producing region in the country, promoting
the sweetest variety of pineapple, the “Queen” or “Formosa” variety. Pineapple planting is mostly concentrated in Camarines Norte. The area planted to this crop was 3,643 hectares in 2003, of which 3,150 hectares were in Camarines Norte
Pili, a nut the quality of which can strongly compete with other nuts such as
cashew and those grown in other countries, is a prime commodity of the Bicol region. Approximately 4,000 hectares of land in the region, mostly in Sorsogon and Albay, are planted with pili.
Bicol contributes 7% to total Philippine rice production. Rice production in 2003
was 846,000 MT for a 74% sufficiency level. The average yield of rice increased from 2.44 MT per cropping per hectare in 2001 to 3.90 MT in 2003, but is much lower than the potential yield of 6.5 MT per cropping. Only 48% of the 212,833 hectares of irrigable land do have irrigation.
Corn production in 2003 was 67,000 MT for a 91% sufficiency level. Prime corn
lands are concentrated in the provinces of Masbate (57%), Camarines Sur (26%), and Albay (16%).
The region is also home to the leading cattle-producing province in the country,
Masbate. It has an extensive coastline and sea coasts which are indented with numerous bays and gulfs. There are 16 marine fishing grounds, six of which are among the richest in the country, namely, Lagonoy Gulf, Lamon Bay, Ragay Gulf, Visayan Sea, Samar Sea, and Sibuyan Sea. The major marine species that can be caught in the region are siganid and tuna. A.2 The Central Visayas Region
The Central Visayas Region (Region VII) lies at the center of the Philippine archipelago between the major islands of Luzon and Mindanao. It is bounded on the north by the Visayan Sea, on the east by the Camotes Sea and the Camigao Channel, on the south by the Mindanao Sea, and on the west by the province of Negros Occidental. Four provinces comprise the region—Bohol, Cebu, Negros Oriental and Siquijor.
Based on the results of the 2000 Census of Population, Central Visayas is the
fifth most populous region in the Philippines. Its population of a little over 5.7 million accounts for 7.4 percent of the country's total. On the average, the regional population grew at an annual rate of 2.79 percent from 1995 to 2000.
11
Central Visayas, with its total land area of 1.5 million hectares, is one of the most densely populated regions in the country. From 335 persons for every square kilometer of land in 1995, the population density rose to 381 persons per square kilometer in 2000. The population density of the region is higher than the national average of 255 persons per square kilometer.
The region registered a GRDP (in current prices) of P376.8 billion in 2005. The
2005 GRDP per capita is P59,272, close to the country’s domestic product per capita of P63,556 per year. Annual regional economic growth was at 6% from 2004 to 2005.
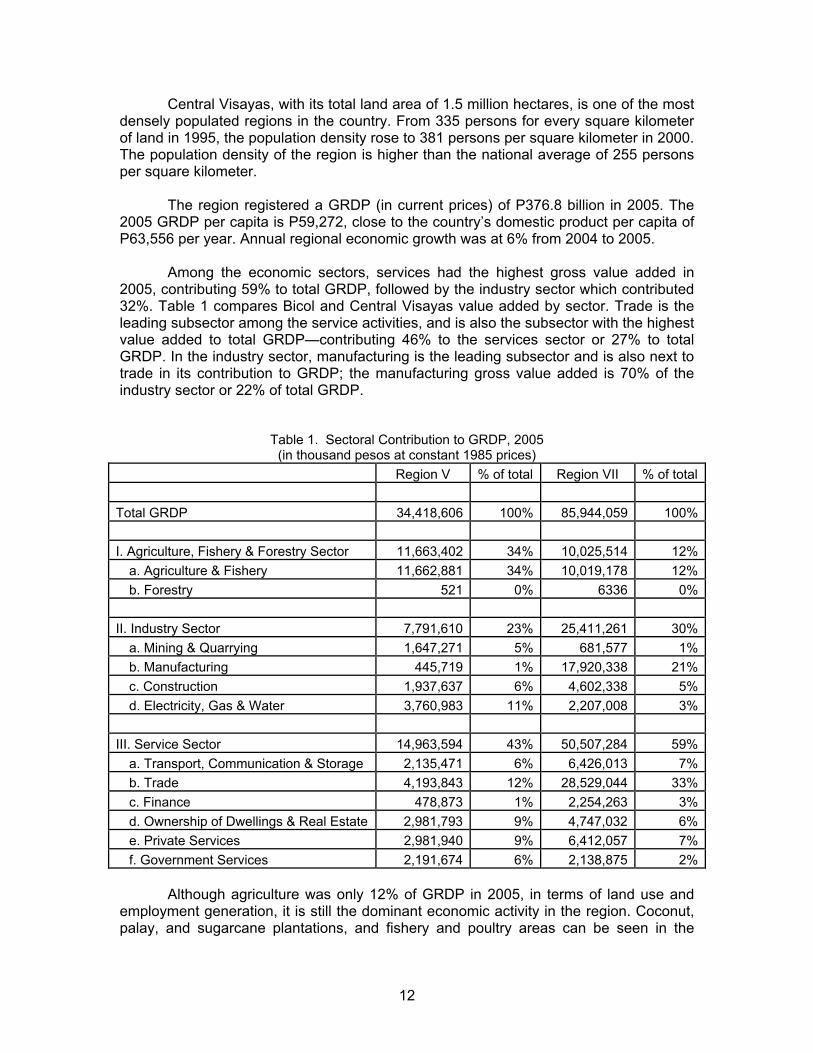
Among the economic sectors, services had the highest gross value added in
2005, contributing 59% to total GRDP, followed by the industry sector which contributed 32%. Table 1 compares Bicol and Central Visayas value added by sector. Trade is the leading subsector among the service activities, and is also the subsector with the highest value added to total GRDP—contributing 46% to the services sector or 27% to total GRDP. In the industry sector, manufacturing is the leading subsector and is also next to trade in its contribution to GRDP; the manufacturing gross value added is 70% of the industry sector or 22% of total GRDP.
Table 1. Sectoral Contribution to GRDP, 2005 (in thousand pesos at constant 1985 prices)
Region V % of total Region VII % of total Total GRDP 34,418,606 100% 85,944,059 100% I. Agriculture, Fishery & Forestry Sector 11,663,402 34% 10,025,514 12%
a. Agriculture & Fishery 11,662,881 34% 10,019,178 12%b. Forestry 521 0% 6336 0%
II. Industry Sector 7,791,610 23% 25,411,261 30%
a. Mining & Quarrying 1,647,271 5% 681,577 1%b. Manufacturing 445,719 1% 17,920,338 21%c. Construction 1,937,637 6% 4,602,338 5%d. Electricity, Gas & Water 3,760,983 11% 2,207,008 3%
III. Service Sector 14,963,594 43% 50,507,284 59%
a. Transport, Communication & Storage 2,135,471 6% 6,426,013 7%b. Trade 4,193,843 12% 28,529,044 33%c. Finance 478,873 1% 2,254,263 3%d. Ownership of Dwellings & Real Estate 2,981,793 9% 4,747,032 6%e. Private Services 2,981,940 9% 6,412,057 7%f. Government Services 2,191,674 6% 2,138,875 2%
Although agriculture was only 12% of GRDP in 2005, in terms of land use and
employment generation, it is still the dominant economic activity in the region. Coconut, palay, and sugarcane plantations, and fishery and poultry areas can be seen in the
12
landscapes of Bohol, Negros Oriental, Siquijor, and Cebu provinces. Vegetable plots, flowers, and mango trees are gaining ground in the interior hilly areas.
Central Visayas is one of the international gateways of the country, and a trade
and services hub of the Visayas-Mindanao area. The region’s economic strengths are in exports, tourism, and commerce. The region is home to several special economic zones, nationally recognized tourist attractions and facilities, and shipping and trading companies. The region is currently a net exporter. Export growth has been stimulated and sustained by production from the Mactan Export Processing Zones.
Infrastructure facilities include the Mactan Cebu International Airport, the Cebu
International Port, the port and airport network in the provinces, and the power and telecommunications facilities. Most of the country’s major shipping lines are based in Cebu. These include WG&A, Sulpicio Lines, and Gothong Lines, which ply the Luzon-Visayas, intra-Visayas and Visayas-Mindanao routes for passengers and cargo. Inter-island fast ferry operation, started by a local corporation, Aboitiz, is most active in the region. Fast ferry routes now include Cebu-Maasin-Surigao, Siquijor-Dumaguete-Oslob, Cebu-Camotes, and Cebu-Hilongos, in addition to the original Cebu-Tagbilaran, Cebu-Dumaguete, and Cebu-Ormoc routes.
Central Visayas is also one of the anchor tourist destinations in the country.
Bohol and Cebu have already been firmly placed in the itineraries of travel agencies, while Negros Oriental and Siquijor are priming to get a part of the tourist market.
B. The Local Economies in the Project Areas B.1 Sorsogon Province
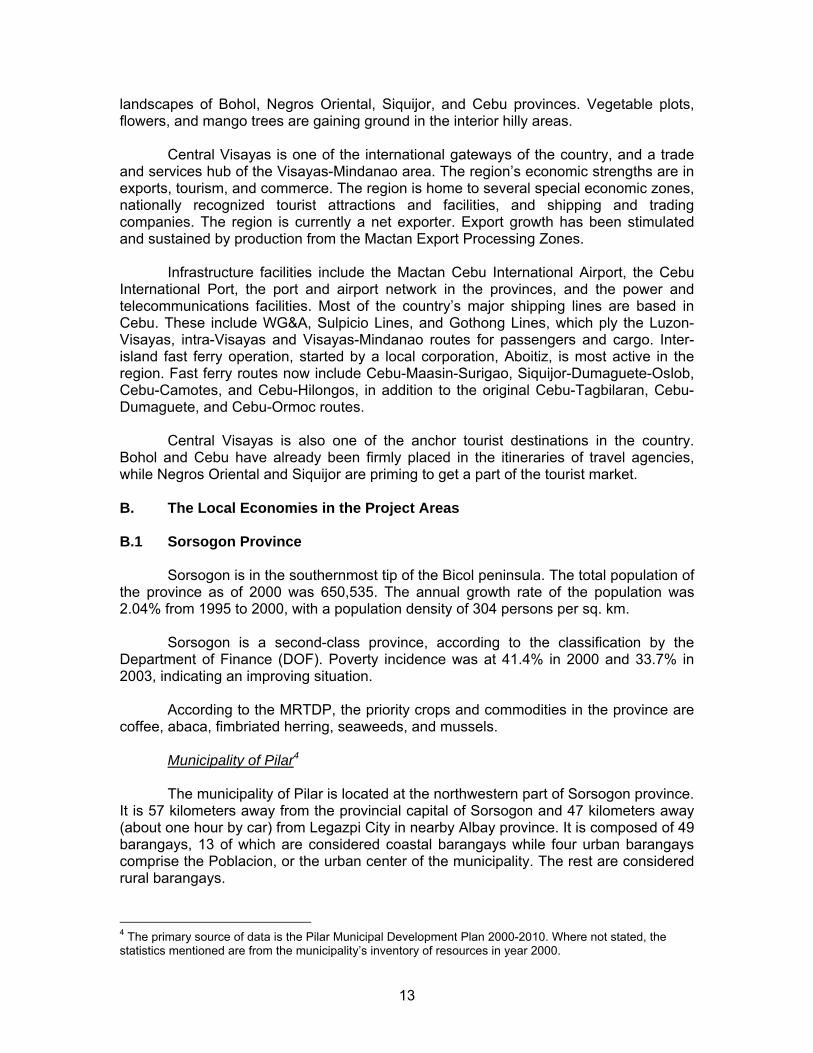
Sorsogon is in the southernmost tip of the Bicol peninsula. The total population of the province as of 2000 was 650,535. The annual growth rate of the population was 2.04% from 1995 to 2000, with a population density of 304 persons per sq. km.
Sorsogon is a second-class province, according to the classification by the Department of Finance (DOF). Poverty incidence was at 41.4% in 2000 and 33.7% in 2003, indicating an improving situation.
According to the MRTDP, the priority crops and commodities in the province are coffee, abaca, fimbriated herring, seaweeds, and mussels. Municipality of Pilar4
The municipality of Pilar is located at the northwestern part of Sorsogon province. It is 57 kilometers away from the provincial capital of Sorsogon and 47 kilometers away (about one hour by car) from Legazpi City in nearby Albay province. It is composed of 49 barangays, 13 of which are considered coastal barangays while four urban barangays comprise the Poblacion, or the urban center of the municipality. The rest are considered rural barangays.
4 The primary source of data is the Pilar Municipal Development Plan 2000-2010. Where not stated, the statistics mentioned are from the municipality’s inventory of resources in year 2000.
13
Pilar
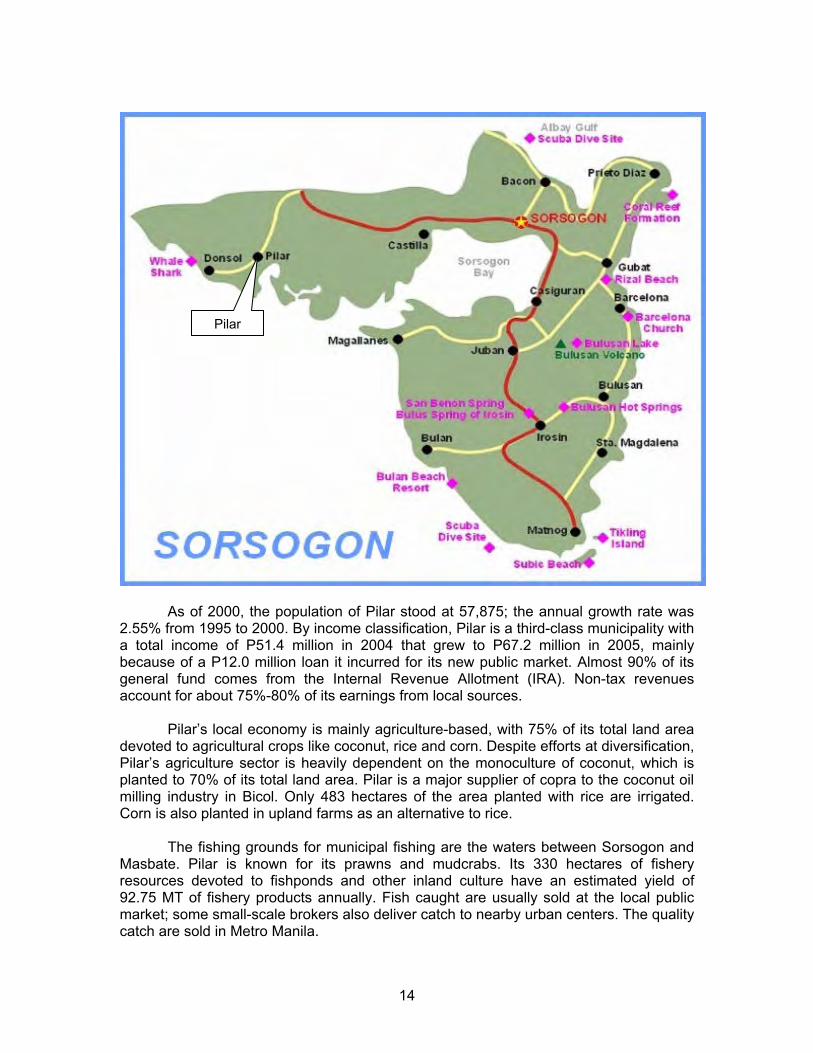
As of 2000, the population of Pilar stood at 57,875; the annual growth rate was 2.55% from 1995 to 2000. By income classification, Pilar is a third-class municipality with a total income of P51.4 million in 2004 that grew to P67.2 million in 2005, mainly because of a P12.0 million loan it incurred for its new public market. Almost 90% of its general fund comes from the Internal Revenue Allotment (IRA). Non-tax revenues account for about 75%-80% of its earnings from local sources.
Pilar’s local economy is mainly agriculture-based, with 75% of its total land area devoted to agricultural crops like coconut, rice and corn. Despite efforts at diversification, Pilar’s agriculture sector is heavily dependent on the monoculture of coconut, which is planted to 70% of its total land area. Pilar is a major supplier of copra to the coconut oil milling industry in Bicol. Only 483 hectares of the area planted with rice are irrigated. Corn is also planted in upland farms as an alternative to rice. The fishing grounds for municipal fishing are the waters between Sorsogon and Masbate. Pilar is known for its prawns and mudcrabs. Its 330 hectares of fishery resources devoted to fishponds and other inland culture have an estimated yield of 92.75 MT of fishery products annually. Fish caught are usually sold at the local public market; some small-scale brokers also deliver catch to nearby urban centers. The quality catch are sold in Metro Manila.
14
Livestock and poultry are mainly backyard operations, except for three contract growers who each raise 5,000 to 7,000 birds per batch. Carabao is primarily raised as a farm work animal. Handicraft activity, though farmed out to cottage-level production, produces finished and semi-finished products for the export market through a network of local middlemen. Raw materials include bamboo, buri and coconut midribs, abaca hemp, rattan, vines, anahaw leaves, and karagumoy. These are turned into tables and chairs, decorative objects, placemats, baskets, containers, blinds, hand fans, and mats. The local government considers its cultural and natural places of interest as promising tourist areas. The cultural places of interest are relics from the Spanish period and a newly constructed Pilar Inter-Faith Memorial Park. Natural tourist spots include white beaches and the whale shark (butanding) interaction site. The beaches are still undeveloped while the whale shark interaction has available boats and trained people who can accompany tourists. (It must be noted, however, that the Department of Tourism promotes Donsol, a nearby municipality, as the whale shark interaction site for tourists, but with Pilar providing the accommodations.) B.2 Masbate Province The province of Masbate lies south of Sorsogon and is at the center of the Philippine archipelago. It is composed of a wedge-shaped mainland (Masbate), two major islands (Ticao and Burias), and 14 small islands. The province covers a total land area of 4,047.7 sq. km. It is politically subdivided into three congressional districts, 20 municipalities, one city and 550 barangays. Masbate’s population was 707,668 in 2000. The average population density is 175 persons per square kilometer. The average annual growth rate was 1.71% from 1995 to 2000. Masbate has consistently ranked among the five poorest provinces in the country. Poverty incidence was 68.9% in 1997 and 70.9% in 2000, indicating a worsening poverty situation. Masbate is the biggest cattle raising province in the Bicol region. Its main economic activity is agriculture with copra, rice, corn, and tobacco as its main products. Fishing is also a major industry in the province. Over a quarter of the fishery production of Region V is accounted for by the province. In 2000, it produced 30,051 metric tons of fish. Until the closure of a gold mining company in 1994, the province was the site of the biggest gold mining operation in the region. Other minerals found in the province are manganese and limestone. Masbate City
Masbate City, the capital of Masbate province, is only a fifth-class city. The municipality of Masbate was converted into a component city on September 30, 2000. The city is 362 nautical miles from Manila. It is bounded on the northeast by Masbate Pass, on the southeast by Tugbo River and the municipality of Mobo, on the southwest by the municipality of Milagros and on the northwest by a portion of Asid River and the municipalities of Milagros and Baleno. Masbate City has a well-protected port with Ticao Island acting as barrier against the effects of inclement weather from the northeast.
15
Masbate City
Aroroy
Cawayan
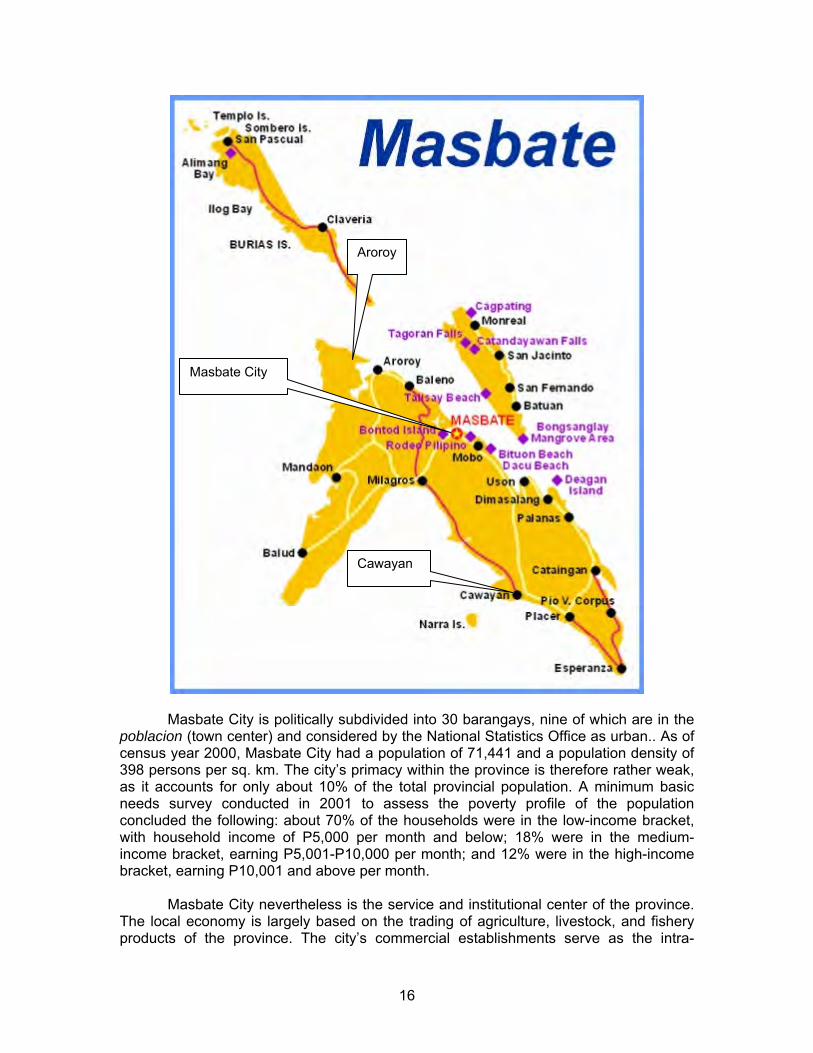
Masbate City is politically subdivided into 30 barangays, nine of which are in the
poblacion (town center) and considered by the National Statistics Office as urban.. As of census year 2000, Masbate City had a population of 71,441 and a population density of 398 persons per sq. km. The city’s primacy within the province is therefore rather weak, as it accounts for only about 10% of the total provincial population. A minimum basic needs survey conducted in 2001 to assess the poverty profile of the population concluded the following: about 70% of the households were in the low-income bracket, with household income of P5,000 per month and below; 18% were in the medium-income bracket, earning P5,001-P10,000 per month; and 12% were in the high-income bracket, earning P10,001 and above per month.
Masbate City nevertheless is the service and institutional center of the province.
The local economy is largely based on the trading of agriculture, livestock, and fishery products of the province. The city’s commercial establishments serve as the intra-
16
province distributor of tradable products entering Masbate City Port. The Masbate City Airport, which currently has commercial flights to and from Manila via Asian Spirit, serve as another gateway to the province. There are registered 393 service establishments in the city, about 75% of the total registered establishments in the province. The service establishments include 10 banking institutions.
The city has a total land area of 188.0 sq. km. representing 4.44% of the total
land area of Masbate province. Eighty-one percent of the area consists of mountain ranges and rolling hills covered with pasture grasses suitable for ranching and suited for coconut and other upland crops. Nineteen percent is composed of plains and areas with fertile soil suitable for rice, corn, vegetables, root crops, and upland rice production.
Masbate City had a total of 563 hectares of land devoted to rice production in
year 2000. It also had a total of 700 hectares of land planted with corn, which is the second staple food of Masbateños. Corn is consumed by almost 15% of the city’s population. Vegetables planted in small areas in the city—bush sitao (string beans), okra, pechay, upo, squash, and green onions—supply only 30% of the vegetables sold in the market. The remaining 70% comes from mainland Bicol, Manila, and Leyte.
Masbate City’s main products are copra and marine catch. These are traded with
Manila, Lucena, Legazpi, and Cebu. The city’s coconut plantations have the highest productivity in the province, averaging 40 nuts per tree per year. In addition to its own catch, fish and other marine products coming from other towns of Masbate province like Milagros, Cawayan, Dimasalang, Mandaon, Aroroy, Baleno, Balud, and Uson are landed and traded in Masbate City. The city imports products mainly from Manila, Lucena, Cebu, and Legazpi. These are mostly rice, baking inputs, vehicles, appliances, farm inputs, construction materials, and basic commodities. The city trades these products to other municipalities in the whole province.
Municipality of Aroroy
The municipality of Aroroy is in the northernmost part of mainland Masbate. It has 41 barangays. Its population stood at 58,751 as of the 2000 census. It is the second biggest local government unit in the province, after Masbate City. The annual population growth rate was 1.29% from 1995 to 2000. It is a second-class municipality, according to DOF classification, with an income of P63.3 million in 2005. As is typical of most Philippine towns, the IRA comprises 90% of the LGU’s revenues. Aroroy spends P1.7 million annually for debt service.
It has a total land area of 440.4 sq. km. It accounts for 10.9% of the total land
area of Masbate province. Around 35.8% of the municipality’s land area consist of agricultural areas, beach sand, major rivers, and open mines. The rest, 64.2% of the land, are timberlands, which consist of existing and proposed reforestation areas.
Aroroy is blessed with a variety of abundant resources and minerals are one of
them. Gold mining is a flourishing activity until the closure of the Atlas Consolidated Mining and Development Corporation in 1994. Since the closure, many residents and small investors have resorted to small-scale mining. Filminera Resources Corporation recently came in to mine gold but it is yet to start full-scale operation. Other minerals present in Aroroy in varying amounts are rock phosphate, guano, and limestone.
17
The municipality depends largely on agriculture. Around 16.0% of the land area of the municipality are devoted to pasture lands on which various kinds of livestock and poultry depend (the most abundant are cattle, chicken, and swine). Land devoted to agricultural crop production (mostly coconut) covers about 34.3% of the total land area.
While the land is fertile and suitable for crop production, fishing grounds are
equally abundant with marine resources. Aroroy has several investors in fishponds; there is one big firm engaged in the culture of fish and prawns.
Business activities are mostly concentrated on buying and selling of goods.
Manufactured goods are mostly bought from Masbate City, Lucena City, and Pilar, Sorsogon. The seafood and copra produce of the municipality are usually sold in Pilar, Sorsogon, and Manila.
Municipality of Cawayan
The municipality of Cawayan is about 66 kilometers southeast of Masbate City.
Cawayan is bounded on the east by the municipalities of Placer and Palanas, on the west by sea facing the marine-rich Asid Gulf, on the northwest by the municipality of Milagros, and on the north by the municipalities of Dimasalang and Uson. Cawayan is a third-class municipality, according to DOF classification, with revenues of P48.7 million and debt service of P866.8 thousand in 2005.
As of census year 2000, Cawayan had a total population of 52,256 and a
population density of 189 persons per sq. km. It is the second biggest municipality in the province, after Aroroy. As of a 2000 survey, 46.4% of the households were earning only P30,000 or less in a year. The municipality has a total land area of 260.2 sq. km. and is politically subdivided into 38 barangays. Cawayan is basically a coastal municipality. Nine barangays are along the seashore, two are inland water barangays and eight are island barangays. Barangay Divisoria is the commercial center of the municipality. This barangay hosts the fish port.
Fishing is the major occupation of the people of Cawayan. The municipality’s
fishing grounds include Cawayan Bay and a great part of Asid Gulf and the Visayan Sea. There are ice and storage facilities in the municipality for fresh fish catch. Some of the fish catch are also dried, salted, packed, and exported to Cebu, Panay Island, Bicol, Manila, and some areas in Mindanao.
About 7,895 hectares or 26.1% of the total land area of the municipality are
devoted to agricultural crop production. It is planted with corn, coconuts, fruits, root crops, and other diversified crops. Corn is the staple food crop, occupying 41% of the land devoted to agriculture. It is estimated that 90% of the local residents are corn eaters. Rice farms cover about 8% of the agricultural land. Coconut production accounts for over 20% of the land devoted to agriculture. It gives an annual yield of 489 metric tons of copra. The people also engage in livestock breeding. Cattle are raised along with other livestock animals on a minor scale and slaughtered for local consumption.
B.3 Cebu Province
Cebu province consists of the main Cebu Island and smaller groups of islands.
The province lies 584 km. south of Manila. The main island of Cebu is long and narrow
18
and has a total land area of about 4,400 sq. km. The smaller group of islands, namely, Mactan, Bantayan and Camotes Islands, has a total land area of 436 sq. km.
Cebu is classified as a first-class province by the DOF. As of census year 2000,
the province has a population of 3,356,137 and a population density of 693.9 persons per sq. km. Population grew at an average of 2.87% per year during the 1995-2000 period. The province is composed of six cities (Cebu, Danao, Lapu-lapu, Mandaue, Toledo and Talisay) and 47 municipalities. Cebu City, the oldest Philippine city, is the second international gateway in the country, next to Manila. Metro Cebu, an informal geo-political grouping of contiguous cities and municipalities, consists of the four cities of Cebu, Mandaue, Lapu-lapu and Talisay and the six municipalities of Cordova, Consolacion, Liloan, Compostela, Minglanilla, and Naga.
Cebu’s economic advantage can be summarized as follows. As the capital of
Cebu province, Cebu City is the hub of economic activity and the center for trade and commerce. Most of the domestic shipping companies in the Philippines have their central offices in Cebu City. The Port of Cebu handles more ships carrying more domestic cargo and passengers than the domestic port in Manila. The improvement of air transportation facilities at Mactan International Airport triggered the development of the Mactan Export Processing Zone in Lapu-lapu City. Cebu City’s neighbor, Mandaue City, has become the manufacturing center of Cebu province. A good number of firms put up their factories in Mandaue to take advantage of incentives and low tax rates. Mandaue is also home to small and medium enterprises which serve as either exporters or subcontractors to the firms located in the Mactan Export Processing Zone.
The Port of Cebu is the second major port in the Philippines, next to Manila. It
consists of a base port at Cebu City and four sub-ports: Toledo in the west of Cebu, Argao in the south, Danao-Carmen in the north, and Sta. Fe at Bantayan Island. Aside from these ports, there are 37 other smaller national and municipal ports throughout the province that are under the jurisdiction of the Cebu Ports Authority (CPA).
The Cebu City base port consists of a 20,000-sq.m. cargo back-up area with
three kilometers of berth for coastwise shipping. The Cebu International Port (CIP) forms part of this base port. CIP covers ten hectares and has almost 700 meters of berthing space. About half of CIP’s terminal is reserved for foreign ships and the rest service large cargo and passenger vessels plying domestic routes. It is equipped with modern cargo handling facilities and standby power supply. It has 2,418 ground slots for containers which translate to 1 million TEUs of annual throughput capacity.
There is an international airport located in Lapu-Lapu City, Cebu. The Mactan
Cebu International Airport serves as hub of air travel in southern Philippines. It is located approximately 600 kilometers south of the Ninoy Aquino International Airport. It is managed by the Mactan Cebu International Airport Authority (MCIAA).
Municipality of Daan Bantayan
The municipality of Daan Bantayan lies about 128 km. from Cebu City, and is
located at the northernmost tip of the island. It is bounded on the north and the west by the Visayan Sea, on the south by the municipality of Medellin, and on the east by the Camotes Sea. As of the 2000 census, its population stood at 69,336. It has a population density of 754 persons per sq. km. It is a third-class municipality which is politically
19
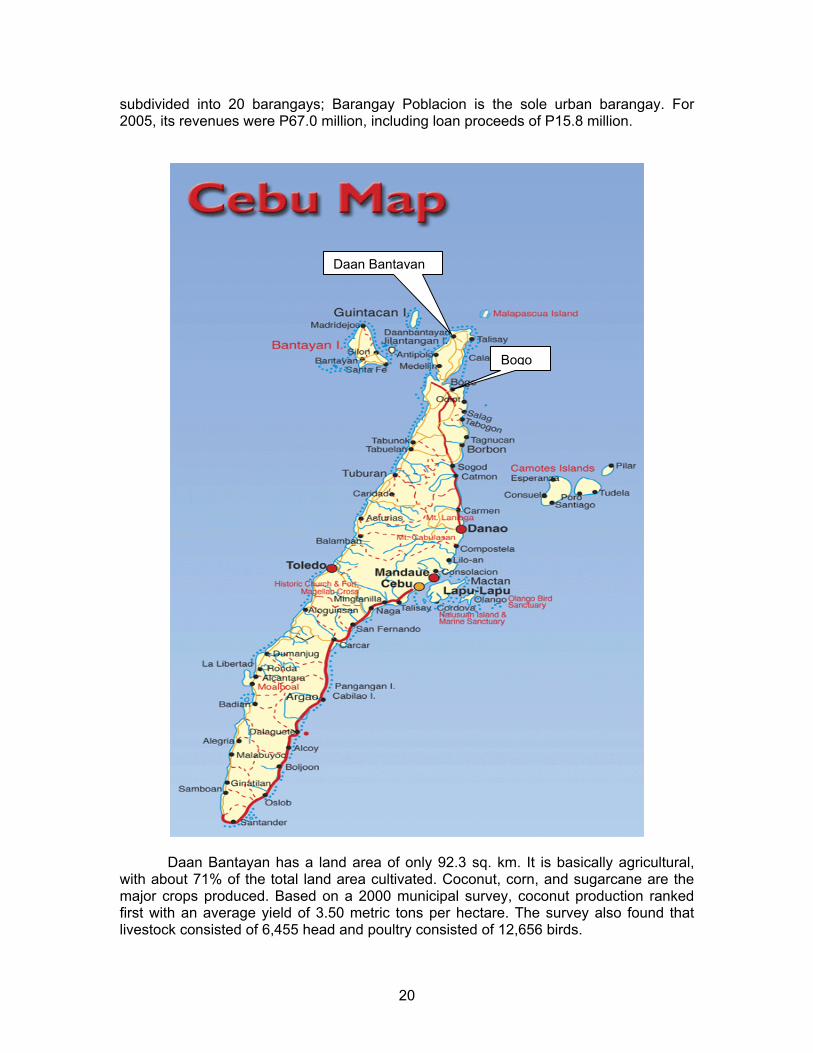
subdivided into 20 barangays; Barangay Poblacion is the sole urban barangay. For 2005, its revenues were P67.0 million, including loan proceeds of P15.8 million.
Daan Bantayan
Bogo
Daan Bantayan has a land area of only 92.3 sq. km. It is basically agricultural,
with about 71% of the total land area cultivated. Coconut, corn, and sugarcane are the major crops produced. Based on a 2000 municipal survey, coconut production ranked first with an average yield of 3.50 metric tons per hectare. The survey also found that livestock consisted of 6,455 head and poultry consisted of 12,656 birds.
20
Daan Bantayan is endowed with rich fishing resources. It has both offshore and inland (fishpond) sites which are sources of income for a number of residents. Fishponds occupy an aggregate area of 37.8 hectares. There are three fish landing sites, located in barangays Poblacion, Tapilon, and Maya. Fish catch in 2000 was 1.9 million metric tons.
As is typical of rural municipalities in the province, Daan Bantayan’s dominant
commercial establishments are sari-sari stores, which comprise 90% of the total number of establishments in the municipality in 2001. There are three banking institutions—two rural banks and one cooperative bank—in the municipality. The industrial establishments are limited to cottage and small-scale industries such as furniture, ceramics, hollow blocks, and rope. The available post-harvest facilities include four rice and corn mills, two ice plants, and two fish ports. There are also a number of beach resorts in the municipality. The most famous tourist destination in the municipality is Malapascua Island where there are 20 beach resort and diving resort operators.
IV. THE PROJECT PROFILE A. Market Aspects – Supply and Demand Analysis
The analysis of the market aspects as well as the ensuing financial analysis was
conducted only for the routes pre-identified by DBP—the Pilar-Aroroy route in the southern Sorsogon-northern Masbate connection and the Cawayan-Daan Bantayan route in the southern Masbate-northern Cebu connection.
A.1 Existing Supply Situation
In all four terminal sites, there are no RoRo services yet and therefore there is no observed vehicle traffic. The existing passenger traffic is primarily served by wooden-hulled pumboats or motor bancas. The connecting roads are all national roads but are of various surface types and conditions; the Cebu road links are generally in better shape than the Masbate province road links.
Metro Manila-Pilar Road Connection
The road connection between Metro Manila and Pilar, Sorsogon is via the
Maharlika Highway (also called the Pan-Philippine Highway). The approximate distance is 560 kilometers and travel time is about 11 hours. The road is paved with concrete and in generally good condition. However, travel time is less than optimal, according to logistics managers who are members of the Distribution Management Association of the Philippines (DMAP). The Maharlika Highway passes through congested town centers, causing road travel to be longer than necessary. There are also hardly any by-pass roads along the way.
Pilar-Aroroy Link
1. Existing Sea Connection
During its May 2006 field visit to Aroroy, the RRTS study team learned that the
motor banca service for the Pilar-Aroroy connection is only once a day; travel time is approximately 2 ½ hours. Pilar is just one of the many destinations of bancas that depart
21
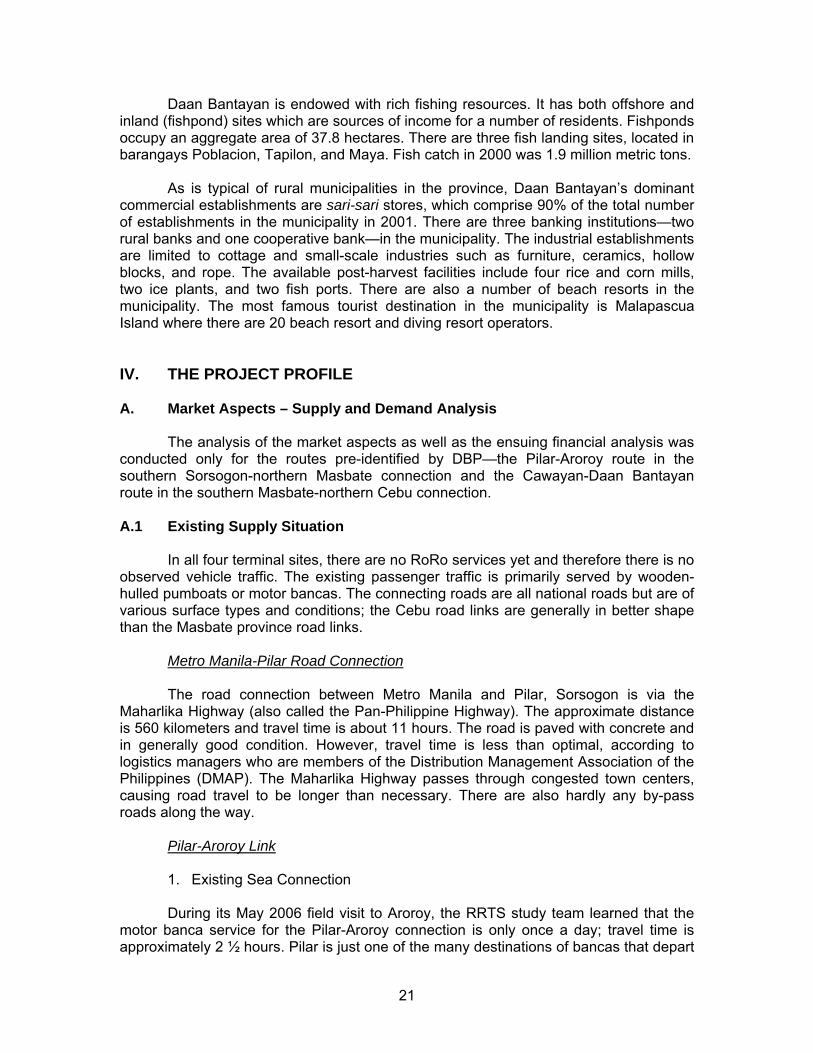
from Aroroy Port. Other destinations include Tigbao, Lanang, Matalangtalang, Don Pablo, Bugui, Gumahang, Sawang, Calanay, Don Pablo, San Agustin, Burias, Mataba, Colorado, Sawang, and Balawing. Similarly, boats leaving Pilar have many destinations in Masbate province other than Aroroy. In particular, fastboats and smaller pumpboats carrying passengers regularly ply the Pilar-Masbate City route.
Pilar-Aroroy RoRo link = 23 nautical miles;
Aroroy-Cawayan road link = 105.6 km
Cawayan-Daan Bantayan RoRo link = 44 nautical miles;
Daan Bantayan-Cebu City road link = 132.4 km
22
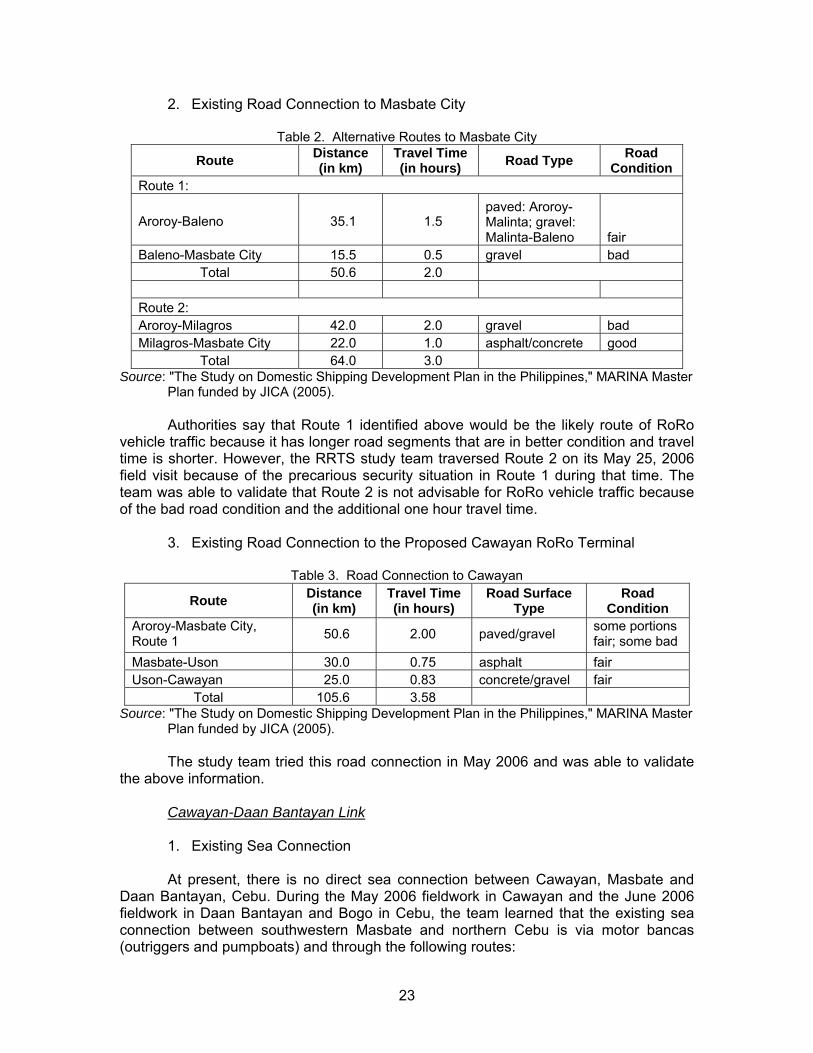
2. Existing Road Connection to Masbate City
Table 2. Alternative Routes to Masbate City
Route Distance (in km)
Travel Time (in hours) Road Type Road
Condition Route 1:
Aroroy-Baleno 35.1 1.5 paved: Aroroy-Malinta; gravel: Malinta-Baleno fair
Baleno-Masbate City 15.5 0.5 gravel bad Total 50.6 2.0
Route 2: Aroroy-Milagros 42.0 2.0 gravel bad Milagros-Masbate City 22.0 1.0 asphalt/concrete good
Total 64.0 3.0 Source: "The Study on Domestic Shipping Development Plan in the Philippines," MARINA Master
Plan funded by JICA (2005). Authorities say that Route 1 identified above would be the likely route of RoRo
vehicle traffic because it has longer road segments that are in better condition and travel time is shorter. However, the RRTS study team traversed Route 2 on its May 25, 2006 field visit because of the precarious security situation in Route 1 during that time. The team was able to validate that Route 2 is not advisable for RoRo vehicle traffic because of the bad road condition and the additional one hour travel time.
3. Existing Road Connection to the Proposed Cawayan RoRo Terminal
Table 3. Road Connection to Cawayan
Route Distance (in km)
Travel Time (in hours)
Road Surface Type
Road Condition
Aroroy-Masbate City, Route 1 50.6 2.00 paved/gravel some portions
fair; some bad Masbate-Uson 30.0 0.75 asphalt fair Uson-Cawayan 25.0 0.83 concrete/gravel fair
Total 105.6 3.58 Source: "The Study on Domestic Shipping Development Plan in the Philippines," MARINA Master
Plan funded by JICA (2005). The study team tried this road connection in May 2006 and was able to validate
the above information. Cawayan-Daan Bantayan Link 1. Existing Sea Connection At present, there is no direct sea connection between Cawayan, Masbate and
Daan Bantayan, Cebu. During the May 2006 fieldwork in Cawayan and the June 2006 fieldwork in Daan Bantayan and Bogo in Cebu, the team learned that the existing sea connection between southwestern Masbate and northern Cebu is via motor bancas (outriggers and pumpboats) and through the following routes:
23
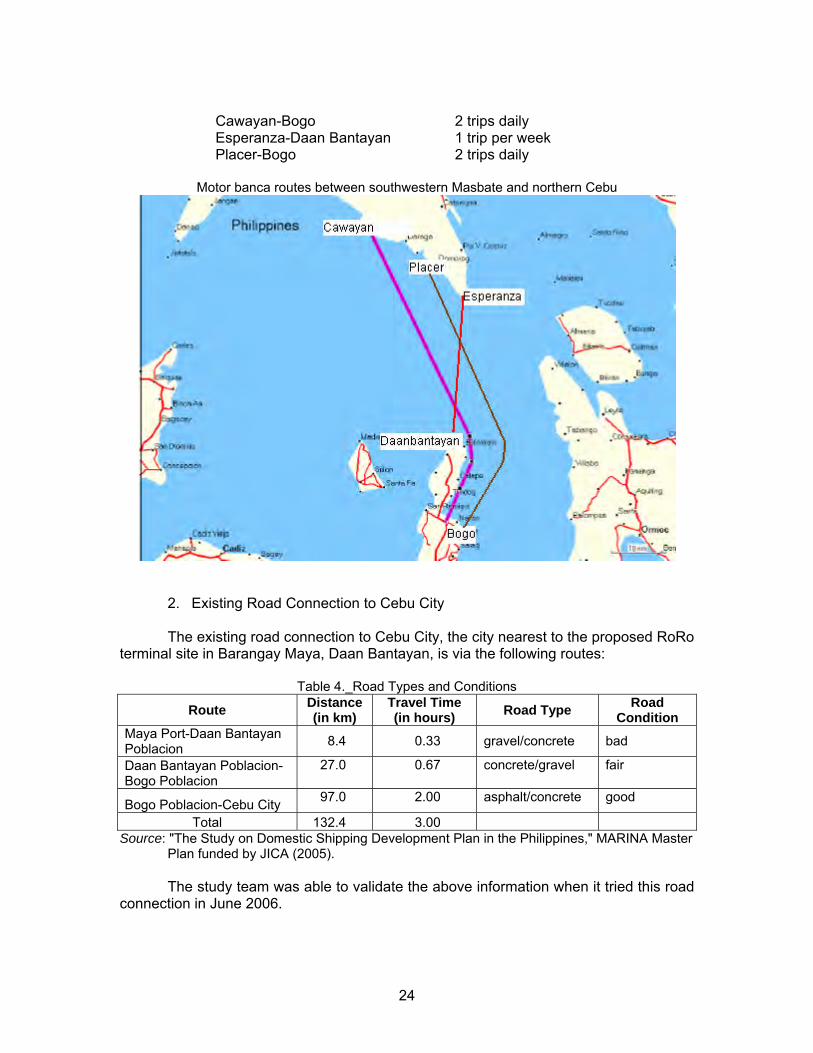
Cawayan-Bogo 2 trips daily Esperanza-Daan Bantayan 1 trip per week Placer-Bogo 2 trips daily
Motor banca routes between southwestern Masbate and northern Cebu
2. Existing Road Connection to Cebu City
The existing road connection to Cebu City, the city nearest to the proposed RoRo terminal site in Barangay Maya, Daan Bantayan, is via the following routes:
Table 4._Road Types and Conditions
Route Distance (in km)
Travel Time (in hours) Road Type Road
Condition Maya Port-Daan Bantayan Poblacion 8.4 0.33 gravel/concrete bad
Daan Bantayan Poblacion-Bogo Poblacion
27.0 0.67 concrete/gravel fair
Bogo Poblacion-Cebu City 97.0 2.00 asphalt/concrete good
Total 132.4 3.00 Source: "The Study on Domestic Shipping Development Plan in the Philippines," MARINA Master
Plan funded by JICA (2005). The study team was able to validate the above information when it tried this road
connection in June 2006.
24
A.2 Demand Estimation Methodology
The demand estimates for the sites consider two components: (a) the potential demand for RoRo services based on the diversion of part of the present and projected future passenger and cargo flows (expected “normal” traffic) between destinations, and (b) the induced demand (“generated” traffic) once the RoRo service becomes available. The potential or latent (diverted) demand for RoRo services is estimated as some percentage of the existing traffic carried by motor bancas or pumboats plying the Pilar-Aroroy and Cawayan-Daan Bantayan routes plus the diverted demand from the more developed routes. Generated traffic, on the other hand, is considered as arising from induced travel unleashed by the availability of the road-RoRo terminal system in the area; it is an all-encompassing estimate of newly generated trips due to factors like higher local economic activity, changes in transportation mode preference, greater willingness for longer road travel, and intensified tourism activities.
Because of time and resource constraints, this study does not conduct its own
survey to establish the baseline traffic. It relies instead on the data gathered through on-site interviews during the brief field visits and official data from government agencies, supplemented by secondary data from the 2005 JICA/MARINA survey for the RRTS chapter of the “Domestic Shipping Development Plan in the Philippines,” a master plan for the domestic shipping sector. Where this study differs from the JICA/MARINA study is in the RRTS operating framework and demand projection methodology. As mentioned earlier in section II, the true RRTS concept bases passage rates for vehicles on the occupancy of lane meters onboard and eliminates the need for cargo handling. The estimates of cargo traffic and part of passenger traffic are therefore converted into lane meter equivalents.
Among other assumptions underlying the demand projections is an initial vessel load factor of 65% (based on the 1992 JICA "Nationwide RORO Ferry Network Development Study"), increasing gradually over time to 70% for passengers and 80% for vehicles. Another assumption is that all vessels considered in the analysis (motor banca, fastcraft, and RORO vessel) operate for 330 days a year. To simplify the calculation, two-way traffic projections are estimated; there is no distinction between inbound and outbound traffic. A.3 Pilar-Aroroy Route
Passenger Traffic
1. Potential Diverted Traffic
During the May 2006 fieldwork in Aroroy, it was established that the average daily traffic the Pilar-Aroroy route is 42 passengers. From this average, the existing annual traffic in the Pilar-Aroroy route is estimated as:
42 banca passengers * 330 days = 13,860 banca passengers per year. It is assumed that about half of the existing traffic served by bancas would
transfer to RoRo if the RoRo tariff is set close to the existing banca tariff, which is P5.56 per person per nautical mile as of 2006, and if passengers perceive RoRo travel as safer
25
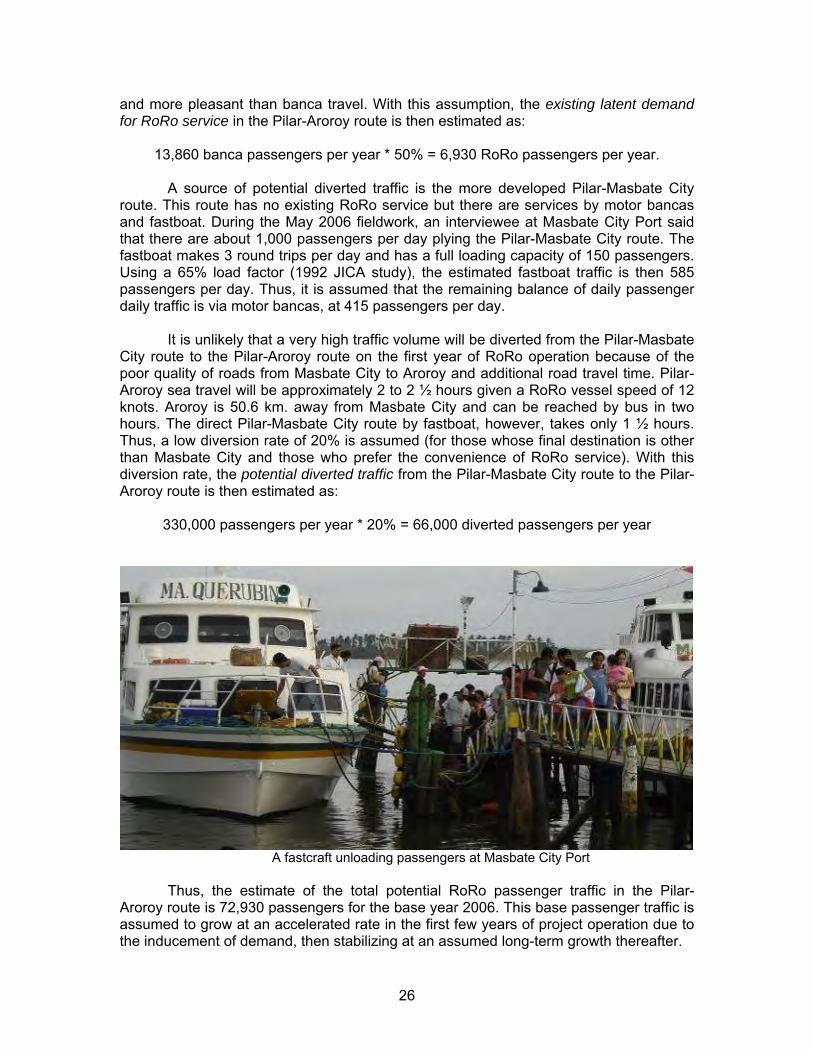
and more pleasant than banca travel. With this assumption, the existing latent demand for RoRo service in the Pilar-Aroroy route is then estimated as:
13,860 banca passengers per year * 50% = 6,930 RoRo passengers per year.
A source of potential diverted traffic is the more developed Pilar-Masbate City
route. This route has no existing RoRo service but there are services by motor bancas and fastboat. During the May 2006 fieldwork, an interviewee at Masbate City Port said that there are about 1,000 passengers per day plying the Pilar-Masbate City route. The fastboat makes 3 round trips per day and has a full loading capacity of 150 passengers. Using a 65% load factor (1992 JICA study), the estimated fastboat traffic is then 585 passengers per day. Thus, it is assumed that the remaining balance of daily passenger daily traffic is via motor bancas, at 415 passengers per day.
It is unlikely that a very high traffic volume will be diverted from the Pilar-Masbate
City route to the Pilar-Aroroy route on the first year of RoRo operation because of the poor quality of roads from Masbate City to Aroroy and additional road travel time. Pilar-Aroroy sea travel will be approximately 2 to 2 ½ hours given a RoRo vessel speed of 12 knots. Aroroy is 50.6 km. away from Masbate City and can be reached by bus in two hours. The direct Pilar-Masbate City route by fastboat, however, takes only 1 ½ hours. Thus, a low diversion rate of 20% is assumed (for those whose final destination is other than Masbate City and those who prefer the convenience of RoRo service). With this diversion rate, the potential diverted traffic from the Pilar-Masbate City route to the Pilar-Aroroy route is then estimated as:
330,000 passengers per year * 20% = 66,000 diverted passengers per year
A fastcraft unloading passengers at Masbate City Port
Thus, the estimate of the total potential RoRo passenger traffic in the Pilar-
Aroroy route is 72,930 passengers for the base year 2006. This base passenger traffic is assumed to grow at an accelerated rate in the first few years of project operation due to the inducement of demand, then stabilizing at an assumed long-term growth thereafter.
26
2. Generated Traffic
It has been mentioned earlier that induced demand for RoRo service is assumed
to account for newly generated trips due to factors like higher local economic activity, changes in transportation mode preference, greater willingness for longer road travel, and more active tourism. This study draws from the Roxas-Caticlan experience to get an indication of the possible magnitude of this induced demand.
Before RoRo service was introduced in the Roxas-Caticlan route in June 2003,
the only service available was via motor bancas (called batel in the local language). Since then, both vehicle traffic and passenger traffic have been continuously growing and the following inducement of demand was observed: slow growth on the first year of RoRo operation, very high growth on the second year, and a slowing down of growth on the third year (displaying a logistic pattern commonly observed in studies on rates of adoption of new technologies). Passenger traffic grew by 89% on the second year of RoRo operation, and by 65% on the third year.
For the Pilar-Aroroy route, it is assumed that the same logistic pattern would be
experienced. A very conservative inducement of demand, however, is assumed—only half of what was observed in the Roxas-Caticlan link, or 44.5% traffic growth on the second year and 32.5% traffic growth on the third year.
Induced demand in the Roxas-Caticlan link is high probably because of several
factors: (a) the link is closer to Metro Manila which is the origin of most flow-through traffic; (b) the Batangas-Calapan cargo trading via RoRo had been in existence for many decades and the Roxas-Caticlan link may have provided a venue for the pent-up demand in cargo trading; and (c) the Boracay factor—Boracay Island was already a very famous tourist attraction even before the Roxas-Caticlan link opened and provided a more affordable alternative for tourists wanting to go to Boracay. The Pilar-Aroroy link, however, together with the Cawayan-Daan Bantayan link, has its own tourist attractions, among which are Mayon Volcano in Legazpi City (an hour’s drive from Pilar), butanding interaction in Donsol (just a few minutes from Pilar), and the beach and dive resorts of Malapascua Island (some 30 minutes’ boat ride from Daan Bantayan).
3. Passenger Traffic Forecast
Table 5 shows the annual RoRo passenger traffic forecast with the project in place. The projection uses 2006 as base year for forecasting, 2008 as start of project operation, and a 20-year forecast period that coincides with the RoRo vessel operation and loan repayment period. The assumed long-term passenger traffic growth is 5.53% per year. This growth rate is based on Region V annual population growth of 1.92% as projected by the National Statistics Office (NSO), an elasticity of transport demand with respect to real Gross Regional Domestic Product (GRDP) per capita of 1.2, and 2004-2005 Region V real GRDP per capita growth of 2.95%. 5
5 Calculation of the long-term passenger traffic growth rate:
∆T/T = (1+∆P/P)*(1+ε∆Y/Y) -1 = [1+1.92%]*[1+(1.2*2.95%)] = 5.53% where T = traffic, P = population, ε = elasticity of transport demand with respect to GRDP per capita, and Y = GRDP per capita
27
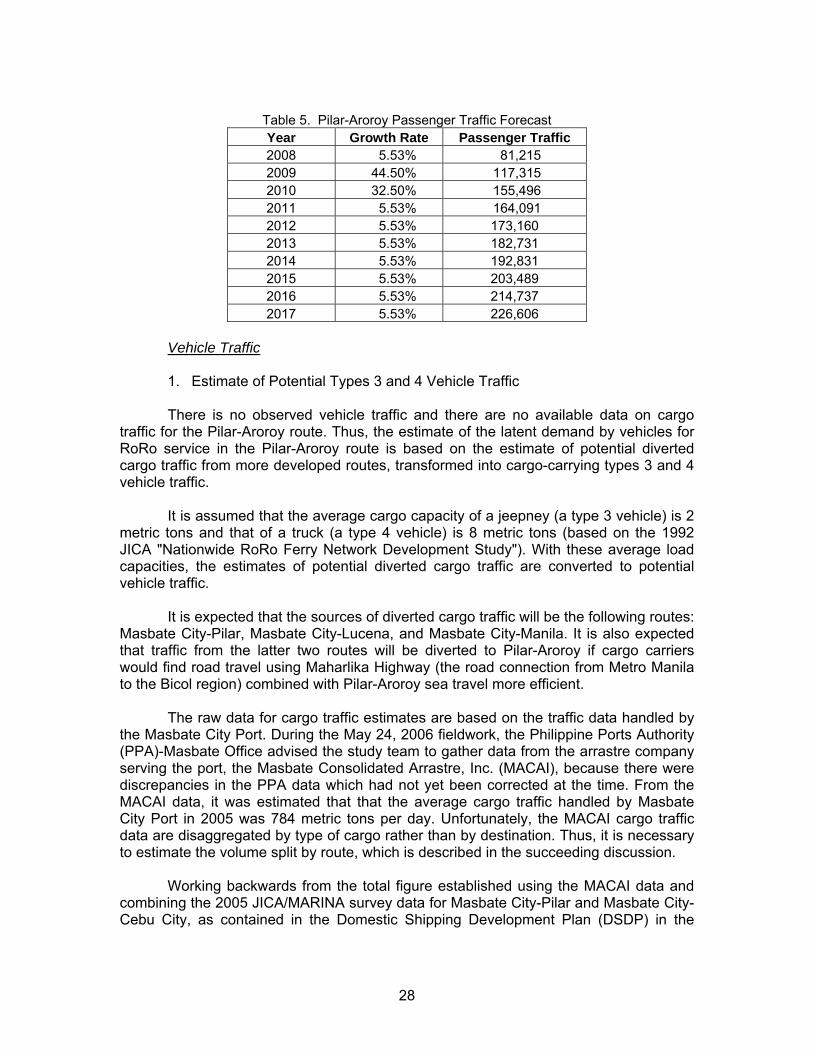
Table 5. Pilar-Aroroy Passenger Traffic Forecast Year Growth Rate Passenger Traffic 2008 5.53% 81,215 2009 44.50% 117,315 2010 32.50% 155,496 2011 5.53% 164,091 2012 5.53% 173,160 2013 5.53% 182,731 2014 5.53% 192,831 2015 5.53% 203,489 2016 5.53% 214,737 2017 5.53% 226,606
Vehicle Traffic
1. Estimate of Potential Types 3 and 4 Vehicle Traffic
There is no observed vehicle traffic and there are no available data on cargo
traffic for the Pilar-Aroroy route. Thus, the estimate of the latent demand by vehicles for RoRo service in the Pilar-Aroroy route is based on the estimate of potential diverted cargo traffic from more developed routes, transformed into cargo-carrying types 3 and 4 vehicle traffic.
It is assumed that the average cargo capacity of a jeepney (a type 3 vehicle) is 2
metric tons and that of a truck (a type 4 vehicle) is 8 metric tons (based on the 1992 JICA "Nationwide RoRo Ferry Network Development Study"). With these average load capacities, the estimates of potential diverted cargo traffic are converted to potential vehicle traffic.
It is expected that the sources of diverted cargo traffic will be the following routes:
Masbate City-Pilar, Masbate City-Lucena, and Masbate City-Manila. It is also expected that traffic from the latter two routes will be diverted to Pilar-Aroroy if cargo carriers would find road travel using Maharlika Highway (the road connection from Metro Manila to the Bicol region) combined with Pilar-Aroroy sea travel more efficient.
The raw data for cargo traffic estimates are based on the traffic data handled by
the Masbate City Port. During the May 24, 2006 fieldwork, the Philippine Ports Authority (PPA)-Masbate Office advised the study team to gather data from the arrastre company serving the port, the Masbate Consolidated Arrastre, Inc. (MACAI), because there were discrepancies in the PPA data which had not yet been corrected at the time. From the MACAI data, it was estimated that that the average cargo traffic handled by Masbate City Port in 2005 was 784 metric tons per day. Unfortunately, the MACAI cargo traffic data are disaggregated by type of cargo rather than by destination. Thus, it is necessary to estimate the volume split by route, which is described in the succeeding discussion.
Working backwards from the total figure established using the MACAI data and combining the 2005 JICA/MARINA survey data for Masbate City-Pilar and Masbate City-Cebu City, as contained in the Domestic Shipping Development Plan (DSDP) in the
28
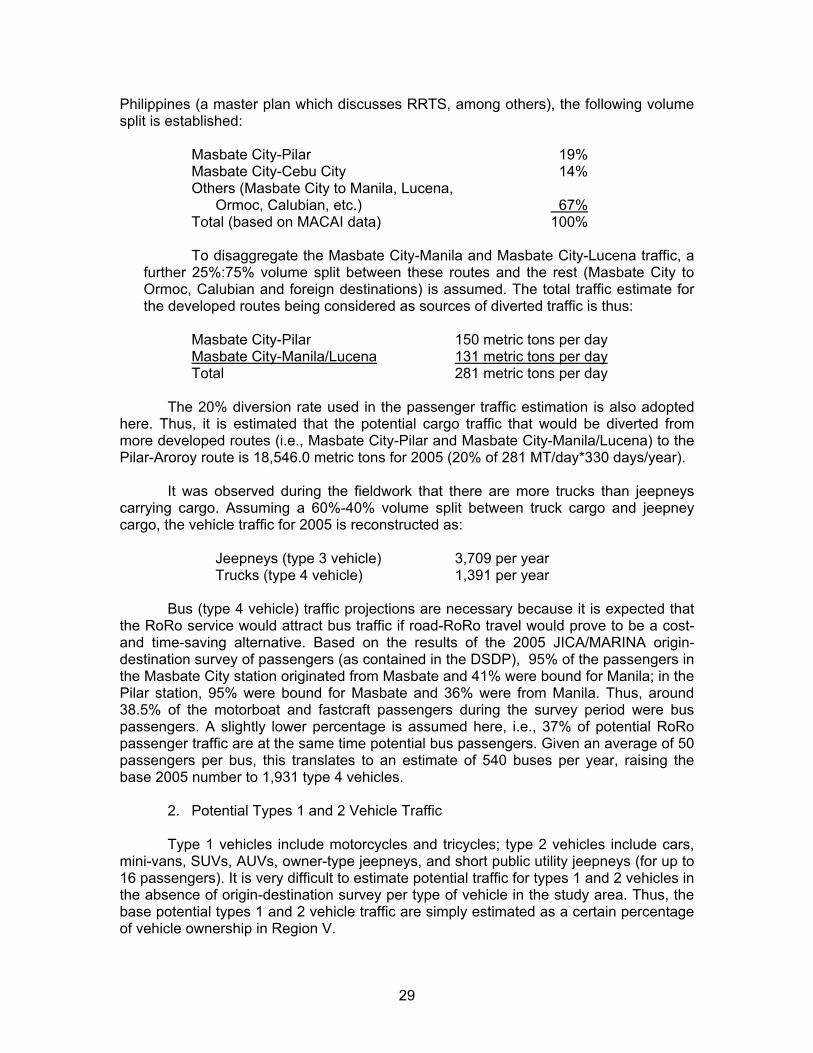
Philippines (a master plan which discusses RRTS, among others), the following volume split is established:
Masbate City-Pilar 19% Masbate City-Cebu City 14% Others (Masbate City to Manila, Lucena,
Ormoc, Calubian, etc.) 67% Total (based on MACAI data) 100%
To disaggregate the Masbate City-Manila and Masbate City-Lucena traffic, a
further 25%:75% volume split between these routes and the rest (Masbate City to Ormoc, Calubian and foreign destinations) is assumed. The total traffic estimate for the developed routes being considered as sources of diverted traffic is thus:
Masbate City-Pilar 150 metric tons per day Masbate City-Manila/Lucena 131 metric tons per day Total 281 metric tons per day
The 20% diversion rate used in the passenger traffic estimation is also adopted
here. Thus, it is estimated that the potential cargo traffic that would be diverted from more developed routes (i.e., Masbate City-Pilar and Masbate City-Manila/Lucena) to the Pilar-Aroroy route is 18,546.0 metric tons for 2005 (20% of 281 MT/day*330 days/year).
It was observed during the fieldwork that there are more trucks than jeepneys carrying cargo. Assuming a 60%-40% volume split between truck cargo and jeepney cargo, the vehicle traffic for 2005 is reconstructed as:
Jeepneys (type 3 vehicle) 3,709 per year Trucks (type 4 vehicle) 1,391 per year
Bus (type 4 vehicle) traffic projections are necessary because it is expected that
the RoRo service would attract bus traffic if road-RoRo travel would prove to be a cost- and time-saving alternative. Based on the results of the 2005 JICA/MARINA origin-destination survey of passengers (as contained in the DSDP), 95% of the passengers in the Masbate City station originated from Masbate and 41% were bound for Manila; in the Pilar station, 95% were bound for Masbate and 36% were from Manila. Thus, around 38.5% of the motorboat and fastcraft passengers during the survey period were bus passengers. A slightly lower percentage is assumed here, i.e., 37% of potential RoRo passenger traffic are at the same time potential bus passengers. Given an average of 50 passengers per bus, this translates to an estimate of 540 buses per year, raising the base 2005 number to 1,931 type 4 vehicles.
2. Potential Types 1 and 2 Vehicle Traffic
Type 1 vehicles include motorcycles and tricycles; type 2 vehicles include cars, mini-vans, SUVs, AUVs, owner-type jeepneys, and short public utility jeepneys (for up to 16 passengers). It is very difficult to estimate potential traffic for types 1 and 2 vehicles in the absence of origin-destination survey per type of vehicle in the study area. Thus, the base potential types 1 and 2 vehicle traffic are simply estimated as a certain percentage of vehicle ownership in Region V.
29
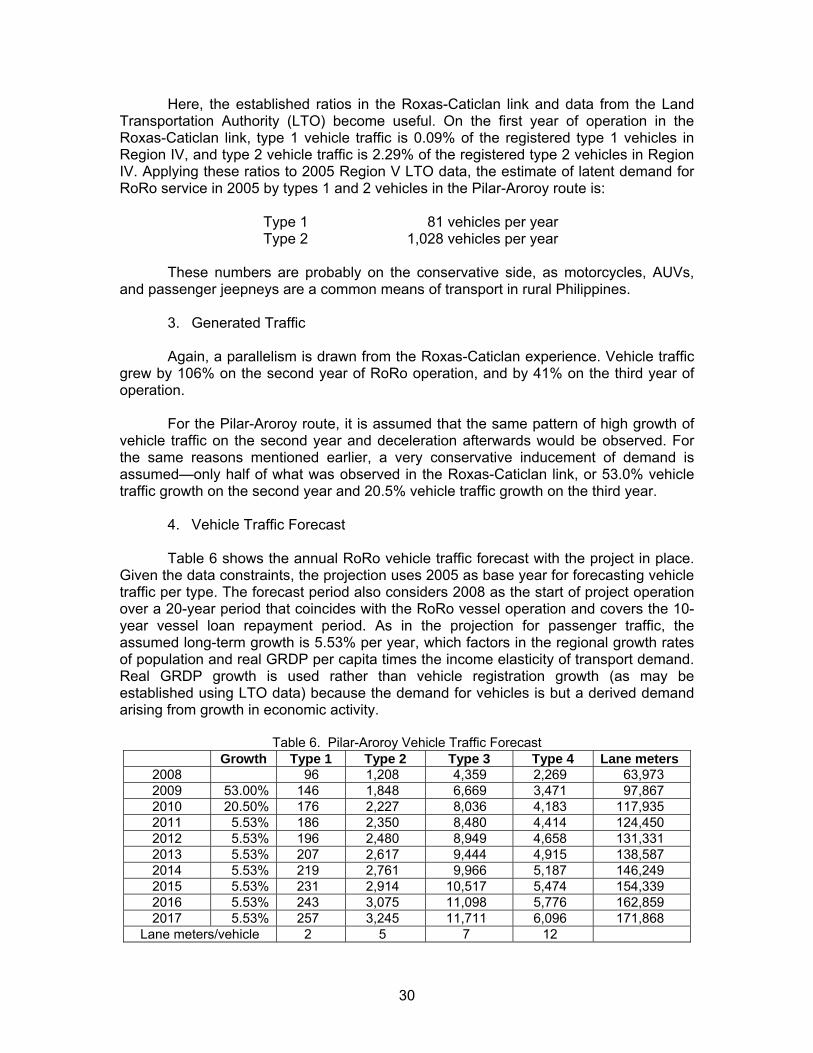
Here, the established ratios in the Roxas-Caticlan link and data from the Land Transportation Authority (LTO) become useful. On the first year of operation in the Roxas-Caticlan link, type 1 vehicle traffic is 0.09% of the registered type 1 vehicles in Region IV, and type 2 vehicle traffic is 2.29% of the registered type 2 vehicles in Region IV. Applying these ratios to 2005 Region V LTO data, the estimate of latent demand for RoRo service in 2005 by types 1 and 2 vehicles in the Pilar-Aroroy route is:
Type 1 81 vehicles per year Type 2 1,028 vehicles per year
These numbers are probably on the conservative side, as motorcycles, AUVs,
and passenger jeepneys are a common means of transport in rural Philippines.
3. Generated Traffic
Again, a parallelism is drawn from the Roxas-Caticlan experience. Vehicle traffic grew by 106% on the second year of RoRo operation, and by 41% on the third year of operation.
For the Pilar-Aroroy route, it is assumed that the same pattern of high growth of
vehicle traffic on the second year and deceleration afterwards would be observed. For the same reasons mentioned earlier, a very conservative inducement of demand is assumed—only half of what was observed in the Roxas-Caticlan link, or 53.0% vehicle traffic growth on the second year and 20.5% vehicle traffic growth on the third year.
4. Vehicle Traffic Forecast
Table 6 shows the annual RoRo vehicle traffic forecast with the project in place. Given the data constraints, the projection uses 2005 as base year for forecasting vehicle traffic per type. The forecast period also considers 2008 as the start of project operation over a 20-year period that coincides with the RoRo vessel operation and covers the 10-year vessel loan repayment period. As in the projection for passenger traffic, the assumed long-term growth is 5.53% per year, which factors in the regional growth rates of population and real GRDP per capita times the income elasticity of transport demand. Real GRDP growth is used rather than vehicle registration growth (as may be established using LTO data) because the demand for vehicles is but a derived demand arising from growth in economic activity.
Table 6. Pilar-Aroroy Vehicle Traffic Forecast Growth Type 1 Type 2 Type 3 Type 4 Lane meters
2008 96 1,208 4,359 2,269 63,973 2009 53.00% 146 1,848 6,669 3,471 97,867 2010 20.50% 176 2,227 8,036 4,183 117,935 2011 5.53% 186 2,350 8,480 4,414 124,450 2012 5.53% 196 2,480 8,949 4,658 131,331 2013 5.53% 207 2,617 9,444 4,915 138,587 2014 5.53% 219 2,761 9,966 5,187 146,249 2015 5.53% 231 2,914 10,517 5,474 154,339 2016 5.53% 243 3,075 11,098 5,776 162,859 2017 5.53% 257 3,245 11,711 6,096 171,868
Lane meters/vehicle 2 5 7 12
30
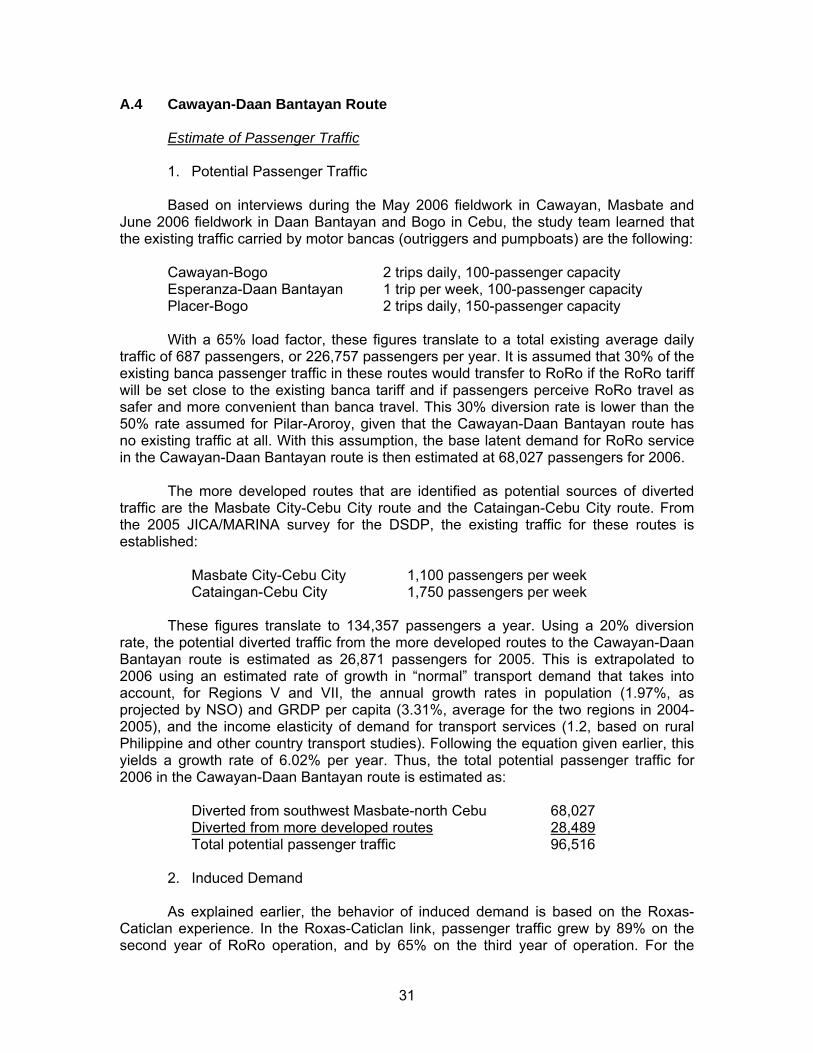
A.4 Cawayan-Daan Bantayan Route
Estimate of Passenger Traffic
1. Potential Passenger Traffic
Based on interviews during the May 2006 fieldwork in Cawayan, Masbate and June 2006 fieldwork in Daan Bantayan and Bogo in Cebu, the study team learned that the existing traffic carried by motor bancas (outriggers and pumpboats) are the following:
Cawayan-Bogo 2 trips daily, 100-passenger capacity Esperanza-Daan Bantayan 1 trip per week, 100-passenger capacity Placer-Bogo 2 trips daily, 150-passenger capacity
With a 65% load factor, these figures translate to a total existing average daily
traffic of 687 passengers, or 226,757 passengers per year. It is assumed that 30% of the existing banca passenger traffic in these routes would transfer to RoRo if the RoRo tariff will be set close to the existing banca tariff and if passengers perceive RoRo travel as safer and more convenient than banca travel. This 30% diversion rate is lower than the 50% rate assumed for Pilar-Aroroy, given that the Cawayan-Daan Bantayan route has no existing traffic at all. With this assumption, the base latent demand for RoRo service in the Cawayan-Daan Bantayan route is then estimated at 68,027 passengers for 2006.
The more developed routes that are identified as potential sources of diverted traffic are the Masbate City-Cebu City route and the Cataingan-Cebu City route. From the 2005 JICA/MARINA survey for the DSDP, the existing traffic for these routes is established:
Masbate City-Cebu City 1,100 passengers per week Cataingan-Cebu City 1,750 passengers per week
These figures translate to 134,357 passengers a year. Using a 20% diversion
rate, the potential diverted traffic from the more developed routes to the Cawayan-Daan Bantayan route is estimated as 26,871 passengers for 2005. This is extrapolated to 2006 using an estimated rate of growth in “normal” transport demand that takes into account, for Regions V and VII, the annual growth rates in population (1.97%, as projected by NSO) and GRDP per capita (3.31%, average for the two regions in 2004-2005), and the income elasticity of demand for transport services (1.2, based on rural Philippine and other country transport studies). Following the equation given earlier, this yields a growth rate of 6.02% per year. Thus, the total potential passenger traffic for 2006 in the Cawayan-Daan Bantayan route is estimated as:
Diverted from southwest Masbate-north Cebu 68,027 Diverted from more developed routes 28,489 Total potential passenger traffic 96,516
2. Induced Demand
As explained earlier, the behavior of induced demand is based on the Roxas-
Caticlan experience. In the Roxas-Caticlan link, passenger traffic grew by 89% on the second year of RoRo operation, and by 65% on the third year of operation. For the
31
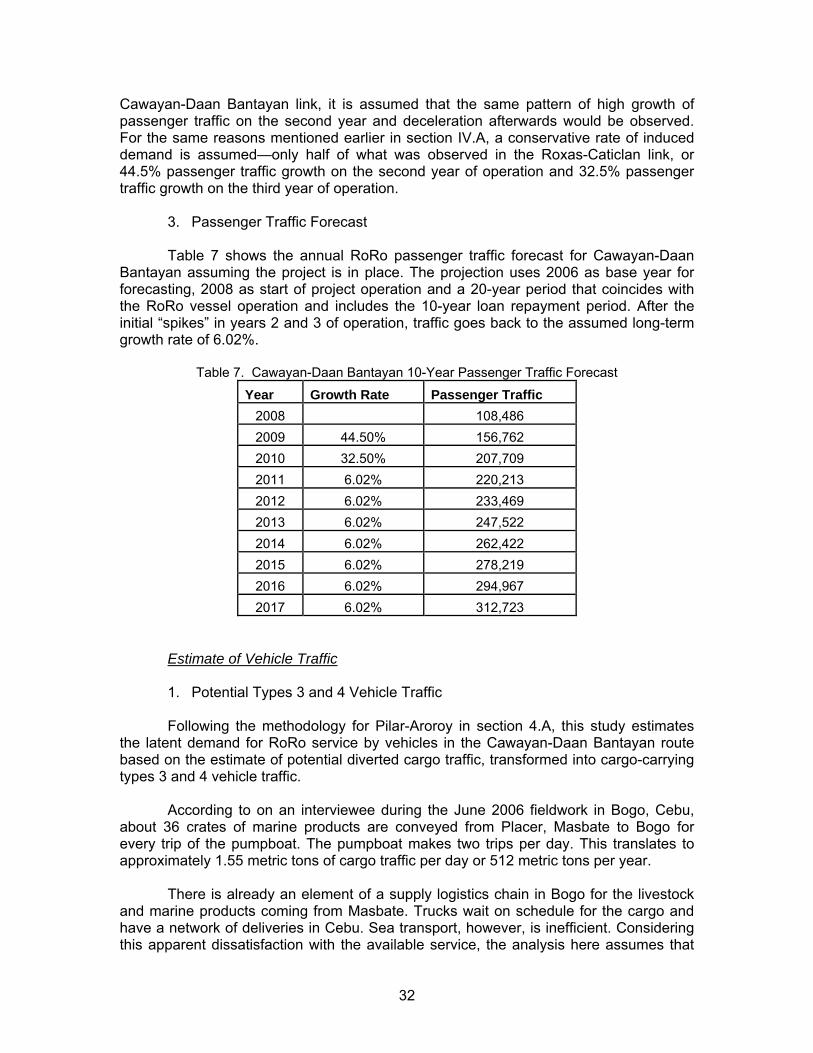
Cawayan-Daan Bantayan link, it is assumed that the same pattern of high growth of passenger traffic on the second year and deceleration afterwards would be observed. For the same reasons mentioned earlier in section IV.A, a conservative rate of induced demand is assumed—only half of what was observed in the Roxas-Caticlan link, or 44.5% passenger traffic growth on the second year of operation and 32.5% passenger traffic growth on the third year of operation.
3. Passenger Traffic Forecast
Table 7 shows the annual RoRo passenger traffic forecast for Cawayan-Daan
Bantayan assuming the project is in place. The projection uses 2006 as base year for forecasting, 2008 as start of project operation and a 20-year period that coincides with the RoRo vessel operation and includes the 10-year loan repayment period. After the initial “spikes” in years 2 and 3 of operation, traffic goes back to the assumed long-term growth rate of 6.02%.
Table 7. Cawayan-Daan Bantayan 10-Year Passenger Traffic Forecast
Year Growth Rate Passenger Traffic 2008 108,486 2009 44.50% 156,762 2010 32.50% 207,709 2011 6.02% 220,213 2012 6.02% 233,469 2013 6.02% 247,522 2014 6.02% 262,422 2015 6.02% 278,219 2016 6.02% 294,967 2017 6.02% 312,723
Estimate of Vehicle Traffic
1. Potential Types 3 and 4 Vehicle Traffic
Following the methodology for Pilar-Aroroy in section 4.A, this study estimates the latent demand for RoRo service by vehicles in the Cawayan-Daan Bantayan route based on the estimate of potential diverted cargo traffic, transformed into cargo-carrying types 3 and 4 vehicle traffic.
According to on an interviewee during the June 2006 fieldwork in Bogo, Cebu,
about 36 crates of marine products are conveyed from Placer, Masbate to Bogo for every trip of the pumpboat. The pumpboat makes two trips per day. This translates to approximately 1.55 metric tons of cargo traffic per day or 512 metric tons per year.
There is already an element of a supply logistics chain in Bogo for the livestock
and marine products coming from Masbate. Trucks wait on schedule for the cargo and have a network of deliveries in Cebu. Sea transport, however, is inefficient. Considering this apparent dissatisfaction with the available service, the analysis here assumes that
32
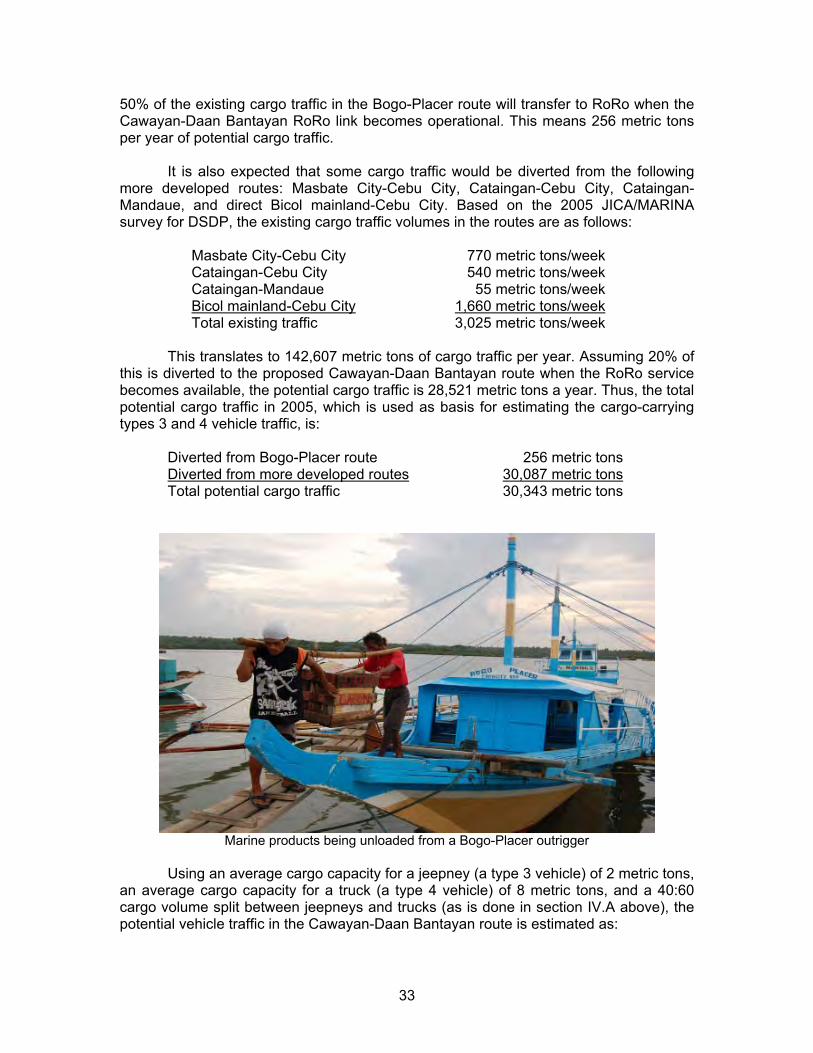
50% of the existing cargo traffic in the Bogo-Placer route will transfer to RoRo when the Cawayan-Daan Bantayan RoRo link becomes operational. This means 256 metric tons per year of potential cargo traffic.
It is also expected that some cargo traffic would be diverted from the following more developed routes: Masbate City-Cebu City, Cataingan-Cebu City, Cataingan-Mandaue, and direct Bicol mainland-Cebu City. Based on the 2005 JICA/MARINA survey for DSDP, the existing cargo traffic volumes in the routes are as follows:
Masbate City-Cebu City 770 metric tons/week Cataingan-Cebu City 540 metric tons/week Cataingan-Mandaue 55 metric tons/week Bicol mainland-Cebu City 1,660 metric tons/week Total existing traffic 3,025 metric tons/week
This translates to 142,607 metric tons of cargo traffic per year. Assuming 20% of
this is diverted to the proposed Cawayan-Daan Bantayan route when the RoRo service becomes available, the potential cargo traffic is 28,521 metric tons a year. Thus, the total potential cargo traffic in 2005, which is used as basis for estimating the cargo-carrying types 3 and 4 vehicle traffic, is:
Diverted from Bogo-Placer route 256 metric tons Diverted from more developed routes 30,087 metric tons Total potential cargo traffic 30,343 metric tons
Marine products being unloaded from a Bogo-Placer outrigger
Using an average cargo capacity for a jeepney (a type 3 vehicle) of 2 metric tons,
an average cargo capacity for a truck (a type 4 vehicle) of 8 metric tons, and a 40:60 cargo volume split between jeepneys and trucks (as is done in section IV.A above), the potential vehicle traffic in the Cawayan-Daan Bantayan route is estimated as:
33
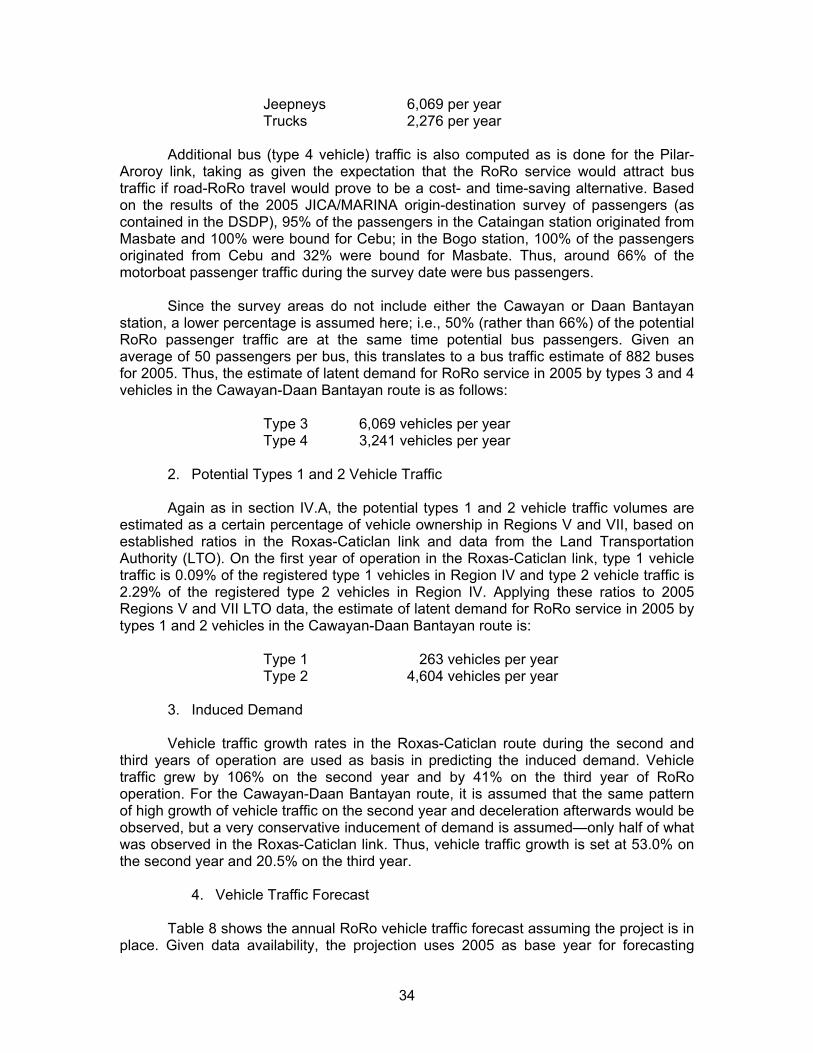
Jeepneys 6,069 per year Trucks 2,276 per year
Additional bus (type 4 vehicle) traffic is also computed as is done for the Pilar-
Aroroy link, taking as given the expectation that the RoRo service would attract bus traffic if road-RoRo travel would prove to be a cost- and time-saving alternative. Based on the results of the 2005 JICA/MARINA origin-destination survey of passengers (as contained in the DSDP), 95% of the passengers in the Cataingan station originated from Masbate and 100% were bound for Cebu; in the Bogo station, 100% of the passengers originated from Cebu and 32% were bound for Masbate. Thus, around 66% of the motorboat passenger traffic during the survey date were bus passengers.
Since the survey areas do not include either the Cawayan or Daan Bantayan station, a lower percentage is assumed here; i.e., 50% (rather than 66%) of the potential RoRo passenger traffic are at the same time potential bus passengers. Given an average of 50 passengers per bus, this translates to a bus traffic estimate of 882 buses for 2005. Thus, the estimate of latent demand for RoRo service in 2005 by types 3 and 4 vehicles in the Cawayan-Daan Bantayan route is as follows:
Type 3 6,069 vehicles per year Type 4 3,241 vehicles per year
2. Potential Types 1 and 2 Vehicle Traffic
Again as in section IV.A, the potential types 1 and 2 vehicle traffic volumes are
estimated as a certain percentage of vehicle ownership in Regions V and VII, based on established ratios in the Roxas-Caticlan link and data from the Land Transportation Authority (LTO). On the first year of operation in the Roxas-Caticlan link, type 1 vehicle traffic is 0.09% of the registered type 1 vehicles in Region IV and type 2 vehicle traffic is 2.29% of the registered type 2 vehicles in Region IV. Applying these ratios to 2005 Regions V and VII LTO data, the estimate of latent demand for RoRo service in 2005 by types 1 and 2 vehicles in the Cawayan-Daan Bantayan route is:
Type 1 263 vehicles per year Type 2 4,604 vehicles per year
3. Induced Demand
Vehicle traffic growth rates in the Roxas-Caticlan route during the second and
third years of operation are used as basis in predicting the induced demand. Vehicle traffic grew by 106% on the second year and by 41% on the third year of RoRo operation. For the Cawayan-Daan Bantayan route, it is assumed that the same pattern of high growth of vehicle traffic on the second year and deceleration afterwards would be observed, but a very conservative inducement of demand is assumed—only half of what was observed in the Roxas-Caticlan link. Thus, vehicle traffic growth is set at 53.0% on the second year and 20.5% on the third year.
4. Vehicle Traffic Forecast
Table 8 shows the annual RoRo vehicle traffic forecast assuming the project is in place. Given data availability, the projection uses 2005 as base year for forecasting
34
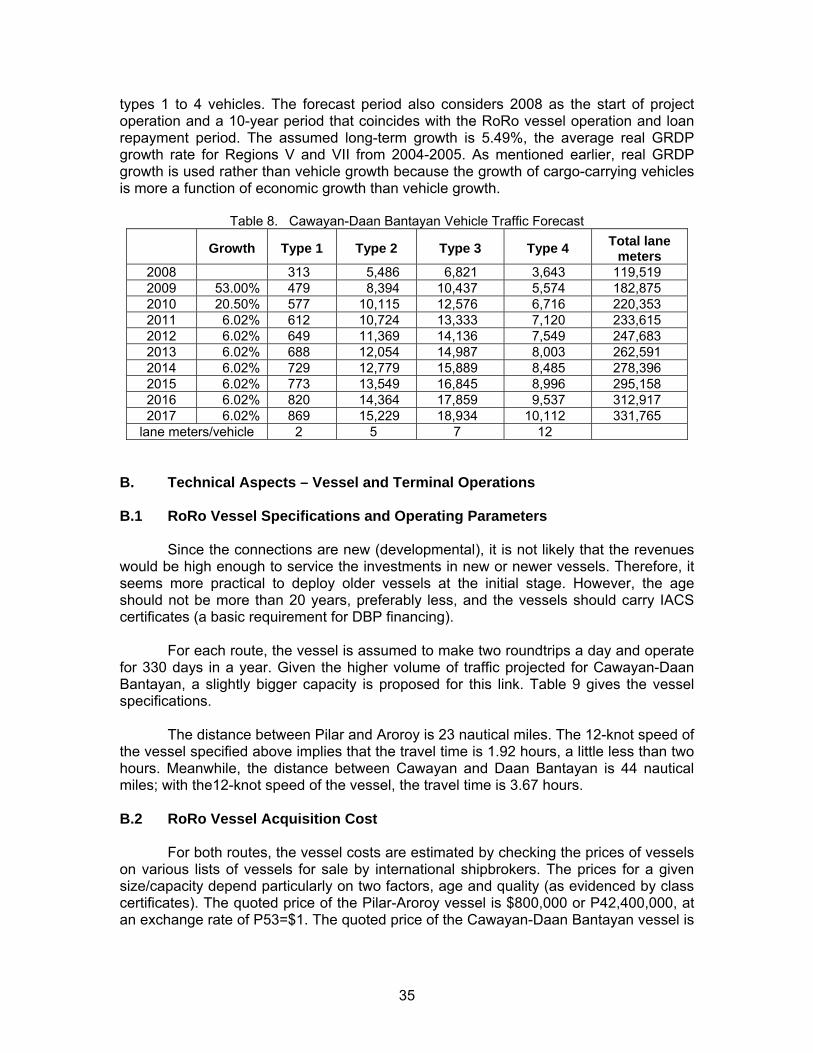
types 1 to 4 vehicles. The forecast period also considers 2008 as the start of project operation and a 10-year period that coincides with the RoRo vessel operation and loan repayment period. The assumed long-term growth is 5.49%, the average real GRDP growth rate for Regions V and VII from 2004-2005. As mentioned earlier, real GRDP growth is used rather than vehicle growth because the growth of cargo-carrying vehicles is more a function of economic growth than vehicle growth.
Table 8. Cawayan-Daan Bantayan Vehicle Traffic Forecast
Growth Type 1 Type 2 Type 3 Type 4 Total lane meters
2008 313 5,486 6,821 3,643 119,519 2009 53.00% 479 8,394 10,437 5,574 182,875 2010 20.50% 577 10,115 12,576 6,716 220,353 2011 6.02% 612 10,724 13,333 7,120 233,615 2012 6.02% 649 11,369 14,136 7,549 247,683 2013 6.02% 688 12,054 14,987 8,003 262,591 2014 6.02% 729 12,779 15,889 8,485 278,396 2015 6.02% 773 13,549 16,845 8,996 295,158 2016 6.02% 820 14,364 17,859 9,537 312,917 2017 6.02% 869 15,229 18,934 10,112 331,765
lane meters/vehicle 2 5 7 12
B. Technical Aspects – Vessel and Terminal Operations
B.1 RoRo Vessel Specifications and Operating Parameters
Since the connections are new (developmental), it is not likely that the revenues
would be high enough to service the investments in new or newer vessels. Therefore, it seems more practical to deploy older vessels at the initial stage. However, the age should not be more than 20 years, preferably less, and the vessels should carry IACS certificates (a basic requirement for DBP financing).
For each route, the vessel is assumed to make two roundtrips a day and operate
for 330 days in a year. Given the higher volume of traffic projected for Cawayan-Daan Bantayan, a slightly bigger capacity is proposed for this link. Table 9 gives the vessel specifications.
The distance between Pilar and Aroroy is 23 nautical miles. The 12-knot speed of
the vessel specified above implies that the travel time is 1.92 hours, a little less than two hours. Meanwhile, the distance between Cawayan and Daan Bantayan is 44 nautical miles; with the12-knot speed of the vessel, the travel time is 3.67 hours. B.2 RoRo Vessel Acquisition Cost
For both routes, the vessel costs are estimated by checking the prices of vessels
on various lists of vessels for sale by international shipbrokers. The prices for a given size/capacity depend particularly on two factors, age and quality (as evidenced by class certificates). The quoted price of the Pilar-Aroroy vessel is $800,000 or P42,400,000, at an exchange rate of P53=$1. The quoted price of the Cawayan-Daan Bantayan vessel is
35
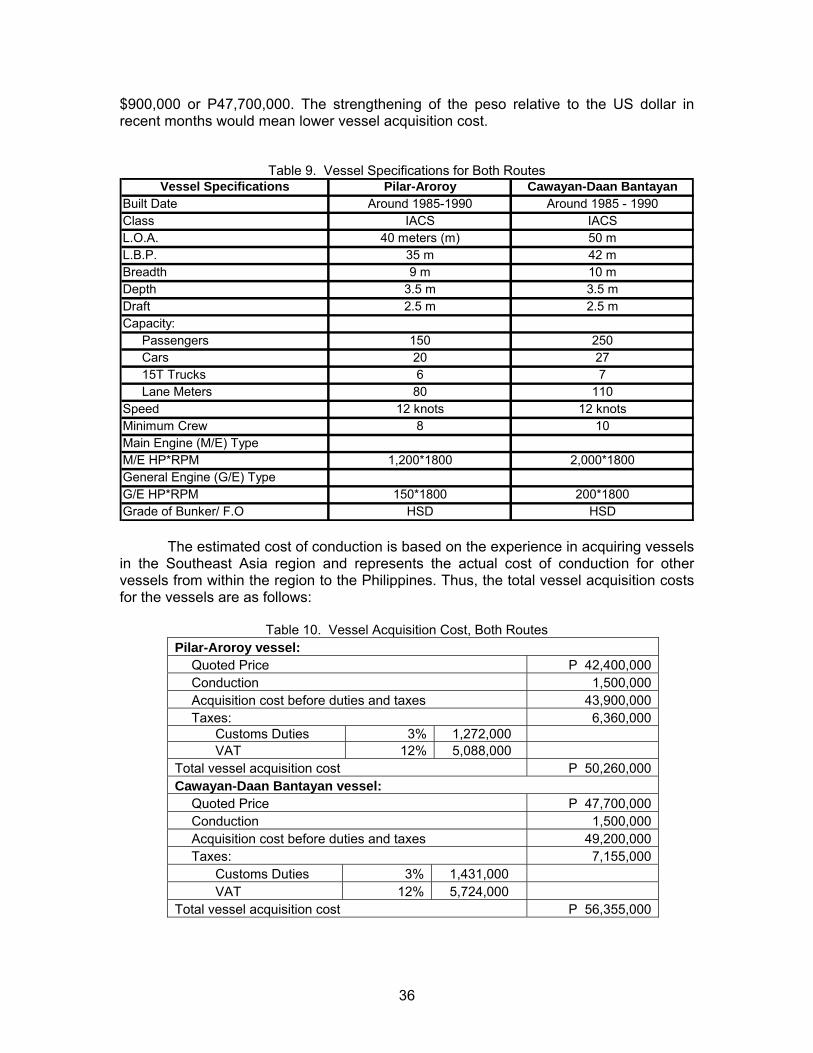
$900,000 or P47,700,000. The strengthening of the peso relative to the US dollar in recent months would mean lower vessel acquisition cost.
Table 9. Vessel Specifications for Both Routes Vessel Specifications Pilar-Aroroy Cawayan-Daan Bantayan
Built Date Around 1985-1990 Around 1985 - 1990Class IACS IACSL.O.A. 40 meters (m) 50 mL.B.P. 35 m 42 mBreadth 9 m 10 mDepth 3.5 m 3.5 mDraft 2.5 m 2.5 mCapacity:
Passengers 150 250Cars 20 2715T Trucks 6 7Lane Meters 80 110
Speed 12 knots 12 knotsMinimum Crew 8 10Main Engine (M/E) TypeM/E HP*RPM 1,200*1800 2,000*1800General Engine (G/E) TypeG/E HP*RPM 150*1800 200*1800Grade of Bunker/ F.O HSD HSD
The estimated cost of conduction is based on the experience in acquiring vessels
in the Southeast Asia region and represents the actual cost of conduction for other vessels from within the region to the Philippines. Thus, the total vessel acquisition costs for the vessels are as follows:
Table 10. Vessel Acquisition Cost, Both Routes
Pilar-Aroroy vessel: Quoted Price P 42,400,000 Conduction 1,500,000 Acquisition cost before duties and taxes 43,900,000 Taxes: 6,360,000
Customs Duties 3% 1,272,000 VAT 12% 5,088,000 Total vessel acquisition cost P 50,260,000 Cawayan-Daan Bantayan vessel:
Quoted Price P 47,700,000 Conduction 1,500,000 Acquisition cost before duties and taxes 49,200,000 Taxes: 7,155,000
Customs Duties 3% 1,431,000 VAT 12% 5,724,000 Total vessel acquisition cost P 56,355,000
36
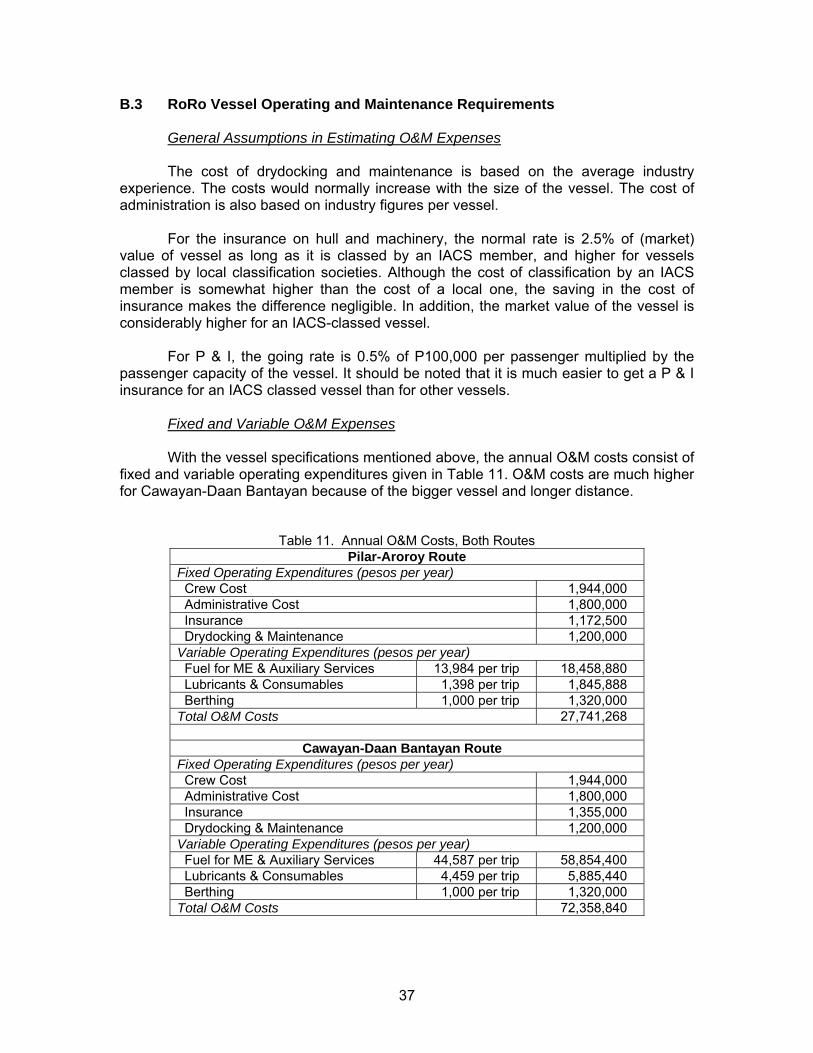
B.3 RoRo Vessel Operating and Maintenance Requirements General Assumptions in Estimating O&M Expenses
The cost of drydocking and maintenance is based on the average industry experience. The costs would normally increase with the size of the vessel. The cost of administration is also based on industry figures per vessel.
For the insurance on hull and machinery, the normal rate is 2.5% of (market)
value of vessel as long as it is classed by an IACS member, and higher for vessels classed by local classification societies. Although the cost of classification by an IACS member is somewhat higher than the cost of a local one, the saving in the cost of insurance makes the difference negligible. In addition, the market value of the vessel is considerably higher for an IACS-classed vessel.
For P & I, the going rate is 0.5% of P100,000 per passenger multiplied by the
passenger capacity of the vessel. It should be noted that it is much easier to get a P & I insurance for an IACS classed vessel than for other vessels.
Fixed and Variable O&M Expenses
With the vessel specifications mentioned above, the annual O&M costs consist of fixed and variable operating expenditures given in Table 11. O&M costs are much higher for Cawayan-Daan Bantayan because of the bigger vessel and longer distance.
Table 11. Annual O&M Costs, Both Routes Pilar-Aroroy Route
Fixed Operating Expenditures (pesos per year) Crew Cost 1,944,000 Administrative Cost 1,800,000 Insurance 1,172,500 Drydocking & Maintenance 1,200,000 Variable Operating Expenditures (pesos per year) Fuel for ME & Auxiliary Services 13,984 per trip 18,458,880 Lubricants & Consumables 1,398 per trip 1,845,888 Berthing 1,000 per trip 1,320,000 Total O&M Costs 27,741,268
Cawayan-Daan Bantayan Route
Fixed Operating Expenditures (pesos per year) Crew Cost 1,944,000 Administrative Cost 1,800,000 Insurance 1,355,000 Drydocking & Maintenance 1,200,000 Variable Operating Expenditures (pesos per year) Fuel for ME & Auxiliary Services 44,587 per trip 58,854,400 Lubricants & Consumables 4,459 per trip 5,885,440 Berthing 1,000 per trip 1,320,000 Total O&M Costs 72,358,840
37
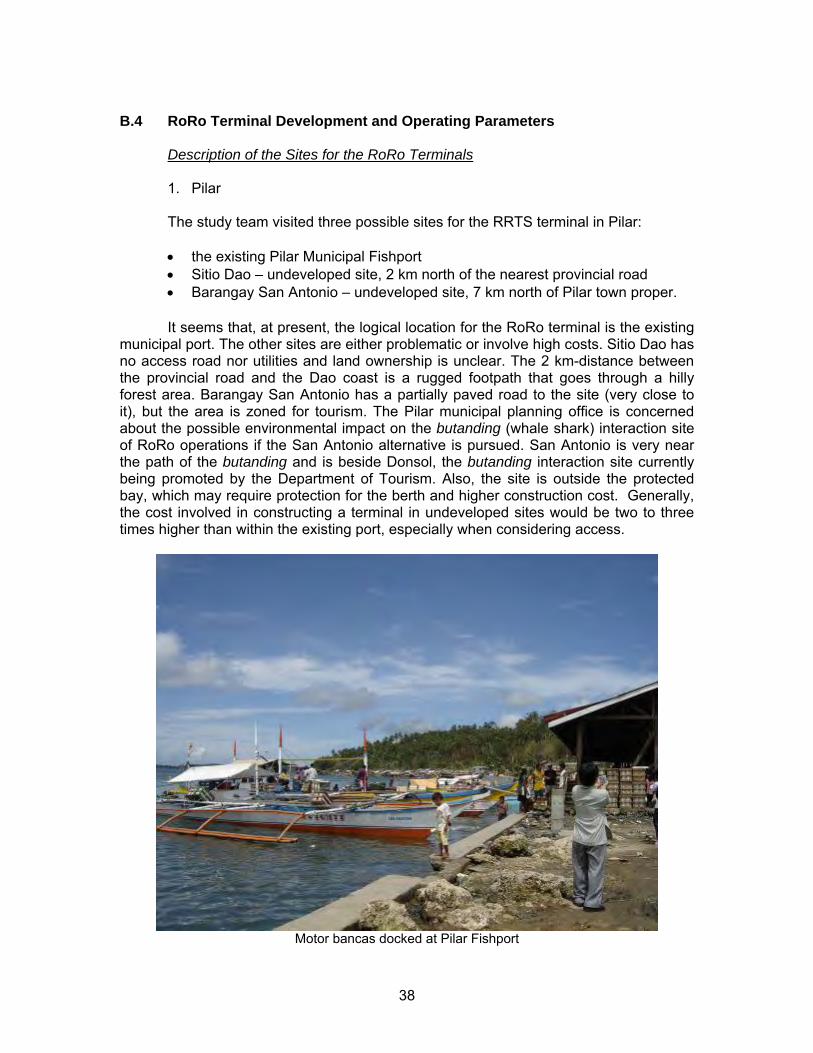
B.4 RoRo Terminal Development and Operating Parameters
Description of the Sites for the RoRo Terminals
1. Pilar
The study team visited three possible sites for the RRTS terminal in Pilar:
• the existing Pilar Municipal Fishport • Sitio Dao – undeveloped site, 2 km north of the nearest provincial road • Barangay San Antonio – undeveloped site, 7 km north of Pilar town proper.
It seems that, at present, the logical location for the RoRo terminal is the existing
municipal port. The other sites are either problematic or involve high costs. Sitio Dao has no access road nor utilities and land ownership is unclear. The 2 km-distance between the provincial road and the Dao coast is a rugged footpath that goes through a hilly forest area. Barangay San Antonio has a partially paved road to the site (very close to it), but the area is zoned for tourism. The Pilar municipal planning office is concerned about the possible environmental impact on the butanding (whale shark) interaction site of RoRo operations if the San Antonio alternative is pursued. San Antonio is very near the path of the butanding and is beside Donsol, the butanding interaction site currently being promoted by the Department of Tourism. Also, the site is outside the protected bay, which may require protection for the berth and higher construction cost. Generally, the cost involved in constructing a terminal in undeveloped sites would be two to three times higher than within the existing port, especially when considering access.
Motor bancas docked at Pilar Fishport
38
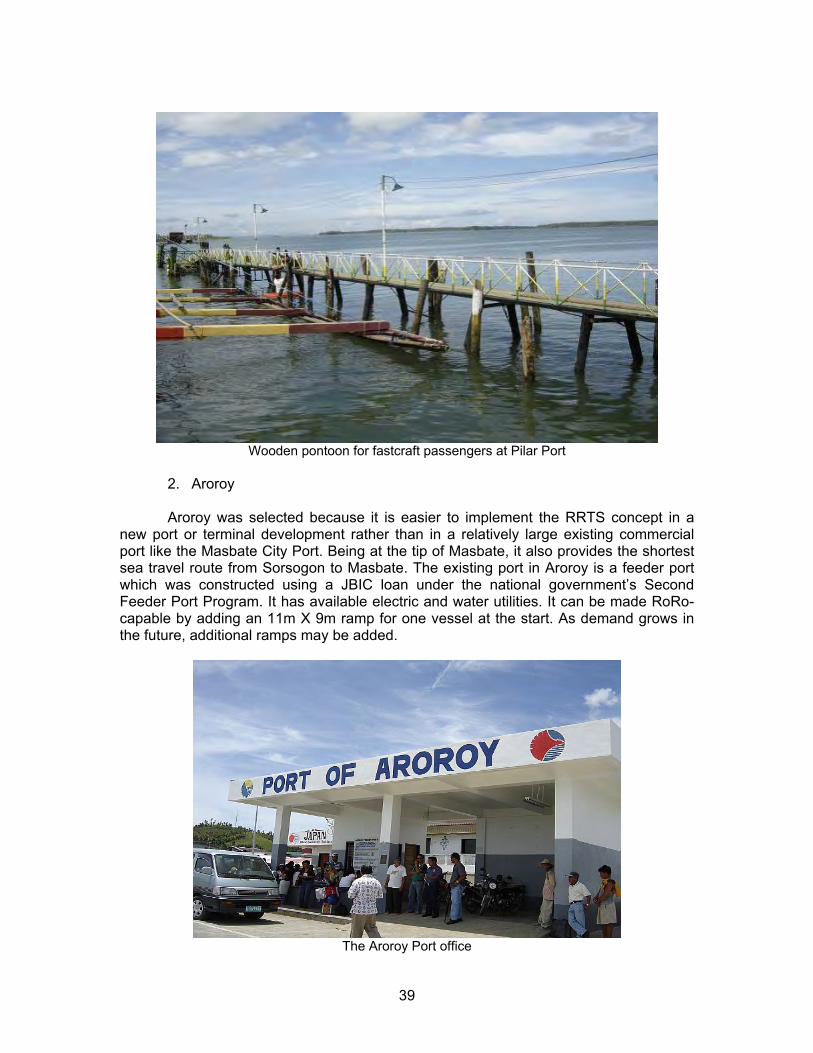
Wooden pontoon for fastcraft passengers at Pilar Port
2. Aroroy
Aroroy was selected because it is easier to implement the RRTS concept in a
new port or terminal development rather than in a relatively large existing commercial port like the Masbate City Port. Being at the tip of Masbate, it also provides the shortest sea travel route from Sorsogon to Masbate. The existing port in Aroroy is a feeder port which was constructed using a JBIC loan under the national government’s Second Feeder Port Program. It has available electric and water utilities. It can be made RoRo-capable by adding an 11m X 9m ramp for one vessel at the start. As demand grows in the future, additional ramps may be added.
The Aroroy Port office
39
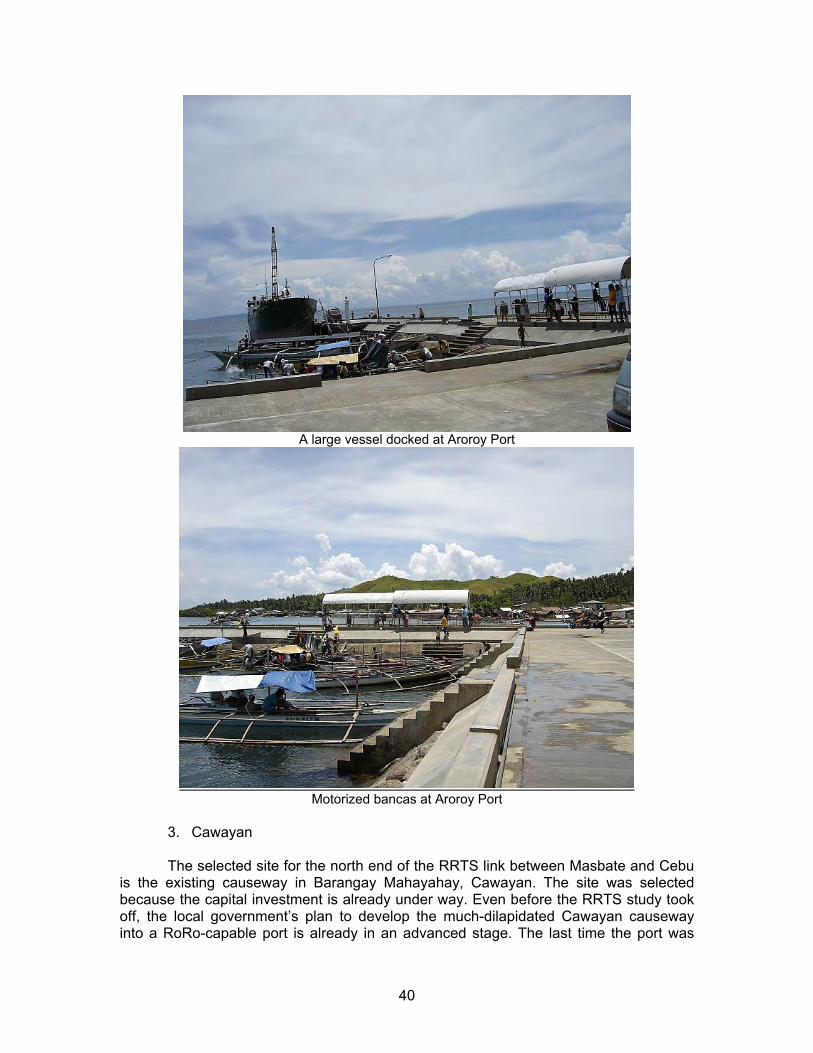
A large vessel docked at Aroroy Port
Motorized bancas at Aroroy Port
3. Cawayan
The selected site for the north end of the RRTS link between Masbate and Cebu is the existing causeway in Barangay Mahayahay, Cawayan. The site was selected because the capital investment is already under way. Even before the RRTS study took off, the local government’s plan to develop the much-dilapidated Cawayan causeway into a RoRo-capable port is already in an advanced stage. The last time the port was
40
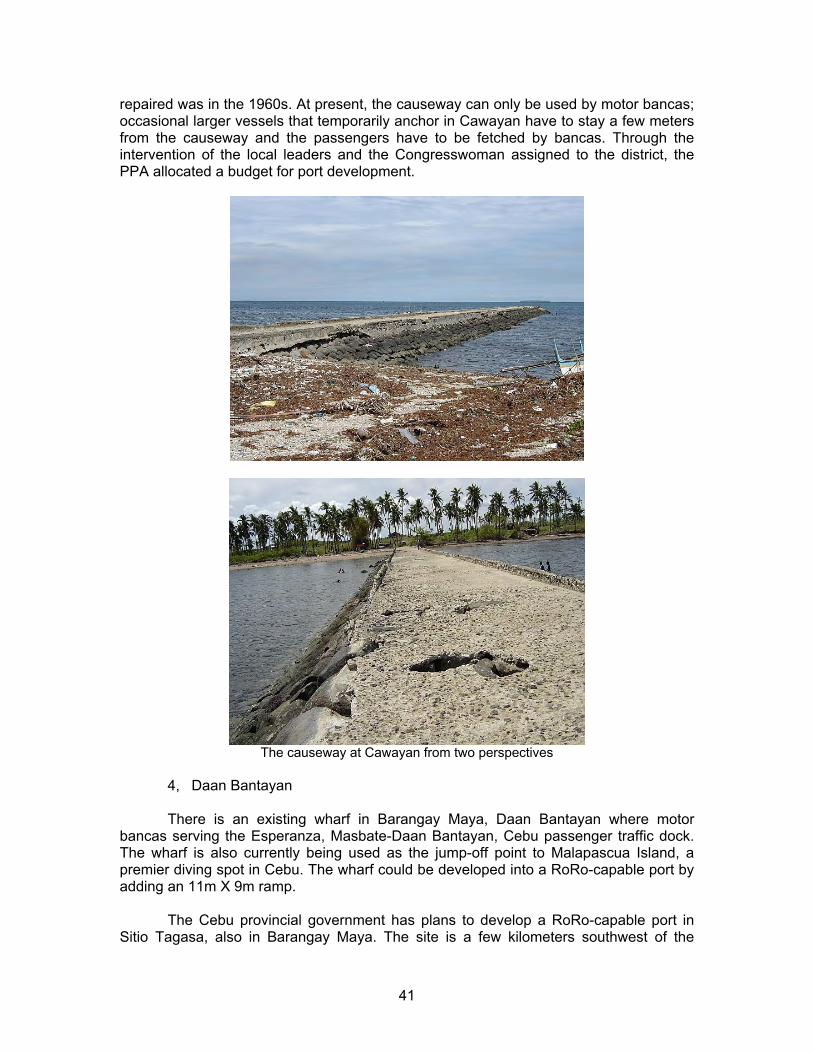
repaired was in the 1960s. At present, the causeway can only be used by motor bancas; occasional larger vessels that temporarily anchor in Cawayan have to stay a few meters from the causeway and the passengers have to be fetched by bancas. Through the intervention of the local leaders and the Congresswoman assigned to the district, the PPA allocated a budget for port development.
The causeway at Cawayan from two perspectives
4, Daan Bantayan
There is an existing wharf in Barangay Maya, Daan Bantayan where motor
bancas serving the Esperanza, Masbate-Daan Bantayan, Cebu passenger traffic dock. The wharf is also currently being used as the jump-off point to Malapascua Island, a premier diving spot in Cebu. The wharf could be developed into a RoRo-capable port by adding an 11m X 9m ramp.
The Cebu provincial government has plans to develop a RoRo-capable port in
Sitio Tagasa, also in Barangay Maya. The site is a few kilometers southwest of the
41
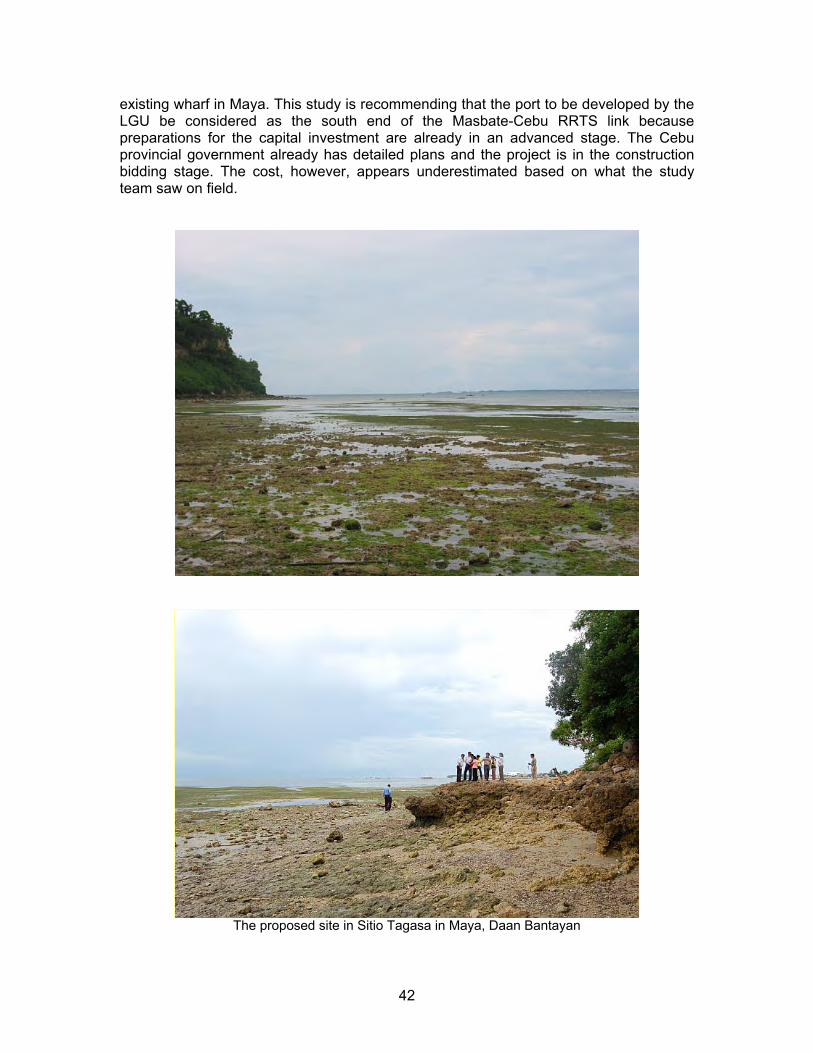
existing wharf in Maya. This study is recommending that the port to be developed by the LGU be considered as the south end of the Masbate-Cebu RRTS link because preparations for the capital investment are already in an advanced stage. The Cebu provincial government already has detailed plans and the project is in the construction bidding stage. The cost, however, appears underestimated based on what the study team saw on field.
The proposed site in Sitio Tagasa in Maya, Daan Bantayan
42
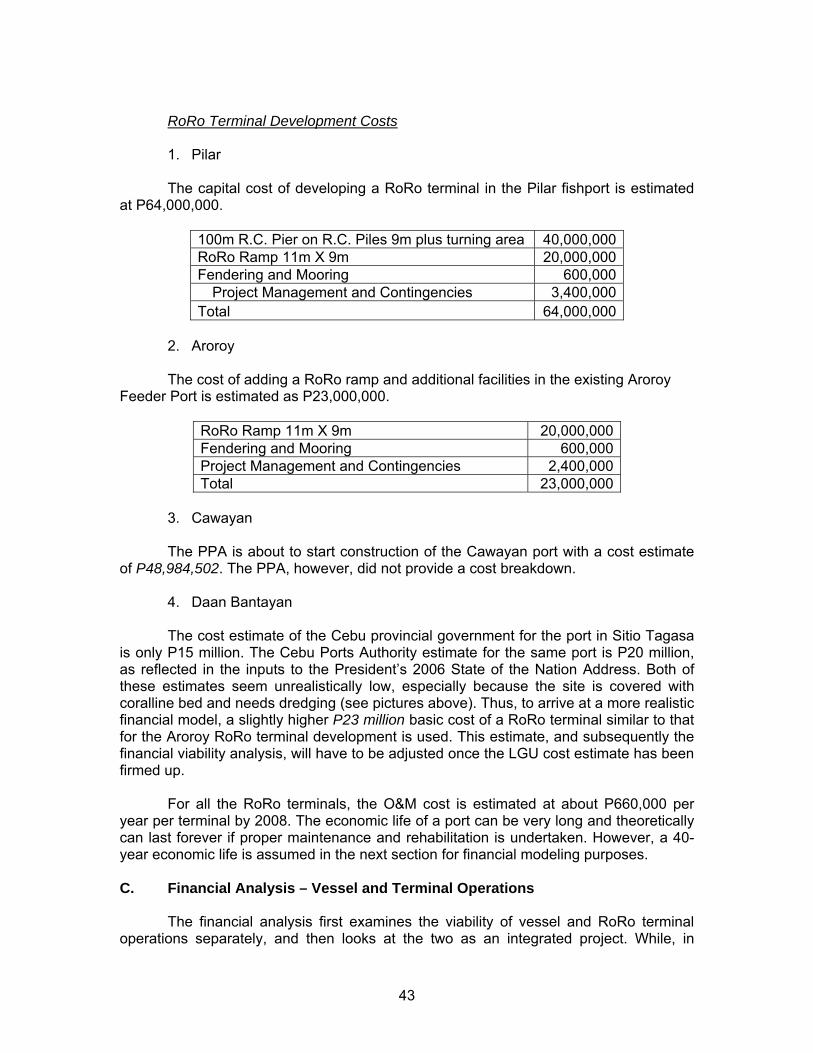
RoRo Terminal Development Costs
1. Pilar
The capital cost of developing a RoRo terminal in the Pilar fishport is estimated
at P64,000,000.
100m R.C. Pier on R.C. Piles 9m plus turning area 40,000,000 RoRo Ramp 11m X 9m 20,000,000 Fendering and Mooring 600,000
Project Management and Contingencies 3,400,000 Total 64,000,000
2. Aroroy The cost of adding a RoRo ramp and additional facilities in the existing Aroroy
Feeder Port is estimated as P23,000,000.
RoRo Ramp 11m X 9m 20,000,000 Fendering and Mooring 600,000 Project Management and Contingencies 2,400,000 Total 23,000,000
3. Cawayan
The PPA is about to start construction of the Cawayan port with a cost estimate
of P48,984,502. The PPA, however, did not provide a cost breakdown. 4. Daan Bantayan
The cost estimate of the Cebu provincial government for the port in Sitio Tagasa
is only P15 million. The Cebu Ports Authority estimate for the same port is P20 million, as reflected in the inputs to the President’s 2006 State of the Nation Address. Both of these estimates seem unrealistically low, especially because the site is covered with coralline bed and needs dredging (see pictures above). Thus, to arrive at a more realistic financial model, a slightly higher P23 million basic cost of a RoRo terminal similar to that for the Aroroy RoRo terminal development is used. This estimate, and subsequently the financial viability analysis, will have to be adjusted once the LGU cost estimate has been firmed up.
For all the RoRo terminals, the O&M cost is estimated at about P660,000 per
year per terminal by 2008. The economic life of a port can be very long and theoretically can last forever if proper maintenance and rehabilitation is undertaken. However, a 40-year economic life is assumed in the next section for financial modeling purposes.
C. Financial Analysis – Vessel and Terminal Operations
The financial analysis first examines the viability of vessel and RoRo terminal
operations separately, and then looks at the two as an integrated project. While, in
43
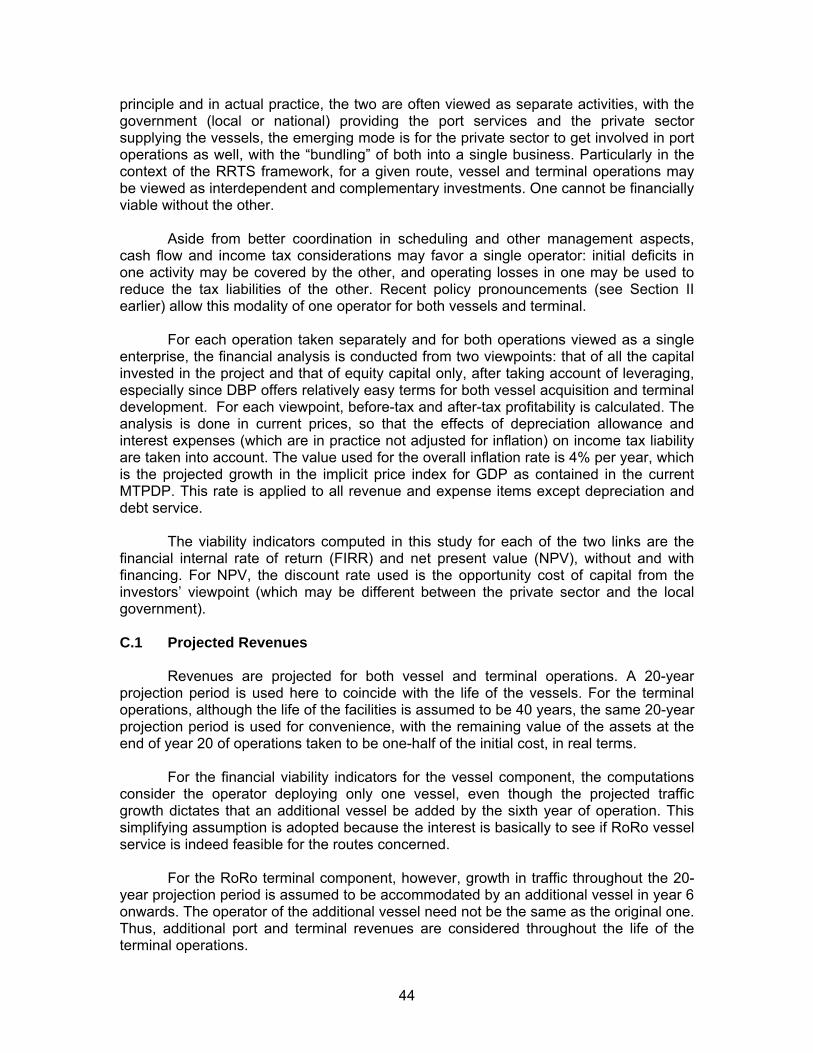
principle and in actual practice, the two are often viewed as separate activities, with the government (local or national) providing the port services and the private sector supplying the vessels, the emerging mode is for the private sector to get involved in port operations as well, with the “bundling” of both into a single business. Particularly in the context of the RRTS framework, for a given route, vessel and terminal operations may be viewed as interdependent and complementary investments. One cannot be financially viable without the other.
Aside from better coordination in scheduling and other management aspects,
cash flow and income tax considerations may favor a single operator: initial deficits in one activity may be covered by the other, and operating losses in one may be used to reduce the tax liabilities of the other. Recent policy pronouncements (see Section II earlier) allow this modality of one operator for both vessels and terminal.
For each operation taken separately and for both operations viewed as a single
enterprise, the financial analysis is conducted from two viewpoints: that of all the capital invested in the project and that of equity capital only, after taking account of leveraging, especially since DBP offers relatively easy terms for both vessel acquisition and terminal development. For each viewpoint, before-tax and after-tax profitability is calculated. The analysis is done in current prices, so that the effects of depreciation allowance and interest expenses (which are in practice not adjusted for inflation) on income tax liability are taken into account. The value used for the overall inflation rate is 4% per year, which is the projected growth in the implicit price index for GDP as contained in the current MTPDP. This rate is applied to all revenue and expense items except depreciation and debt service.
The viability indicators computed in this study for each of the two links are the
financial internal rate of return (FIRR) and net present value (NPV), without and with financing. For NPV, the discount rate used is the opportunity cost of capital from the investors’ viewpoint (which may be different between the private sector and the local government).
C.1 Projected Revenues
Revenues are projected for both vessel and terminal operations. A 20-year projection period is used here to coincide with the life of the vessels. For the terminal operations, although the life of the facilities is assumed to be 40 years, the same 20-year projection period is used for convenience, with the remaining value of the assets at the end of year 20 of operations taken to be one-half of the initial cost, in real terms.
For the financial viability indicators for the vessel component, the computations
consider the operator deploying only one vessel, even though the projected traffic growth dictates that an additional vessel be added by the sixth year of operation. This simplifying assumption is adopted because the interest is basically to see if RoRo vessel service is indeed feasible for the routes concerned.
For the RoRo terminal component, however, growth in traffic throughout the 20-
year projection period is assumed to be accommodated by an additional vessel in year 6 onwards. The operator of the additional vessel need not be the same as the original one. Thus, additional port and terminal revenues are considered throughout the life of the terminal operations.
44
Revenues from Vessel Operations
1. Passage Fee for Passengers
At present, RoRo passage fees are deregulated and therefore the RoRo passage
fee for passengers assumed by this study is set close to the prevailing market rate. Executive Order 213 deregulated in 1994 all domestic shipping (including RoRo) passage and cargo and freight rates, but the government through MARINA reserves the right to intervene in cases of unreasonably high rates. To get an approximation of the market rate, data obtained from Montenegro Shipping Lines during the June 2006 fieldwork were used to calculate the passage fee per person per nautical mile prevailing in the following competitive routes, where there are at least two vessel operators: Batangas-Puerto Galera, Batangas-Abra de Ilog, Batangas-Calapan, Batangas-Odiongan, Batangas-Romblon, Batangas-San Jose, Caticlan-Roxas, Odiongan-Romblon, Lucena-Balanacan, Lucena-Kawit, and Bacolod-Iloilo. The passage fees are then averaged and the result is P5.20 average passage fee per person per nautical mile, slightly lower than the average motor banca passage fee of P5.56 per person per nautical mile in the Masbate area as of 2006. For this study, the passenger passage fee by 2008 (start of vessel operation) is assumed to be P6.00 per person per nautical mile, as the inflation rate of 4% per year is factored in.
2. Passage Fee for Vehicles
One of the objectives of the RRTS is to have a passage fee structure based on the lane-meter space occupied by vehicles onboard the RoRo vessel, regardless of the vehicle and freight tonnage. At present, some RoRo vessel operators still charge vehicle passage fees based on the tonnage of the vehicle and the freight carried by the vehicles. From the data gathered from Montenegro Lines, it can be inferred that the company is charging in terms of lane-meter space occupancy, in line with the objective of the RRTS.
To get an approximation of the market rate, the vehicle passage fees per lane
meter per nautical mile imposed by Montenegro Lines in the competitive routes enumerated in section III above are examined. Although there were wide variations in the vehicle passage fees in these routes, thereby making the averaging of fees less straightforward, the commonly observed fee is P10.71 per lane meter per nautical mile.
The vehicle passage fee by 2008 (start of vessel operation) assumed in this study is P11.50 per lane meter per nautical mile. This is reasonable given the market rate for vehicle passage fees prevailing in 2006, as established in the preceding paragraph.
Revenues from Terminal Operations
1. Terminal Fees
The following are the assumed terminal fees for the RRTS:
Passenger terminal fee P10.00 per passenger Vehicle terminal fee P32.00 per lane meter
45
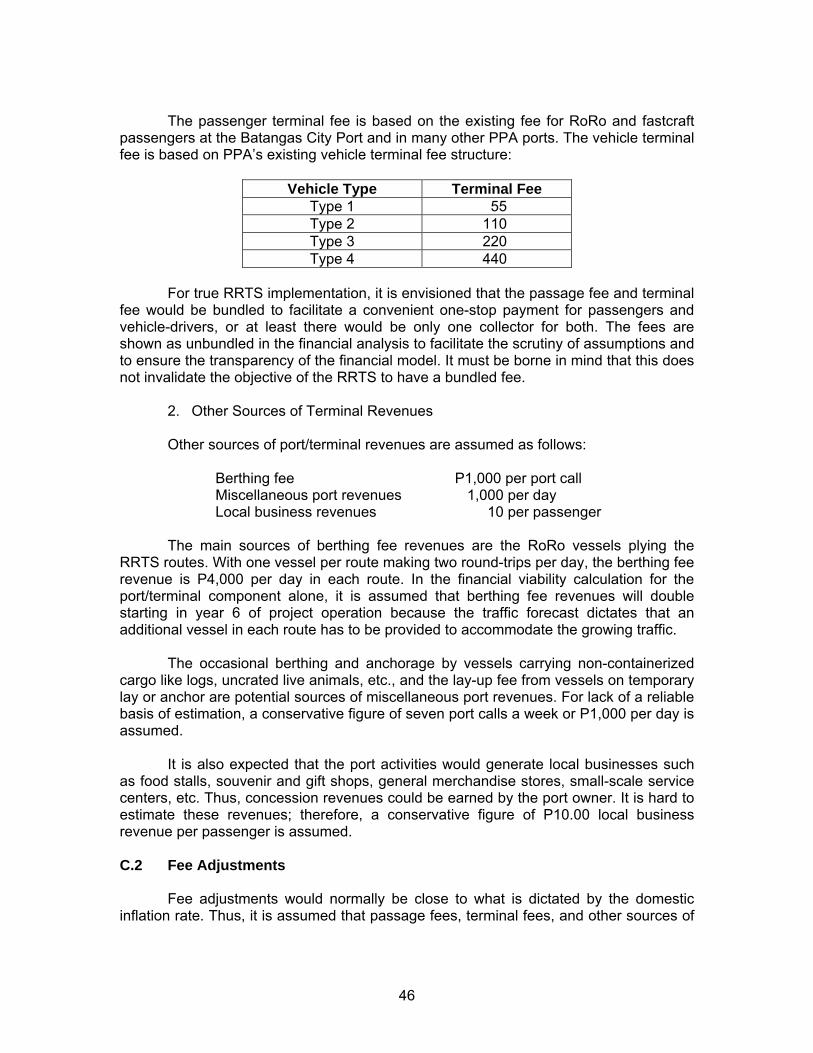
The passenger terminal fee is based on the existing fee for RoRo and fastcraft passengers at the Batangas City Port and in many other PPA ports. The vehicle terminal fee is based on PPA’s existing vehicle terminal fee structure:
Vehicle Type Terminal Fee Type 1 55 Type 2 110 Type 3 220 Type 4 440
For true RRTS implementation, it is envisioned that the passage fee and terminal fee would be bundled to facilitate a convenient one-stop payment for passengers and vehicle-drivers, or at least there would be only one collector for both. The fees are shown as unbundled in the financial analysis to facilitate the scrutiny of assumptions and to ensure the transparency of the financial model. It must be borne in mind that this does not invalidate the objective of the RRTS to have a bundled fee.
2. Other Sources of Terminal Revenues
Other sources of port/terminal revenues are assumed as follows:
Berthing fee P1,000 per port call Miscellaneous port revenues 1,000 per day Local business revenues 10 per passenger
The main sources of berthing fee revenues are the RoRo vessels plying the
RRTS routes. With one vessel per route making two round-trips per day, the berthing fee revenue is P4,000 per day in each route. In the financial viability calculation for the port/terminal component alone, it is assumed that berthing fee revenues will double starting in year 6 of project operation because the traffic forecast dictates that an additional vessel in each route has to be provided to accommodate the growing traffic.
The occasional berthing and anchorage by vessels carrying non-containerized
cargo like logs, uncrated live animals, etc., and the lay-up fee from vessels on temporary lay or anchor are potential sources of miscellaneous port revenues. For lack of a reliable basis of estimation, a conservative figure of seven port calls a week or P1,000 per day is assumed.
It is also expected that the port activities would generate local businesses such
as food stalls, souvenir and gift shops, general merchandise stores, small-scale service centers, etc. Thus, concession revenues could be earned by the port owner. It is hard to estimate these revenues; therefore, a conservative figure of P10.00 local business revenue per passenger is assumed. C.2 Fee Adjustments
Fee adjustments would normally be close to what is dictated by the domestic inflation rate. Thus, it is assumed that passage fees, terminal fees, and other sources of
46
port/terminal revenues increase by 4% annually, the domestic inflation rate projected by the 2004-2010 Medium-Term Philippine Development Plan. C.3 Financial Internal Rates of Return and Net Present Values
General Assumptions
Given that the RRTS routes examined in this study are developmental routes (or missionary routes), and given the relatively small size of the market, only a single RoRo vessel operator per route is feasible in the early years of operation. Thus, the financial model assumes that there is only one RoRo vessel operator per route initially.
The economic life of the RoRo vessel is assumed as 20 years, considering the built date earlier and the 31 years average age of Philippine domestic fleet (as stated in MARINA’s Domestic Shipping Development Plan of the Philippines, 2005). The useful life of the RoRo terminal, on the other hand, is assumed as 40 years. In all the calculations, the RoRo vessel and the RoRo terminal are depreciated using the straight-line method.
In addition to the revenue and cost assumptions described in earlier sections, an
exchange rate of P53 = $1.00 and a corporate income tax rate of 32% are assumed. (The appreciation of the peso relative to the US dollar in recent months suggests that investment costs for both the vessel and the terminal may be lower than the estimates used in this study by the time the project takes off.) The working capital for both the RoRo vessel and RoRo terminal operation is assumed as equivalent to three months of operation and maintenance requirements.
DBP Loan Terms and Investors’ Cost of Capital
1. Loan Terms
The available re-lending facility for RRTS investments is the Domestic Shipping Modernization Program II (DSMP II), a program loan by the Japan Bank for International Cooperation (JBIC) to the Philippine government. DSMP II is being administered by the DBP. The program allows re-lending for both vessel acquisition and port investment.
The sub-loan under DSMP II has the following terms: payable semi-annually, 10
years to pay inclusive of three years’ grace period, and with annual interest of 7.5% on the first three years and 8.5% thereafter.
2. Investors’ Cost of Capital
The willingness of investors to engage in a venture depends on the whether the FIRR on the project exceeds their opportunity cost of capital, computed in most finance textbooks as the weighted average cost of (equity and debt) capital or WACC.
As an approximation of the potential investors’ opportunity cost of equity capital,
the established equity return in an industry or among a group of firms involved in the same business as the project being studied can be used as a benchmark. No observed benchmark for the RoRo shipping industry, or even for the whole domestic shipping industry, is easily available. The 19% return on equity in 2005 posted by Aboitiz Equity
47
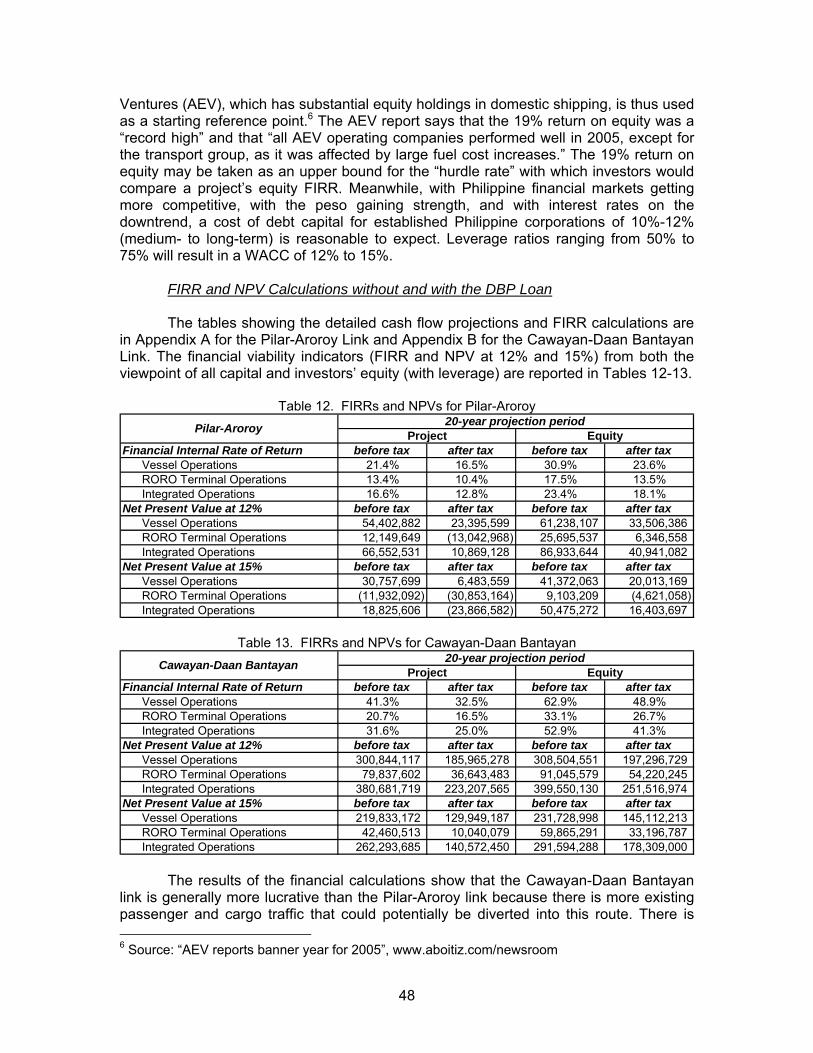
Ventures (AEV), which has substantial equity holdings in domestic shipping, is thus used as a starting reference point.6 The AEV report says that the 19% return on equity was a “record high” and that “all AEV operating companies performed well in 2005, except for the transport group, as it was affected by large fuel cost increases.” The 19% return on equity may be taken as an upper bound for the “hurdle rate” with which investors would compare a project’s equity FIRR. Meanwhile, with Philippine financial markets getting more competitive, with the peso gaining strength, and with interest rates on the downtrend, a cost of debt capital for established Philippine corporations of 10%-12% (medium- to long-term) is reasonable to expect. Leverage ratios ranging from 50% to 75% will result in a WACC of 12% to 15%.
FIRR and NPV Calculations without and with the DBP Loan
The tables showing the detailed cash flow projections and FIRR calculations are
in Appendix A for the Pilar-Aroroy Link and Appendix B for the Cawayan-Daan Bantayan Link. The financial viability indicators (FIRR and NPV at 12% and 15%) from both the viewpoint of all capital and investors’ equity (with leverage) are reported in Tables 12-13.
Table 12. FIRRs and NPVs for Pilar-Aroroy
Financial Internal Rate of Return before tax after tax before tax after taxVessel Operations 21.4% 16.5% 30.9% 23.6%RORO Terminal Operations 13.4% 10.4% 17.5% 13.5%Integrated Operations 16.6% 12.8% 23.4% 18.1%
Net Present Value at 12% before tax after tax before tax after taxVessel Operations 54,402,882 23,395,599 61,238,107 33,506,386 RORO Terminal Operations 12,149,649 (13,042,968) 25,695,537 6,346,558 Integrated Operations 66,552,531 10,869,128 86,933,644 40,941,082
Net Present Value at 15% before tax after tax before tax after taxVessel Operations 30,757,699 6,483,559 41,372,063 20,013,169 RORO Terminal Operations (11,932,092) (30,853,164) 9,103,209 (4,621,058) Integrated Operations 18,825,606 (23,866,582) 50,475,272 16,403,697
20-year projection periodPilar-Aroroy Project Equity
Table 13. FIRRs and NPVs for Cawayan-Daan Bantayan
Financial Internal Rate of Return before tax after tax before tax after taxVessel Operations 41.3% 32.5% 62.9% 48.9%RORO Terminal Operations 20.7% 16.5% 33.1% 26.7%Integrated Operations 31.6% 25.0% 52.9% 41.3%
Net Present Value at 12% before tax after tax before tax after taxVessel Operations 300,844,117 185,965,278 308,504,551 197,296,729 RORO Terminal Operations 79,837,602 36,643,483 91,045,579 54,220,245 Integrated Operations 380,681,719 223,207,565 399,550,130 251,516,974
Net Present Value at 15% before tax after tax before tax after taxVessel Operations 219,833,172 129,949,187 231,728,998 145,112,213 RORO Terminal Operations 42,460,513 10,040,079 59,865,291 33,196,787 Integrated Operations 262,293,685 140,572,450 291,594,288 178,309,000
20-year projection periodCawayan-Daan Bantayan Project Equity
The results of the financial calculations show that the Cawayan-Daan Bantayan
link is generally more lucrative than the Pilar-Aroroy link because there is more existing passenger and cargo traffic that could potentially be diverted into this route. There is 6 Source: “AEV reports banner year for 2005”, www.aboitiz.com/newsroom
48
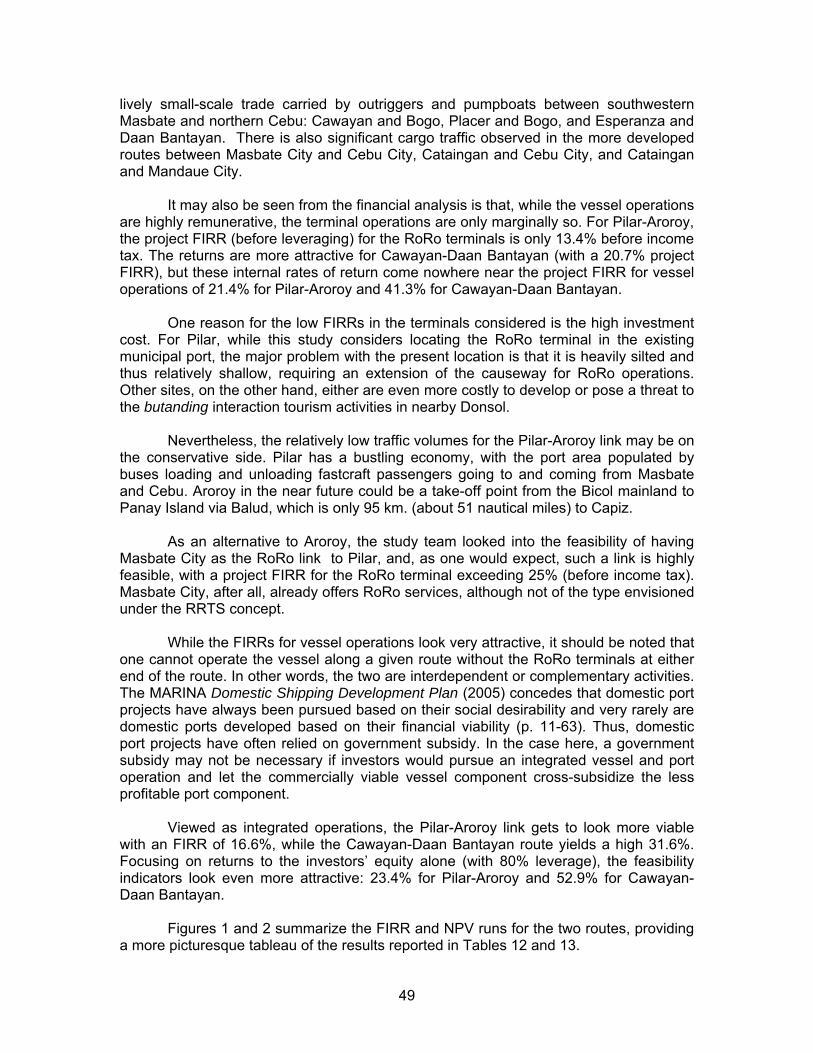
lively small-scale trade carried by outriggers and pumpboats between southwestern Masbate and northern Cebu: Cawayan and Bogo, Placer and Bogo, and Esperanza and Daan Bantayan. There is also significant cargo traffic observed in the more developed routes between Masbate City and Cebu City, Cataingan and Cebu City, and Cataingan and Mandaue City.
It may also be seen from the financial analysis is that, while the vessel operations
are highly remunerative, the terminal operations are only marginally so. For Pilar-Aroroy, the project FIRR (before leveraging) for the RoRo terminals is only 13.4% before income tax. The returns are more attractive for Cawayan-Daan Bantayan (with a 20.7% project FIRR), but these internal rates of return come nowhere near the project FIRR for vessel operations of 21.4% for Pilar-Aroroy and 41.3% for Cawayan-Daan Bantayan.
One reason for the low FIRRs in the terminals considered is the high investment
cost. For Pilar, while this study considers locating the RoRo terminal in the existing municipal port, the major problem with the present location is that it is heavily silted and thus relatively shallow, requiring an extension of the causeway for RoRo operations. Other sites, on the other hand, either are even more costly to develop or pose a threat to the butanding interaction tourism activities in nearby Donsol.
Nevertheless, the relatively low traffic volumes for the Pilar-Aroroy link may be on
the conservative side. Pilar has a bustling economy, with the port area populated by buses loading and unloading fastcraft passengers going to and coming from Masbate and Cebu. Aroroy in the near future could be a take-off point from the Bicol mainland to Panay Island via Balud, which is only 95 km. (about 51 nautical miles) to Capiz.
As an alternative to Aroroy, the study team looked into the feasibility of having
Masbate City as the RoRo link to Pilar, and, as one would expect, such a link is highly feasible, with a project FIRR for the RoRo terminal exceeding 25% (before income tax). Masbate City, after all, already offers RoRo services, although not of the type envisioned under the RRTS concept.
While the FIRRs for vessel operations look very attractive, it should be noted that
one cannot operate the vessel along a given route without the RoRo terminals at either end of the route. In other words, the two are interdependent or complementary activities. The MARINA Domestic Shipping Development Plan (2005) concedes that domestic port projects have always been pursued based on their social desirability and very rarely are domestic ports developed based on their financial viability (p. 11-63). Thus, domestic port projects have often relied on government subsidy. In the case here, a government subsidy may not be necessary if investors would pursue an integrated vessel and port operation and let the commercially viable vessel component cross-subsidize the less profitable port component.
Viewed as integrated operations, the Pilar-Aroroy link gets to look more viable
with an FIRR of 16.6%, while the Cawayan-Daan Bantayan route yields a high 31.6%. Focusing on returns to the investors’ equity alone (with 80% leverage), the feasibility indicators look even more attractive: 23.4% for Pilar-Aroroy and 52.9% for Cawayan-Daan Bantayan.
Figures 1 and 2 summarize the FIRR and NPV runs for the two routes, providing
a more picturesque tableau of the results reported in Tables 12 and 13.
49
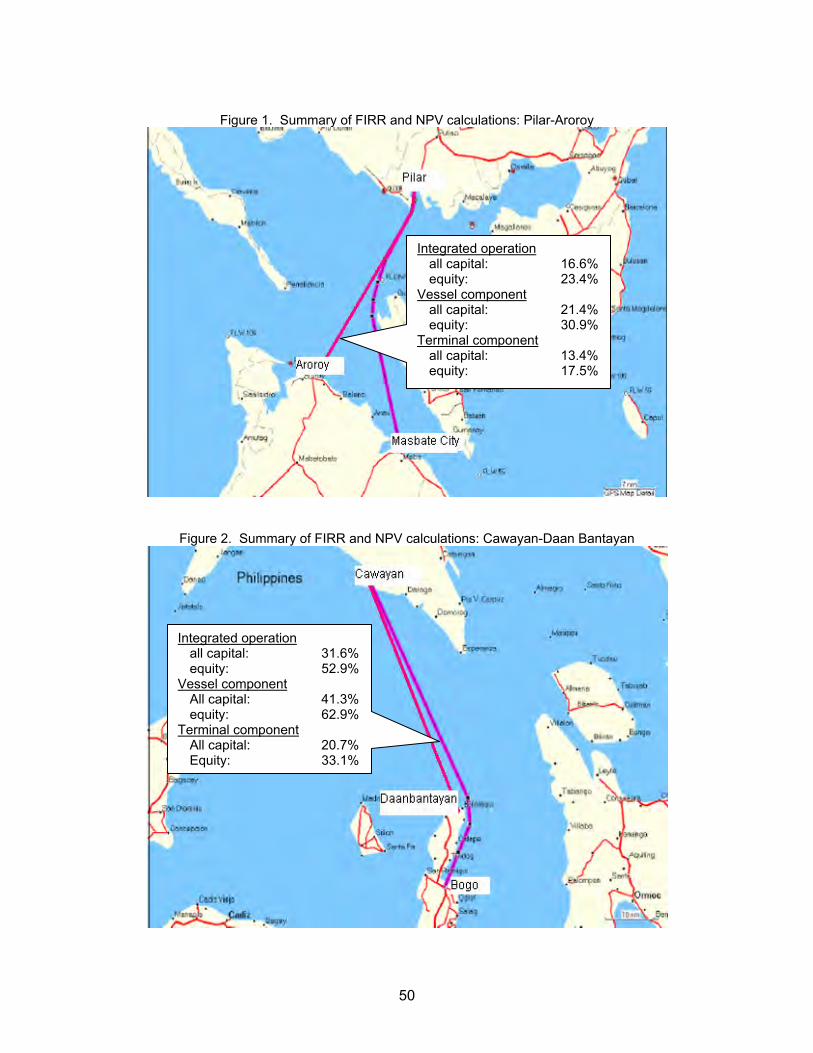
Figure 1. Summary of FIRR and NPV calculations: Pilar-Aroroy
Integrated operation all capital: 16.6% equity: 23.4%
Vessel component all capital: 21.4% equity: 30.9%
Terminal component all capital: 13.4% equity: 17.5%
Figure 2. Summary of FIRR and NPV calculations: Cawayan-Daan Bantayan
Integrated operation all capital: 31.6%equity: 52.9%
Vessel component All capital: 41.3%equity: 62.9%
Terminal component All capital: 20.7%Equity: 33.1%
50
Vessel Acquisition: Financing Options For the potential investors, leveraging through loans that offer interest rates lower
than their opportunity cost of capital, such as that from DSMP II, therefore appears to be a necessary course of action, especially for RoRo terminal development. With an 80:20 debt-equity ratio, the equity FIRR for RoRo terminal development in Pilar-Aroroy rises to 17.5%, while that for Cawayan-Daan Bantayan reaches 32.9% (before income taxes).
One other financing arrangement that this study looks into is the lease-purchase
option. Vessel operators may acquire the RoRo vessels through a financial lease (or lease-purchase) from the National Maritime Equity Corporation (NMEC), a subsidiary of the National Development Company (NDC). NMEC terms7 are as follows:
lease period: 10 years interest: 10% per annum, to be included in the lease charge lease deposit: 10% of the total vessel acquisition cost
While the lease terms cited above look very favorable, they do not compare well
with the terms of DBP’s DSMP II, which offers only 7.5% per year during the three-year grace period and 8.5% per year for the remaining period of the 10-year loan. The cross-over discount rate for the lease-purchase option to be more attractive than the straight-loan option is 38%. That is, if the borrower’s cost of capital is less than 38%, then the straight-loan option would be the better choice.
Table 14 shows the computations comparing the two options, before income tax.
For the loan option, included in the outflow for year 0 is the equity that the investors would have to put up to purchase the vessel. For the lease option, the outflow in year 0 represents the 10% deposit, which the investors get back in year 10. An IRR (cross-over discount rate) for the difference in cash flows that is higher than the investors’ cost of capital means that the first option is preferred.
Table 14. Loan vs. Lease Financing, before Income Tax
Loan Lease Loan - Lease Loan Lease Loan - Lease0 (15,140,000) (5,026,000) (10,114,000) (16,995,000) (5,635,500) (11,359,500) 1 (2,634,000) (8,179,584) 5,545,584 (2,952,000) (9,171,517) 6,219,517 2 (2,634,000) (8,179,584) 5,545,584 (2,952,000) (9,171,517) 6,219,517 3 (2,634,000) (8,179,584) 5,545,584 (2,952,000) (9,171,517) 6,219,517 4 (6,759,761) (8,179,584) 1,419,823 (7,575,860) (9,171,517) 1,595,657 5 (6,759,761) (8,179,584) 1,419,823 (7,575,860) (9,171,517) 1,595,657 6 (6,759,761) (8,179,584) 1,419,823 (7,575,860) (9,171,517) 1,595,657 7 (6,759,761) (8,179,584) 1,419,823 (7,575,860) (9,171,517) 1,595,657 8 (6,759,761) (8,179,584) 1,419,823 (7,575,860) (9,171,517) 1,595,657 9 (6,759,761) (8,179,584) 1,419,823 (7,575,860) (9,171,517) 1,595,657
10 (6,759,761) (3,153,584) (3,606,177) (7,575,860) (3,536,017) (4,039,843) IRR 38.0% 37.9%
Pilar-Aroroy Cawayan-Daan BantayanYear
7 These are the terms indicated in the RRTS chapter of the DSDP (2005 JICA/MARINA study).
The actual terms may vary depending on NMEC’s source of funds (bond flotation, development loan, etc.). Only one lease-purchase application has thus far been approved by NMEC.
51
From the investors’ viewpoint, however, the lease-purchase mode of financing offers the financial advantage of reducing the project’s income tax liabilities, if the tax regime allows the full deduction of lease payments from taxable income. (The tradeoff is that the lessee cannot charge depreciation expenses against income until he gains full ownership of the asset; it is the lessor who can avail of the depreciation expenses.) The computations show that for the Pilar-Aroroy vessel operations, the crossover discount rate (at which the lease-purchase option dominates the loan option) is 20.1%. That is, if the investors’ opportunity cost of capital is higher than 20.1%, then the lease-purchase option gets chosen over the loan option.
For Cawayan-Daan Bantayan vessel operations, however, the present value of the incremental net cash flow with the lease-purchase option over the loan option is positive at any discount rate. This result is due to the fact that the Cawayan-Daan Bantayan route is much more profitable than the Pilar-Aroroy link and tax savings from lease-purchase financing are therefore higher. It should be noted that this result is based on the relative terms of the two options. The higher the implicit interest rate with the lease financing, and the lower the equity requirement with the loan financing, the more favorable the latter is.)
It should also be pointed out that project viability from the economy’s viewpoint should not depend on the mode of financing. C.4 Sensitivity Analysis and Risk Assessment
Sensitivity Analysis
The size of the market probably the most critical factor affecting the profitability of both the RoRo vessel and terminal operations. For the two RoRo links under study, the absence of any significant RoRo traffic in all the four proposed terminal sites means that the expected market will be coming from diverted and induced or generated traffic, which are both unobserved.
For diverted traffic, the methodology followed by the study team in the demand
projections is to take off from data on existing traffic using alternative modes, but adopt a conservative assumption on the proportion that would transfer to the proposed facilities which would offer competitive tariffs plus the convenience of better service. Only 20% of observed existing traffic (as reconstructed from field interviews and secondary sources) is assumed to move to the proposed facilities.
For induced or generated traffic, the methodology of basing the projections on
the observed experience with recently developed Roxas-Caticlan RoRo route is probably less robust, but nevertheless reasonable to adopt. Masbate province is, after all, slightly bigger even than Mindoro Oriental in terms of population, and Roxas is smaller than any of the municipalities hosting the proposed RoRo terminals.
In any case, Table 15 below shows the sensitivity of the project and equity FIRRs
to changes in the assumptions on market demand for RoRo services in the areas concerned. The profitability indicators for the Cawayan-Daan Bantayan route generally remain high, while the Pilar-Aroroy route becomes unattractive.
52
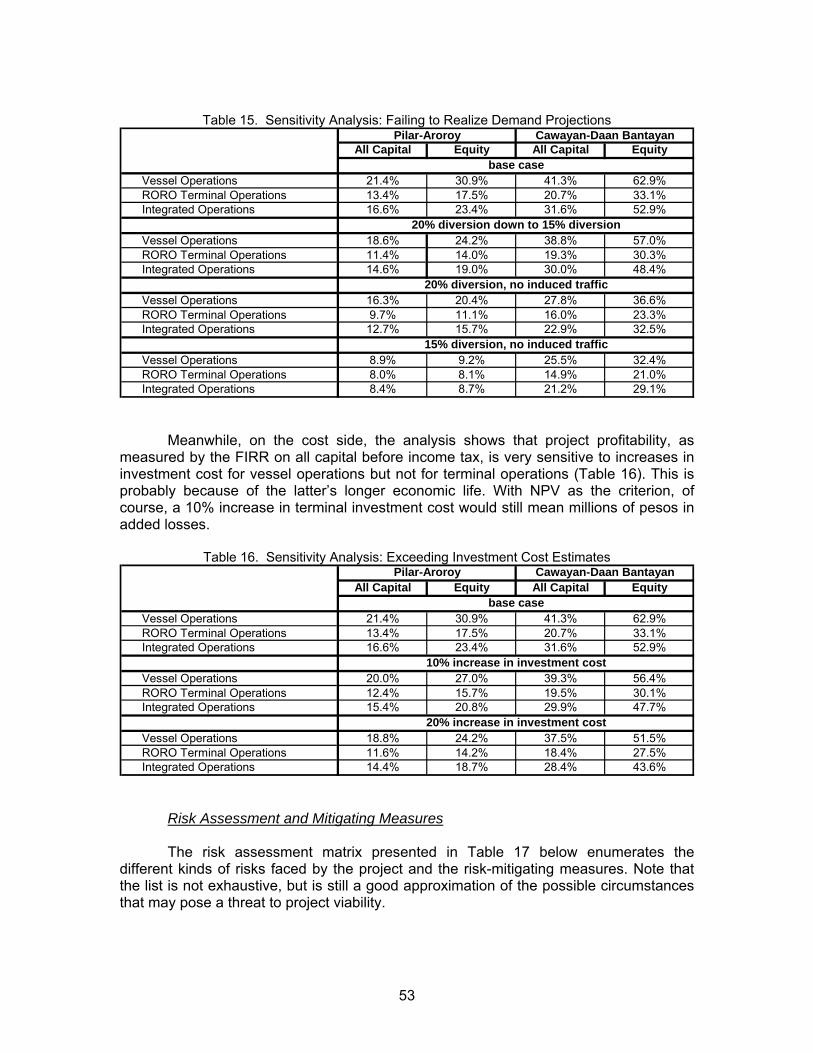
Table 15. Sensitivity Analysis: Failing to Realize Demand Projections
All Capital Equity All Capital Equity
Vessel Operations 21.4% 30.9% 41.3% 62.9%RORO Terminal Operations 13.4% 17.5% 20.7% 33.1%Integrated Operations 16.6% 23.4% 31.6% 52.9%
Vessel Operations 18.6% 24.2% 38.8% 57.0%RORO Terminal Operations 11.4% 14.0% 19.3% 30.3%Integrated Operations 14.6% 19.0% 30.0% 48.4%
Vessel Operations 16.3% 20.4% 27.8% 36.6%RORO Terminal Operations 9.7% 11.1% 16.0% 23.3%Integrated Operations 12.7% 15.7% 22.9% 32.5%
Vessel Operations 8.9% 9.2% 25.5% 32.4%RORO Terminal Operations 8.0% 8.1% 14.9% 21.0%Integrated Operations 8.4% 8.7% 21.2% 29.1%
20% diversion down to 15% diversion
20% diversion, no induced traffic
15% diversion, no induced traffic
base case
Pilar-Aroroy Cawayan-Daan Bantayan
Meanwhile, on the cost side, the analysis shows that project profitability, as measured by the FIRR on all capital before income tax, is very sensitive to increases in investment cost for vessel operations but not for terminal operations (Table 16). This is probably because of the latter’s longer economic life. With NPV as the criterion, of course, a 10% increase in terminal investment cost would still mean millions of pesos in added losses.
Table 16. Sensitivity Analysis: Exceeding Investment Cost Estimates
All Capital Equity All Capital Equity
Vessel Operations 21.4% 30.9% 41.3% 62.9%RORO Terminal Operations 13.4% 17.5% 20.7% 33.1%Integrated Operations 16.6% 23.4% 31.6% 52.9%
Vessel Operations 20.0% 27.0% 39.3% 56.4%RORO Terminal Operations 12.4% 15.7% 19.5% 30.1%Integrated Operations 15.4% 20.8% 29.9% 47.7%
Vessel Operations 18.8% 24.2% 37.5% 51.5%RORO Terminal Operations 11.6% 14.2% 18.4% 27.5%Integrated Operations 14.4% 18.7% 28.4% 43.6%
10% increase in investment cost
20% increase in investment cost
Pilar-Aroroy Cawayan-Daan Bantayan
base case
Risk Assessment and Mitigating Measures The risk assessment matrix presented in Table 17 below enumerates the
different kinds of risks faced by the project and the risk-mitigating measures. Note that the list is not exhaustive, but is still a good approximation of the possible circumstances that may pose a threat to project viability.
53
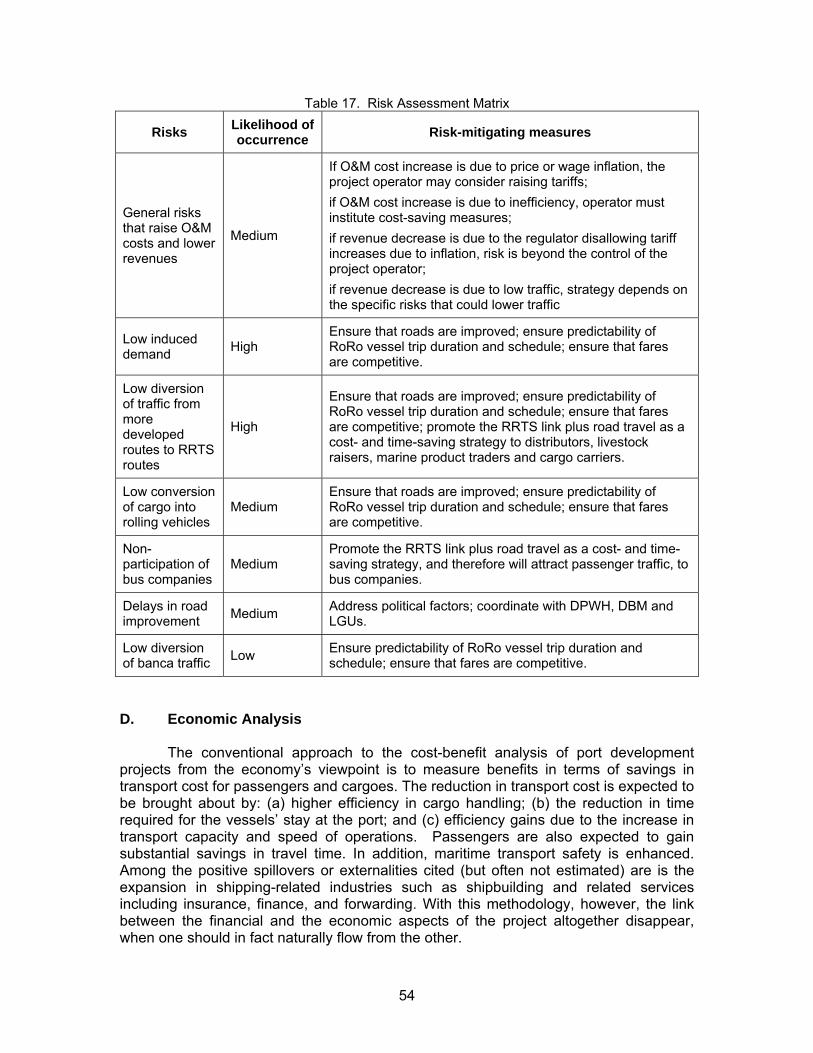
Table 17. Risk Assessment Matrix
Risks Likelihood of occurrence Risk-mitigating measures
General risks that raise O&M costs and lower revenues
Medium
If O&M cost increase is due to price or wage inflation, the project operator may consider raising tariffs; if O&M cost increase is due to inefficiency, operator must institute cost-saving measures; if revenue decrease is due to the regulator disallowing tariff increases due to inflation, risk is beyond the control of the project operator; if revenue decrease is due to low traffic, strategy depends on the specific risks that could lower traffic
Low induced demand High
Ensure that roads are improved; ensure predictability of RoRo vessel trip duration and schedule; ensure that fares are competitive.
Low diversion of traffic from more developed routes to RRTS routes
High
Ensure that roads are improved; ensure predictability of RoRo vessel trip duration and schedule; ensure that fares are competitive; promote the RRTS link plus road travel as a cost- and time-saving strategy to distributors, livestock raisers, marine product traders and cargo carriers.
Low conversion of cargo into rolling vehicles
Medium Ensure that roads are improved; ensure predictability of RoRo vessel trip duration and schedule; ensure that fares are competitive.
Non-participation of bus companies
Medium Promote the RRTS link plus road travel as a cost- and time-saving strategy, and therefore will attract passenger traffic, to bus companies.
Delays in road improvement Medium Address political factors; coordinate with DPWH, DBM and
LGUs.
Low diversion of banca traffic Low Ensure predictability of RoRo vessel trip duration and
schedule; ensure that fares are competitive.
D. Economic Analysis The conventional approach to the cost-benefit analysis of port development projects from the economy’s viewpoint is to measure benefits in terms of savings in transport cost for passengers and cargoes. The reduction in transport cost is expected to be brought about by: (a) higher efficiency in cargo handling; (b) the reduction in time required for the vessels’ stay at the port; and (c) efficiency gains due to the increase in transport capacity and speed of operations. Passengers are also expected to gain substantial savings in travel time. In addition, maritime transport safety is enhanced. Among the positive spillovers or externalities cited (but often not estimated) are is the expansion in shipping-related industries such as shipbuilding and related services including insurance, finance, and forwarding. With this methodology, however, the link between the financial and the economic aspects of the project altogether disappear, when one should in fact naturally flow from the other.
54
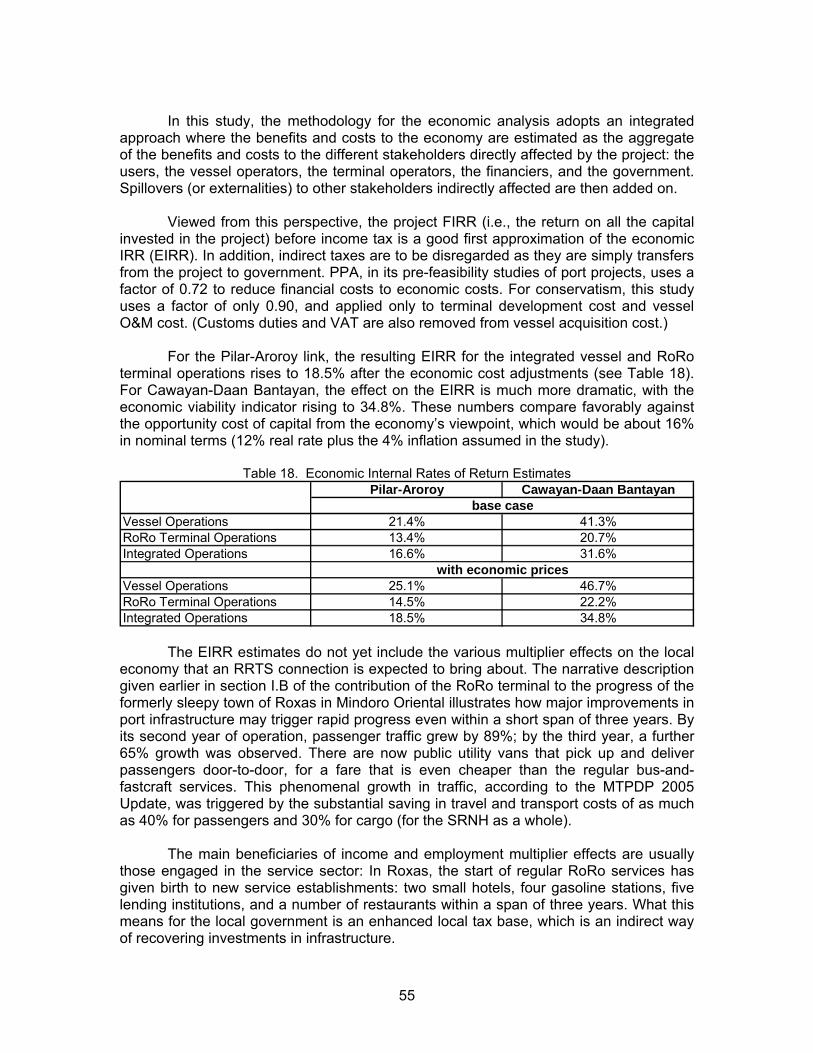
In this study, the methodology for the economic analysis adopts an integrated approach where the benefits and costs to the economy are estimated as the aggregate of the benefits and costs to the different stakeholders directly affected by the project: the users, the vessel operators, the terminal operators, the financiers, and the government. Spillovers (or externalities) to other stakeholders indirectly affected are then added on. Viewed from this perspective, the project FIRR (i.e., the return on all the capital invested in the project) before income tax is a good first approximation of the economic IRR (EIRR). In addition, indirect taxes are to be disregarded as they are simply transfers from the project to government. PPA, in its pre-feasibility studies of port projects, uses a factor of 0.72 to reduce financial costs to economic costs. For conservatism, this study uses a factor of only 0.90, and applied only to terminal development cost and vessel O&M cost. (Customs duties and VAT are also removed from vessel acquisition cost.)
For the Pilar-Aroroy link, the resulting EIRR for the integrated vessel and RoRo terminal operations rises to 18.5% after the economic cost adjustments (see Table 18). For Cawayan-Daan Bantayan, the effect on the EIRR is much more dramatic, with the economic viability indicator rising to 34.8%. These numbers compare favorably against the opportunity cost of capital from the economy’s viewpoint, which would be about 16% in nominal terms (12% real rate plus the 4% inflation assumed in the study).
Table 18. Economic Internal Rates of Return Estimates Pilar-Aroroy Cawayan-Daan Bantayan
Vessel Operations 21.4% 41.3%RoRo Terminal Operations 13.4% 20.7%Integrated Operations 16.6% 31.6%
Vessel Operations 25.1% 46.7%RoRo Terminal Operations 14.5% 22.2%Integrated Operations 18.5% 34.8%
base case
with economic prices
The EIRR estimates do not yet include the various multiplier effects on the local economy that an RRTS connection is expected to bring about. The narrative description given earlier in section I.B of the contribution of the RoRo terminal to the progress of the formerly sleepy town of Roxas in Mindoro Oriental illustrates how major improvements in port infrastructure may trigger rapid progress even within a short span of three years. By its second year of operation, passenger traffic grew by 89%; by the third year, a further 65% growth was observed. There are now public utility vans that pick up and deliver passengers door-to-door, for a fare that is even cheaper than the regular bus-and-fastcraft services. This phenomenal growth in traffic, according to the MTPDP 2005 Update, was triggered by the substantial saving in travel and transport costs of as much as 40% for passengers and 30% for cargo (for the SRNH as a whole).
The main beneficiaries of income and employment multiplier effects are usually those engaged in the service sector: In Roxas, the start of regular RoRo services has given birth to new service establishments: two small hotels, four gasoline stations, five lending institutions, and a number of restaurants within a span of three years. What this means for the local government is an enhanced local tax base, which is an indirect way of recovering investments in infrastructure.
55
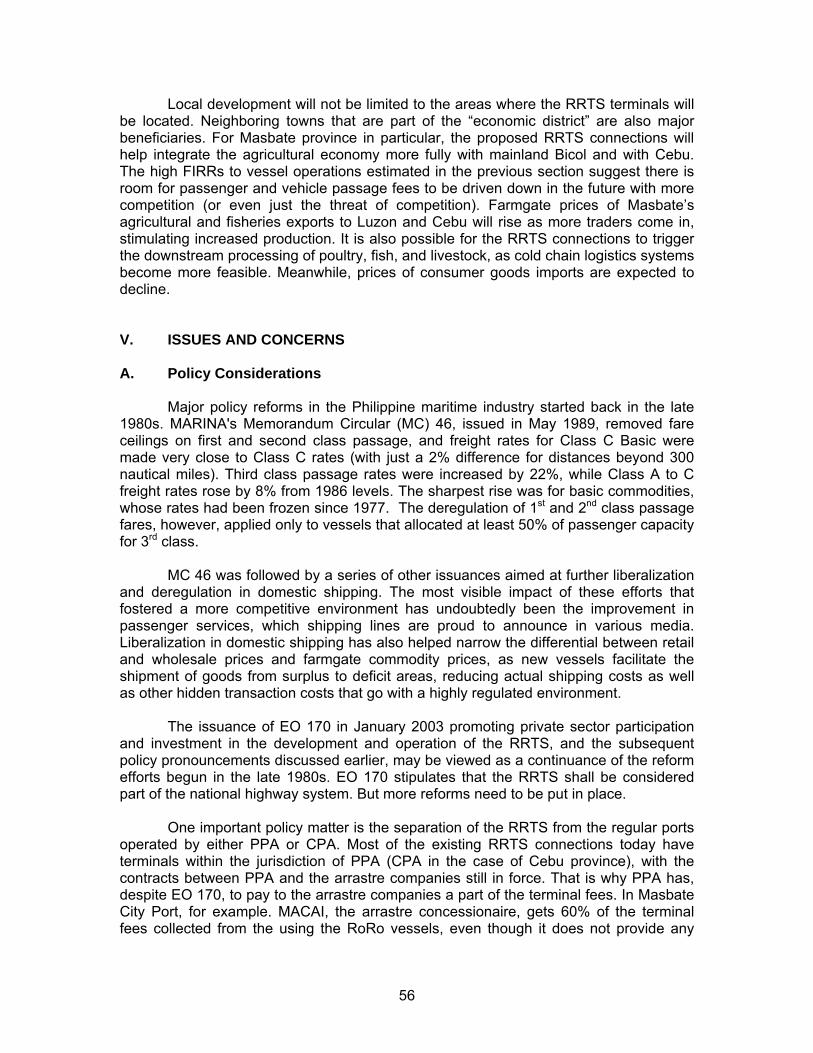
Local development will not be limited to the areas where the RRTS terminals will be located. Neighboring towns that are part of the “economic district” are also major beneficiaries. For Masbate province in particular, the proposed RRTS connections will help integrate the agricultural economy more fully with mainland Bicol and with Cebu. The high FIRRs to vessel operations estimated in the previous section suggest there is room for passenger and vehicle passage fees to be driven down in the future with more competition (or even just the threat of competition). Farmgate prices of Masbate’s agricultural and fisheries exports to Luzon and Cebu will rise as more traders come in, stimulating increased production. It is also possible for the RRTS connections to trigger the downstream processing of poultry, fish, and livestock, as cold chain logistics systems become more feasible. Meanwhile, prices of consumer goods imports are expected to decline.
V. ISSUES AND CONCERNS A. Policy Considerations Major policy reforms in the Philippine maritime industry started back in the late 1980s. MARINA's Memorandum Circular (MC) 46, issued in May 1989, removed fare ceilings on first and second class passage, and freight rates for Class C Basic were made very close to Class C rates (with just a 2% difference for distances beyond 300 nautical miles). Third class passage rates were increased by 22%, while Class A to C freight rates rose by 8% from 1986 levels. The sharpest rise was for basic commodities, whose rates had been frozen since 1977. The deregulation of 1st and 2nd class passage fares, however, applied only to vessels that allocated at least 50% of passenger capacity for 3rd class. MC 46 was followed by a series of other issuances aimed at further liberalization and deregulation in domestic shipping. The most visible impact of these efforts that fostered a more competitive environment has undoubtedly been the improvement in passenger services, which shipping lines are proud to announce in various media. Liberalization in domestic shipping has also helped narrow the differential between retail and wholesale prices and farmgate commodity prices, as new vessels facilitate the shipment of goods from surplus to deficit areas, reducing actual shipping costs as well as other hidden transaction costs that go with a highly regulated environment. The issuance of EO 170 in January 2003 promoting private sector participation and investment in the development and operation of the RRTS, and the subsequent policy pronouncements discussed earlier, may be viewed as a continuance of the reform efforts begun in the late 1980s. EO 170 stipulates that the RRTS shall be considered part of the national highway system. But more reforms need to be put in place.
One important policy matter is the separation of the RRTS from the regular ports operated by either PPA or CPA. Most of the existing RRTS connections today have terminals within the jurisdiction of PPA (CPA in the case of Cebu province), with the contracts between PPA and the arrastre companies still in force. That is why PPA has, despite EO 170, to pay to the arrastre companies a part of the terminal fees. In Masbate City Port, for example. MACAI, the arrastre concessionaire, gets 60% of the terminal fees collected from the using the RoRo vessels, even though it does not provide any
56
services. Even in some of the LGUs terminals under the RRTS, exorbitant charges for use of the port area is often applied.
To be able to implement the intentions of EO 170, it is crucial that the RRTS is to be looked at differently from the regular shipping and port operations. There should be no cargo handing in the RRTS; only the terminal fee and the passage fee have to be paid for so that the seamless travel for vehicles can be achieved. It should not be a problem for the terminal operator to charge for both payments at the entrance of the terminal in a one-stop booth. But such a one-stop booth is nowhere to be seen in any of the RRTS terminals. For both passenger and vehicle, one has to pay for entering the terminal and pay again separately for the passage.
An important step towards the creation of a truly nautical highway is to relieve both MARINA and PPA of the overall responsibility over the RRTS. Under AO 123 passed in 2005, the President instructed DOTC to establish and chair a board with representatives of various government agencies, like DTI, DPWH, and DBP, together with private sector representatives (PCCI) to map out the details of implementing the RRTS. MARINA and PPA, however, dominate the board, which does not look promising for significant changes to be effected for the present RRTS system.
A separate regulatory body (a “Nautical Highway Regulatory Board” or NHRB) is
perhaps needed to implement the RRTS concept. EO 170 says that the RRTS shall be considered as part of the national highways. It is therefore natural that DPWH should be given a clear mandate within the NHRB and take a leading role in developing the RRTS. MARINA’s role should simply be to assure the riding public that the RoRo vessels are seaworthy and safe while the PPA should confine its role to leasing out the terminals to private operators. On the other hand, NHRB should take on the responsibility to develop the “bridge foundations,” or the RoRo facilities in the ports and terminals, where the ferry operators can lease the facilities from NHRB for their own purposes. DOTC is by law the agency mandated to oversee and regulate the flow of vehicular and passenger traffic. The NHRB would not interfere with this mandate, but would merely put the “roads and ferry bridges” in place for the traveling public.
The NHRB would oversee the RRTS connections both in terms of service quality, including frequencies of trips and prices. It would be bidding out the various connections. MARINA’s role would be to ensure the seaworthiness and safety of the vessels. PPA, meanwhile, would lease out the proper areas of its ports to NHRB; these areas should be dedicated to RRTS operations and outside PPA jurisdiction. NHRB would then bid out the operation through a re-lease agreement from NHRB. The same procedure could be applied to privately owned ports.
RRTS links (“ferry bridges”) are of course only as good as the roads that they connect. DPWH is responsible for national roads while the provinces and municipalities are responsible for provincial and municipal roads. This could be the case also under the RRTS. The NHRB should see to it that the provinces are establishing their own “boards” and cooperate with NHRB for RRTS links not connecting national roads. Likewise, the provincial “board” should make the concerned municipalities do the same. This “board” need not be an added layer in the local bureaucracy. It could be an existing committee within the present setup assigned the RRTS supervision functions. NHRB would have overall responsibility for the system, but this will enable a smooth cooperation between the NHRB and the LGUs in the development of the RRTS.
57
The NHRB may be a novel concept in the Philippine setting, but it is the accepted
practice in many European countries. In this country, new legislation may be needed for it to be institutionalized. Under the present legal and regulatory framework, it would be difficult to implement a truly functional RRTS scheme and avail of the efficiency gains that the RRTS would bring about.
Nevertheless, before such a regime is put in place, policies of MARINA and PPA
could be aligned to the concept through AO 123. DPWH should also be more active in the formulation of implementing guidelines for the RRTS, as this agency is after all the one responsible for the road component of the system. B. Implementation Concerns
In the earlier discussion on the financial aspects, it has been pointed out that while vessel operations appear to be much more lucrative than terminal operations, for any given route, the two activities are really interdependent: one cannot operate without the other. Under the current institutional setup, however, vessel operations are the concern of the private sector while most RoRo-capable ports are run by either PPA or the local governments. It is therefore often the case that financially and economically viable investment opportunities fail to be realized because of institutional constraints. A given route with strong market potential is not provided RoRo services because there is no existing mechanism by which vessel and terminal operations could function as an integrated enterprise.
For the cases at hand, all the four local governments (Pilar, Aroroy, Cawayan,
and Daan Bantayan) express the desire to invest in RoRo terminals, but tight fiscal positions coupled with the difficulty of having two local governments at either end of a potential connection coordinate with each other have kept the investment opportunities from materializing. There is also the hope among LGUs that the national government through the PPA would come in to support their port development. Already, PPA has allocated funds for Cawayan and has included Pilar and Aroroy in its port development plan (with RoRo facilities), while the Cebu provincial government has committed to assist Daan Bantayan.
The role, then, of this study has been to show that these investments are indeed
financially and economically worthwhile, even in the context of the new RRTS paradigm whereby there would be facilities dedicated to RoRo operations that do away with those arrastre charges for services that are not even needed. The common fear among regular port operators used to the old system of charges is that port revenues would fall with the RRTS. But the more efficient services that a true RRTS brings about would engender an increase in the flow of passenger and vehicle traffic using the terminal that may more than make up for lost revenues due to lower charges. Indirectly as well, more traffic brings more business to the local community, and more business means more tax and non-tax revenues for the local government.
At the same time, an implication flowing from the financial analysis is that, in the
absence of any port or terminal development that dedicates a ramp for RoRo services, it would pay for the vessel operators to invest in the facilities themselves. The present policy environment allows this arrangement, as both PPA and local governments have the mandate to engage the private sector in long-term concession agreements. The
58
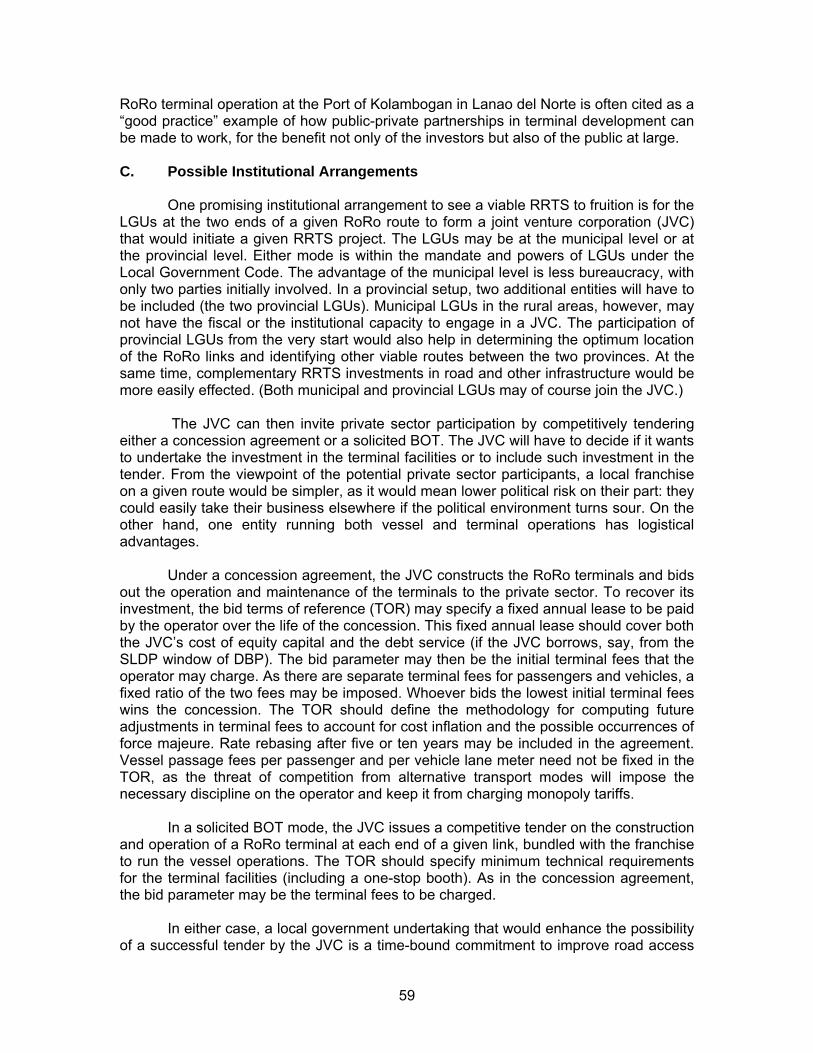
RoRo terminal operation at the Port of Kolambogan in Lanao del Norte is often cited as a “good practice” example of how public-private partnerships in terminal development can be made to work, for the benefit not only of the investors but also of the public at large. C. Possible Institutional Arrangements
One promising institutional arrangement to see a viable RRTS to fruition is for the LGUs at the two ends of a given RoRo route to form a joint venture corporation (JVC) that would initiate a given RRTS project. The LGUs may be at the municipal level or at the provincial level. Either mode is within the mandate and powers of LGUs under the Local Government Code. The advantage of the municipal level is less bureaucracy, with only two parties initially involved. In a provincial setup, two additional entities will have to be included (the two provincial LGUs). Municipal LGUs in the rural areas, however, may not have the fiscal or the institutional capacity to engage in a JVC. The participation of provincial LGUs from the very start would also help in determining the optimum location of the RoRo links and identifying other viable routes between the two provinces. At the same time, complementary RRTS investments in road and other infrastructure would be more easily effected. (Both municipal and provincial LGUs may of course join the JVC.)
The JVC can then invite private sector participation by competitively tendering
either a concession agreement or a solicited BOT. The JVC will have to decide if it wants to undertake the investment in the terminal facilities or to include such investment in the tender. From the viewpoint of the potential private sector participants, a local franchise on a given route would be simpler, as it would mean lower political risk on their part: they could easily take their business elsewhere if the political environment turns sour. On the other hand, one entity running both vessel and terminal operations has logistical advantages.
Under a concession agreement, the JVC constructs the RoRo terminals and bids
out the operation and maintenance of the terminals to the private sector. To recover its investment, the bid terms of reference (TOR) may specify a fixed annual lease to be paid by the operator over the life of the concession. This fixed annual lease should cover both the JVC’s cost of equity capital and the debt service (if the JVC borrows, say, from the SLDP window of DBP). The bid parameter may then be the initial terminal fees that the operator may charge. As there are separate terminal fees for passengers and vehicles, a fixed ratio of the two fees may be imposed. Whoever bids the lowest initial terminal fees wins the concession. The TOR should define the methodology for computing future adjustments in terminal fees to account for cost inflation and the possible occurrences of force majeure. Rate rebasing after five or ten years may be included in the agreement. Vessel passage fees per passenger and per vehicle lane meter need not be fixed in the TOR, as the threat of competition from alternative transport modes will impose the necessary discipline on the operator and keep it from charging monopoly tariffs.
In a solicited BOT mode, the JVC issues a competitive tender on the construction
and operation of a RoRo terminal at each end of a given link, bundled with the franchise to run the vessel operations. The TOR should specify minimum technical requirements for the terminal facilities (including a one-stop booth). As in the concession agreement, the bid parameter may be the terminal fees to be charged.
In either case, a local government undertaking that would enhance the possibility
of a successful tender by the JVC is a time-bound commitment to improve road access
59
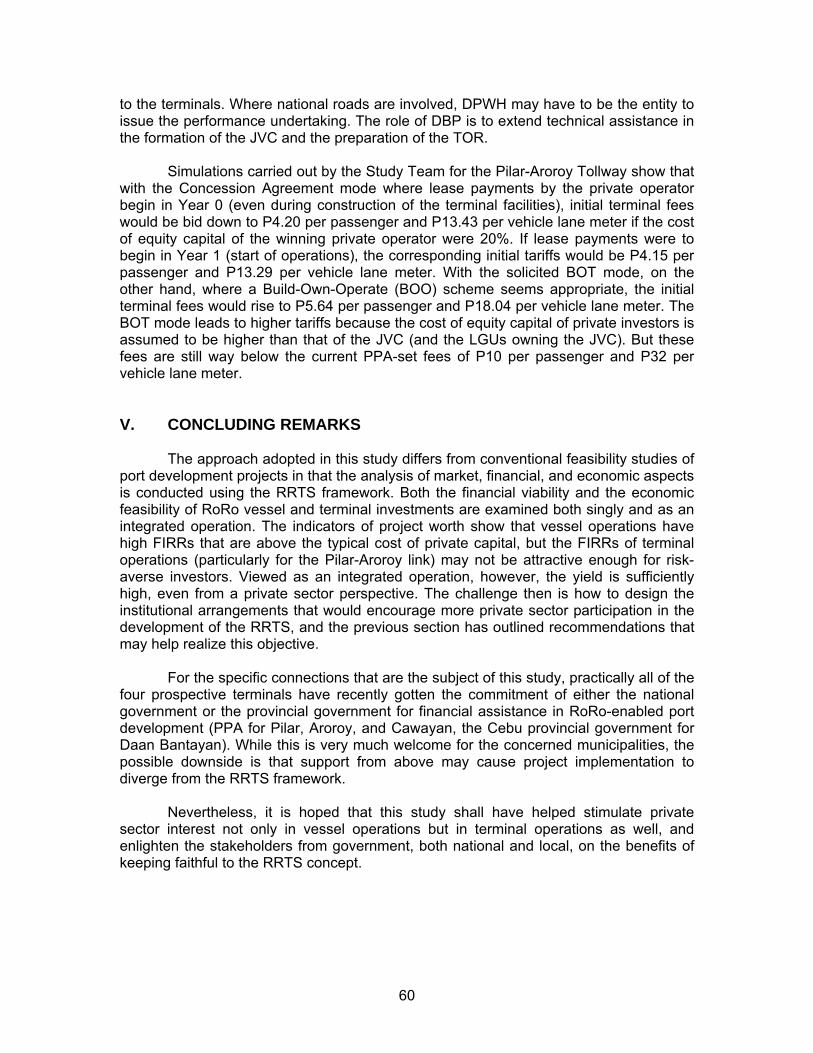
to the terminals. Where national roads are involved, DPWH may have to be the entity to issue the performance undertaking. The role of DBP is to extend technical assistance in the formation of the JVC and the preparation of the TOR.
Simulations carried out by the Study Team for the Pilar-Aroroy Tollway show that
with the Concession Agreement mode where lease payments by the private operator begin in Year 0 (even during construction of the terminal facilities), initial terminal fees would be bid down to P4.20 per passenger and P13.43 per vehicle lane meter if the cost of equity capital of the winning private operator were 20%. If lease payments were to begin in Year 1 (start of operations), the corresponding initial tariffs would be P4.15 per passenger and P13.29 per vehicle lane meter. With the solicited BOT mode, on the other hand, where a Build-Own-Operate (BOO) scheme seems appropriate, the initial terminal fees would rise to P5.64 per passenger and P18.04 per vehicle lane meter. The BOT mode leads to higher tariffs because the cost of equity capital of private investors is assumed to be higher than that of the JVC (and the LGUs owning the JVC). But these fees are still way below the current PPA-set fees of P10 per passenger and P32 per vehicle lane meter.
V. CONCLUDING REMARKS The approach adopted in this study differs from conventional feasibility studies of port development projects in that the analysis of market, financial, and economic aspects is conducted using the RRTS framework. Both the financial viability and the economic feasibility of RoRo vessel and terminal investments are examined both singly and as an integrated operation. The indicators of project worth show that vessel operations have high FIRRs that are above the typical cost of private capital, but the FIRRs of terminal operations (particularly for the Pilar-Aroroy link) may not be attractive enough for risk-averse investors. Viewed as an integrated operation, however, the yield is sufficiently high, even from a private sector perspective. The challenge then is how to design the institutional arrangements that would encourage more private sector participation in the development of the RRTS, and the previous section has outlined recommendations that may help realize this objective. For the specific connections that are the subject of this study, practically all of the four prospective terminals have recently gotten the commitment of either the national government or the provincial government for financial assistance in RoRo-enabled port development (PPA for Pilar, Aroroy, and Cawayan, the Cebu provincial government for Daan Bantayan). While this is very much welcome for the concerned municipalities, the possible downside is that support from above may cause project implementation to diverge from the RRTS framework. Nevertheless, it is hoped that this study shall have helped stimulate private sector interest not only in vessel operations but in terminal operations as well, and enlighten the stakeholders from government, both national and local, on the benefits of keeping faithful to the RRTS concept.
60
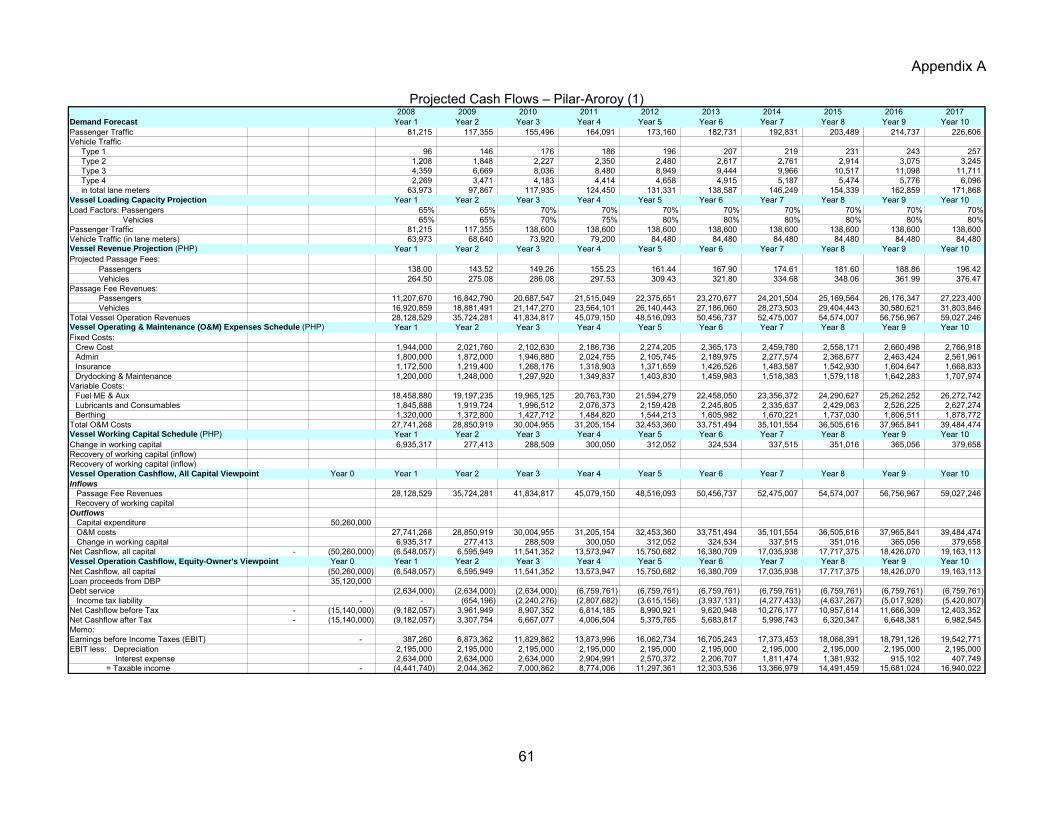
Appendix A
Projected Cash Flows – Pilar-Aroroy (1) 2008 2009 2010 2011 2012 2013 2014 2015 2016 2017
Demand Forecast Year 1 Year 2 Year 3 Year 4 Year 5 Year 6 Year 7 Year 8 Year 9 Year 10Passenger Traffic 81,215 117,355 155,496 164,091 173,160 182,731 192,831 203,489 214,737 226,606 Vehicle Traffic
Type 1 96 146 176 186 196 207 219 231 243 257 Type 2 1,208 1,848 2,227 2,350 2,480 2,617 2,761 2,914 3,075 3,245 Type 3 4,359 6,669 8,036 8,480 8,949 9,444 9,966 10,517 11,098 11,711 Type 4 2,269 3,471 4,183 4,414 4,658 4,915 5,187 5,474 5,776 6,096 in total lane meters 63,973 97,867 117,935 124,450 131,331 138,587 146,249 154,339 162,859 171,868
Vessel Loading Capacity Projection Year 1 Year 2 Year 3 Year 4 Year 5 Year 6 Year 7 Year 8 Year 9 Year 10Load Factors: Passengers 65% 65% 70% 70% 70% 70% 70% 70% 70% 70%
Vehicles 65% 65% 70% 75% 80% 80% 80% 80% 80% 80%Passenger Traffic 81,215 117,355 138,600 138,600 138,600 138,600 138,600 138,600 138,600 138,600 Vehicle Traffic (in lane meters) 63,973 68,640 73,920 79,200 84,480 84,480 84,480 84,480 84,480 84,480 Vessel Revenue Projection (PHP) Year 1 Year 2 Year 3 Year 4 Year 5 Year 6 Year 7 Year 8 Year 9 Year 10Projected Passage Fees:
Passengers 138.00 143.52 149.26 155.23 161.44 167.90 174.61 181.60 188.86 196.42 Vehicles 264.50 275.08 286.08 297.53 309.43 321.80 334.68 348.06 361.99 376.47
Passage Fee Revenues:Passengers 11,207,670 16,842,790 20,687,547 21,515,049 22,375,651 23,270,677 24,201,504 25,169,564 26,176,347 27,223,400 Vehicles 16,920,859 18,881,491 21,147,270 23,564,101 26,140,443 27,186,060 28,273,503 29,404,443 30,580,621 31,803,846
Total Vessel Operation Revenues 28,128,529 35,724,281 41,834,817 45,079,150 48,516,093 50,456,737 52,475,007 54,574,007 56,756,967 59,027,246 Vessel Operating & Maintenance (O&M) Expenses Schedule (PHP) Year 1 Year 2 Year 3 Year 4 Year 5 Year 6 Year 7 Year 8 Year 9 Year 10Fixed Costs:
Crew Cost 1,944,000 2,021,760 2,102,630 2,186,736 2,274,205 2,365,173 2,459,780 2,558,171 2,660,498 2,766,918 Admin 1,800,000 1,872,000 1,946,880 2,024,755 2,105,745 2,189,975 2,277,574 2,368,677 2,463,424 2,561,961 Insurance 1,172,500 1,219,400 1,268,176 1,318,903 1,371,659 1,426,526 1,483,587 1,542,930 1,604,647 1,668,833 Drydocking & Maintenance 1,200,000 1,248,000 1,297,920 1,349,837 1,403,830 1,459,983 1,518,383 1,579,118 1,642,283 1,707,974
Variable Costs:Fuel ME & Aux 18,458,880 19,197,235 19,965,125 20,763,730 21,594,279 22,458,050 23,356,372 24,290,627 25,262,252 26,272,742 Lubricants and Consumables 1,845,888 1,919,724 1,996,512 2,076,373 2,159,428 2,245,805 2,335,637 2,429,063 2,526,225 2,627,274 Berthing 1,320,000 1,372,800 1,427,712 1,484,820 1,544,213 1,605,982 1,670,221 1,737,030 1,806,511 1,878,772
Total O&M Costs 27,741,268 28,850,919 30,004,955 31,205,154 32,453,360 33,751,494 35,101,554 36,505,616 37,965,841 39,484,474 Vessel Working Capital Schedule (PHP) Year 1 Year 2 Year 3 Year 4 Year 5 Year 6 Year 7 Year 8 Year 9 Year 10Change in working capital 6,935,317 277,413 288,509 300,050 312,052 324,534 337,515 351,016 365,056 379,658 Recovery of working capital (inflow)Recovery of working capital (inflow)Vessel Operation Cashflow, All Capital Viewpoint Year 0 Year 1 Year 2 Year 3 Year 4 Year 5 Year 6 Year 7 Year 8 Year 9 Year 10Inflows Passage Fee Revenues 28,128,529 35,724,281 41,834,817 45,079,150 48,516,093 50,456,737 52,475,007 54,574,007 56,756,967 59,027,246
Recovery of working capitalOutflows Capital expenditure 50,260,000 O&M costs 27,741,268 28,850,919 30,004,955 31,205,154 32,453,360 33,751,494 35,101,554 36,505,616 37,965,841 39,484,474 Change in working capital 6,935,317 277,413 288,509 300,050 312,052 324,534 337,515 351,016 365,056 379,658 Net Cashflow, all capital - (50,260,000) (6,548,057) 6,595,949 11,541,352 13,573,947 15,750,682 16,380,709 17,035,938 17,717,375 18,426,070 19,163,113 Vessel Operation Cashflow, Equity-Owner's Viewpoint Year 0 Year 1 Year 2 Year 3 Year 4 Year 5 Year 6 Year 7 Year 8 Year 9 Year 10Net Cashflow, all capital (50,260,000) (6,548,057) 6,595,949 11,541,352 13,573,947 15,750,682 16,380,709 17,035,938 17,717,375 18,426,070 19,163,113 Loan proceeds from DBP 35,120,000 Debt service (2,634,000) (2,634,000) (2,634,000) (6,759,761) (6,759,761) (6,759,761) (6,759,761) (6,759,761) (6,759,761) (6,759,761) Income tax liability - - (654,196) (2,240,276) (2,807,682) (3,615,156) (3,937,131) (4,277,433) (4,637,267) (5,017,928) (5,420,807) Net Cashflow before Tax - (15,140,000) (9,182,057) 3,961,949 8,907,352 6,814,185 8,990,921 9,620,948 10,276,177 10,957,614 11,666,309 12,403,352 Net Cashflow after Tax - (15,140,000) (9,182,057) 3,307,754 6,667,077 4,006,504 5,375,765 5,683,817 5,998,743 6,320,347 6,648,381 6,982,545 Memo:Earnings before Income Taxes (EBIT) - 387,260 6,873,362 11,829,862 13,873,996 16,062,734 16,705,243 17,373,453 18,068,391 18,791,126 19,542,771 EBIT less: Depreciation 2,195,000 2,195,000 2,195,000 2,195,000 2,195,000 2,195,000 2,195,000 2,195,000 2,195,000 2,195,000 Interest expense 2,634,000 2,634,000 2,634,000 2,904,991 2,570,372 2,206,707 1,811,474 1,381,932 915,102 407,749 = Taxable income - (4,441,740) 2,044,362 7,000,862 8,774,006 11,297,361 12,303,536 13,366,979 14,491,459 15,681,024 16,940,022
61
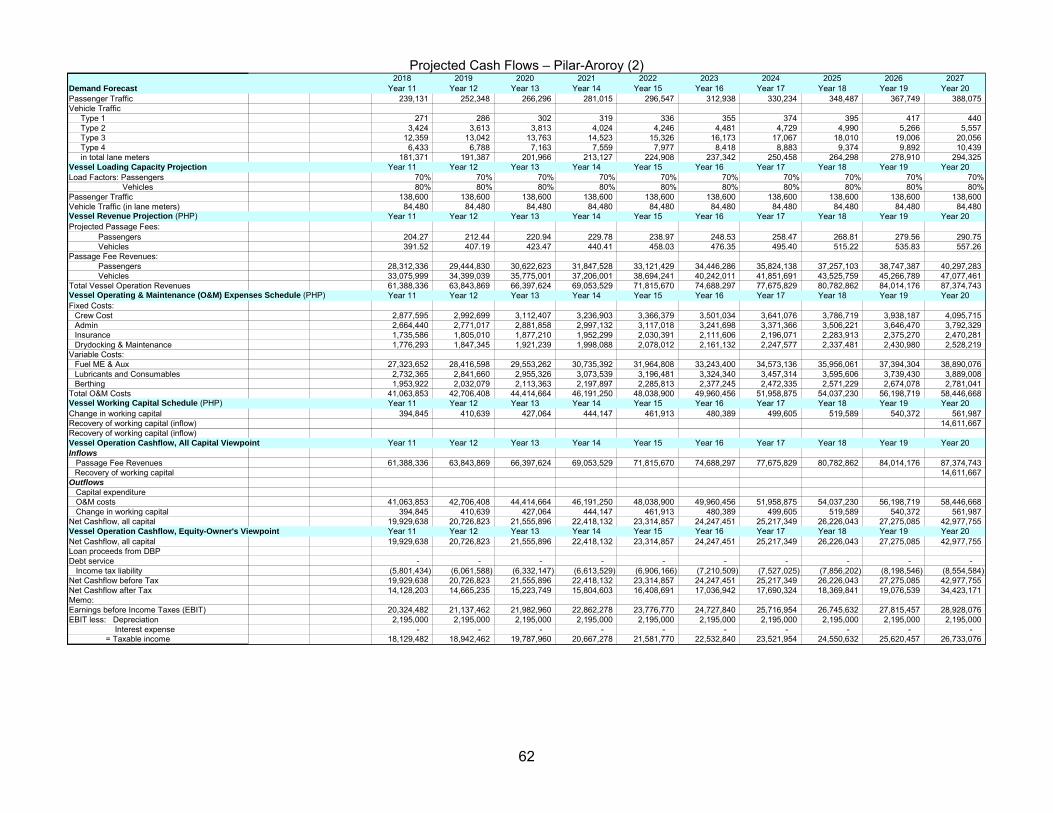
Projected Cash Flows – Pilar-Aroroy (2) 2018 2019 2020 2021 2022 2023 2024 2025 2026 2027
Demand Forecast Year 11 Year 12 Year 13 Year 14 Year 15 Year 16 Year 17 Year 18 Year 19 Year 20Passenger Traffic 239,131 252,348 266,296 281,015 296,547 312,938 330,234 348,487 367,749 388,075 Vehicle Traffic
Type 1 271 286 302 319 336 355 374 395 417 440 Type 2 3,424 3,613 3,813 4,024 4,246 4,481 4,729 4,990 5,266 5,557 Type 3 12,359 13,042 13,763 14,523 15,326 16,173 17,067 18,010 19,006 20,056 Type 4 6,433 6,788 7,163 7,559 7,977 8,418 8,883 9,374 9,892 10,439 in total lane meters 181,371 191,387 201,966 213,127 224,908 237,342 250,458 264,298 278,910 294,325
Vessel Loading Capacity Projection Year 11 Year 12 Year 13 Year 14 Year 15 Year 16 Year 17 Year 18 Year 19 Year 20Load Factors: Passengers 70% 70% 70% 70% 70% 70% 70% 70% 70% 70%
Vehicles 80% 80% 80% 80% 80% 80% 80% 80% 80% 80%Passenger Traffic 138,600 138,600 138,600 138,600 138,600 138,600 138,600 138,600 138,600 138,600 Vehicle Traffic (in lane meters) 84,480 84,480 84,480 84,480 84,480 84,480 84,480 84,480 84,480 84,480 Vessel Revenue Projection (PHP) Year 11 Year 12 Year 13 Year 14 Year 15 Year 16 Year 17 Year 18 Year 19 Year 20Projected Passage Fees:
Passengers 204.27 212.44 220.94 229.78 238.97 248.53 258.47 268.81 279.56 290.75 Vehicles 391.52 407.19 423.47 440.41 458.03 476.35 495.40 515.22 535.83 557.26
Passage Fee Revenues:Passengers 28,312,336 29,444,830 30,622,623 31,847,528 33,121,429 34,446,286 35,824,138 37,257,103 38,747,387 40,297,283 Vehicles 33,075,999 34,399,039 35,775,001 37,206,001 38,694,241 40,242,011 41,851,691 43,525,759 45,266,789 47,077,461
Total Vessel Operation Revenues 61,388,336 63,843,869 66,397,624 69,053,529 71,815,670 74,688,297 77,675,829 80,782,862 84,014,176 87,374,743 Vessel Operating & Maintenance (O&M) Expenses Schedule (PHP) Year 11 Year 12 Year 13 Year 14 Year 15 Year 16 Year 17 Year 18 Year 19 Year 20Fixed Costs:
Crew Cost 2,877,595 2,992,699 3,112,407 3,236,903 3,366,379 3,501,034 3,641,076 3,786,719 3,938,187 4,095,715 Admin 2,664,440 2,771,017 2,881,858 2,997,132 3,117,018 3,241,698 3,371,366 3,506,221 3,646,470 3,792,329 Insurance 1,735,586 1,805,010 1,877,210 1,952,299 2,030,391 2,111,606 2,196,071 2,283,913 2,375,270 2,470,281 Drydocking & Maintenance 1,776,293 1,847,345 1,921,239 1,998,088 2,078,012 2,161,132 2,247,577 2,337,481 2,430,980 2,528,219
Variable Costs:Fuel ME & Aux 27,323,652 28,416,598 29,553,262 30,735,392 31,964,808 33,243,400 34,573,136 35,956,061 37,394,304 38,890,076 Lubricants and Consumables 2,732,365 2,841,660 2,955,326 3,073,539 3,196,481 3,324,340 3,457,314 3,595,606 3,739,430 3,889,008 Berthing 1,953,922 2,032,079 2,113,363 2,197,897 2,285,813 2,377,245 2,472,335 2,571,229 2,674,078 2,781,041
Total O&M Costs 41,063,853 42,706,408 44,414,664 46,191,250 48,038,900 49,960,456 51,958,875 54,037,230 56,198,719 58,446,668 Vessel Working Capital Schedule (PHP) Year 11 Year 12 Year 13 Year 14 Year 15 Year 16 Year 17 Year 18 Year 19 Year 20Change in working capital 394,845 410,639 427,064 444,147 461,913 480,389 499,605 519,589 540,372 561,987 Recovery of working capital (inflow) 14,611,667 Recovery of working capital (inflow)Vessel Operation Cashflow, All Capital Viewpoint Year 11 Year 12 Year 13 Year 14 Year 15 Year 16 Year 17 Year 18 Year 19 Year 20Inflows Passage Fee Revenues 61,388,336 63,843,869 66,397,624 69,053,529 71,815,670 74,688,297 77,675,829 80,782,862 84,014,176 87,374,743
Recovery of working capital 14,611,667 Outflows Capital expenditure O&M costs 41,063,853 42,706,408 44,414,664 46,191,250 48,038,900 49,960,456 51,958,875 54,037,230 56,198,719 58,446,668 Change in working capital 394,845 410,639 427,064 444,147 461,913 480,389 499,605 519,589 540,372 561,987 Net Cashflow, all capital 19,929,638 20,726,823 21,555,896 22,418,132 23,314,857 24,247,451 25,217,349 26,226,043 27,275,085 42,977,755 Vessel Operation Cashflow, Equity-Owner's Viewpoint Year 11 Year 12 Year 13 Year 14 Year 15 Year 16 Year 17 Year 18 Year 19 Year 20Net Cashflow, all capital 19,929,638 20,726,823 21,555,896 22,418,132 23,314,857 24,247,451 25,217,349 26,226,043 27,275,085 42,977,755 Loan proceeds from DBPDebt service - - - - - - - - - - Income tax liability (5,801,434) (6,061,588) (6,332,147) (6,613,529) (6,906,166) (7,210,509) (7,527,025) (7,856,202) (8,198,546) (8,554,584) Net Cashflow before Tax 19,929,638 20,726,823 21,555,896 22,418,132 23,314,857 24,247,451 25,217,349 26,226,043 27,275,085 42,977,755 Net Cashflow after Tax 14,128,203 14,665,235 15,223,749 15,804,603 16,408,691 17,036,942 17,690,324 18,369,841 19,076,539 34,423,171 Memo:Earnings before Income Taxes (EBIT) 20,324,482 21,137,462 21,982,960 22,862,278 23,776,770 24,727,840 25,716,954 26,745,632 27,815,457 28,928,076 EBIT less: Depreciation 2,195,000 2,195,000 2,195,000 2,195,000 2,195,000 2,195,000 2,195,000 2,195,000 2,195,000 2,195,000 Interest expense - - - - - - - - - - = Taxable income 18,129,482 18,942,462 19,787,960 20,667,278 21,581,770 22,532,840 23,521,954 24,550,632 25,620,457 26,733,076
62
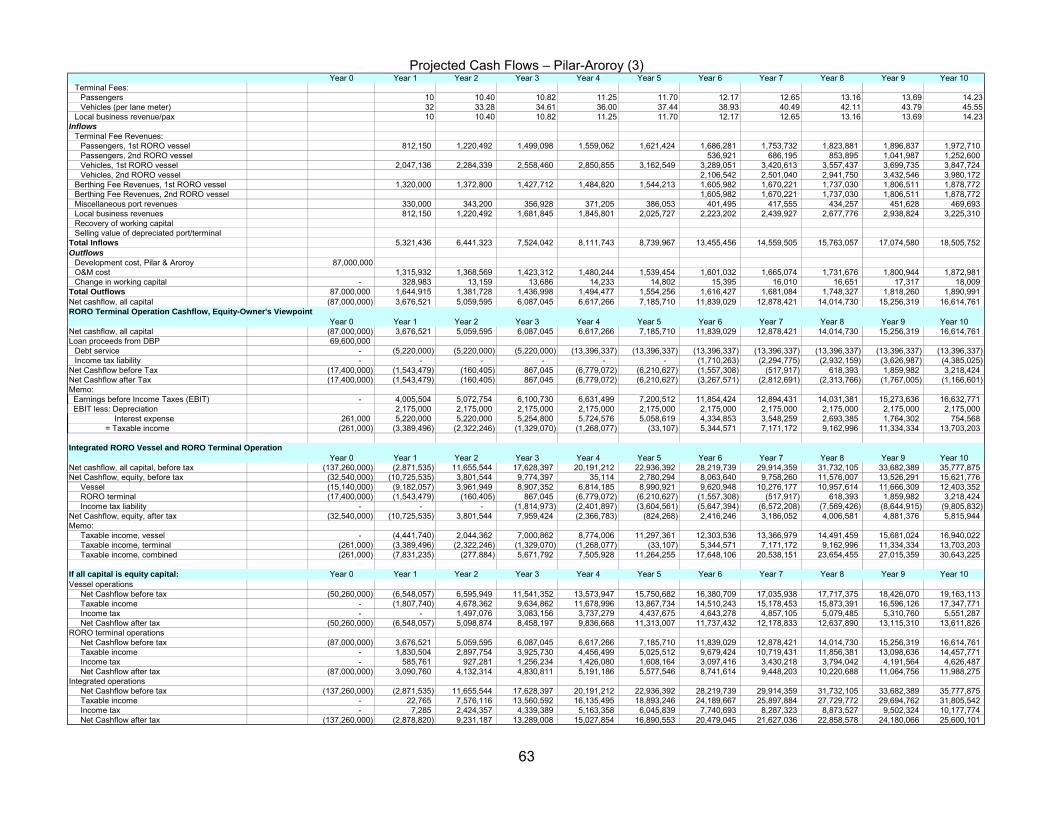
Projected Cash Flows – Pilar-Aroroy (3) Year 0 Year 1 Year 2 Year 3 Year 4 Year 5 Year 6 Year 7 Year 8 Year 9 Year 10
Terminal Fees:Passengers 10 10.40 10.82 11.25 11.70 12.17 12.65 13.16 13.69 14.23Vehicles (per lane meter) 32 33.28 34.61 36.00 37.44 38.93 40.49 42.11 43.79 45.55
Local business revenue/pax 10 10.40 10.82 11.25 11.70 12.17 12.65 13.16 13.69 14.23Inflows
Terminal Fee Revenues:Passengers, 1st RORO vessel 812,150 1,220,492 1,499,098 1,559,062 1,621,424 1,686,281 1,753,732 1,823,881 1,896,837 1,972,710 Passengers, 2nd RORO vessel 536,921 686,195 853,895 1,041,987 1,252,600 Vehicles, 1st RORO vessel 2,047,136 2,284,339 2,558,460 2,850,855 3,162,549 3,289,051 3,420,613 3,557,437 3,699,735 3,847,724 Vehicles, 2nd RORO vessel 2,106,542 2,501,040 2,941,750 3,432,546 3,980,172
Berthing Fee Revenues, 1st RORO vessel 1,320,000 1,372,800 1,427,712 1,484,820 1,544,213 1,605,982 1,670,221 1,737,030 1,806,511 1,878,772 Berthing Fee Revenues, 2nd RORO vessel 1,605,982 1,670,221 1,737,030 1,806,511 1,878,772 Miscellaneous port revenues 330,000 343,200 356,928 371,205 386,053 401,495 417,555 434,257 451,628 469,693 Local business revenues 812,150 1,220,492 1,681,845 1,845,801 2,025,727 2,223,202 2,439,927 2,677,776 2,938,824 3,225,310 Recovery of working capitalSelling value of depreciated port/terminal
Total Inflows 5,321,436 6,441,323 7,524,042 8,111,743 8,739,967 13,455,456 14,559,505 15,763,057 17,074,580 18,505,752 Outflows
Development cost, Pilar & Aroroy 87,000,000O&M cost 1,315,932 1,368,569 1,423,312 1,480,244 1,539,454 1,601,032 1,665,074 1,731,676 1,800,944 1,872,981 Change in working capital - 328,983 13,159 13,686 14,233 14,802 15,395 16,010 16,651 17,317 18,009
Total Outflows 87,000,000 1,644,915 1,381,728 1,436,998 1,494,477 1,554,256 1,616,427 1,681,084 1,748,327 1,818,260 1,890,991 Net cashflow, all capital (87,000,000) 3,676,521 5,059,595 6,087,045 6,617,266 7,185,710 11,839,029 12,878,421 14,014,730 15,256,319 16,614,761 RORO Terminal Operation Cashflow, Equity-Owner's Viewpoint
Year 0 Year 1 Year 2 Year 3 Year 4 Year 5 Year 6 Year 7 Year 8 Year 9 Year 10Net cashflow, all capital (87,000,000) 3,676,521 5,059,595 6,087,045 6,617,266 7,185,710 11,839,029 12,878,421 14,014,730 15,256,319 16,614,761 Loan proceeds from DBP 69,600,000
Debt service - (5,220,000) (5,220,000) (5,220,000) (13,396,337) (13,396,337) (13,396,337) (13,396,337) (13,396,337) (13,396,337) (13,396,337) Income tax liability - - - - - - (1,710,263) (2,294,775) (2,932,159) (3,626,987) (4,385,025)
Net Cashflow before Tax (17,400,000) (1,543,479) (160,405) 867,045 (6,779,072) (6,210,627) (1,557,308) (517,917) 618,393 1,859,982 3,218,424 Net Cashflow after Tax (17,400,000) (1,543,479) (160,405) 867,045 (6,779,072) (6,210,627) (3,267,571) (2,812,691) (2,313,766) (1,767,005) (1,166,601) Memo: Earnings before Income Taxes (EBIT) - 4,005,504 5,072,754 6,100,730 6,631,499 7,200,512 11,854,424 12,894,431 14,031,381 15,273,636 16,632,771 EBIT less: Depreciation 2,175,000 2,175,000 2,175,000 2,175,000 2,175,000 2,175,000 2,175,000 2,175,000 2,175,000 2,175,000 Interest expense 261,000 5,220,000 5,220,000 5,254,800 5,724,576 5,058,619 4,334,853 3,548,259 2,693,385 1,764,302 754,568 = Taxable income (261,000) (3,389,496) (2,322,246) (1,329,070) (1,268,077) (33,107) 5,344,571 7,171,172 9,162,996 11,334,334 13,703,203
Integrated RORO Vessel and RORO Terminal OperationYear 0 Year 1 Year 2 Year 3 Year 4 Year 5 Year 6 Year 7 Year 8 Year 9 Year 10
Net cashflow, all capital, before tax (137,260,000) (2,871,535) 11,655,544 17,628,397 20,191,212 22,936,392 28,219,739 29,914,359 31,732,105 33,682,389 35,777,875 Net Cashflow, equity, before tax (32,540,000) (10,725,535) 3,801,544 9,774,397 35,114 2,780,294 8,063,640 9,758,260 11,576,007 13,526,291 15,621,776
Vessel (15,140,000) (9,182,057) 3,961,949 8,907,352 6,814,185 8,990,921 9,620,948 10,276,177 10,957,614 11,666,309 12,403,352 RORO terminal (17,400,000) (1,543,479) (160,405) 867,045 (6,779,072) (6,210,627) (1,557,308) (517,917) 618,393 1,859,982 3,218,424 Income tax liability - - - (1,814,973) (2,401,897) (3,604,561) (5,647,394) (6,572,208) (7,569,426) (8,644,915) (9,805,832)
Net Cashflow, equity, after tax (32,540,000) (10,725,535) 3,801,544 7,959,424 (2,366,783) (824,268) 2,416,246 3,186,052 4,006,581 4,881,376 5,815,944 Memo:
Taxable income, vessel - (4,441,740) 2,044,362 7,000,862 8,774,006 11,297,361 12,303,536 13,366,979 14,491,459 15,681,024 16,940,022 Taxable income, terminal (261,000) (3,389,496) (2,322,246) (1,329,070) (1,268,077) (33,107) 5,344,571 7,171,172 9,162,996 11,334,334 13,703,203 Taxable income, combined (261,000) (7,831,235) (277,884) 5,671,792 7,505,928 11,264,255 17,648,106 20,538,151 23,654,455 27,015,359 30,643,225
If all capital is equity capital: Year 0 Year 1 Year 2 Year 3 Year 4 Year 5 Year 6 Year 7 Year 8 Year 9 Year 10Vessel operations
Net Cashflow before tax (50,260,000) (6,548,057) 6,595,949 11,541,352 13,573,947 15,750,682 16,380,709 17,035,938 17,717,375 18,426,070 19,163,113 Taxable income - (1,807,740) 4,678,362 9,634,862 11,678,996 13,867,734 14,510,243 15,178,453 15,873,391 16,596,126 17,347,771 Income tax - - 1,497,076 3,083,156 3,737,279 4,437,675 4,643,278 4,857,105 5,079,485 5,310,760 5,551,287 Net Cashflow after tax (50,260,000) (6,548,057) 5,098,874 8,458,197 9,836,668 11,313,007 11,737,432 12,178,833 12,637,890 13,115,310 13,611,826
RORO terminal operationsNet Cashflow before tax (87,000,000) 3,676,521 5,059,595 6,087,045 6,617,266 7,185,710 11,839,029 12,878,421 14,014,730 15,256,319 16,614,761 Taxable income - 1,830,504 2,897,754 3,925,730 4,456,499 5,025,512 9,679,424 10,719,431 11,856,381 13,098,636 14,457,771 Income tax - 585,761 927,281 1,256,234 1,426,080 1,608,164 3,097,416 3,430,218 3,794,042 4,191,564 4,626,487 Net Cashflow after tax (87,000,000) 3,090,760 4,132,314 4,830,811 5,191,186 5,577,546 8,741,614 9,448,203 10,220,688 11,064,756 11,988,275
Integrated operationsNet Cashflow before tax (137,260,000) (2,871,535) 11,655,544 17,628,397 20,191,212 22,936,392 28,219,739 29,914,359 31,732,105 33,682,389 35,777,875 Taxable income - 22,765 7,576,116 13,560,592 16,135,495 18,893,246 24,189,667 25,897,884 27,729,772 29,694,762 31,805,542 Income tax - 7,285 2,424,357 4,339,389 5,163,358 6,045,839 7,740,693 8,287,323 8,873,527 9,502,324 10,177,774 Net Cashflow after tax (137,260,000) (2,878,820) 9,231,187 13,289,008 15,027,854 16,890,553 20,479,045 21,627,036 22,858,578 24,180,066 25,600,101
63
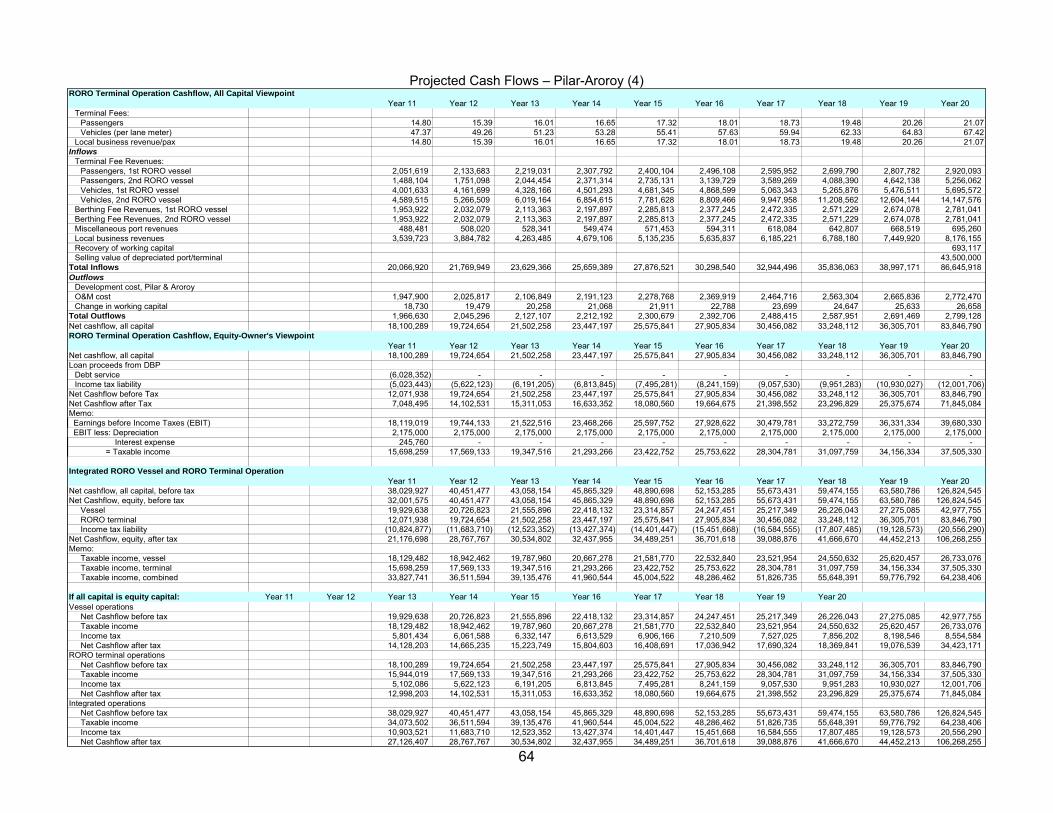
Projected Cash Flows – Pilar-Aroroy (4)
64
RORO Terminal Operation Cashflow, All Capital ViewpointYear 11 Year 12 Year 13 Year 14 Year 15 Year 16 Year 17 Year 18 Year 19 Year 20
Terminal Fees:Passengers 14.80 15.39 16.01 16.65 17.32 18.01 18.73 19.48 20.26 21.07Vehicles (per lane meter) 47.37 49.26 51.23 53.28 55.41 57.63 59.94 62.33 64.83 67.42
Local business revenue/pax 14.80 15.39 16.01 16.65 17.32 18.01 18.73 19.48 20.26 21.07Inflows
Terminal Fee Revenues:Passengers, 1st RORO vessel 2,051,619 2,133,683 2,219,031 2,307,792 2,400,104 2,496,108 2,595,952 2,699,790 2,807,782 2,920,093 Passengers, 2nd RORO vessel 1,488,104 1,751,098 2,044,454 2,371,314 2,735,131 3,139,729 3,589,269 4,088,390 4,642,138 5,256,062 Vehicles, 1st RORO vessel 4,001,633 4,161,699 4,328,166 4,501,293 4,681,345 4,868,599 5,063,343 5,265,876 5,476,511 5,695,572 Vehicles, 2nd RORO vessel 4,589,515 5,266,509 6,019,164 6,854,615 7,781,628 8,809,466 9,947,958 11,208,562 12,604,144 14,147,576
Berthing Fee Revenues, 1st RORO vessel 1,953,922 2,032,079 2,113,363 2,197,897 2,285,813 2,377,245 2,472,335 2,571,229 2,674,078 2,781,041 Berthing Fee Revenues, 2nd RORO vessel 1,953,922 2,032,079 2,113,363 2,197,897 2,285,813 2,377,245 2,472,335 2,571,229 2,674,078 2,781,041 Miscellaneous port revenues 488,481 508,020 528,341 549,474 571,453 594,311 618,084 642,807 668,519 695,260 Local business revenues 3,539,723 3,884,782 4,263,485 4,679,106 5,135,235 5,635,837 6,185,221 6,788,180 7,449,920 8,176,155 Recovery of working capital 693,117 Selling value of depreciated port/terminal 43,500,000
Total Inflows 20,066,920 21,769,949 23,629,366 25,659,389 27,876,521 30,298,540 32,944,496 35,836,063 38,997,171 86,645,918 Outflows
Development cost, Pilar & AroroyO&M cost 1,947,900 2,025,817 2,106,849 2,191,123 2,278,768 2,369,919 2,464,716 2,563,304 2,665,836 2,772,470 Change in working capital 18,730 19,479 20,258 21,068 21,911 22,788 23,699 24,647 25,633 26,658
Total Outflows 1,966,630 2,045,296 2,127,107 2,212,192 2,300,679 2,392,706 2,488,415 2,587,951 2,691,469 2,799,128 Net cashflow, all capital 18,100,289 19,724,654 21,502,258 23,447,197 25,575,841 27,905,834 30,456,082 33,248,112 36,305,701 83,846,790 RORO Terminal Operation Cashflow, Equity-Owner's Viewpoint
Year 11 Year 12 Year 13 Year 14 Year 15 Year 16 Year 17 Year 18 Year 19 Year 20Net cashflow, all capital 18,100,289 19,724,654 21,502,258 23,447,197 25,575,841 27,905,834 30,456,082 33,248,112 36,305,701 83,846,790 Loan proceeds from DBP
Debt service (6,028,352) - - - - - - - - - Income tax liability (5,023,443) (5,622,123) (6,191,205) (6,813,845) (7,495,281) (8,241,159) (9,057,530) (9,951,283) (10,930,027) (12,001,706)
Net Cashflow before Tax 12,071,938 19,724,654 21,502,258 23,447,197 25,575,841 27,905,834 30,456,082 33,248,112 36,305,701 83,846,790 Net Cashflow after Tax 7,048,495 14,102,531 15,311,053 16,633,352 18,080,560 19,664,675 21,398,552 23,296,829 25,375,674 71,845,084 Memo: Earnings before Income Taxes (EBIT) 18,119,019 19,744,133 21,522,516 23,468,266 25,597,752 27,928,622 30,479,781 33,272,759 36,331,334 39,680,330 EBIT less: Depreciation 2,175,000 2,175,000 2,175,000 2,175,000 2,175,000 2,175,000 2,175,000 2,175,000 2,175,000 2,175,000 Interest expense 245,760 - - - - - - - - - = Taxable income 15,698,259 17,569,133 19,347,516 21,293,266 23,422,752 25,753,622 28,304,781 31,097,759 34,156,334 37,505,330
Integrated RORO Vessel and RORO Terminal OperationYear 11 Year 12 Year 13 Year 14 Year 15 Year 16 Year 17 Year 18 Year 19 Year 20
Net cashflow, all capital, before tax 38,029,927 40,451,477 43,058,154 45,865,329 48,890,698 52,153,285 55,673,431 59,474,155 63,580,786 126,824,545 Net Cashflow, equity, before tax 32,001,575 40,451,477 43,058,154 45,865,329 48,890,698 52,153,285 55,673,431 59,474,155 63,580,786 126,824,545
Vessel 19,929,638 20,726,823 21,555,896 22,418,132 23,314,857 24,247,451 25,217,349 26,226,043 27,275,085 42,977,755 RORO terminal 12,071,938 19,724,654 21,502,258 23,447,197 25,575,841 27,905,834 30,456,082 33,248,112 36,305,701 83,846,790 Income tax liability (10,824,877) (11,683,710) (12,523,352) (13,427,374) (14,401,447) (15,451,668) (16,584,555) (17,807,485) (19,128,573) (20,556,290)
Net Cashflow, equity, after tax 21,176,698 28,767,767 30,534,802 32,437,955 34,489,251 36,701,618 39,088,876 41,666,670 44,452,213 106,268,255 Memo:
Taxable income, vessel 18,129,482 18,942,462 19,787,960 20,667,278 21,581,770 22,532,840 23,521,954 24,550,632 25,620,457 26,733,076 Taxable income, terminal 15,698,259 17,569,133 19,347,516 21,293,266 23,422,752 25,753,622 28,304,781 31,097,759 34,156,334 37,505,330 Taxable income, combined 33,827,741 36,511,594 39,135,476 41,960,544 45,004,522 48,286,462 51,826,735 55,648,391 59,776,792 64,238,406
If all capital is equity capital: Year 11 Year 12 Year 13 Year 14 Year 15 Year 16 Year 17 Year 18 Year 19 Year 20Vessel operations
Net Cashflow before tax 19,929,638 20,726,823 21,555,896 22,418,132 23,314,857 24,247,451 25,217,349 26,226,043 27,275,085 42,977,755 Taxable income 18,129,482 18,942,462 19,787,960 20,667,278 21,581,770 22,532,840 23,521,954 24,550,632 25,620,457 26,733,076 Income tax 5,801,434 6,061,588 6,332,147 6,613,529 6,906,166 7,210,509 7,527,025 7,856,202 8,198,546 8,554,584 Net Cashflow after tax 14,128,203 14,665,235 15,223,749 15,804,603 16,408,691 17,036,942 17,690,324 18,369,841 19,076,539 34,423,171
RORO terminal operationsNet Cashflow before tax 18,100,289 19,724,654 21,502,258 23,447,197 25,575,841 27,905,834 30,456,082 33,248,112 36,305,701 83,846,790 Taxable income 15,944,019 17,569,133 19,347,516 21,293,266 23,422,752 25,753,622 28,304,781 31,097,759 34,156,334 37,505,330 Income tax 5,102,086 5,622,123 6,191,205 6,813,845 7,495,281 8,241,159 9,057,530 9,951,283 10,930,027 12,001,706 Net Cashflow after tax 12,998,203 14,102,531 15,311,053 16,633,352 18,080,560 19,664,675 21,398,552 23,296,829 25,375,674 71,845,084
Integrated operationsNet Cashflow before tax 38,029,927 40,451,477 43,058,154 45,865,329 48,890,698 52,153,285 55,673,431 59,474,155 63,580,786 126,824,545 Taxable income 34,073,502 36,511,594 39,135,476 41,960,544 45,004,522 48,286,462 51,826,735 55,648,391 59,776,792 64,238,406 Income tax 10,903,521 11,683,710 12,523,352 13,427,374 14,401,447 15,451,668 16,584,555 17,807,485 19,128,573 20,556,290 Net Cashflow after tax 27,126,407 28,767,767 30,534,802 32,437,955 34,489,251 36,701,618 39,088,876 41,666,670 44,452,213 106,268,255
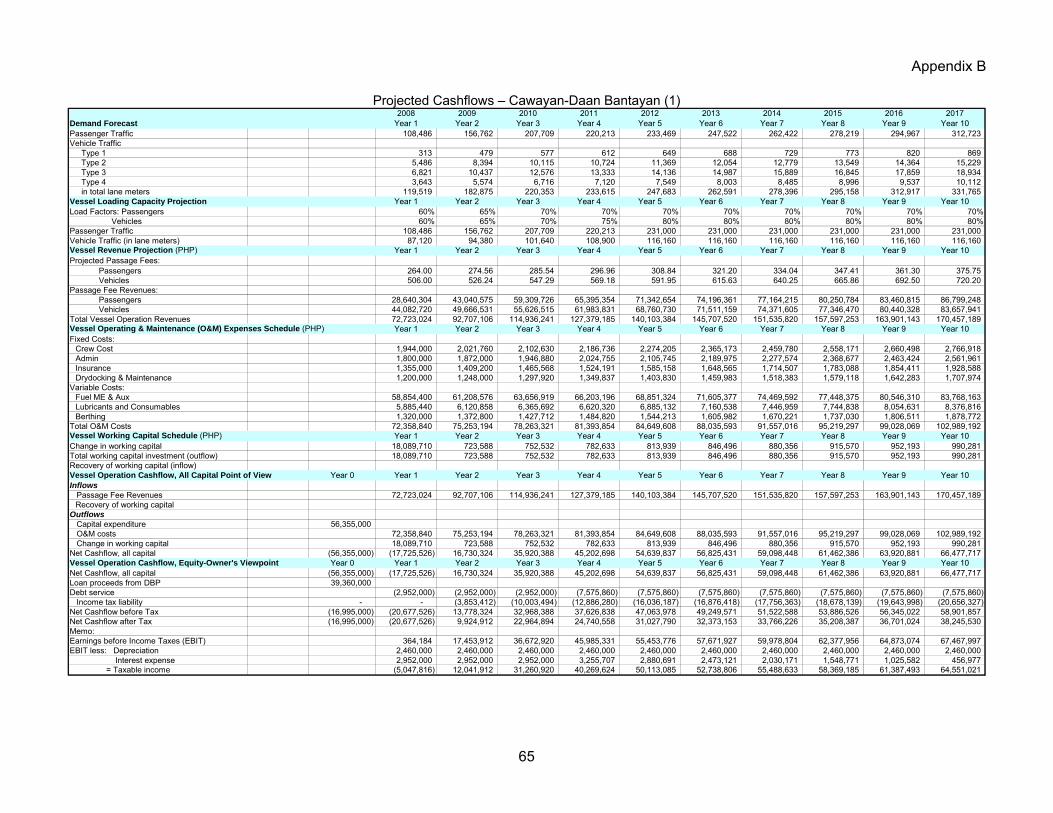
Appendix B
Projected Cashflows – Cawayan-Daan Bantayan (1) 2008 2009 2010 2011 2012 2013 2014 2015 2016 2017
Demand Forecast Year 1 Year 2 Year 3 Year 4 Year 5 Year 6 Year 7 Year 8 Year 9 Year 10Passenger Traffic 108,486 156,762 207,709 220,213 233,469 247,522 262,422 278,219 294,967 312,723 Vehicle Traffic
Type 1 313 479 577 612 649 688 729 773 820 869 Type 2 5,486 8,394 10,115 10,724 11,369 12,054 12,779 13,549 14,364 15,229 Type 3 6,821 10,437 12,576 13,333 14,136 14,987 15,889 16,845 17,859 18,934 Type 4 3,643 5,574 6,716 7,120 7,549 8,003 8,485 8,996 9,537 10,112 in total lane meters 119,519 182,875 220,353 233,615 247,683 262,591 278,396 295,158 312,917 331,765
Vessel Loading Capacity Projection Year 1 Year 2 Year 3 Year 4 Year 5 Year 6 Year 7 Year 8 Year 9 Year 10Load Factors: Passengers 60% 65% 70% 70% 70% 70% 70% 70% 70% 70%
Vehicles 60% 65% 70% 75% 80% 80% 80% 80% 80% 80%Passenger Traffic 108,486 156,762 207,709 220,213 231,000 231,000 231,000 231,000 231,000 231,000 Vehicle Traffic (in lane meters) 87,120 94,380 101,640 108,900 116,160 116,160 116,160 116,160 116,160 116,160 Vessel Revenue Projection (PHP) Year 1 Year 2 Year 3 Year 4 Year 5 Year 6 Year 7 Year 8 Year 9 Year 10Projected Passage Fees:
Passengers 264.00 274.56 285.54 296.96 308.84 321.20 334.04 347.41 361.30 375.75 Vehicles 506.00 526.24 547.29 569.18 591.95 615.63 640.25 665.86 692.50 720.20
Passage Fee Revenues:Passengers 28,640,304 43,040,575 59,309,726 65,395,354 71,342,654 74,196,361 77,164,215 80,250,784 83,460,815 86,799,248 Vehicles 44,082,720 49,666,531 55,626,515 61,983,831 68,760,730 71,511,159 74,371,605 77,346,470 80,440,328 83,657,941
Total Vessel Operation Revenues 72,723,024 92,707,106 114,936,241 127,379,185 140,103,384 145,707,520 151,535,820 157,597,253 163,901,143 170,457,189 Vessel Operating & Maintenance (O&M) Expenses Schedule (PHP) Year 1 Year 2 Year 3 Year 4 Year 5 Year 6 Year 7 Year 8 Year 9 Year 10Fixed Costs:
Crew Cost 1,944,000 2,021,760 2,102,630 2,186,736 2,274,205 2,365,173 2,459,780 2,558,171 2,660,498 2,766,918 Admin 1,800,000 1,872,000 1,946,880 2,024,755 2,105,745 2,189,975 2,277,574 2,368,677 2,463,424 2,561,961 Insurance 1,355,000 1,409,200 1,465,568 1,524,191 1,585,158 1,648,565 1,714,507 1,783,088 1,854,411 1,928,588 Drydocking & Maintenance 1,200,000 1,248,000 1,297,920 1,349,837 1,403,830 1,459,983 1,518,383 1,579,118 1,642,283 1,707,974
Variable Costs:Fuel ME & Aux 58,854,400 61,208,576 63,656,919 66,203,196 68,851,324 71,605,377 74,469,592 77,448,375 80,546,310 83,768,163 Lubricants and Consumables 5,885,440 6,120,858 6,365,692 6,620,320 6,885,132 7,160,538 7,446,959 7,744,838 8,054,631 8,376,816 Berthing 1,320,000 1,372,800 1,427,712 1,484,820 1,544,213 1,605,982 1,670,221 1,737,030 1,806,511 1,878,772
Total O&M Costs 72,358,840 75,253,194 78,263,321 81,393,854 84,649,608 88,035,593 91,557,016 95,219,297 99,028,069 102,989,192 Vessel Working Capital Schedule (PHP) Year 1 Year 2 Year 3 Year 4 Year 5 Year 6 Year 7 Year 8 Year 9 Year 10Change in working capital 18,089,710 723,588 752,532 782,633 813,939 846,496 880,356 915,570 952,193 990,281 Total working capital investment (outflow) 18,089,710 723,588 752,532 782,633 813,939 846,496 880,356 915,570 952,193 990,281 Recovery of working capital (inflow)Vessel Operation Cashflow, All Capital Point of View Year 0 Year 1 Year 2 Year 3 Year 4 Year 5 Year 6 Year 7 Year 8 Year 9 Year 10Inflows Passage Fee Revenues 72,723,024 92,707,106 114,936,241 127,379,185 140,103,384 145,707,520 151,535,820 157,597,253 163,901,143 170,457,189
Recovery of working capitalOutflows Capital expenditure 56,355,000 O&M costs 72,358,840 75,253,194 78,263,321 81,393,854 84,649,608 88,035,593 91,557,016 95,219,297 99,028,069 102,989,192 Change in working capital 18,089,710 723,588 752,532 782,633 813,939 846,496 880,356 915,570 952,193 990,281 Net Cashflow, all capital (56,355,000) (17,725,526) 16,730,324 35,920,388 45,202,698 54,639,837 56,825,431 59,098,448 61,462,386 63,920,881 66,477,717 Vessel Operation Cashflow, Equity-Owner's Viewpoint Year 0 Year 1 Year 2 Year 3 Year 4 Year 5 Year 6 Year 7 Year 8 Year 9 Year 10Net Cashflow, all capital (56,355,000) (17,725,526) 16,730,324 35,920,388 45,202,698 54,639,837 56,825,431 59,098,448 61,462,386 63,920,881 66,477,717 Loan proceeds from DBP 39,360,000 Debt service (2,952,000) (2,952,000) (2,952,000) (7,575,860) (7,575,860) (7,575,860) (7,575,860) (7,575,860) (7,575,860) (7,575,860) Income tax liability - - (3,853,412) (10,003,494) (12,886,280) (16,036,187) (16,876,418) (17,756,363) (18,678,139) (19,643,998) (20,656,327) Net Cashflow before Tax (16,995,000) (20,677,526) 13,778,324 32,968,388 37,626,838 47,063,978 49,249,571 51,522,588 53,886,526 56,345,022 58,901,857 Net Cashflow after Tax (16,995,000) (20,677,526) 9,924,912 22,964,894 24,740,558 31,027,790 32,373,153 33,766,226 35,208,387 36,701,024 38,245,530 Memo:Earnings before Income Taxes (EBIT) 364,184 17,453,912 36,672,920 45,985,331 55,453,776 57,671,927 59,978,804 62,377,956 64,873,074 67,467,997 EBIT less: Depreciation 2,460,000 2,460,000 2,460,000 2,460,000 2,460,000 2,460,000 2,460,000 2,460,000 2,460,000 2,460,000 Interest expense 2,952,000 2,952,000 2,952,000 3,255,707 2,880,691 2,473,121 2,030,171 1,548,771 1,025,582 456,977 = Taxable income (5,047,816) 12,041,912 31,260,920 40,269,624 50,113,085 52,738,806 55,488,633 58,369,185 61,387,493 64,551,021
65
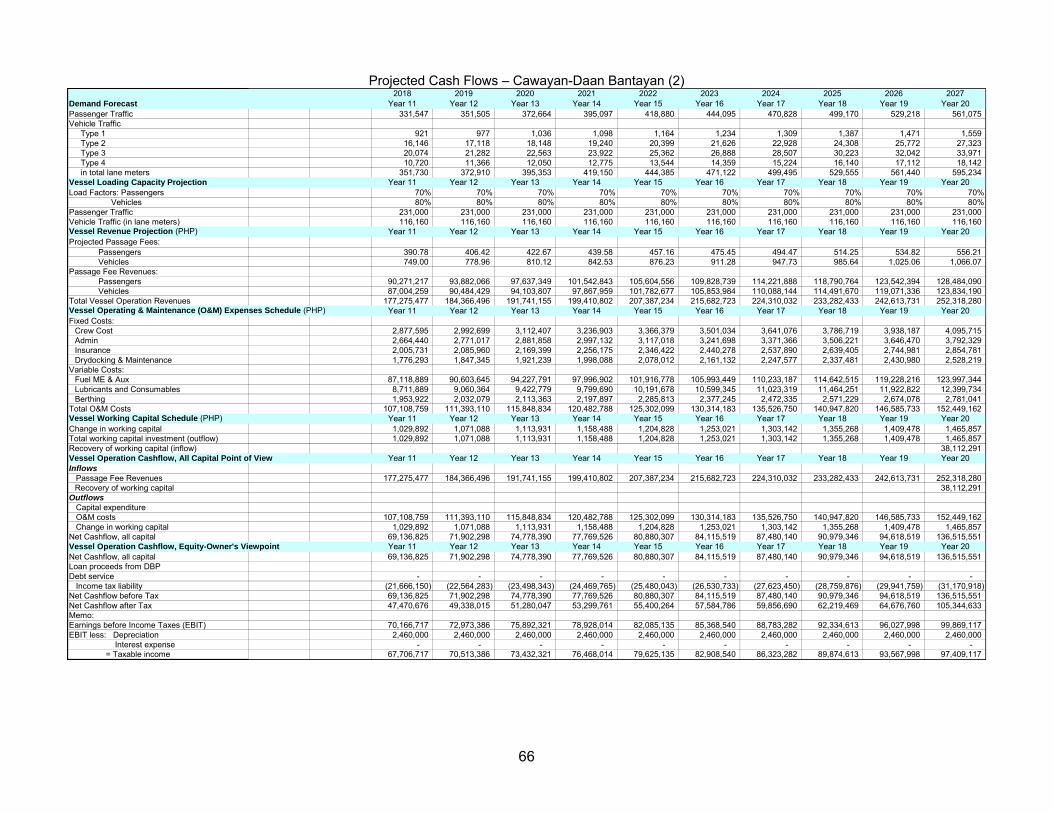
Projected Cash Flows – Cawayan-Daan Bantayan (2)
2018 2019 2020 2021 2022 2023 2024 2025 2026 2027Demand Forecast Year 11 Year 12 Year 13 Year 14 Year 15 Year 16 Year 17 Year 18 Year 19 Year 20Passenger Traffic 331,547 351,505 372,664 395,097 418,880 444,095 470,828 499,170 529,218 561,075 Vehicle Traffic
Type 1 921 977 1,036 1,098 1,164 1,234 1,309 1,387 1,471 1,559 Type 2 16,146 17,118 18,148 19,240 20,399 21,626 22,928 24,308 25,772 27,323 Type 3 20,074 21,282 22,563 23,922 25,362 26,888 28,507 30,223 32,042 33,971 Type 4 10,720 11,366 12,050 12,775 13,544 14,359 15,224 16,140 17,112 18,142 in total lane meters 351,730 372,910 395,353 419,150 444,385 471,122 499,495 529,555 561,440 595,234
Vessel Loading Capacity Projection Year 11 Year 12 Year 13 Year 14 Year 15 Year 16 Year 17 Year 18 Year 19 Year 20Load Factors: Passengers 70% 70% 70% 70% 70% 70% 70% 70% 70% 70%
Vehicles 80% 80% 80% 80% 80% 80% 80% 80% 80% 80%Passenger Traffic 231,000 231,000 231,000 231,000 231,000 231,000 231,000 231,000 231,000 231,000 Vehicle Traffic (in lane meters) 116,160 116,160 116,160 116,160 116,160 116,160 116,160 116,160 116,160 116,160 Vessel Revenue Projection (PHP) Year 11 Year 12 Year 13 Year 14 Year 15 Year 16 Year 17 Year 18 Year 19 Year 20Projected Passage Fees:
Passengers 390.78 406.42 422.67 439.58 457.16 475.45 494.47 514.25 534.82 556.21 Vehicles 749.00 778.96 810.12 842.53 876.23 911.28 947.73 985.64 1,025.06 1,066.07
Passage Fee Revenues:Passengers 90,271,217 93,882,066 97,637,349 101,542,843 105,604,556 109,828,739 114,221,888 118,790,764 123,542,394 128,484,090 Vehicles 87,004,259 90,484,429 94,103,807 97,867,959 101,782,677 105,853,984 110,088,144 114,491,670 119,071,336 123,834,190
Total Vessel Operation Revenues 177,275,477 184,366,496 191,741,155 199,410,802 207,387,234 215,682,723 224,310,032 233,282,433 242,613,731 252,318,280 Vessel Operating & Maintenance (O&M) Expenses Schedule (PHP) Year 11 Year 12 Year 13 Year 14 Year 15 Year 16 Year 17 Year 18 Year 19 Year 20Fixed Costs:
Crew Cost 2,877,595 2,992,699 3,112,407 3,236,903 3,366,379 3,501,034 3,641,076 3,786,719 3,938,187 4,095,715 Admin 2,664,440 2,771,017 2,881,858 2,997,132 3,117,018 3,241,698 3,371,366 3,506,221 3,646,470 3,792,329 Insurance 2,005,731 2,085,960 2,169,399 2,256,175 2,346,422 2,440,278 2,537,890 2,639,405 2,744,981 2,854,781 Drydocking & Maintenance 1,776,293 1,847,345 1,921,239 1,998,088 2,078,012 2,161,132 2,247,577 2,337,481 2,430,980 2,528,219
Variable Costs:Fuel ME & Aux 87,118,889 90,603,645 94,227,791 97,996,902 101,916,778 105,993,449 110,233,187 114,642,515 119,228,216 123,997,344 Lubricants and Consumables 8,711,889 9,060,364 9,422,779 9,799,690 10,191,678 10,599,345 11,023,319 11,464,251 11,922,822 12,399,734 Berthing 1,953,922 2,032,079 2,113,363 2,197,897 2,285,813 2,377,245 2,472,335 2,571,229 2,674,078 2,781,041
Total O&M Costs 107,108,759 111,393,110 115,848,834 120,482,788 125,302,099 130,314,183 135,526,750 140,947,820 146,585,733 152,449,162 Vessel Working Capital Schedule (PHP) Year 11 Year 12 Year 13 Year 14 Year 15 Year 16 Year 17 Year 18 Year 19 Year 20Change in working capital 1,029,892 1,071,088 1,113,931 1,158,488 1,204,828 1,253,021 1,303,142 1,355,268 1,409,478 1,465,857 Total working capital investment (outflow) 1,029,892 1,071,088 1,113,931 1,158,488 1,204,828 1,253,021 1,303,142 1,355,268 1,409,478 1,465,857 Recovery of working capital (inflow) 38,112,291 Vessel Operation Cashflow, All Capital Point of View Year 11 Year 12 Year 13 Year 14 Year 15 Year 16 Year 17 Year 18 Year 19 Year 20Inflows Passage Fee Revenues 177,275,477 184,366,496 191,741,155 199,410,802 207,387,234 215,682,723 224,310,032 233,282,433 242,613,731 252,318,280
Recovery of working capital 38,112,291 Outflows Capital expenditure O&M costs 107,108,759 111,393,110 115,848,834 120,482,788 125,302,099 130,314,183 135,526,750 140,947,820 146,585,733 152,449,162 Change in working capital 1,029,892 1,071,088 1,113,931 1,158,488 1,204,828 1,253,021 1,303,142 1,355,268 1,409,478 1,465,857 Net Cashflow, all capital 69,136,825 71,902,298 74,778,390 77,769,526 80,880,307 84,115,519 87,480,140 90,979,346 94,618,519 136,515,551 Vessel Operation Cashflow, Equity-Owner's Viewpoint Year 11 Year 12 Year 13 Year 14 Year 15 Year 16 Year 17 Year 18 Year 19 Year 20Net Cashflow, all capital 69,136,825 71,902,298 74,778,390 77,769,526 80,880,307 84,115,519 87,480,140 90,979,346 94,618,519 136,515,551 Loan proceeds from DBPDebt service - - - - - - - - - - Income tax liability (21,666,150) (22,564,283) (23,498,343) (24,469,765) (25,480,043) (26,530,733) (27,623,450) (28,759,876) (29,941,759) (31,170,918) Net Cashflow before Tax 69,136,825 71,902,298 74,778,390 77,769,526 80,880,307 84,115,519 87,480,140 90,979,346 94,618,519 136,515,551 Net Cashflow after Tax 47,470,676 49,338,015 51,280,047 53,299,761 55,400,264 57,584,786 59,856,690 62,219,469 64,676,760 105,344,633 Memo:Earnings before Income Taxes (EBIT) 70,166,717 72,973,386 75,892,321 78,928,014 82,085,135 85,368,540 88,783,282 92,334,613 96,027,998 99,869,117 EBIT less: Depreciation 2,460,000 2,460,000 2,460,000 2,460,000 2,460,000 2,460,000 2,460,000 2,460,000 2,460,000 2,460,000 Interest expense - - - - - - - - - - = Taxable income 67,706,717 70,513,386 73,432,321 76,468,014 79,625,135 82,908,540 86,323,282 89,874,613 93,567,998 97,409,117
66
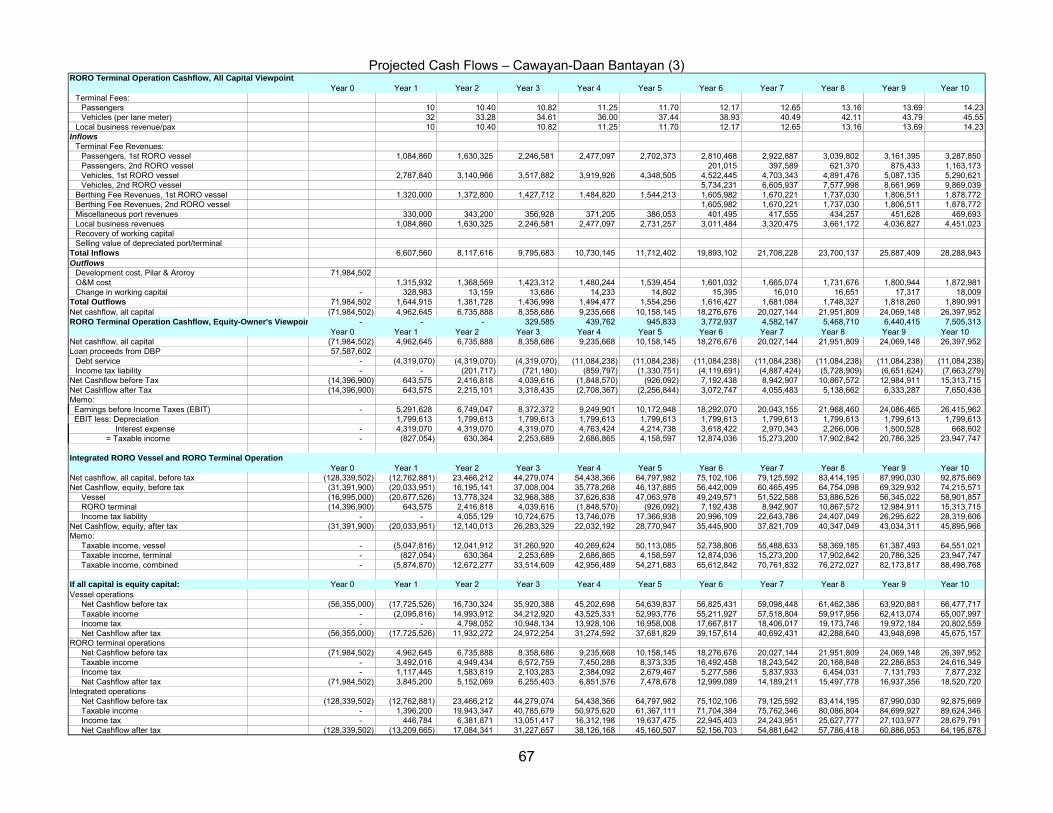
Projected Cash Flows – Cawayan-Daan Bantayan (3) RORO Terminal Operation Cashflow, All Capital Viewpoint
Year 0 Year 1 Year 2 Year 3 Year 4 Year 5 Year 6 Year 7 Year 8 Year 9 Year 10Terminal Fees:
Passengers 10 10.40 10.82 11.25 11.70 12.17 12.65 13.16 13.69 14.23Vehicles (per lane meter) 32 33.28 34.61 36.00 37.44 38.93 40.49 42.11 43.79 45.55
Local business revenue/pax 10 10.40 10.82 11.25 11.70 12.17 12.65 13.16 13.69 14.23Inflows
Terminal Fee Revenues:Passengers, 1st RORO vessel 1,084,860 1,630,325 2,246,581 2,477,097 2,702,373 2,810,468 2,922,887 3,039,802 3,161,395 3,287,850 Passengers, 2nd RORO vessel 201,015 397,589 621,370 875,433 1,163,173 Vehicles, 1st RORO vessel 2,787,840 3,140,966 3,517,882 3,919,926 4,348,505 4,522,445 4,703,343 4,891,476 5,087,135 5,290,621 Vehicles, 2nd RORO vessel 5,734,231 6,605,937 7,577,998 8,661,969 9,869,039
Berthing Fee Revenues, 1st RORO vessel 1,320,000 1,372,800 1,427,712 1,484,820 1,544,213 1,605,982 1,670,221 1,737,030 1,806,511 1,878,772 Berthing Fee Revenues, 2nd RORO vessel 1,605,982 1,670,221 1,737,030 1,806,511 1,878,772 Miscellaneous port revenues 330,000 343,200 356,928 371,205 386,053 401,495 417,555 434,257 451,628 469,693 Local business revenues 1,084,860 1,630,325 2,246,581 2,477,097 2,731,257 3,011,484 3,320,475 3,661,172 4,036,827 4,451,023 Recovery of working capitalSelling value of depreciated port/terminal
Total Inflows 6,607,560 8,117,616 9,795,683 10,730,145 11,712,402 19,893,102 21,708,228 23,700,137 25,887,409 28,288,943 Outflows
Development cost, Pilar & Aroroy 71,984,502 O&M cost 1,315,932 1,368,569 1,423,312 1,480,244 1,539,454 1,601,032 1,665,074 1,731,676 1,800,944 1,872,981 Change in working capital - 328,983 13,159 13,686 14,233 14,802 15,395 16,010 16,651 17,317 18,009
Total Outflows 71,984,502 1,644,915 1,381,728 1,436,998 1,494,477 1,554,256 1,616,427 1,681,084 1,748,327 1,818,260 1,890,991 Net cashflow, all capital (71,984,502) 4,962,645 6,735,888 8,358,686 9,235,668 10,158,145 18,276,676 20,027,144 21,951,809 24,069,148 26,397,952 RORO Terminal Operation Cashflow, Equity-Owner's Viewpoin - - - 329,585 439,762 945,833 3,772,937 4,582,147 5,468,710 6,440,415 7,505,313
Year 0 Year 1 Year 2 Year 3 Year 4 Year 5 Year 6 Year 7 Year 8 Year 9 Year 10Net cashflow, all capital (71,984,502) 4,962,645 6,735,888 8,358,686 9,235,668 10,158,145 18,276,676 20,027,144 21,951,809 24,069,148 26,397,952 Loan proceeds from DBP 57,587,602
Debt service - (4,319,070) (4,319,070) (4,319,070) (11,084,238) (11,084,238) (11,084,238) (11,084,238) (11,084,238) (11,084,238) (11,084,238) Income tax liability - - (201,717) (721,180) (859,797) (1,330,751) (4,119,691) (4,887,424) (5,728,909) (6,651,624) (7,663,279)
Net Cashflow before Tax (14,396,900) 643,575 2,416,818 4,039,616 (1,848,570) (926,092) 7,192,438 8,942,907 10,867,572 12,984,911 15,313,715 Net Cashflow after Tax (14,396,900) 643,575 2,215,101 3,318,435 (2,708,367) (2,256,844) 3,072,747 4,055,483 5,138,662 6,333,287 7,650,436 Memo: Earnings before Income Taxes (EBIT) - 5,291,628 6,749,047 8,372,372 9,249,901 10,172,948 18,292,070 20,043,155 21,968,460 24,086,465 26,415,962 EBIT less: Depreciation 1,799,613 1,799,613 1,799,613 1,799,613 1,799,613 1,799,613 1,799,613 1,799,613 1,799,613 1,799,613 Interest expense - 4,319,070 4,319,070 4,319,070 4,763,424 4,214,738 3,618,422 2,970,343 2,266,006 1,500,528 668,602 = Taxable income - (827,054) 630,364 2,253,689 2,686,865 4,158,597 12,874,036 15,273,200 17,902,842 20,786,325 23,947,747
Integrated RORO Vessel and RORO Terminal OperationYear 0 Year 1 Year 2 Year 3 Year 4 Year 5 Year 6 Year 7 Year 8 Year 9 Year 10
Net cashflow, all capital, before tax (128,339,502) (12,762,881) 23,466,212 44,279,074 54,438,366 64,797,982 75,102,106 79,125,592 83,414,195 87,990,030 92,875,669 Net Cashflow, equity, before tax (31,391,900) (20,033,951) 16,195,141 37,008,004 35,778,268 46,137,885 56,442,009 60,465,495 64,754,098 69,329,932 74,215,571
Vessel (16,995,000) (20,677,526) 13,778,324 32,968,388 37,626,838 47,063,978 49,249,571 51,522,588 53,886,526 56,345,022 58,901,857 RORO terminal (14,396,900) 643,575 2,416,818 4,039,616 (1,848,570) (926,092) 7,192,438 8,942,907 10,867,572 12,984,911 15,313,715 Income tax liability - - 4,055,129 10,724,675 13,746,076 17,366,938 20,996,109 22,643,786 24,407,049 26,295,622 28,319,606
Net Cashflow, equity, after tax (31,391,900) (20,033,951) 12,140,013 26,283,329 22,032,192 28,770,947 35,445,900 37,821,709 40,347,049 43,034,311 45,895,966 Memo:
Taxable income, vessel - (5,047,816) 12,041,912 31,260,920 40,269,624 50,113,085 52,738,806 55,488,633 58,369,185 61,387,493 64,551,021 Taxable income, terminal - (827,054) 630,364 2,253,689 2,686,865 4,158,597 12,874,036 15,273,200 17,902,842 20,786,325 23,947,747 Taxable income, combined - (5,874,870) 12,672,277 33,514,609 42,956,489 54,271,683 65,612,842 70,761,832 76,272,027 82,173,817 88,498,768
If all capital is equity capital: Year 0 Year 1 Year 2 Year 3 Year 4 Year 5 Year 6 Year 7 Year 8 Year 9 Year 10Vessel operations
Net Cashflow before tax (56,355,000) (17,725,526) 16,730,324 35,920,388 45,202,698 54,639,837 56,825,431 59,098,448 61,462,386 63,920,881 66,477,717 Taxable income - (2,095,816) 14,993,912 34,212,920 43,525,331 52,993,776 55,211,927 57,518,804 59,917,956 62,413,074 65,007,997 Income tax - - 4,798,052 10,948,134 13,928,106 16,958,008 17,667,817 18,406,017 19,173,746 19,972,184 20,802,559 Net Cashflow after tax (56,355,000) (17,725,526) 11,932,272 24,972,254 31,274,592 37,681,829 39,157,614 40,692,431 42,288,640 43,948,698 45,675,157
RORO terminal operationsNet Cashflow before tax (71,984,502) 4,962,645 6,735,888 8,358,686 9,235,668 10,158,145 18,276,676 20,027,144 21,951,809 24,069,148 26,397,952 Taxable income - 3,492,016 4,949,434 6,572,759 7,450,288 8,373,335 16,492,458 18,243,542 20,168,848 22,286,853 24,616,349 Income tax - 1,117,445 1,583,819 2,103,283 2,384,092 2,679,467 5,277,586 5,837,933 6,454,031 7,131,793 7,877,232 Net Cashflow after tax (71,984,502) 3,845,200 5,152,069 6,255,403 6,851,576 7,478,678 12,999,089 14,189,211 15,497,778 16,937,356 18,520,720
Integrated operationsNet Cashflow before tax (128,339,502) (12,762,881) 23,466,212 44,279,074 54,438,366 64,797,982 75,102,106 79,125,592 83,414,195 87,990,030 92,875,669 Taxable income - 1,396,200 19,943,347 40,785,679 50,975,620 61,367,111 71,704,384 75,762,346 80,086,804 84,699,927 89,624,346 Income tax - 446,784 6,381,871 13,051,417 16,312,198 19,637,475 22,945,403 24,243,951 25,627,777 27,103,977 28,679,791 Net Cashflow after tax (128,339,502) (13,209,665) 17,084,341 31,227,657 38,126,168 45,160,507 52,156,703 54,881,642 57,786,418 60,886,053 64,195,878
67
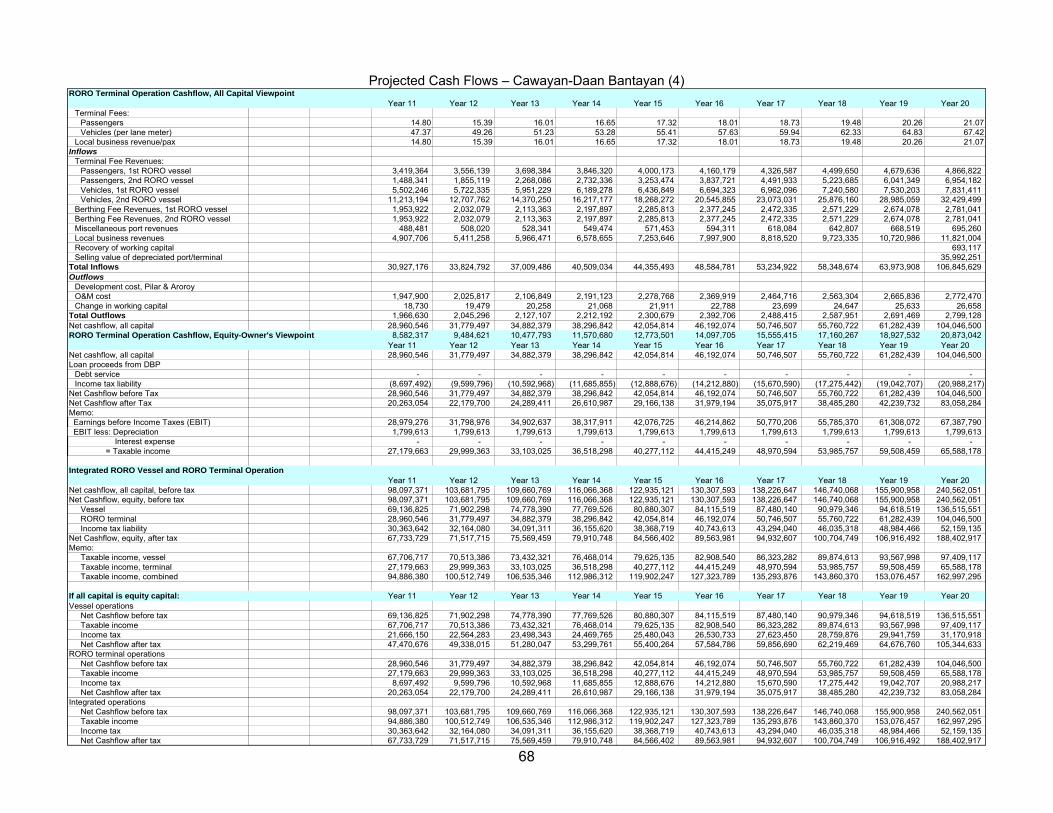
Projected Cash Flows – Cawayan-Daan Bantayan (4)
68
RORO Terminal Operation Cashflow, All Capital ViewpointYear 11 Year 12 Year 13 Year 14 Year 15 Year 16 Year 17 Year 18 Year 19 Year 20
Terminal Fees:Passengers 14.80 15.39 16.01 16.65 17.32 18.01 18.73 19.48 20.26 21.07Vehicles (per lane meter) 47.37 49.26 51.23 53.28 55.41 57.63 59.94 62.33 64.83 67.42
Local business revenue/pax 14.80 15.39 16.01 16.65 17.32 18.01 18.73 19.48 20.26 21.07Inflows
Terminal Fee Revenues:Passengers, 1st RORO vessel 3,419,364 3,556,139 3,698,384 3,846,320 4,000,173 4,160,179 4,326,587 4,499,650 4,679,636 4,866,822 Passengers, 2nd RORO vessel 1,488,341 1,855,119 2,268,086 2,732,336 3,253,474 3,837,721 4,491,933 5,223,685 6,041,349 6,954,182 Vehicles, 1st RORO vessel 5,502,246 5,722,335 5,951,229 6,189,278 6,436,849 6,694,323 6,962,096 7,240,580 7,530,203 7,831,411 Vehicles, 2nd RORO vessel 11,213,194 12,707,762 14,370,250 16,217,177 18,268,272 20,545,855 23,073,031 25,876,160 28,985,059 32,429,499
Berthing Fee Revenues, 1st RORO vessel 1,953,922 2,032,079 2,113,363 2,197,897 2,285,813 2,377,245 2,472,335 2,571,229 2,674,078 2,781,041 Berthing Fee Revenues, 2nd RORO vessel 1,953,922 2,032,079 2,113,363 2,197,897 2,285,813 2,377,245 2,472,335 2,571,229 2,674,078 2,781,041 Miscellaneous port revenues 488,481 508,020 528,341 549,474 571,453 594,311 618,084 642,807 668,519 695,260 Local business revenues 4,907,706 5,411,258 5,966,471 6,578,655 7,253,646 7,997,900 8,818,520 9,723,335 10,720,986 11,821,004 Recovery of working capital 693,117 Selling value of depreciated port/terminal 35,992,251
Total Inflows 30,927,176 33,824,792 37,009,486 40,509,034 44,355,493 48,584,781 53,234,922 58,348,674 63,973,908 106,845,629 Outflows
Development cost, Pilar & AroroyO&M cost 1,947,900 2,025,817 2,106,849 2,191,123 2,278,768 2,369,919 2,464,716 2,563,304 2,665,836 2,772,470 Change in working capital 18,730 19,479 20,258 21,068 21,911 22,788 23,699 24,647 25,633 26,658
Total Outflows 1,966,630 2,045,296 2,127,107 2,212,192 2,300,679 2,392,706 2,488,415 2,587,951 2,691,469 2,799,128 Net cashflow, all capital 28,960,546 31,779,497 34,882,379 38,296,842 42,054,814 46,192,074 50,746,507 55,760,722 61,282,439 104,046,500 RORO Terminal Operation Cashflow, Equity-Owner's Viewpoint 8,582,317 9,484,621 10,477,793 11,570,680 12,773,501 14,097,705 15,555,415 17,160,267 18,927,532 20,873,042
Year 11 Year 12 Year 13 Year 14 Year 15 Year 16 Year 17 Year 18 Year 19 Year 20Net cashflow, all capital 28,960,546 31,779,497 34,882,379 38,296,842 42,054,814 46,192,074 50,746,507 55,760,722 61,282,439 104,046,500 Loan proceeds from DBP
Debt service - - - - - - - - - - Income tax liability (8,697,492) (9,599,796) (10,592,968) (11,685,855) (12,888,676) (14,212,880) (15,670,590) (17,275,442) (19,042,707) (20,988,217)
Net Cashflow before Tax 28,960,546 31,779,497 34,882,379 38,296,842 42,054,814 46,192,074 50,746,507 55,760,722 61,282,439 104,046,500 Net Cashflow after Tax 20,263,054 22,179,700 24,289,411 26,610,987 29,166,138 31,979,194 35,075,917 38,485,280 42,239,732 83,058,284 Memo: Earnings before Income Taxes (EBIT) 28,979,276 31,798,976 34,902,637 38,317,911 42,076,725 46,214,862 50,770,206 55,785,370 61,308,072 67,387,790 EBIT less: Depreciation 1,799,613 1,799,613 1,799,613 1,799,613 1,799,613 1,799,613 1,799,613 1,799,613 1,799,613 1,799,613 Interest expense - - - - - - - - - - = Taxable income 27,179,663 29,999,363 33,103,025 36,518,298 40,277,112 44,415,249 48,970,594 53,985,757 59,508,459 65,588,178
Integrated RORO Vessel and RORO Terminal OperationYear 11 Year 12 Year 13 Year 14 Year 15 Year 16 Year 17 Year 18 Year 19 Year 20
Net cashflow, all capital, before tax 98,097,371 103,681,795 109,660,769 116,066,368 122,935,121 130,307,593 138,226,647 146,740,068 155,900,958 240,562,051 Net Cashflow, equity, before tax 98,097,371 103,681,795 109,660,769 116,066,368 122,935,121 130,307,593 138,226,647 146,740,068 155,900,958 240,562,051
Vessel 69,136,825 71,902,298 74,778,390 77,769,526 80,880,307 84,115,519 87,480,140 90,979,346 94,618,519 136,515,551 RORO terminal 28,960,546 31,779,497 34,882,379 38,296,842 42,054,814 46,192,074 50,746,507 55,760,722 61,282,439 104,046,500 Income tax liability 30,363,642 32,164,080 34,091,311 36,155,620 38,368,719 40,743,613 43,294,040 46,035,318 48,984,466 52,159,135
Net Cashflow, equity, after tax 67,733,729 71,517,715 75,569,459 79,910,748 84,566,402 89,563,981 94,932,607 100,704,749 106,916,492 188,402,917 Memo:
Taxable income, vessel 67,706,717 70,513,386 73,432,321 76,468,014 79,625,135 82,908,540 86,323,282 89,874,613 93,567,998 97,409,117 Taxable income, terminal 27,179,663 29,999,363 33,103,025 36,518,298 40,277,112 44,415,249 48,970,594 53,985,757 59,508,459 65,588,178 Taxable income, combined 94,886,380 100,512,749 106,535,346 112,986,312 119,902,247 127,323,789 135,293,876 143,860,370 153,076,457 162,997,295
If all capital is equity capital: Year 11 Year 12 Year 13 Year 14 Year 15 Year 16 Year 17 Year 18 Year 19 Year 20Vessel operations
Net Cashflow before tax 69,136,825 71,902,298 74,778,390 77,769,526 80,880,307 84,115,519 87,480,140 90,979,346 94,618,519 136,515,551 Taxable income 67,706,717 70,513,386 73,432,321 76,468,014 79,625,135 82,908,540 86,323,282 89,874,613 93,567,998 97,409,117 Income tax 21,666,150 22,564,283 23,498,343 24,469,765 25,480,043 26,530,733 27,623,450 28,759,876 29,941,759 31,170,918 Net Cashflow after tax 47,470,676 49,338,015 51,280,047 53,299,761 55,400,264 57,584,786 59,856,690 62,219,469 64,676,760 105,344,633
RORO terminal operationsNet Cashflow before tax 28,960,546 31,779,497 34,882,379 38,296,842 42,054,814 46,192,074 50,746,507 55,760,722 61,282,439 104,046,500 Taxable income 27,179,663 29,999,363 33,103,025 36,518,298 40,277,112 44,415,249 48,970,594 53,985,757 59,508,459 65,588,178 Income tax 8,697,492 9,599,796 10,592,968 11,685,855 12,888,676 14,212,880 15,670,590 17,275,442 19,042,707 20,988,217 Net Cashflow after tax 20,263,054 22,179,700 24,289,411 26,610,987 29,166,138 31,979,194 35,075,917 38,485,280 42,239,732 83,058,284
Integrated operationsNet Cashflow before tax 98,097,371 103,681,795 109,660,769 116,066,368 122,935,121 130,307,593 138,226,647 146,740,068 155,900,958 240,562,051 Taxable income 94,886,380 100,512,749 106,535,346 112,986,312 119,902,247 127,323,789 135,293,876 143,860,370 153,076,457 162,997,295 Income tax 30,363,642 32,164,080 34,091,311 36,155,620 38,368,719 40,743,613 43,294,040 46,035,318 48,984,466 52,159,135 Net Cashflow after tax 67,733,729 71,517,715 75,569,459 79,910,748 84,566,402 89,563,981 94,932,607 100,704,749 106,916,492 188,402,917