Embed Size (px)
Citation preview
The Reliability of Hot Axle & Hot Wheel
(HAHW) Detection Data Analysis, Possible Main Factors, and possible solutions
Internship Report
Authors
Zhou He s1914235
External Supervisor
Juliette Van Driel
UT Supervisor
Dr. Alberto Martinetti
Sep 1st, 2018 to Dec 31st, 2018
ProRail/AM-Informatie/Materieelimpact, Utrecht, Netherlands
University of Twente/ME/MEO
1
Summary
This report focuses on investigating the reliability of hotbox detection system and
their measurement data in Dutch railway network. Then, to find the possible main
factors which affect temperature result and give the solution correspondingly.
The reliability of hotbox detection system is accessed by using root cause analysis
(e.g. FTA & FEMA) and data analysis method (e.g. R&R study and reliability
analysis). Furthermore, some possible reasons can be assumed based on the analysis
result. Finally, possible solutions will be given according to the possible reasons.
The analysis shows the HBD detection system has very good internal and external
consistency in most of the time. However, abnormal data are generated in some case,
most of the unreliability comes from repeatability. Based on this information, some
possible main factors from parts variation, condition interference and alarm criteria
setting have been found. And possible solutions are given correspondingly from three
aspects.
Keywords: railway network, hot box detection, reliability, data consistency, FTA,
FEMA, R&R
2
Content
Content .......................................................................................................................... 2
1 Introduction ............................................................................................................. 3
2 Define Problems...................................................................................................... 4
2.1 Failure .......................................................................................................... 5
2.2 Error ............................................................................................................. 7
2.3 Data Reliability ............................................................................................ 8
3 Working Plan......................................................................................................... 11
4 Root Cause Analysis (FTA & FMEA) .................................................................. 13
4.1 Fault Tree Analysis .................................................................................... 14
4.2 Failure Mode and Effect Analysis ............................................................. 16
5 Data Analysis ........................................................................................................ 18
5.1 Measurement System Analysis (R & R Study) ......................................... 20
5.2 Assessing Reliability ................................................................................. 25
5.2.1 Internal Reliability .......................................................................... 25
5.2.2 External Reliability ......................................................................... 28
5.3 Full Factorial Design ................................................................................. 30
6 Possible Main Factors Contribute to Unreliability ............................................... 33
6.1 Variation Due to the Parts .......................................................................... 33
6.2 Condition Interference from Outside of the Given Data ........................... 35
6.3 Alarm Criteria Setting ............................................................................... 36
7 Possible Solutions ................................................................................................. 37
7.1 Double Testing with Different Angle......................................................... 37
7.2 Algorithm & People Decision ................................................................... 38
7.3 Criteria Setting by using Decision Tree ..................................................... 38
8 Conclusion and Discussion ................................................................................... 40
References .................................................................................................................... 41
Appendix A .................................................................................................................. 43
Appendix B (Description of the employer & own functioning) ............................... 45
List of Acronyms.......................................................................................................... 46
3
1 Introduction
Between Friday 19 October 2007 and Sunday 5 October 2008, there were 12
occurrences when wheel-bearings failed on wagons traveling on express freight trains
at various locations in the North and South Island. Seven of the 12 wheel-bearing
failures resulted in the affected wagon derailing and causing a number of following
wagons to also derail. The derailments caused extensive damage to the rolling stock,
freight it was conveying and the rail network. On 2 occasions, molten metal from the
failed wheel-bearings resulted in fires in trackside foliage and across adjacent land. The
Commission determined that wheel-bearings were critical items, the failure of which
had the potential to result in a derailment.
Luckily, the HBD system can reduce accident rate by monitoring bearing and wheel
temperature and it has been located in 31 different sites throughout the Dutch railway
network. Not only for the axle temperature but also for the wheel. Hence, the reliability
of the HBD system is an important thing for safety.
This report focuses on investigating the reliability of hotbox detection system and
their measurement data in Dutch railway network. Then, to find the possible main
factor which affects temperature result and gives the possible solution
correspondingly.
Firstly, the report begins with defining the problem in three aspects, failure, error and
data reliability. Then, the working plan can be made by considering the required time
and problems defined. Secondly, root cause analysis by using FTA and FEMA can be
applied to investigate the reliability of the HBD system. Thirdly, data analysis method
e.g. R&R study, accessing reliability and full factorial design are used to access data
reliability. Next, based on these results, some possible factors contribute to abnormal
detection results would be found and the possible solutions will be applied
correspondingly.
4
2 Define Problems
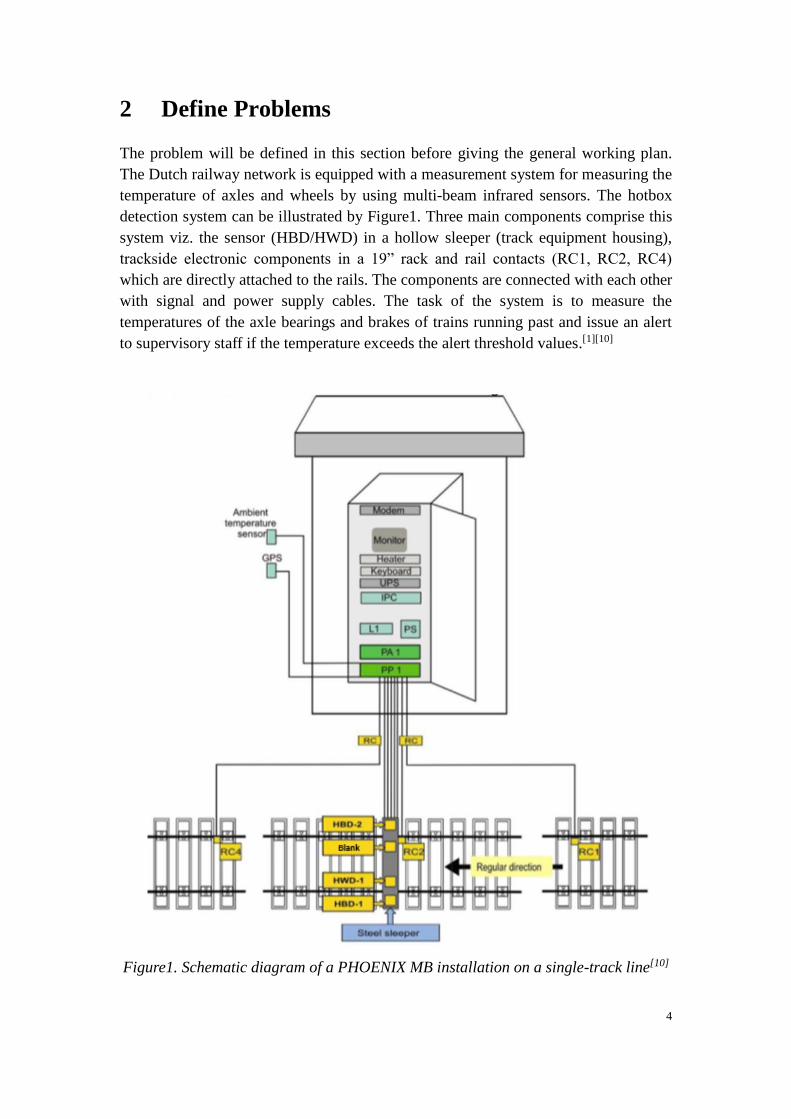
The problem will be defined in this section before giving the general working plan.
The Dutch railway network is equipped with a measurement system for measuring the
temperature of axles and wheels by using multi-beam infrared sensors. The hotbox
detection system can be illustrated by Figure1. Three main components comprise this
system viz. the sensor (HBD/HWD) in a hollow sleeper (track equipment housing),
trackside electronic components in a 19” rack and rail contacts (RC1, RC2, RC4)
which are directly attached to the rails. The components are connected with each other
with signal and power supply cables. The task of the system is to measure the
temperatures of the axle bearings and brakes of trains running past and issue an alert
to supervisory staff if the temperature exceeds the alert threshold values.[1][10]
Figure1. Schematic diagram of a PHOENIX MB installation on a single-track line[10]
5
The temperatures of the axles on the left and right sides are measured while the
temperature of the wheels is measured on one side. They are installed with a spacing of
80 kilometres along the entire length of freight corridors because an axle can develop
into a 'hot axle' within 80 kilometres. There are 31 sites throughout the Dutch railway
network. [1] In addition to reducing derailment risks, it also provides data to operators
which can be used for prediction maintenance.
The reliability of hotbox would be high enough to achieve this goal in the way of the
combination of failure, error and data reliability. However, it shows some unexpected
failure and errors obey the Hot Box Dashboard 2018. The DB, Germany also advice
ProRail to increase data reliability according to ir. Pieter Dings report[2]
Hence, the problem will be defined in the following 3 different sections.
2.1 Failure
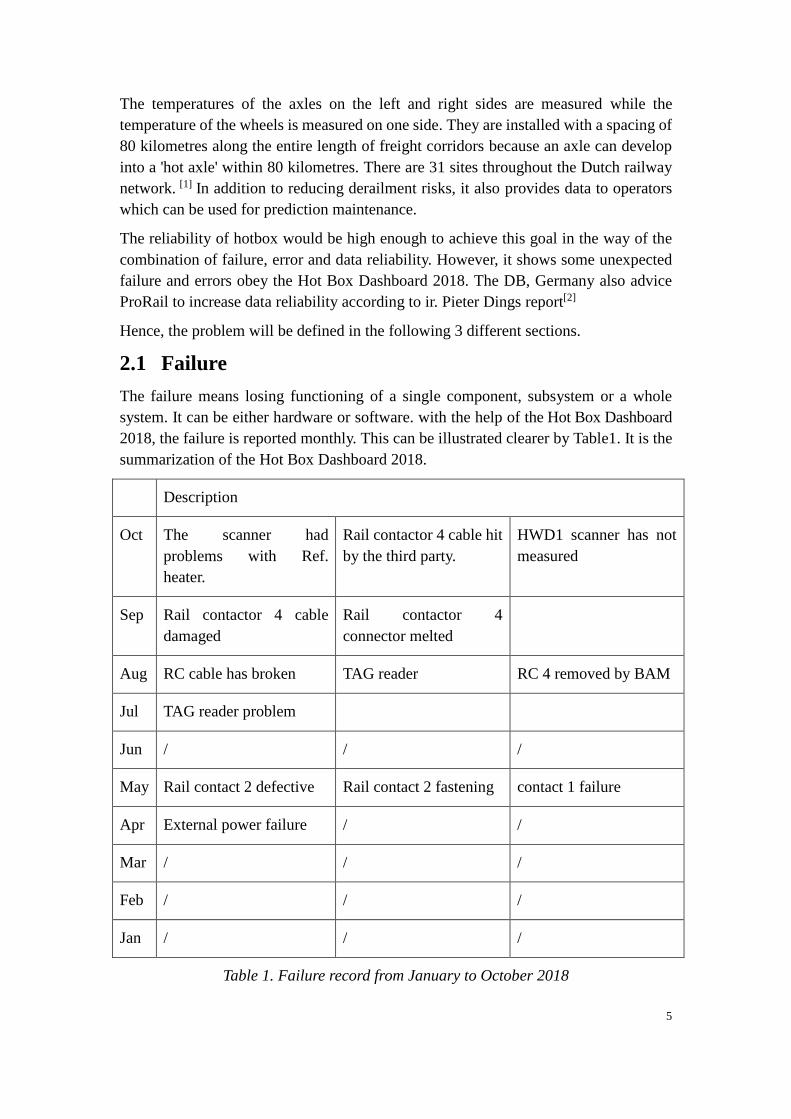
The failure means losing functioning of a single component, subsystem or a whole
system. It can be either hardware or software. with the help of the Hot Box Dashboard
2018, the failure is reported monthly. This can be illustrated clearer by Table1. It is the
summarization of the Hot Box Dashboard 2018.
Description
Oct The scanner had
problems with Ref.
heater.
Rail contactor 4 cable hit
by the third party.
HWD1 scanner has not
measured
Sep Rail contactor 4 cable
damaged
Rail contactor 4
connector melted
Aug RC cable has broken TAG reader RC 4 removed by BAM
Jul TAG reader problem
Jun / / /
May Rail contact 2 defective Rail contact 2 fastening contact 1 failure
Apr External power failure / /
Mar / / /
Feb / / /
Jan / / /
Table 1. Failure record from January to October 2018
6
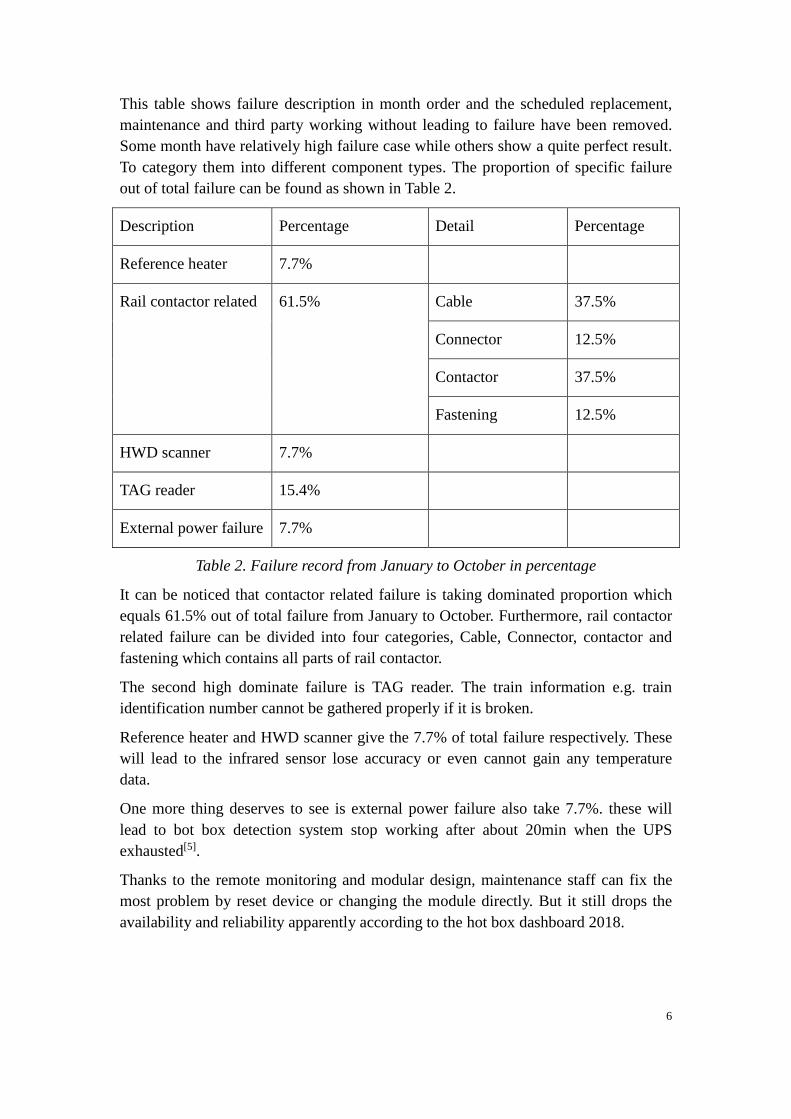
This table shows failure description in month order and the scheduled replacement,
maintenance and third party working without leading to failure have been removed.
Some month have relatively high failure case while others show a quite perfect result.
To category them into different component types. The proportion of specific failure
out of total failure can be found as shown in Table 2.
Description Percentage Detail Percentage
Reference heater 7.7%
Rail contactor related 61.5% Cable 37.5%
Connector 12.5%
Contactor 37.5%
Fastening 12.5%
HWD scanner 7.7%
TAG reader 15.4%
External power failure 7.7%
Table 2. Failure record from January to October in percentage
It can be noticed that contactor related failure is taking dominated proportion which
equals 61.5% out of total failure from January to October. Furthermore, rail contactor
related failure can be divided into four categories, Cable, Connector, contactor and
fastening which contains all parts of rail contactor.
The second high dominate failure is TAG reader. The train information e.g. train
identification number cannot be gathered properly if it is broken.
Reference heater and HWD scanner give the 7.7% of total failure respectively. These
will lead to the infrared sensor lose accuracy or even cannot gain any temperature
data.
One more thing deserves to see is external power failure also take 7.7%. these will
lead to bot box detection system stop working after about 20min when the UPS
exhausted[5].
Thanks to the remote monitoring and modular design, maintenance staff can fix the
most problem by reset device or changing the module directly. But it still drops the
availability and reliability apparently according to the hot box dashboard 2018.
7
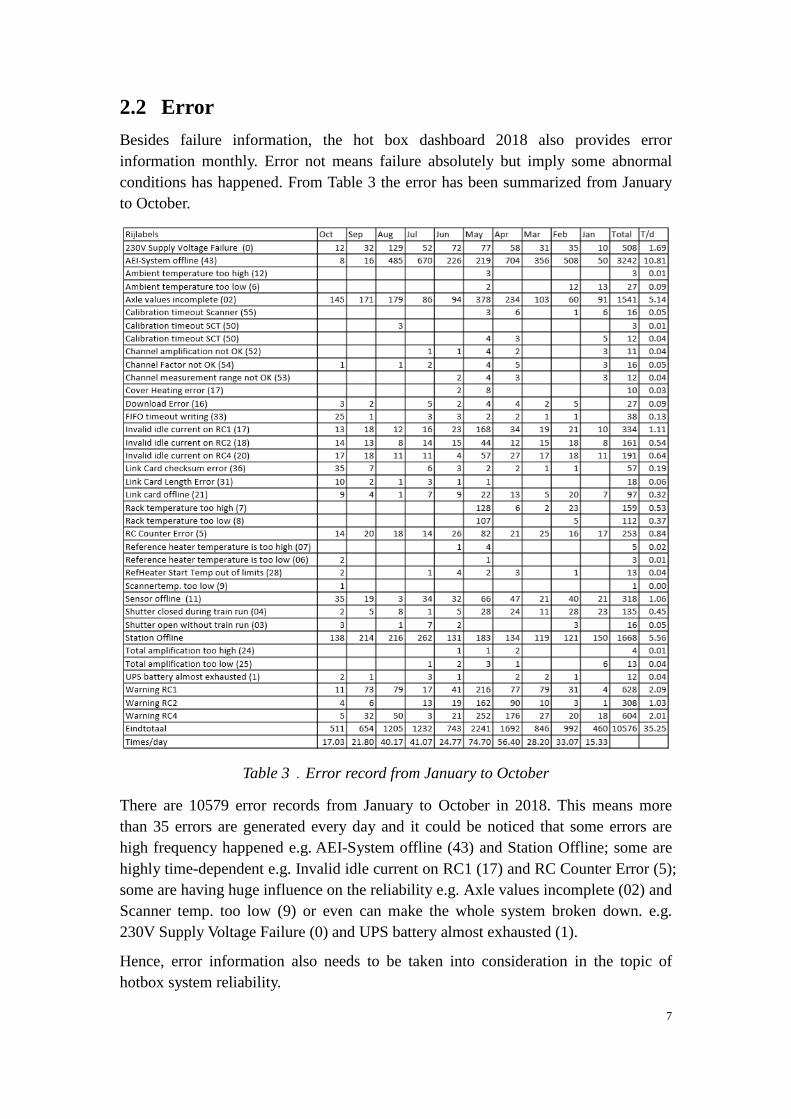
2.2 Error
Besides failure information, the hot box dashboard 2018 also provides error
information monthly. Error not means failure absolutely but imply some abnormal
conditions has happened. From Table 3 the error has been summarized from January
to October.
Table 3.Error record from January to October
There are 10579 error records from January to October in 2018. This means more
than 35 errors are generated every day and it could be noticed that some errors are
high frequency happened e.g. AEI-System offline (43) and Station Offline; some are
highly time-dependent e.g. Invalid idle current on RC1 (17) and RC Counter Error (5);
some are having huge influence on the reliability e.g. Axle values incomplete (02) and
Scanner temp. too low (9) or even can make the whole system broken down. e.g.
230V Supply Voltage Failure (0) and UPS battery almost exhausted (1).
Hence, error information also needs to be taken into consideration in the topic of
hotbox system reliability.
8
2.3 Data Reliability
No matter the failure rate and error record show good result or not, the data reliability
needs to be considered independently. Because the data can show inaccuracy or
imprecision without failure and error. It can be noticed that some historical data show
quite abnormal value or trend compare to others. This can be illustrated in Table 4 and
Figure 1 to 4.
NO Name times of
HWD
times of
HAD
percentage of
HWD
percentage of
HAD
1 0 0 193 0 0.08%
2
lower than
ambient with
accuracy
(HWD 3,
HAD 1)
0 259 0 0.10%
Table 4. temperature equals to zero or below the ambient temperature,5th-September
2018
Table 4 shows the abnormal temperature value in a percentage way. 5th Sep,2018 is a
normal day without extreme weather and failure was reported in that day and the
ambient temperature is 20 degree Celsius. Considered testing condition and sensor
accuracy[5][7][8] the temperature give below 17 degree Celsius for HWD (19 degree
Celsius for HAD) will be treated as abnormal. And zero temperature also need to be
considered because 193 testing result shows 0 which is 0.08% of the total data
gathered on that day. Another 259 data show below 19 but not zero which is 0.1%.
Hence it can be found that there nearly 0.2% of data are abnormal.
All the abnormal data are found in the terms of HAD but nothing found in HWD. This
is because HWD has a testing range from 80 to 650 degree Celsius which means it
will show 80 for all the value below 80 degree Celsius. This leads to the low-
temperature testing cannot be found in HWD data.
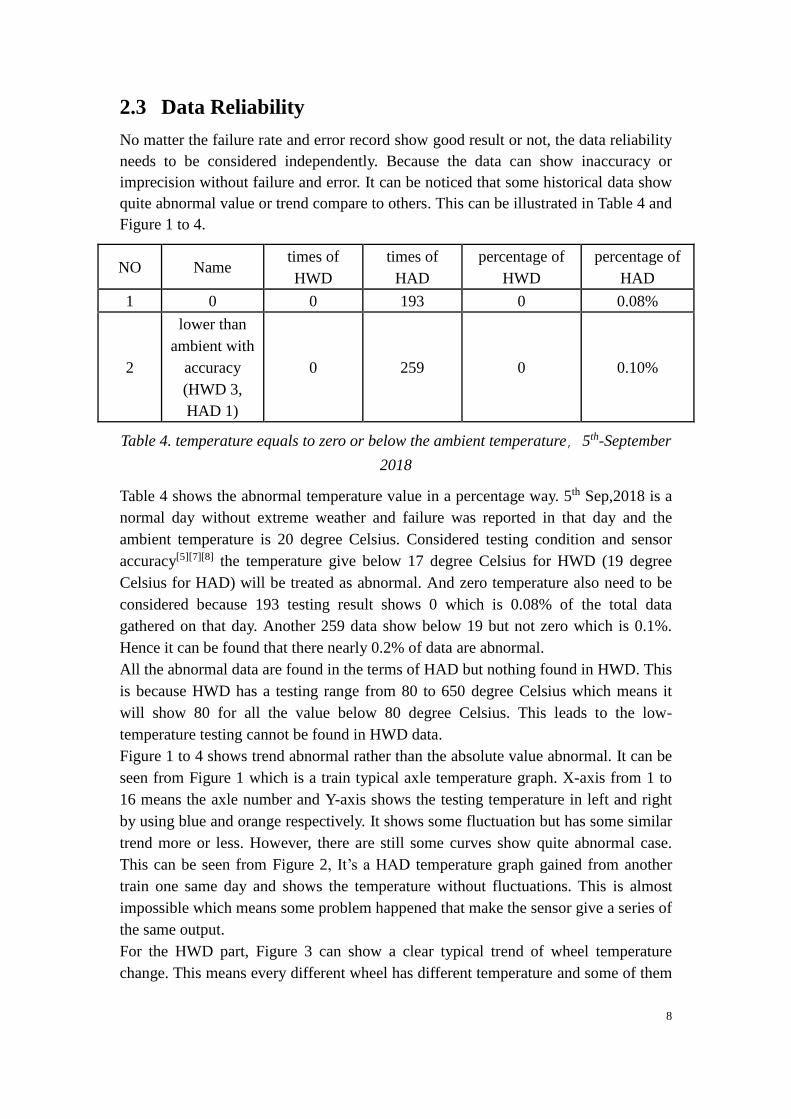
Figure 1 to 4 shows trend abnormal rather than the absolute value abnormal. It can be
seen from Figure 1 which is a train typical axle temperature graph. X-axis from 1 to
16 means the axle number and Y-axis shows the testing temperature in left and right
by using blue and orange respectively. It shows some fluctuation but has some similar
trend more or less. However, there are still some curves show quite abnormal case.
This can be seen from Figure 2, It’s a HAD temperature graph gained from another
train one same day and shows the temperature without fluctuations. This is almost
impossible which means some problem happened that make the sensor give a series of
the same output.
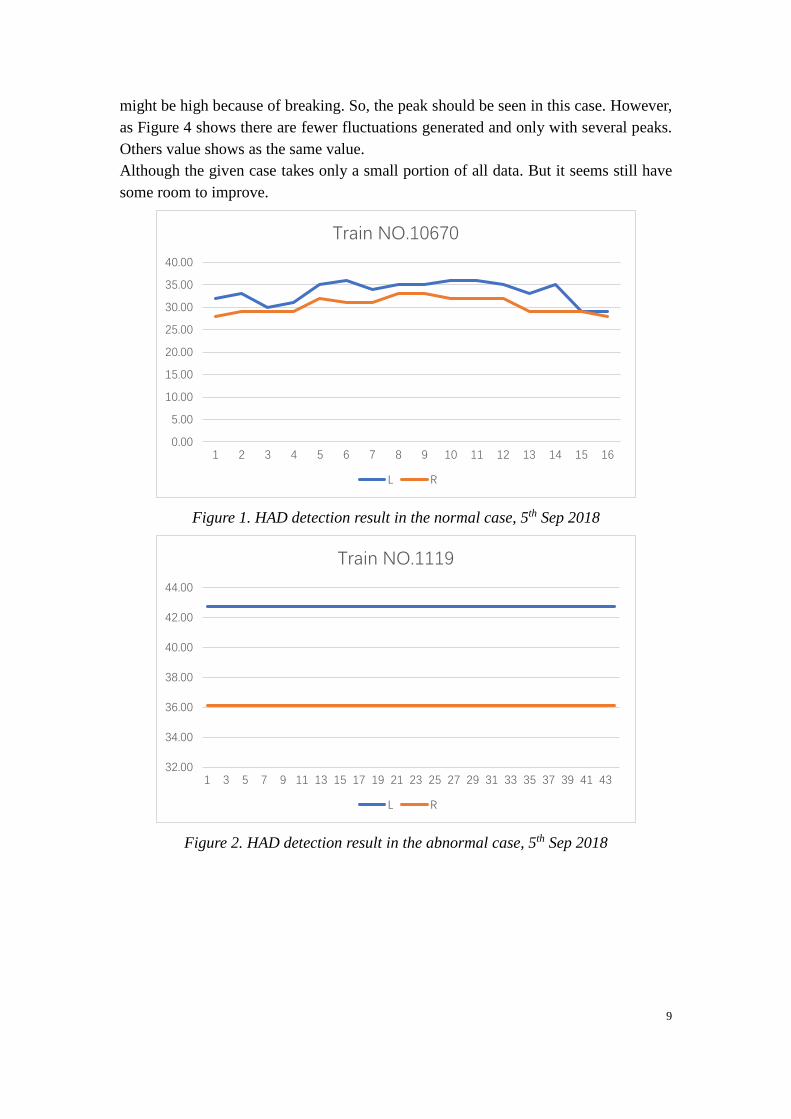
For the HWD part, Figure 3 can show a clear typical trend of wheel temperature
change. This means every different wheel has different temperature and some of them
9
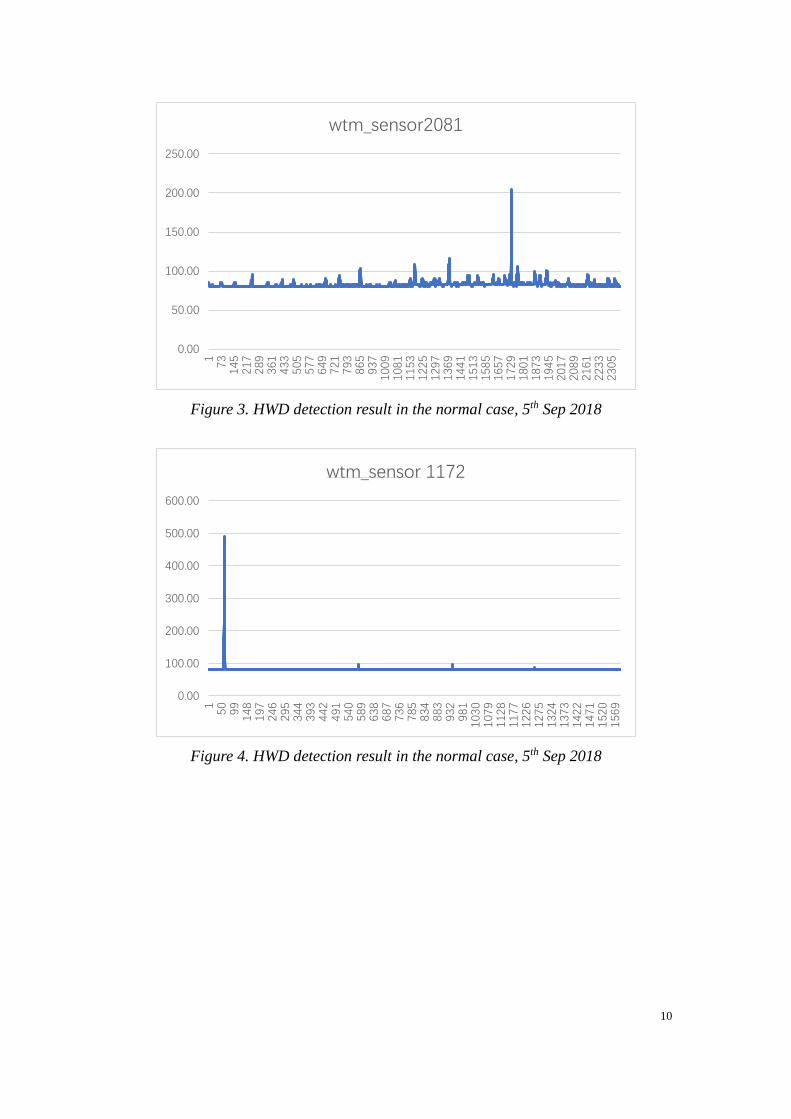
might be high because of breaking. So, the peak should be seen in this case. However,
as Figure 4 shows there are fewer fluctuations generated and only with several peaks.
Others value shows as the same value.
Although the given case takes only a small portion of all data. But it seems still have
some room to improve.
Figure 1. HAD detection result in the normal case, 5th Sep 2018
Figure 2. HAD detection result in the abnormal case, 5th Sep 2018
0.00
5.00
10.00
15.00
20.00
25.00
30.00
35.00
40.00
1 2 3 4 5 6 7 8 9 10 11 12 13 14 15 16
Train NO.10670
L R
32.00
34.00
36.00
38.00
40.00
42.00
44.00
1 3 5 7 9 11 13 15 17 19 21 23 25 27 29 31 33 35 37 39 41 43
Train NO.1119
L R
10
Figure 3. HWD detection result in the normal case, 5th Sep 2018
Figure 4. HWD detection result in the normal case, 5th Sep 2018
0.00
50.00
100.00
150.00
200.00
250.00
173
145
217
289
361
433
505
577
649
721
793
865
937
100
9108
1115
3122
5129
7136
9144
1151
3158
5165
7172
9180
1187
3194
5201
7208
9216
1223
3230
5
wtm_sensor2081
0.00
100.00
200.00
300.00
400.00
500.00
600.00
150
99
148
197
246
295
344
393
442
491
540
589
638
687
736
785
834
883
932
981
103
0107
9112
8117
7122
6127
5132
4137
3142
2147
1152
0156
9
wtm_sensor 1172
11
3 Working Plan
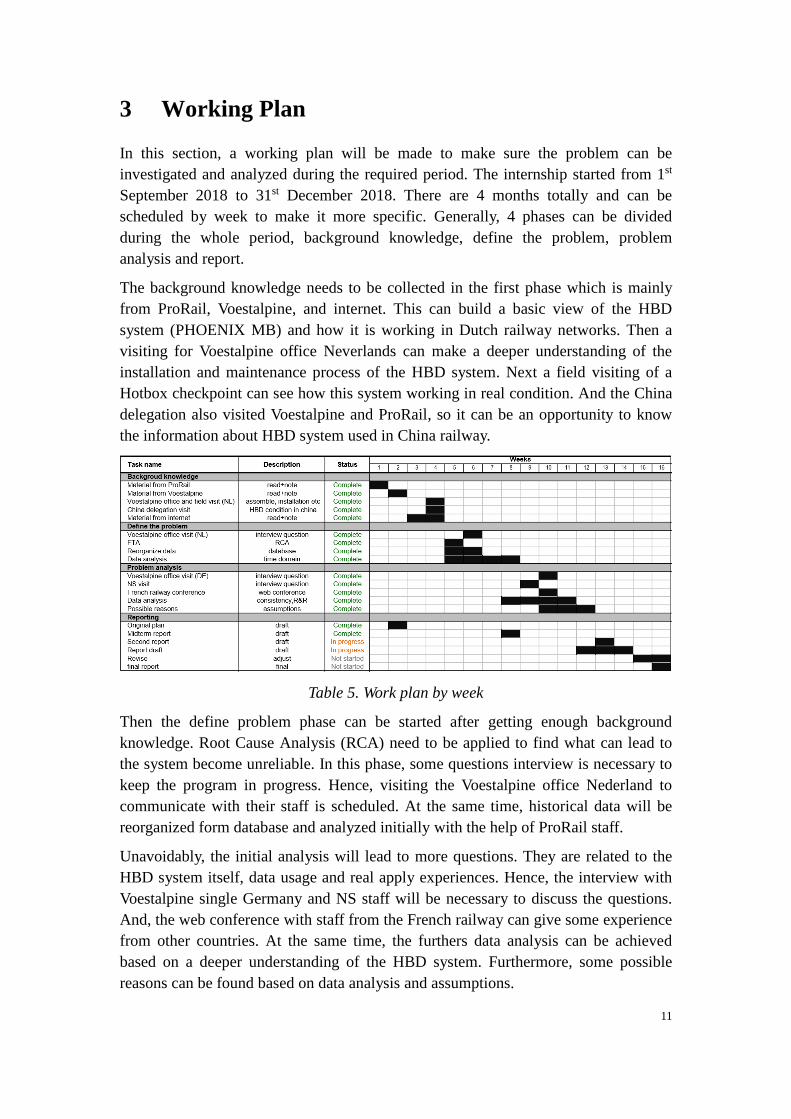
In this section, a working plan will be made to make sure the problem can be
investigated and analyzed during the required period. The internship started from 1st
September 2018 to 31st December 2018. There are 4 months totally and can be
scheduled by week to make it more specific. Generally, 4 phases can be divided
during the whole period, background knowledge, define the problem, problem
analysis and report.
The background knowledge needs to be collected in the first phase which is mainly
from ProRail, Voestalpine, and internet. This can build a basic view of the HBD
system (PHOENIX MB) and how it is working in Dutch railway networks. Then a
visiting for Voestalpine office Neverlands can make a deeper understanding of the
installation and maintenance process of the HBD system. Next a field visiting of a
Hotbox checkpoint can see how this system working in real condition. And the China
delegation also visited Voestalpine and ProRail, so it can be an opportunity to know
the information about HBD system used in China railway.
Table 5. Work plan by week
Then the define problem phase can be started after getting enough background
knowledge. Root Cause Analysis (RCA) need to be applied to find what can lead to
the system become unreliable. In this phase, some questions interview is necessary to
keep the program in progress. Hence, visiting the Voestalpine office Nederland to
communicate with their staff is scheduled. At the same time, historical data will be
reorganized form database and analyzed initially with the help of ProRail staff.
Unavoidably, the initial analysis will lead to more questions. They are related to the
HBD system itself, data usage and real apply experiences. Hence, the interview with
Voestalpine single Germany and NS staff will be necessary to discuss the questions.
And, the web conference with staff from the French railway can give some experience
from other countries. At the same time, the furthers data analysis can be achieved
based on a deeper understanding of the HBD system. Furthermore, some possible
reasons can be found based on data analysis and assumptions.

12
Last, reporting is also important to be taken into consideration. It is not only
containing the final report but also the progress meeting every Monday with company
supervisor, presentation of progress for colleagues and discuss progress with the
university supervisor. The final report needs to meet some requirements obey the
internship website, so the revised time will be scheduled to make sure it can suitable
for the requirements. And the progress meeting every Monday with company
supervisor can keep the project in a good rhythm and receive feedback and advice
from the supervisor. Presentation of progress for colleagues can get more advice from
different people with different perspective and knowledge. Discuss progress with the
university supervisor will generate more academic advice and perspectives.
And until this time most of the phases have been done already as is shown in Table 5.
The plan shows only 16 weeks, but it can be adjusted when the delay happens or in
case of unexpected situations.
13
4 Root Cause Analysis (FTA & FMEA)
The reliability problem become clearer after the problem defines process presented in
section 2. Before solving the problem, the reason behind reliability problems must be
identified first. Hence, Root Cause Analysis (RCA) will be applied in this section. It is
a part of a problem-solving process used to examine and determine the root causes or
core reasons of any failure of safety observance, accident or issues related to health,
environment, quality, reliability, and production etc. In his case, only the root cause of
HBD unreliability will be focused on. Because only when the definite underlying
causes are identified and determined, the corrective actions to be taken for preventing
any unwanted event and betterment can be achieved in the future.
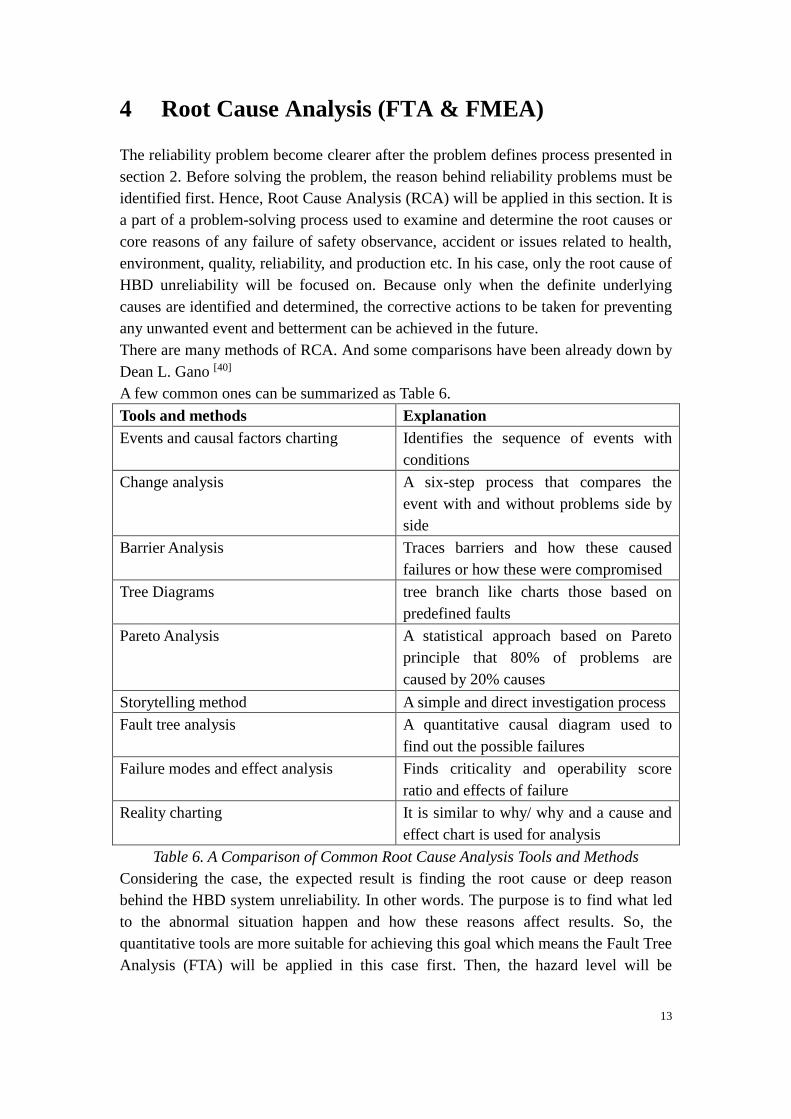
There are many methods of RCA. And some comparisons have been already down by
Dean L. Gano [40]
A few common ones can be summarized as Table 6.
Tools and methods Explanation
Events and causal factors charting Identifies the sequence of events with
conditions
Change analysis A six-step process that compares the
event with and without problems side by
side
Barrier Analysis Traces barriers and how these caused
failures or how these were compromised
Tree Diagrams tree branch like charts those based on
predefined faults
Pareto Analysis A statistical approach based on Pareto
principle that 80% of problems are
caused by 20% causes
Storytelling method A simple and direct investigation process
Fault tree analysis A quantitative causal diagram used to
find out the possible failures
Failure modes and effect analysis Finds criticality and operability score
ratio and effects of failure
Reality charting It is similar to why/ why and a cause and
effect chart is used for analysis
Table 6. A Comparison of Common Root Cause Analysis Tools and Methods
Considering the case, the expected result is finding the root cause or deep reason
behind the HBD system unreliability. In other words. The purpose is to find what led
to the abnormal situation happen and how these reasons affect results. So, the
quantitative tools are more suitable for achieving this goal which means the Fault Tree
Analysis (FTA) will be applied in this case first. Then, the hazard level will be
14
identified to make the research focus on the most important failure. This can be
achieved by using Failure Modes and Effect Analysis.[40]
4.1 Fault Tree Analysis
The Fault Tree Analysis result general graph can be seen in Appendix Figure1. Fault
Tree Analysis-general view. To be more specific, the detail of FTA can be shown as
Figure 5 to Figure 8.
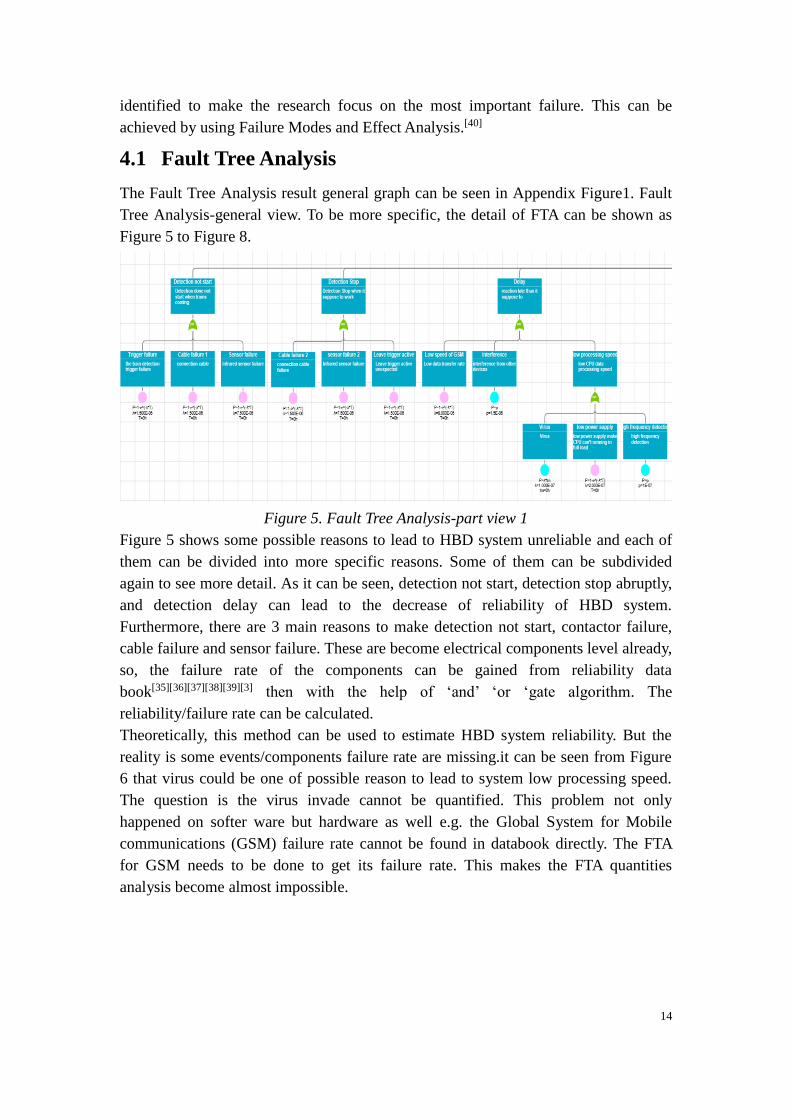
Figure 5. Fault Tree Analysis-part view 1
Figure 5 shows some possible reasons to lead to HBD system unreliable and each of
them can be divided into more specific reasons. Some of them can be subdivided
again to see more detail. As it can be seen, detection not start, detection stop abruptly,
and detection delay can lead to the decrease of reliability of HBD system.
Furthermore, there are 3 main reasons to make detection not start, contactor failure,
cable failure and sensor failure. These are become electrical components level already,
so, the failure rate of the components can be gained from reliability data
book[35][36][37][38][39][3] then with the help of ‘and’ ‘or ‘gate algorithm. The
reliability/failure rate can be calculated.
Theoretically, this method can be used to estimate HBD system reliability. But the
reality is some events/components failure rate are missing.it can be seen from Figure
6 that virus could be one of possible reason to lead to system low processing speed.
The question is the virus invade cannot be quantified. This problem not only
happened on softer ware but hardware as well e.g. the Global System for Mobile
communications (GSM) failure rate cannot be found in databook directly. The FTA
for GSM needs to be done to get its failure rate. This makes the FTA quantities
analysis become almost impossible.
15
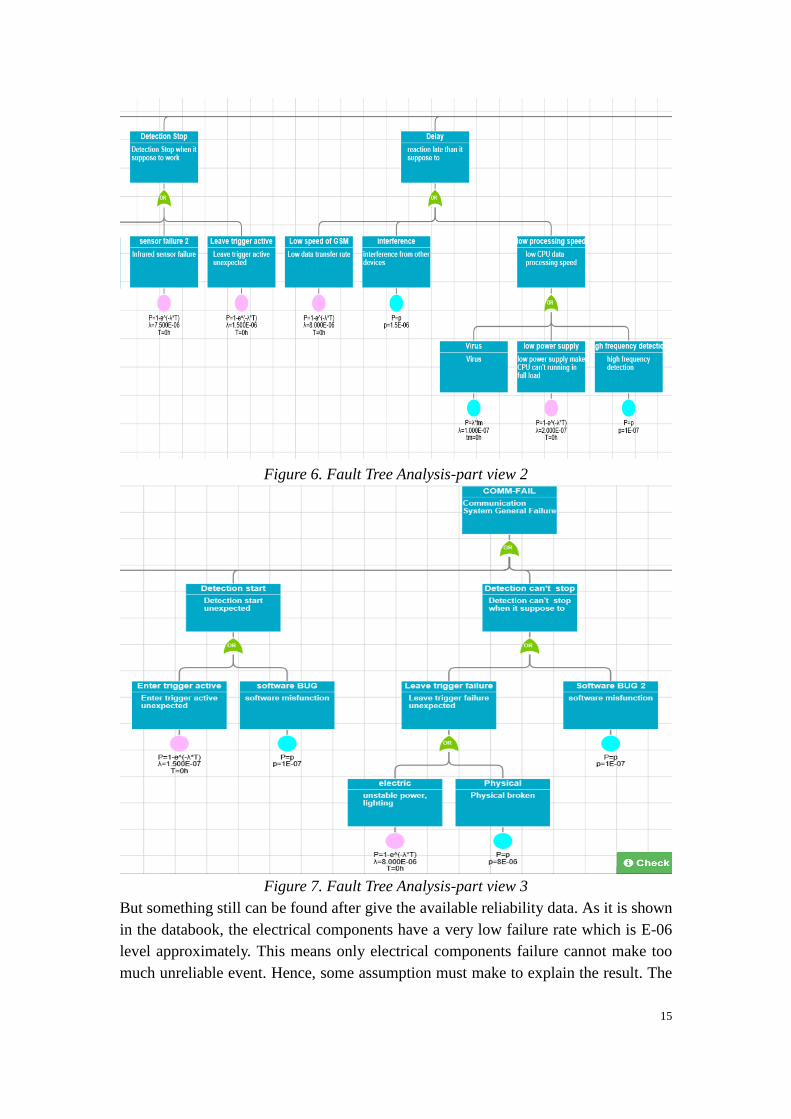
Figure 6. Fault Tree Analysis-part view 2
Figure 7. Fault Tree Analysis-part view 3
But something still can be found after give the available reliability data. As it is shown
in the databook, the electrical components have a very low failure rate which is E-06
level approximately. This means only electrical components failure cannot make too
much unreliable event. Hence, some assumption must make to explain the result. The
16
software bug rate and trigger wrong active rate has been assumed as E-07 level as it
can be seen from Figure 7.
However, this is still a very small failure rate. There must be some other reason to
contribute to the result. So, the FTA should be subdivided again until fond possible
solutions.
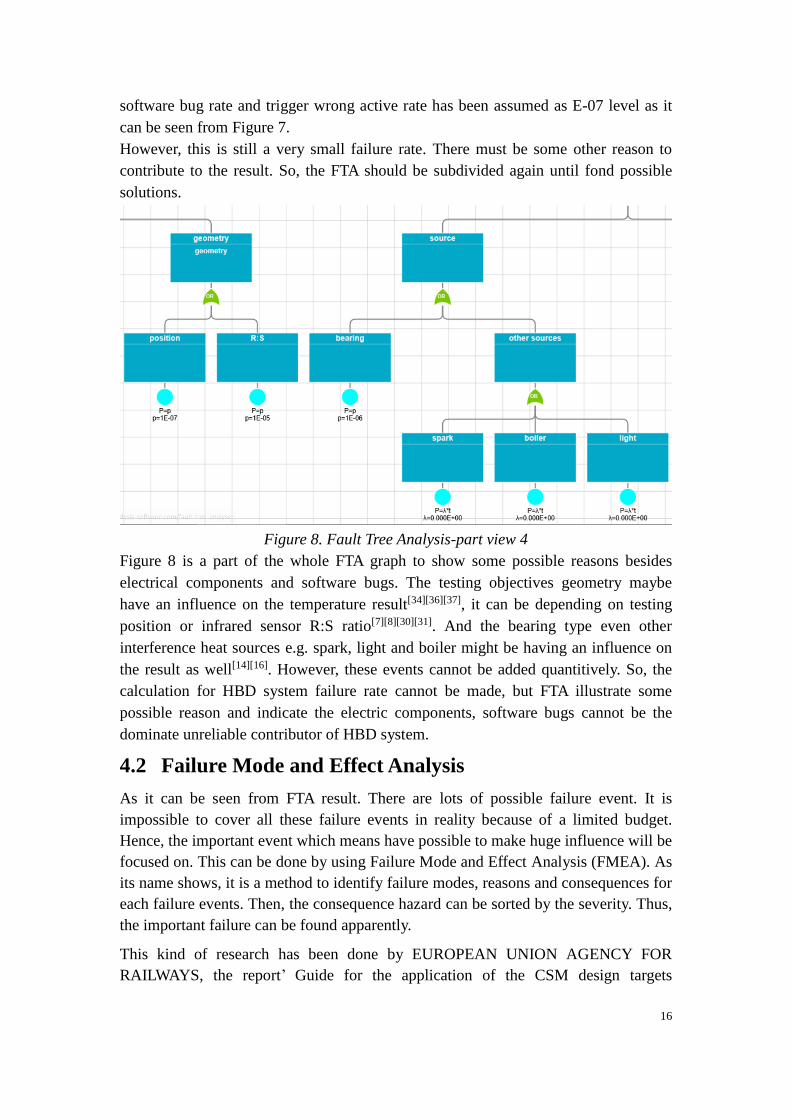
Figure 8. Fault Tree Analysis-part view 4
Figure 8 is a part of the whole FTA graph to show some possible reasons besides
electrical components and software bugs. The testing objectives geometry maybe
have an influence on the temperature result[34][36][37], it can be depending on testing
position or infrared sensor R:S ratio[7][8][30][31]. And the bearing type even other
interference heat sources e.g. spark, light and boiler might be having an influence on
the result as well[14][16]. However, these events cannot be added quantitively. So, the
calculation for HBD system failure rate cannot be made, but FTA illustrate some
possible reason and indicate the electric components, software bugs cannot be the
dominate unreliable contributor of HBD system.
4.2 Failure Mode and Effect Analysis
As it can be seen from FTA result. There are lots of possible failure event. It is
impossible to cover all these failure events in reality because of a limited budget.
Hence, the important event which means have possible to make huge influence will be
focused on. This can be done by using Failure Mode and Effect Analysis (FMEA). As
its name shows, it is a method to identify failure modes, reasons and consequences for
each failure events. Then, the consequence hazard can be sorted by the severity. Thus,
the important failure can be found apparently.
This kind of research has been done by EUROPEAN UNION AGENCY FOR
RAILWAYS, the report’ Guide for the application of the CSM design targets
17
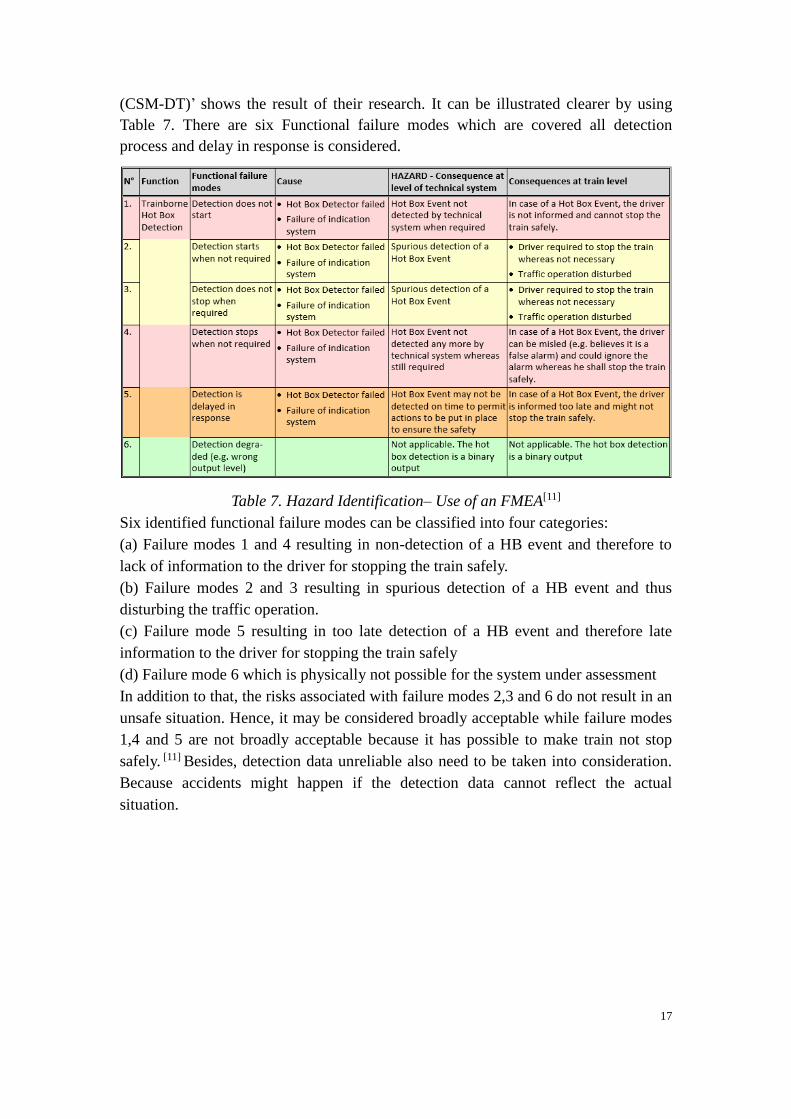
(CSM-DT)’ shows the result of their research. It can be illustrated clearer by using
Table 7. There are six Functional failure modes which are covered all detection
process and delay in response is considered.
Table 7. Hazard Identification– Use of an FMEA[11]
Six identified functional failure modes can be classified into four categories:
(a) Failure modes 1 and 4 resulting in non-detection of a HB event and therefore to
lack of information to the driver for stopping the train safely.
(b) Failure modes 2 and 3 resulting in spurious detection of a HB event and thus
disturbing the traffic operation.
(c) Failure mode 5 resulting in too late detection of a HB event and therefore late
information to the driver for stopping the train safely
(d) Failure mode 6 which is physically not possible for the system under assessment
In addition to that, the risks associated with failure modes 2,3 and 6 do not result in an
unsafe situation. Hence, it may be considered broadly acceptable while failure modes
1,4 and 5 are not broadly acceptable because it has possible to make train not stop
safely. [11] Besides, detection data unreliable also need to be taken into consideration.
Because accidents might happen if the detection data cannot reflect the actual
situation.
18
5 Data Analysis
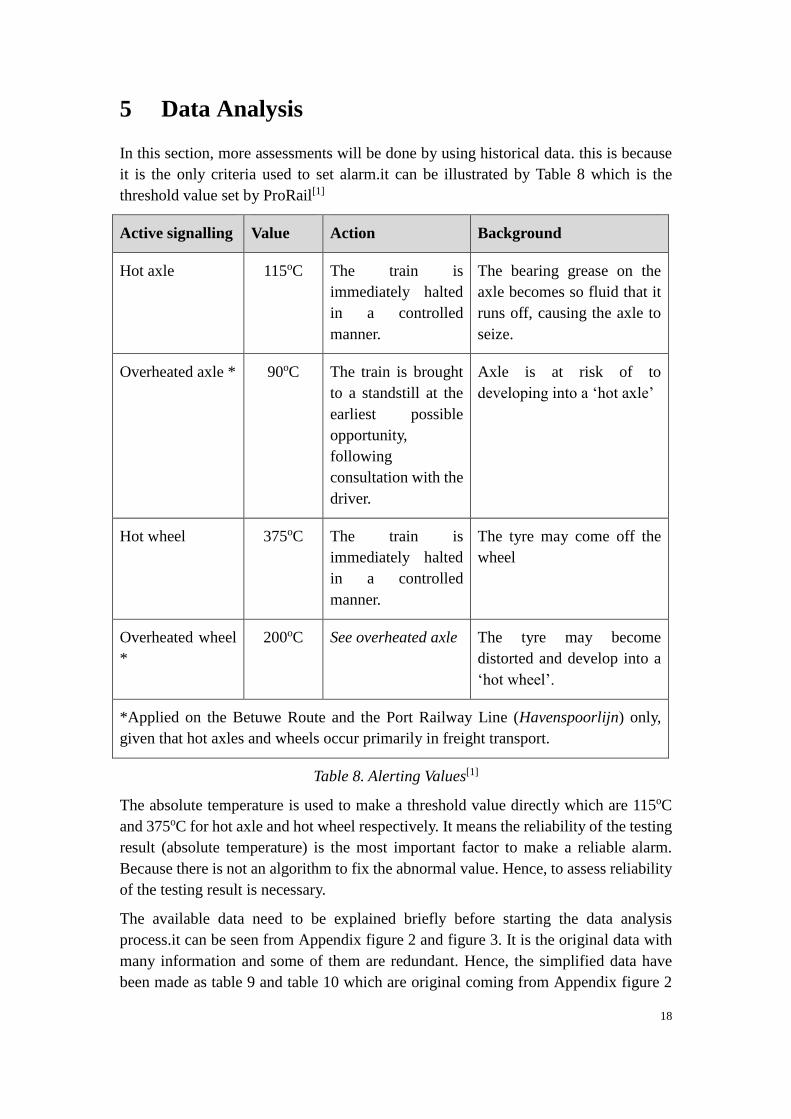
In this section, more assessments will be done by using historical data. this is because
it is the only criteria used to set alarm.it can be illustrated by Table 8 which is the
threshold value set by ProRail[1]
Active signalling Value Action Background
Hot axle 115oC The train is
immediately halted
in a controlled
manner.
The bearing grease on the
axle becomes so fluid that it
runs off, causing the axle to
seize.
Overheated axle * 90oC The train is brought
to a standstill at the
earliest possible
opportunity,
following
consultation with the
driver.
Axle is at risk of to
developing into a ‘hot axle’
Hot wheel 375oC The train is
immediately halted
in a controlled
manner.
The tyre may come off the
wheel
Overheated wheel
*
200oC See overheated axle The tyre may become
distorted and develop into a
‘hot wheel’.
*Applied on the Betuwe Route and the Port Railway Line (Havenspoorlijn) only,
given that hot axles and wheels occur primarily in freight transport.
Table 8. Alerting Values[1]
The absolute temperature is used to make a threshold value directly which are 115oC
and 375oC for hot axle and hot wheel respectively. It means the reliability of the testing
result (absolute temperature) is the most important factor to make a reliable alarm.
Because there is not an algorithm to fix the abnormal value. Hence, to assess reliability
of the testing result is necessary.
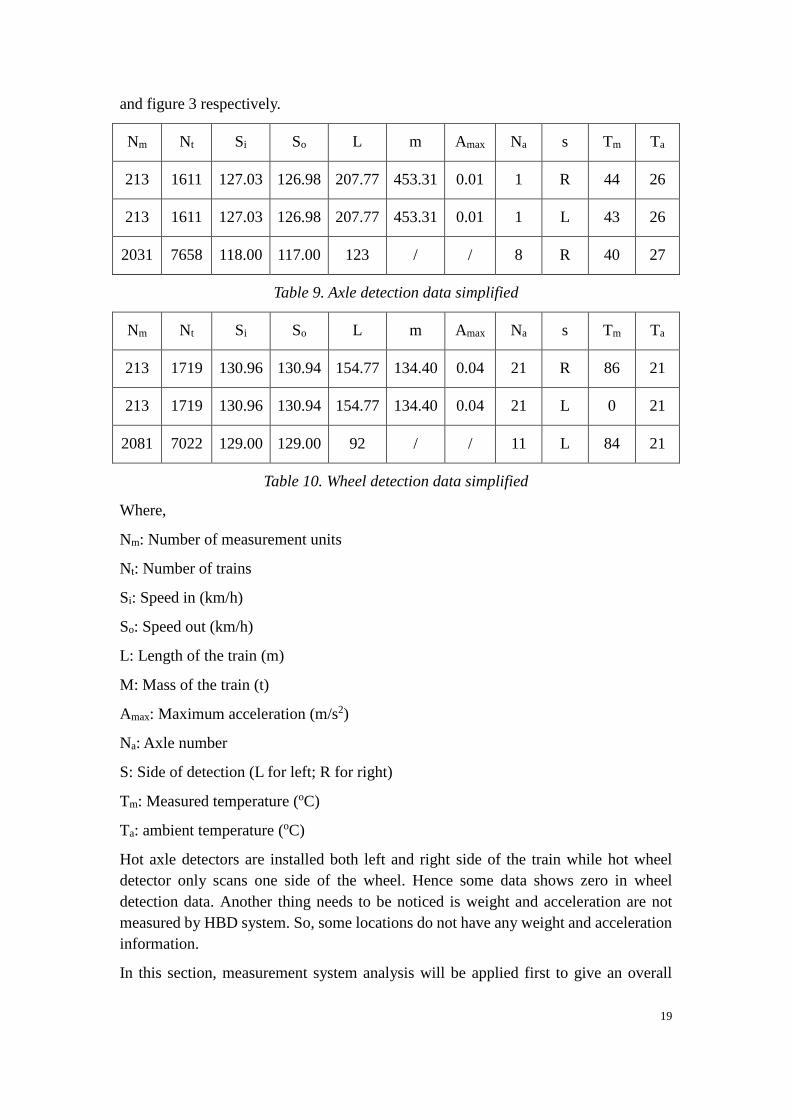
The available data need to be explained briefly before starting the data analysis
process.it can be seen from Appendix figure 2 and figure 3. It is the original data with
many information and some of them are redundant. Hence, the simplified data have
been made as table 9 and table 10 which are original coming from Appendix figure 2
19
and figure 3 respectively.
Nm Nt Si So L m Amax Na s Tm Ta
213 1611 127.03 126.98 207.77 453.31 0.01 1 R 44 26
213 1611 127.03 126.98 207.77 453.31 0.01 1 L 43 26
2031 7658 118.00 117.00 123 / / 8 R 40 27
Table 9. Axle detection data simplified
Nm Nt Si So L m Amax Na s Tm Ta
213 1719 130.96 130.94 154.77 134.40 0.04 21 R 86 21
213 1719 130.96 130.94 154.77 134.40 0.04 21 L 0 21
2081 7022 129.00 129.00 92 / / 11 L 84 21
Table 10. Wheel detection data simplified
Where,
Nm: Number of measurement units
Nt: Number of trains
Si: Speed in (km/h)
So: Speed out (km/h)
L: Length of the train (m)
M: Mass of the train (t)
Amax: Maximum acceleration (m/s2)
Na: Axle number
S: Side of detection (L for left; R for right)
Tm: Measured temperature (oC)
Ta: ambient temperature (oC)
Hot axle detectors are installed both left and right side of the train while hot wheel
detector only scans one side of the wheel. Hence some data shows zero in wheel
detection data. Another thing needs to be noticed is weight and acceleration are not
measured by HBD system. So, some locations do not have any weight and acceleration
information.
In this section, measurement system analysis will be applied first to give an overall
20
view of the HBD system. Then, assessing reliability by calculating internal and external
reliability will be made to check the across items-consistency and self-consistency. Last,
a full factorial design can show which factor give the most contribution to the testing
temperature.
5.1 Measurement System Analysis (R & R Study)
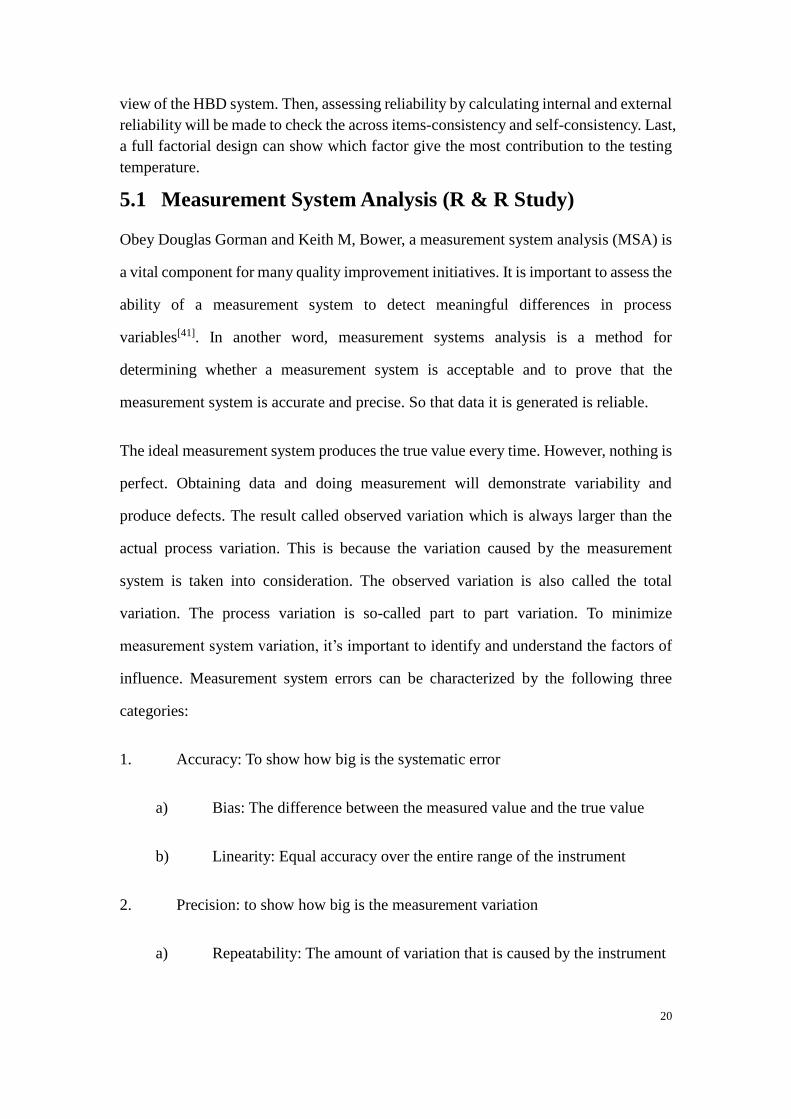
Obey Douglas Gorman and Keith M, Bower, a measurement system analysis (MSA) is
a vital component for many quality improvement initiatives. It is important to assess the
ability of a measurement system to detect meaningful differences in process
variables[41]. In another word, measurement systems analysis is a method for
determining whether a measurement system is acceptable and to prove that the
measurement system is accurate and precise. So that data it is generated is reliable.
The ideal measurement system produces the true value every time. However, nothing is
perfect. Obtaining data and doing measurement will demonstrate variability and
produce defects. The result called observed variation which is always larger than the
actual process variation. This is because the variation caused by the measurement
system is taken into consideration. The observed variation is also called the total
variation. The process variation is so-called part to part variation. To minimize
measurement system variation, it’s important to identify and understand the factors of
influence. Measurement system errors can be characterized by the following three
categories:
1. Accuracy: To show how big is the systematic error
a) Bias: The difference between the measured value and the true value
b) Linearity: Equal accuracy over the entire range of the instrument
2. Precision: to show how big is the measurement variation
a) Repeatability: The amount of variation that is caused by the instrument
21
b) Reproducibility: The amount of variation that is caused by the
procedure, operator, etc.
c) Uniformity: Extent to which measurement variation is constant over the
whole range of the measurement scale
3. Stability: The measurement system stable over time or not
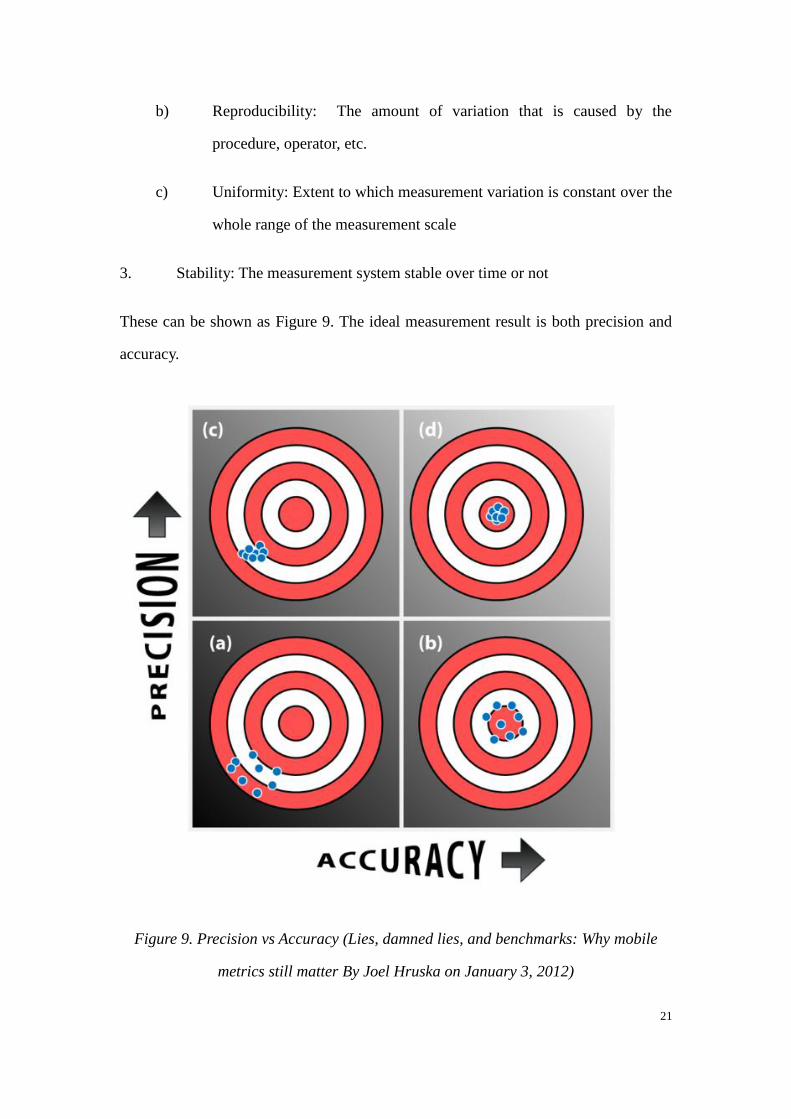
These can be shown as Figure 9. The ideal measurement result is both precision and
accuracy.
Figure 9. Precision vs Accuracy (Lies, damned lies, and benchmarks: Why mobile
metrics still matter By Joel Hruska on January 3, 2012)
22
However, to bake to the HBD system history data, the true value is unknown. Hence,
accuracy cannot be accessed because of the bias and linearity cannot be calculated. The
only thing can be applied for the data is the precision assessment. For a continuous
response variable, this is determined by amount of total variation which from the
measurement process. This includes variation caused by the measurement instrument
and the measurement process. The amount of precision variability can be determined
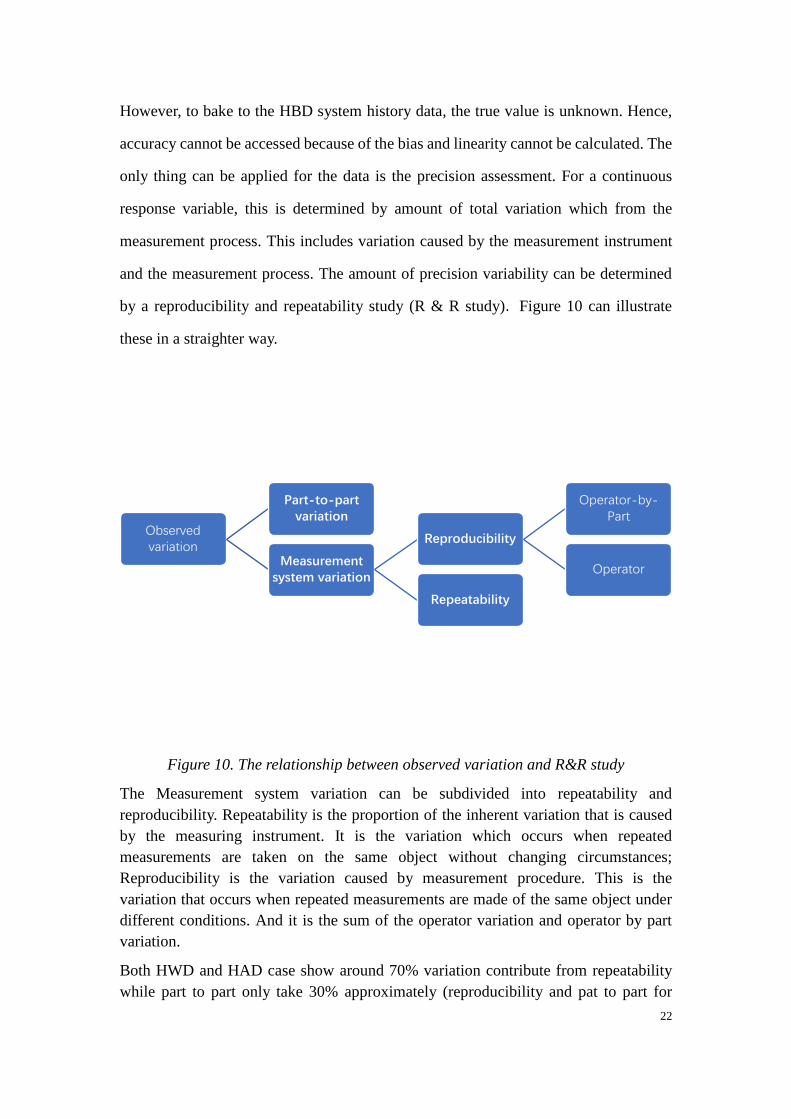
by a reproducibility and repeatability study (R & R study). Figure 10 can illustrate
these in a straighter way.
Figure 10. The relationship between observed variation and R&R study
The Measurement system variation can be subdivided into repeatability and
reproducibility. Repeatability is the proportion of the inherent variation that is caused
by the measuring instrument. It is the variation which occurs when repeated
measurements are taken on the same object without changing circumstances;
Reproducibility is the variation caused by measurement procedure. This is the
variation that occurs when repeated measurements are made of the same object under
different conditions. And it is the sum of the operator variation and operator by part
variation.
Both HWD and HAD case show around 70% variation contribute from repeatability
while part to part only take 30% approximately (reproducibility and pat to part for
Observed variation
Part-to-part variation
Measurement system variation
Reproducibility
Operator-by-Part
Operator
Repeatability
23
HAD because it has both left and right value from the same axle). Which means the
main error is caused by the instrument aspects. To be more specific, it could be the
variation due to the measurement device, operators, parts, conditions. This can be
illustrated better by take HWD sensor 1191 and HAD sensor 213
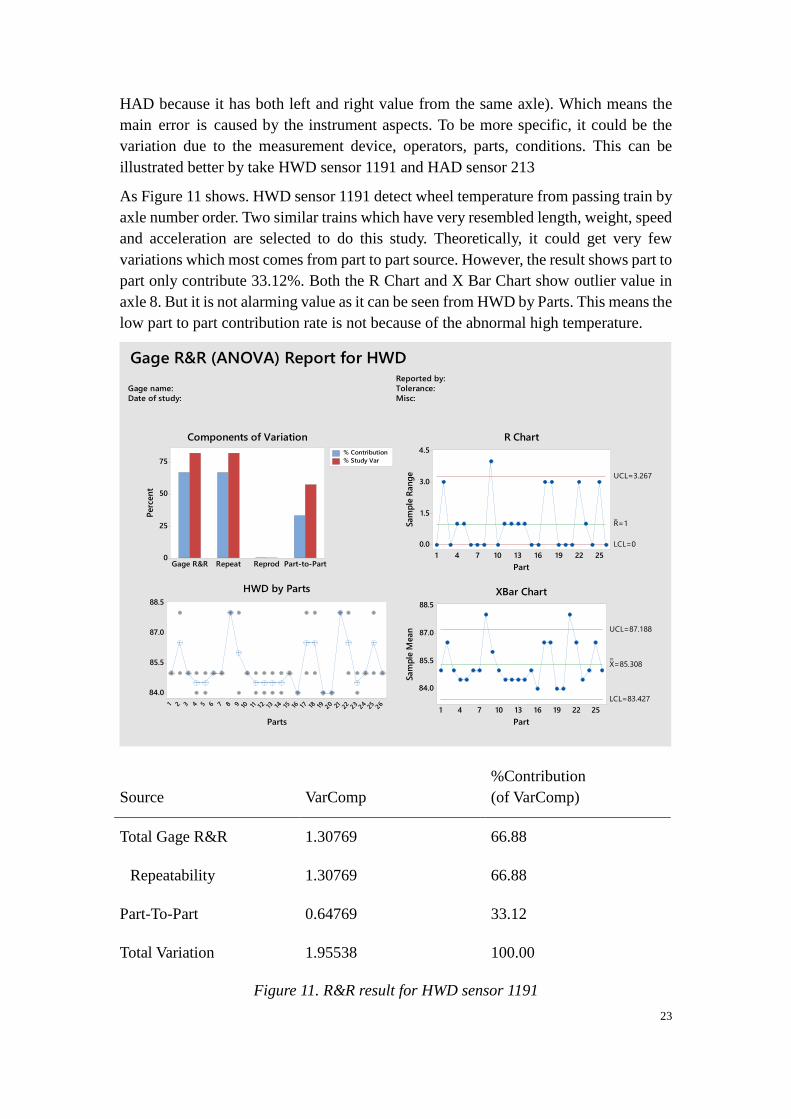
As Figure 11 shows. HWD sensor 1191 detect wheel temperature from passing train by
axle number order. Two similar trains which have very resembled length, weight, speed
and acceleration are selected to do this study. Theoretically, it could get very few
variations which most comes from part to part source. However, the result shows part to
part only contribute 33.12%. Both the R Chart and X Bar Chart show outlier value in
axle 8. But it is not alarming value as it can be seen from HWD by Parts. This means the
low part to part contribution rate is not because of the abnormal high temperature.
Source VarComp
%Contribution
(of VarComp)
Total Gage R&R 1.30769 66.88
Repeatability 1.30769 66.88
Part-To-Part 0.64769 33.12
Total Variation 1.95538 100.00
Figure 11. R&R result for HWD sensor 1191
Gage name:
Date of study:
Reported by:
Tolerance:
Misc:
Part-to-PartReprodRepeatGage R&R
75
50
25
0
Perc
en
t
% Contribution
% Study Var
2625242322212019181716151413121110987654321
88.5
87.0
85.5
84.0
Parts
252219161310741
4.5
3.0
1.5
0.0
Part
Sam
ple
Ran
ge
_R=1
UCL=3.267
LCL=0
252219161310741
88.5
87.0
85.5
84.0
Part
Sam
ple
Mean
__X=85.308
UCL=87.188
LCL=83.427
Components of Variation
HWD by Parts
R Chart
XBar Chart
Gage R&R (ANOVA) Report for HWD
24
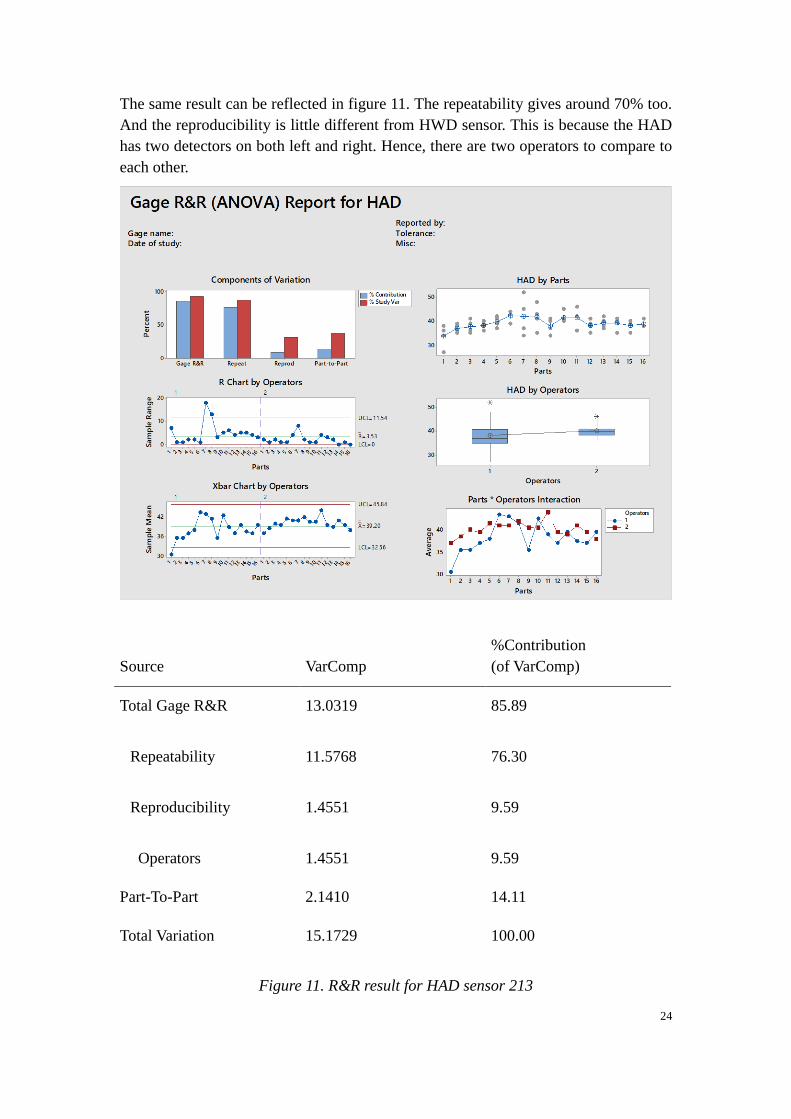
The same result can be reflected in figure 11. The repeatability gives around 70% too.
And the reproducibility is little different from HWD sensor. This is because the HAD
has two detectors on both left and right. Hence, there are two operators to compare to
each other.
Source VarComp
%Contribution
(of VarComp)
Total Gage R&R 13.0319 85.89
Repeatability 11.5768 76.30
Reproducibility 1.4551 9.59
Operators 1.4551 9.59
Part-To-Part 2.1410 14.11
Total Variation 15.1729 100.00
Figure 11. R&R result for HAD sensor 213
25
Both HWD and HAD data show the high repeatability Which means the main error
could be caused by the following aspects;
1. Variation due to the measurement device.
2. Variation due to the operators.
3. Variation due to the parts.
4. Variation due to the conditions.
The variation due to the measurement device will be assessed in 5.2; Variation due to
the conditions can be assessed in section 5.3 and others can be treated as possible
factors which will be illustrated in section 6.
5.2 Assessing Reliability
A method can be used to assess data reliability of a measurement device. Considering
what the situation is, the data is a huge amount but no reference value and
multi-testing. This is rather like psychological data analysis. The researcher has no
reference and multi-testing data from their research samples. Hence, the term
reliability in psychological research refers to the consistency of a research study or
measuring test. This can be applied in the HBD system.
To be more specific, if a train pass through 10 HBD point a day it would expect to see
a similar trend between left and right. The same analogy could be applied to a
checkpoint measure lots of similar train during resemble conditions. It would not be
considered reliable if the data shows too much unexpecting fluctuation.
If findings from the research are replicated consistently, it means they are reliable. A
correlation coefficient can be used to assess the degree of reliability. If a test is
reliable it should show a high positive correlation.
Of course, it is unlikely the exact same results will be obtained each time as
participants and situations vary, but a strong positive correlation between the results
of the same test indicates reliability.
There are two types of reliability – internal and external reliability.
Internal reliability assesses the consistency of results across items within a test.
External reliability refers to the extent to which a measure varies from one user to
another. [15]
5.2.1 Internal Reliability
The split-half method can assess the internal consistency of a test, it measures the extent
to which all parts of the test contribute equally to what is being measured.
This is done by comparing the results of one half of a test with the results from the other
half. A test can be split in half in several ways, e.g. first half and second half, or by odd
and even numbers. If the two halves of the test provide similar results this would
26
suggest that the test has internal reliability.
In HWD case, split half by odd and even is used. This is because the odd and even way
can minimize influence from the time change. The result could show a very low
correlation if use first half and second half way. But this comes from daily condition
change but not the sensor itself.
The result shows a very high correlation value which is above 0.9 for HWD data. This
means the detection system doesn’t have too much random fluctuation hence the sensor
has a very high internal reliability.
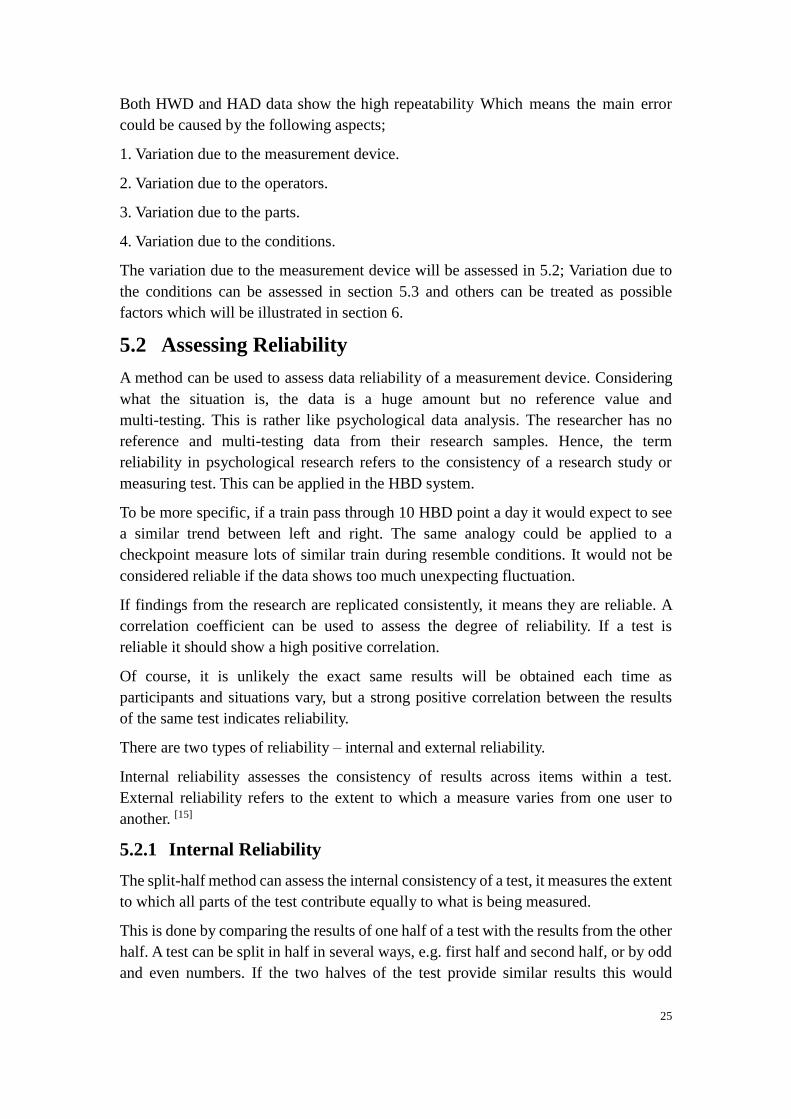
Sensor 213 is taken as an example to illustrate. As can be seen from figure 12. The 1000
data getting from HWD sensor 213 and be separated into two groups by odd and even.it
can be seen both odd and even group have some same trend fluctuation but some
different trend as well.
Figure 12. Time series plot odd, even, HWD sensor 213
To find the relationship of this group the cross-correlation can be calculated which is
presented as figure 13. The red line is positive and almost a straight line this shows a
very good correlation which is 0.9211. this means the sensor will give very similar
output for resemble condition. Hence, the sensor has very high internal reliability.

27
Figure 13. Matrix plot odd, even, HWD sensor 213
The same result can also be found in HAD case. And because of the two operators in
HAD system. Half split method can also be treated as left and right. This can be
illustrated better by figure 14. The 1000 temperature data are generated randomly to
access internal consistency like what did in HWD case. But the half split is applied by
left and right side.
Figure 14. Time series plot of L, R, HAD sensor 213
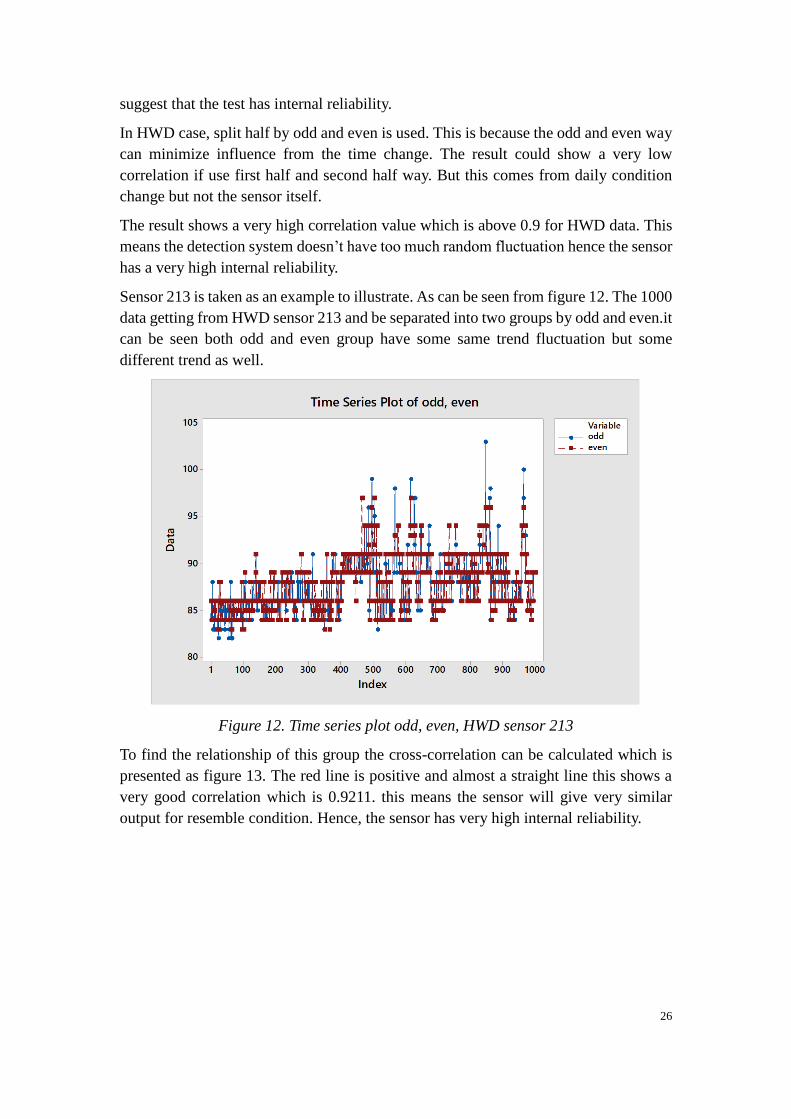
The same cross-correlation is used to access the result.it can be illustrated by figure 15.
It can be found there are still high correlation which equals to 08855 between left and
right side. Hence, it can be concluded that both HWD and HAD system have high
10095908580
100
95
90
85
odd
even
Matrix Plot of odd, even
28
internal consistency. In another word, the consistency of results across items is very
good. the system can generate corresponding value in different situations.
Figure 15. Matrix plot of L, R, HAD sensor 213
Next, the external reliability also needs to be accessed to know which a measure
varies from one use to another.
5.2.2 External Reliability
The goal to use external reliability is to know the extent which a measure varies from
one use to another. Two methods can achieve this goal. Firstly, called test-retest method,
as its name shows it measures the stability of a test over time. Secondly, called
inter-rater method which means to access to which different raters give consistent
estimates of the same behavior.
The most difficult thing to access external reliability in the HBD system case is the
actual same behavior does not exist. In another word, every testing point is checked
only one time by one sensor. This makes the inter-rater method cannot be used. Hence,
only the test-retest method is discussed here.
The test-retest method answered does the HBD system provide the same set of
responses when nothing has changed during the time passing by. Because the ideal
situation is the measurement system doesn’t fluctuate when all other things are static.
When correlating the two sets of measures if it shows very high correlations, it can be
treated as high external reliability.
This process can be explained better by using figure 16(more information can be seen
from Appendix figure 4). In HWD case, a fixed sensor is selected and find resemble
train passing through this sensor in similar conditions. The axle amount, speed, length,
weight, acceleration and even ambient temperature should be set as similar as possible.
6050403020
50
40
30
20
L
RMatrix Plot of L, R
29
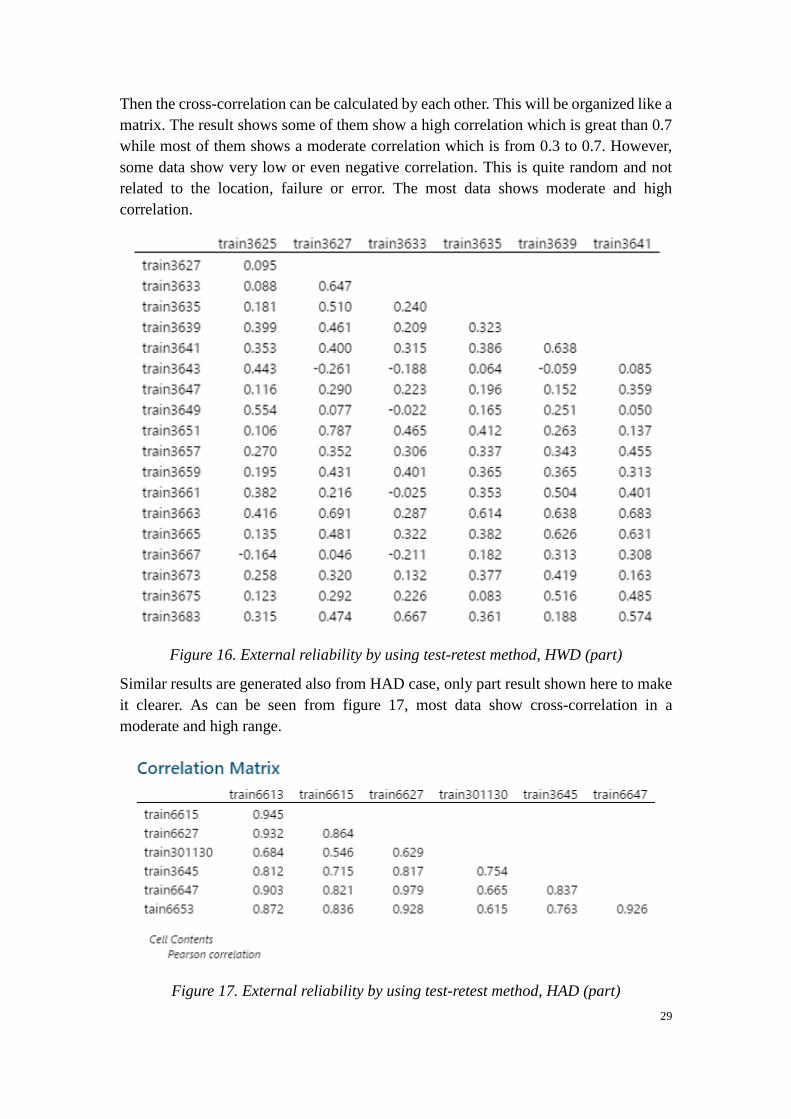
Then the cross-correlation can be calculated by each other. This will be organized like a
matrix. The result shows some of them show a high correlation which is great than 0.7
while most of them shows a moderate correlation which is from 0.3 to 0.7. However,
some data show very low or even negative correlation. This is quite random and not
related to the location, failure or error. The most data shows moderate and high
correlation.
Figure 16. External reliability by using test-retest method, HWD (part)
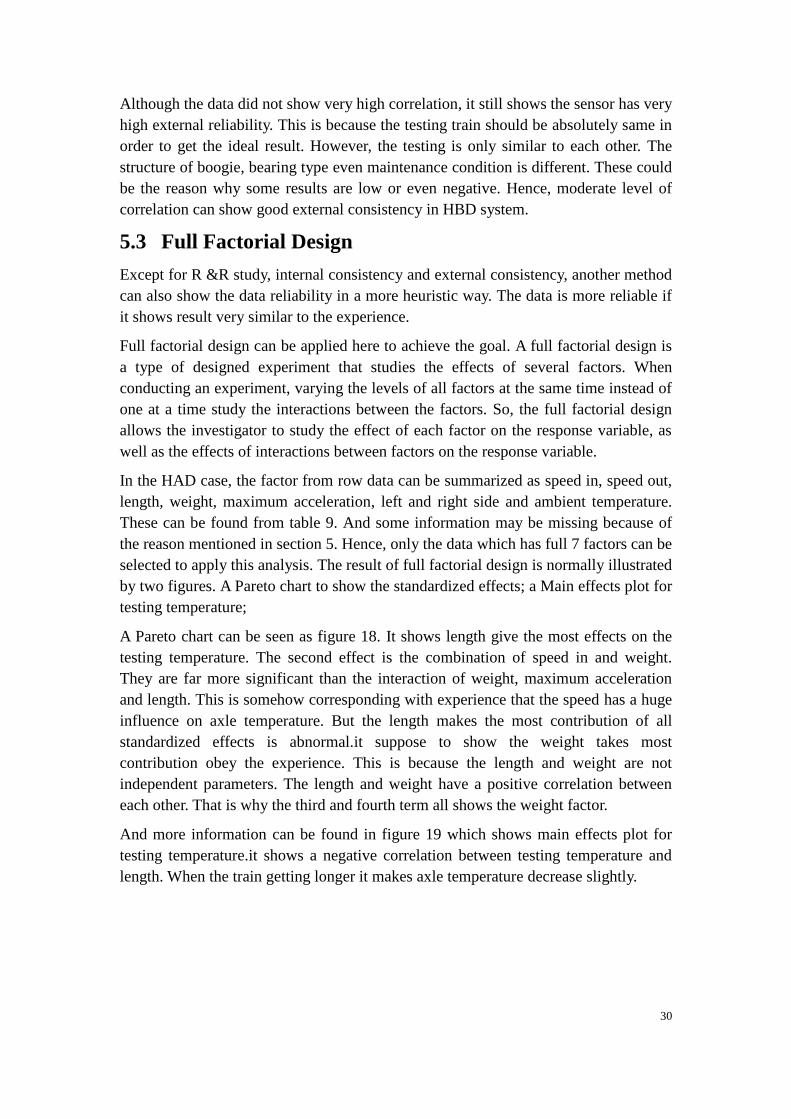
Similar results are generated also from HAD case, only part result shown here to make
it clearer. As can be seen from figure 17, most data show cross-correlation in a
moderate and high range.
Figure 17. External reliability by using test-retest method, HAD (part)
30
Although the data did not show very high correlation, it still shows the sensor has very
high external reliability. This is because the testing train should be absolutely same in
order to get the ideal result. However, the testing is only similar to each other. The
structure of boogie, bearing type even maintenance condition is different. These could
be the reason why some results are low or even negative. Hence, moderate level of
correlation can show good external consistency in HBD system.
5.3 Full Factorial Design
Except for R &R study, internal consistency and external consistency, another method
can also show the data reliability in a more heuristic way. The data is more reliable if
it shows result very similar to the experience.
Full factorial design can be applied here to achieve the goal. A full factorial design is
a type of designed experiment that studies the effects of several factors. When
conducting an experiment, varying the levels of all factors at the same time instead of
one at a time study the interactions between the factors. So, the full factorial design
allows the investigator to study the effect of each factor on the response variable, as
well as the effects of interactions between factors on the response variable.
In the HAD case, the factor from row data can be summarized as speed in, speed out,
length, weight, maximum acceleration, left and right side and ambient temperature.
These can be found from table 9. And some information may be missing because of
the reason mentioned in section 5. Hence, only the data which has full 7 factors can be
selected to apply this analysis. The result of full factorial design is normally illustrated
by two figures. A Pareto chart to show the standardized effects; a Main effects plot for
testing temperature;
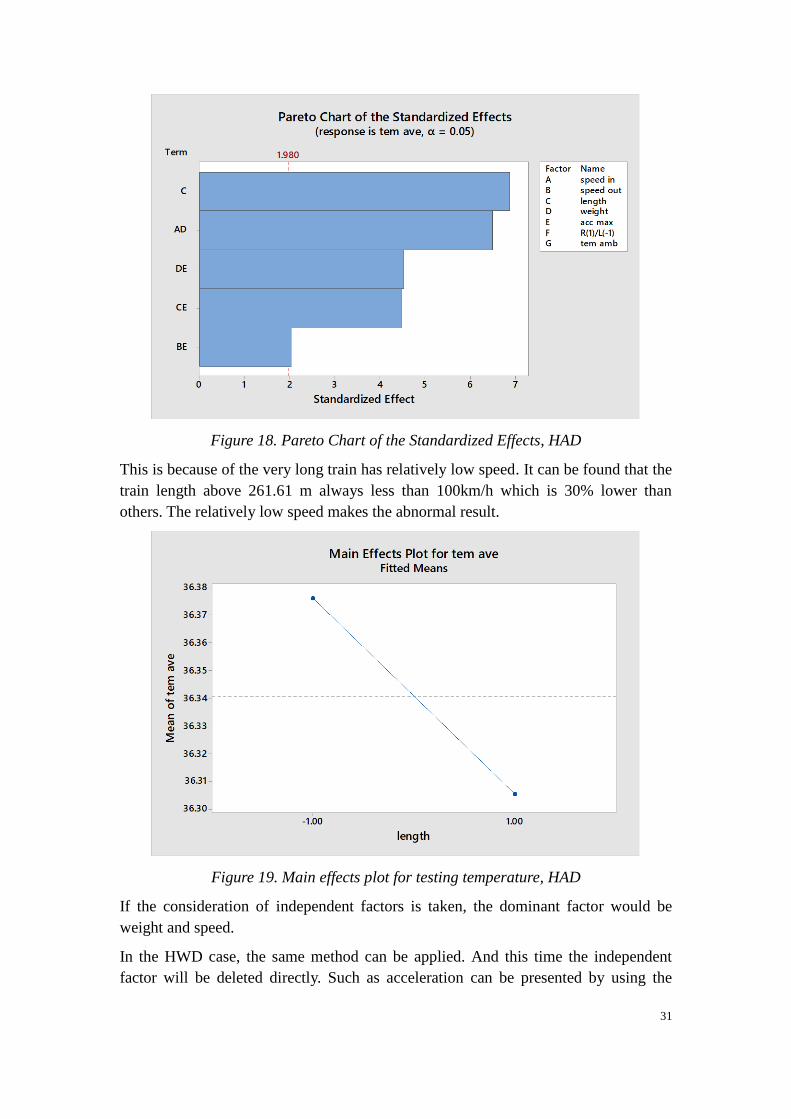
A Pareto chart can be seen as figure 18. It shows length give the most effects on the
testing temperature. The second effect is the combination of speed in and weight.
They are far more significant than the interaction of weight, maximum acceleration
and length. This is somehow corresponding with experience that the speed has a huge
influence on axle temperature. But the length makes the most contribution of all
standardized effects is abnormal.it suppose to show the weight takes most
contribution obey the experience. This is because the length and weight are not
independent parameters. The length and weight have a positive correlation between
each other. That is why the third and fourth term all shows the weight factor.
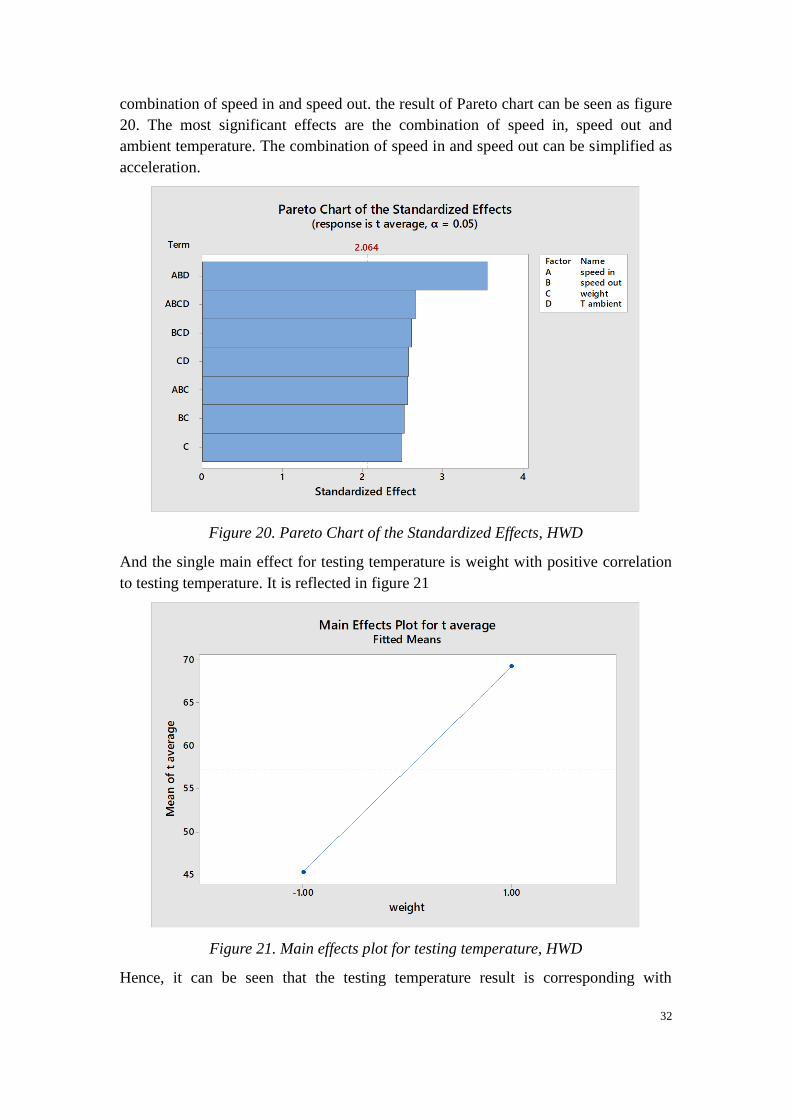
And more information can be found in figure 19 which shows main effects plot for
testing temperature.it shows a negative correlation between testing temperature and
length. When the train getting longer it makes axle temperature decrease slightly.
31
Figure 18. Pareto Chart of the Standardized Effects, HAD
This is because of the very long train has relatively low speed. It can be found that the
train length above 261.61 m always less than 100km/h which is 30% lower than
others. The relatively low speed makes the abnormal result.
Figure 19. Main effects plot for testing temperature, HAD
If the consideration of independent factors is taken, the dominant factor would be
weight and speed.
In the HWD case, the same method can be applied. And this time the independent
factor will be deleted directly. Such as acceleration can be presented by using the
32
combination of speed in and speed out. the result of Pareto chart can be seen as figure
20. The most significant effects are the combination of speed in, speed out and
ambient temperature. The combination of speed in and speed out can be simplified as
acceleration.
Figure 20. Pareto Chart of the Standardized Effects, HWD
And the single main effect for testing temperature is weight with positive correlation
to testing temperature. It is reflected in figure 21
Figure 21. Main effects plot for testing temperature, HWD
Hence, it can be seen that the testing temperature result is corresponding with
33
experience.
6 Possible Main Factors Contribute to Unreliability
As mentioned in section 5.1 the main error could be caused by the following aspects:
Variation due to the measurement device; Variation due to the operators; Variation due
to the parts; Variation due to the conditions.
The variation due to the measurement device has been assessed in 5.2 by using internal
and external consistency analysis which shows a good consistency; Variation due to the
known conditions has been assessed in section 5.3 by using full factorial design which
shows corresponding with experience. Hence, other reasons become possible factors
which can be considered from 3 parts:
1. Variation due to the parts.
2. Condition interference from outside of the given data.
3. Alarm criteria setting.
Hence, some possible main factors contribute to unreliability will be illustrated in this
section from these three aspects. All the possible main factors are summarized in Table
11
Aspects Possible Main Factors
Variation due to the parts Boogie structure
Bearing type and material
Condition interferences from outside of
the given data
Other sources e.g. spark, sunlight
Position change e.g. ‘snake motion’,
distance changes
Without people decision
Alarm criteria setting Use absolute temperature directly
Table 11. possible main factors
6.1 Variation Due to the Parts
There are multiple types of trains running in Dutch railway network. Some of them
have different types of boogie structure, and the locomotive may different from
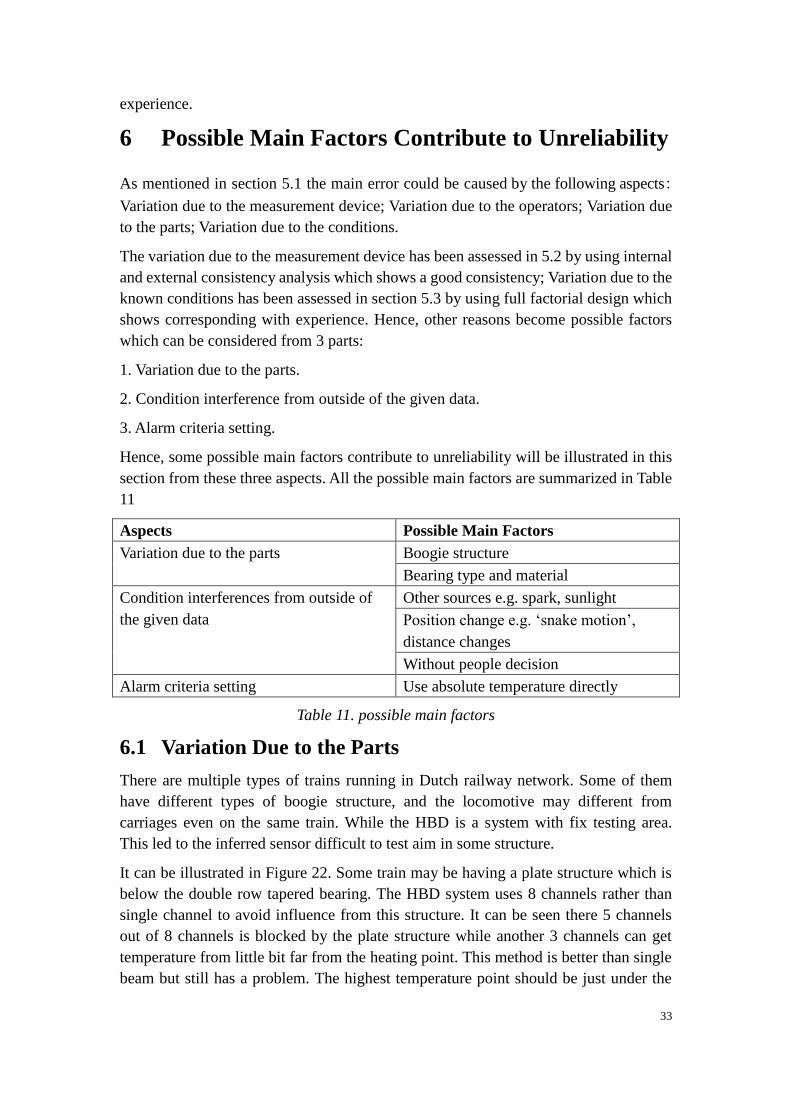
carriages even on the same train. While the HBD is a system with fix testing area.
This led to the inferred sensor difficult to test aim in some structure.
It can be illustrated in Figure 22. Some train may be having a plate structure which is
below the double row tapered bearing. The HBD system uses 8 channels rather than
single channel to avoid influence from this structure. It can be seen there 5 channels
out of 8 channels is blocked by the plate structure while another 3 channels can get
temperature from little bit far from the heating point. This method is better than single
beam but still has a problem. The highest temperature point should be just under the
34
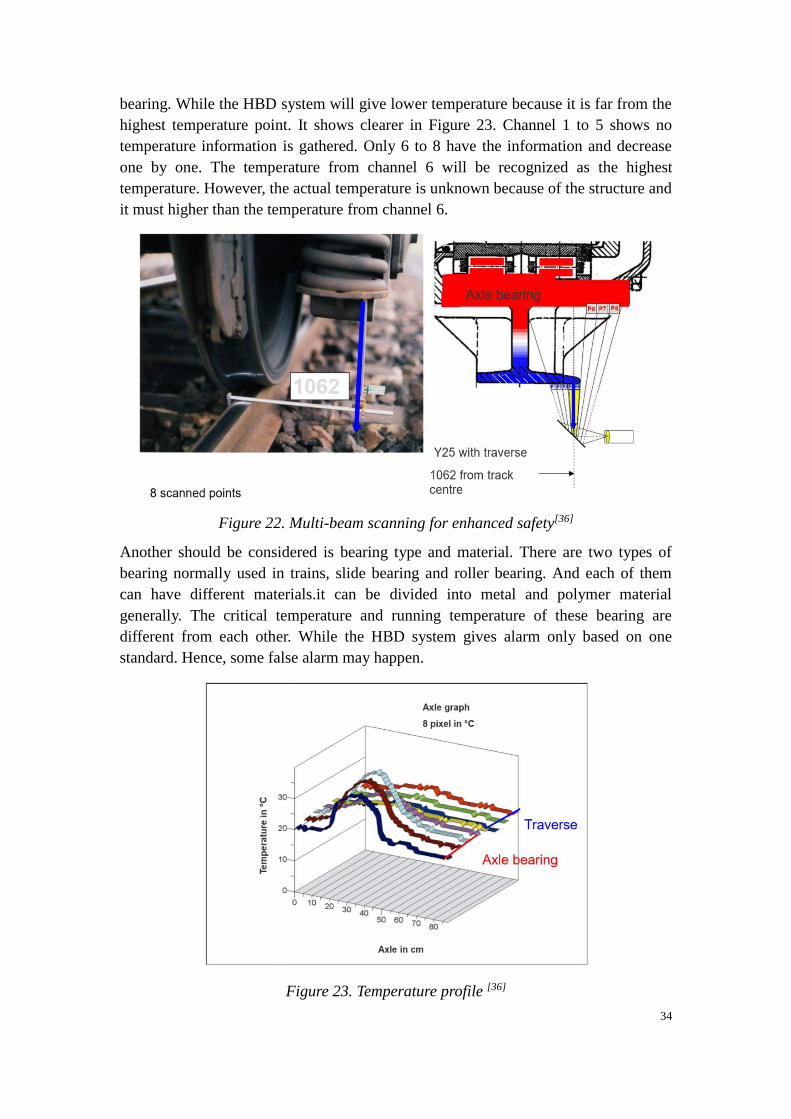
bearing. While the HBD system will give lower temperature because it is far from the
highest temperature point. It shows clearer in Figure 23. Channel 1 to 5 shows no
temperature information is gathered. Only 6 to 8 have the information and decrease
one by one. The temperature from channel 6 will be recognized as the highest
temperature. However, the actual temperature is unknown because of the structure and
it must higher than the temperature from channel 6.
Figure 22. Multi-beam scanning for enhanced safety[36]
Another should be considered is bearing type and material. There are two types of
bearing normally used in trains, slide bearing and roller bearing. And each of them
can have different materials.it can be divided into metal and polymer material
generally. The critical temperature and running temperature of these bearing are
different from each other. While the HBD system gives alarm only based on one
standard. Hence, some false alarm may happen.
Figure 23. Temperature profile [36]
35
6.2 Condition Interference from Outside of the Given Data
The database can prove information e.g. ambient temperature, speed, acceleration,
length and weight. However, this is far more enough because lots of interference from
outside this given data can have influence on the result.
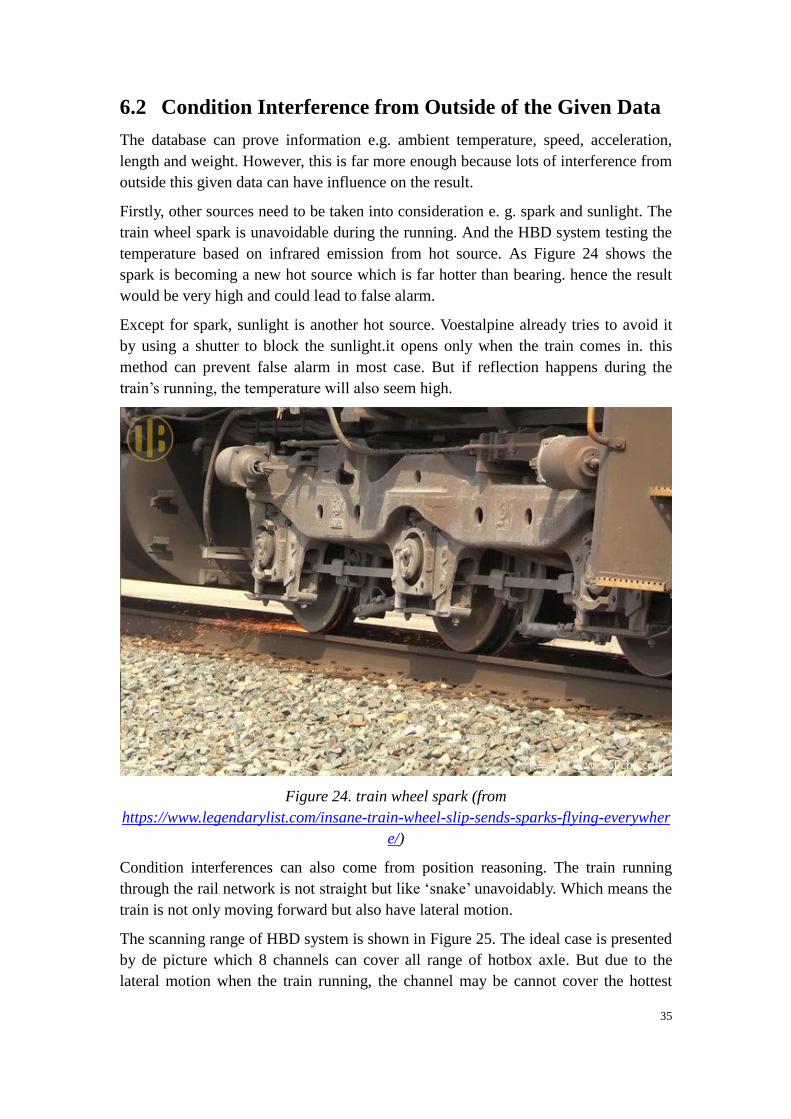
Firstly, other sources need to be taken into consideration e. g. spark and sunlight. The
train wheel spark is unavoidable during the running. And the HBD system testing the
temperature based on infrared emission from hot source. As Figure 24 shows the
spark is becoming a new hot source which is far hotter than bearing. hence the result
would be very high and could lead to false alarm.
Except for spark, sunlight is another hot source. Voestalpine already tries to avoid it
by using a shutter to block the sunlight.it opens only when the train comes in. this
method can prevent false alarm in most case. But if reflection happens during the
train’s running, the temperature will also seem high.
Figure 24. train wheel spark (from
https://www.legendarylist.com/insane-train-wheel-slip-sends-sparks-flying-everywher
e/)
Condition interferences can also come from position reasoning. The train running
through the rail network is not straight but like ‘snake’ unavoidably. Which means the
train is not only moving forward but also have lateral motion.
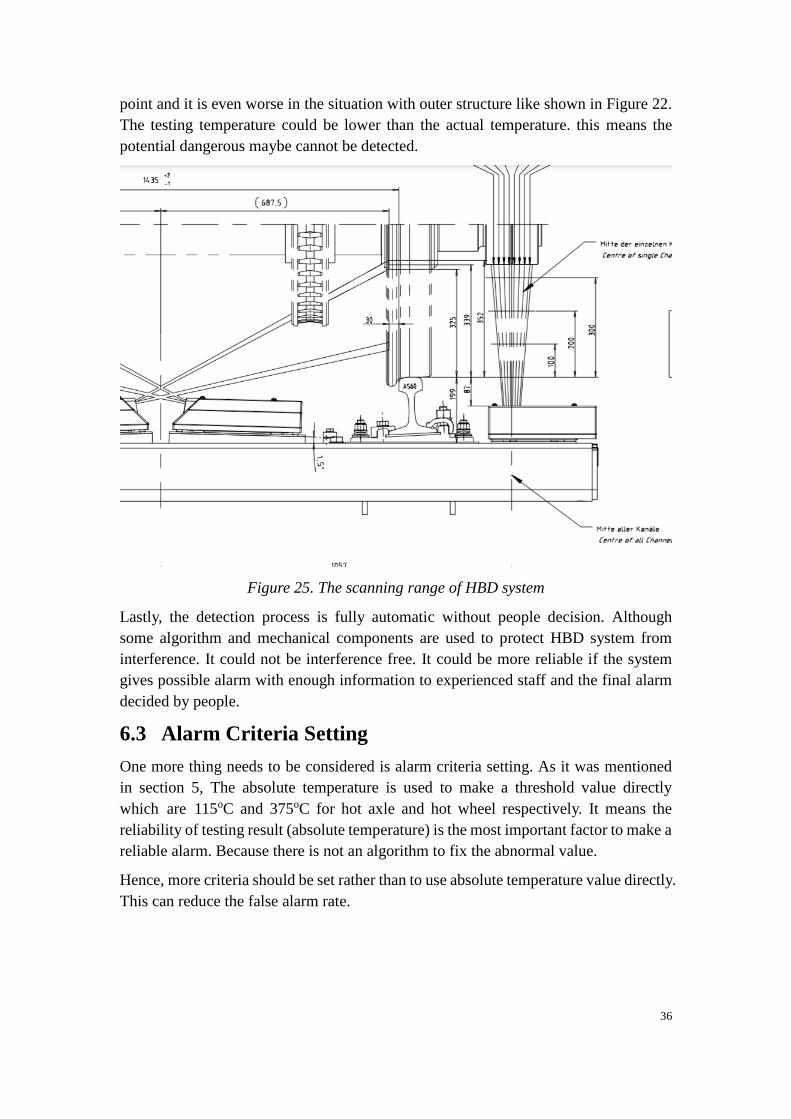
The scanning range of HBD system is shown in Figure 25. The ideal case is presented
by de picture which 8 channels can cover all range of hotbox axle. But due to the
lateral motion when the train running, the channel may be cannot cover the hottest
36
point and it is even worse in the situation with outer structure like shown in Figure 22.
The testing temperature could be lower than the actual temperature. this means the
potential dangerous maybe cannot be detected.
Figure 25. The scanning range of HBD system
Lastly, the detection process is fully automatic without people decision. Although
some algorithm and mechanical components are used to protect HBD system from
interference. It could not be interference free. It could be more reliable if the system
gives possible alarm with enough information to experienced staff and the final alarm
decided by people.
6.3 Alarm Criteria Setting
One more thing needs to be considered is alarm criteria setting. As it was mentioned
in section 5, The absolute temperature is used to make a threshold value directly
which are 115oC and 375oC for hot axle and hot wheel respectively. It means the
reliability of testing result (absolute temperature) is the most important factor to make a
reliable alarm. Because there is not an algorithm to fix the abnormal value.
Hence, more criteria should be set rather than to use absolute temperature value directly.
This can reduce the false alarm rate.
37
7 Possible Solutions
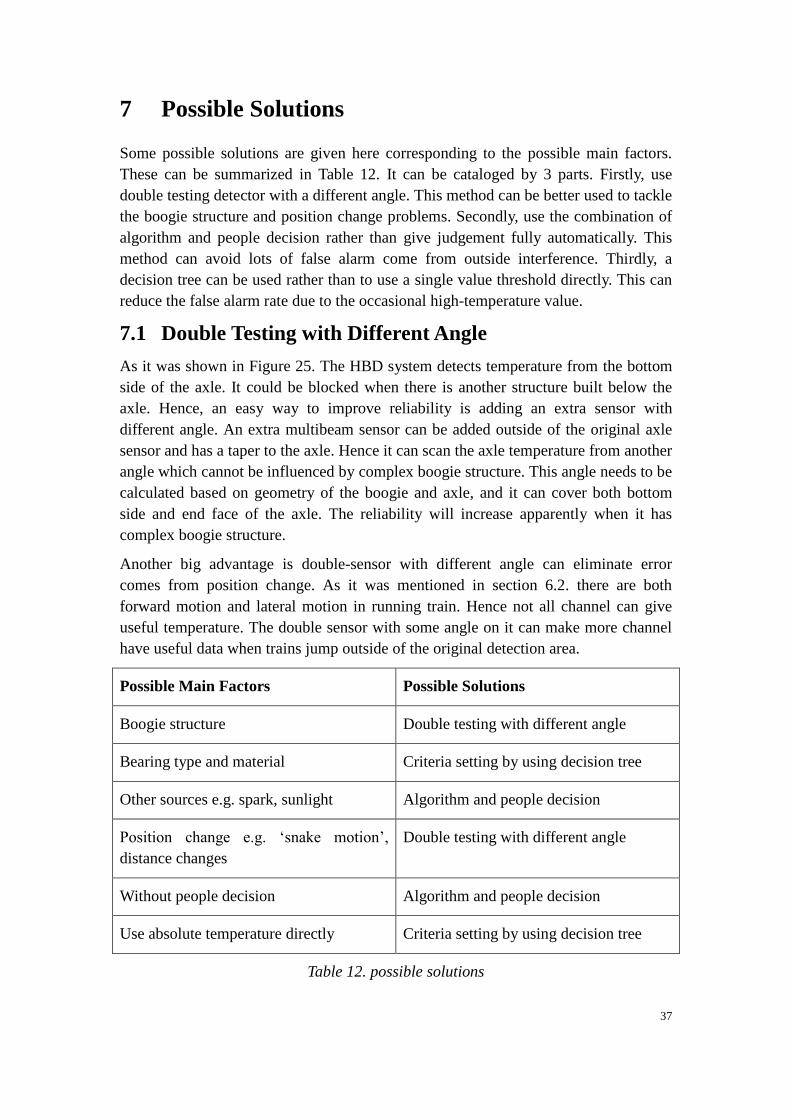
Some possible solutions are given here corresponding to the possible main factors.
These can be summarized in Table 12. It can be cataloged by 3 parts. Firstly, use
double testing detector with a different angle. This method can be better used to tackle
the boogie structure and position change problems. Secondly, use the combination of
algorithm and people decision rather than give judgement fully automatically. This
method can avoid lots of false alarm come from outside interference. Thirdly, a
decision tree can be used rather than to use a single value threshold directly. This can
reduce the false alarm rate due to the occasional high-temperature value.
7.1 Double Testing with Different Angle
As it was shown in Figure 25. The HBD system detects temperature from the bottom
side of the axle. It could be blocked when there is another structure built below the
axle. Hence, an easy way to improve reliability is adding an extra sensor with
different angle. An extra multibeam sensor can be added outside of the original axle
sensor and has a taper to the axle. Hence it can scan the axle temperature from another
angle which cannot be influenced by complex boogie structure. This angle needs to be
calculated based on geometry of the boogie and axle, and it can cover both bottom
side and end face of the axle. The reliability will increase apparently when it has
complex boogie structure.
Another big advantage is double-sensor with different angle can eliminate error
comes from position change. As it was mentioned in section 6.2. there are both
forward motion and lateral motion in running train. Hence not all channel can give
useful temperature. The double sensor with some angle on it can make more channel
have useful data when trains jump outside of the original detection area.
Possible Main Factors Possible Solutions
Boogie structure Double testing with different angle
Bearing type and material Criteria setting by using decision tree
Other sources e.g. spark, sunlight Algorithm and people decision
Position change e.g. ‘snake motion’,
distance changes
Double testing with different angle
Without people decision Algorithm and people decision
Use absolute temperature directly Criteria setting by using decision tree
Table 12. possible solutions
38
7.2 Algorithm & People Decision
As it was mentioned in section 6.2. other heat sources have an influence on
temperature result. This can be reduced by updating algorithm and filter. But some of
them cannot be eliminated in some complex situation. Hence, using the combination
of algorithm and people decision could be a better way to increase reliability. This
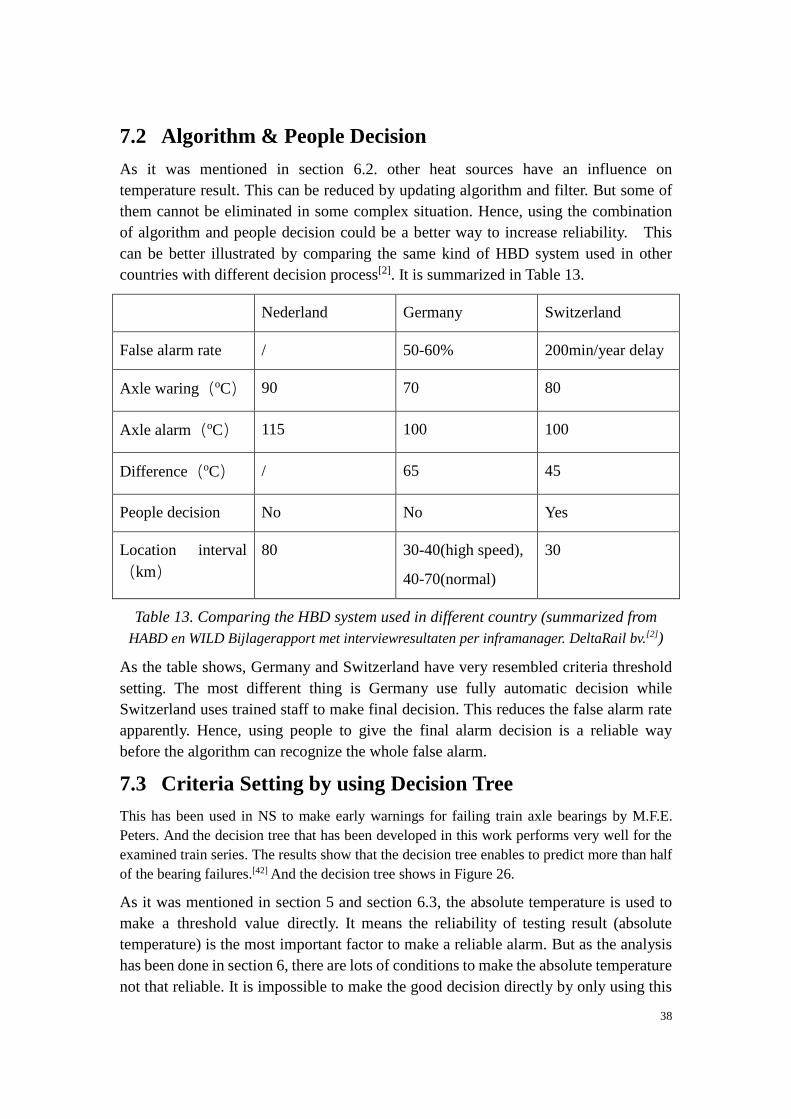
can be better illustrated by comparing the same kind of HBD system used in other
countries with different decision process[2]. It is summarized in Table 13.
Nederland Germany Switzerland
False alarm rate / 50-60% 200min/year delay
Axle waring(oC) 90 70 80
Axle alarm(oC) 115 100 100
Difference(oC) / 65 45
People decision No No Yes
Location interval
(km)
80 30-40(high speed),
40-70(normal)
30
Table 13. Comparing the HBD system used in different country (summarized from
HABD en WILD Bijlagerapport met interviewresultaten per inframanager. DeltaRail bv.[2])
As the table shows, Germany and Switzerland have very resembled criteria threshold
setting. The most different thing is Germany use fully automatic decision while
Switzerland uses trained staff to make final decision. This reduces the false alarm rate
apparently. Hence, using people to give the final alarm decision is a reliable way
before the algorithm can recognize the whole false alarm.
7.3 Criteria Setting by using Decision Tree
This has been used in NS to make early warnings for failing train axle bearings by M.F.E.
Peters. And the decision tree that has been developed in this work performs very well for the
examined train series. The results show that the decision tree enables to predict more than half
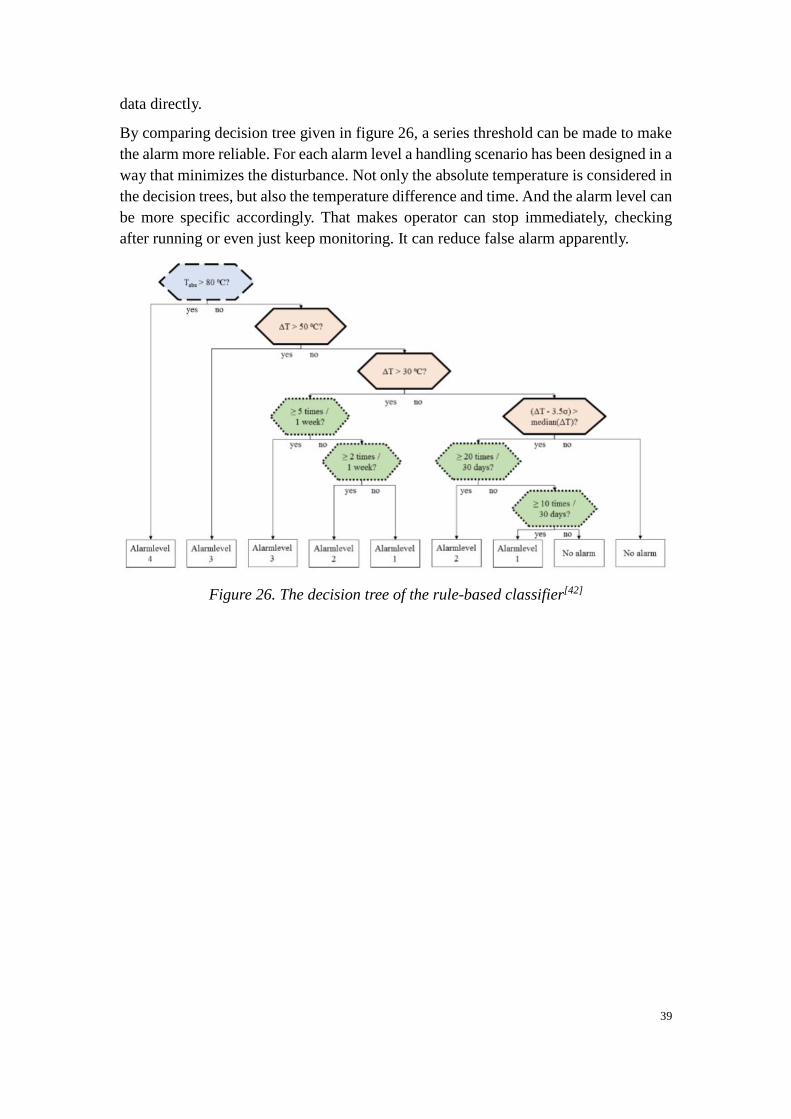
of the bearing failures.[42] And the decision tree shows in Figure 26.
As it was mentioned in section 5 and section 6.3, the absolute temperature is used to
make a threshold value directly. It means the reliability of testing result (absolute
temperature) is the most important factor to make a reliable alarm. But as the analysis
has been done in section 6, there are lots of conditions to make the absolute temperature
not that reliable. It is impossible to make the good decision directly by only using this
39
data directly.
By comparing decision tree given in figure 26, a series threshold can be made to make
the alarm more reliable. For each alarm level a handling scenario has been designed in a
way that minimizes the disturbance. Not only the absolute temperature is considered in
the decision trees, but also the temperature difference and time. And the alarm level can
be more specific accordingly. That makes operator can stop immediately, checking
after running or even just keep monitoring. It can reduce false alarm apparently.
Figure 26. The decision tree of the rule-based classifier[42]
40
8 Conclusion and Discussion
This report analyzes the reliability of HBD system in failure, error and data reliability
aspects. And it shows very good internal and external consistency most of the time.
However, abnormal data are generated in some case, most of the unreliability comes
from repeatability. Based on this information, some possible main factors have been
found and possible solutions are given correspondingly.
There are still have a possibility to find more main factors and give better solution.
such as the influence of lubrication level and heat distribution on axle box. These
maybe make the highest temperature point not located on the bottom side. Hence,
some possible solution might need to relocate sensor position.
And another thing needs to be taken into consideration is how to balance the
reliability and other factors e.g. economics and effectiveness. For example, trained
staff can make better decision than fully automatic alarm in some complex situations.
But it makes decision slower and more investment need to be applied to train
employees. Hence, some balance needs to be achieved between them. e.g. some
high-level alarm can be given automatically but other levels which are not that serious
can be assessed by people.
Furthermore, more detection point can be located across the Dutch railway network.
Not only the inferred temperature detection system but also other condition
monitoring systems e.g. vibration monitoring system. Multi-detection system can
make decision have more supporting than using single system only. The reliability of
decision will increase if multi-system can work at the same time.
41
References
[1]. Juliette van Driel. (15 Sep 2018). Quo Vadis and Hotbox. ProRail. Utrecht.
[2]. ir. Pieter Dings (15 Oktober 2010). HABD en WILD Bijlagerapport met
interviewresultaten per inframanager. DeltaRail bv.
[3]. Reiner Henn, Maintenance Manual for the PHOENIX MB Combined Hot Box and Hot
Wheel Detector, Voestalpine Signal.
[4]. Thomas Kuppler (26 Jun 2002) Service Manual for PHOENIX MB Combined Hot-box
and Hot wheel Detector. Voestalpine Signal.
[5]. Erich EisenBrand (12 Dec 2000), Technical Documentation for PHOENIX MB.
Voestalpine Signal.
[6]. GAMZE GARİP, İLKER ÜSTOĞLU, TARIK V. MUMCU, ÖZGÜR T. KAYMAKÇI,
Hot Box Detection System Design for Railway Vehicle Safety
[7]. PHOENIXMDS HBD/HWD HOT BOX AND HOT WHEEL DETECTION, Voestalpine
[8]. PHOENIXMDS Bearing and Brake Temperature Measurement, Voestalpine
[9]. Andreas Schöbel, Manfred Pisek, Johannes Karner. HOT BOX DETECTION SYSTEMS
AS A PART OF AUTOMATED TRAIN OBSERVATION IN AUSTRIA
[10]. System Description for the Combined Hot Box and Hot Wheel Detector PHOENIX MB,
Voestalpine
[11]. ANNEX LL HOT AXLE BOX DETECTION REFERENCE DOCUMENT,
EUROPEAN RAILWAY AGENCY
[12]. Guide for the application of the CSM design targets (CSM-DT), Annex 3 – Fitting
existing passenger trains with an onboard Hot Box Detection system, Workshop on
CSM-DT, 29-30 November 2016, Dragan JOVICIC, EU Agency for Railways
[13]. Diernhofer Florian, SAFETY STANDARDS OF MODERN RAILWAY LINES IN EUROPA
– DECISION MAKING WITH RISK-BASED APPROACH, SRT (State Railway of
Thailand) – Seminar 19th-23th of January, Bangkok
[14]. Karen Ackland (June 1998), Selecting the right infrared temperature sensor.
[15]. Yong Kyu KIM, Jong Hyun BAEK, Yong Ki YOON, and Ducko SHIN, Analysis and
Examination in wayside equipment failure of high-speed line Train control system.
[16]. Failure Modes, Effects and Diagnostic Analysis, 3144P SIS Temperature Transmitter.
version 2
[17]. Assessing Measurement System Variation, Minitab.
[18]. Prof. Tom Kuczek, Purdue Univ. Gage R&R Estimating measurement components Gage
capability and acceptability measures
[19]. A. ROGALSKI. History of infrared detectors. Institute of Applied Physics, Military
University of Technology, 2 Kaliskiego Str., 00–908 Warsaw, Poland
[20]. Bill kolbeck, INFRARED TEMPERATURE MEASUREMENT: NEW ADVANCEMENTS
IMPROVE PERFORMANCE
[21]. M. STEFFANSON* and I.W. RANGELOW, Microthermomechanical infrared sensors.
[22]. Network Statement 2018, ProRail.
42
[23]. Predicting Hot Box Defector Failures, Predikto.
[24]. Principles of Non-contact Temperature measurement. Raytek.
[25]. Quality & Reliability handbook, ON Semiconductor, Feb-2018
[26]. EN 15437-1:2009: Railway applications Axlebox condition monitoring - Interface and
design requirements - Part 1: Track side equipment and rolling stock axle box [Required
by Directive 2008/57/EC]
[27]. G.C Avontuur, Reliability analysis in mechanical Engineering Design
[28]. Bud Adler, RELIABILITY ASPECTS OF TEMPERATURE MEASUREMENT, Moore
Industries-International, Inc. North Hills, CA 91343
[29]. SWAJEETH PILOT PANCHANGAM and V. N. A. NAIKAN, RELIABILITY ANALYSIS
OF TEMPERATURE SENSOR SYSTEM, Reliability Engineering Center, Indian Institute
of Technology Kharagpur, West Bengal, India, Published 21 February 2013
[30]. Temperature Measurement
[31]. Theory and application of the infrared temperature, OMEGA
[32]. DTD-Anti Vibration-10a mount theory and selection. Farrat.
[33]. RAMS - Guideline: Reliability, availability, maintainability, safety - Implementation of
EN 50126 for Mechanical Components in Railway, UIC B 169/RP 43 (May 2015)
[34]. Axles, wheels and axle boxes reliability/safety - Implementation of EN 50126, UIC B
169/RP 44 (April 2015)
[35]. Military handbook Reliability prediction of electronic equipment, 2 Dec 1991
[36]. Basic Training PHOENIX MB Lesson1 General Introduction, Voestalpine SIGNALING.
[37]. Basic Training PHOENIX MB Lesson2 Components and Function Flow, Voestalpine
SIGNALING.
[38]. Basic Training PHOENIX MB Lesson3 Track Equipment: Installation and Cabling,
Voestalpine SIGNALING.
[39]. Basic Training PHOENIX MB Lesson4 Track Equipment: Structure and Function,
Voestalpine SIGNALING
[40]. A Comparison of Common Root Cause Analysis Tools and Methods, From the Book;
RealityCharting® - Seven Steps to Effective Problem-Solving and Strategies for
Personal Success* by Dean L. Gano Copyright 2011
[41]. Measurement System Analysis and Destructive Testing, Douglas Gorman, Minitab, and
Keith M. Bower, Minitab
[42]. Early Warnings for failing Train Axle Bearings based on Temperature, M.F.E. Peters,
1Netherlands Railways (NS), PO Box 2167, 3500 GD Utrecht, Nederland
43
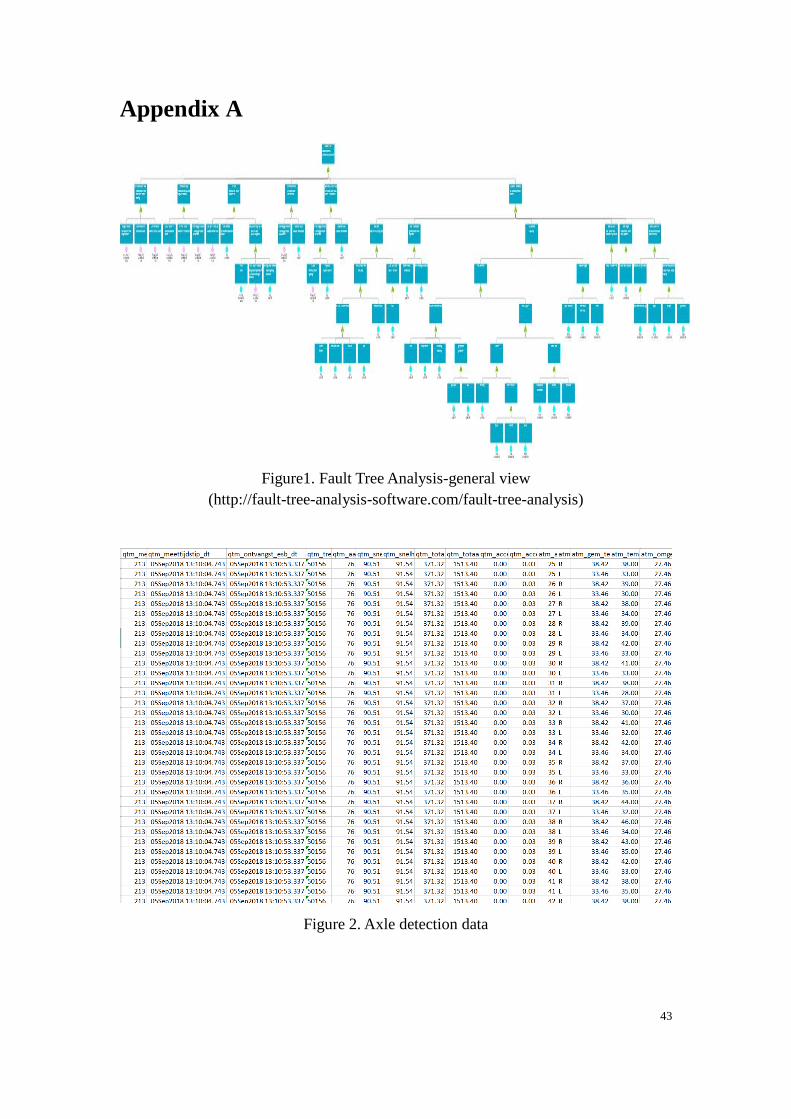
Appendix A
Figure1. Fault Tree Analysis-general view
(http://fault-tree-analysis-software.com/fault-tree-analysis)
Figure 2. Axle detection data
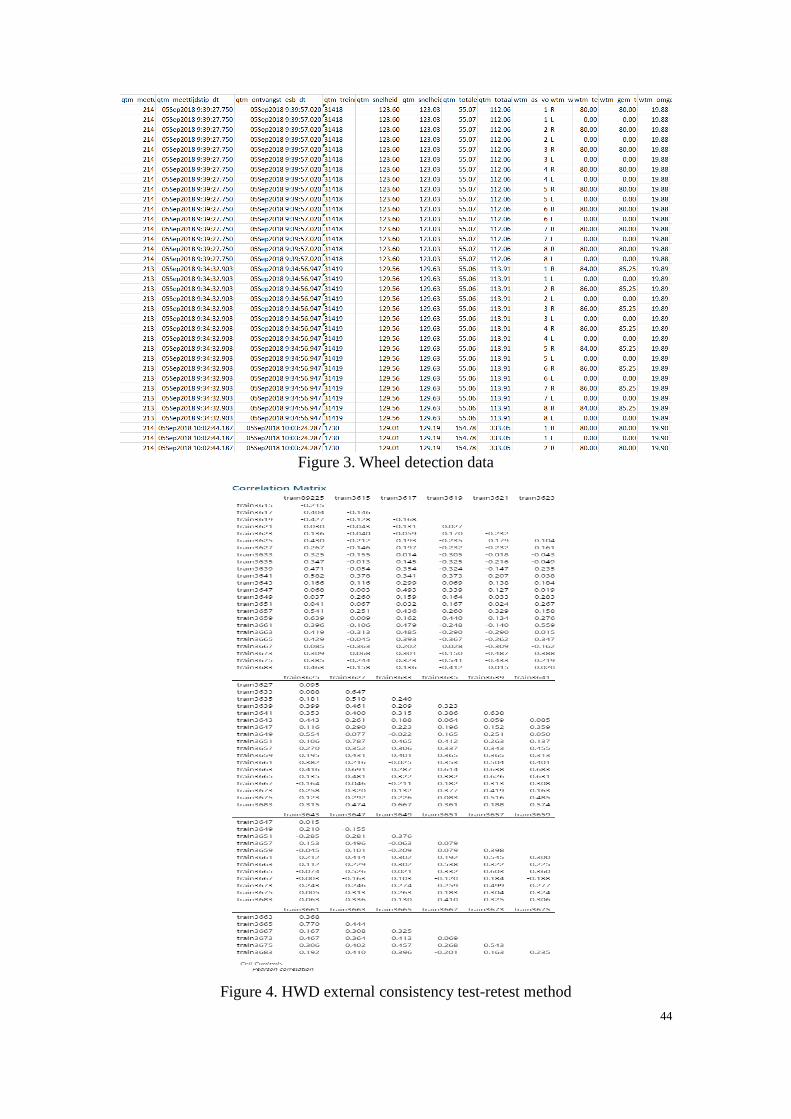
44
Figure 3. Wheel detection data
Figure 4. HWD external consistency test-retest method
45
Appendix B (Description of the employer & own
functioning)
ProRail is responsible for the rail network of the Netherlands which contains
construction, maintenance, management and security matters. it arranges all train
traffic, building and managing stations and lay new tracks as well as maintain existing
tracks, turnouts, signals.
ProRail provides a secure, reliable, punctual, durable and comfortable rail network in
cooperation with carriers and partners. it works efficiently and cost-conscious to a rail
network which makes people can have a pleasant trip and goods can be transported
unrestricted. The track is essential for the accessibility of the densely populated
Netherlands and surrounding countries. With relatively little space, ProRail make sure
that 1.1 million daily train trips and 51 billion tons are made annually
(https://www.prorail.nl)
My job is concerning about reliability of Hotbox detection. ProRail has Hotbox
detection system installed in the railway network to prevent trains to derail caused by
hot axles and hot wheels. The question is how to prove the temperatures measured are
reliable. And how are the temperature measurements affected by other issues.
46
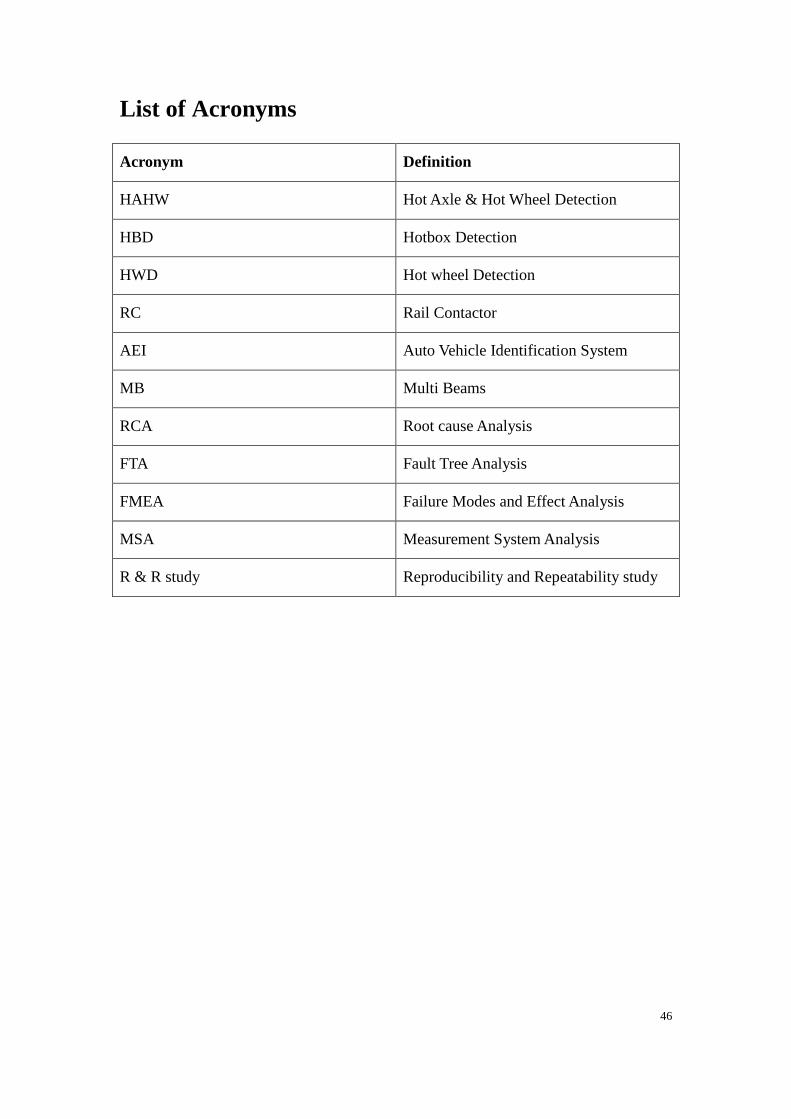
List of Acronyms
Acronym Definition
HAHW Hot Axle & Hot Wheel Detection
HBD Hotbox Detection
HWD Hot wheel Detection
RC Rail Contactor
AEI Auto Vehicle Identification System
MB Multi Beams
RCA Root cause Analysis
FTA Fault Tree Analysis
FMEA Failure Modes and Effect Analysis
MSA Measurement System Analysis
R & R study Reproducibility and Repeatability study