Embed Size (px)
Citation preview
1
The Relationship Insurance Role of Financial Conglomerates:
Evidence from Earnings Announcements
Jiun-Lin Chen, Gary C. Sanger and Wei-Ling Song*
January 23, 2015
Abstract
Financial conglomerates have the opportunity to gather information from multiple sources, and to use that information in multiple ways. This paper uses earnings announcements to analyze the trading behavior and associated price impacts of relationship institutions, which have a lending or underwriting relationship with client firms and also hold client firms’ equities through their asset management divisions. We find that buying support from relationship institutions surrounding client firms’ negative earnings surprises mitigates both the negative initial impact on client firms’ stock prices and longer term post-announcement drift. The magnitude of these effects is economically important. Support by relationship institutions is also associated with less selling by other, independent institutions holding the same client firms’ shares. Further, price reactions to negative earnings surprises of unconnected firms (without any relationship institutions) are significantly larger. Our findings suggest that price support from relationship institutions helps resolve the uncertainty accompanying clients’ temporary earnings shocks, which can be considered welfare enhancing due to reduced noise in capital markets.
JEL Classification: G12, G14, G21, G24
Keywords: institutional trading, banking relationships, price support, earnings momentum
* Jiun-Lin Chen ([email protected]) is at the University of Adelaide; Gary C. Sanger
([email protected]) is at the E.J. Ourso College of Business, Louisiana State University, and Wei-Ling Song ([email protected]) is at the E.J. Ourso College of Business, Louisiana State University.

1
1. Introduction
Institutional investors play important roles in financial markets and their actions may
have diverse effects on both firms and market prices. For example, Chen, Harford, and Li (2007)
document the monitoring role of institutional investors, while Cella, Ellul, and Giannetti (2013)
provide evidence of price pressure by short-term institutional investors during times of market
turmoil. Allen, Morris, and Shin (2006) demonstrate theoretically that stock price can deviate
from its liquidation value when traders are motivated to second- and third-guess other traders in
order to profit from short-run price movements. In their model, even long-lived traders with a
preference for smoothing consumption over time will care about short-run price movements. It
follows that firms may have a desire to maintain smooth stock prices.
In light of the above discussions, this paper proposes a price support role for a special
type of institutional investor which we term a “relationship institution”. This is defined as an
institutional investor which has a lending or underwriting relationship with a client firm and also
holds the clients’ equities through its asset management divisions. We hypothesize that, given
the fees or interest payments collected from client firms, relationship institutions may have the
incentive to support clients’ stock prices, especially in the short run. Relationship institutions, as
long term business partners, can strengthen their relationships with client firms by purchasing
clients’ stocks especially during periods of selling pressure by other types of institutions.
The prevalence of this type of relationship has increased dramatically due to regulatory
change. The gradual relaxation of the Glass-Steagall Act, culminating with passage of the
Gramm-Leach-Bliley Act in 1999 has resulted in complex relations among diverse financial

2
institutions (Lown, Osler, Strahan, and Sufi, 2000).1 These relations and their consequences for
the functioning of capital markets have also attracted wide attention by researchers. It is not
uncommon for a financial conglomerate to both aid firms in fund raising (either lending, IPO or
SEO equity financing) and to invest in the same firms’ equity through one or more of its asset
management subsidiaries. These financial institutions have economies in acquiring and
producing information on their client firms as a byproduct of their lending/underwriting
relationships. By exploiting economies of scale and scope, financial institutions can accumulate
private information about their clients and share this information firm-wide. For example,
Acharya and Johnson (2007) show evidence of the use of private information by informed banks
in the credit default swap market. Massa and Rehman (2008) find that the mutual funds affiliated
with banks increase their portfolio weights in the firms borrowing from these banks, enhancing
fund performance by an average of 1.4% per year. Connections among subsidiaries also create
complex sets of incentives that can reasonably be expected to affect behaviors.
To test the potential for relationship institutions to support client firms’ stock prices, we
examine the trading behavior and resulting price impacts of relationship institutions surrounding
earnings announcements. Earnings surprises offer a convenient opportunity to examine
institutional trading behavior surrounding the public release of client firm information. The
regular frequency of earnings announcements facilitates our analysis by providing a large sample
over a wide variety of business conditions. Our setting helps to avoid the selection bias issue that
may be involved in irregular corporate events such as capital raising or mergers. It also captures
1 The repeal process started in 1987. Banks were required to submit individual applications to establish Section 20
Subsidiaries. For more details, see J.P Morgan & Co. Inc., The Chase Manhattan Corp., Bankers Trust New York
Corp., Citicorp, and Security Pacific Corp., Federal Reserve Bulletin 75 (1989): 192-217. See also Federal Register
61 (1996), pages 68750-68756 for subsequent relaxation of the rules.

3
the long-term nature of relationships between client firms and institutions more clearly than
infrequent corporate events. Furthermore, earnings announcements are associated with various
market anomalies. We believe the findings in this paper help to shed light on these anomalies.
To test our hypotheses, we analyze the stock trading patterns of two different types of
financial institutions: relationship institutions and independent institutions. We define
relationship institutions as those that hold shares of firms that they have also served as either
lenders or underwriters within a three-year period prior to these client firms’ earnings
announcements. Other (non-connected) institutions holding these same firms shares are
classified as independent institutions.
Following the literature discussed above, we formally analyze institutional trading and
related stock price impacts by contrasting two hypotheses: the relationship insurance hypothesis
and the information advantage hypothesis. The relationship insurance hypothesis predicts that
relationship institutions will tend to support their clients’ stock prices by increasing holdings of
clients’ shares surrounding short-term negative earnings shocks. If such price support activities
are effective, firms having relationship institutions should have smaller price reactions to
negative earnings surprises than firms without support. On the contrary, the information
advantage hypothesis suggests that relationship institutions will exploit the private information
obtained from their affiliated banks to improve their performance. In this case, relationship
institutions will reduce their holdings before their client firms announce negative earnings
surprises.
Our findings are consistent with relationship insurance hypothesis. We find that
relationship institutions increase their holdings of clients’ shares while independent institutions
reduce their holdings surrounding negative surprises. We also contrast the holding patterns of

4
independent institutions across two classifications of firms – those with relationship institutions
(connected firms) versus those without relationship institutions (unconnected firms).
Interestingly, we observe that independent institutions more aggressively reduce their holdings of
unconnected firms (by nearly four times) relative to those of connected firms. These findings
suggest that relationship institutions, on average, support their clients when negative earnings
surprises occur, possibly signaling the unobserved strength of client firms to the market. These
activities by relationship institutions also appear to discourage the selling of connected firms by
independent institutions. The behavior of independent institutions is consistent with the fact that
both the announcement effect and post-earnings-announcement drift are lower for connected
firms, thus presenting a less profitable trading strategy relative to unconnected firms.
To examine the effects of institutional trading more closely, we construct a price support
(PS) measure (described in Section 4.4) designed to capture both the magnitude of buying or
selling activity and the sign and magnitude of earnings surprises. We calculate this PS measure
for relationship institutions and independent institutions and examine whether price impacts
differ when connected firms are traded by relationship versus independent firms.
First, we find that relationship institutions provide more price support for client firms’
stocks than independent institutions when the firms experience negative earnings shocks.
Interestingly, price support of these client firms by independent institutions, albeit smaller in
magnitude, suggests that the presence of relationship institutions appears to encourage
independent institutions to buy shares. Second, independent institutions do not support
unconnected firms, and in fact strongly sell when measured by PS. This is consistent with the
finding that the earnings surprise and momentum effects are stronger among unconnected firms.

5
To further examine the effects of trading by relationship and independent institutions, we
analyze hedge portfolio (buy-minus-sell) returns by sorting on our PS measure for firms with
negative average earnings surprises. Specifically, we hold the extreme-buy quintile portfolio and
short the extreme sell quintile portfolio. Interesting patterns emerge. For independent institutions,
hedge portfolio returns are significantly positive prior to the current earnings announcement and
significantly negative for the following 15 months. This clear reversal of hedge portfolio returns
suggests that trading by independent institutions is not driven by fundamental information but
instead is based on short-lived price movements.
By contrast, hedge portfolio returns based on relationship institutions’ PS measures are
largely insignificant both before and after negative earnings surprises. Surprisingly, client firms
that are sold by their relationship institutions perform significantly better than those that are
purchased. One possible interpretation is that relationship institutions raise capital by selling
client firms that can do well on their own in the near future, and purchase clients’ stocks in need
of price support. The results are consistent with the relationship insurance hypothesis, and
contrary to the information advantage hypothesis. Our findings are consistent with Griffin, Shu,
and Topaloglu (2012) who find no evidence that relationship institutions trade on inside
information for short-term profits.
Our paper demonstrates the association of independent institutions’ trading with
momentum and reversal, which are considered the most prominent anomalies in the financial
markets as suggested by Vayanos and Woolley (2013). They build a theoretical model based on a
negative shock to asset value that triggers fund outflows and further selling by the fund manager
resulting in a temporary negative deviation of asset price from fundamental value. Similarly, we

6
show that the trading of independent institutions appears to push stock prices below their
fundamental values when firms experience temporary negative earnings shocks.
We further document that the presence of relationship institutions seems to mitigate the
impact of selling pressure by independent institutions. We contribute to the literature on financial
institutions by providing evidence of a relationship insurance role in capital markets for a broad
sample of firms using regular and frequent earnings announcements as the conditioning event.
These findings may also have more general implications for the asset pricing literature. Support
by relationship institutions appears to alter the stock return profile around negative earnings
surprises by smoothing out temporary negative return shocks. Firms without such support
experience wider temporary price swings. If relationships among institutions can reduce
unnecessary price movements and discourage short-term trading, less noise in financial markets
could be considered welfare enhancing.
The remainder of this paper is organized as follows. Section 2 develops our hypotheses.
Section 3 describes the data and research design. Section 4 reports the empirical results for
abnormal stock returns at the earnings announcement, subsequent earnings momentum,
institutional trading behavior and price support. Section 5 concludes.
2. Hypothesis Development
2.1 The Roles and Incentives of Financial Conglomerates
Numerous studies explore various aspects of connections within financial conglomerates
and with their client firms. Ellis, Michaely and O’Hara (2000) examine the price support
activities of IPO underwriters and find that market markers within a financial group tend to
support the stock prices of IPO firms underwritten by investment banks within the same group.
Hao and Yan (2012) find that investment bank-affiliated mutual funds underperform unaffiliated

7
funds because they hold relatively large amounts of clients’ underperforming IPO and SEO
shares. Potential banking fees collected from client firms provide incentives for financial firms to
support the stock prices of their clients to help maintain their banking relationships.
Chan, Karceski and Lakonishok (2007) claim analysts may issue favorable investment
opinions to curry favor with executives who can direct future investment banking business to the
analyst’s firm. Yasuda (2005) also shows that lending relationships have a significant and
positive effect on a firm’s underwriter choice, particularly for junk-bond issuers and first-time
issuers. Reuter (2006) documents a robust positive correlation between the annual brokerage
payments that mutual fund families make to lead underwriters and the IPO allocations to these
families. Ferreira and Matos (2012) also report that strong bank-firm relations (board seats,
direct equity stakes or through institutional holdings) increase a bank’s probability of being
picked as lead syndicate arranger. The above stream of literature highlights the quid-pro-quo that
seems to exist among financial firms and their subsidiaries.
Although regulators and market participants have expressed concern about the
information spillover within financial conglomerates and have required them to erect “Chinese
Walls” to prevent abuses, evidence from prior studies suggests that Chinese Walls may not be
totally effective. This second strand of literature focuses on the informational advantages of
combined business lines. Through underwriting or lending, banks have an advantage in acquiring
private information about clients. Ivashina and Sun (2011) find that institutions participating in
loan renegotiations subsequently trade the same firms’ stocks and outperform a comparison
group by 5.4% per year. Chen and Martin (2011) also suggest an information spillover from the
commercial lending division to the equity research division in financial conglomerates. For those

8
clients with a lending association, bank affiliated analysts exhibit greater EPS forecast accuracy
compared with independent analysts.
Dass and Massa (2011) argue that a strong bank-firm relationship has offsetting effects.
Firms benefit through better corporate governance, but suffer reduced liquidity due to higher
adverse selection perceived by other non-connected institutional shareholders. However, the
findings of Dass and Massa (2011) are consistent with our proposition that relationship
institutions can support clients’ stock prices. Such an action may discourage short-term trading.
Our paper thus adds to the above literature by providing evidence on the role of financial
conglomerates as supportive institutional investors.
2.2 Institutional Investors and Earnings Surprises
Institutional investors are important financial intermediaries that manage money on
behalf of individual investors. There are vest literature on their behaviors, roles, and impacts in
the financial markets. Besides the special incentives of relationship institutions, investing for
monetary gain is ultimately the primary goal of institutional investors. However, their strategies
and information sources vary.
One strand of literature has focused on investment horizon, i.e., short-term investors
versus long-term investors. Yan and Zhang (2009) find that only short-term investors are
momentum traders and that stocks experiencing the largest increase in short-term institutional
holdings have significantly higher earnings surprises and earnings announcement abnormal
returns over the subsequent four quarters than stocks experiencing the largest decrease in short-
term institutional holdings. Such patterns do not exist among the findings of long-term
institutional holdings. They conclude that short-term institutions possess more information than
long-term institutions.

9
In contrast to Yan and Zhang (2009), we focus on relationship institutions and
independent institutions. Relationship institutions are definitely long term investors and their
investment horizons are specific to the client firms rather than a general churn rate or portfolio
turnover rate used to classify institutional investors by several studies, such as Yan and Zhang
(2009) and Cella, Ellul, and Giannetti (2013). Literature also suggests that relationship
institutions are informed. If their trades are not driven by short-term profit taking due to
temporary earnings shocks, then the trading analysis will be inappropriate to infer whether
relationship institutions have more information. In fact, using mergers and acquisitions as events,
Chen, Harford, and Li (2007) show that long-term independent institutions only trade when there
are very bad outcomes.
Other studies using earnings announcements to examine institutional trading include
Baker, Litov, Wachter, and Wurgler (2010) and Jiang and Zheng (2014). Baker et al. (2010) also
find evidence that aggregate mutual fund trades forecast earnings surprises. However, the
predictability reduced following the passage of SEC Regulation Fair Disclosure, which since
October 2000 has banned the selective disclosure of corporate information to a preferred set of
investors. Our study, on the other hand, offers another possible explanation that the price support
from relationship institutions can also discourage trading for short-term earnings shocks.
2.3 Hypotheses
Relationship institutions and independent institutions may have different incentives,
information sets, and trading behaviors for the firms whose shares they own. We presume that all
institutions have incentives to make optimal investment decisions. However, relationship
institutions also have incentives to maintain good relations with their client firms, and may
simultaneously enjoy an informational advantage over their non-connected rivals. The banking

10
fees paid by corporate clients and future possible business opportunities provide potentially
strong incentives for banks to maintain long-term relationships with their clients.
Because of information asymmetry in markets, firms suffering from temporary negative
earnings shocks may not be able to credibly convey favorable information to outsiders. Thus,
relationship institutions may play a role in certifying their client firms in the event of such
transitory shocks. One possible strategy is for relationship institutions to increase their equity
holdings in client firms, signaling their positive views to the market. If relationship institutions
are successful, stock price reactions to negative earnings surprises will be smaller and post-
earnings announcement drift will be less pronounced than otherwise. We refer to this scenario as
the relationship insurance hypothesis. Conversely, relationship institutions may choose to exploit
the private information obtained from their affiliated banks to improve their investment
performance. If this is true, relationship institutions should sell shares before bad news, possibly
magnifying the price reaction to negative earnings surprises. We refer to this scenario as the
information advantage hypothesis.
3. Data and Research Design
3.1. Data Sources
Our sample consists of all common stocks listed on NYSE, AMEX and NASDAQ with
CRSP share codes 10 or 11 from 1990 to 2004. Closed-end funds, real estate investment trusts
(REITs), American Depository Receipts (ADRs) and foreign companies are eliminated from the
sample. Our key variable of interest is quarterly institutional holdings data, which are from the
Thomson Financial CDA/Spectrum institutional (13f) holdings database. All institutional
holdings greater than 10,000 shares or $200,000 are reported to the Securities and Exchange
Commission (SEC) on form 13-f and CDA/Spectrum collects information from these filings.

11
Bond and equity underwriting information comes from the Thomson Financial SDC/Platinum
new issues database. Because there are numerous mergers and acquisitions among relationship
institutions during the sample period, these transactions are gathered from the Thomson
Financial SDC/Platinum mergers and acquisitions database. We obtain loan deal and lender
information from Thomson Financial Reuter’s LPC Dealscan database. Quarterly earnings
announcement information is from the I/B/E/S Summary database. Stock prices, returns, and
shares outstanding are obtained from CRSP. Finally, firm characteristics are from Compustat.
To test our hypothesis, we divide all institutional investors into two types: relationship
institutions and independent institutions. Following current terminology we will typically refer to
diversified financial institutions as banks. If a bank has a lending or underwriting relationship
with a client firm, any of the bank’s affiliated institutions that hold shares of this client firm are
defined as this firm’s “relationship institutions”. Other institutions owning the same firm’s shares
but whose affiliated groups do not have lending or underwriting relationships are defined as
“independent institutions”. We use a three year window prior to an earnings announcement to
classify institutions. For example, if Smith Barney underwrote an SEO for IBM within the past
three years, the asset management divisions of Citigroup are classified as IBM’s relationship
institutions since Smith Barney and Citigroup belong to the same conglomerate group. On the
other hand, if J.P. Morgan holds shares of IBM without a lending or underwriting relationship,
J.P. Morgan is classified as an independent institution for IBM. Similarly, we divide all firms in
our study into two types: “connected firms” and “unconnected firms”. Connected firms (e.g.
IBM) are those firms paying banking fees to their relationship institutions within past three
years. Unconnected firms are those without any relationship institutions. Note that this may be

12
either because the firm has not used the services of a bank within the past three years, or if so,
none of the bank’s asset management affiliates own shares in the firm.
To identify client equity held by relationship institutions we match (by hand) data on the
lenders from LPC/Dealscan and underwriters from SDC/Platinum to institutional holdings in
CDA/Spectrum. Over our sample period there are more than 10,000 institutional investors’
names in CDA/Spectrum and about 10,000 lender and underwriter names. All names are
corrected for changes in parent holding company names by incorporating M&A information.
Due to the magnitude of the effort required to hand match banks by name, we focus only on
those with brokerage services, which includes most financial conglomerates. Finally, the
institutional holdings data are merged with the I/B/E/S, CRSP, and Compustat data by Cusip for
each firm in our sample.
3.2 Empirical Test Design
We first explore the trading behavior of relationship and independent institutions in
shares of connected firms. We also examine the trading behavior of independent institutions in
shares of unconnected firms. Given our data limitations, we infer the extent of buying or selling
each quarter surrounding earnings announcements by calculating changes in institutional
holdings as reported in SEC form 13-f.
In the second set of tests, we use event study methods to examine whether abnormal
returns around earnings announcements differ between connected and unconnected firms.
Abnormal returns (CAR) for the announcement period (-1, +1) are computed with the market
model using an estimation period of days -255 to -10 relative to each earnings announcement.
Unreported findings using market-adjusted returns and/or CAR (0, +2) produce nearly identical
results. Each quarter we estimate a Fama-Macbeth cross-sectional regression to study the relation

13
between announcement period CARs and various characteristics of the announcing firms. The
dependent variable is cumulative abnormal returns (CAR -1, +1). The model can be expressed
as:
iiiiiii
iiiii
ereturnCumStdevNumestErrAgeSUE
MBSizeRe_numrelaDumCAR
+++++++++++=
_
)/(_
1098765
43210
βββββββββββ
(1)
Independent variables include:
Dum_rela: equal to 1 if the firm is connected (has one or more relationship institutions) and 0
otherwise
Re_num: the number of relationship institution for each firm
Size: log of market value at the quarter prior to each earnings announcement
B/M: book value divided by market value the quarter prior to each earnings announcement
Age: the number of years since the firm was added to CRSP
Err: actual earnings per share minus the consensus of analysts’ forecasts, deflated by the stock
price at the end of each quarter prior to the earnings announcement
Numest: number of analysts following each firm the quarter before each announcement
Stdev: cross-sectional standard deviation of analysts’ earnings forecasts the quarter before each
announcement
Cum_return: three-month cumulative return before each announcement
SUE: current quarter’s standardized unexpected earnings defined based on Chordia and
Schivakumar (2006) as follows:
quarterseight prior in the change earnings ofdeviation Standard
earningsquarterly Expected -earningsQuarterly =SUE (2)
Expected quarterly earnings are proxied by earnings four quarters previous to the current quarter.
The final sample consists of 107,157 firm-quarter earnings announcements from 1990 to 2004.

14
We then examine whether earnings momentum differs between connected and
unconnected firms. Prior literature has used a variety of methods to estimate expected quarterly
earnings (Jones and Litzenberger, 1970; Latane and Jones, 1979; Bernard and Thomas, 1989;
Chan, Jegadeesh and Lakonishok, 1996). However, Jegadeesh and Titman (2001) show that the
accuracy of the earnings expectations model is not particularly important for the purpose of
measuring unexpected earnings to predict momentum returns.
In our final set of tests, we construct a measure of price support (described in section 4.4)
to capture the interaction between trading intensity and the sign and magnitude of the earnings
surprise. We examine differences in price support for connected and unconnected firms across
SUE quintiles. We also contrast cumulative abnormal returns associated with different levels of
price support starting from the measure construction period and the subsequent two years.
3.3 Summary Statistics
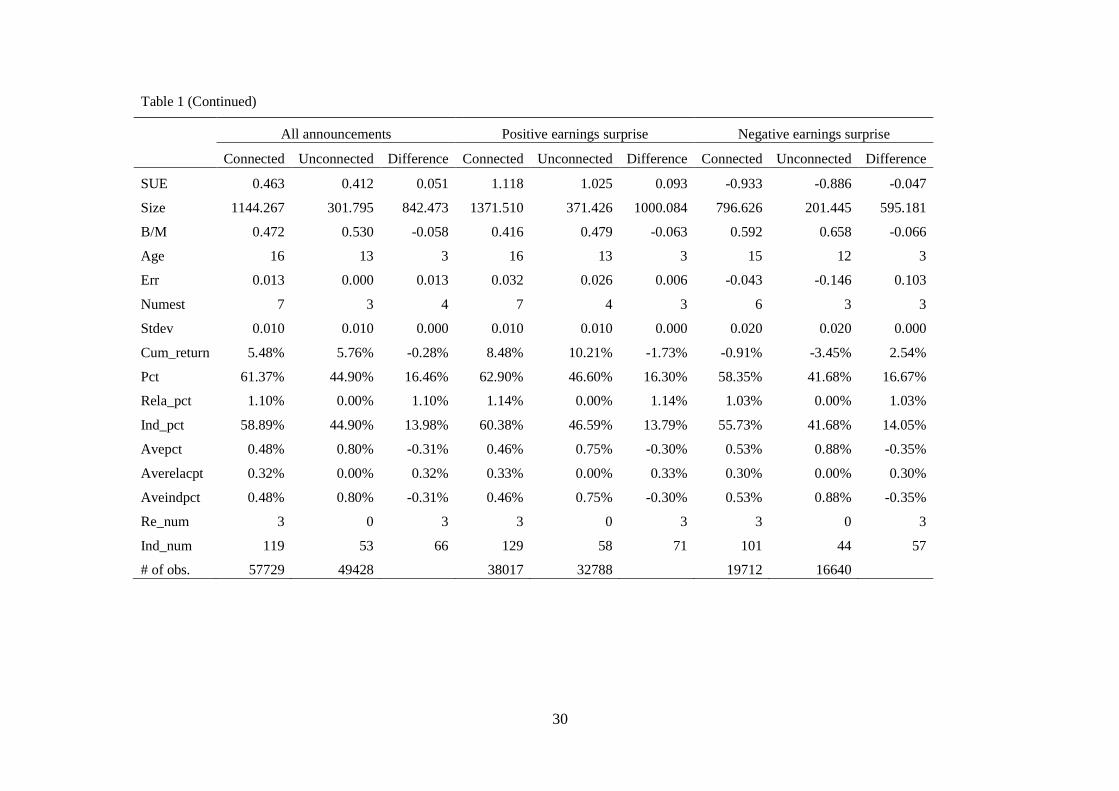
Table 1 provides median descriptive statistics for the sample firms in this study. Each
quarter we divide all firms with earnings announcements into two groups (connected vs.
unconnected firms) depending upon whether a firm’s stock is held by one or more relationship
institutions prior to the announcement. Compared to unconnected firms, connected firms are
larger, older and followed by more analysts. They also have higher median SUE and earnings per
share, and smaller median book-to-market ratios. Regarding ownership variables, connected
firms have higher ownership by institutions (61% vs. 45%) with about 1.1% owned by
relationship institutions. Connected firms have a median of 3 (119) relationship (independent)
institutional owners, while unconnected firms have a median of 53 independent owners. Because
many of our tests focus on negative earnings surprises, we also present statistics based on the
sign of SUE.

15
[Insert Table 1 here]
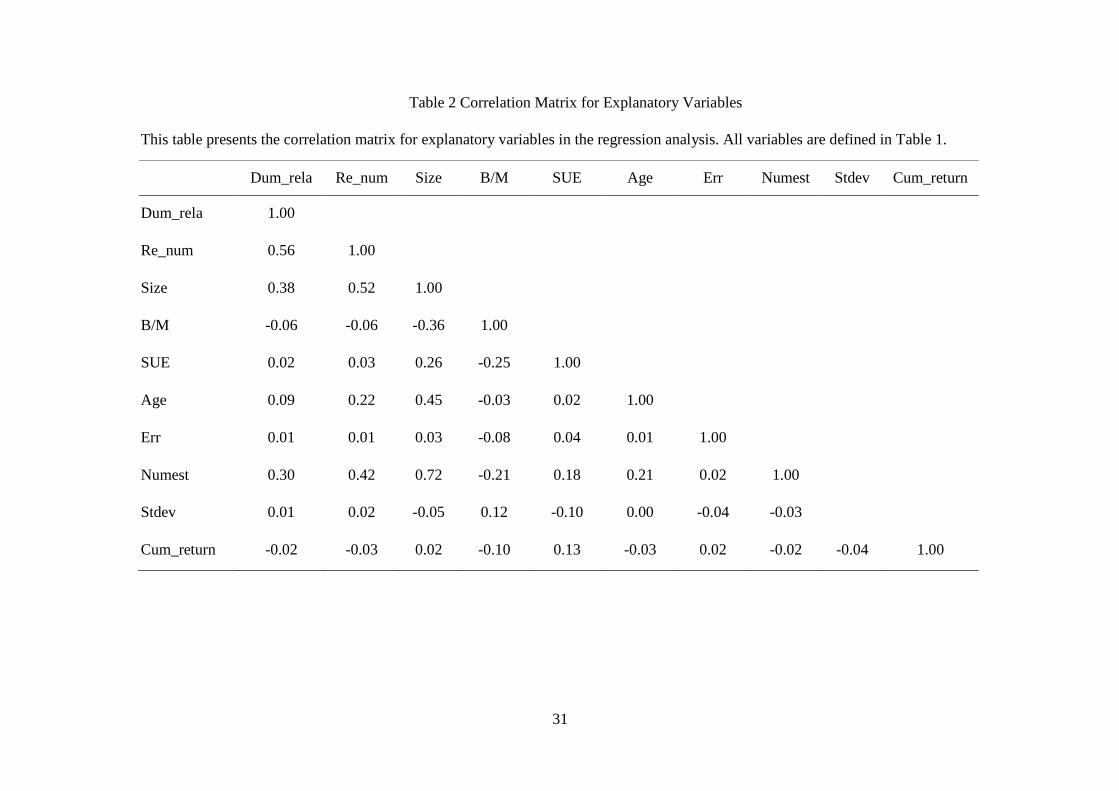
Table 2 presents the correlation matrix for the explanatory variables. Not surprisingly,
correlations between Size and Dum_rela; Numest and Dum_rela, are high. Connected firms are
larger and have more analyst coverage. Also, older firms tend to have more relationship
institutions.
[Insert Table 2 here]
4. Empirical Results
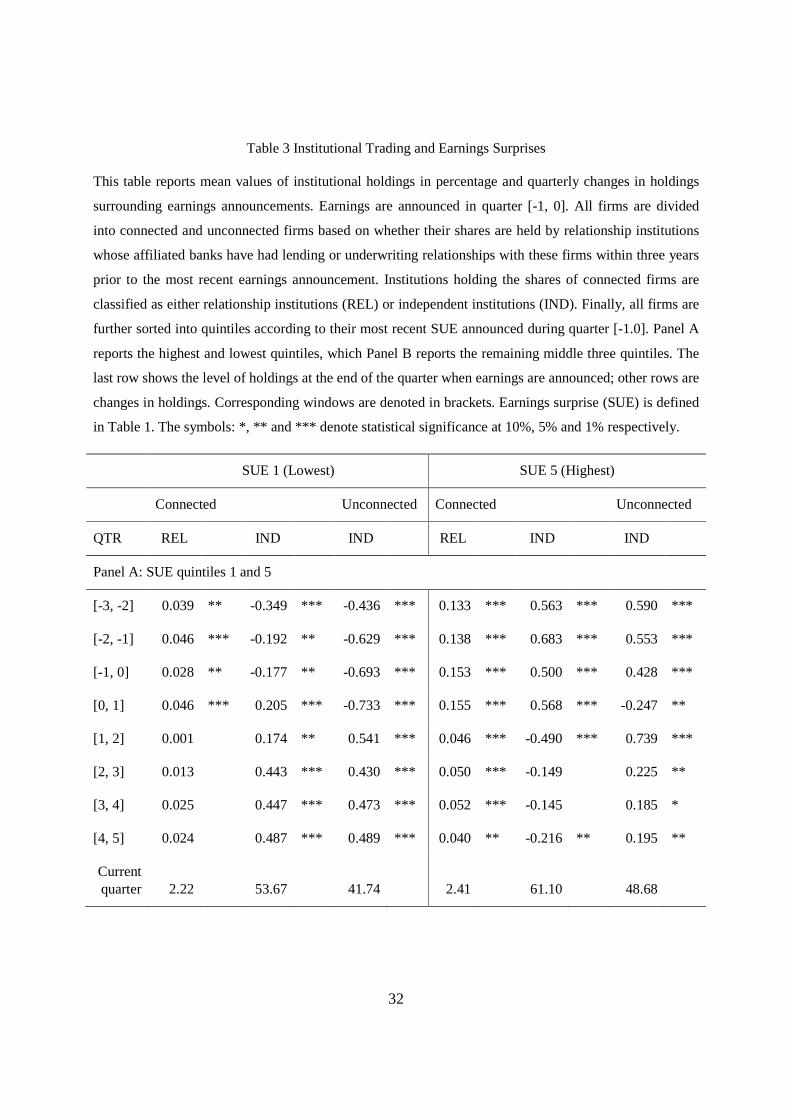
4.1 Changes in Institutional Holdings
To examine the trading behavior of relationship institutions and independent institutions
around earnings announcements, we partition all earnings announcements into quintiles each
quarter based on SUE. Quintile 5 contains firms with the highest SUE and quintile 1 contains
those with the lowest SUE. Results, reported in Table 3 reveal significant differences in trading
between relationship and independent institutions. As a baseline for interpreting changes in
holdings, the last row in Table 3 reports average holdings as of the end of quarter 0. The actual
earnings announcement occurs sometime within the [-1, 0] quarter.
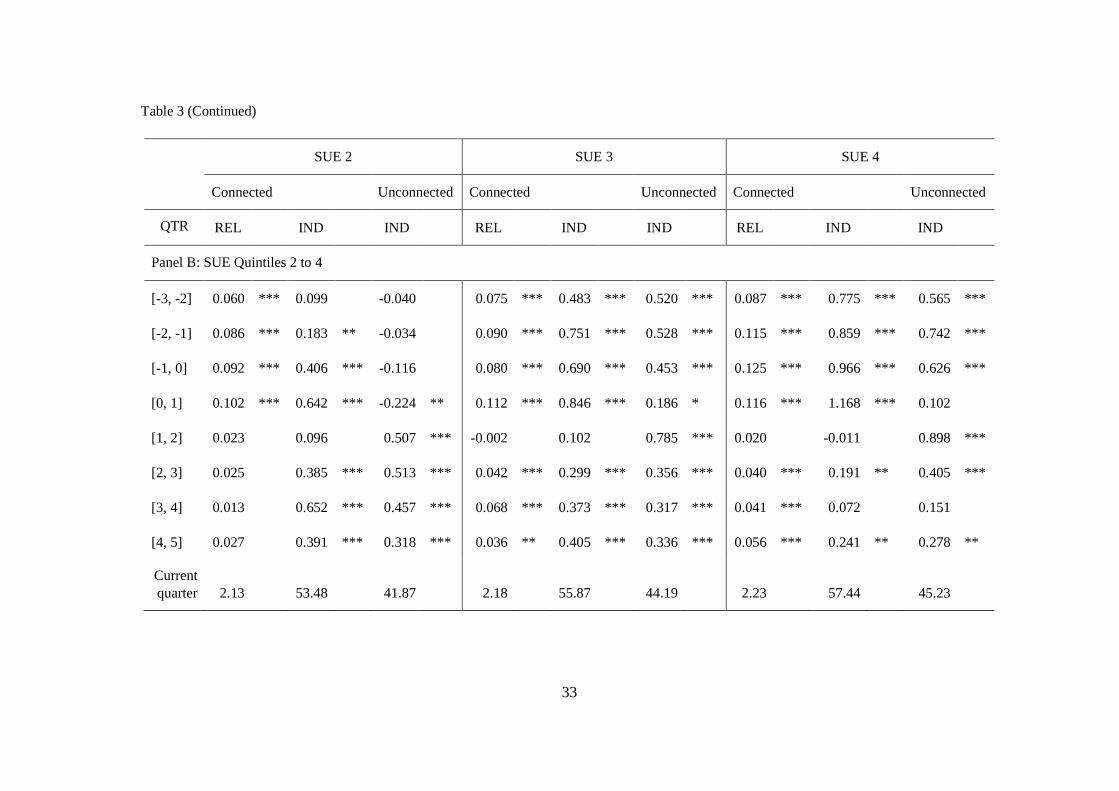
We acknowledge that our analysis is somewhat limited by the coarseness of the holdings
data. Since we are interested in whether relationship firms support their clients in the event of
bad news, we focus our analysis on SUE quintile 1. However, we note in passing that for neutral
to positive SUE (quintiles 3 – 5) both relationship and independent institutions tend to increase
their holdings of both connected and unconnected firms prior to earnings announcements. Also,
for all quintiles there is a general buying trend after earnings announcements. The only exception
is for quintile 5. Independent institutions, on average, appear to sell connected firms.

16
An interesting pattern emerges for negative SUE (quintile 1) firms. For connected firms,
independent institutions significantly reduce their holdings prior to the announcement, possibly
due to negative precursors of bad earnings reports. However, relationship institutions
significantly increase their holdings prior to the announcement. Presuming that relationship
institutions have information about their client firms that is at least as good as independent
institutions, this behavior supports the relationship insurance hypothesis, and runs counter to the
information advantage (predatory) hypothesis. The argument is further supported by the
significant buying among independent institutions following negative earnings announcements.
The reversal of trading behavior by independent institutions the negative earnings shocks are, on
average, transitory. It is likely to reverse in the near future.
For unconnected firms, independent institutions significantly reduce their holdings prior
to the announcements. Interestingly, independent institutions sell unconnected firms much more
aggressively that connected firms. Over the cumulative [-3, 0] window leading up to the earnings
announcement independent firms reduce their holdings of connected (unconnected) firms by
0.72% (1.76%) respectively. This is consistent with the notion that the observed behavior of
relationship institutions serves as a deterrent that restrains the selling of connected firms by
independent institutions prior to the announcement.
[Insert Table 3 here]
4.2 Abnormal Returns around Earnings Announcements
In this section, we use the Fama-Macbeth (1973) methodology to examine three-day
cumulative abnormal returns around earnings announcements. Because market reactions differ,
we estimate the model first for all announcements, and then separately for announcements with
positive surprises and negative surprises based on the sign of the SUE. The dependent variable is

17
CAR (-1, +1) surrounding the announcement day, using the market model. Each quarter we
estimate the cross-sectional regression model (equation 1), and then calculate the time-series
mean and standard deviation of the coefficients over the sample period.
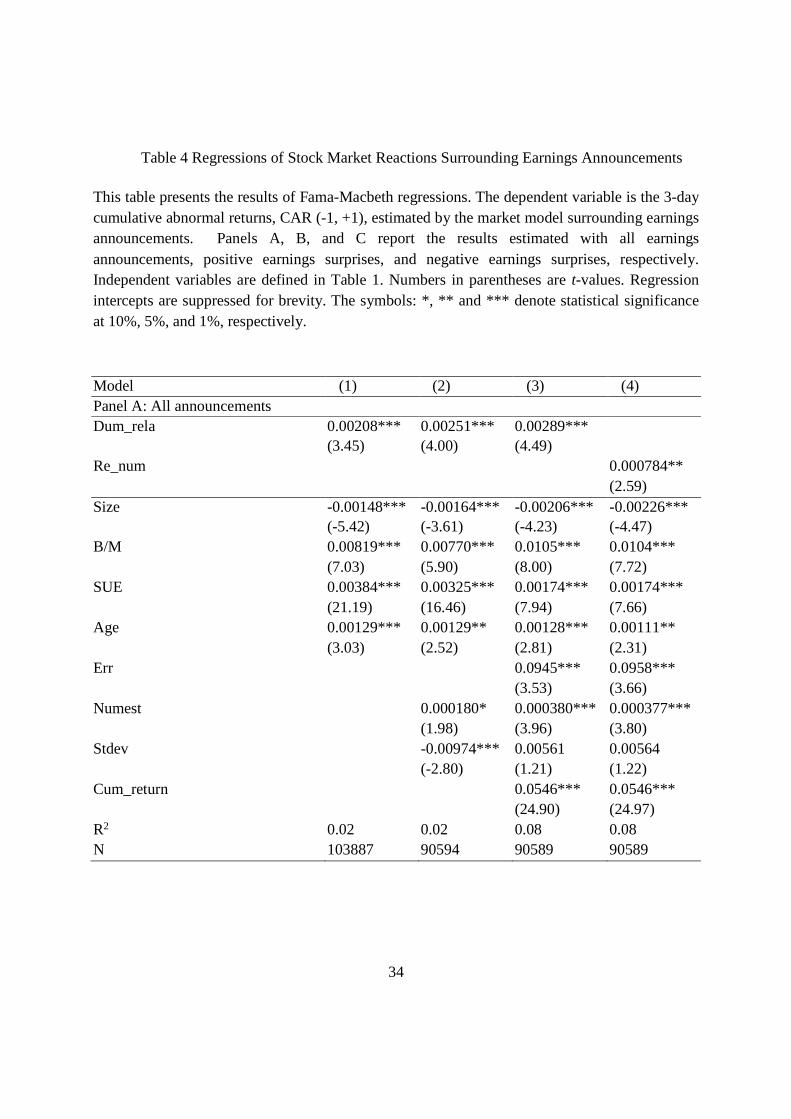
Table 4, Panel A presents results for all announcements. The primary result is that the
coefficient on the dummy variable representing the presence of at least one relationship
institution (Dum_rela) is positive and significant at the 1% level in all specifications. For
example, in Model 3 connected firms have a 0.29% (t-value = 4.49) higher CAR than
unconnected firms. As an alternate specification, in Model 4 the coefficient on Re_num shows
that firms with one more relationship institution have on average a 0.08% higher CAR (t-value =
2.59). These findings are consistent with the relationship insurance hypothesis; connected firms
experience better earnings announcement period abnormal returns.
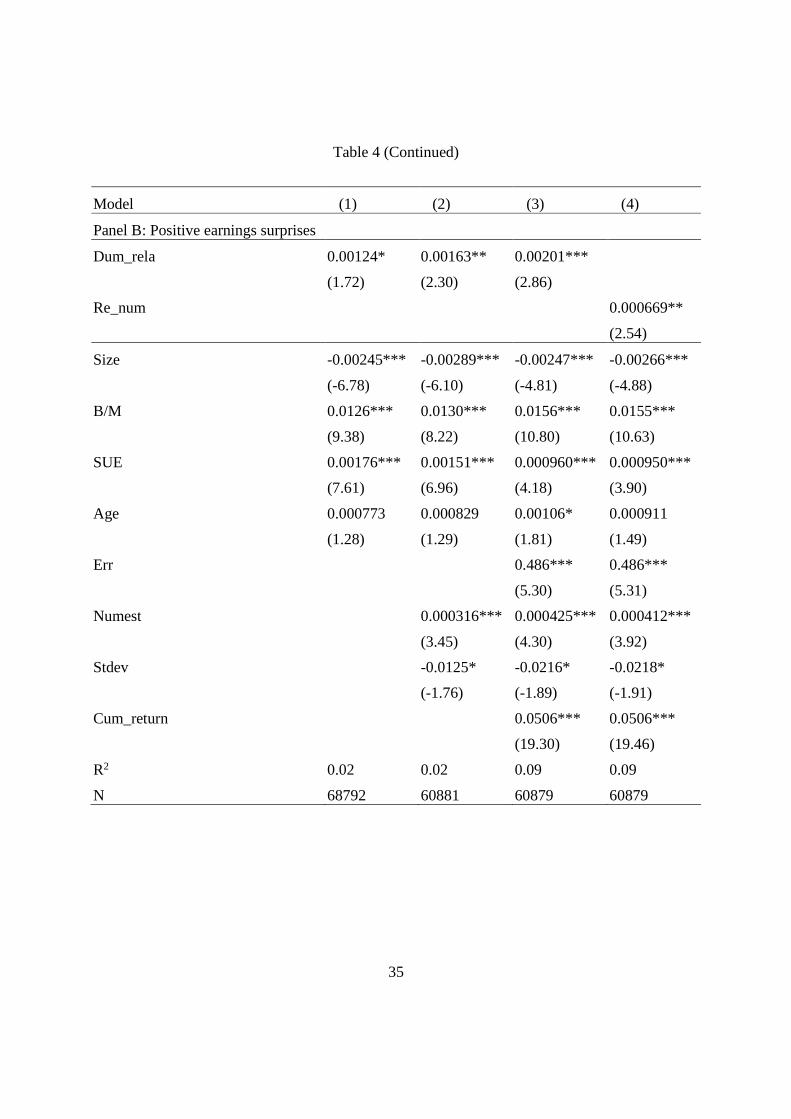
Panel B shows results for positive earnings surprises. As in Panel A, the coefficient
estimates on Dum_rela are positive and significant in all models. For example, in Model 3
connected firms have a 0.20% (t-value = 2.86) higher CAR than unconnected firms. Model 4
shows that for positive earnings surprises, firms with one more relationship institution have on
average a 0.07% higher CAR (t-value = 2.54). A more optimistic response to positive earnings
surprises when companies have relationship institutions could be the result of the certification
effect. For example, Puri (1996) shows that investors are willing to pay relatively higher prices
for securities underwritten by commercial banks than by investment banks due to the issuing
firms having closer or longer term relationships with commercial banks.
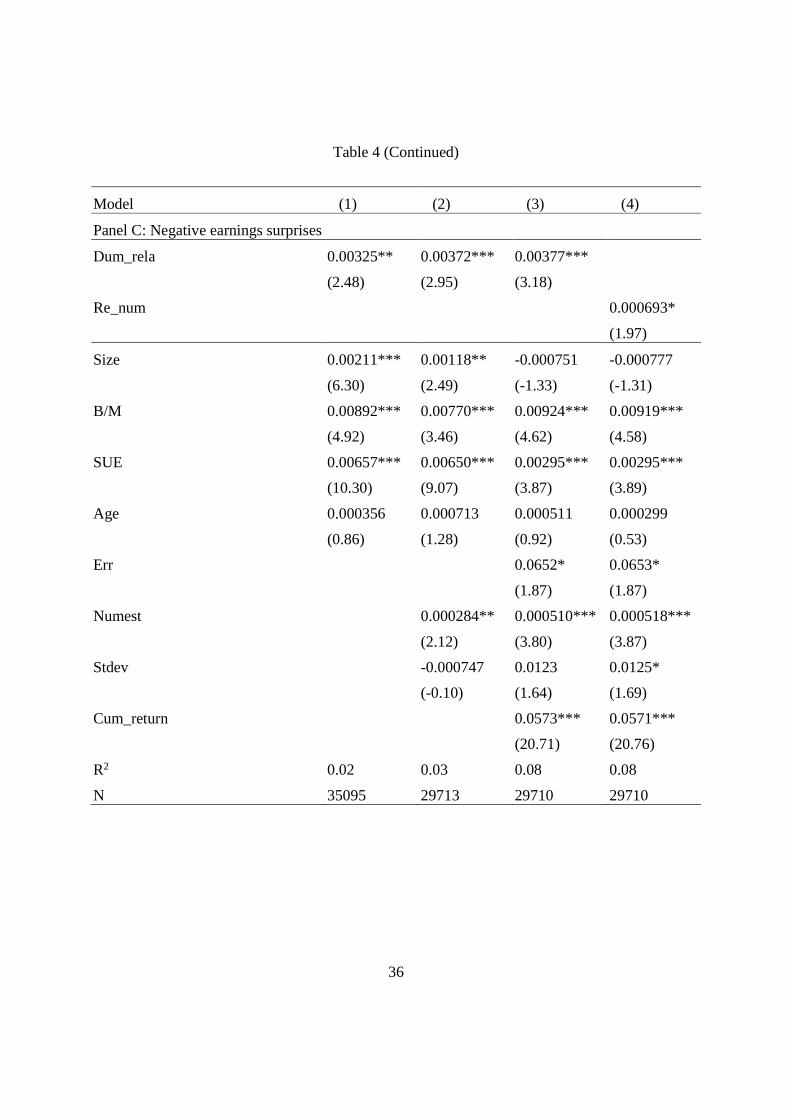
Panel C provides results for negative earnings surprises. As before, the coefficient
estimates on Dum_rela are positive and significant in all models. For example, in Model 3
connected firms have a 0.38% (t-value = 3.18) higher CAR than unconnected firms. Model 4

18
shows that for negative earnings surprises, firms with one more relationship institution have on
average a 0.07% higher CAR (t-value = 1.97). These results indicate that connected firms have a
significantly smaller (negative) price impact than unconnected firms when negative earnings
surprises occur.
Comparing positive and negative surprises provides some insight regarding the
relationship institution hypothesis. First, as is well known, the market is more sensitive to
negative surprises. This is confirmed by comparing the coefficients on SUE in Model 3, Panels
B and C (0.0010 vs. 0.0030). In our sample the market is three times more sensitive to negative
versus positive surprises. Second, the impact of the presence of at least one relationship
institution is greater for negative versus positive surprises. For example, the estimated coefficient
of Dum_rela in Model 3 of Panel C is roughly double that of Panel B (0.0038 vs. 0.0020). These
findings are consistent with the relationship insurance hypothesis if it is more important for
relationship institutions to support their clients’ stock prices when these clients experience
negative earnings shocks. Finally, coefficients on the control variables are significant and
broadly consistent with the literature on earnings announcements (see, for example, Berkman,
Dimitrov, Jain, Koch, and Tice, 2009).
[Insert Table 4 here]
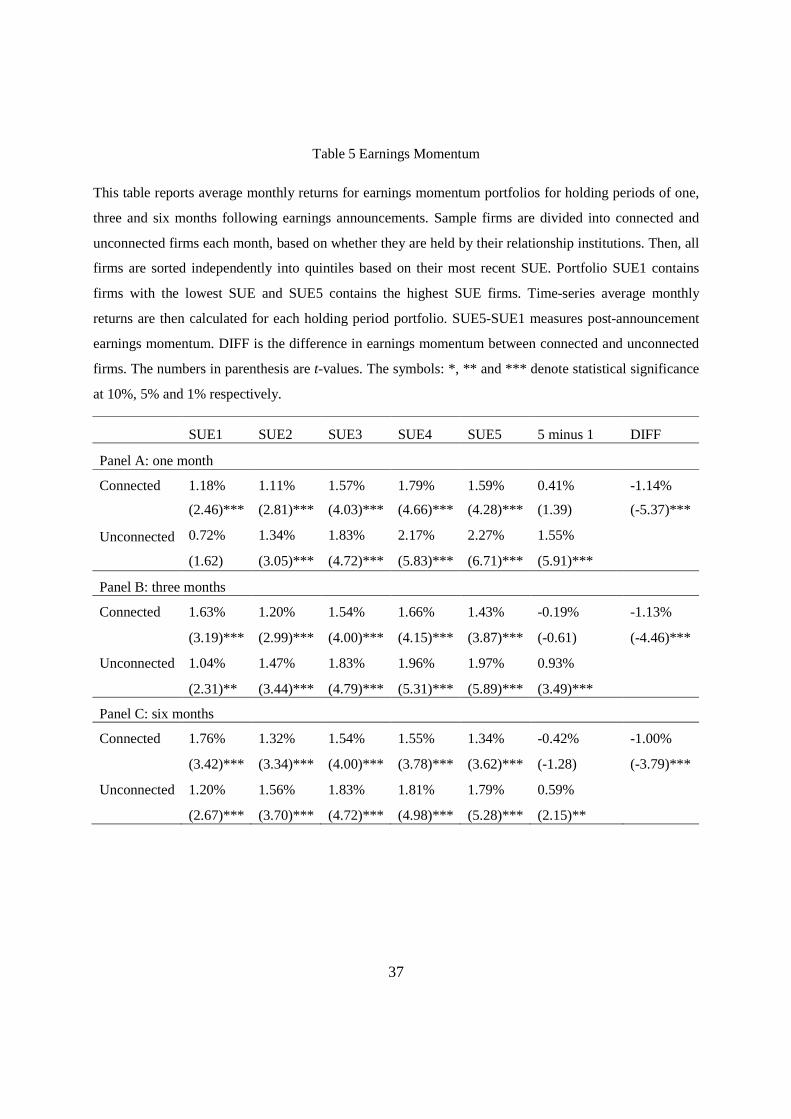
4.3 Earnings Momentum
In this section we use standard methodology to examine post-earnings announcement
momentum (drift) for connected and unconnected firms. Each month, we categorize firms as
connected or unconnected and then sort them into quintiles based on SUE from their most recent
earnings announcement. Firms in Portfolio SUE1 have the lowest SUE (negative surprises) and

19
firms in portfolio SUE5 have the highest SUE (positive surprises). We then examine average
monthly raw returns over one, three and six month holding periods.
Panel A of Table 5 shows that for unconnected firms the average return difference
between SUE5 firms and SUE1 firms is a statistically significant 1.55 % (t-value=5.91) over a
one month holding period. By contrast, the difference for connected firms is an insignificant
0.41%. Also, the difference in momentum between connected and unconnected firms is a
statistically significant -1.14% (t-value = -5.37). Over the three and six month holding periods,
average monthly momentum returns decrease for unconnected firms, but they remain statistically
significant. For connected firms, the momentum effect actually becomes negative, though it
remains insignificant. Importantly, for all horizons, momentum for unconnected firms is
significantly greater than for connected firms. To interpret these results, we note that the
momentum returns for unconnected firms are similar to those in the literature (Chan, Jegadeesh
and Lakonishok, 1996; Jegadeesh and Titman, 1993). However, for connected firms, momentum
returns have been smoothed. Returns for low (negative) SUE1 firms are higher, while returns to
high (positive) SUE 5 firms are lower. This pattern is consistent with relationship institutions
supporting client firms when needed (negative earnings surprises), but perhaps not when
unneeded (positive earnings surprises).
[Insert Table 5 here]
4.4 Addressing Sample Selection Issues and Price Support Measures
The direct comparison of connected and unconnected firms thus far may suffer from a
sample selection problem. It is possible that the observed differences in trading behavior, short
run and long run returns surrounding earnings announcements may be driven by unobserved
differences in firm characteristics between connected and unconnected firms, rather than by the

20
deliberate actions of relationship institutions. To address this concern, we re-examine the effects
of institutional behavior by contrasting the degree of price support within the set of connected
firms. The crux of our hypotheses center on institutions’ behavior when there is bad news, thus
we focus on negative earnings surprises in the following discussion.
Recall from Table 1, for the negative earnings surprise sample, connected firms have a
median of 3 (101) relationship (independent) institutions holding their shares. To focus on the
intensity of trading by individual institutions, we standardize each quarter’s trading activity by
constructing a price support (PS) measure similar to Shu’s (2007) positive-feedback measure
(MT measure). Specifically, we use the following procedures to calculate the PS measure. First,
we calculate ∆holdi,t (changes in holdings) for firm i in quarter t and divide it by ∑=
−∆3
0 ,
jjtihold ,
the sum of the absolute value of changes in institutional holdings of firm i over the four quarters
leading up to the announcement (quarter t). Second, we calculate an SUEindexi,t, a discrete
index to measure the sign and magnitude of SUE for firm i in quarter t. To do this, each quarter
firms are sorted into quartiles by SUE and assigned an SUEindexi,t with values: -2, -1, 1 or 2.
Finally, each quarter, we multiply
∑=
−∆
∆3
0 ,
jjti
it
hold
hold by SUEindexi,t and sum the product across the
past four quarters to obtain the price support measure (PS). Note that when SUEindexi,t is
positive, a higher PS measure indicates greater buying. However, when SUEindexi,t is negative,
a smaller (more negative) PS indicates greater buying, i.e., a contrarian strategy.
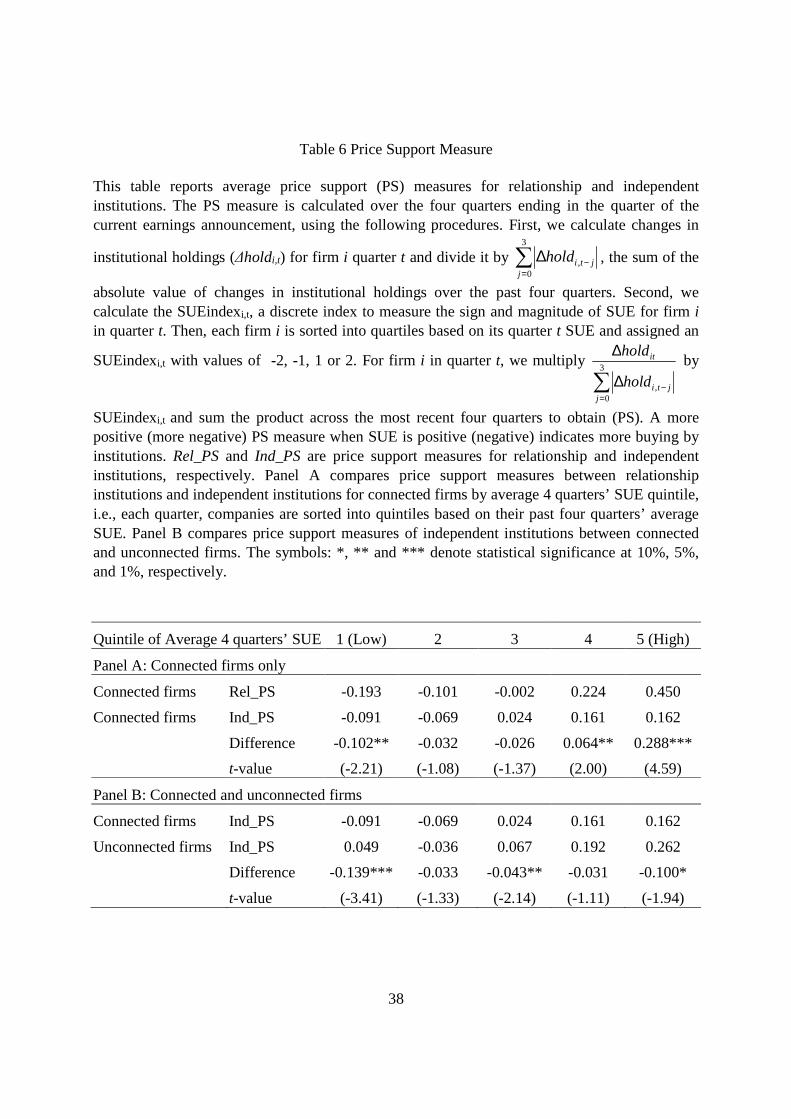
Panel A of Table 6 reports PS measures for connected firms, sorted into quintiles by their
past four quarter’s average SUE. For the most positive earnings surprises (quintile 5) connected
firms have positive price support by both relationship and independent institutions. However,

21
price support by relationship institutions is significantly higher than for independent institutions
(difference in PS = 0.29, t-value = 4.59). For the most negative earnings surprises (quintile 1)
connected firms also have positive price support by both relationship and independent
institutions (a negative SUEindex multiplied by a positive scaled change in holdings). Again, PS
is significantly higher for relationship institutions, supporting the relationship institution
hypothesis (difference in PS = -0.10, t-value = -2.21). For completeness, Panel B examines the
behavior of independent institutions with respect to their PS measures for connected and
unconnected firms. PS by independent institutions is positive for both connected and
unconnected firms when earnings surprises are most positive (quintile 5). However, for the most
negative earnings surprises (quintile 1), PS by independent institutions is negative for connected
firms and positive for unconnected firms (difference in PS = -0.14, t-value = -3.41, remembering
the SUEindex is negative in this case). These findings suggests that independent institutions
pursue momentum strategy for unconnected firms regardless of the sign of earnings surprises,
but pursue such a strategy for connected firms only when the earnings surprises are positive.
Like our results using raw changes in holdings reported in Table 3, our scaled price support
measure also shows significant differences in institutional trading, in support of the relationship
institution hypothesis. The price support also appears to induce independent institutions to
reduce their likelihood to pursue momentum strategy.
[Insert Table 6 here]
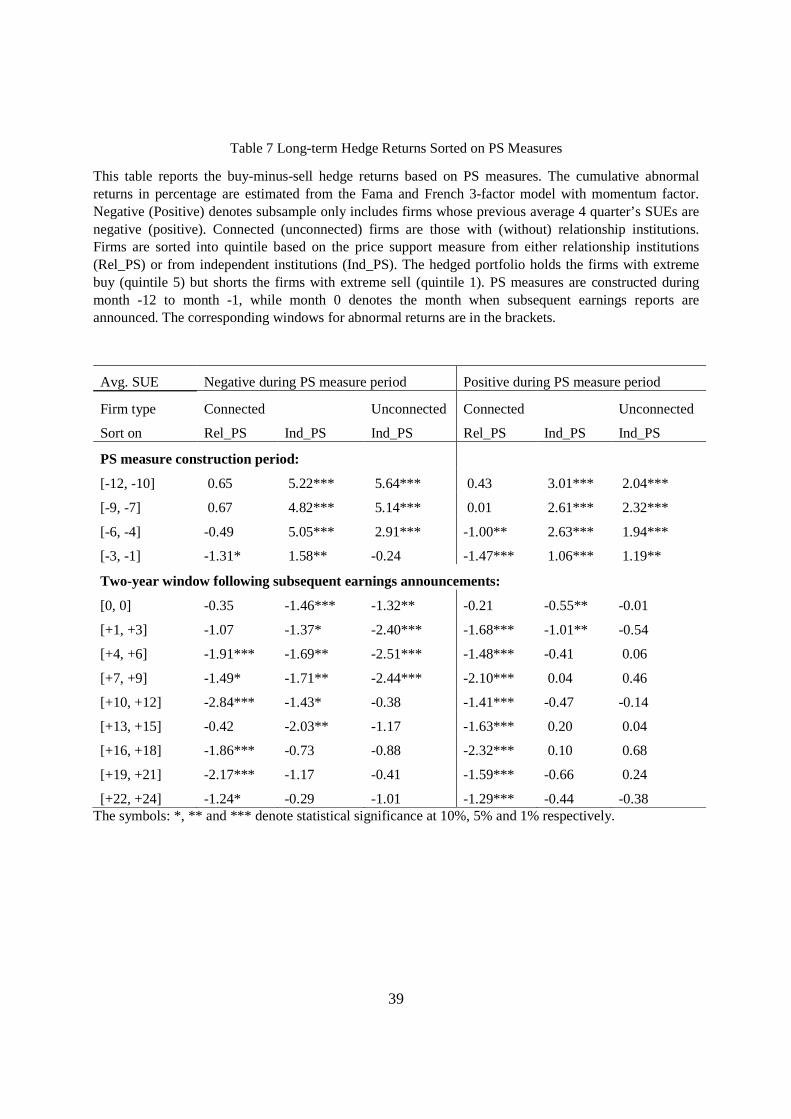
4.5 Abnormal Hedge (Buy-minus-sell) Returns
As a final test of the potential differential effects of trading by relationship versus
independent institutions, we examine abnormal hedge (buy-minus-sell) returns conditional on the
sign of average SUE during the four PS measure construction quarters (the PS period). We also

22
follow the returns of hedged portfolios for two years following the PS period. We are not
suggesting that institutions are holding these hedge portfolios for two years. It is used to
investigate the impacts on firms following the trading activities. Specifically, we estimate
monthly CARs using the Fama-French-Carhart four-factor model. Each quarter we sort
connected firms (also unconnected firms separately) that have had a negative average SUE over
the previous four quarters into quintiles based on their PS measures. The hedged portfolio holds
(shorts) the one with the most buy (sell) PS quintile, i.e., buy minus sell. We follow the similar
procedure for firms with a positive average SUE.
Table 7 shows striking hedge return patterns. It is obvious that independent institutions
are trading for temporary price movements. The concurrent hedge returns are significantly
positive and only during the PS period regardless of portfolios experiencing negative or positive
average SUEs. More strikingly, for the portfolio with a negative average SUE, the hedge returns
are significantly negative lasting for 15 months for connected firms and 9 months for
unconnected firms following the PS period.
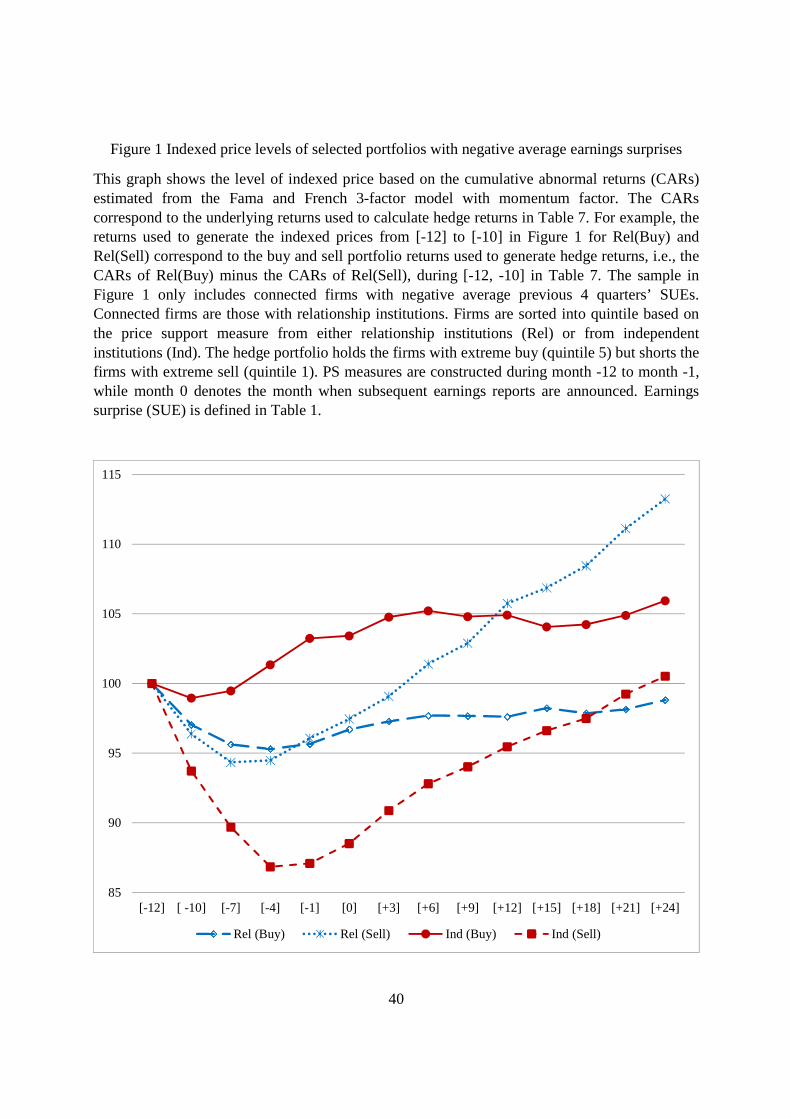
Figure 1 traces the price levels of connected firms experiencing a negative average SUE
using the original buy and sell portfolio abnormal returns. We assume all portfolios start with a
hypothetical index price of 100. If a portfolio always has 0 abnormal returns during the following
three years, its price will remain at 100. Figure 1 shows that the significantly negative hedge
returns sorted on the PS measures of independent institutions are driven by the dramatic price
reversals of the extreme sell portfolio. The price level of this portfolio drops more than 13 points
to below 87 during the third PS constructing quarter. It takes about two years for this portfolio to
resume its price level at 100. On the other hand, the price path of extreme buy portfolio by
independent institutions is rather flat following the PS period. The results suggest that, when

23
firms experience negative SUEs, the selling pressure by independent institutions pushes the stock
prices from firms’ fundamental values for rather extensive periods. If the selling is information
driven, we should not have observed the price reversals and the hedge returns should have been
insignificantly different from 0 following the PS period.
In contrast, Table 7 reports that the hedge returns sort on PS measure by relationship
institutions are indeed insignificantly different from 0 during the PS period except for the last
quarter, which is significantly negative. The negative hedge returns continue for the following
two years. The findings suggest that relationship institutions do not use their private information
to trade for profit instead they trade to support their clients.
Consistent with the above claim, Figure 1 shows that the price levels of both buy and sell
portfolios by relationship institutions follow similar paths during the first three PS construction
quarters, but the sell group rebounds during the last PS quarter and continue to rise for the
following two years. During the same period, the price levels of buy group hover slightly below
the 100 mark. These price paths are consistent with the explanation that, with limited capital to
support client firms’ stock prices, banks choose to sell the clients rebounding on their own and
buy those in need of price supports. In this sense, banks are using private information to decide
which firms to support rather than trading for profit. If the trading of relationship institutions
have no purposes or effects, one should have expected similar price paths of both buy and sell
portfolios during the PS period and no price reversals following the PS period.
Another observation implied by Figure 1 is that relationship and independent institutions
do not buy and sell the same group of firms. If both types of institutional investors trade in the
same way, i.e., buy and sell the same group of firms, the price paths of buy (or sell) for both
types of institutions would have been similar. The fact that the group of firms supported by

24
relationship institutions exhibits smooth price path in contrast to that sold by independent
institutions is consistent with the relationship insurance hypothesis. The impact of such supports
seems quite remarkable when one considers relationship institutions are outnumbered by about
100:1 for a typical client firm (Table 1 also shows the percent of client firms’ shares held by
relationship institutions is also dwarfed by the holdings of independent institutions). Second, if
one considers abnormal returns (long-term drift) surrounding earnings announcements to
represent an anomaly or market inefficiency, then PS by relationship institutions helps to reduce
this drift.
[Insert Table 7 here]
5. Conclusion
Financial conglomerates have the opportunity to gather information from multiple
sources, and to use that information in multiple ways. When asset managers hold shares of firms
that also have lending or underwriting relationships with affiliated banks, they may either exploit
private information obtained from their affiliated banks to make profits (information advantage
hypothesis), or support their clients to maintain good relationships in hope of future business
opportunities (relationship insurance hypothesis). Although “Chinese Walls” are designed to
prevent information spillover among different divisions of financial conglomerates, prior studies
suggest that Chinese Walls may not be totally effective. This paper examines the trading
behavior of relationship institutions and the resulting impact on connected client firms, focusing
primarily upon when these client firms experience negative earnings shocks.
Our empirical findings support the relationship insurance hypothesis since relationship
institutions support their client firms when these firms have negative earnings surprises. This
support (increase in share holdings) also appears to discourage selling pressure from independent

25
institutions holding shares in these client firms. Moreover, price support from relationship
institutions mitigates both the negative announcement period returns and the post-earnings-
announcement-drift of client firms, thus generates smoother price paths of client firms.
We believe this paper contributes to the literature on the roles of institutional investors
and, more generally, financial institutions by studying the non-intermediary role of financial
conglomerates in the capital markets. The findings also provide implications for the asset pricing
literature. If relationship institutions can reduce unnecessary temporary price movements, less
noise in financial markets could be considered welfare enhancing.

26
References
Acharya, V., and T. Johnson. “Insider Trading in Credit Derivatives.” Journal of Financial
Economics, 84 (2007), 110–141.
Allen, F., S. Morris, and H. Shin. “Beauty Contests and Iterated Expectations in Asset Markets.”
Review of Financial Studies 19 (2006), 719-752.
Baker, M., L. Litov, J. Wachter, and J. Wurgler. “Can Mutual Fund Managers Pick Stocks?
Evidence from Their Trades Prior to Earnings Announcements.” Journal of Financial and
Quantitative Analysis 45 (2010), 1111–1131.
Bernard, V. L., and J. K. Thomas. “Post-Earnings-Announcement Drift: Delayed Price Response
or Risk Premium?” Journal of Accounting Research, 27 (1989), 1-36.
Berkman, H., V. Dimitrov, P. C. Jain, P. D. Koch, and S. Tice. “Sell on the News: Differences of
Opinion, short-sales Constraints, and Returns around Earnings Announcements.” Journal
of Financial Economics, 92 (2009), 376-399.
Cella, C., A. Ellul, and M. Giannetti. “Investor Horizons and the Amplification of Market
Shocks.” Review of Financial Studies, 26 (2013), 1607-1648.
Chan, L. K. C., N. Jegadeesh, and J. Lakonishok. “Momentum Strategies.” Journal of Finance,
51 (1996), 1681-1713.
Chan, L. K. C., J. Karceski, and J. Lakonishok. “Analysts’ Conflict of Interest and Biases in
Earnings Forecasts.” Journal of Financial and Quantitative Analysis, 42 (2007), 893-913.
Chen, X., J. Harford, and K. Li. "Monitoring: Which Institutions Matter?" Journal of Financial
Economics, 86 (2007), 279-305.
Chen, T., and X. Martin. “Do Bank-Affiliated Analysts Benefit from Lending Relationships?”
Journal of Accounting Research, 49 (2011), 633-675.
Chordia, T., and L. Schivakumar. “Earnings and Price Momentum.” Journal of Financial
Economics, 80 (2006), 627-656.
Dass, N., and M. Massa. “The Impact of a Strong Bank-Firm Relationship on the Borrowing
Firm.” Review of Financial Studies, 24 (2011), 1204-1260.

27
Ellis, K, R. Michaely, and M. O’Hara. “When the Underwriter Is the Market Maker: An
Examination of Trading in the IPO Market.” Journal of Finance, 55 (2000), 1039-1074.
Fama, E., and J. Macbeth. “Risk, Return, and Equilibrium: Empirical Tests.” Journal of Political
Economy, 81 (1973), 607-636.
Ferreira, M., and P. Matos. “Universal Banks and Corporate Control: Evidence from the Global
Syndicated Loan Market.” Review of Financial Studies, 25 (2012), 2703-2744.
Griffin, J., T. Shu, and Topaloglu. “Examining the Dark Side of Financial Markets: Do
Institutions Trade on Information from Investment Bank Connections?” Review of
Financial Studies, 27 (2012), 2155-2188.
Hao, Q., and X. Yan. “The Performance of Investment Bank-Affiliated Mutual Funds: Conflicts
of Interest or Informational Advantage?” Journal of Financial and Quantitative Analysis,
47 (2012), 537-565.
Ivashina, V., and Z. Sun, “Institutional Stock Trading on Loan Market Information.” Journal of
Financial Economics, 100 (2011), 284-303.
Jegadeesh, N., and S. Titman. “Returns to Buying Winners and Selling Losers: Implications for
Stock Market Efficiency.” Journal of Finance, 48 (1993), 65-91.
Jegadeesh, N., and S. Titman. “Momentum.” Working Paper, University of Illinois (2001).
Jiang, Hao, and Lu Zheng. “Identifying Skilled Mutual Fund Managers by Their Ability to
Forecast Earnings.” Working Paper, University of California, Irvine (2014).
Jones, C. P., and R. H. Litzenberger. “Quarterly Earnings Reports and Intermediate Stock Price
Trends.” Journal of Finance, 25 (1970), 143-148.
Latane, H. A., and C. P. Jones. “Standardized Unexpected Earnings: 1971-1977.” Journal of
Finance, 34 (1979), 717-724.
Lown, C. S., C. L. Osler, P. E. Strahan, and A. Sufi. “The Changing Landscapes of the Financial
Services Industry: What Lies Ahead?” FRB of New York Economic Policy Review, 6
(2000), 39-55.

28
Massa, M., and Z. Rehman. “Information Flows within Financial Conglomerates: Evidence from
the Banks-Mutual Funds Relationship.” Journal of Financial Economics, 89 (2008), 288-
306.
Puri, M. “Commercial Banks in Investment Banking Conflict of Interest or Certification Role?”
Journal of Financial Economics, 40 (1996), 373-401.
Reuter, J. “Are IPO Allocations for Sale? Evidence from Mutual funds.” Journal of Finance, 64
(2006), 2289-2324.
Shu, T. “Does Positive-Feedback Trading by Institutions Contribute to Stock Return
Momentum?” AFA 2007 Meeting Paper.
Vayanos, D., and P. Woolley. “An Institutional Theory of Momentum and Reversal.” Review of
Financial Studies, 26 (2013), 1087-1145.
Yan, X., and Z. Zhang. “Institutional Investors and Equity Returns: Are Short-term Institutions
Better Informed?” Review of Financial Studies, 22 (2009), 893-924.
Yasuda, A. “Do Bank Relationships Affect the Firm’s Underwriter Choice in the Corporate-
Bond Underwriting Market?” Journal of Finance, 60 (2005), 1259–1292.
29
Table 1 Summary Statistics
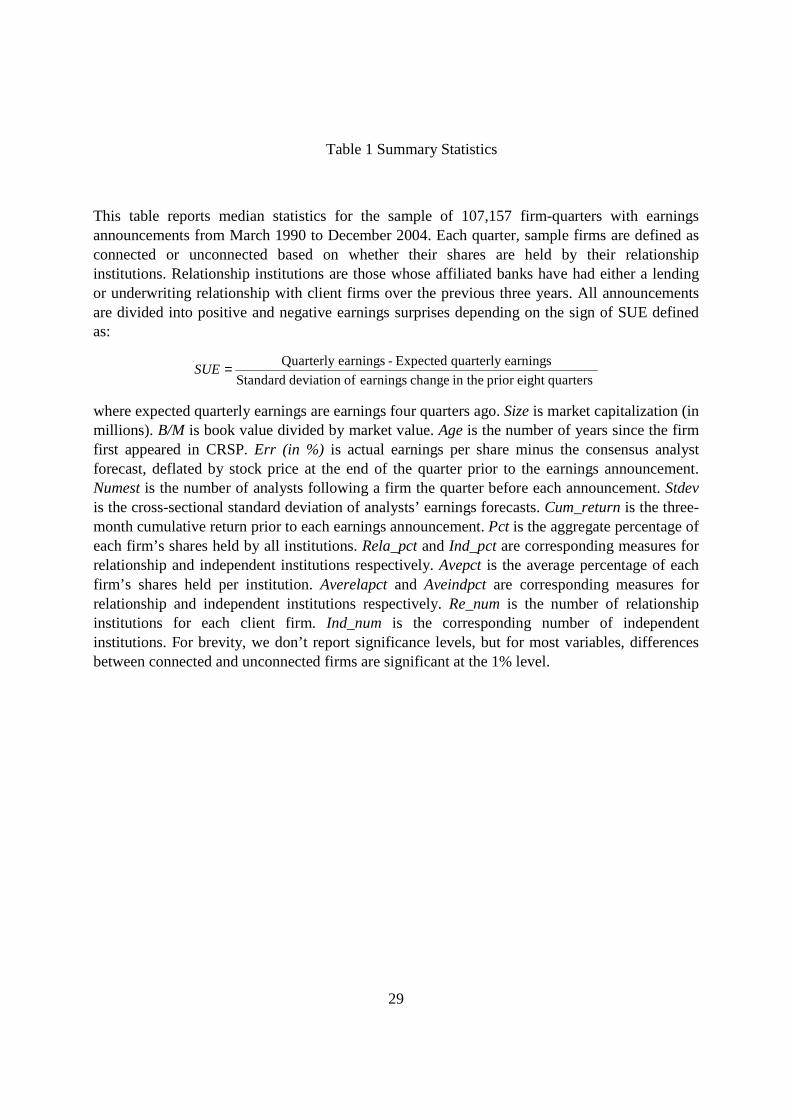
This table reports median statistics for the sample of 107,157 firm-quarters with earnings announcements from March 1990 to December 2004. Each quarter, sample firms are defined as connected or unconnected based on whether their shares are held by their relationship institutions. Relationship institutions are those whose affiliated banks have had either a lending or underwriting relationship with client firms over the previous three years. All announcements are divided into positive and negative earnings surprises depending on the sign of SUE defined as:
quarterseight prior thein change earnings of deviation Standard
earningsquarterly Expected-earningsQuarterly =SUE
where expected quarterly earnings are earnings four quarters ago. Size is market capitalization (in millions). B/M is book value divided by market value. Age is the number of years since the firm first appeared in CRSP. Err (in %) is actual earnings per share minus the consensus analyst forecast, deflated by stock price at the end of the quarter prior to the earnings announcement. Numest is the number of analysts following a firm the quarter before each announcement. Stdev is the cross-sectional standard deviation of analysts’ earnings forecasts. Cum_return is the three-month cumulative return prior to each earnings announcement. Pct is the aggregate percentage of each firm’s shares held by all institutions. Rela_pct and Ind_pct are corresponding measures for relationship and independent institutions respectively. Avepct is the average percentage of each firm’s shares held per institution. Averelapct and Aveindpct are corresponding measures for relationship and independent institutions respectively. Re_num is the number of relationship institutions for each client firm. Ind_num is the corresponding number of independent institutions. For brevity, we don’t report significance levels, but for most variables, differences between connected and unconnected firms are significant at the 1% level.
30
Table 1 (Continued)
All announcements Positive earnings surprise Negative earnings surprise
Connected Unconnected Difference Connected Unconnected Difference Connected Unconnected Difference
SUE 0.463 0.412 0.051 1.118 1.025 0.093 -0.933 -0.886 -0.047
Size 1144.267 301.795 842.473 1371.510 371.426 1000.084 796.626 201.445 595.181
B/M 0.472 0.530 -0.058 0.416 0.479 -0.063 0.592 0.658 -0.066
Age 16 13 3 16 13 3 15 12 3
Err 0.013 0.000 0.013 0.032 0.026 0.006 -0.043 -0.146 0.103
Numest 7 3 4 7 4 3 6 3 3
Stdev 0.010 0.010 0.000 0.010 0.010 0.000 0.020 0.020 0.000
Cum_return 5.48% 5.76% -0.28% 8.48% 10.21% -1.73% -0.91% -3.45% 2.54%
Pct 61.37% 44.90% 16.46% 62.90% 46.60% 16.30% 58.35% 41.68% 16.67%
Rela_pct 1.10% 0.00% 1.10% 1.14% 0.00% 1.14% 1.03% 0.00% 1.03%
Ind_pct 58.89% 44.90% 13.98% 60.38% 46.59% 13.79% 55.73% 41.68% 14.05%
Avepct 0.48% 0.80% -0.31% 0.46% 0.75% -0.30% 0.53% 0.88% -0.35%
Averelacpt 0.32% 0.00% 0.32% 0.33% 0.00% 0.33% 0.30% 0.00% 0.30%
Aveindpct 0.48% 0.80% -0.31% 0.46% 0.75% -0.30% 0.53% 0.88% -0.35%
Re_num 3 0 3 3 0 3 3 0 3
Ind_num 119 53 66 129 58 71 101 44 57
# of obs. 57729 49428 38017 32788 19712 16640
31
Table 2 Correlation Matrix for Explanatory Variables
This table presents the correlation matrix for explanatory variables in the regression analysis. All variables are defined in Table 1.
Dum_rela Re_num Size B/M SUE Age Err Numest Stdev Cum_return
Dum_rela 1.00
Re_num 0.56 1.00
Size 0.38 0.52 1.00
B/M -0.06 -0.06 -0.36 1.00
SUE 0.02 0.03 0.26 -0.25 1.00
Age 0.09 0.22 0.45 -0.03 0.02 1.00
Err 0.01 0.01 0.03 -0.08 0.04 0.01 1.00
Numest 0.30 0.42 0.72 -0.21 0.18 0.21 0.02 1.00
Stdev 0.01 0.02 -0.05 0.12 -0.10 0.00 -0.04 -0.03
Cum_return -0.02 -0.03 0.02 -0.10 0.13 -0.03 0.02 -0.02 -0.04 1.00
32
Table 3 Institutional Trading and Earnings Surprises
This table reports mean values of institutional holdings in percentage and quarterly changes in holdings
surrounding earnings announcements. Earnings are announced in quarter [-1, 0]. All firms are divided
into connected and unconnected firms based on whether their shares are held by relationship institutions
whose affiliated banks have had lending or underwriting relationships with these firms within three years
prior to the most recent earnings announcement. Institutions holding the shares of connected firms are
classified as either relationship institutions (REL) or independent institutions (IND). Finally, all firms are
further sorted into quintiles according to their most recent SUE announced during quarter [-1.0]. Panel A
reports the highest and lowest quintiles, which Panel B reports the remaining middle three quintiles. The
last row shows the level of holdings at the end of the quarter when earnings are announced; other rows are
changes in holdings. Corresponding windows are denoted in brackets. Earnings surprise (SUE) is defined
in Table 1. The symbols: *, ** and *** denote statistical significance at 10%, 5% and 1% respectively.
SUE 1 (Lowest) SUE 5 (Highest)
Connected Unconnected Connected Unconnected
QTR REL IND IND REL IND IND
Panel A: SUE quintiles 1 and 5
[-3, -2] 0.039 ** -0.349 *** -0.436 *** 0.133 *** 0.563 *** 0.590 ***
[-2, -1] 0.046 *** -0.192 ** -0.629 *** 0.138 *** 0.683 *** 0.553 ***
[-1, 0] 0.028 ** -0.177 ** -0.693 *** 0.153 *** 0.500 *** 0.428 ***
[0, 1] 0.046 *** 0.205 *** -0.733 *** 0.155 *** 0.568 *** -0.247 **
[1, 2] 0.001 0.174 ** 0.541 *** 0.046 *** -0.490 *** 0.739 ***
[2, 3] 0.013 0.443 *** 0.430 *** 0.050 *** -0.149 0.225 **
[3, 4] 0.025 0.447 *** 0.473 *** 0.052 *** -0.145 0.185 *
[4, 5] 0.024 0.487 *** 0.489 *** 0.040 ** -0.216 ** 0.195 **
Current quarter 2.22 53.67 41.74 2.41 61.10 48.68
33
Table 3 (Continued)
SUE 2 SUE 3 SUE 4
Connected Unconnected Connected Unconnected Connected Unconnected
QTR REL IND IND REL IND IND REL IND IND
Panel B: SUE Quintiles 2 to 4
[-3, -2] 0.060 *** 0.099 -0.040 0.075 *** 0.483 *** 0.520 *** 0.087 *** 0.775 *** 0.565 ***
[-2, -1] 0.086 *** 0.183 ** -0.034 0.090 *** 0.751 *** 0.528 *** 0.115 *** 0.859 *** 0.742 ***
[-1, 0] 0.092 *** 0.406 *** -0.116 0.080 *** 0.690 *** 0.453 *** 0.125 *** 0.966 *** 0.626 ***
[0, 1] 0.102 *** 0.642 *** -0.224 ** 0.112 *** 0.846 *** 0.186 * 0.116 *** 1.168 *** 0.102
[1, 2] 0.023 0.096 0.507 *** -0.002 0.102 0.785 *** 0.020 -0.011 0.898 ***
[2, 3] 0.025 0.385 *** 0.513 *** 0.042 *** 0.299 *** 0.356 *** 0.040 *** 0.191 ** 0.405 ***
[3, 4] 0.013 0.652 *** 0.457 *** 0.068 *** 0.373 *** 0.317 *** 0.041 *** 0.072 0.151
[4, 5] 0.027 0.391 *** 0.318 *** 0.036 ** 0.405 *** 0.336 *** 0.056 *** 0.241 ** 0.278 **
Current quarter 2.13 53.48 41.87 2.18 55.87 44.19 2.23 57.44 45.23
34
Table 4 Regressions of Stock Market Reactions Surrounding Earnings Announcements
This table presents the results of Fama-Macbeth regressions. The dependent variable is the 3-day cumulative abnormal returns, CAR (-1, +1), estimated by the market model surrounding earnings announcements. Panels A, B, and C report the results estimated with all earnings announcements, positive earnings surprises, and negative earnings surprises, respectively. Independent variables are defined in Table 1. Numbers in parentheses are t-values. Regression intercepts are suppressed for brevity. The symbols: *, ** and *** denote statistical significance at 10%, 5%, and 1%, respectively.
Model (1) (2) (3) (4) Panel A: All announcements Dum_rela 0.00208*** 0.00251*** 0.00289*** (3.45) (4.00) (4.49) Re_num 0.000784** (2.59) Size -0.00148*** -0.00164*** -0.00206*** -0.00226*** (-5.42) (-3.61) (-4.23) (-4.47) B/M 0.00819*** 0.00770*** 0.0105*** 0.0104*** (7.03) (5.90) (8.00) (7.72) SUE 0.00384*** 0.00325*** 0.00174*** 0.00174*** (21.19) (16.46) (7.94) (7.66) Age 0.00129*** 0.00129** 0.00128*** 0.00111** (3.03) (2.52) (2.81) (2.31) Err 0.0945*** 0.0958*** (3.53) (3.66) Numest 0.000180* 0.000380*** 0.000377*** (1.98) (3.96) (3.80) Stdev -0.00974*** 0.00561 0.00564 (-2.80) (1.21) (1.22) Cum_return 0.0546*** 0.0546*** (24.90) (24.97) R2 0.02 0.02 0.08 0.08 N 103887 90594 90589 90589
35
Table 4 (Continued)
Model (1) (2) (3) (4)
Panel B: Positive earnings surprises
Dum_rela 0.00124* 0.00163** 0.00201***
(1.72) (2.30) (2.86)
Re_num 0.000669**
(2.54)
Size -0.00245*** -0.00289*** -0.00247*** -0.00266***
(-6.78) (-6.10) (-4.81) (-4.88)
B/M 0.0126*** 0.0130*** 0.0156*** 0.0155***
(9.38) (8.22) (10.80) (10.63)
SUE 0.00176*** 0.00151*** 0.000960*** 0.000950***
(7.61) (6.96) (4.18) (3.90)
Age 0.000773 0.000829 0.00106* 0.000911
(1.28) (1.29) (1.81) (1.49)
Err 0.486*** 0.486***
(5.30) (5.31)
Numest 0.000316*** 0.000425*** 0.000412***
(3.45) (4.30) (3.92)
Stdev -0.0125* -0.0216* -0.0218*
(-1.76) (-1.89) (-1.91)
Cum_return 0.0506*** 0.0506***
(19.30) (19.46)
R2 0.02 0.02 0.09 0.09
N 68792 60881 60879 60879
36
Table 4 (Continued)
Model (1) (2) (3) (4)
Panel C: Negative earnings surprises
Dum_rela 0.00325** 0.00372*** 0.00377***
(2.48) (2.95) (3.18)
Re_num 0.000693*
(1.97)
Size 0.00211*** 0.00118** -0.000751 -0.000777
(6.30) (2.49) (-1.33) (-1.31)
B/M 0.00892*** 0.00770*** 0.00924*** 0.00919***
(4.92) (3.46) (4.62) (4.58)
SUE 0.00657*** 0.00650*** 0.00295*** 0.00295***
(10.30) (9.07) (3.87) (3.89)
Age 0.000356 0.000713 0.000511 0.000299
(0.86) (1.28) (0.92) (0.53)
Err 0.0652* 0.0653*
(1.87) (1.87)
Numest 0.000284** 0.000510*** 0.000518***
(2.12) (3.80) (3.87)
Stdev -0.000747 0.0123 0.0125*
(-0.10) (1.64) (1.69)
Cum_return 0.0573*** 0.0571***
(20.71) (20.76)
R2 0.02 0.03 0.08 0.08
N 35095 29713 29710 29710
37
Table 5 Earnings Momentum
This table reports average monthly returns for earnings momentum portfolios for holding periods of one,
three and six months following earnings announcements. Sample firms are divided into connected and
unconnected firms each month, based on whether they are held by their relationship institutions. Then, all
firms are sorted independently into quintiles based on their most recent SUE. Portfolio SUE1 contains
firms with the lowest SUE and SUE5 contains the highest SUE firms. Time-series average monthly
returns are then calculated for each holding period portfolio. SUE5-SUE1 measures post-announcement
earnings momentum. DIFF is the difference in earnings momentum between connected and unconnected
firms. The numbers in parenthesis are t-values. The symbols: *, ** and *** denote statistical significance
at 10%, 5% and 1% respectively.
SUE1 SUE2 SUE3 SUE4 SUE5 5 minus 1 DIFF
Panel A: one month
Connected 1.18% 1.11% 1.57% 1.79% 1.59% 0.41% -1.14%
(2.46)*** (2.81)*** (4.03)*** (4.66)*** (4.28)*** (1.39) (-5.37)***
Unconnected 0.72% 1.34% 1.83% 2.17% 2.27% 1.55%
(1.62) (3.05)*** (4.72)*** (5.83)*** (6.71)*** (5.91)***
Panel B: three months
Connected 1.63% 1.20% 1.54% 1.66% 1.43% -0.19% -1.13%
(3.19)*** (2.99)*** (4.00)*** (4.15)*** (3.87)*** (-0.61) (-4.46)***
Unconnected 1.04% 1.47% 1.83% 1.96% 1.97% 0.93%
(2.31)** (3.44)*** (4.79)*** (5.31)*** (5.89)*** (3.49)***
Panel C: six months
Connected 1.76% 1.32% 1.54% 1.55% 1.34% -0.42% -1.00%
(3.42)*** (3.34)*** (4.00)*** (3.78)*** (3.62)*** (-1.28) (-3.79)***
Unconnected 1.20% 1.56% 1.83% 1.81% 1.79% 0.59%
(2.67)*** (3.70)*** (4.72)*** (4.98)*** (5.28)*** (2.15)**
38
Table 6 Price Support Measure
This table reports average price support (PS) measures for relationship and independent institutions. The PS measure is calculated over the four quarters ending in the quarter of the current earnings announcement, using the following procedures. First, we calculate changes in
institutional holdings (∆holdi,t) for firm i quarter t and divide it by ∑=
−∆3
0,
jjtihold , the sum of the
absolute value of changes in institutional holdings over the past four quarters. Second, we calculate the SUEindexi,t, a discrete index to measure the sign and magnitude of SUE for firm i in quarter t. Then, each firm i is sorted into quartiles based on its quarter t SUE and assigned an
SUEindexi,t with values of -2, -1, 1 or 2. For firm i in quarter t, we multiply
∑=
−∆
∆3
0,
jjti
it
hold
hold by
SUEindexi,t and sum the product across the most recent four quarters to obtain (PS). A more positive (more negative) PS measure when SUE is positive (negative) indicates more buying by institutions. Rel_PS and Ind_PS are price support measures for relationship and independent institutions, respectively. Panel A compares price support measures between relationship institutions and independent institutions for connected firms by average 4 quarters’ SUE quintile, i.e., each quarter, companies are sorted into quintiles based on their past four quarters’ average SUE. Panel B compares price support measures of independent institutions between connected and unconnected firms. The symbols: *, ** and *** denote statistical significance at 10%, 5%, and 1%, respectively.
Quintile of Average 4 quarters’ SUE 1 (Low) 2 3 4 5 (High)
Panel A: Connected firms only
Connected firms Rel_PS -0.193 -0.101 -0.002 0.224 0.450
Connected firms Ind_PS -0.091 -0.069 0.024 0.161 0.162
Difference -0.102** -0.032 -0.026 0.064** 0.288***
t-value (-2.21) (-1.08) (-1.37) (2.00) (4.59)
Panel B: Connected and unconnected firms
Connected firms Ind_PS -0.091 -0.069 0.024 0.161 0.162
Unconnected firms Ind_PS 0.049 -0.036 0.067 0.192 0.262
Difference -0.139*** -0.033 -0.043** -0.031 -0.100*
t-value (-3.41) (-1.33) (-2.14) (-1.11) (-1.94)
39
Table 7 Long-term Hedge Returns Sorted on PS Measures
This table reports the buy-minus-sell hedge returns based on PS measures. The cumulative abnormal returns in percentage are estimated from the Fama and French 3-factor model with momentum factor. Negative (Positive) denotes subsample only includes firms whose previous average 4 quarter’s SUEs are negative (positive). Connected (unconnected) firms are those with (without) relationship institutions. Firms are sorted into quintile based on the price support measure from either relationship institutions (Rel_PS) or from independent institutions (Ind_PS). The hedged portfolio holds the firms with extreme buy (quintile 5) but shorts the firms with extreme sell (quintile 1). PS measures are constructed during month -12 to month -1, while month 0 denotes the month when subsequent earnings reports are announced. The corresponding windows for abnormal returns are in the brackets.
Avg. SUE Negative during PS measure period Positive during PS measure period
Firm type Connected Unconnected Connected Unconnected
Sort on Rel_PS Ind_PS Ind_PS Rel_PS Ind_PS Ind_PS
PS measure construction period:
[-12, -10] 0.65 5.22*** 5.64*** 0.43 3.01*** 2.04***
[-9, -7] 0.67 4.82*** 5.14*** 0.01 2.61*** 2.32***
[-6, -4] -0.49 5.05*** 2.91*** -1.00** 2.63*** 1.94***
[-3, -1] -1.31* 1.58** -0.24 -1.47*** 1.06*** 1.19**
Two-year window following subsequent earnings announcements:
[0, 0] -0.35 -1.46*** -1.32** -0.21 -0.55** -0.01
[+1, +3] -1.07 -1.37* -2.40*** -1.68*** -1.01** -0.54
[+4, +6] -1.91*** -1.69** -2.51*** -1.48*** -0.41 0.06
[+7, +9] -1.49* -1.71** -2.44*** -2.10*** 0.04 0.46
[+10, +12] -2.84*** -1.43* -0.38 -1.41*** -0.47 -0.14
[+13, +15] -0.42 -2.03** -1.17 -1.63*** 0.20 0.04
[+16, +18] -1.86*** -0.73 -0.88 -2.32*** 0.10 0.68
[+19, +21] -2.17*** -1.17 -0.41 -1.59*** -0.66 0.24
[+22, +24] -1.24* -0.29 -1.01 -1.29*** -0.44 -0.38 The symbols: *, ** and *** denote statistical significance at 10%, 5% and 1% respectively.
40
Figure 1 Indexed price levels of selected portfolios with negative average earnings surprises
This graph shows the level of indexed price based on the cumulative abnormal returns (CARs) estimated from the Fama and French 3-factor model with momentum factor. The CARs correspond to the underlying returns used to calculate hedge returns in Table 7. For example, the returns used to generate the indexed prices from [-12] to [-10] in Figure 1 for Rel(Buy) and Rel(Sell) correspond to the buy and sell portfolio returns used to generate hedge returns, i.e., the CARs of Rel(Buy) minus the CARs of Rel(Sell), during [-12, -10] in Table 7. The sample in Figure 1 only includes connected firms with negative average previous 4 quarters’ SUEs. Connected firms are those with relationship institutions. Firms are sorted into quintile based on the price support measure from either relationship institutions (Rel) or from independent institutions (Ind). The hedge portfolio holds the firms with extreme buy (quintile 5) but shorts the firms with extreme sell (quintile 1). PS measures are constructed during month -12 to month -1, while month 0 denotes the month when subsequent earnings reports are announced. Earnings surprise (SUE) is defined in Table 1.
85
90
95
100
105
110
115
[-12] [ -10] [-7] [-4] [-1] [0] [+3] [+6] [+9] [+12] [+15] [+1 8] [+21] [+24]
Rel (Buy) Rel (Sell) Ind (Buy) Ind (Sell)