Embed Size (px)
Citation preview
THE PRODUCTION OF VEGETABLE CROPS UNDER PROTECTION FORSMALL-SCALE FARMING SITUATIONS
©© UUnniivveerrssiittyy ooff PPrreettoorriiaa
THE PRODUCTION OF VEGETABLE CROPS UNDER PROTECTION FORSMALL-SCALE FARMING SITUATIONS
SUBMITTED IN PARTIAL FULFILLMENTOF THE REQUIREMENTS FOR THE DEGREE
M INST AGRAR: PLANT PRODUCTION (AGRONOMY)
DEPARTMENT OF PLANT PRODUCTION AND SOIL SCIENCEFACULTY OF NATURAL AND AGRICULTURAL SCIENCES
UNIVERSITY OF PRETORIA
Acknowledgements
Abstract
Page
(iv)
(v)
CHAPTER 1
INTRODUCTION
CHAPTER 2
LITERATURE REVIEW
2.1 HYDROPONIC VEGETABLE PRODUCTION
2.1.1 Definition 4
2.1.2 Closed and open hydroponic systems 5
2.1.3 Components of a hydroponic systems 5
2.1.4 Liquid hydroponic systems 7
2.1.5 Aggregate hydroponic systems 8
2.1.6 Nutrient solution 9
2.1.7 Nutritional disorders 12
2.1.8 Disease and insect control in hydroponic systems 12
2.2 TOMATO PRODUCTION UNDER PROTECTION
2.2.1 Morphology and development
2.2.2 Environmental responses
2.2.3 Cultivation practices
2.2.4 Physiological disorders
2.2.5 Diseases
2.2.6 Pests
CHAPTER 3
EFFECT OF SHADING ON TOMATO PRODUCTION
3.1 Introduction
3.2 Materials and methods
3.3 Results and discussion
CHAPTER 4
ADAPTING A VERTICAL HYDROPONIC SYSTEM FOR
LETTUCE PRODUCTION TO SMALL SCALE FARMING
SITUATIONS
4.1 Introduction
4.2 Materials and methods
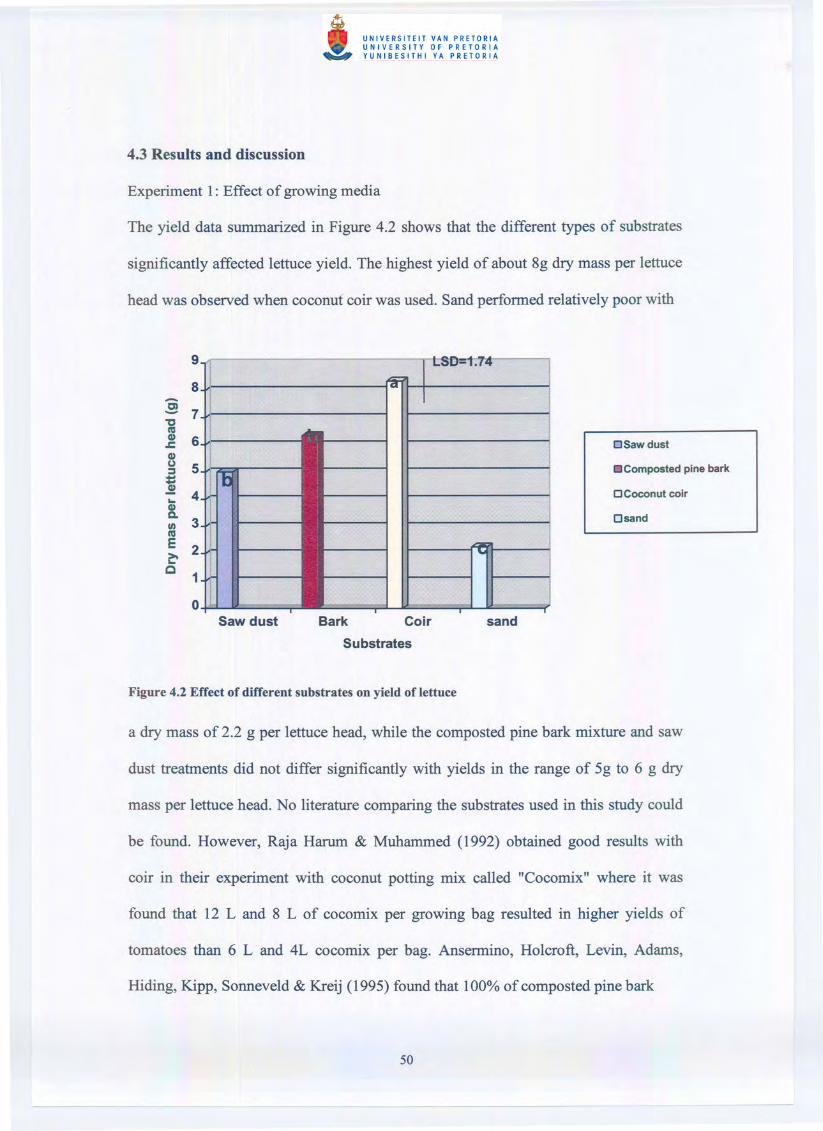
4.3 Results and discussion
4.4 Implication of the study to small scale farmers
CHAPTERS
SUMMARY
LIST OF REFERENCES
APPENDIX TABLES

Prof. P.S. Hammes, my supervisor, who tirelessly read my thesis draft and made
valuable suggestions. I also appreciate his guidance, advice and support, which all
enabled me to complete the study.
Dr. P. Soundy, my co-supervIsor, for his contribution on the preparation of the
manuscript.
Mr. Les Hutton, from Feed The People project for supplying materials for the
experiments.
To my family and friends for the support and motivation they gave me throughout the
study. Finally, I would like to thank the All Mighty God for giving me strength and
wisdom to do the work.
THE PRODUCTION OF VEGETABLE CROPS UNDER PROTECTION FORSMALL-SCALE FARMING SITUATIONS
ByD.C. Mashego
Supervisor: Prof. P.S. HammesCo-supervisor: Dr P. Soundy
Department: Plant Production and Soil ScienceDegree: M Inst Agrar: Plant Production (Agronomy)
Experiments were conducted with tomato under shade netting and with lettuce in a
vertical hydroponic system at the Hatfield Experimental Farm, University of Pretoria.
The objectives of the study were:
1. To evaluate the effect of different types of shade netting on tomato production
2. To develop a vertical hydroponic system for lettuce production which would be
suitable for use by small-scale farmers.
In the tomato trial the highest number of fruit per plant (47) was produced under 12%
white shade and 40% black shade nets, and the lowest fruit number (35) was produced
under 30% black net. The highest yield of 6.2 kg per plant was obtained under the 18%
white net while 30% black net produced the lowest yield of 3.9 kg per plant.
The best yield of lettuce grown in plastic tubes with eight vertically arranged plant
positions were obtained with a continuous high flow rate of the nutrient solution.
However, a simplified manual system where the nutrient solution was delivered by
gravity from a small reservoir tank resulted in comparable yields.
CHAPTERl
INTRODUCTION
A significant problem facing world agriculture is the variation in crop yields from
year to year due to variation in environmental stresses like drought, flooding, high
wind velocities and high or low temperatures. Damage caused by stresses can also
result in physiological disorders in crop plants. Tipburn in lettuce is caused by high
temperature (Sherf & Macnab, 1986) among other factors. Catface in tomatoes is
caused by poor pollination resulting from low temperatures (Kalloo, 1986). Growing
crops under protection can contribute to overcome these problems in order to get high
yields of good quality. Protected cultivation involves more sophisticated growing
techniques than unprotected cultivation in the field. It implies greater financial cost
for the grower in the construction and management of the protective structures.
Historically, this began by the production of seedlings in protective hotbeds for setting
into the fields when the last threat of frost had passed. In recent decades this concept
has been developed to the extent of supplying the optimum aerial and root
environment to optimize plant growth. Factors which can be controlled include
temperature, radiation, composition of the atmosphere (C02 concentration), water
supply and plant nutrition.
Protective covenngs vary from shade netting and simple film plastics (passive
protected cultivation) to structures with glass or rigid sheet plastic and equipped with
sophisticated environmental controls (active protected cultivation) (Kozai, 1988).
Passive protected cultivation refers to structures where environmental control
equipment is absent or simple in order to minimize the initial cost and running costs.
The environment is naturally controlled in a passive way by the physical properties of
the structural covering materials. Structures are typically designed to make maximum
use of climatic resources like solar energy and temperature, and minimizing the use of
artificial energy like electricity.
Active protected cultivation refers to systems where the environment is more actively
managed. A range of sophisticated systems of environmental control are available,
utilizing measures like forced ventilation, evaporative or mechanical cooling, heating
by means of warm water circulation or electric heating, carbon dioxide enrichment
and artificial lightning. Automated computerized environmental control systems are
available. Disadvantages are the cost of such systems, complicated management and
the risk of losses when the system malfunctions (Kozai, 1988).
Two local companies, Alnet South Africa and Knittex produce a range of netting
materials for agricultural applications. Available shade densities range from 10% to
85% in white, black and green colors. At present little is known about the suitability
of the different types of netting for vegetable production.
Apart from controlling the aerial environment, the rooting environment can also be
controlled to improve growth of vegetable crops. One way of controlling the root
environment is with hydroponic systems, which is the technology of growing plants
without soil. Plants are grown in nutrient solution, with or without the use of artificial
growing media to provide mechanical support to the plants. In recent years vertical
hydroponic systems, where the plants are grown in vertical layers, are receiving more
attention. A potential advantage is that much higher yields per unit area of growing
space are possible.
The possibility of obtaining high yields and good quality from various high value
crops on a relatively small area offers opportunities to small-scale farmers. Adapting
protected cultivation and hydroponic production system to suit the requirements of
small-scale farmers is essential.
The objectives of the study were:
1. To evaluate the effect of different types of shade netting on tomato production.
2. To develop a vertical hydroponic system for lettuce production which would be
suitable for use by small-scale farmers.
CHAPTER 2
LITERA TURE REVIEW
2.1 HYDROPONIC VEGETABLE PRODUCTION
2.1.1 Definition
Hydroponics refers to the technology of growing plants in a nutrient solution with or
without the use of a substrate (e.g. gravel, sand, vermiculite, rockwool, peatmoss or
sawdust) to provide mechanical support to the plants (Jensen & Collins, 1985; Jensen,
1997). Liquid hydroponic systems have no supporting medium for the plant roots,
while aggregate hydroponic systems have solid growing media to support the plants.
In most cases hydroponic systems are enclosed inside greenhouses or shade nets in
order to provide some temperature control, to reduce evaporative water loss, to better
control diseases and pests and to protect the crops against the elements of weather
such as wind and rain.
A major advantage of hydroponics as compared to growth of plants in soil is the
isolation of crops from the soil, which often has problems associated with diseases,
salinity or poor structure and drainage. Costly and time consuming soil preparation is
unnecessary in hydroponic systems and a rapid turnover of crops is readily achieved
as replanting can be done within a day or two after harvesting. The principal
disadvantages of hydroponics are the cost of capital and energy inputs relative to
conventional open-field production. A high degree of competence in plant science and
engineering skills is also required for successful operation of the system. Because of
its significantly higher costs, successful application of hydroponic technology is
limited to crops of high economic value (Jensen & Collins, 1985).
2.1.2 Closed and open hydroponic systems
All hydroponic systems are categorized with respect to how the nutrient solution is
used, as either "closed" where the nutrient solution is recirculated, or "open" where
the nutrient solution is not recirculated. A common practice with a closed system is to
use nutrient solution for one or two weeks before replacing it. Usually additional
fertilizers are added during this period to ensure that sufficient nutrients are available
to the plants. The recirculated nutrient solution is continuously changing in nutrient
composition due to plant uptake and by the evapotranspiration of water from the
solution (Graves, 1985). The successful commercial application of closed hydroponic
systems is more dependent on good knowledge of plant needs for water and nutrients
than open systems. Nutrients can built up to excessive levels which are toxic to plants
or be depleted to extremely low levels if not supplied at concentrations analogous to
plant needs.
In an open hydroponic system plants are supplied with fresh nutrient solution through
the growing media at each irrigation. The fresh nutrient solution may be pumped from
the reservoir tank or may be provided from nutrient concentrates which are diluted
through a fertilizer proportioner. Nutrient management problems can be considerably
reduced and the potential for nutrient deficiency may also be lessened with the use of
an open system (Jensen & Collins, 1985).
2.1.3 Components of a hydroponics system
A typical layout of a hydroponic system is a series of troughs in which the crop is
grown, a catchment tank containing the nutrient solution, circulation pumps; a flow
pipe delivering the nutrient solution to the upper part of the growing trough and the
return pipe collecting the solution for return to the catchment tank (Cooper, 1979).
The catchment tank being the lowest point in the system is typically sited below
ground level and is covered to exclude light thus preventing algae growth. Care
should be taken to exclude contamination from the adjacent soil which can introduce
soil borne diseases into the circulating water. The size of the tank will depend on the
size of the system. However, larger tanks are more advantageous particularly in the
warmer climates (Cooper, 1979 and Burrage, 1992). The catchment tank is preferably
of rigid material such as PVC (polyvinyl chloride), fiberglass or concrete sealed with
non-phytotoxic resins.
The c:irculation system is usually electrically driven with stainless steel or non-
phytotoxic plastic impellers capable of withstanding slightly corrosive nutrient
solutions. Two pumps are normally provided, should one fail the other is switched on
automatically or manually. The pumps may be mounted above the catchment tank or
submerged in it (Jensen & Collins, 1985).
Various forms of troughs or gullies made from polyethylene and other rigid structures
are available. Aluminium troughs have been used in more automated systems
(Cooper, 1979). The size and the shape of the troughs are dictated by labour
efficiency rather than biological and engineering constraints (Jensen & Collins, 1985).
Vine crops such as tomatoes usually are grown in troughs wide enough for ease in
pruning, training and harvesting. A close control
should be kept on the materials used throughout the system to ensure they are non-
phytotoxic. Polyethylene, rigid PVC and polypropylene appear to have little
phytotoxicity, whereas problems have been experienced with flexible PVC and butyl
rubber. Copper and galvanized zinc piping should not be used as both elements
accumulate in solution, rapidly reaching toxic levels (Burrage, 1992).
2.1.4 Liquid hydroponic systems
Liquid hydroponic systems are by their nature closed systems (Jensen & Collins,
1985). Plant roots are exposed to the nutrient solution without any substrate and the
nutrient solution is reused. Liquid hydroponic systems includes the nutrient film
technque (NFT) and aeroponics (Root mist technique).
The nutrient film technique was developed during the late 1960s by Dr Allan Cooper
at the Glasshouse Crop Research Institute, England (Cooper, 1979). The NFT system
appear to be the most rapidly evolving type of hydroponic system today (Jensen &
Collins, 1985). In a nutrient film technique system, a thin film of nutrient solution
flows through parallel series of sloping gullies or channels which contains the plant
roots (Cooper, 1979; Graves, 1983). The nutrient solution is pumped to the higher end
of th~: trough and flow by gravity past the plant roots to the catchment pipes. The
soluti·)n is monitored for replenishment of salts and water before it is recycled. A
practi;;al advantage of this system is that the nutrient solution can be easily heated
during winter months to obtain optimum temperature for root growth or be cooled
during hot summers in arid regions to avoid bolting and other undesirable plant
responses (Cooper, 1979; Jensen & Collins, 1985). However, if the flow of the
nutrient solution stops the roots will dry up and become stressed quickly. An
additbnal problem is that the growing channels can get blocked by the roots of
vigoft)us growing plants.
In ae:·oponics the plants are suspended with the roots enclosed in a spraying box
(ScoLer & Burger, 1989). The box is sealed so that the plant roots are in darkness to
inhibit algae growth. Misting systems are used to spray the roots periodically. The
misting system is normally turned on for only a few seconds every two to three
minutes which is sufficient to keep the plant roots moist and the nutrient solution
aeratc:d (Jensen & Collins, 1985).
2.1.5 Aggregate hydroponic systems
In a!:gregate hydroponic systems a solid inert growmg medium (sand, gravel,
rockwool, peatmoss, sawdust, or pine bark) is used to provide support to the plants
(Jens'~n & Collins, 1985; Olympios, 1992; Schwartz, 1995; Hardgrave & Harriman,
1995:1. As in liquid systems, the nutrient solution is delivered directly to the plant
roots Aggregate systems may be closed or open depending on whether the surplus
nutriont solution is recovered and re-used. Aggregate hydroponic systems include
trough or trench culture and bag culture.
Trou:~h culture systems involve relatively narrow growing beds, either as above
grad(:s troughs (supported by stands) or sub grade troughs (constructed on a
greer house floor). Concrete is usually used as a construction material for permanent
trough installation. Fiberglass and PVC-film can also be used (Jensen & Collins,
1985).
Container culture is similar to trough culture except that the growing media is placed
in container-like plastic bags which are placed on the greenhouse floor, thus avoiding
the cost of constructing troughs or trenches and complex drainage systems. Drip
application of the nutrient mixture is recommended and the nutrient solution is not
recycled, thus reducing nutrient solution management problems. Large plants growing
in high light and high temperature conditions will require up to two liters of nutrient
solution per day (Jensen & Collins, 1985). In Europe, where controlled environment
agriculture is used more widely, container culture is replacing trough culture because
of its ease in operation and in moving of material in and out of the greenhouse (Jensen
& Collins, 1985). The containers can be used for at least two years and are much
easier and less costly to steam sterilize than troughs.
All the nutrient elements required for plant growth have to be present in the
circulating water of a hydroponic system. Some of the elements may be present in the
water supply such as sodium and chlorine but not necessarily in the right proportions.
The nutrient elements will have to be added to the circulating water, namely nitrogen
(N), phosphorus (P), potassium (K), calcium (Ca), magnesium (Mg), iron (Fe),
manganese (Mn), boron (B), copper (Cu), molybdenum (Mo) and zinc (Zn). These
elements must be maintained at appropriate concentrations since too little will result
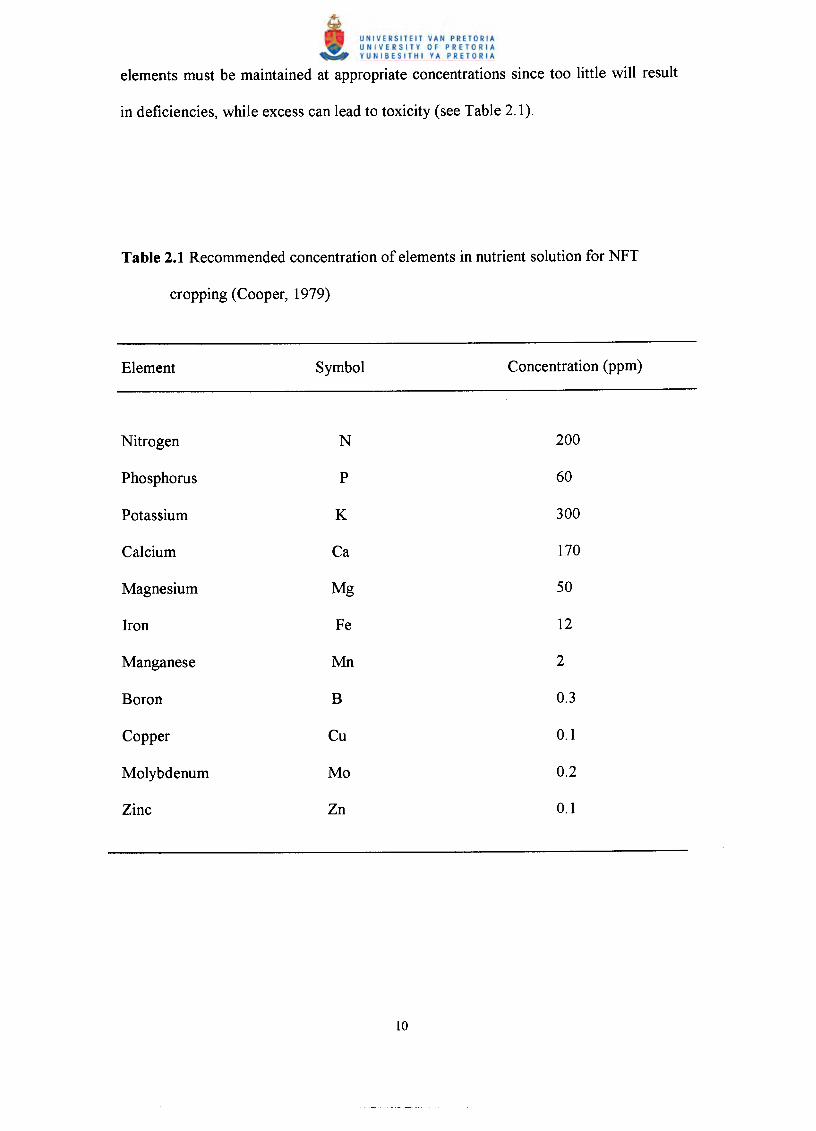
in deficiencies, while excess can lead to toxicity (see Table 2.1).
Table 2.1 Recommended concentration of elements in nutrient solution for NFT
cropping (Cooper, 1979)
Nitrogen N 200
Phosphorus P 60
Potassium K 300
Calcium Ca 170
Magnesium Mg 50
Iron Fe 12
Manganese Mn 2
Boron B 0.3
Copper Cu 0.1
Molybdenum Mo 0.2
Zinc Zn 0.1
Closed hydroponic systems such as the nutrient film technique are economical in the
use of nutrients but require frequent monitoring and adjustment of the nutrient
solution. Electrical conductivity is a convenient measure of the total salt
concentration, but it provides no indication of the concentration of the major elements
and is virtually unaffected by the quantity of trace elements present in the solution
(Jensen & Collins, 1985). Thus, periodic chemical analyses are required, usually
every 2-3 weeks for major elements and every 3-4 weeks for minor elements (Graves,
1983). It is essential that the relative concentration of nutrients in the nutrient solution
approximate crop uptake ratio, otherwise some nutrients accumulate while others are
depleted. Additions to the solution may be required to maintain a proper balance of
nutrient elements. Nutrient solution pH should be maintained between 5.5 and 6.5
because it is within this range that plants can absorb most of the nutrient elements.
This ensures that phosphates remain in the more soluble form and that the iron
chelate, Fe EDTA remains associated and is therefore less liable to precipitation
(Graves & Hurd, 1983)
As the nutrient solution is not recovered and recycled in open systems, it does not
require monitoring and adjustments, once mixed, it is used until depleted. Though the
nutrient solution per se does not require monitoring in open systems, the growing
media may, particularly if the irrigation water is relatively saline or if the hydroponics
facility is located in a warm, high sunlight region. To avoid salt accumulation in the
growing media, enough irrigation water must be used to allow some drainage from the
planting beds. This drainage should be collected and tested periodically for total
dissolved salts.

2.1.7 Nutritional disorders
Nutritional disorders in hydroponics do not differ in cause and effect from such
disorders in field agriculture. Nutritional disorders are more likely to occur in closed
hydroponic systems than in open systems because nutrients may build up to toxic
levels or be depleted if not monitored. The most common nutritional disorders in
hydroponic systems are caused by too much ammonium and zinc and too little
potassium and calcium. High levels of ammonium, which causes various
physiological disorders in tomatoes, can be avoided by providing no more than 10%
of the required nitrogen in the ammonium form. It is best to completely avoid
ammonium in nutrient solutions. Low levels of potassium (less than 100 ppm in the
nutrient solution) can affect tomato acidity and reduce the percentage of high quality
fruits (Winsor & Masey, 1978). Low levels of calcium induces blossom end rot in
tomatoes (Nakuya & Tayeko, 1990; Nukaya, Goto, Jang, Kano & Ohkawa, 1995;
Paiva, Sampaio & Martinez 1998) and tipburn on lettuce (Sherf & Macnab, 1986).
Zinc toxicity is caused by the dissolution of the elements from the galvanized pipes in
the irrigation system and it can be avoided by using plastic or other materials suitable
for agriculture. Nutrient related disorders of crop plants can be avoided by
maintaining careful control of the composition of the nutrient solution, particularly in
closed systems (Graves, 1983).
2.1.8 Disease and insect control in hydroponic systems
One advantage of hydroponic growing systems is the avoidance of soil borne
pathogens, especially fungi that cause diseases. The introduction of pathogens and
insects pests happens when people are moving in and out of the greenhouse or
contamination may be through dust on the uncovered systems (Paulitz, 1997).
Innoculum may also be introduced through infected seed or propagation material. Peat
has been shown to contain pathogens (Runia, 1994 and Paulitz, 1997). Pest
populations can increase at an alarming rate in controlled environment installations
because of lack of natural environmental checks. Root diseases in closed hydroponic
systems can spread quickly affecting all plants. The use of ultra violet radiation to
control bacterial plant pathogens in the nutrient solution is used in the Netherlands
(Runia, 1994) and in England (Jensen & Collins, 1985).
Tomato (Lycopersicon esculentum) belongs to the Solanaceae family. Tomato is a
short-lived perennial grown as an annual crop. Growth can either be determinate or
indet{rminate. Tomato is a warm season crop but it can be produced in cold climates
under protection. The plant requires 3 to 4 months from time of seeding to produce
the first ripe fruit (Kalloo, 1986).
2.2.1 Morphology and development
2.2.1.1 The seed
Seed :>fthe genus Lycopersicon are oval in shape and flattened. Seed size may vary
from J to 5 mm in length. The seed consists of the embryo, endosperm and testa. The
embryo consists of the radicle, hypocotyl and two cotyledons. The endosperm
provides nutrition for the initial growth of the embryo, while the testa or the seed coat
enclo:les the embryo and the endosperm. The characteristics of the seed influence
germi nation performance. More rapid germination has been observed with smaller
seed, and this is thought to be due to a reduced endosperm thickness (Whittington,
Child I, Hartridge & How, 1965; Mobayen, 1980; Pickens, Steward & Klapwijk,
1986). Age of tomato seed has been shown to be oflittle importance to germination as
long cs the seed are stored in an air-tight container. Calvert (1973) reported over 90 %
germination with ten-year-old seed.
2.2. LZ The root system
Tomatoes usually have a fairly well defined taproot but there is also abundance of
lateral roots of a fibrous nature. The roots system may, however, be modified as a
result of cultural operations; e.g. root damage during transplanting can give rise to a
greater density of fibrous roots often without a taproot (Calvert, 1973; Maree, 1993).
The plant forms adventitious roots on the stem if favourable conditions are provided.
A layor of moist peat or compost at the stem base will encourage new roots to form at
this point.
2.2. LI The stem
The yl)Ung stem is soft, hairy and become hard, woody and copiously branched when
matuN. It is erect to semi-erect. The plant can be classified into determinate and
indete rminate types. With the determinate types, vegetative growth stops with the
commencement of the reproductive stage. The plants are erect and bushy with
restric ted flowering and fruiting periods. In indeterminate types the main stem grows
indefinitely. Vegetative growth continues together with reproductive development,
and such cultivars are ideal for long season cropping. The stem is typically about 4 cm
in diameter at the base and is covered with hairs. At the tip of the main stem is the
apical meristem, a region of active cell division where new leaves and flower parts are
initiated (Calvert, 1973).
2.2.1.4 The flower
Flow<:rs of the Lycopersicon species are bright yellow in color. The calyx consists of
the sepal leaves and the corolla is made up of five segments. The style is shorter than
the pollen tube and the stigma is thus situated below the anthers ensuring that self-
pollination can take place easily. Under conditions of poor light (during winter) the
style may lengthen and consequently be situated above the anthers. In this situation
pollination take place with some difficulty and only about 12% of the flowers are
fertili !:edwhile up to 60% fertilization may be expected in the case of flowers with the
normal short styles (Calvert, 1973; Kalloo, 1986). Under greenhouse conditions
pollination can be improved with the aid of bumblebee (Papadopoulos & Khosla,
1995) or by mechanically shaking of the flower trusses.
2.2.2 Environmental responses
2.2.2.1 Temperature
GermInation, plant growth, flowering, fruit set, photosynthesis and yield are all
influenced by temperature. The optimum temperature for germination ranges from
18°C to 26 °c. Temperatures above 34°C during the daytime, and above 40 °c for
longe" than four consecutive hours, causes flower abortion. At low temperatures there
is slow or reduced germination. A difference of 5 °c to 8 °c between day and night
temp€:rature improves germination, growth and development, flowering and yield
(Voicm, Lacutus & Tanasescu, 1995). There is a marked influence of temperature on
the ir .itiation of flowers. The number of flowers per inflorescence and the total
numb ~r of flowers per plant are the major determinants of the number of fruit, and
thus cfyield. Favourable temperature for flower initiation is between 20°C and 25 DC.
Two '~eeks after cotyledon expansion, when initiation of the first inflorescence takes
place, is the most sensitive period. Exposure of seedlings to low temperatures (10 to 12
DC) during this period accelerates the formation of flowers. Fruit set in tomato is very
much influenced by temperature. The tomato plant has a long flowering and fruiting
durati::>oand during this period maintenance of favourable temperatures (21 to 24°C)
is imJlortant in order to obtain proper and abundant fruit set. At high temperatures
fruit set is impaired. Various experiments have proved that temperatures above 32°C
lead t" the reduction in fruit set. Pollen production and viability are reduced at high
temperatures (Kalloo, 1986). Inability of the pollen to reach the stigma surface, poor
pollen tube growth and blossom drop is associated with high temperatures. During hot
dry wl~ather abnormal projection or elongation of the style is a common feature.
2.2.2.:~ Light and daylength
Light Jrovides the energy essential for plant growth. The accumulation of plant matter
is the result of the process of photosynthesis which takes place only when the
electwmagnetic radiation within the range of 400 to 700 nm is absorbed by
chlorophyll in the leaves. The essential feature of the process is the chemical fixation
of the energy by the conversion of CO2 obtained from the air and water from the soil
into carbohydrates such as sugar. Generally, the rate of photosynthesis is related to the
intens ty of the radiation. In very poor light there may be no accumulation of dry
matter because only enough carbohydrates will be synthesized to allow respiration to
continue and to keep the plant alive. This light level is known as the compensation
point. At a higher level of light intensity plant matter will accumulate and the rate of
photo:lynthesis will also increase until that intensity is reached where photosynthesis
no lorger increases because other factors, such as C02 concentration is limiting. This
is kno wn as the saturation point. Another factor is the duration of the light period, also
refern:d to as the daylength or the photoperiod. For many plant species photoperiod
affect: I the onset of flowering. However, tomato is daylength insensitive or
photoperiodically day neutral in its flowering habit (Calvert, 1973).
2.2.2.:1 Carbon dioxide
Carbon dioxide is often a limiting factor for greenhouse tomato production,
particularly in winter due to its limited availability in unventilated greenhouses.
Increase in tomato yield by CO2 enrichment is due to a number of effects of elevated
CO2 which occur in both the vegetative and the reproductive stage of the plant growth.
The beneficial effects of CO2 enrichment on plant growth are mainly attributed to
increased photosynthetic activity (Slack, 1986). The rate of photosynthesis is directly
related to the amount of CO2 available provided light intensity and water are not
limitir .g. Young tomato plants are more responsive to C02 enrichment in the
greenhouse than older plants (Wittwer & Honma, 1969), and it is, important that
enrichment should be started at an early stage and continued throughout the growing
period. According to Morgan (1971) C02 enrichment advances the dates offirst
anthenis and promotes early cropping. Growth rates can be increased by up to 50 %,
and flowering and fruiting accelerated by a week or more. Smith (1966) reported a
diffenmce of nine days in earliness of anthesis on plants enriched with CO2 as
compared to non-enriched plants.
2.2.3 I:ultivation practices
2.2.3. l Production and treatment of seedlings
Treat ment of the seed with fungicides before sowing is essential. Seed can be treated
with thiram prior to sowing (Maree, 1993). The seedlings can be grown in seedling
trays. For better germination, seedling trays should be provided with shade. Seedlings
shoulc. be thinned out to reduce competition and to remove weak or diseased plants at
the appearance of the first true leaves. Before transplanting, hardening of the
seedlings is essential as it helps to establish the plants into the field (Calvert, 1973).
Maree (1993) also found that hardening of the seedlings results in bigger seed leaves,
thick ~,temand increased flowers in the first and second trusses. During transplanting
care should be taken to avoid damaging the plants, as such damage will allow entry of
patho~;ens into the plant.
2.2.3.:: Planting methods and training systems
Accor1iing to Resh (1993) tomato seedlings should be transplanted into their
perma lent positions when they have 3 to 4 true leaves and their roots have penetrated
the growing cubes in the seedling trays. Only strong healthy plants should be
transplanted. The normal planting arrangement for greenhouse tomatoes is to use a
double row system (Van de Voren, Welles & Hayman, 1986; Maree, 1993).
Acconling to Maree (1993) double rows should be spaced 60 cm apart and with a
spacin g of 40 cm in the rows. The width of the path between the double rows could
vary fiom 1.3 m to 1.6 m. Saglam & Yazgan (1995) found 0.75 m by 0,35 m spacing
yieldell more fruit per plant and heavier individual fruit mass than spacing at 0.75 m
by 0.2 m or 0.75 m by 0.15 m.
Greer house tomatoes are trained vertically retaining a single main stem. A popular
trainin g system for tomatoes grown in protected structures is by using a string
susper.ded from an overhead wire and tied to the base of the plants (Maree, 1993). All
side sltoots growing on the main stem should be removed at an early stage. Senesced
leaves at the bottom of the plant should be removed for better air circulation around
the pl~.nt and to limit infestation by fungal rot (Botrytis) (Resh, 1993).
2.2.3.3 Water requirements
Plant growth and development and quality of the fruit is very much influenced by the
soil moisture content. The water requirements depend upon the rate of transpiration
which is influenced by atmospheric demand. To maximize crop productivity and
optimi ze water use it is important to irrigate efficiently to meet the evapotranspiration
at all -:imes. Unlimited supply of water is not always desirable; in the cultivation of
tomatoes it is important to restrict water supply and hence limit excessive vegetative
growth. Water restriction reduces the risk of abortion of the fruit trusses and improves
qualit~r of the fruit (Cooper & Hurd, 1968). According to Maree (1993) drip irrigation
is suitable in the sense that it maximizes the efficiency of water use and the water is

applie1i slowly and uniformly to the soil adjacent to the plant. It economizes watering
by red .Icing water loss through runoff and evaporation.
2.2.3.L• Nutrition
When tomatoes are planted in soil, the soil should be tested for pH and electrical
condu ~tivity before planting starts. Should the pH be low, it can be improved by
applyitlg lime. Tomato requires a pH of 6.0. Should the conductivity be high, for
instan,;e 300 mS/cm the soil should be loosened and drenched to remove excess salts
before planting. Water to be used for irrigation should be tested to ensure that it has a
suitab e pH and that there is no excess of unwanted salts. The next step according to
Maree (1993) would be to pre- fertilize to ensure that the soil has a pH of 6.0 (Kef),
a P COtltentof 50 to 80 ppm and 100 to 120 ppm K.
Fertili ~er program for greenhouse tomatoes according to Maree (1993):
Week 1-5 Solution A
3 1. 1 kg potassium nitrate per ha per week
14.9 kg magnesium sulfate per ha per week
Solution B
16.8 kg calcium nitrate per ha per week
Solution A
62.2 kg potassium nitrate per ha per week
29.8 kg magnesium sulfate per ha per week
Solution B
protection are mainly grown hydroponically and a wide range of substrates has been
succe~:sfully used. This ranges from inert material like rockwool, perlite, coconut coir
eleme lts that plants require for normal growth. Many Solanaceae crops prefer nitrate
(N03-' rather than ammonium (NH/) as a source of nitrogen and N03- is a good
Artific ial pollination is often necessary in order to produce fruit of good shape, size
and firmness. Poor pollination can result in disorders such as catface (Kalloo, 1986).
Pollination is done by a hand held air-blower or an electric vibrator or by
: 10(07b ?S~
bl Soe,~~2-1
mech, mically shaking of the flower trusses. Pollination can be improved with the aid
of bu:nblebees (Papadopoulos & Khosla, 1995). Abak, Sani, Paksoy, Kaftanoglu &
Yeninar (1995) and Asada & Ono (1997) also found an increase in yield on bumble-
bee pllllinated plants than where no bees were used. Number of fruit per unit area and
the nt:mber of seeds per fruit were also increased.
2.2.3.1) Hydroponic tomatoes
Hydrc ponic tomatoes are raised as transplants. About 3 to 4 weeks after germination,
when the seedlings have started to produce the second pair of leaves and when they
are ab :mt 60 to 75 cm in height, they are transplanted on to the hydroponics beds. The
spacirg should be at least 45 cm in row and between the rows (Harris, 1987). They
can b( planted on liquid hydroponic systems like the nutrient film technique (Cooper,
1979) or on an aggregate system where solid growing media like gravel, rockwool
and s, nd are used for plant support. Zekki, Gauthier & Gosselin (1996) found that
aggre! :ate hydroponic systems performs better than the nutrient film technique. Fresh
and dly mass of the aerial plant parts cultivated in nutrient film technique systems
were :~3and 35 % lower respectively compared to rockwool cultivated tomatoes. It
was a]so found that prolonged recycling of the nutrient solution in a closed system
reduc( d fresh mass and yield of tomatoes as compared to plants grown on nutrient
film t{;chnique with regular renewal of the nutrient solution.
2.2.3.~ Harvesting
Pickin ~ should be done at the correct stage. The correct stage depends on the purpose
for wh lch the fruits are to be used. The fruit ripening stages according to Kalloo

(1986) are green, mature green, turning pink, red pink and over-ripe. For
supern larkets the fruit should be picked when the bottom tip of the tomatoes have an
orang( -pink tint. The fruit will turn light red within two to three days. Greenhouse
tomat< ,es are mainly harvested by hand. Soon after picking, the fruit should be cooled
rapidl~' to 13 °C to increase the shelflife of the fruit by reducing the rate of respiration
and ot ler physiological processes which influence ripening.
2.2.4 Physiological disorders
In add ition to diseases caused by micro-organisms, there are certain disorders which
are ca Jsed by adverse weather conditions, nutrition disorders or other physiological
factor L Control of the disorders is essential for profitable production of tomatoes.
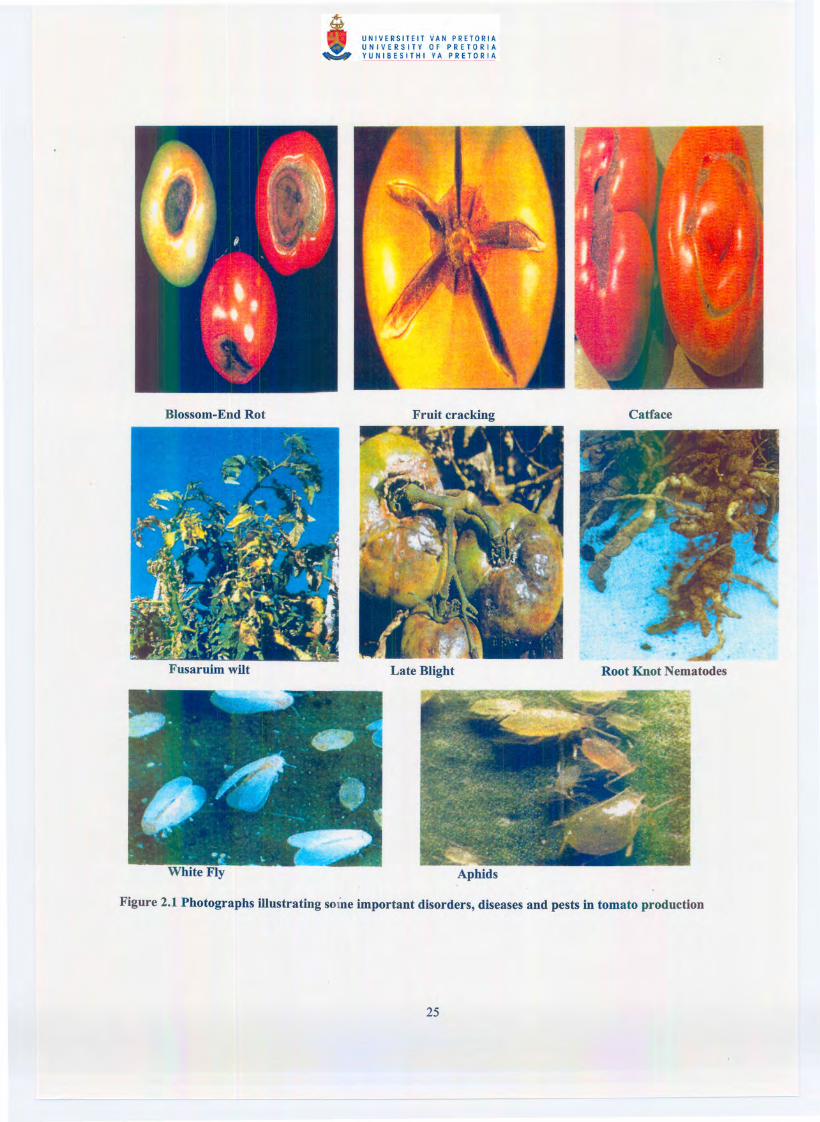
2.2.4. Blossom-end rot
Bloss( 1m-end rot is the most serious physiological disorder of tomato. It is common in
greenl Louse and field grown tomatoes. Initially a brown discoloration starts at the
blossc m-end portion of the fruit. Gradually, a black spot develops which can
encon lpass one half or more of the fruit. In the advanced stage the tissue shrinks and
the skn becomes dark-grey to black (Fig.2.1). Secondary infection of soft rot or other
micro ,ial diseases may occur. The affected fruit are totally unsuitable for human
consu nption. This disorder is caused by a localized deficiency of calcium in the fruit
(Paiv~, Martinez, Casali & Padilha, 1998). It was also found that the incidence of
bloss< m-end rot became higher with increasing NRt +-N concentration in the nutrient
solution (Nakuya & Tayeko, 1990; Nukaya et al., 1995). This is because NH/
compl ~tewith calcium for absorption and calcium uptake decreases with an increase
ofNF./ in the nutrient solution (Mengel & Kirkby, 1979). Any cultural practice that
conse] yes soil moisture and maintains a fairly uniform moisture supply aid in the
contre I of blossom-end rot. Spraying calcium salts solutions on the fruit and on the
leaves is effective in controlling blossom-end rot.
2.2.4.: ~Fruit cracking
Symp'oms of this disorder are cracks on the maturing fruit at any time from a few
days llefore pink color begins to the red ripe stage (Fig 2.1). Fruit of most varieties
will c ~ack when there is excessively high temperature and sudden changes in soil
moistllre supply to plants. When low soil moisture is followed by irrigation, the
sudde 1 increase in water content of the cells may create internal pressure enough to
crack the fruit. Cracking is also common during the rainy season when rain follows a
dry sp ell. A higher incidence of cracking was found in fruit grown under high relative
humid ity (Maroto, Bardizi, Lopez, Pascual & Alagarda, 1995). Prevention lies in
varieti II selection for maximum resistance, avoidance of high fruit temperature and
maintc:nance of uniform soil moisture conditions.
This disorder is characterized by a large scar at the blossom-end portion of the fruit.
Affect ed fruit have ridges and blotches and at the blossom-end the fruit is malformed.
This disorder is caused by low temperature, which causes faulty pollination and poor
fertili2ation (Kalloo, 1986). According to Naude, Ferreira, Van Den Berg & Bosch,
(1992: this disorder is common on the first fruit produced on the plant and also on
tomat( les which start to flower under low temperature conditions.
Aphids
Figure 2.1 Photographs illustrating some important disorders, diseases and pests in tomato production
Tomatl) is attacked by various fungal, bacterial and viral diseases. Almost all parts of
the pIa lt are affected by diseases, and on the basis of the part affected the diseases are
classifi ed as leaf, stem, fruit, root and post-harvest or storage diseases.
2.2.5.1 Fusarium wilt
This i~ the most important disease of tomato where intensive cropping is followed.
The di lease is common in warm humid climates and is a soil borne disease. A fungus,
Fusari ttm oxysporum F. lycopersici causes this disease. Fusarium wilt fungus survives
in tom 1to debris or in the soil as tough chlamydospores. It spreads from infected plant
materi 11,through irrigation water and also by infected seeds. Symptoms include bright
yellov. ing of older leaflets on the base of the plant and wilting. Wilted leaves turn
brown and dry but do not fall off Control of Fusarium wilt is mainly by using
resista lt cultivars. Almost all tomato cultivars in South Africa are resistant to
Fusarhm wilt (Naude, et al., 1992). Crop rotation also helps in controlling this
diseasl~.
2.2.5.:: Bacterial wilt
This c isease is caused by a bacterium, Ralstonia solanacearum. It attacks tomatoes
and 01her related crops such as potatoes, tobacco, peppers and weeds like Datura. It
also ,ttacks plants that are not related to tomato like groundnuts and bananas.
Bactel ial wilt can spread from one field to another if contaminated soil is transported
by me illS of implements, vehicles or even on shoes. It can also move
acros; a field through runoff water. The bacteria can survive for many years in the
soil. .rhey infect plants through the roots or stem, mainly through small wounds, like
those caused by nematodes or transplanting. After infection, the bacteria move to the
vascular system of the plant and the pith collapses. According to Naude eta!., (1992)
two s :rains of bacterial wilt occur in South Africa, namely Biovar2 and Biovar3. Both
strain s can attack tomato. Bacterial wilt resistance in South African tomato cultivars is
effective only against Biovar3. Symptoms include rapid wilting and death of the
plant~. There is no chemical registered for control of bacterial wilt.
2.2.5.3 Late Blight
Late· ,light disease is caused by the fungus Phytophthora infestans. This is probably
the m )st destructive disease of tomato and potato in the world. It spreads very quickly
and (an completely defoliate a tomato crop in less than a week after the first
symp·oms have been seen. The fungus spreads over long distances by means of air
borne spores. The disease is favoured by cool nights and misty weather, and spores
germi nate rapidly at temperatures of 5 °c to 21°C. Late blight attacks all above
groun d parts. Affected plants look as if they have been damaged by frost. Irregular,
green sh black or brown leaf spots develop, sometimes with a purple margin on the
upper surface of the leaf Lesions enlarge under cool, moist conditions destroying the
plant. Fruit symptoms include grey brown lesions which look like bruises which
cover; the whole fruit (Fig 2.1). Lesions become copper brown with a rough surface.
Late 1,light can be controlled effectively with fungicides like Mancozeb or Methalaxyl
ifappjed correctly (Krause, Nel & VanZyl, 1996).
2.2.5.<, Grey mould
Grey .nould is caused by the fungus Botrytis cinerea. It is a problem in greenhouse
tomatc les and occur where the plant population and humidity are high. Under
green) louse conditions, where light intensities are low and relative humidity reach 95
to 10(% during the night, Botrytis often affects all parts of the plant (Sherf & Macnab,
1986) The fungus produces spores on dead leaves and stalks which will infect healthy
plants Affected plants have light brown or grey lesions on stalks which turn black.
The fiuit shows irregular grey or pale green spots with pale margins, and grey moulds
devel<lp on the margins. Soft rotting may follow. Regulation of greenhouse
tempe rature and relative humidity is the most important and practical control
meast .res. Good control can be achieved by applying benomyl, chlorothalonil or other
products listed by Krause et aI., (1996).
2.2.6 Tomato pests
2.2.6.1 Nematodes
Nema todes are one of the most serious pests of tomato, causing severe yield loss
partie lliarly in sandy soil (Sherf & Macnab, 1986). The incidence largely depends on
factO!s like host variety and initial nematode population in the soil and temperature
condi lions. In vegetable growing areas, Meloidogyne javanica and M incognita
specil:S are the predominant ones. Their host range is very wide, as they attack almost
all th ~ plants grown in the world. Infection may start at the seedling stage and can
contillUe throughout the growing season. Stunting and yellowing of leaves take place
due t:) the formation of galls on the roots. A suitable crop rotation and fallowing
progr am can reduce the nematode population. Different chemicals for nematode
contrcl are listed by Krause et al., (1996). The use of resistant cultivars is the most
econo nic way of controlling nematodes.
2.2.6.:~Aphids
Aphid s attack the leaves and the stem. There are several species of aphids damaging
tomatl), among them Myzus persicae is the most prevalent one. The damage is caused
by dir ~ct as well as indirect methods. The nymphs and the adults attack the growing
shoot! and leaves thereby reducing plant vigour. Aphids spread virus diseases and
they aIso secrete a honeydew like substance which invites fungi to grow. In the case
of severe infestation the plants wilt and die. Aphids can be controlled effectively with
a number of insecticides (Krause et al., 1996).
2.2.6.1 White fly (Bemisia tabaci Gennadius)
White fly is a serious pest of tomatoes. It sucks the sap from the leaves and stem
causir g yellowing on the affected areas. Both nymphs and the adults are harmful and
can tr ansmit viral diseases. White fly is a problem particularly in autumn and mid-
summ er when temperatures are favourable. A strict spraying programme has to be
follov 'ed in order to control this pest. Regular spraying with methomyl is
reCOITmended (Maree, 1993).
CHAPTER 3
EFFECT OF SHADING ON TOMATO PRODUCTION
3.1 In troduction
Toma :oes are produced throughout the year in South Africa but production is often
affect' ~d by unfavourable climatic conditions. Tomato fruit produced under
unfavi mrable conditions are small and of poor quality (Sakyma, 1968). Kalloo (1986)
and Sakyma (1968) found that a higher incidence of physiological disorders were
found in fruit produced under low temperatures and these disorders were reduced
when plants were grown under shade. A significant reduction in the percentage of sun
scald ruit were found in plants grown under shade net while the highest percentage of
puffy and blotchy ripening of tomatoes were observed on plants grown under full
sunlight and under high density of shade (63%) during late summer season in Egypt
(EI-G zawy, Abdallah, Gomma & Mohammed, 1992). Shade net were also found to
impro ve the total fruit yield of tomato plants, shoot dry mass (Russo, 1993) and
chara( :teristics like fruit mass, length and diameter (EI-Gizawy et ai., 1992).
Green house production offers effective environmental control, but structures are
expen sive to build. An alternative to sophisticated greenhouses may be found in
inexpl msive shade net structures. Two local companies, Alnet South Africa and
Knitt( x produce a range of netting materials for agricultural application. Available
shade intensities range from 10% to 85% in white, black and green colors. Little
inforn lation is available about the suitability of the different types of netting for
vegetl.ble production.
The cbjective of this investigation was to evaluate the effect of different types of
shade netting on tomato production.
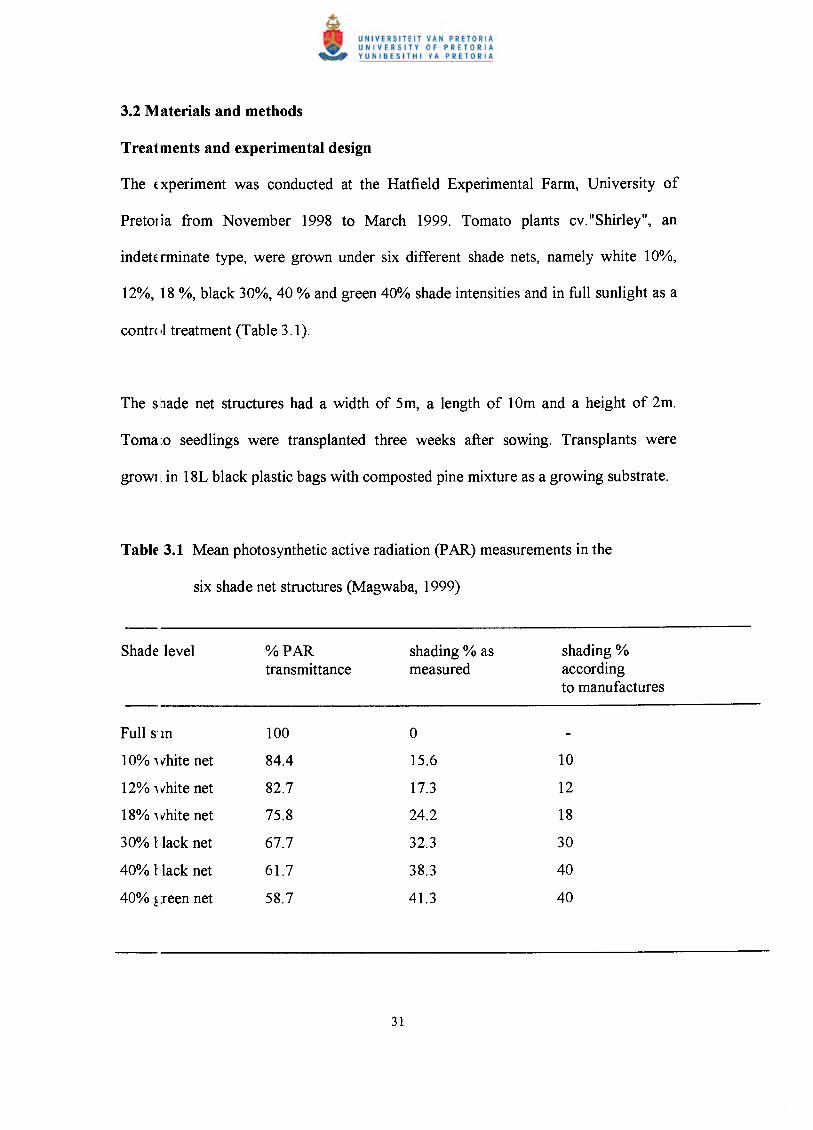
Shade level % PAR shading % as shading %transmittance measured according
to manufactures
Full s'm 100 0
10% ,vhite net 84.4 15.6 10
12% ,vhite net 82.7 17.3 12
18% ,vhite net 75.8 24.2 18
30% t'lack net 67.7 32.3 30
40% Hack net 61.7 38.3 40
40% !;reen net 58.7 41.3 40
FertilIzation and irrigation
Nutri( nts were mixed with irrigation water and were supplied through an open dripper
syster 1delivering two liters per hour twice a day. Fertilizer mixtures used were:
• H:rdro-gro (lOOOgper 1000L of water)
• H>rtichem calcium nitrate (640g per 1000L of water)
• H>rtichem potassium sulfate (l50g per 1000 L of water)
The c )ncentration and composition of the three fertilizer mixtures are given in Table
3.2
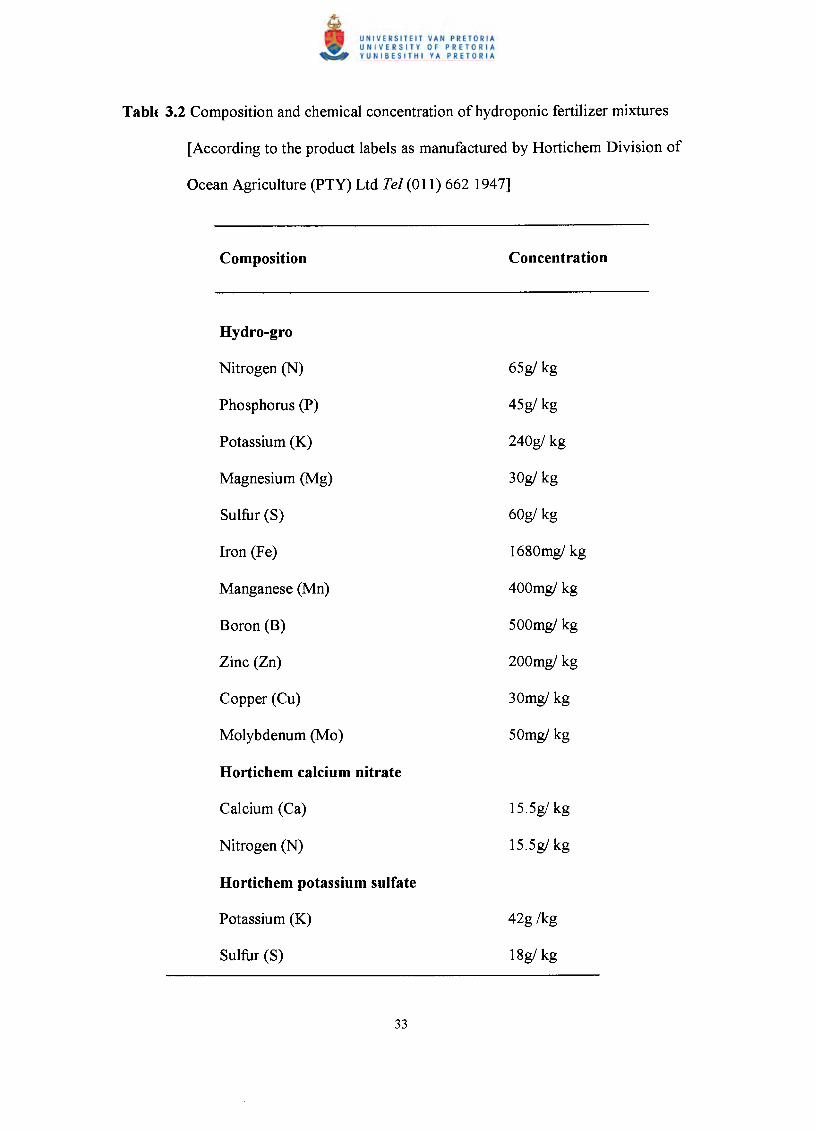
Tabh 3.2 Composition and chemical concentration of hydroponic fertilizer mixtures
[According to the product labels as manufactured by Hortichem Division of
Ocean Agriculture (PTY) Ltd Tel (011) 662 1947]
Hydro-gro
Nitrogen (N) 65g! kg
Phosphorus (P) 45g! kg
Potassium (K) 240g! kg
Magnesium (Mg) 30g! kg
Sulfur (S) 60g! kg
Iron (Fe) 1680mg! kg
Manganese (Mn) 400mg! kg
Boron (B) 500mg! kg
Zinc (Zn) 200mg! kg
Copper (Cu) 30mg! kg
Molybdenum (Mo) 50mg! kg
Hortichem calcium nitrate
Calcium (Ca) 15.5g/ kg
Nitrogen (N) 15.5g! kg
Hortichem potassium sulfate
Potassium (K) 42g /kg
Sulfur (S) 18g! kg
Fertili;;ers were mixed as follows:
• 501)L of water was added into a tank with 1000g ofHydro-gro and stirred until the
chI :mical dissolved.
• 251)L of water was added into the same tank and 640g of Hortchem calcium
nit 'ate was added.
• 25 )L of water and 150g of Hortchem potassium sulfate was added in the solution
anll the solution was stirred until all the chemicals were dissolved.
Cultu °al practices
The plants were staked with strings tied around the base of the stems. The other end of
the str ing was secured to a wire strung 2m above the growing containers. The plants
were :rained to single main stems. All developing shoots in the leafaxils were
removed at a young stage. Senesced leaves were removed to allow better air
circuli ,tion around the plants.
Measllrements and statistical analysis
The f( Illowing parameters were determined:
• Nllmber of fruit produced per plant
• In iividual fruit mass
• T<Ital mass of fruit produced per plant
The f uit were harvested weekly over a period of nine weeks with the first harvest
early .n January. The experiment was analyzed as a completely randomized design.
All d ita was analyzed with the aid of SAS (Statistical Analyses System), least
signifcant differences (LSD) were calculated at the 5 % level of significance.
3.3 Rc:sults and discussion
The ) ield data summarized In Table 3.3 shows that the type of shade netting
signifi cantly affected tomato yield component. The highest number of fruit per plant
(47) v ras produced under 12% white shade and 40% black shade nets, and the lowest
fiuit llumber (35) under the 30% black net. The highest yield of 6.2kg per plant
obtain ed under the 18% white net was significantly better than the yield from the 10%
white and 30% black nets. The mean fiuit mass obtained from most of the shade net
structllres was approximately 110g per fruit. However, under the 18% white net the
fiuit \fas much larger at 148g per fruit. No explanation can be offered for the poor
yield produced under the 30% black shade and 10% white shade nets. Russo (1993) in
an eXlleriment with 63% black polypropylene shade fabric and unshaded plants found
that sllading improved total fiuit yield of tomato plants established in June but failed
to im:)rove yield of plants established in May and July. EI-Gizawy et al., (1992)
recorced the highest fruit yield of tomato under 35% shading compared to 51% and
63% 5 hading intensities and un shaded plants during the late summer season in Egypt.
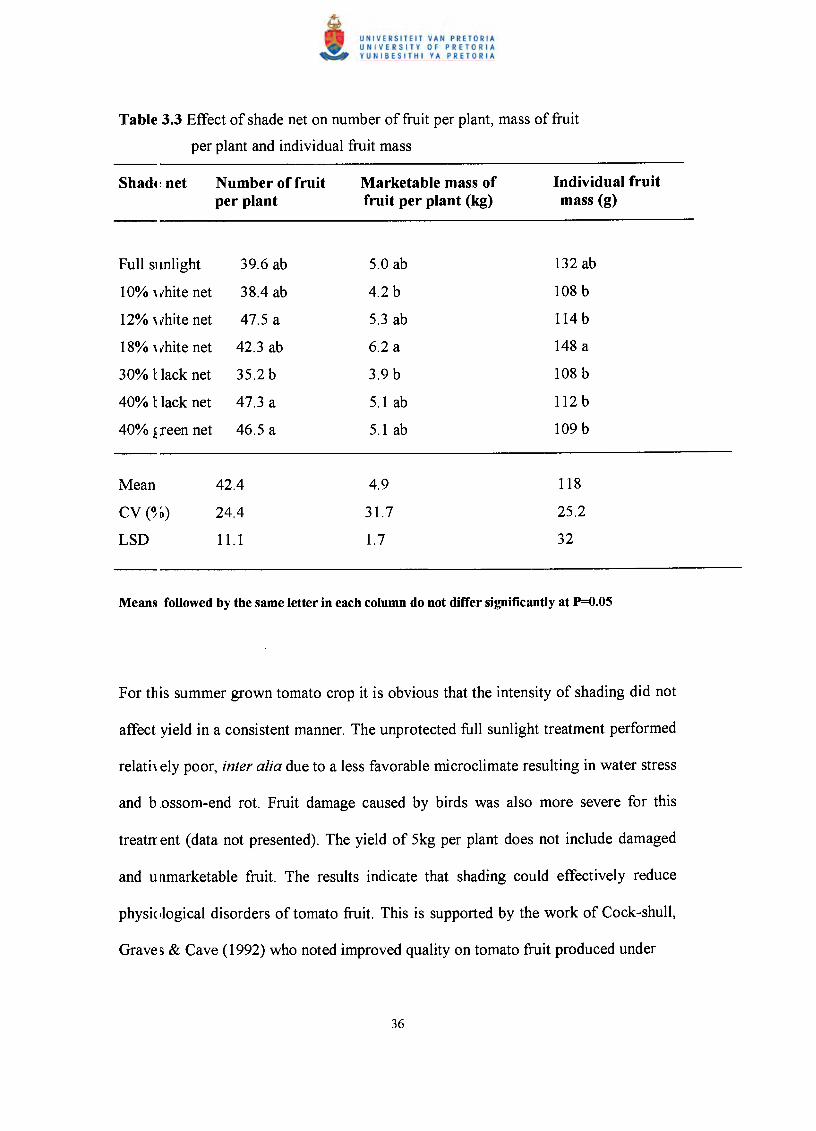
Table 3.3 Effect of shade net on number of fruit per plant, mass of fruit
per plant and individual fruit mass
Number of fruitper plant
Marketable mass offruit per plant (kg)
Individual fruitmass (g)
Full SI mlight 39.6 ab 5.0 ab 132 ab
10% \ vhite net 38.4 ab 4.2 b 108 b
12% \ vhite net 47.5 a 5.3 ab 114 b
18% \ vhite net 42.3 ab 6.2 a 148 a
30% t lack net 35.2 b 3.9 b 108 b
40% t lack net 47.3 a 5.1 ab 112 b
40% !reen net 46.5 a 5.1 ab 109 b
Mean 42.4 4.9 118
CV(%) 24.4 31.7 25.2
LSD 11.1 1.7 32
shade as compared to those grown unshaded. Shading was found to reduce sun scald
in torrato fruit, however, higher densities of shading (63%) increased the percentage
ofblo1chy ripening in tomato fruits (EI-Gizawy et al., 1992).
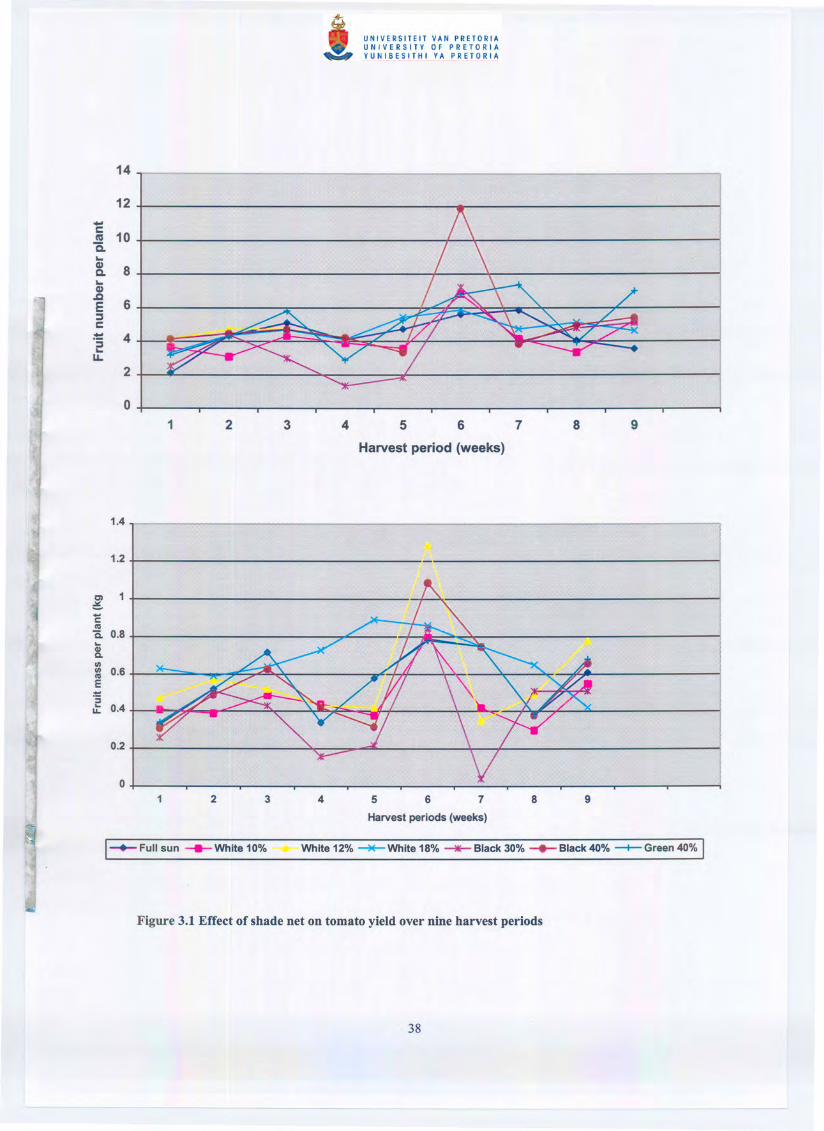
In Fig .lfe 3.1 yield data for the production season is presented. From the third harvest
onwar ~s there was a consistent trend of higher yields from the 18% white and lower
yields from the 30% black net structures. For the 18% white net, production peaked
betwe m harvest weeks 4 and 6, and declined after week 6. For many of the other
treatrrents, notably the 10 and 12% white nets and 30% black net there were a trend
of up and downward movement during all harvesting weeks and an increased yields
towarlis the end of the experiment (weeks 7, 8 and 9). The pronounced peak in the
yield I)f all the treatments except 18% white for harvest week 6 may be partly due to
warm:r temperatures during the preceding period. No explanation can be offered for
the re narkable consistence in the weekly yields obtained in the 18% white structure,
compl.red to larger but similar variation in the weekly yield obtained from the other
shadel I structures.
14
12-r:: 10lISQ.~CI) 8Q.
~CI)J:l
6E~r::~ 4~~LL
2
01 2 3 4 5 6 7 8 9
Harvest period (weeks)
1.4
1.2
Cl~CCllis. 0.8•..GlCoIIIIII 0.6CllE-':;•.. 0.4LL
0.2
0
CHAPTER 4
t\DAPTING A VERTICAL HYDROPONIC SYSTEM FOR LETTUCE
PRODUCTION TO SMALL SCALE FARMING SITUATIONS
4.1 lltroduction
4.1.1 Vertical hydroponic systems
Hydr )ponic culture is gaining importance for the production of protected vegetable
crop~ and ornamental plants and few greenhouse crops are still grown in soil
(Olympios, 1992). Due to the high capital cost per square meter of protective
envir )nment structures, vertical layer systems may be a viable option, especially for
crop~ with relatively small plants like strawberry and lettuce. A small, inexpensive
prote ~tive structure with a vertical hydroponic system may be a viable vegetable
prodt iction enterprise for small-scale growers, provided the technical operation can be
simpl ified. Various vertical systems are possible ranging from horizontal NFT troughs
stake i above each other to small containers arranged vertically. Relatively
inexp ensive containers made from PVC plastic tubes divided into a number of pockets
are c(Immercially available. Such tubes are typically suspended over a cable or beam,
provi ling up to eight planting positions on both sides (L. Hutton- Personal
communication, 1999)*.
4.1.2 ]Iydroponic lettuce production
Lettuc e (Lactuca sativa) belongs to the Compositae family. It probably originated in
Asia (Vamaguchi, 1983) and it was first used for its medicinal properties and as early
as 45C0 BC as food. Modern lettuce cultivars are grouped according to plant form and
predOlninant use. Crisp-head lettuce is the most popular in southern Africa. Heads are
firm, hard and the texture is brittle and crisp. Head size is usually large, about 150 mm
in dia neter, and often with a mass of more than 1 kg. Butter-head lettuce is small,
soft, n lore fragile and perishable than the crisp head type. The leaves are thick, loosely
folded and buttery in texture. Loose-leaflettuce form clusters of partially open leaves,
and dl) not form heads. Leaf color varies from light green to red. Cos lettuce has a
more lpright growth habit with a long head and narrow spatulate leaves. The heads
are se f-closing with leaves curling inwards at the tips. Leaves appear coarse but are
tender and damage easily (He my, 1984).
Lettu< e grows best at relatively cool temperatures and for this reason it is grown as a
wintel crop or a cool season crop. It is usually grown in areas in which the average
tempe ,atures are between 10°C and 20°C. However, it may be grown throughout the
year. femperatures higher than 21°C promotes seed stalk elongation, puffy heads,
bitten .ess, and an increased tendency towards internal disorders (Yamaguchi, 1983;
Kana2 n, 1992; Thomson, Langhans, Both & Albright, 1998).
Trans] )lants are raised from fresh, certified lettuce seed. Seed are sown in seedling
trays. Typically the seedling trays are filled with growing media like peat. Irrigation is
usuall { supplied three times a day in summer and once a day in winter. Water is
appliec. until it starts to drain from the bottom of the seedling trays. Fertilizers should
only b ~ applied through the irrigation water. Hardening is usually done in the last
week Jefore transplanting by reducing water and fertilizer applications. Lettuce
seedlir gs are ready for transplanting after four weeks in summer and five to six weeks
in wimer. Lettuce is planted at a spacing of25 cm between plants (Harris, 1987).
Nitrog ~n is the most important element in fertilization of lettuce. Nitrogen foliar
fertiliz er can be applied on the leaves to slow down the filling of the heads and to
increa: Ievegetative growth. The form in which nitrogen is applied to the plants is also
impOI1ant. Lettuce plants react better on nitrogen supplied in the form of nitrate
(N03-~ nitrogen than ammonium (NHt +) nitrogen (Sandy, Rozek & Myczkowski,
1995).
Leaf 1. :ttuce is harvested as soon as the leaves are large enough for consumption while
head 1~ttuce is harvested when the heads become hard but before the seedstalk begin
to dev ~lop. Harvesting is done in the morning. Lettuce is a highly perishable crop, and
it she uld be cooled immediately after harvest to about 1°C and held at this
tempe ~ature at high humidity of 95-97 % or it will loose its quality (Yamaguchi,
1983)
Lettuc e is less prone to pest and diseases than most of the greenhouse, fungicides and
pestic des registered for disease and insect control on lettuce in South Africa is listed
by NaJde, Van Der Berg & Thomson (1992) and Krause, Nel & Van Zyl, (1996).
The 0 )jectives of this study were:
1. T<I compare different substrates in a vertical hydroponic system.
2. T<I compare different nutrient solution application methods in order to develop a
siJnplified system applicable to small-scale situations.
3. T<. monitor changes in pH and electrical conductivity of the nutrient solution as
in luenced by the different application methods.
4. To determine the effect of plant position on the vertical tube on the yield of
le1tuce.
4.2 Materials and methods
Trials with hydroponically grown lettuce in a vertical system were carried out in a
glasslouse on the Hatfield Experimental Farm, University of Pretoria. In the first trial
differl mt substrates were compared while in the second trial different methods of
suppl: ring nutrient solution were evaluated. The vertical hydroponic system consisted
of nOll-transparent white plastic tubes with a series of vertical plant holding pockets
filled with appropriate substrate and supplied with nutrient solution. The plastic tubes
were l.7 m in length and 300 mm in diameter with sixteen pockets. Suspended over a
cable eight pockets spaced 200 mm apart were available on each side. Small drainage
openi 19S were made at the bottom of each growing pocket. These openings allowed
nutrie tlt solution to drain from one pocket to the next. Excess nutrient solution was
collee led for recycling in the closed system or drained to waste in the open system.
Nutrit :nt solution was delivered into the top pocket by means of a micro drip tube.

Trea1ments and experimental design
Expel iment 1: Effect of growing media
LettUi:e seedlings, cv. Great Lakes were transplanted on 25th January 1999 in four
differ mt substrates namely, sawdust, sand, coconut coir and composted pine bark.
Nutricmt solution was delivered into the top pocket by means of a micro drip tube
three times a day and the nutrient solution was applied until the bottom pocket started
to dra In. Excess nutrient solution was not recycled.
Fertil zer mixtures used were:
• HVdro-gro (1000g per 1000L of water)
• H)rtichem calcium nitrate (640g per 1000L of water)
• H)rtichem potassium sulfate (150g per 1000 L of water)
The C Dncentration and composition of the three fertilizer mixtures are given in Table
4.1
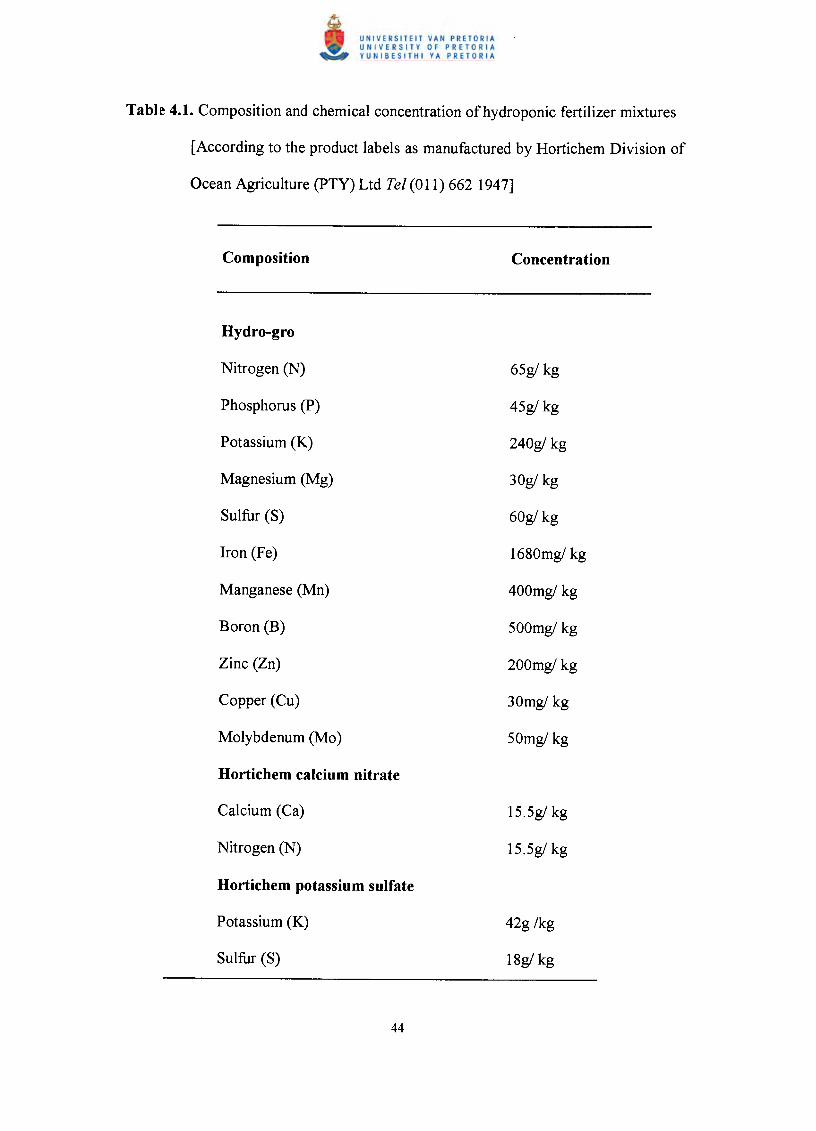
Table 4.1. Composition and chemical concentration of hydroponic fertilizer mixtures
[According to the product labels as manufactured by Hortichem Division of
Ocean Agriculture (PTY) Ltd Tel (011) 662 1947]
Hydro-gro
Nitrogen (N) 65g! kg
Phosphorus (P) 45g! kg
Potassium (K) 240g! kg
Magnesium (Mg) 30g! kg
Sulfur (S) 60g! kg
Iron (Fe) 1680mg! kg
Manganese (Mn) 400mg!kg
Boron (B) 500mg! kg
Zinc (Zn) 200mg! kg
Copper (Cu) 30mg! kg
Molybdenum (Mo) 50mg! kg
Hortichem calcium nitrate
Calcium (Ca) 15.5g! kg
Nitrogen (N) 15.5g! kg
Hortichem potassium sulfate
Potassium (K) 42g /kg
Sulfur (8) 18g! kg
Fertili zers were mixed as follows:
• SeOL of water was added into a tank with lOOOgofHydro-gro and stirred until the
ch emical dissolved.
• 250L of water was added into the same tank and 640g of Hortchem calcium
nilrate was added.
• 250L of water and lS0g of Hortchem potassium sulfate was added in the solution
an d the solution was stirred until all the chemicals were dissolved.
The e (periment was terminated on OSthMarch 1999. Plants were harvested and dried
in the oven for 48 hours at 6S °C and dry mass recorded. The Statistical Analysis
Systel n (SAS) program was used to analyze the data. Treatment means were
comp: lred using the Least Significant Difference (LSD) test at the S% probability
levell)f significance.
Experiment 2: Effect of nutrient solution application method
Three methods of supplying the nutrient solution were compared.
Treatl nent 1. Continuous flow by means of an electric pump (control)
The reservoir tank was placed at the bottom of the vertical columns and the
surplus nutrient solution drained directly into the reservoir tank. Nutrient
solution was continuously pumped from the reservoir tank to the drip tubes in
the top pockets. The delivery rate into each top pocket was 4L per hour,
obtained from two drippers each delivering 2L per hour.
Treatr lent 2. Continuous flow by means of a gravitational system
Nutrient solution was delivered by gravity from a tank 1 m above the plants.
Nutrient solution draining from the vertical columns was collected and
recirculated manually. The nutrient solution was always circulating. The
delivery rate per dripper was 1L per hour with one dripper in each pocket.
Treatment 3. Pulse application operated manually
The plants were irrigated once daily for a short period at a high flow rate. The
nutrient solution was delivered by gravity from the reservoir tank, which was
placed one meter high above the plants. The plants were irrigated until the
lowest pocket started to drain. The nutrient solution was also recirculated. The
delivery rate was 6L per dripper per hour.
Fertilizer mixtures used were the same as in experiment 1, namely:
• H:rdro-gro (1000g per 1000L of water)
• H>rtichem calcium nitrate (640g per 1000L of water)
• H>rtichem potassium sulfate (l50g per 1000 L of water)
The c mcentration and composition of the three fertilizer mixtures are given in Table
4.1. F)r each of the three treatments 80L of nutrient solution was in circulation. A pH
of 6.6 and an electrical conductivity of 2000mS/cm were recorded at the start of the
experi ment and the changes in pH and electrical conductivity were monitored every
seconll day starting from the 7th day after transplanting.
Lettu~e seedlings cv. Great Lakes were transplanted on 13th July 1999 into the
growi ng pockets of the vertical tubes. Coconut coir was used as growing medium.
Each Jocket contained 540 g of coconut coiro
Othel' treatments:
The ~H and the electrical conductivity of the nutrient solution, as well as the lettuce
yield were monitored separately for each of the growing pockets, resulting in the
folIo" ring treatments:
• PIant position on the tube (i.e. 1st, 2nd until the 8th growing pocket at the bottom).
• Side that the plastic tubes were facing (East and West).
Cultu ral practice
Foliar fertilizer Horti was applied to all plants every week at a concentration of 5ml
per 2 L of water. Aphids were sprayed with methomex SL at a concentration of 11.25
ml pe' 5L whenever necessary. This production practice resulted in vigorous growth
of the lettuce. See Figure 4.1 for photographs of the experimental setup and the good
growt h obtained.
Meas Jrements and statistical analysis
The fi tllowing parameters were determined:
1. Fr esh and dry mass of lettuce as influenced by
(a I different methods of nutrient solution application
(b I Growing position on the tube
(c: I Sides which the tubes were facing
2. Cllanges in pH of the nutrient solution

(c.) Every second day In the reservoir tank starting from the 7th day after
transplanting
(ll) Directly after harvesting in each growing pocket
3. Changes in electrical conductivity of the nutrient solution
(,) Every second day in the reservoir tank starting from the 7th day after
transplanting
(t) Directly after harvesting in each growing pocket
The (:xperiment was terminated on 16th August 1999. All the plants were harvested
and dried in the oven for 72 hours at 65°C. The Statistical Analysis System (SAS)
progr:lm was used to analyze data. Treatment means were compared using the Least
Signi:1cant Difference (LSD) test at the 5 %level of significance.
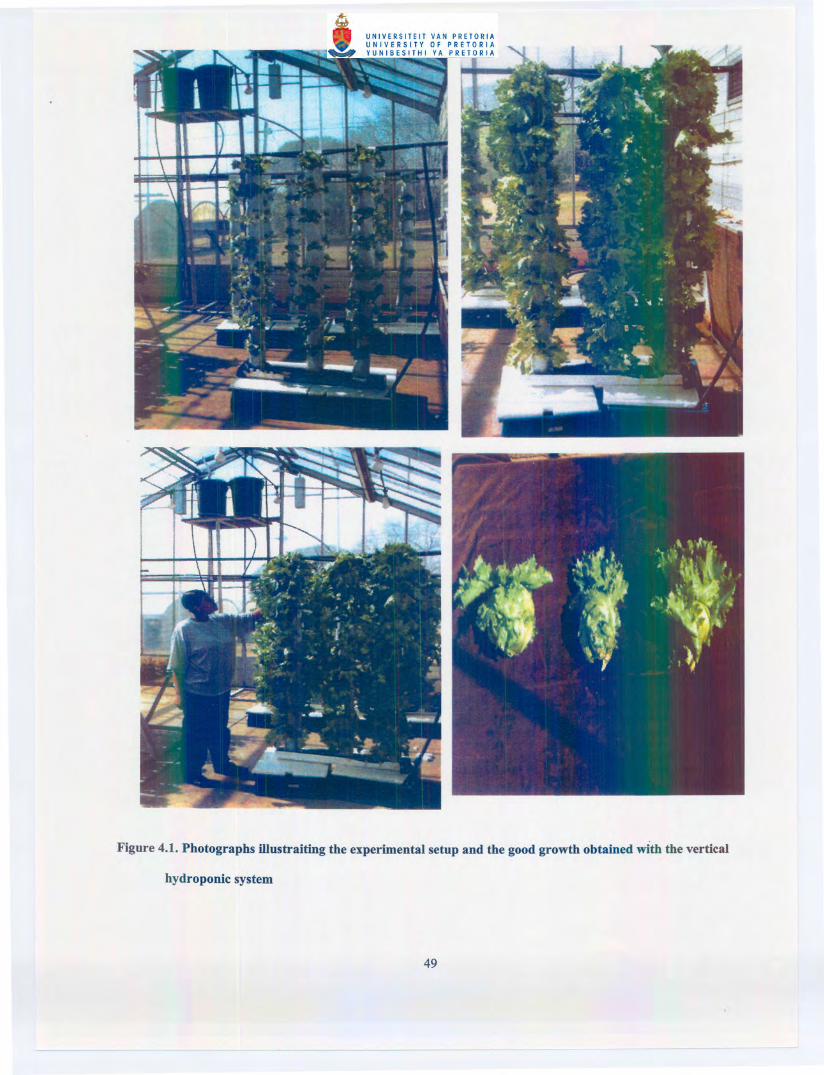
Figure 4.1. Photographs illustraiting the experimental setup and the good growth obtained with the vertical
hydroponic system
9
8-Cl7-'t'ca
CIl 6J:CIlU~-l! 4..CIlCo
3IIIcaE 2~c
1
0Saw dust Bark Coir sand
Substrates
(CPE) potting mixture gave better results in height of petunia transplants as compared
to 75 CPB: 25 peat, 50 CPB: 50 peat, 25 CPB: 75 peat and 100% peat treatments.
This was ascribed to better aeration of the pine bark substrate compared to the peat
mixtt res. The poor performance of sand in the present experiment may be due to poor
water holding capacity and high bulk density. Based on the good results obtained with
CoCOIlut coir this substrate was in the follow up experiment.
Experiment 2: Effect of nutrient solution application method
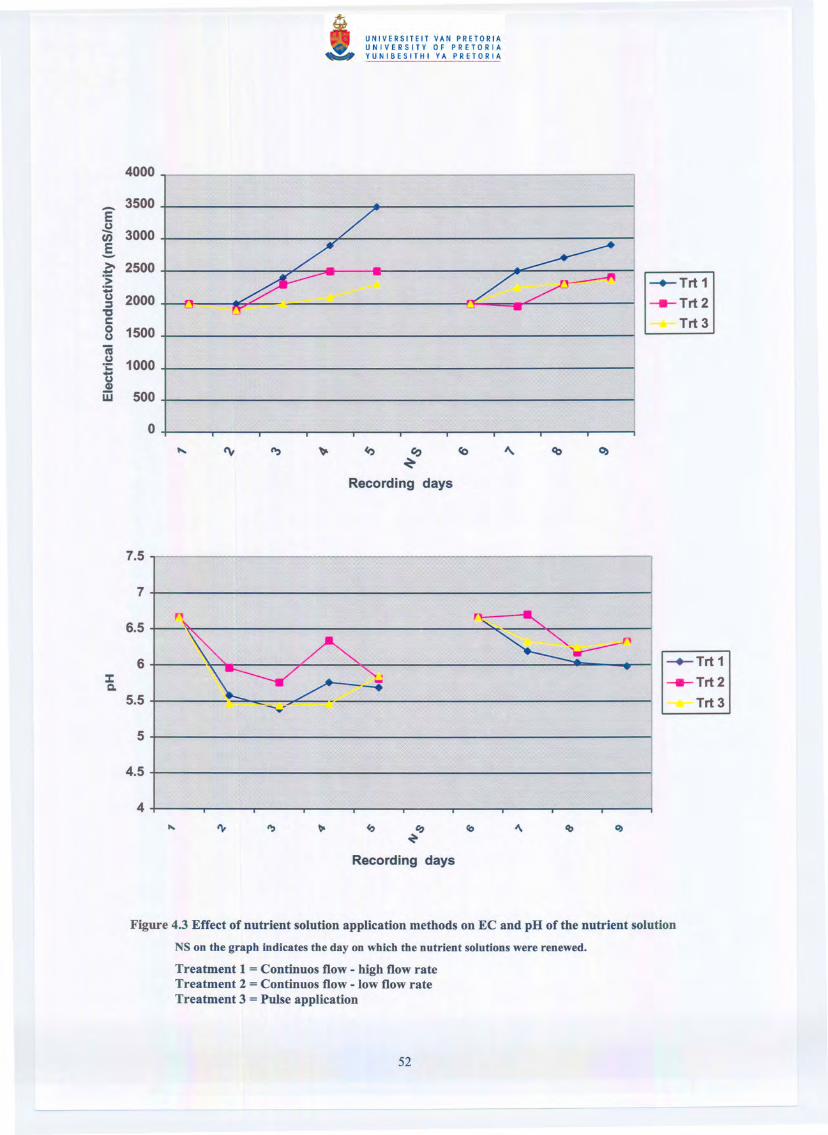
2.1 :E lectrical conductivity and pH of the nutrient solution
A gra phical presentation of changes in electrical conductivity and pH of the nutrient
soluti)n as influenced by the different methods of nutrient solution application is
given in Figure 4.3. The graph shows that the nutrient solution EC for all the
treatn lents increased as the plants were growing. However, in treatment 1 the EC
incre, .sed more than in treatment 2 and 3 where there were only a small increases. The
pH oi' the nutrient solution of all the treatments decreased slightly during the first five
recorc ling days. The variation in pH values recorded from the second nutrient solution
were small and was always in the range acceptable for crops grown in a soilless
culture (Cooper, 1979; Siraj-Ali, Peterson & Tayama, 1987). The changes in pH and
EC oi' the nutrient solution is in agreement with the observation of Mengel & Kirkby
(1979) who found that pH decreases and EC of the solution increases if plants absorb
more water than nutrient elements.
4000
- 3500Eu- 3000en.5->a 2500-.:;:;;u 2000~
"c0 1500uiUu
1000'L:-UQ)
W 500
0
""" ~ ~ r., CO~
Recording days
-+-Trt 1
~Trt2
Trt 3
7.5
7
n6.5
6 -+-Trt 1:I: ~Trt2c.
5.5 Trt3
5
4.5
4•... ~ " ~ (0
~Recording days
Figure 4.3 Effect of nutrient solution application methods on EC and pH of the nutrient solution
NS on the graph indicates the day on which the nutrient solutions were renewed.
Treatment 1 = Continuos flow - high flow rateTreatment 2 = Continuos flow - low flow rateTreatment 3 = Pulse application

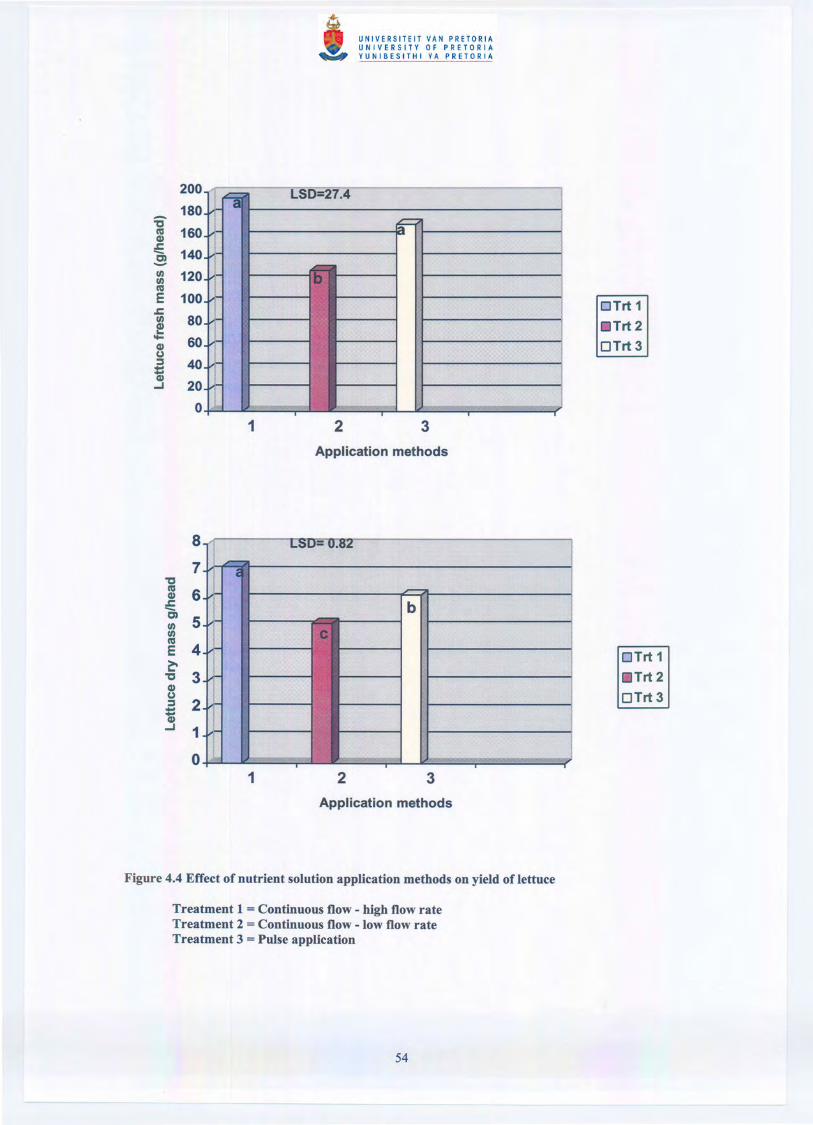
2.2 I,ffect of nutrient solution application methods on yield of lettuce
The y.eld data summarized in Figure 4.4 shows that the method of nutrient solution
applicition significantly affected lettuce yield. The highest yield of about 194.5g fresh
mass per lettuce head was produced when the nutrient solution was applied
contin uously using a high flow rate (treatment 1), while applying the nutrient solution
using a low flow rate (treatment 2) performed relatively poor resulting in a yield of
about 129g per lettuce head. Treatment 1 did not differ significantly from treatment 3
(pulse application) but differed significantly from treatment 2. The reason for the poor
perfor mance of treatment 2 may be that plants were experiencing periodic moisture
stress during the growing period due to the low flow rate. However, this was at no
stage'risually noticeable,
200
180 1:e-m 160.l:S 140:g 120IUE 100.l:III 80~CI) 60(J:J 40i...I 20
o '"
8
7't:'m 6.l:-~ 5~E 4~'t:' 3CI)(J:J 2i...I 1
o
Treatment 1 = Continuous flow - high flow rateTreatment 2 = Continuous flow - low flow rateTreatment 3 = Pulse application
oTrt 1[lTrt 2OTrt 3
OTrt 1Trt 2
OTrt 3
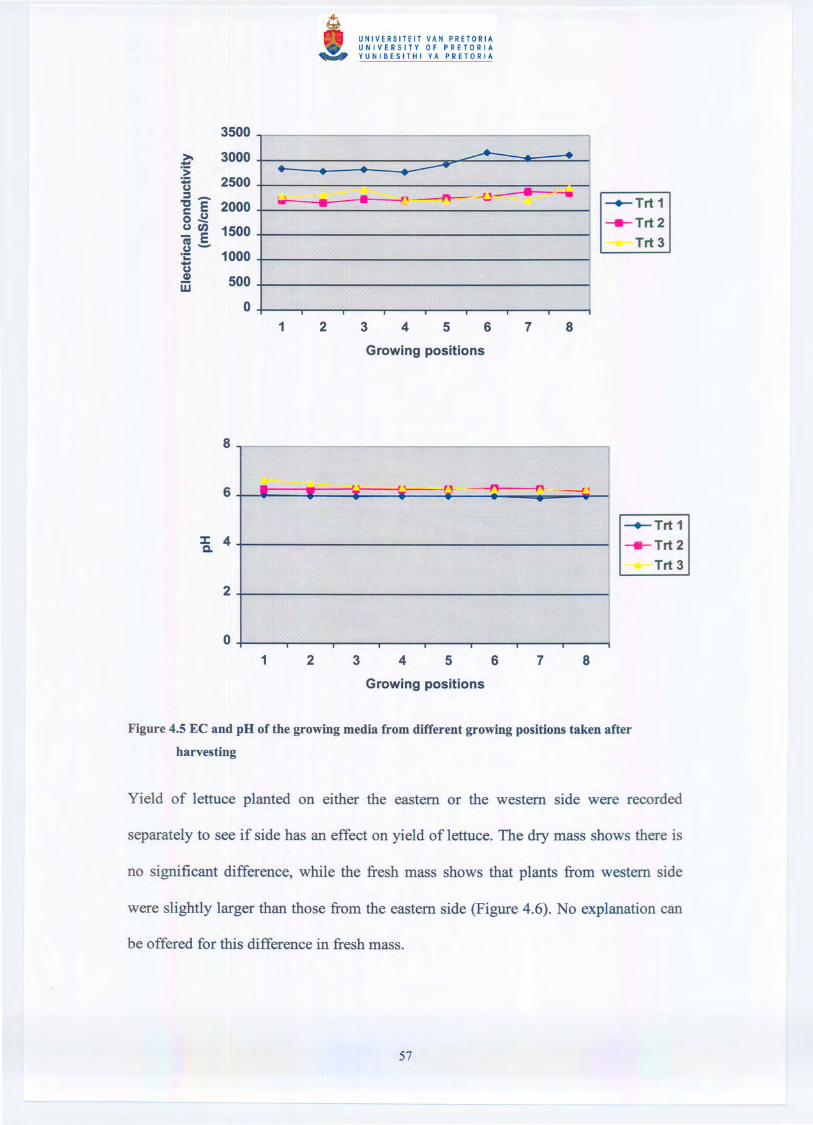
2.3 I ~ffect of growing position on yield oflettuce
The t<Ital mass (fresh and dry) produced by lettuce plants planted in different positions
on the plastic tubes is given in Table 4.2. The top growing pocket performed
relatively well with a mean fresh mass of243.g and dry mass of9.2g per head. From
the sl:cond growing position to the bottom (eighth pocket), yield did not differ
signif .cantly. The reason for the relatively high yield from the top pockets could be
that tile plants were exposed to more radiation than the lower, more shaded ones. In
the to p pockets the nutrient solution was still balanced while with the lower growing
pockc:ts it is possible that the nutrient solution become slightly depleted of some
nutrie nt elements. The system of forced ventilation in the glasshouse probably
exclw les variation in temperature or carbon dioxide concentration as reasons for
differ,mces in growth. Figure 4.5 shows the electrical conductivity and pH of the
growi ng media from different growing positions taken after harvesting. All treatments
show a slight increase in EC from the top growing pocket to the bottom, however,
treatn lent 1 had the highest EC in all pockets. The pH of the remaining nutrient
soluti ms were very similar for all treatments and pocket positions.
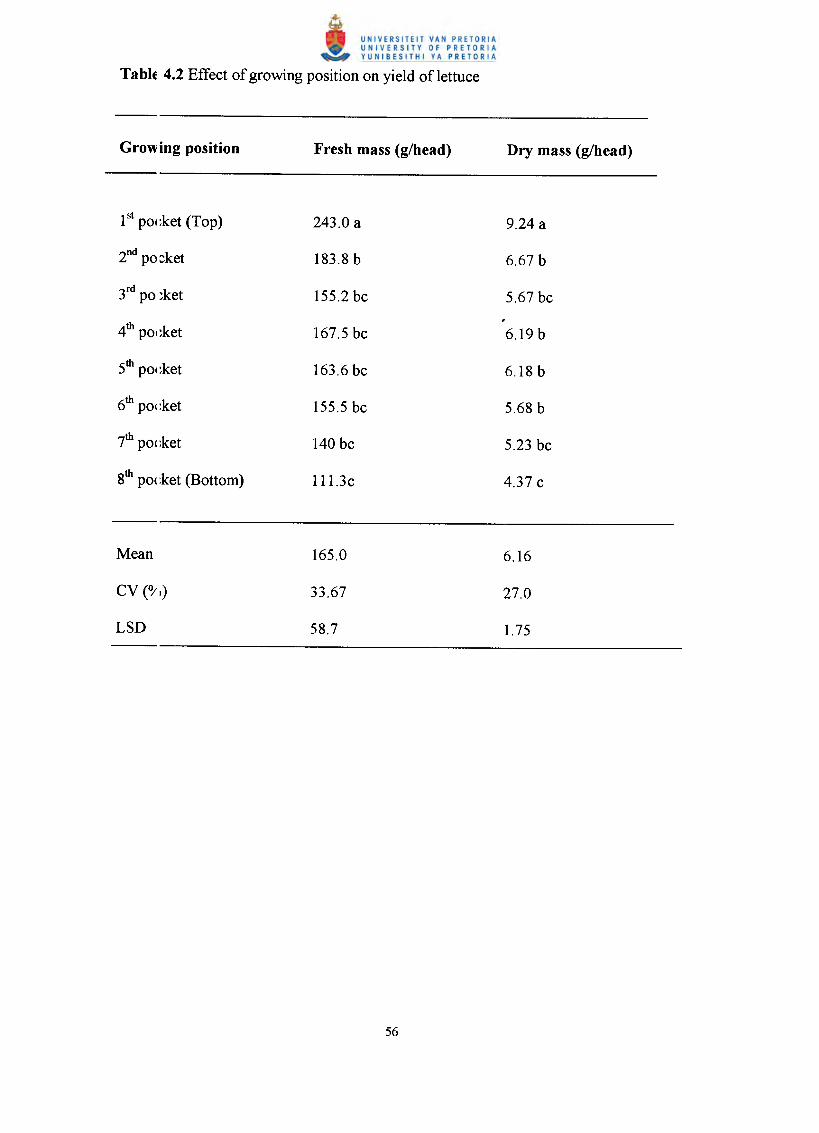
1st pal :ket (Top) 243.0 a 9.24 a
2nd pocket 183.8 b 6.67 b
3rd po ~ket 155.2 be 5.67 be
4th pOI:ket 167.5 be 6.19 b
5th pOI:ket 163.6 be 6.18 b
6th pOI:ket 155.5 be 5.68 b
7th poc;ket 140 be 5.23 be
8th pal :ket (Bottom) 111.3e 4.37 e
165.0
33.67
58.7
6.16
27.0
1.75
CV (~,)
LSD
3500>. 3000-'s;
:0:: 2500u::::1-'t' E 2000c u0_U(/) 1500- E~-1000't:-uCD 500W
0
..•.. .....•.. -- I
-..... I• ,,---n---- -f..J- • -•• •
II
.
~Trt1___Trt 2
Trt 3
8
- . f'-- ~ .----{\6
~Trt1:I: 4 ___ Trt 2Q,
Trt 3
2
01 2 3 4 5 6 7 8
Growing positions
Figure 4.5 EC and pH of the growing media from different growing positions taken after
harvesting
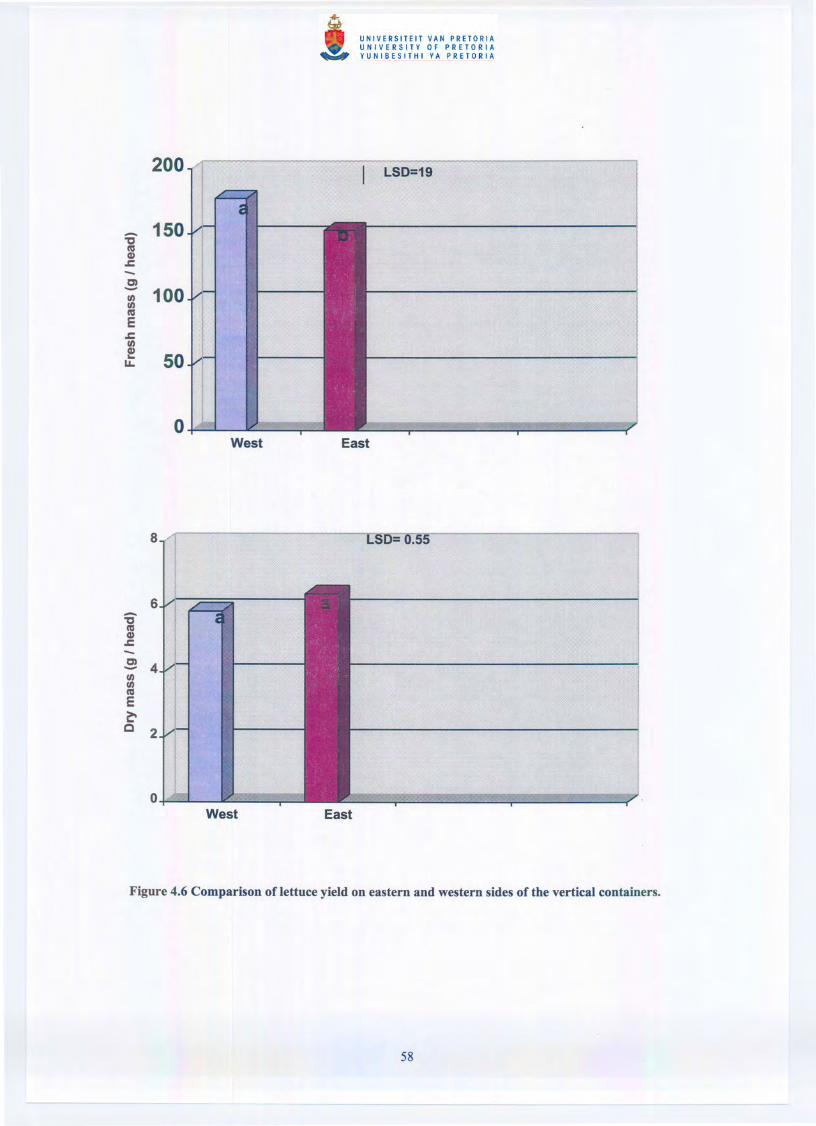
- 150"CnsCI).c-C)- 100fIIfIInsE.cfIIe 50LL.
6-"CnsCI).c-C)
4-fIIfIInsE~c 2
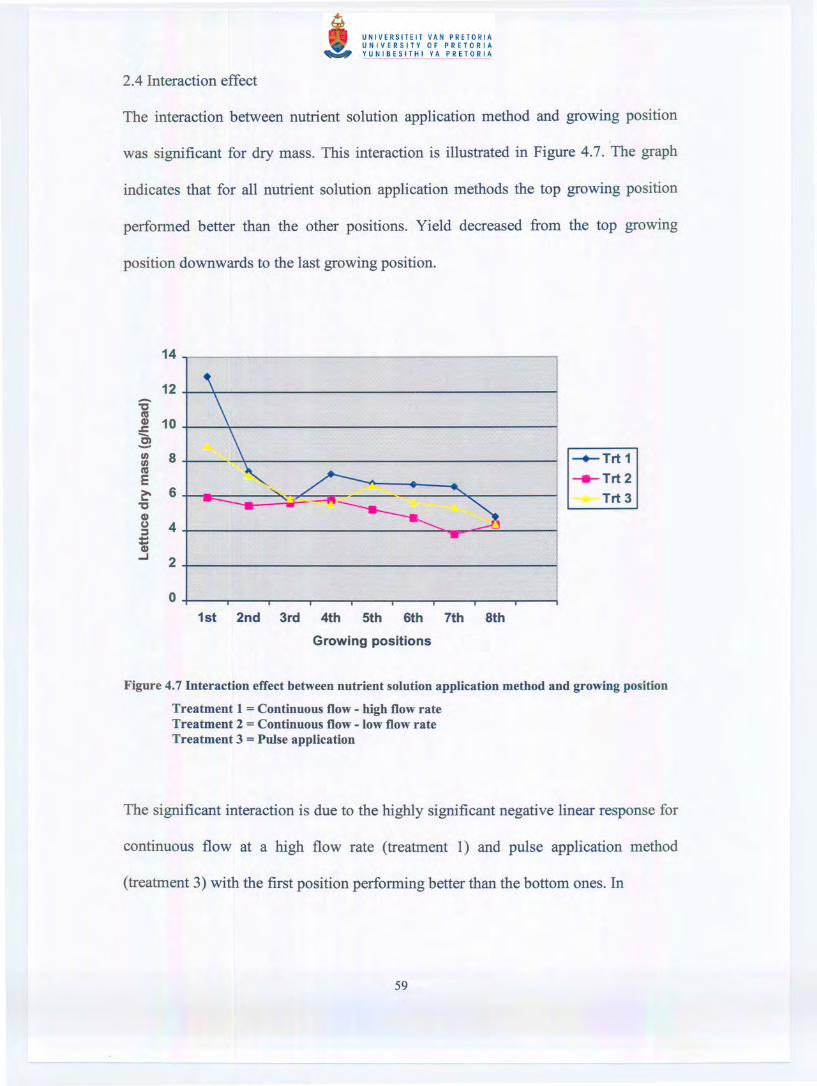
14
12-"CCllC1) 10.l:-Cl-III 8IIICllE~ 6"CC1)(J 4~--C1)~ 2
0
~Trt1-.... Trt 2
Trt 3
Figure 4.7 Interaction effect between nutrient solution application method and growing position
Treatment 1 = Continuous flow - high flow rateTreatment 2 = Continuous flow - low flow rateTreatment 3 = Pulse application
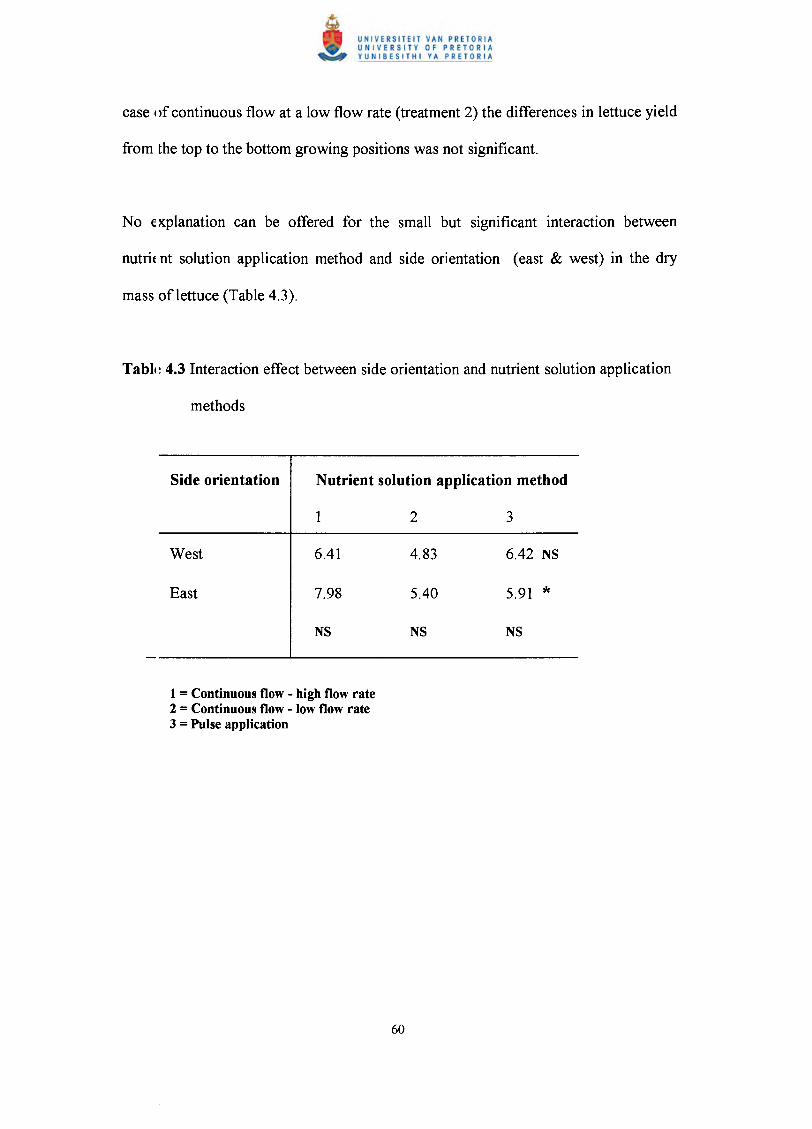
1 = Continuous flow - high flow rate2 = Continuous flow - low flow rate3 = Pulse application

A ger eral objective of this study was to adapt a vertical hydroponic system to small
scale farming situations. Materials used in the experiment were made out of simple
struct Ires that are inexpensive and affordable to small-scale farmers.
Small-scale farmers often have limited technologies that they can afford. Typically
they llave limited or no access to electricity. Evidence suggests that even the least
educa led farmers when shown superior technologies suited to their farming and social
condi ions have adopted them (Brady, 1985). One explanation for the poor adoption
oftec:mologies is that in many cases no technology is available that is suitable for the
farmers' specific needs. Despite this limitation to technology adoption, small-scale
farme rs will adopt new technology if it is advantageous to do so.
Techr .ologies developed for small-scale farmers should be simple to use while at the
same time produce better results. The vertical hydroponic system developed in this
study can be an option for small-scale farmers because of its low costs and simplicity.
Recy( :ling of the nutrient solution for one to two weeks is feasible. Commercial
hydro ponic mixtures are available that are easy to use and the instructions are given
by th( manufactures.
The v ~rtical hydroponic system makes high yields per unit area possible, thus making
it eve 1feasible for small-scale farmers to invest in protective structures like shade net.
The d lsadvantage of the vertical system is that it limits the choice of crops to be

plantt:d. Only crops with relatively small plants like strawberries and lettuce can be
produ ced successfully.
CHAPTERS
SUMMARY
Product ion of vegetable crops under protection is gaining importance worldwide and in
South j ~frica. The aerial environment can be controlled by planting crops in protective
structur ~s where temperature, radiation, photoperiod and carbon dioxide concentration
can be manipulated to a greater or lesser extent. The rooting environment can be
controll ed by using the hydroponic systems.
The objectives of the study were:
1. To I~valuate the effect of different types of shade netting on tomato production
2. To .ldapt a vertical hydroponic system for lettuce production to be suitable for use by
sma ll-scale farmers.
Tomatc plants cv. "Shirley" were grown under six different shade nets, namely 10%,
12% ard 18%, white, 30% and 40% black and 40% green shade intensities as well as in
full sUlllight. Transplants were grown in 18L plastic bags with composted pine bark
mixtun as a growing substrate. The performance of the tomato plants under different
shade letting was monitored over nine harvest dates. Number of fruit per plant,
individ! lal fruit mass and total mass of fruit per plant was recorded. The highest number
of fruit per plant (47) was produced under 12% white shade and 40% black shade nets,
and the lowest fruit number (35) under the 30% black shade net. The highest yield of 6.2
kg per plant was produced under 18% white shade net. The 30% black and 10% white
shade r ets performed relatively poorly.
An exp' ~riment to evaluate the effect of the substrate on lettuce yield grown in a vertical
hydrop(mic system was conducted. Lettuce seedlings cv. "Great Lakes" were transplanted
in four, iifferent substrates namely saw dust, sand, coconut coir and composted pine bark.
The hi~hest yield of 8g dry mass per head was obtained when coconut coir was used.
Sand pIoduced the lowest yield of 2.2g per head dry mass. Sawdust and composted pine
bark dieI not differ significantly in yield.
The nut rient solution application methods affected lettuce yield significantly. The highest
yield "as produced under continuous flow of nutrient solution at a high flow rate. A
simplifi ed manual system where the nutrient solution was delivered by gravity from a
small f( servoir tank resulted in comparable yields.
The pf( 'cedures adopted in both the shade net study and the vertical hydroponic trial can
be usee profitably by small-scale farmers to control the growing environment. Shade
netting can be used to control the aerial environment while the rooting environment can
be com rolled by use of the vertical hydroponic system. High yields per unit area of
growinJ ~space are possible.
ABAK, K., SANI, N., PAKSOY, M., KAFTANOGLU, O. & YENINAR, H. 1995.
Efficiency of bumble bees on yield and quality of egg plant and tomato grown
in unheated glasshouse. Acta Hortic. 412: 268-278.
ANSJ~RNIO, S.D., HOLCROFT, D.M., LEVIN, lB., ADAM, P., HIDING, AP.,
KIPP, AJ., SONNEVELD, C. & KRAlJ, C. 1995. A comparison of peat and
pine bark as a medium for bedding plant peck production. Acta Hortic 401:
151-160.
ASA)A, S. & ONO, M. 1997. Tomato pollination with Japanese native bumble bees
(Bombus spp) Acta Hortic. 437: 289-292.
BRADY, N.C., 1985. Significance of developing and transferring technology
to farmers with limited resources. In: Transferring technology for
small-scale farming. Edited by Usherwood, N.R., Stelly, M.,
Krall, D.M. & Cousin, M.K. 1-21.
CAr VERT, A 1973. Morphology and development of tomatoes. In: The UK tomato
manual, Growers book. London. 19-22.
COC:(-SHULL, K.E., GRAVES, C.J. & CAVE, C.RJ. 1992. The effect of shading
on yield of greenhouse tomatoes. HartScience 67 (1): 11-24.
COO ?ER, A.J. & HURD, RG. 1968. The influence of cultural factors on
development of the first inflorescence of greenhouse tomatoes. HartScience
43: 243-248.
DA V [S, J.M., LOESCHER, W.H., HOMMOND, M.W. & THORNTON, RE. 1986.
Response of potatoes to nitrogen form and change in nitrogen form at tuber
initiation. J. Am. Soc. Hart. Sci. III (1) 70-72.
EL-CIZAWY, A.M., ABDALLAH, M.M.F., GaMMA, H.M. & MOHAMMED,
S.S. 1992. Effect of different shading levels on tomato plants. Yield and fruit
quality. Acta Hartic. 323: 349-354.
GRA VES, c.J. & HURD. R 1983. Intermittent solution circulation in nutrient
film technique. Acta Hartic. 133: 47-52
HARl)GRAVE, M. & HARRIMAN, M. 1995. Development of organic substrates for
hydroponic cucumber production. Acta Hortic. 401: 2219-224.
HARtiS, D. 1987. Hydroponics. The South African guide to growing without soil.
[Cape Town]: Struik Johannesburg: Therold's African books distributor.
JEN~ EN, M.H. 1988. Controlled environment agriculture: Today and tomorrow.
In: Horticulture in high technology era. Special lectures. International
symposium on high technology in protected cultivation. 145-155.
JEN~mN, M.H. & COLLINS,W.L. 1985. Hydroponic vegetable production.
Hort. Rev. 7: 483-558.
KA1'fAAN, S.S. 1992. Effect of climatic conditions and time of harvest on growth and
tissue nitrate content of lettuce in nutrient film technique. Acta Hortic. 325:
75- 80.
KO~:AI, T. 1988. High technology in protected cultivation. In: Horticulture in high
technology era. Special lectures. International symposium on high technology
KRA JSE, A., NEL, A. & VAN ZYL, K. 1996. A guide to the use of pesticides and
fungicides in the Republic of South Africa. National Department of
Agriculture.
MAG WABA, S. 1999. The effect of shading and nutrition on tomato production.
Masters dissertation. University of Pretoria.
MAREE, P.c.l 1993. Growing greenhouse tomatoes in South Africa. Department of
Agronomy and Pastures: University of Stellenbosch.
MAROTO, lV., BARDIZI, A., LOPEZ, S., PASCUAL, B.& ALAGARDA, l 1995.
Influence of relative humidity in the appearance of cracking in tomatoes
(Lycopersicon esculentum) fruit. Acta Hortic. 412: 306-312.
MENGEL, K. & KIRKBY, E.A. 1979. Principle of plant nutrition. 2nd edition.
International Potash Institute. Bern
MOBAYEN, RG. 1980. Germination of citrus and tomato seed in relation to
temperature. J. Amer. Soc. Hort. Sci. V 55: 291 -297.
MORGAN, lY. 1971. The influence of supplementary carbon dioxide enrichment on
growth, flowering and fruiting of tomato. Acta Hortic. 22: 187-198.
NAKJYA, A & TAYEKO, Y. 1990. Varietal characteristics of tomato cultivars
grown in rockwool with different composition of nutrient solution. J. Japan.
Soc. Hort. sci. 59 (1) 647-651.
NAUDE, S., FERREIRA, J., VAN DEN BERGH, A & BOSCH, E. 1992. Tomato
diseases. In: South African plant disease control handbook. Edited by Trench,
T., Wilkinson, D.& Esterhuysen, S. Farmers support group. University of
Natal. Pietermaritzburg. 435-456.
NAU DE, S.P., VAN DEN BERG, AJ. & THOMSON, G. 1992. Lettuce diseases. In:
South African plant disease control handbook. Edited by Trench, T.,
Wilkinson, D.& Esterhuysen, S. Farmers support group. University of Natal.
Pietermaritzburg. 331-334.
NUKUYA, A, GOTO, K., JANG, H., KANO, A & OHKAWA, K. 1995. Effect of
~ + level in the nutrient solution on the incidence of blossom-end rot and
gold specks on tomato fruit grown in rockwool. Acta Hortic. 401: 381-388.
OLY MPIOS, C.M.1992. Soilless media under protected cultivation. Rockwool, peat,
perlite and other substrates. Acta Hortic. 323: 215-230.
PAlv A, E.AS., MARTINEZ, H.E.P., CASALI, V.W.D. & PADILHA, L. 1998.
Occurrence of BER in tomato as a function of calcium dose in the nutrient
solution and air relative humidity. J. Plant Nutrition 21 (12) : 2663-2670.
PAlVA, E.AS., SAMPAlO, R.A& MARTINEZ, H.E.P. 1998. Composition and
quality of tomato fruit cultivated in nutrient solution containing different
calcium concentrations. J. Plant nutrition 21(12): 2653-2662.
PAPADOPOULOS, AP. & KHOSLA, S. 1995. Concepts and methodology fertilizer
use economy in greenhouse tomato production, in Canada. Acta Hortic.
401: 461-471.
PAULITZ, T.C. 1997. Biological control of root pathogens in soilless and
hydroponics system. HortScience 32 (2): 193-196.
PICI<ENS, AJ.F., STEWARD, K.& KLAPWIJK, D. 1986. Morphology and
development. In: The Tomato crop. A scientific basis for improvement. Edited
by Atherthon, lG. & Rudich, J.P. New York. 111-166.
RAI \. HURAM, R.M. & MUHAMMED, A 1992. The use of coconut potting mix in
the soilless cultivation of tomatoes. Acta Hortic. 292: 155-160.
RES} [, HM. 1993. Hydroponic tomatoes for the home gardener. Santa Barbara:
Woodbridge.
RUN lA, W.T. 1994. Disinfecting of recirculating water from closed cultivation with
ozone. Acta Hortic. 361: 338-396.
RUS;;O, V.M., 1993. Shading of tomato plants inconsistently affects fruit yield.
HortScience 28 (11): 1133.
SAG LAM, N. & YAZGAN, A. 1995. The effect of planting density and the number
of trusses per plant on earliness, yield and quality of tomato grown under
unheated high plastic tunnels. Acta Hortic. 412: 258 - 267.
SAKYMA, R.1968. Effect of irrigation, temperature and shading on acidity of tomato
Fruits. J. Japanese. Soc. Hort. Sci. 37: 67-72.
SAl\DY, W., ROZEK, S. & MYCZKOWSKI, 1. 1995. Effect of different forms of
nitrogen on the quality of lettuce yield. Acta Hortic. 401: 409-415.
SCCTTER, H & BURGER, D.W. 1989. Plant propagation using an aero-hydroponic
system. HortScience 24 (1): 151.
SHEHF, AF. & MACNAB, A H. 1986. Vegetable disease and their control. New
York:Wiley.
SIRAJ-ALI, M.S., PETERSON, J.C., TAYAMA, H.K. 1987. Influence of nutrient
solution pH on the uptake of plant nutrients and growth of Chrysanthemum
morifolium 'Bright Golden Anne' in hydroponic culture. 1. Plant Nutrition 10:
2161-2168.
SLA :::K,G. 1986. CO2 enrichment of tomato crop. In: Carbon dioxide enrichment of
greenhouse crops. Volume ii. Physiology, Yield and Economics. Edited by
Enoch, H.Z. & Kimball, B.A CRC Press.151-163.
SMI rH, D.R 1966. Tomato. Heated carbon dioxide enrichment of an early crop.
Annu. Rep. Efford. Exp. Hort. Stak. 73 (Cited by Witter & Honma, 1969).
THCIMSON, H.C., LANGHaNS, RW., BOTH, AJ. & ALBRIGHT, L.D. 1998.
Shoot and root temperature effects on lettuce growth in a floating hydroponics
system. 1. Am. Soc. Hort. Sci. 123 (3): 361-396.
VA1~DE VOOREN, J., WELLES, G.W.H. & HAYMAN, G. 1986. Glasshouse crop
production. In: The tomato crop. A scientific basis for improvement. Edited by
Atherthon, J.G. & Rudich, J.P. New York: Chapman and Hall. 581- 620.
of tomato plants related to climatic conditions from some areas of Romania.
Acta Hortic. 412: 355 - 365.
WHITTINTON, W.J., CHILDS, J.D., HARTRIDGE, J.M.& HOW, J. 1965. Analysis
of variation in the rates of germination and early seedling growth in tomato.
Ann. Bot. 29: 59-71.
WIN ~OR, G.W. & MASEY, D.M. 1978. Some aspects of nutrition of tomato grown
in recirculating solution. Acta Hortic. 82: 121-132.
WITTWER, S.H & HONMA, S. 1969. Greenhouse tomatoes. Guide lines for
successful production. East Lansing: Michigan State University.
YA1 [AGUCHI, M. 1983. World vegetables. Principles, production and nutritive
value. West port, Conn.
ZEK KI, H, GAUTHIER, L.& GOSSELIN, A. 1996. Growth, productivity and
mineral composition of hydroponically cultivated greenhouse tomatoes with
or without nutrient solution recycling. J. Am. Soc. Hart. Sci. 121(6):
1082-1088.
ZORONA, P., GONZALEC, M., CARPENA, O. & CASELLES,J. 1995. Response
of the two tomato plant cultivars to N03- : NH/ ratios and light intensity. Acta
Hortic.412:455-462.
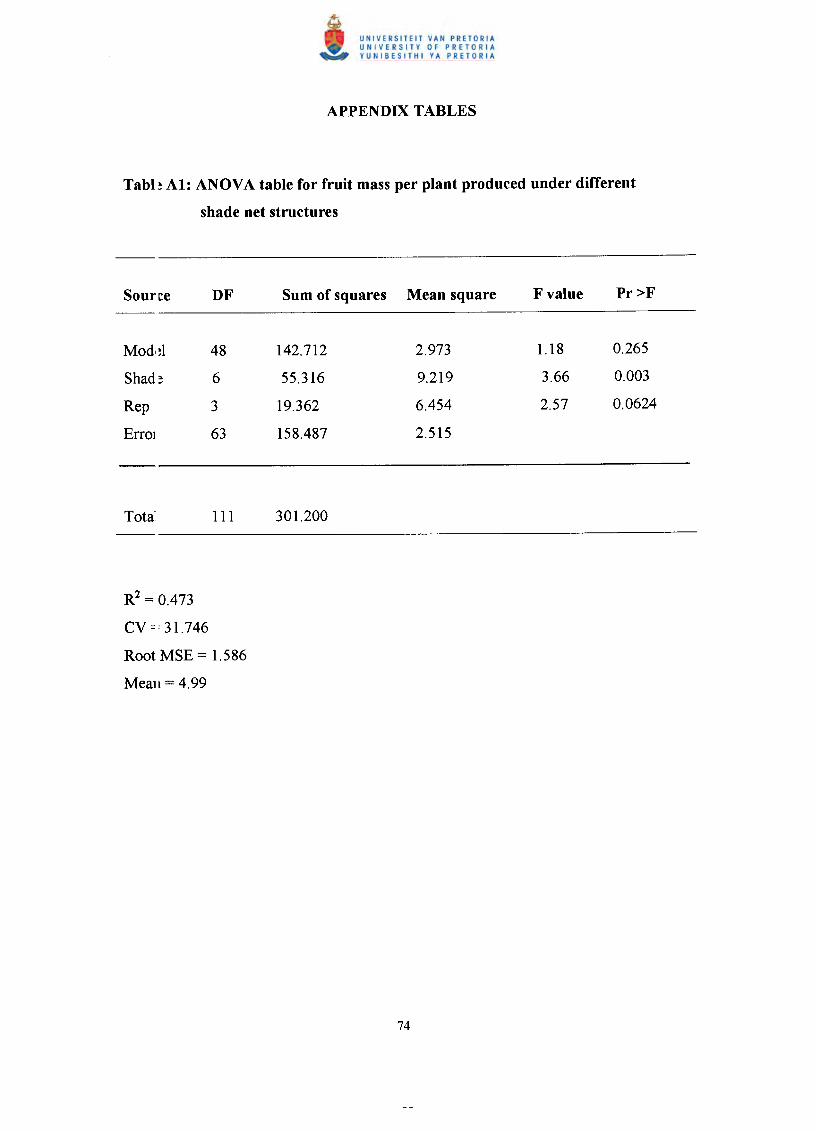
Tabl ~At: ANOVA table for fruit mass per plant produced under different
shade net structures
Soune DF Sum of squares Mean square F value Pr>F
Mod,~l 48 142.712 2.973 1.18 0.265
Shad~ 6 55.316 9.219 3.66 0.003
Rep 3 19.362 6.454 2.57 0.0624
Errol 63 158.487 2.515
R2 = 0.473
CV =: 31.746
Root MSE = 1.586
Mean = 4.99
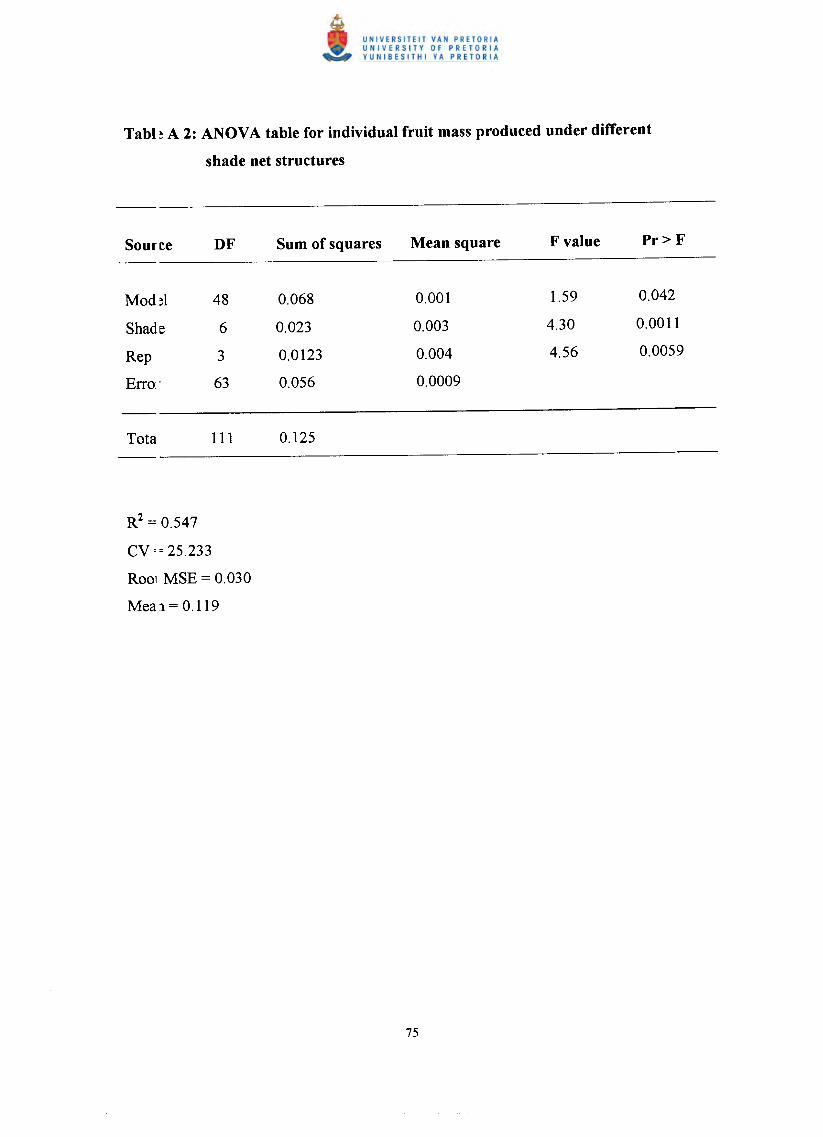
Tabl ~A 2: ANOV A table for individual fruit mass produced under different
shade net structures
Source DF Sum of squares Mean square F value Pr>F
Mod~l 48 0.068 0.001 1.59 0.042
Shade 6 0.023 0.003 4.30 0.0011
Rep 3 0.0123 0.004 4.56 0.0059
Erro' 63 0.056 0.0009
R2 = 0.547
CV:: 25.233
R001 MSE = 0.030
Meal = 0.119

Tabl ~A 3: ANOVA table for fruit number (marketable) per plant produced
under different shade net structures
Mod~l 48 7031.5 146.489 1.36 0.127
Shad~ 6 2282 380.354 3.52 0.0046
Rep 3 629 209.67 1.94 0.132
Errol 63 6804.06 108.0
R2 = 0.508
CV = 24.488
Root MSE = 10.392
Meal I = 42.43
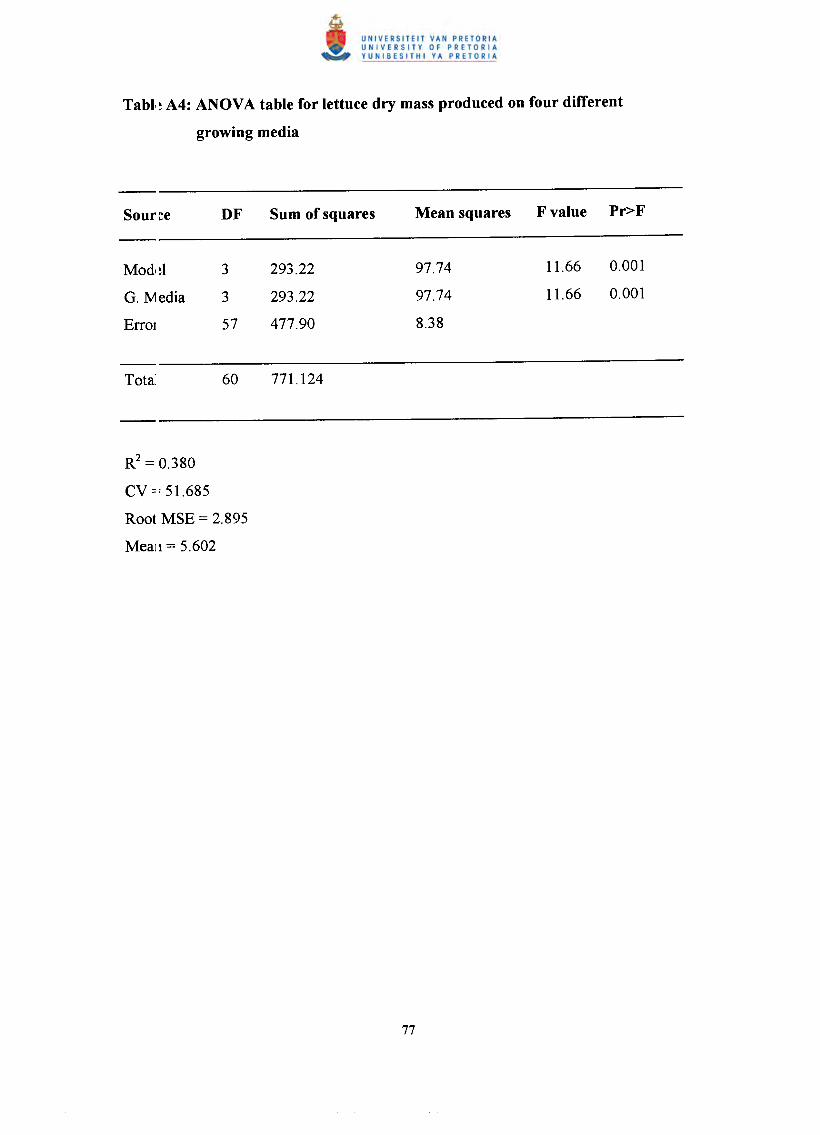
Tabl, ~A4: ANOV A table for lettuce dry mass produced on four different
growing media
Mod,~l
G. Media
Errol
293.22
293.22
477.90
11.66
11.66
0.001
0.001
97.74
97.74
8.38
R2 = 0.380
CV =: 51.685
Root MSE = 2.895
Meall = 5.602
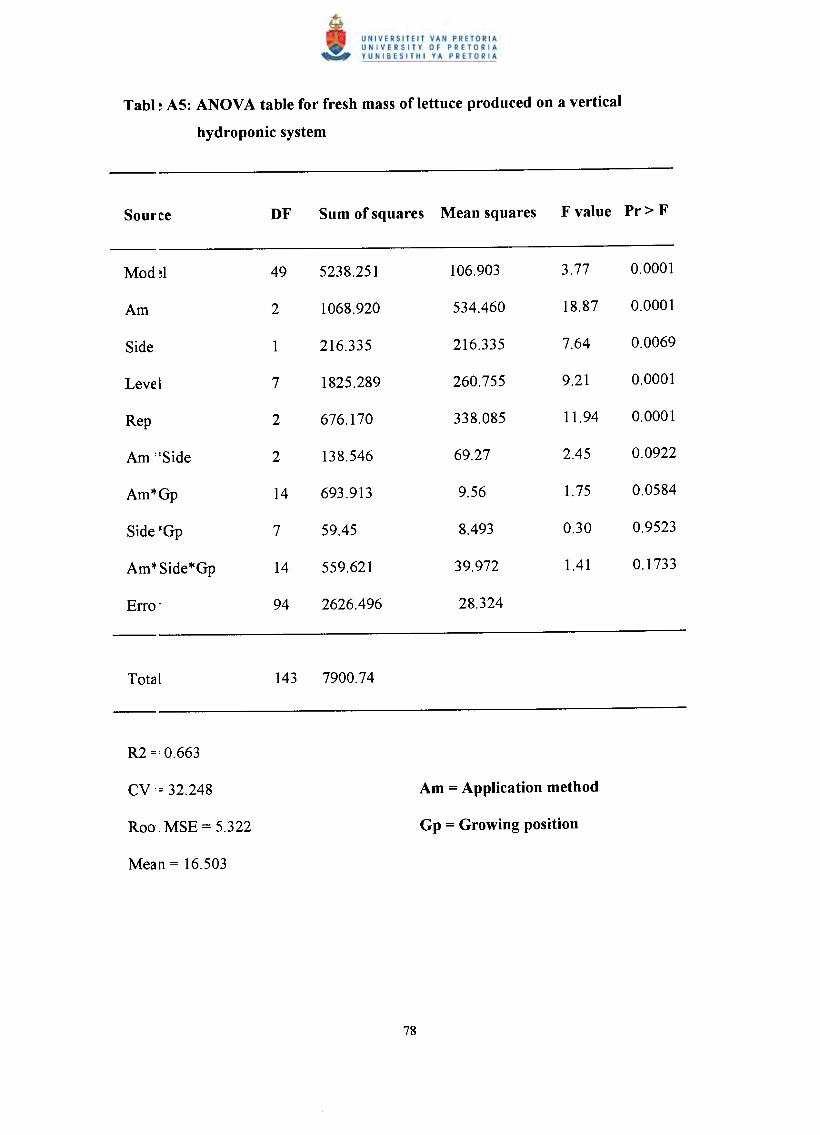
Tabl ~AS: ANOVA table for fresh mass of lettuce produced on a vertical
hydroponic system
Mod ~1 49 5238.251 106.903 3.77 0.0001
Am 2 1068.920 534.460 18.87 0.0001
Side 1 216.335 216.335 7.64 0.0069
Level 7 1825.289 260.755 9.21 0.0001
Rep 2 676.170 338.085 11.94 0.0001
Am "Side 2 138.546 69.27 2.45 0.0922
Am*Gp 14 693.913 9.56 1.75 0.0584
Side 'Gp 7 59.45 8.493 0.30 0.9523
Am*Side*Gp 14 559.621 39.972 1.41 0.1733
EITo· 94 2626.496 28.324
Am = Application method
Gp = Growing position
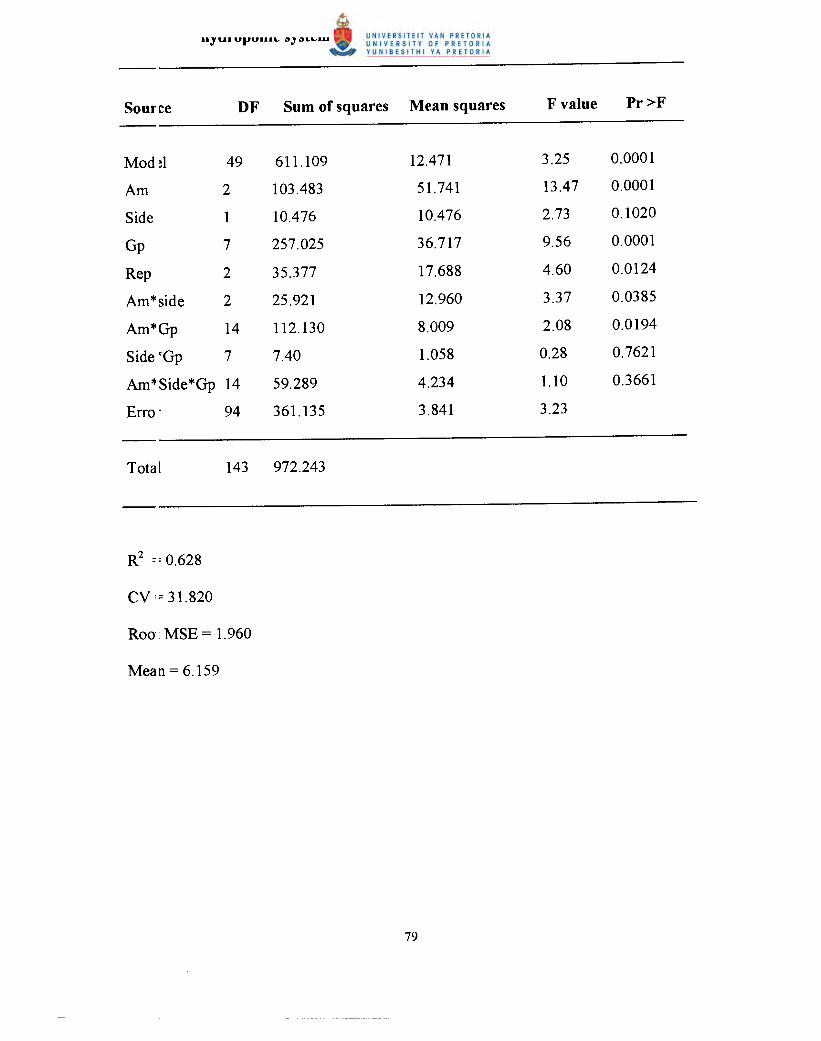
Source DF Sum of squares Mean squares F value Pr>F
Mod~l 49 611.109 12.471 3.25 0.0001
Am 2 103.483 51.741 13.47 0.0001
Side 1 10.476 10.476 2.73 0.1020
Gp 7 257.025 36.717 9.56 0.0001
Rep 2 35.377 17.688 4.60 0.0124
Am*side 2 25.921 12.960 3.37 0.0385
Am*Gp 14 112.130 8.009 2.08 0.0194
Side ~Gp 7 7.40 1.058 0.28 0.7621
Am*Side*Gp 14 59.289 4.234 1.10 0.3661
Erro" 94 361.135 3.841 3.23