Embed Size (px)
Citation preview
Joumal of Accounting ResearchVol. 18 No. 1 Spring 1980
Printed m U.SA.
The Pricing of Audit Services:Theory and Evidence
DAN A. SIMUNIC*
1. Introduction
The question of the existence of competition among auditors has beenthe subject of considerable discussion in recent years. More specifically,the "Big Eight" firms as a group have been accused of monopolizing themarket for audits (Staff Study of the Subcommittee on Reports, Account-ing and Management of the Senate Committee on Government Opera-tions [1977]). However, evidence on the issue is scanty and typicallyanecdotal (e.g., Bernstein [1978]). The evidence of the Staff Study itselfis limited to concentration statistics, with the allegations relying on whathas come to be called the "concentration doctrine" (Demsetz [1973]).According to this doctrine, supplier concentration is a reliable indicatorof supplier behavior and performance. In this paper, I provide evidencefrom a test of the hypothesis that price competition prevails throughoutthe market for the audits of pubUcly held companies, irrespective of theshare of a market segment which is serviced by the Big Eight firms. Theevidence is based on an examination of a sample cross-section of auditfees.
In order to test the competitiveness of the audit industry using feedata, it is first necessary to develop a positive model of the process bywhich audit fees are determined. Since an audit fee is the product of unitprice and the quantity of audit services demanded by the management ofthe audited company (hereafter called the auditee), cross-sectional dif-
• Assistant Professor, University of British Columbia. This paper is based on my doctoraldissertation (University of Chicago, 1979). I am indebted to Yale Brozen, Sidney Davidson,Nicholas Dopueh, Roger Kormendi, Shyam Sunder, and William Wecker for their com-ments. I have also benefited from the comments of participants in various accountingworkshops at which the results of my dissertation were presented. [Accepted for publicationNovember 1979.]
161
Copyright ©, Institute of Professional Accounting 1980

162 JOURNAL OF ACCOUNTING RESEARCH, SPRING 1980
ferences in fees can represent either the effect of quantity differences orprice differences. A positive model of the determinants of audit quantityand price suggests factors which need to be controlled before any infer-ence about competition can be made from observed fee data.
Following Demski and Swieringa [1974], I consider the external auditto be a subsystem of an auditee's overall financial reporting system. Inthis regard, the audit service is viewed as an economic good to theauditee, which has substitutes and complements in consumption. Thusthe quantity of auditing demanded by an auditee will result from aconventional equalization of marginal private benefits and costs.' How-ever, the nature of the benefits which an auditee derives from the auditservice is stiU an open question. I hypothesize that the potential legalliability of an auditee and auditor to financial statement users (share-holders, creditors, etc.) drives the design of external financial reportingsystems. That is, the benefits are in the nature of liability avoidance. Theimplications of this sort of motivation are discussed later in this paper.
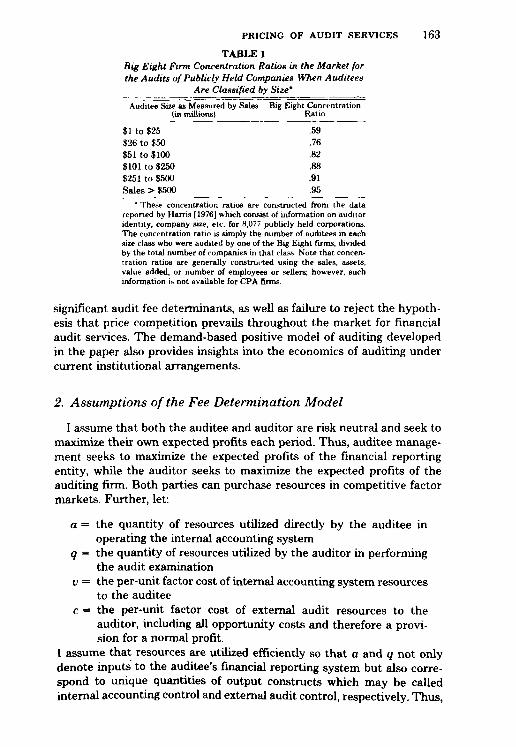
A second requirement for testing competition is the identification of acompetitive benchmark. The typical approach in the industrial organi-zation literature (see Weiss [1971]) is to make cross-sectional interindus-try comparisons of market structure (generally measured by a concentra-tion ratio) with performance (generally measured by an average rate ofreturn earned by firms within an industry). In such studies, industrieswith "low" supplier concentration serve as a benchmark. However, anyinterindustry comparison of rates of return involves difficult problems ofcontrol for confounding differences, such as in risk. In this paper, the testfor competition is an intraindustry comparison of prices, where thecompetitive benchmark is the market segment for "small" audits. Anintraindustry test is possible because, as shown in table 1, the marketdominance of the Big Eight firms increases significantly with the size ofthe audited company. Thus, I assume that price competition prevails inthe submarket for the audits of "small" companies and test for the effectsof increasing Big Eight concentration on prices paid by "large" auditees.
The data for this paper consist of 397 observations on audit fees andrelated variables obtained from a sample survey of publicly held corpo-rations in the United States. The survey was conducted during 1977. Thedata were analyzed using a series of least-squares regressions where thespecification of the regression equations was derived from the model ofaudit fee determination. Results include the identification of a number of
' The terms "audit" and "audit service" refer to the process of auditing, not the auditor'scertificate which is attached to a set of financial statement* This distinction is necessarybecause the audit production fiinction is clearly not single valued—audit processes of manydifferent specifications can result in the same observed outcome. Much confusion can beavoided if one is careful to distinguish between these two elements. For example, whileowners may demand that financial statements prepared by management be accompaniedby an audit certificate, under existing institutional arrangements, it is the auditee manage-ment who demands the quantity of auditing which underlies that certificate.
PRICING OF AUDIT SERVICES 163
TABLE 1Big Eight Firm Concentration Ratios in the Market forthe Audits of Publicly Held Companies When Auditees
Are Classified by Size'
Auditee Site as Measured by Sales Big Eight Concentration(in millions) Ratio
$1 to $25 .59$26 to $50 .76$51 to $100 .82$101 to $250 .88$251 to $500 .91Sales > $500 .95
* These concentration ratios are constructed from the datareported by Harris [1976] which consist of information on auditoridentity, company size, etc. for 8,077 publicly held corporations.The concentration ratio is simply the number of auditees in eachsize class who were audited by one of the Big Eight firms, dividedby the total number of companies in that class. Note that concen-tration ratios are generally constructed using the sales, assets,value added, or number of employees or sellers; however, suchinformation i. not available for CPA firms.
significant audit fee determinants, as well as failure to reject the hypoth-esis that price competition prevails throughout the market for financialaudit services. The demand-based positive model of auditing developedin the paper also provides insights into the economics of auditing undercurrent institutional arrangements.
2. Assumptions of the Fee Determination Model
I assume that both the auditee and auditor are risk neutred and seek tomaximize their own expected profits each period. Thus, auditee manage-ment seeks to maximize the expected profits of the financial reportingentity, while the auditor seeks to maximize the expected profits of theauditing firm. Both parties can purchase resources in competitive factormarkets. Further, let:
a = the quantity of resources utilized directly by the auditee inoperating the internal accounting system
q = the quantity of resources utilized by the auditor in performingthe audit examination
V = the per-unit factor cost of internal accounting system resourcesto the auditee
c = the per-unit factor cost of external audit resources to theauditor, including all opportunity costs and therefore a provi-sion for a normal profit.
I assume that resources are utilized efficiently so that a and q not onlydenote inputs to the auditee's financial reporting system but also corre-spond to unique quantities of output constructs which may be calledinternal accounting control and external audit control, respectively. Thus,

164 DAN A. SIMUNIC
a financial reporting system is completely described by the ordered pair(a,q).
Assume that the auditee and auditor are jointly and severaUy liable tofinancial statement users for losses attributable to defects in the auditedfinancial statements.^ Further, the benefits from the financial reportingsystem (a, q), derive solely from reduction of losses to financial statementusers. Let the random variable, d, denote the present value of possiblefuture losses which may arise from this period's audited financial state-ments. Thus, E(d) = f(a, q). Assume that the auditee and auditoridentically assess this function which has first- and second-order partialderivatives where:
aE(d)aa
aE(d)
aq
< 0 -
< 0
i'E(d)aa'
fE(d)
aq'
And at any given level of E(d):
da
dqCO
> 0
> 0
d'a
dq'
aaaq
Since liability is joint and several, actual losses will somehow be dividedbetween the two parties. Let 6 denote the ex-post fraction of losses borneby the auditor where:
At the time of the audit, this loss apportionment factor is also a randomvariable. Assume that the auditee and auditor identicaUy assess E(d) andassume that d and 0 are independent.
Finally, let p denote the unit price of external audit services to theauditee; that is, the price per unit of q purchased by the auditee from theauditor. The auditor's revenue derived from an audit engagement istherefore pq, or the audit fee.
3. The Auditee's Problem When the Market for Audits IsCompetitive
An expected profit-maximizing auditee wUl seek to minimize the ex-pected periodic costs of operating a financial reporting system. Let TC
- Section ll(f) of the Securities Act of 1933 and Section 18(b) of the Securities ExchangeAct of 1934 provide for joint and seversd liability on the part of auditees and auditors. Underthese provisions, the entire amount of damages suffered by a third party can be collectedfrom any one of the liable persons, with that person generally retaining rights to collectfrom all other persons who are also liable.

PRICING OF AUDIT SERVICES 165
denote the total costs of the system. The auditee's problem can initiallybe expressed as an unconstrained minimization of expected total costs:
minE(TC) = va + pq + E(d\a,q)(l - E(d)). (1)
In this problem, the choice variables are the systems design, (a, q),whereas i' is a market parameter, E(S) is an unconditional expectation,and E{d) is an expectation conditional on the system's design. The valueof p, on the other hand, will depend on the state of competition in themarket for audit services.
An auditor's minimum supply price per unit of q is marginal cost.Alternatively, his minimum fee for different levels of audit quantity wiUbe equal to his incremental expected total cost, denoted E(C), where:
E(C) = cq + E(d\a,q)E(e). (2)
Note that the auditor's expected costs are a function of the auditee'sfinancial reporting system. Since by definition, the parameter c includesall costs of a unit of q, including a normal return,' when the market foraudits is competitive pq' = E(C), and the auditee's problem becomes:
rmnE(f'O = va + cq + E(d\a, q)E(6) +E{d\a,q)(\ - Eiff)) (3)
or simply:
min£( fC) = va + cq + E(d\a,q). (4)
The necessary condition for the expected cost minimization is:
aE(TC)aa
EifC)
dE(d)da
md)(- r
- 0
= 0
or
or
dE(d)da
dE(d)dq dq aq
This condition states that the auditee will demand quantities of a and qup to the point where the marginal reduction in expected liability lossesis equal to the auditee's marginal resource cost. The solution to thissystem of equations under competition is denoted (a, q).
While the solution values (d, q) are obtained simultaneously, thenature of internal accounting systems and external auditing suggests thatimplementation of the solution by the auditee is sequential, that is, d isfollowed by q. This is consistent with the normal technical auditing modelwherein an auditor's audit program design is a function of the internalaccounting system. However, to what extent does the model allow forindependent action on the part of auditors in attaining the solution (d,g)? In other words, given that the auditee has computed (d, q) and
' It is reasonable that an auditor's return to capital be computed per unit of q ratherthan per engagement, since an auditor's capital itself is predominantly general rather thanengagement specific.

166 DAN A. SIMUNIC
installed the internal accounting system d, what additional conditions arenecessary for the auditor to perceive that an audit examination of scopeq is in his own best interests? An agreement on the amount of the auditfee, pq, insures only that q -^ q, since for larger values of q an auditorwould fail to earn a normal return. To insure that audit scope is in factequal to q, it is necessary to assume (in a single-period model) that theauditee is able to evaluate q.
It is also worth noting that the solution (d, q) is invariant to theincidence of third-peuty liability. Equation (3) will reduce to equation (4)for all values where 0 :£ E(d) :< 1. This result holds because the auditeeexpects to incur aU systems costs and is eissumed to be indifferent aboutwhether costs occur in the form of the cost of internal accounting systems(I'd), the external audit fee (cq -I- .E(d | d, q)E(d)), or the expected presentvalue of the auditee's share of residual liability losses E(d\d, q)(l -E(6)). However, attainment of the competitive solution when E(d) > 0requires that the auditee recognize that p is not a fixed value but afunction, p(a, q). In addition, when E(6) > 0, the auditee must be able toanalyze the component terms of equation (2). Thus, if one assumes thatanalysis is costly, the imposition of third-party liability upon the auditeealone is preferable to a regime of joint and several habUity, unless thereare sufficient offsetting benefits associated with existing arrangements.
4. The Auditee's Problem in a Noncompetitive MarketSetting
Suppose that a dominant subset of auditors (e.g., the Big Eight firms),through collusion, agree to limit price competition so as to introduce anelement of monopoly profit into audit prices. Let m represent the amountof monopoly rent included in the unit price p.* The fee schedule of anauditor who was a member of the cartel would be:
pq = (c + m)q + E(d\a, q)E(e).
Substituting into equation (1) and simphfying, an auditee would seek to:
minE( TC) = va + (c + m)q + E(d\a, q).
And the necessary condition for the minimization would be:
dE(d)
da
aE(d)= c + m.
' In principle, a group of auditors acting as a cartel could he expected to compute andincorporate into p, a joint profit-maximizing value of m However, to demonstrate theeffects of monopoly pricing, determination of the optimum m is not necessary and I merelyassume that m > 0.

PRICING OF AUDIT SERVICES 167
By inspection, the revised solution value of q, denoted qm, mustdecrease relative to q. In addition, since:
dadq
the reduction oi q makes the value of aE(d)/aa more negative at any a,and thus the desired quantity of internal accounting under monopoly,denoted am, must be greater than d. However, because of diminishingsubstitutability between internal accounting and external audit resourcesin controlling liability losses, it must also be true that:
E(d\an,,qm)>E(d\d,q), and (5)
E(TC\a^,qr,,)>E(TC\d,q). (6)
That is, monopoly pricing induces a substitution away from q toward arelatively less productive resource, a, which results in an increase in thedesired level of expected residual liability losses (relation (5)). This effectcan be described as a decrease in the quality of the auditee's financialreporting system because financial statements are now more likely to bedefective, resulting in larger expected liabUity payments to third parties.In summeu^, auditor monopoly reduces the quantity demanded of exter-nal auditing jmd results in lower-quality, higher-cost financial reportingsystems.
By definition, monopoly pricing increases the unit price of extemedauditing, p. However, the effect upon observable audit fees is indetermi-nate. That is:
pqn, i pq,
depending upon the price elasticity of demand implicit in the auditee'scost minimization problem at the competitive solution point (d, ^). If theimplicit demand function is inelsistic in the vicinity of the point (c, q),then for small values of m, the audit fee would increase, while if demandwas elastic in that vicinity, the audit fee would decrease.
While the increase inp has no clear implication for the audit fee itself,I have shown that the auditee's_total systems costs must increase in amonopoly setting. However, E(TC) includes an unobservable cost com-ponent, E(d\ a, q)(l — E(0)), the share of residual losses expected to beincurred directly by the auditee. Unless the entire increase in E(TC)occurs in this unobservable component, which is unlikely,^ monopolypricing will increase an auditee's observable systems costs, or:
vam + pqm > vd + pq.
' For this to occur, it is necessary that £(fi) = 0 and that the entire increase in E{ fC) bein the expected residual loss component.

168 DAN A. SIMUNIC
5. The Effects of Auditor Production Economies onFinancial Reporting Systems
While I 2issume that the factor costs of resources are uniform to allauditors, the production functions of audit firms may nevertheless differ.In the model, production is measured by reduction of expected liabilitylosses. Therefore, allowing for production function differences impliesthat dE(d)/dq may vary across auditors.
If specific auditors enjoy unique economies in production, then thesefirms will earn economic rents, but the characteristics of auditee financialreporting systems, including audit fees, wiU not be affected. Sucb econ-omies are not of interest here. Alternatively, there may exist sources ofeconomies which can be exploited, at least potentially, by more than oneauditor. If there is competition among the auditors who achieve theeconomies, then rents would be bid away and audit prices would decrease.In addition, in equilibrium, auditees would only demand services fromthose auditors who fully achieved the available economies.
The necessary condition for the minimization of expected costs witheconomies is:
_ dE(d) _~~da ^
dE(d) dE(d) c— A = c or = -
dq dq \
where the parameter \ S 1 denotes an auditor's relative efficiency inreducing expected losses. For auditors who achieve economies, X > 1. Iwill denote the auditee's expected cost-minimizing solution with econ-omies as (ae, qe). The characteristics of this solution are the reverse ofthe monopoly results. That is, while p decreases, the sign of the changein audit fee is indeterminate, since the auditee is motivated to substituteq for a and the net change in pq depends on the price elasticity of theimphcit demand function for external auditing. As in the case of monop-oly, unless the entire change occurs in the auditee's share of residuallosses, which is unlikely, then:
rap -I- pq^ < id + pq.
6. Effects of Variations in Assessed Loss Functions
The loss function, E(d) = f(a, q), wiU vary across audit engagements.The assessment of this function by the auditee and auditor can beexpected to reflect all available information, including historic loss expe-riences under similar circumstances. The spatial location of the functionassessed for a specific engagement can be influenced by many factors,including the leged environment and various internal characteristics ofthe engagement, which I call determinants of loss exposure. Possible

PRICING OF AUDIT SERVICES 169
variables which might be associated with such differences are discussedin a later section. At this point, I simply note that a uniform upwarddisplacement of the loss function in the (E(d), a, q) space, that is, greaterloss exposure at any (a, q), increases the marginal benefits from expectedloss reduction and results in expansion of the cost-minimizing financialreporting system. Note that there is no change in relative prices. Rather,the expansion of a and q is complementary. As a result, each of the threecomponents of the auditee's expected total costs, namely, va, pq, andE(d\ a, q)(l — E(S)), can be expected to increase. Finally, this increasein demand for both control resources will occur under any and all of thethree industry scenarios—competition, monopoly, and auditor econo-mies—discussed in the previous sections.
7. Summary of the Model and Development of the Test forCompetition
The implications of the model, in the form of directional changes inthe auditee's decision variables emd related costs, are summarized in table2. The changes described in the first two columns of the table aremeasured against the competitive solution; the last two columns describethe effects of differences in assessed loss functions and the loss-sharingratio. The characteristics of auditee financial reporting systems aregrouped into two categories, unobservable and observable. Included inthe former are the auditee's share of residual losses, the price of auditservices, and the quantities of internal accounting control and externalaudit control which the auditee demands.
TABLE 2Implications of the Model with Respect to Cross-Sectional Differences in the
Characteristics of Auditee Financial Reporting Systems
Unobservable:Auditee's share of residual
losses £(d 1 a, 9)(1 - £(#))Unit price of the audit service
(P)Quantity of internal accounting
control (a)Quantity of external audit con-
trol (g)Ohservable:
Audit fee (pq)
Cost of internal accounting con-trol {va)
Sum (va +pq)
Monopoly ProductionPricing Economies
-H -
-H -
-t- —
— -t-
Depends on implicitprice elasticity of de-mand
-
increase in Audi-tor s onaje ot
Losses
-
-H
none
none
-t-
none-1-
Increase inLoss Exposure
4-
none
+
-1-
-t-
170 DAN A. SIMUNIC
Recall from the assumptions of the model that a and q either can bethought of as generalized quantities of factor inputs or as output con-structs. As outputs, these quantities are not observable. It is the outputconstruct, external audit control, which is priced in the market for auditservices and the price, p, is likewise not observable. Rather, we can onlyobserve the fee, pq. In the case of internal accoimting, there is nointervening output market and thus no market price. However, assumingefficiency in resource use, va and pq are commensurable.
Based on the model, the hypothesis that price competition prevailsthroughout the market for audit services can be tested using the sum ofobservable systems costs, va + pq. Before I develop the test, note thatwhile the Big Eight firms have been accused of monopolizing the marketfor audit services, these firms are also the most hkely to have exploitedavailable economies of scale. Furthermore, scale economies can exist ineither a monopolistic or a competitive market setting. Note also thataudit services may be differentiated. With respect to product differentia-tion, the market for audits is a hedonic market (see Rosen [1974]). Thatis, differentiated products are not observed directly but rather are re-vealed by differences in prices which are associated with differences inobserved product characteristics. In auditing, the principal differentiatingcharacteristic of the service is likely to be the identity of the suppUer,and again it is the Big Eight firms which enjoy visibility and brand-namerecognition among buyers. Thus, the pricing of audit services can beexpected to be complex, and any price differences between Big Eightfirms and other auditors must be interpreted with care.
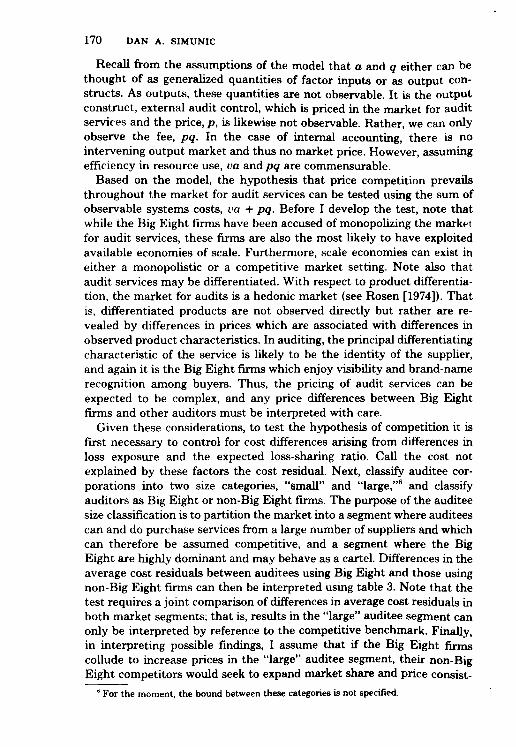
Given these considerations, to test the hypothesis of competition it isfirst necessary to control for cost differences arising from differences inloss exposure and the expected loss-sharing ratio. Call the cost notexplained by these factors the cost residual. Next, classify auditee cor-porations into two size categories, "small" and "large,"* and classifyauditors as Big Eight or non-Big Eight firms. The purpose of the auditeesize classification is to partition the market into a segment where auditeescan and do purchase services from a large number of supphers and whichcan therefore be assumed competitive, and a segment where the BigEight are highly dominant and may behave as a cartel. Differences in theaverage cost residuals between auditees using Big Eight and those usingnon-Big Eight firms c£m then be interpreted using table 3. Note that thetest requires a joint comparison of differences in average cost residuals inboth market segments; that is, results in the "large" auditee segment canonly be interpreted by reference to the competitive benchmark. Finally,in interpreting possible findings, I assume that if the Big Eight firmscollude to increase prices in the "large" auditee segment, their non-BigEight competitors would seek to expand market share and price consist-
' For the moment, the bound between these categories is not specified.

PRICING OF AUDIT SERVICES 171
TABLE 3Test for Competition: Interpretation of Possible Differences in Average Residual Total
Systems Costs of Auditees Using Big Eight versus Non-Big Eight Auditors acrossMarket Segments
Result* for the "Large"Auditee Segment
ResultD for the "Small" Auditee Segment
\(CUE 18) (CRE\»)
(CRE\ai<(CRE\»)
{CRE\S)>(CRE\8)'
(CRE\8)
(CRE\8)<{CRE\S)
Competition with Monopoly pric-differentiated ing by the Bigproduct to the EightBig Eight
Competition withdifferentiatedproduct to theBig Eight to-gether with dis-economies tohon-Big Eightwith "large" au-ditees"
Competition withdifferentiatedproduct to theBig Eight to-gether with dis-economies tonon-Big Eightwith "large" au-ditees
Competitionwithout any scaleeconomies to theBig Eight
Competition withdiseconomies tonon-Big Eightwith "large" au-ditees
Monopoly pric-ing by the BigEight togetherwith scale econ-omies to the BigEight
Monopoly pric-ing by the BigEight togetherwith scale econ-omies to the BigEight
Competition withscale economiesto the Big Eight
* (CRE18) denotes the average residual costs of auditees using a big Eight firm and (CRE \ 8) denotesthe average residual costs of audit«es using a non-Big Eight firm.
* * The combinations wherein the costs of large auditees only are lower when a Big Eight firm is theauditor would be evidence of economies to the Big Eight or diseconomies to the non-Big Eight whenperforming large audits. Note that this is not evidence of economies to auditor size, arising, for example,ftom staff specialization, since the effect is limited to a certain audit context. As a result, I would interpretsuch findings as evidence of diseconomies to smaller auditors when servicing large auditees.
ent with their own cost conditions, rather than to maintain the cartelprice.
8. Control Variables for Differences in Loss Exposure
Little is presently known about sources of variations in liability lossexposure across audit engagements. To obtain some initial insights, Idiscussed the question with Chicago-area representatives of each of theBig Eight firms and with representatives of a number of organizations
172 DAN A. SIMUNIC
writing professional liability insurance coverage for accountants.' Fromthese discussions, the following general factors were identified as possibledeterminants of loss exposure: (a) the size of the auditee, (b) the com-plexity of the auditee's operations, (c) auditing problems associated withcertain financial statement components, especially inventories and re-ceivables, (d) the industry of the auditee, and (e) whether the auditee isa publicly or closely held company. The data for this research wereobtained solely from publicly held corporations and thus were homoge-neous with respect to the last factor. The variables and their measuresused to control for the remaining factors are described below. Eachvariable is assigned a mnemonic name for ease of further reference.
SIZE OF THE AUDITEE
I measured the size of the auditee by the entity's total year end assets(variable name ASSETS). A priori, the stock of assets seems more closelyrelated to possible loss exposure than would an accounting fiow measure,such as revenue, because defective financial statements which result in alawsuit frequently involve some deficiency in asset valuation. In addition,external auditors have traditionally approached the audit process throughthe ending balance sheet, relying on the fact that verification of balancesheet components indirectly verifies reported income. Note also that bothinternal accounting and external auditing are sampling-based processes.To the extent that increases in measured total assets of auditees refiectincreases in the number of individual elements which comprise theaccounting populations of which total assets are composed, then thesample size required to achieve a given level of control will increase at adecreasing rate. Thus, I hypothesized that the positive relationshipbetween ASSETS and both q and a is nonlinear.
COMPLEXITY OF THE AUDITEE'S OPERATIONS
Loss exposure can be expected to increase, the greater the decentrali-zation and diversification of the financial reporting entity. Both of theseaspects of complexity increase the number of decision centers in anorganization whose activities need to be monitored. The recent contro-versy over illegal corporate payments and the resulting internal controlrequirements imposed by the Foreign Corrupt Practices Act reflect theoverall problem of controlling large decentralized organizations.
In this study, I measured decentrahzation by the number of consoli-dated subsidiaries which are included in the auditee's financial statements(variable name SUBS). The diversification of the auditee is measuredusing two variables: (1) the number of Standard Industrial ClassificationSystem two-digit industries in which the auditee operates, less one
' Information was obtained from the following insurers: American Home AssuranceCompany, the St. Paul Companies, Chubb Custom Market, Inc., Crum & Forester InsuranceCompanies, and Lloyd's Underwriters' Non-Marine Association.
PRICING OF AUDIT SERVICES 173
(variable name DIVERS), and (2) by the ratio of the auditee's foreign tototal assets at year-end (variable name FORGN).
RECEIVABLES AND INVENTORIES
Auditors have long recognized that certain accounting populationsinvolve potentially greater loss exposure through the loose notion of"relative audit risk" (see, e.g., Lenhart and Defiiese [1957]). In this sense,both receivables and inventories are "risky" balance sheet components.Specific auditing procedures (confirmation and observation) are recom-mended for these accounts. Moreover, the valuation of these items is acomplex task, requiring a forecast of future events. Liability exposure isthus expected to vary cross-sectionally with the relative size of receivablesand inventories in different auditee badance sheets. To control for thesedifferences, I used the two ratio variables: receivables to total assets atyear-end (variable name RECV) and inventories to total assets at year-end (variable name INV).
PRINCIPAL INDUSTRY OF THE AUDITEE
While loss exposure may well vary with the industry(ies) in which anauditee operates, there is really no basis to hypothesize any specificindustry effects. However, possible differences in q and a associated withindustry classification were also investigated in the sample data.
9. Control Variables for Differences in the Assessed Loss-Sharing Ratio
A plausible, and probably the only measurable, determinant of .E(^) isevidence of auditor or auditee financial distress. Recall that the auditorand auditee are assumed to assess identical distributions on 6. Evidenceof auditor financial distress increases the probability that the realizationof 0 will be = 0; that is, all losses must be paid by the auditee becausethe auditor is insolvent. Thus E(6) would decreeise. Conversely, evidenceof auditee financial distress increases the probability that realized ^ = 1,due to auditee insolvency, and E(d) would increase.
Because public accounting firms are private partnerships, evidencewhich might be used to assess possible financial distress of auditors isdifficult to obtain. As a result, I did not control for this effect.
I used three variables to control for cross-sectional differences in .E(^)arising from auditee financial difficulty. The first is a measure of theauditee's accounting rate of return in the current year, the ratio of netincome to total assets at year-end (variable name PROFIT). E(6) isexpected to increase as the rate of return decreases. Note that rate ofreturn measures have been found useful in bankruptcy studies (e.g..Beaver [1968] and Altman [1968]) for discriminating between "failed"and "nonfailed" firms. The second variable is a (0, 1) variable which was
174 DAN A. SIMUNIC
assigned a value of one if an auditee had incurred a net loss during anyone of the current or two prior fiscal years (variable name LOSS). Finally,I used another (0, 1) variable to identify those auditees who received a"subject to" qualified audit opinion in the current year (variable nameSUBJ). A "subject to" qualification is given when there exist significantuncertainties which may result in future losses to the auditee. In theUnited Kingdom, Firth [1978] found that the issuance of an opinion formequivsdent to a "subject to" (namely, "asset valuation" and "going con-cern" qualifications) by a U.K. auditor had a significant negative impacton the market price of the auditee's securities. Thus, the conditions whichunderlie the issuance of a "subject to" opinion were hypothesized toaffect the assessment of E(6) such that E(0) increases when SUBJ takeson a vedue of one.
10. Differences in Auditor Production Functions
There has been essentially no previous research in the area of auditorproduction functions and sources of production economies. In my study,I did not investigate directly any specific sources of economies to scale.Rather I inferred the presence of some unspecified economies to firm sizeif, as described in table 3, the residual systems costs of "small" companiesusing Big Eight auditors were, on average, lower than the costs of "small"companies using non-Big Eight auditors.* The argument is analagous toa test for scale economies based on the survivor principle (see Stigler[1968]), in that the current state of the industry might arise from anynumber of factors which increase the relative efficiency of the Big Eightfirms.
I did, however, control for the possible source of production functiondifferences across engagements brought about by reductions in q becauseof auditor learning over time. The reduction of cumulative average coststhrough learning during successive performances of a task has beenobserved in several physical production situations. A similar phenomenoncan be expected in auditing if the auditee employs a given auditor for anumber of years. Normally, the effects of learning would be measuredusing time series of production and cost data. But, a learning effect canalso be observed in a cross-section of audit fees if the effect is sufficientlylarge and the length of auditee/auditor association varies in the sample.To control for possible differences in q from this source, I included as acontrol variable the number of years an auditee has used its current
' To infer the presence of scale economies to the Big Eight, it is both necessary andsufficient that (CRE \ 8) < (CRE 18) in the competitive market segment. Of course, if theBig Eight do not price as a cartel, then the same relationship would be obser\ed in themarket segment for "large" audits.

PRICING OF AUDIT SERVICES 175
auditor (variable name TIME).^ The relationship between TIME and qwas hypothesized to be negative.
11. Measurement of the Dependent Variables
The auditee's total observable systems costs consist of the two com-ponents, va and pq. Since the audit fee is a payment made in a markettransaction, measurement of pq was relatively straightforward. Thiselement of total cost is denoted by the variable named FEE.
Identification and measurement of the empirical counterpart of the vacomponent was substantially more difficult. From the model, note thatinternal accounting resources sure only relevant to a test for competitionamong external auditors if the (a, q) resources are substitutable. In orderto obtain a relevant measure of va for purposes of this study, it wassufficient to identify and measure those elements of internal systemscosts which could reasonably be substituted for external audit services.Based on this argument, I measured va using the salaries paid by theauditee to its internal auditors. This element of total cost is denoted bythe variable named ICOST.
WhUe the test for competition is based on residual differences in thesum of FEE + ICOST, the individual components may differ in degreeof measurement error and are each of interest. Therefore, in the analyseswhich foUow, I examine the behavior and determinants of the separatecomponents as well as of the sum.
The variables, their measures, and hypothesized relationships aresummarized in table 4. The average residual difference in the systemscosts of auditees across the two auditor classes is measured by thecoefficient of a (0, 1) variable named AUDITOR which is assigned avalue of one when the auditor is a Big Eight firm. The questionnaire usedto obtain data on these variables is available on request.
12. Design and Results of the Survey
The basis for the survey was the list of publicly held corporations andtheir auditors comprising the 1976 edition of Who Audits America? Thislist includes 8,077 companies classified by sales volume and auditoridentity. A stratified sample of 1,207 companies was contacted during1977 througb a questionnaire mailed to a principal financial officer of thecorporation. The size of the sample was based on an informal assessmentof the marginal benefits-costs of sampling and an expected response rateof 30 to 40 percent.'° The sample is stratified by size of auditee (companies
' As learning occurs, an external auditor becomes relatively more efficient in reducingIcsses and, from the model, the auditee is motivated to substitute q for a. However,
• adjusting a cont(ol system is probably costly, and I do not expect to observe nor do I controlfor this effect in the empincal work.
™ The response rate to the Financial Executive Institute's audit fee survey of its memberswas 41 percent (Hobgood and Sciarrino [1972]).

176 DAN A. SIMUNIC
TABLE 4Summary of Variables and Hypothesized Relationships
NameRelationship to Auditee's Sys-
tenis Cost Component
FEE ICOST
Control variables for differences in lossexposure:
1. Total assets at year-end ASSETS2. Number of consolidated subsidiaries SUBS3. Number of two-digit SIC industries DIVERS
in which auditee operates, less one4. Foreign assets •>- total assets at year- FORGN
end5. Accounts, loans, and notes receivable RECV
+ total assets at year-end6. Inventories -s- total assets at year-end INV
Control vsuriables for differences in theassessed loss-sharing ratio:7. Net income - total assets PROFITS8. (0, 1) variable where (1) if auditee LOSS
incurred loss in any of last three fiscalyears
9. (0, 1) variable where (1) if auditee SUBJreceived a "subject to" qualified opin-
-+
N/A
N/A
N/A
Control variable for differences in auditorproduction functions:10. Number of years auditee has used TIME
current auditor
Auditor identity:11. (0, 1) variable where (1) if auditor is AUDITOR
a Big Eight firm
Dependent variables:12. Amount ofcurrent year's external au- FEE
dit fee13. Salaries paid to internal auditors in ICOST
current year
N/A
any—see table 3
with sales less than $125 million versus those with sales greater than thatamount) and by auditor group (Big Eight firm versus non-Big Eightfirm). The "small" auditee segment was bounded at $125 miUion, sincethe marginal Big Eight market share for clients of this size and largerapproaches 90 percent. Thus the hypothesis that competition prevails inthe market for audits of companies greater than about this size becomesdifficult to maintain, a priori."
" That is, a market share this large would surely be sufficient evidence, to a believer inthe "concentration doctrine," that the market segment was not competitive. Even a smaller
PRICING OF AUDIT SERVICES 177
T A B L E 5Responses by Stratum
Big Eight auditor:Sample requestsUsable responsesResponse rate
Non-Big Eight auditor:Sample requestsUsable responsesResponse rate
All auditors:Sample requestsUsable responsesResponse rate
Small Auditees (salesless than $125 miUion)
33311735%
3267021%
65918729%
Large Auditees(sales greater than
1125 million)
42517240%
1233831%
548210
37%
All Auditees
758289
38%
44910824%
1207397
33%
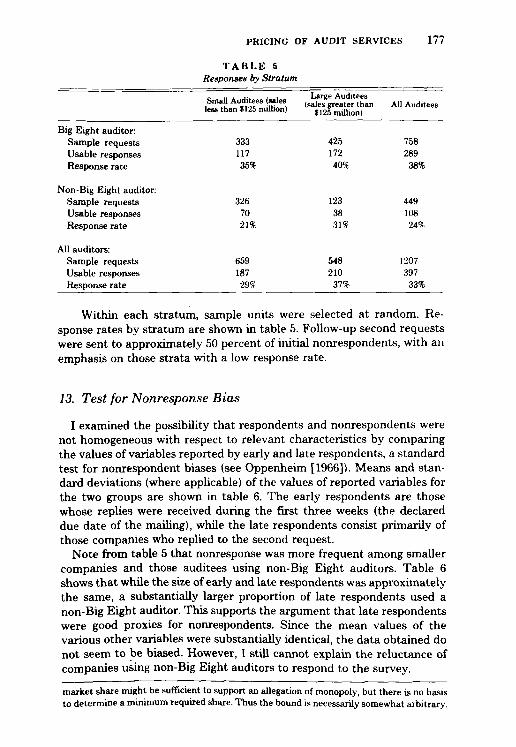
Within each stratum, sample units were selected at random. Re-sponse rates by stratum are shown in table 5. FoUow-up second requestswere sent to approximately 50 percent of initial nonrespondents, with anemphasis on those strata with a low response rate.
73. Test for Nonresponse Bias
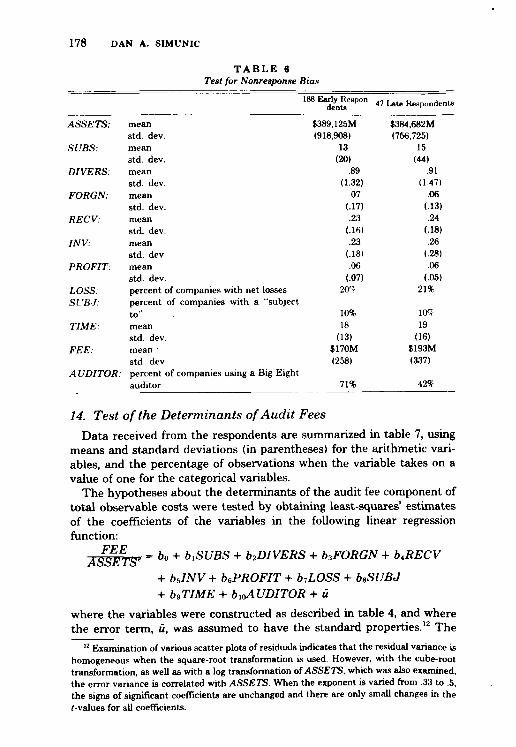
I examined the possibility that respondents and nonrespondents werenot homogeneous with respect to relevant characteristics by comparingthe vedues of variables reported by early and late respondents, a standardtest for nonrespondent biases (see Oppenheim [1966]). Means and stan-dard deviations (where applicable) of the values of reported variables forthe two groups are shown in table 6. The early respondents are thosewhose replies were received during the first three weeks (the declareddue date of the mailing), whUe the late respondents consist primarily ofthose companies who replied to the second request.
Note from table 5 that nonresponse was more frequent among smallercompanies and those auditees using non-Big Eight auditors. Table 6shows that while the size of early and late respondents was approximatelythe same, a substantially larger proportion of late respondents used anon-Big Eight auditor. This supports the argument that late respondentswere good proxies for nonrespondents. Since the mean values of thevsunous other variables were substantially identical, the data obtained donot seem to be biased. However, I still cannot explain the reluctance ofcompanies using non-Big Eight auditors to respond to the survey.
market share might he sufficient to support an allegation of monopoly, but there is no basisto determine a minimum required share. Thus the bound is necessarily somewhat arbitrary.
178 DAN A. SIMUNIC
TABLE 6Test for Nonresponse Bias
"'Late Respondents
ASSETS:
SUBS:
DIVERS:
FORGN:
RECV:
INV:
PROFIT:
LOSS:SVBJ:
TIME:
FEE:
AUDITOR:
meanstd. dev.meanstd. dev.meanstd. dev.meanstd. dev.meanstd. dev.meanstd. dev.meanstd. dev.percent of companies with net lossespercent of companies with a "subjectto"meanstd. dev.mean •std. dev.percent of companies using a Big Eightauditor
$389,125M(918,908)
13(20)
.89(1.32)
.07(.17).23
(.16).23
(.18).06
(.07)2O''r
10%18
(13)$170M(258)
71%
$384,682M(756,725)
15(44)
.91(1.47)
.06(.13).24
(.18).26
(.28).06
(.05)21%
lO^r
19(16)
$193M(337)
42%
14. Test of the Determinants of Audit FeesData received from the respondents are summarized in table 7, using
means and standard deviations (in pju-entheses) for the arithmetic vari-ables, and the percentage of observations wben the variable takes on avalue of one for the categorical variables.
The hypotheses about the determinants of the audit fee component oftotal observable costs were tested by obtaining least-squares' estimatesof the coefficients of the variables in the following linear regressionfunction:
= bo + biSUBS + biDIVERS + bsFORGN + b.RECV
-I- bJNV + bePROFIT + b7L0SS + bsSUBJ+ bc,TIME + bioAUDITOR + u
where the variables were constructed as described in table 4, and wherethe error term, «, was assumed to have the standard properties.'^ The
" Examination of various scatter plots of residuals indicates that the residual variance ishomogeneous when the square-root transformation is used. However, with the cube-roottransformation, as well as with a log transformation of ASSETS, which was also examined,the error variance is correlated with ASSETS. When the exponent is varied from .33 to .5,the signs of significant coefficients are unchanged and there are only small changes in the(-values for all coefficients.

PRICING OF AUDIT SERVICES 179
TABLE 7Descriptive Statistics for Variables
FEE
ICOST
ASSETS
SUBS
DIVERS
FORGN
RECV
INV
PROFIT
LOSSSUBJTIME
AUDITOR
397 TotalOhservation«
$206.6M(277.1)$I12.0M(271.0)$555.1MM
(1,194.5)16.9
(30.5).9
(1.4).07
(.15).23
(.17).23
(.19).06
(.06)16.3%8.0%
19.0 yrs.(15.2)72.5%
By Auditee Size
187 Auditeeswith SalesLess Than
tI25 million
$77.1M(71.4)$29.0M(83.0)
$176.7MM(640.7)
7.0(13.9)
.6(.9).05
(.11).24
(.18).25
(.21).06
(.08)25.7%8.5%
13.7 yrs.(12.0)62.0%
210 Auditeeswith Sales
Greater Than$126 million
$322.0M(355.0)$202.8M(361.8)$891.9MM
(1,147.7)25.6
(37.8)1.3
(1.6).11
(.17).18
(.11).23
(.17).06
(.04)8.1%7.6^r
23.8 yrs.(16.1)82.0%
By Auditor Group
fiVi AiiHiti iiRbO^ nuuiiees
ig u or
$226.6M(266.9)$141.0(308.2)$695.6MM
(1,311.8)18.1
(31.1)1.0
(1.4).08
(.15).23
(.17).20
(.17).06
(.04)13.8%8.0%
19.9 yrs.(15.8)100.0%
108 AuditeesUsing a Non-
Big Eight Audi-tor
$153.0M(297.2)$ 45.5M(134.2)$178.9MM(672.8)
13.4(28.8)
.7(1.1)
.05(.11).23
(.14).29
(.23).07
(.08)23.1%
9.3%16.6 yrs.
(12.9)0.%
dependent variable was deflated by some power transformation of AS-SETS, denoted ASSETS', in order to linearize the FEE = g(ASSETS)relationship. I used a power transformation because, in the absence of atheory from which the form of the function, g, can be derived, theexponent for a power transformation can readily be estimated. Thus, ifFEE = wASSETS'v, then In FEE = In w + e(ln ASSETS) + In v, anda least-squares estimate of the exponent is simply the e in the regressionof In FEE on In ASSETS.
Note that by using size-defiated audit fees as the dependent variable,an implicit interaction is assumed between ASSETS' Jind each of theindependent variables and the error term in the determination of theobserved undeflated value of FEE. That is, the effect of each of theindependent variables in the regression function was assumed to beconditional on auditee size.
Using this approach, the residt of the first step in the data analysisyielded a regression of In FEE on In ASSETS of:

180 DAN A. SIMUNIC
In FEE = 3.33 -t- .45(ln ASSETS)
^ = 9.1 t = 22.7
R' = .57
n = 397 observations.
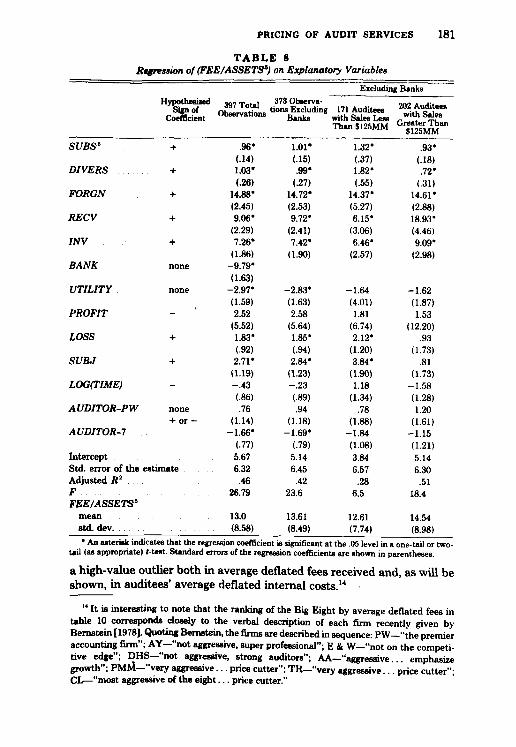
Taken alone, the variable ASSETS is a very significant determinant ofthe audit fee, with a nonlinear relationship, as hypothesized. While theestimated exponent for the ASSETS transformation is .45, the test of thedeterminants of the ratio, FEE/ASSETS', may be sensitive to thespecific transformation which is used. Therefore, I fitted the regressionfunction using both a somewhat larger exponent value of .5 (a square-root transformation) and a somewhat lower value of .33 (a cube-roottransformation). The best results were obtained with a .5 exponent andare shown in table 8. However, overall results were not sensitive to thisvariation in the exponent.'^
Table 8 shows the regression coefficients, their standard errors (inparentheses), and various regression statistics. Coefficients which aresignificant at the .05 level in a one-tail or two-tail t-test (as appropriate)are marked with an asterisk. The correlation matrix of the variables isdisplayed in table 9. Column 1 of table 8 includes aU usable observations,whUe the last three columns, which are relevant to the test for competi-tion, exclude twenty-four responses received from banks (SIC code 60).Bank respondents were excluded from the test both because none of thebanks in the sample was audited by a non-Big Eight firm, and they wereouthers with uniformly very low vedues for the dependent variable. Thecoefficient for the variable BANK in column 1 is for a (0, 1) variable(given assigned a value of one for these twenty-four respondents).
Examination of the data also revesded that the dependent variable wassystematically low for public utility companies (SIC code 49). However,the twenty-two utilities in the sample were audited both by Big Eightand non-Big Eight firms. Thus, I included in the regression another (0, 1)variable, denoted UTILITY, whose observations were retained for thetest of competition. In addition, a power transformation (using a .5exponent) of the variable SUBS and a log transformation of the variableTIME helped to linearize the fitted function.
A final modification of the regression function, made after a preliminaryexamination of the data, was to partition the Big Eight firms into the twogroups. Price Waterhouse & Co. ((0, 1) variable named AUDITOR-PW)and the remaining seven firms ((0,1) variable named i4[7D/T'O/?-7). Thiswas done because, as shown in table 10, the average value of thedependent variable varied across the Big Eight, with Price Waterhouse
" This is the hypothesized specification of the fimction. As explained below, certain ex-post modifications of the regression function were made after a preliminary analysis of thedata.
PRICING OF AUDIT 8ERVICES 181
TABLE 8Stgression of (FEE/ASSETS') on Explanatory Variables
SUBS'
DIVERS
FORGN
RECV
INV
BANK
UTILITY
PROFIT
LOSS
SUBJ
LOG(TIME)
AUDITOR-PW
AUDITOR-!
InterceptStd. error of theAdjusted R'FFEE/ASSETS'
meanstd. dev
Sign ofCoeincien
+
-f
+
none
none
-
+
-
none-(- o r -
estimate
"* 397 TotalObservations
.96*(.14)1.03*(.26)
14.88*(2.45)9.06*
(2.29)7.26*
(1.86)-9.79*(1.63)
-2.97*(1.59)2.52
(5.52)1.83*(.92)2.71*
(1.19)- .43(.86).76
(1.14)-1.66*
(.77)5.676.32
.4626.79
13.0(8.58)
373 ObMrva-tions Excluding
Banks
1.01*(.15).99*
(.27)14.72*(2.53)9.72*
(2.41)7.42*
(1.90)
-2.83*(1.63)2.58
(5.64)1.85*(.94)2.84*
(1.23)- .23(.89).94
(1.18)-1.69*
(.79)5.146.45
.4223.6
13.61(8.49)
Excluding Banks
171 Auditeeswith Sales LessThan $125MM
1.32*(.37)1.82*(.55)
14.37*(5.27)6.15*
(3.06)6.46*
(2.57)
-1.64(4.01)1.81
(6.74)2.12*
(1.20)3.84*
(1.90)1.18
(1.34).78
(1.88)-1.84(1.08)3.846.57
.286.5
12.61(7.74)
202 Auditeeswith Sales
Greater Than$125MM
.93*(.18).72*
(.31)14.61*(2.88)18.93*(4.46)9.09*
(2.98)
-1.62(1.87)1.53
(12.20).93
(1.73).81
(1.73)-1.58(1.28)1.20
(1.61)-1.15(1.21)5.146.30
.5118.4
14.54(8.98)
* An asterisk indicates that the regression coefficient is significant at the .05 level in a one-tail or two-tail (as appropriate) (-test. Standard errors of the regression coefficients are shown in parentheses.
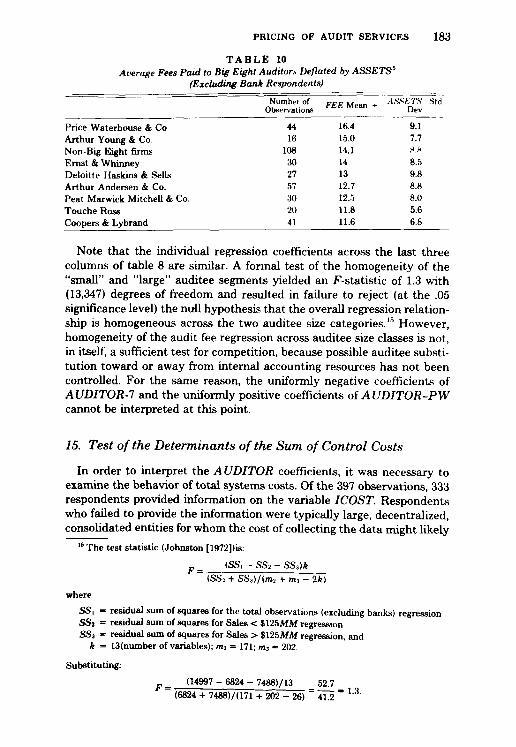
a high-value outlier both in average deflated fees received and, as will beshown, in auditees' average deflated internal costs."
" It is interesting to note that the ranking of the Big Eight by average deflated fees intable 10 corresponds closely to the verbal description of each firm recently given byBemstein [1978]. Quoting Bernstein, the firms are described in sequence: PW—"the premieraccounting firm"; AY—"not aggressive, super professional"; E & W—"not on the competi-tive edge"; DHS—"not aggressive, strong auditors"; AA—"aggTessive... emphasizegrowth"; PMM—"very aggressive... price cutter"; TR—"very aggressive... price cutter";CX—"most aggressive of the eight... price cutter."

182 DAN A. SIMUNIC
w
n .h a
i!
§1
I
r • r
S m -v a ^ m ^ t.-qp
' ' ' ' \' \ ' \' \'
o
1
s1
$1
§1
1
B
s
o
1 1
s1
I I I I I
I I
cq o o —
CO «3
!§55
PRICING OF AUDIT SERVICES 183
TABLE 10Average Fees Paid to Big Eight Auditors Deflated by ASSETS"
(Excluding Bank Respondents)
Price Waterhouse & CoArthur Young & Co.Non-Big Eight firmsEmst & WhinneyDeloitte Haskins & SellsArthur Andersen & Co.Peat Marwick Mitchell & Co.Touche RossCoopers & Lybrand
Number ofObservations
4416
108302757302041
FEE Mean -^
16.415.014.1141312.712..511.811.6
ASSETS • .StdDev
9.17.78.8
8.59.88.88.05.66.8
Note that the individual regression coefficients across the last threecolumns of table 8 are similar. A formal test of the homogeneity of the"small" and "large" auditee segments yielded an F-statistic of 1.3 with(13,347) degrees of freedom and resulted in failure to reject (at the .05significance level) the nuU hypothesis that the overall regression relation-ship is homogeneous across the two auditee size categories.'^ However,homogeneity of the audit fee regression across auditee size classes is not,in itself, a sufficient test for competition, because possible auditee substi-tution toward or away from internal accounting resources has not beencontrolled. For the same reason, the uniformly negative coefficients ofAUDITOR-! and the uniformly positive coefficients of AUDITOR-PWcannot be interpreted at this point.
15. Test of the Determinants of the Sum of Control Costs
In order to interpret the AUDITOR coefficients, it was necessary toexamine the behavior of total systems costs. Of the 397 observations, 333respondents provided information on the variable ICOST. Respondentswho failed to provide the information were typically large, decentralized,consohdated entities for whom the cost of collecting the data might likely
" The test statistic (Johnston [1972])is:
^ _ (SS, - SS2 - SSM
(SS2 -t- SS3)/(m2 -t- ms - 2*)
where
SS, = residual sum of squares for the total observations (excluding banks) regressionSSi = residual sum of squares for Sales < $125MAf regressionSS3 = residual sum of squares for Sales > $125MAf regression, and
* = 13(ntimher of variables); m; = 171; mj = 202.
Substituting:
p ^ (14997 - 6824 - 7488)/13 _ 52.7
(6824 - 7488)/(171 -h 202 - 26) " i T S ° ' ^
184 DAN A. SIMUNIC
be high. Of the 333 complete responses, nineteen were from banks, whichreduced the available observations for the test of competition to 314.
Proceeding as in the analysis of the audit fee data, the regression ofln(FEE H- ICOST) on in(ASSETS) yielded an estimated slope coeffi-cient, e, of .55. This vjdue is sufficiently close to one-half to justify use ofthe square-root transformation of ASSETS as the size deflator for eachcost component, and thus for their sum.
The least-squares' estimates of the coefficients of the variables in thelinear regression function:
FEE -I- ICOST= bo -t- biSUBS -(- biDIVERS
ASSETS'
-t- b.FORGN -I- b,RECV-^• bJNV
H- bePROFIT -)- b.LOSS -t- bsSUBJ
-H b^TIME -I- buyAUDITOR-PW
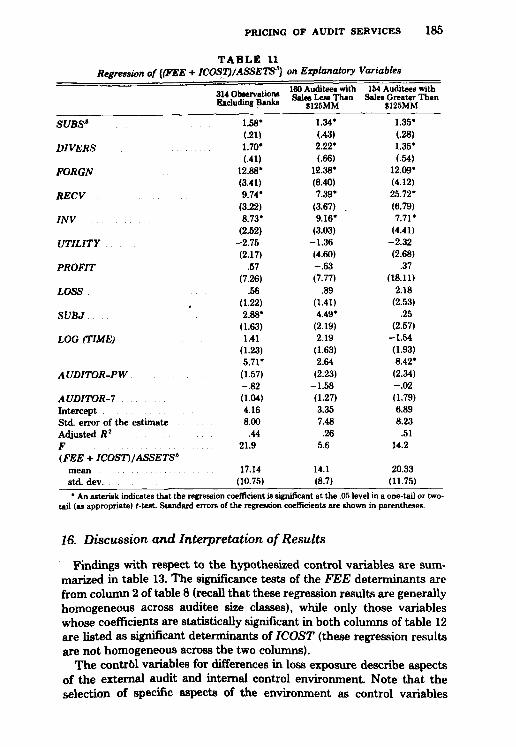
-H buAUDITOR-7 -I- bnUTILITY -\- uare displayed in table 11, together with various regression statistics. As intable 8, the standard errors of the coefficients are shown in parentheses,while coefficients which are significant at the .05 level are marked withan asterisk. In these results, the sets of auditor coefficients are of principalinterest, with the remaining variables included solely for purposes ofcontrol.
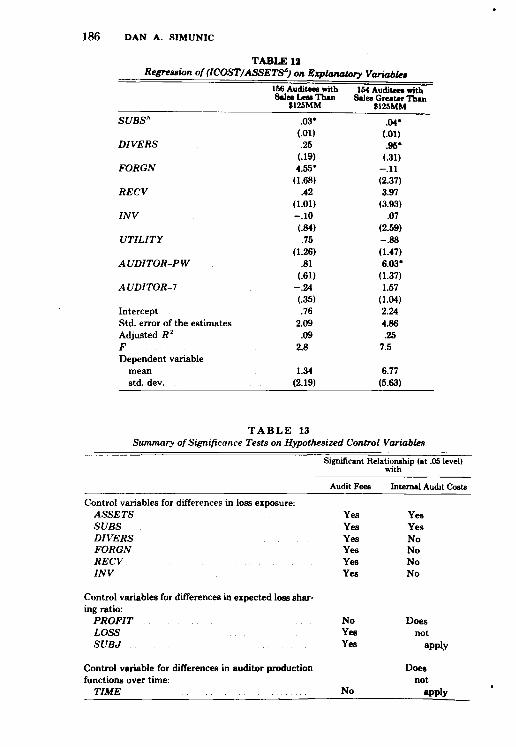
Finally, for completeness, I display in table 12 the least-squares' coef-ficient estimates of the variables hypothesized to be determinants ofICOST. The regression function is:
ICOSTbo -H biSUBS -I- b2DIVERS -I- b^FORGNASSETS'
-t- biRECV-i- bJNV+ bJkUDITOR-PW
+ biAUDITOR-! -\- b^UTILITY + u.
Results are presented using the same format as in table 11. Four obser-vations were deleted from column 1 as outliers, representing very smallcompanies who used some internal auditors with very high values for theconstructed dependent variable.
A scan of table 12 shows that the regression results are, on the whole,unsatisfactory. The low adjusted R' and the lack of significance andinconsistent signs of many of the control variables suggest that thedeterminants of ICOST are not correctly specified and/or that there issignificant error in the measurement of this variable.
PRICING OF AUDIT SERVICES
TABLE URegression of {(FEE + ICOST^/ASSETS') on Explanatory Variables
185
SUBS'
DIVERS
FORGN
RECV
INV
UTILITY
PROFIT
LOSS
SUBJ
LOG (TIME)
AUDITOR-PW
AUDITOR-!InterceptStd. error of the estimateAdjusted R'F(FEE -t- ICOSTl/ASSETS^
meanstd. dev.
Excluding Banks
1.58*(.21)1.70*(.41)
12.88*(3.41)9.74*
(3.22)8.73*
(2.52)-2.75(2.17)
.57(7.26)
.56(1.22)2.88*
(1.63)1.41
(1.23)5.71*
(1.57)- .82(1.04)4.168.00
.4421.9
17.14(10.75)
160 Auditees withSales Less Than
$12SMM
1.34*(.43)2.22*(.66)
12.38*(6.40)7.39*
(3.67) .9.16*
(3.03)-1.36(4.60)- .63(7.77)
.89(1.41)4.49*
(2.19)2.19
(1.63)2.64
(2.23)-1.58(1.27)3.357.48
.265.6
14.1(8.7)
154 Auditees withSales Greater Than
$125MM
1.35*(.28)1.35*(.54)
12.09*(4.12)25.72*(6.79)7.71*
(4.41)-2.32(2.68)
.37(18.11)
2.18(2.53)
.25(2.57)
-1.54(1.93)8.42*
(2.34)- .02(1.79)6.898.23
.5114.2
20.33(11.75)
* An asterisk indicates that the regression coefficient is significant at the .05 level in a one-tail or two-tail (as appropriate) (-test. Standard errors of the regression coefficients are shown in parentheses.
16. Discussion and Interpretation of Results
Findings with respect to the hypothesized control variables are sum-marized in table 13. The significance tests of the FEE determinants arefrom column 2 of table 8 (recall that these regression results are generallyhomogeneous across auditee size classes), while only those variableswhose coefficients are statistically significant in both columns of table 12are listed as significant determinants of ICOST (these regression resultsare not homogeneous across the two columns).
The contr61 variables for differences in loss exposure describe aspectsof the external audit and internal control environment. Note that theselection of specific aspects of the environment as control variables
186 DAN A. SIMUNIC
TABLE 12Regression of (ICOST/ASSETS^) on Explanatory Variables
SUBS''
DIVERS
FORGN
RECV
INV
UTILITY
AUDITOR-PW
AUDITOR-!
InterceptStd. error of the estimatesAdjusted R^FDependent variable
meanstd. dev.
166 Auditaea withSales Leaa Than
$125MM
.03*(.01).25
(.19)4.55*
(1.68).42
(1.01)- .10(.84).75
(1.26).81
(.61)- .24(.35).76
2.09.09
2.8
1.34(2.19)
154 Auditees withSales Greater Thwi
$125MM
.04*(.01).95*
(.31)- .11(2.37)3.97
(3.93).07
(2.59)- .88(1.47)6.03*
(1.37)1.57
(1.04)2.244.86.25
7.5
6.77(5.63)
T A B L E 13Summary of Significance Tests on Hypothesized Control Variables
Control variables for differences in loss exposure:ASSETSSUBSDIVERSFORGNRECVINV
Control variables for differences in expected loss shar-ing ratio:
PROFITLOSSSUBJ
Control variable for differences in auditor productionfunctions over time:
TIME
Significant Relationship (at .05 level)with
Audit Fees
YesYesYesYesYesYes
NoYesYes
No
Internal Audit Costs
YesYesNoNoNoNo
Doesnot
apply
Doesnot
apply
PRICING OF AUDIT SERVICES 187
follows from the hypothesis that avoidance of third-party liability lossesmotivates the design of auditee control systems. The fact that all variablesin this group (namely, ASSETS, SUBS, DIVERS, FORGN, RECV, andINV) are statistically significant determinants of audit fees supports thedescriptive validity of this hypothesis with respect to the external auditcomponent of the system. However, the same variables are far lesssuccessful in explaining cross-sectional variation in internal audit costs.The latter result may indicate either that liability avoidance is not aprimary motivator in the design of internal systems, or the presence ofsignificant measurement problems.
The quantity of internal accounting control relevant to external finan-cial reporting is a construct in the model whose empirical counterpartcan only be measured with substantial error. For example, internalauditors are likely to be involved both in the verification of financial datafor external reporting and in monitoring operating efficiency and theadherence to general management policies. Since the principal benefitfrom these other activities is not liability avoidance, a failure to separatethese costs by various internal audit activities leads to misspecification ofthe regression function for observed internal audit costs. Although furtherresearch on this problem is necessary, the overall results reported herenevertheless do not support a rejection of the hypothesis that liabilityavoidance drives the design of financial reporting systems.
The control variables for differences in the assessed loss-sharing ratiorepresent alternative measures of auditee financial distress. The insignif-icance of the PROFIT variable and significance of the two categoricalvariables, LOSS and SUBJ, suggest that E(d) and therefore p do notvary continuously with the profitability of auditees. Rather, the auditor'sexpected share of residual liability losses seems to increase only withevidence of significant deterioration in the auditee's operations or pros-pects.
The fact that audit fees were not found to vary systematicaUy withTIME could indicate either that learning effects were "swamped" by thenoise in a cross-section, or that auditors pursue multi-period pricingpolicies, in that they average the expected cost reduction of learning overtime. With such policies, lesumng effects could not be observed in feedata.
For the test of competition, the test statistics are the AUDITORcoefficients in table 11, interpreted using table 3. For both "large" and"small" auditees and for the observations in total, the AUDITOR-!coefficients are not significantly different from zero. Thus, the hypothesisthat price competition prevails throughout the market for audits ofpublicly held companies cannot be rejected. Indeed, since average feesfor audits by seven of the dominant firms are lower throughout themarket than the fees of their non-Big Eight competitors (table 8) and thefact that coefficients of AUDITOR-! in table 11 stiU tend to be negative.

188 DAN A. SIMUNIC
the results suggest that the Big Eight firms enjoy scale economies whichare passed on as lower prices to auditees. This is obviously an importantissue which deserves further research.
Finally, with respect to Price Waterhouse & Co. (PW), the significantlypositive coefficient of AUDITOR-PW in column 1 of table 11, which isconsistent across auditee size classes, indicates that the clients of thisfirm, on average, use higher cost control systems. However, this is notevidence of monopoly pricing by PW, since the obvious and best substi-tute for a PW audit is not the employment of additional internal auditors,but rather an external audit by some other Big Eight firm. Note thatboth the separate audit fee (from table 8) and internal cost components(from table 12) are differentially greater for PW auditees. In the regres-sions, the PW classification vsu-iable may be a proxy for omitted variablesdescribing certain unknown differentiating characteristics of PW cUentswhich affect the quantities (a, q) demanded by these companies. Thus,auditees using PW may demand control systems of greater than averagequsdity. Alternatively, the significantly positive coefficient of 4 UDITOR-PW (relative to A UDITOR-!) in table 8 may represent a price differencepaid by auditees for a differentiated service. That is, a PW audit maypossess some utility-bearing characteristics to auditees which commanda positive implicit price in the market. While it is not possible todistinguish between the two interpretations, clearly PW, PW chents, orboth are somehow differentiated from other class members.
17. Concluding Comments
One of the impediments to understanding the audit service is theambiguity of the relationship between auditors, audited companies, andexternal financial statement users. Auditors are exhorted, in their codesof ethics, for exeunple, to be independent and objective; yet they are hiredand compensated by auditees. The finding of the Commission on Audi-tors' Responsibilities [1978] that "many users appear to misunderstandthe role of the auditor and the nature of the service he offers" is thereforenot surprising.
In the positive model of auditing developed in this paper, the essentialinterdependence of the auditee's and auditor's economic interests isrecognized. The model allows for auditor independence in the sense thatthe auditor implements ^ as a complement to the internal accountingsystem, a. An auditee demands a positive quantity of auditing becauseexternal auditors have some advantage (relative to internal systems) incertain aspects of control. In the model, therefore, em auditor is indepen-dent in the same sense as is any supplier of a service who seeks compe-tently to perform a task demanded by a customer. The auditee andauditor are not always adversaries. Although their economic interestsmay diverge in ex-post htigation, as each tries to minimize losses, thehypothesis regarding liability avoidance motivation implies that, at the

PRICING OF AUDIT SERVICES 189
time of the audit, there is a mutuality in the auditee's and auditor'sprivate interests vis-a-vis the external world.
The question of whether the avoidance of third-party liability is adominant source of expected benefits which drives the design of auditeefinancial reporting systems is an important one because of a possibleexternality which can thereby result. Expected liability losses are aprivate cost, and the legal system is the screen through which lossessuffered by third parties are filtered. An alternative would be to force theauditee to internalize expected losses to users by relating the quality ofcontrol system design to the market valuation of the auditee's firm. Inthat way, variations in the quality of control systems as perceived by themarket would affect the risk-return characteristics of auditees' securities.Note, however, that currently neither internal control costs nor externalaudit fees are information which is publicly available to market agents.Thus, under current arrangements, market reaction to alternative sys-tems designs can only be a tenuous auditee motivator, at best. TheSecurities and Exchange Commission recently did propose a requirementthat management disclose and discuss weaknesses in its internal controls.But in the final version of Accounting Series Release No. 250, the SECwithdrew a proposed rule that external audit fees be disclosed. Oneargument in support of required disclosure of audit fees could be theavoidance of potential externalities, to the extent that the audit fee is agood measure of the quality of auditing purchased.
Finally, the failure to reject the hypothesis that price competitionprevails throughout the market for audits of publicly held companiessuggests that observed differences in Big Eight concentration across themarket may be essentially irrelevant. That is, concentration statistics, bythemselves, cannot support the allegation that the Big Eight firms aremonopolizing the market for audit services.
REFERENCES
ALTMAN, E. "Financial Ratios, Discriminant Analysis and the Prediction of CorporateBankruptcy." Journal of Finance (September 1968): 589-609.
BEAVER, W. Market Prices, Financial Ratios, and the Prediction of Failure." Journal ofAccounting Research (Autumn 1968): 179-92.
BERNSTEIN, P. "Competition Comes to Accounting." Fortune (July 17, 197H): 89-96.COMMISSION ON AUDITORS' RESPONSIBILITIES. Report. Conclusions, and Recommenda-
tions. New York: Commission on Auditors' Responsibilities, 1978.DEMSETZ, H. The Market Concentration Doctrine. Stanford, Calif.: American Enterprise
Institute-Hoover Institute on War, Revolution and Peace, 1973.DEMSKI, J., AND R. SWIERINGA. "A Cooperative Formulation of the Audit Choice Problem "
The Accounting Review (July 1974): 506-13.FIRTH, M. "Qualified Audit Reports: Their Impact on Investment Decisions." The Account-
ing Review (July 1978): 642-50.HARRIS, S. P. Who Audits America? Menlo Park, Calif.: Spencer P. Harris, 1976.HOBGOOD, G., AND J. SCIARRINO. "Management Looks at Audit Services" Financial
Executive (Apnl 1972): 26-32.JOHNSTON, J. Econometric Methods. 2d ed. New York: McGraw-Hill, 1972.
190 DAN A. SIMUNIC
LENHART, N., AND P. DEFLIESE. Montgomery's Auditing. 8th ed. New York: Ronald Press,1957.
OPPENHEIM, A. M. Questionnaire Design and Attitude Measurement. New York: BasicBooks, 1966.
ROSEN, S. "Hedonic Prices and Implicit Markets: Product Differentiation in Pure Compe-tition." Journal of Political Economy (January 1974): 34-55.
STICLEB, G. "The Economies of Scale." Reprinted in The Organization of Industry.Homewood: Richard D. Irwin, 1968.
SUBCOMMITTEE ON REPORTS, ACCOUNTING AND MANAGEMENT OF THE COMMISSION ONGOVERNMENT OPERATIONS, UNITED STATES SENATE. The Accounting Establishment:A Staff Study. Washington, D.C.: Government Printing Office, 1977.
UNITED STATES OFFICE OF MANAGEMENT AND BUDGET. Standard Industrial Classifica-tion Manual. Washington, D.C.: Government Printing Office, 1972.
WEISS, L. "Quantitative Studies in Industrial Organization." In Frontiers of QuantitativeEconomics, edited by M. D. Intriligator. Amsterdam: North-Holland Puhlishing Co.,1971.