Embed Size (px)
Citation preview

International Journal of Academic Research in Economics and Management Sciences Sep 2014, Vol. 3, No. 5
ISSN: 2226-3624
129 www.hrmars.com
The Prediction of Corporate Social Responsibility Impact on Competitive Advantage: An Artificial
Neural Network Approach
Sami Abdullah Albahussain
Associate Professor of Business Administration, Head of Department of Business Administration, College of Business Administration, University of Dammam, Saudi Arabia
Wael Hassan El-Garaihy Head, Department of Business Administration, College of Applied Studies and Community Service, University of Dammam, Saudi Arabia & Seconded by University of Port Said, Egypt
Abdel-Kader Mohamed Mobarak
Professor, Head of Marketing Department, College of Applied Studies and Community Service, University of Dammam, Saudi Arabia
DOI: 10.6007/IJAREMS/v3-i5/1197 URL: http://dx.doi.org/10.6007/IJAREMS/v3-i5/1197
This research has been funded by the deanship of scientific research, University of Dammam, Saudi Arabia. Project No., 2014227.
Abstract Effective measure and analysis of the effect of (CSR) on (CA) are a fundamental first step in its development. To achieve this purpose, this study conducts a discussion on developing the neural network models. The validity of neural network model to measure and forecast the effect of CSR on CA is principally enhanced. The data of marketing managers are extracted from a survey of Saudi Arabian industrial corporates. The sample is composed of 400 corporates from a diversified amount of industries that supply the foundation for model development. An analytical foundation for the significance of our standard in evaluating the effect of CSR on CA is also provided by the study. Nevertheless, the study illustrates the necessity for further research before neural network models may be efficiently utilized for sensitivity analyses that include limited aspects of service quality.
Key Words: Corporate Social Responsibility (CSR) - Saudi Arabian corporates - Competitive Advantage (CA) - Reputation - Customer Satisfaction (CS) - Prediction - Artificial Neural Network. 1. Introduction Vellido, Lisboa and Vaughan (1999); Malhotra and Malhotra (2003) argued that neural networks can be an effective tool more than conventional statistical tools, because:

International Journal of Academic Research in Economics and Management Sciences Sep 2014, Vol. 3, No. 5
ISSN: 2226-3624
130 www.hrmars.com
a) the fundamental functions regulating business data are mostly unfamiliar and the neural networks do not demand a prior classification function, only a sample of input and output data is required to learn and train the process;
b) the neural networks are flexible – the brain conforms to new events and can recognize non-linear tendencies by learning from the data;
c) the neural networks can deal with confused data (very familiar in economics); and d) They can deal with incomplete information or confused data and can be extremely
effectual, especially in situations where it is not possible to determine the regulations or stages leading to the solution of an issue.
Surkan and Singleton (1990); Kim, Weistroffer and Redmond (1993); Daniels and Kamp (1999); Bennell, Crabbe, Thomas and Gwilym (2006), in this context, indicated that a considerable number of empirical researches have conducted a comparison between neural network methodology and techniques of econometrics, and consistent with conceptual arguments. The results obviously illustrate that the neural networks constitute an exceptional methodology for forecasting over more linear regression analysis, multivariable discriminant analysis, and logistic regression. Stutz and Warf (2009) indicated that the organization accomplishes CA when a company acquires or enhances an attribute or a set of attributes that enables it to outclass its competitors. These features or attributes can include an approach to natural resources such as high-quality materials, cheap force, or an approach to highly trained human resources. The scheme of business is a method, dealing with resources and helps to create CA (Powell, 2001). For that reason, the appropriate business scheme may be insufficient unless it regulates its unequaled resources along with the capacity to produce an unequaled characteristic. In few words, CA is one of the essential determining elements of unusual performance. It also attempts to assure keeping a superior position in the market. The unusual performance is the excessive aim required from the company. Therefore, the CA is the foundation for executing this performance. This research paper implements a neural network method to measure and predict the effect of CSR on CA. Three clear problems are revealed when considering such a method. First, the probability of evaluating the effect of CSR on CA sufficiently using neural networks is to be examined. To identify this, it is necessary to investigate the development of a sufficient neural network that represents marketing managers’ assessment of the impact of CSR on CA. Second, because a neural network can be indicated as a metaphor for the brain" of information processing, it may be possible to get some perception into problems connected to how the effect of CSR on CA is presently being estimated and assessed. Eventually, it would be essential to examine whether neural network models of the effect of CSR on CA can be of benefit to the managers in their endeavors to determine and enhance targeted phases of competitive advantage, having the most significant returns in the overall assessment of the effect of CSR on CA. This has an especial significance in the common environment of expanding demand for the effective investment in CSR development attempts. This paper aims at addressing the aforementioned issues. The improvement of a neural network model of the impact of CSR on CA is demonstrated after a short summary to neural networks. The foundation of a neural network model is shaped by using a systematic diagram, representing the CSR. Elgaraihy, Mobarak and Albahussain (2014) indicated that the model data

International Journal of Academic Research in Economics and Management Sciences Sep 2014, Vol. 3, No. 5
ISSN: 2226-3624
131 www.hrmars.com
are established upon the earlier standard survey of the data of marketing managers extracted from a survey of Saudi Arabian industrial corporates. The model is subject to initial evaluation and then used in experiments and sensitivity analyses (SA) to identify the problems discussed above. The implicit conclusions for further studies are therefore discussed. The Neurointelligence 2.2 program is used in this study. In the literature, different methods used to evaluate the performance of CSR are expectedly found, such as: (a) content analysis; (b) interviews held to measure personal perceptions, surveys and questionnaires (Elgaraihy et al., 2014); (c) indexes of reputation; (d) different one-dimensional indicators; (e) case studies (Waddock and Graves, 1997; Maignan and Ferrell,2000; Igalens and Gond, 2003, 2005; Soana, 2009; Turker, 2009, Leo´ Mun˜ oz and Chalmeta, 2010) and (f) ratings or indications developed by experts or specialized corporates, following various methodologies, and sometimes with final integrated rates (Moneva, Rivera-Lirio and Mun˜oz, 2007, Mun˜oz, Rivera and Moneva, 2008, Rivera and Mun˜oz, 2010). This study, in this context, provides the structure of principles and methods for measuring overall CSR impact on CA. It mainly aims at proposing a methodology, which duplicates evaluation models of measuring and forecasting the impact of CSR on CA. It is a unique study based on using the neural networks and Linear Discriminant Analysis (LDA) for applying with intricate sets of data. This study paper is separated into six parts. The introduction is pursued by a summarized analysis of CSR and a short interpretation and prediction of the effect of CSR on CA through linear discriminant analysis (LDA) and the neural networks. In the second Part we present the conceptual framework and neural network concept in the third, while in fourth section we introduces the recommended methodology for measuring and forecasting the impact of CSR on CA, and the 5th section displays a study design experimental results. After presenting the concluded results, the essential conclusions are presented in the last section.
2. The Conceptual Framework Elgaraihy et al., 2014, research is the basis from which we have adopted our previous research model. Figure 1 illustrates the research model. Figure 1:
2.1. Corporate Social Responsibility (CSR)
CSR, as indicated by Matten and Moon (2004); Smith (2003), illustrates that a corporate undertakes to the community or to those affected by its policies and social practices. There are

International Journal of Academic Research in Economics and Management Sciences Sep 2014, Vol. 3, No. 5
ISSN: 2226-3624
132 www.hrmars.com
three fundamental aspects, Basu and Palazzo (2008), to handle the procedures of CSR as the following: Stakeholder-oriented approach, performance-oriented approach, and motives-oriented approach. Each approach leads to a unique interpretation of CSR. For instance, McWilliams, Siegel and Wright (2006) indicated that Stakeholder-oriented approach identifies and evaluates CSR and its role in executing the requirements of shareholders and external stakeholders. Performance-based approach illustrates the activities and focuses on the relationship among CSR, corporate plan, and required performance (McWilliams, Siegel and Wright. 2006). Eventually, motives-based approach shows the results. According to Basu and Palazzo (2008), it also examines the external causes for the mutual relation among organizations with CSR or significant interpretations for enhancing the central concepts of the obligations and responsibilities. Even though CSR can be recognized in several approaches, social responsibility has many aspects of construction (Rowley and Berman, 2000). Carroll (1979) developed one of the most models mentioned in literature. It differentiates among economy patterns, legal patterns, ethical patterns and optional patterns.
2.2. Customer Satisfaction (CS) CS is a preamble of important behavioral outcomes to customers, that is, customer loyalty, and customer commitment (Donio, Massari and Passinate, 2006), repurchase intentions (Elgaraihy, 2013), and positive transferred speech (Cronin, Brady and Hult, 2000; Brady and Robertson 2001). CS leads to support behavioral attitudes of customers to strengthen those levels of satisfaction they own. Emotional reaction is defined as ''demonstrative assessment connecting to enjoyment that a product or service presents to the purchaser (Sweeney, Soutar and Johnson, 2001, Petrick, 2002). Luo and Bhattacharya (2006) suggested that there are three tendencies to illustrate the effect of CSR on CS as follows:
1) The first tendency indicates that the perceived value positively affects customer satisfaction (Athanassopoulos, 2000).
2) Established upon social identity theory and organizational identity theory, corporate social responsibilities initiatives lead to superior levels of consumer identity – the corporate identity (Bhattacharya and Sen, 2003), that in turn strengthen fulfillment the requirements of its customers (Luo and Bhattacharya, 2006).
3) According to Maignan, Ferrell and Linda (2005), corporates require developing an appropriate point of view to meet the demands of all stakeholders and implicated parties to meet their requirements.
A superior level of satisfaction was concluded that led to a good reputation for the company in the long term (Anderson and Sullivan, 1993). Bontis, Booker and Serenko (2007) concluded that customer satisfaction positively influences corporate reputation and recommends dealing with the corporate. Hence, corporates positively evaluated by consumers concerning the corporate social responsibility initiatives would have superior levels of customer satisfaction, which leads to more positive perceptions, acquired by consumers, concerning corporate reputation.
2.3. Corporate Reputation (CR) Corporate reputation represents a sign of the corporate credibility, confidence, reliability, and responsibility (Miles and Covin, 2000). Miles and Covin (2000) also indicated that corporates presenting high quality-products utilize the proper ad and conduct businesses adopted social

International Journal of Academic Research in Economics and Management Sciences Sep 2014, Vol. 3, No. 5
ISSN: 2226-3624
133 www.hrmars.com
and environmental responsibility. The advantage of good reputation can also achieved by satisfying their obligations toward stakeholders. Caves and Porter (1977) indicated that competitive advantage established upon CR considers one of the intangible assets that represents a source of strategic advantage strengthening the capacities of corporates to achieve a value over the long term.Corporate reputation can be developed to be a stimulus to involve in the activities of CSR (Fombrun, 2005). The returns of corporate reputation are due to the programs of CSR (Garberg and Fombrun, 2006).
2.4. The intermediating influences of CS and CR between CSR and CA Many endeavors are exerted to explain the relationship between the SR and CA. Although the results of those attempts are obviously positive, they have provided an incomplete apprehension of the complete picture of that relationship (Saeed and Arshad, 2012). Scientists have exerted several attempts to adopt this concept more than any other time to examine the relationship between CSR and CA. That resulted in a more exact assessment of the variables correlating CSR and CA. Customer satisfaction and corporate reputation represent two of these variables. Many researches have concluded that CSR, reputation, and customer satisfaction positively affects the CA.
2.5. Competitive Advantage (CA) Seldom attempts have been presented by marketing literature to indicate the relationship between CSR and competitive advantage, despite the dramatical development of that relationship in the past few years. McWilliams and Siegel, 2001) indicated that most studies concentrated on the relationship between competitive capacity and CSR in an attempt to illustrate that CSR and financial performance have a positive relation. Chand and Fraser (2006) concluded the inconclusive results, therefore, some researchers referred to substitutive approaches, such as corporate competitive advantage produced by the determination of value for the stakeholders (Freeman, 1984) the evaluation of CSR as a risk to the essential competitive variables, such as reputation and the mental image (Carlisle and Faulkner. 2005; Schnietz and Epstein, 2005), or using case studies (Gueterbok, 2004; Juholin, 2004). The fundamental cause is that there is a possibility of a relationship between CSR and competitive ability; however, the nature of the relationship is vague. It was illustrated that the financial performance or the corporate value might not unintentionally indicate competitive ability over the long term (McWilliams and Siegel, 2001; Porter and Kramer, 2006).
3. Neural Networks Neural networks are one of operating systems of information technology that rely on mathematical methods so that they imitate the nature of the human neuron in dealing with information and data. The artificial neural networks are the result of the study of the working methods of the brain and human neurons, electronic forms, depending on the structure of the human nervous system. Human brain learns from the experience it gained, and the neural networks are designed to learn in the same way from its experience in performing in a particular field (Chen and Leung, 2004). The neural network has been used to evaluate between a set of choices that may not have analytical solutions (Chen and Leung, 2005), i.e., it analyzes those choices comparable to human brain. Through the review of several previous studies, such as (Dunis and Huang, 2002; Dunis and Williams, 2002; Gradojevic and Yang, 2006; Shin and Sohn, 2007; Cheung and Wong, 2000; Kaastra and Boyd, 1996; Zhang, 2001), we review the following significant points:

International Journal of Academic Research in Economics and Management Sciences Sep 2014, Vol. 3, No. 5
ISSN: 2226-3624
134 www.hrmars.com
3.1. Artificial Neural Networks Concept By reviewing many concepts of artificial neural networks, studies introducing many definitions such as (Leung, Chen and Daouk, 2000; Yao and Tan, 2000; Walczak, 2001; Cheung and Wong, 2000; Zhang, 2004; Dunis and Chen, 2005) we adopt a comprehensive definition of neural networks as follows: “Neural networks are sophisticated artificial intelligence techniques, consisting of electronic forms based on the idea of nervous composition of natural neurons, consisting of the human mind. They imitate human intelligence and behavior as an attempt to imitate its skills in terms of acquiring and organizing information and concepts.” They are an associative system, consisting of a set of primary neuronal processing elements that represent the artificial nerve cells. These elements are correlated with each other to give a specific standard form, and consist of three layers: Input layer, hidden layer, output layer. The network is working through connecting inputs nodes and outputs nodes with each other so that both are related to the nodes of hidden layer that helps to generate the network functions down to the desired output, using a set of mathematical means."
3.2. Information Processing in Neural Networks Through the inductive reasoning of many studies (Hlavàcek, Cada, and Hake, 2005; Bose, Sethuraman and Raipet, 2006; Rama suramian and Kannan, 2006; Östermark, Aaltonen, Saxenèn and Soderlund, 2004; Smith and Lokmic, 2002; Moutinho and Phillips, 2002) we attempt to reach how to process information in artificial networks, the stages of processing. It has been found out that they have the following important stages: (a) Determine Input: Each input represents a characteristic so that the characteristics of input are determined, (b) Output: is the final decision or the final product of the operation process, it takes many shapes; Yes (+1), No (0), (c) Weights: weight reflects the relative strength (relative importance) or arithmetic value for initial input data or different connectors that transmit data from layer to layer, (d) Summation Function: It specializes in calculating the average weight of each input to the processing element by multiplying the value of each input element by its weight to get the total, (e) Transfer Function: Each nerve cell has activation level, which is calculated by summation function. This is what is called interior simulation, and finally, and (f) learning: the most significant characteristic of artificial neural network is the ability to learn from its mistakes. This is achieved in three steps: (1) output calculation, (2) output calculation with specific answers, (3) weights amendment and reprocessing.
3.3. Foundations and Components of Neural Networks The artificial neural networks consist of a number of interconnected operating units, in a form of successive layers. Operating units comprise of processing elements that communicate with each other through interfaces so that network inputs are interconnected with network outputs. The network layers have been divided into the input and output layer, and between them are one or more layers called hidden layers, (Alam, Booth, Lee and Thordarson, 2000). Figure (2) shows the architecture of artificial neural network. Figure (2) the Architecture of Artificial Neural Networks

International Journal of Academic Research in Economics and Management Sciences Sep 2014, Vol. 3, No. 5
ISSN: 2226-3624
135 www.hrmars.com
The network performance is through the three layers. Input layer is allocated to input and receive data while the elements of output layer are allocated to output the results. The hidden layer enable to develop an internal representation of what forms it perceives and of what formats enters to it. The input layer is then formed of input unit arranged in the form of a two-dimensional network whose activation format is determined by the input datum. Based on this internal representation, a unit of output layer that expresses the required data is activated. The network is classified according to the nature of the activation spread (Celik and Karatepe, 2006) to: feed forward networks, feedback networks, auto associative networks. The Network can adapt itself by learning function. Therefore, the neural network, as adaptive systems, is based on the adaptation with its interdependent weights, depending on the nature of the input represented in information, data, images, or forms. The process of modifying weights is made by using weight updating function, learning function, or error function (Vojinovic, Kecman and Seidel, 2001). Kumar and Ravi (2007) confirmed that numerous ways appeared to spread activation among the cells of neural network after that period, including: (a) Supervised learning (observed), auto regulation, (b) Unsupervised learning (unobserved). The idea of supervised learning relies on presenting training data before the network as a pair of shapes. The network distinguish between the two forms in the calculation of the error function used then to modify the weights' values to reduce the difference by using weight updating function “learning function” (Ng, Quek, and Jiang, 2008). The most important ways of supervised learning are as follows (Ravi. Kurniawan, Thai and Kumar, 2007; Swicegood and Clark, 2001; Tan, Quke and Ng, 2007; Tung, Quke and Cheng, 2004):
1) Back-propagation method, 2) Maximizing performance method – Boltzmann.
In light of unsupervised learning method, the network considers the multiple examples of inputs without considering the output. This occurs through the ability of the network to discover the distinctive features of what displayed of inputs and its ability to develop the internal representation, without prior knowledge and without displaying examples of what it must produce. Several studies demonstrated the strength of neural network performance and its high analytical ability to perform complex tasks in all areas. Feroz, Kwon, Pastena and Park (2000) emphasized that the neural network has high accuracy in prediction, depending on the various frequencies of the data and learning algorithm. Coakley and Brown (2000); Parag and James (2003); Poh, Yaoand Jasic (2000) confirmed that the method of artificial neural networks is a proven and high accuracy method, and can deal with any changes in the structure of data.
4. Research Methods 4.1. Sample Selection and Data Collection Procedure

International Journal of Academic Research in Economics and Management Sciences Sep 2014, Vol. 3, No. 5
ISSN: 2226-3624
136 www.hrmars.com
This study has been established upon a survey of Saudi Arabian industrial corporates. The research sample consisted of 500 companies from a wide range of industries, involving chemical, petroleum, machinery, equipment, automotive, electronics, computer, steel and metals, food, and agriculture. A survey-based e-mail has been used to gather data in this study, while questionnaires have been sent to the marketing directors. Four hundred thirteen (413) questionnaires have been retrieved, including 400 useable questionnaires. That indicates the rate of effective reaction is almost 80%. From 400 questionnaires representing the sample, 197 questionnaires, representing 49.25% of the sample, allocated for the corporates, which have experienced the Corporate Social Responsibility from 1-3 years. Two hundred three (203) questionnaires, representing 50.75%, illustrated that their experience in CSR initiatives has been extended to more than 3 years. The results show that participants sufficiently know the corporate social responsibility initiatives. (63%) of the applicants ages ranged between 45-60 years, while (37%) of the ages ranged between 27 and 44 years. About 76% of the participants have high levels of education. The results indicate that non-response bias does not represent a significant problem in available data.
4.2. Measurements The study of Elgaraihy et al., (2014) was adopted in our previous model. The questionnaire consisted of 5 sections. The 1st section has been alloted to obtain the apprehension of respondents to the corporate social responsibility initiatives under the study. The 2nd section has been alloted to determine the apprehensions of respondents about satisfaction. The 3rd section has been alloted to evaluate the perceptions of respondents about corporate reputation. The 4th section has been alloted to evaluate the perceptions connected to the identification of CA. Fifth Likert Scale has beeen adopted to get the replys to the items of these 4 sections, so that (1) = Strongly Disagree and (5) = Strongly Agree. Section VI has involved demographic questions.
5. Procedures (Data Analysis and Results) 5.1. Factor Analysis and Scale Reliabilities
Confirmatory factor analysis (CFA) has been conducted, using (AMOS.16) to examine the standardized validity of the measure used in the study. Byrne (2001) recommended that confirmatory factor analysis should be used through exploratory factor analysis (EFA), due to its hypothetical foundation to illustrate the measurement errors; in addition, to examine uni-dimensional model. 17 items representing the 1st group have been canceled of 61 to get to the last set of items for each construct. This has been based on item-total correlations, and the standardized remaining values. Byrne (2001) recommended adopting this procedure. The eliminated items have been examined and incorporated to original conceptual explanation of the constructs. In each case, the factors that significantly changed the construction field connected to them have not been eliminated. As it was initially recognized, confirmatory factor analysis have been conducted to test the remaining factors. Entirely standardized solution caused by Amos 16, using the maximum-likelihood estimation led to that all 37 remaining items had extreme load on their similar elements that confirmed the uni-dimensionality of the constructs. They also supplied an efficient experimental proof of their validity. Furthermore, t-values of burdens were high, which indicated effective convergent validity. The results of the measure model are as follows: (X² 400 = 263.179; p = 0.000; (GFI) = 0.91; (AGFI) = 0.86; (CFI) = 0.95; (IFI) = 0.95; (RMSEA) = 0.07). Cronbach alpha coefficients have been calculated to

International Journal of Academic Research in Economics and Management Sciences Sep 2014, Vol. 3, No. 5
ISSN: 2226-3624
137 www.hrmars.com
determine the level of reliability of the various structures of the study. It has been 0.89 (CSR), 0.86 (CS), 0.95 (CR), and 0.84 (CA). Thus, Nunnally, 1978 concluded that the credibility has varied between 0.84:0.95, providing more enhancements to assure that all measures used in this research have acceptability and reliability.
5.2. Using Neural Networks to Predict the Effect of Social Responsibility Initiatives on the CA of Corporate
In recent years, paying attention of the development of artificial neural networks has commenced for their use in solving multiple problems in different areas. Those models have proven their ability to easily overcome to the traditional methods that rely on regression analysis, linear discriminant analysis (LDA), or multiple discriminant analysis (MDA). The style of artificial neural networks is characterized from those traditional methods by that it does not require prior assumptions for data representation due to the ability of neural networks method to determine the relationship among variables through learning feature. This kind of models is also characterized by that it needs relatively smaller samples in its test for the credibility of the model. Because the method of neural networks is superior to different statistical methods, we have used linear discriminant analysis (LDA) method, as one of those methods, to predict the impact of social responsibility initiatives on the competitive advantage of corporate as a comparative method of neural networks. This method has been selected to compare with the neural networks on the basis of what results have been concluded of our review of previous studies, which indicated that linear discriminant analysis is the most commonly used method in comparison with neural networks. To distinguish between whether there is an effect of SR initiatives on CA of corporate or there is no impact, we have taken all data averages of each respondent. On that basis, a distinction is made between whether there is or not an impact of the social responsibility initiatives on competitive advantage from the respondents' viewpoint. The less than average values have been considered to indicate a lack of impact, while the average or higher values indicate that there is an impact. A new column of data called the impact of social responsibility initiatives (ISRI) has been added, including one of two values, namely (1) if there is an impact from the respondent's viewpoint, that is, any value resulting from taking the average of responses is equal to or more than the average. The second value is (0), i.e., there is no impact, meaning that the resulting value of averages is less than the average value.
5.3. The Results of LDA Test LDA seeks to distinguish between the two features existed in the community. MDA also seeks to distinguish between several characteristics of the community. In our research, we seek to distinguish between the two features only, namely, whether there is an impact/ no impact of social responsibility initiatives on competitive advantage. Therefore, it was normal to use linear discriminant analysis. As the case is in the regression analysis, this analysis is conducted when the total sample can be divided into two parts based on a non-metric dependent variable, which has two known category. The primary purpose of this analysis is to understand the differences between these two categories and to predict the research terms in a particular category, using a number of metric independent variables, dimensions to measure the effect of SR initiatives on CA (Elgaraihy, et al., 2014). This test has been conducted by using (SPSS 21)

International Journal of Academic Research in Economics and Management Sciences Sep 2014, Vol. 3, No. 5
ISSN: 2226-3624
138 www.hrmars.com
program. Table (1) below indicates the most important results of the analysis and the table classification results, and the accuracy level of this classification. Table (1) Analysis and the Table Classification Results
Impact Classification
Classification sets
Overall set
.00 1.00
Original set NO. 0.00
1.00
80
20
0
300
80
320
% 0.00
1.00
100
6.25
0
93.75
100.0
100.0
Validation set
(test)
NO. 0.00
1.00
80
20
0
300
80
320
% 0.00
1.00
100
6.25
0
93.75
100.0
100.0
From the above table, it is indicated that the accuracy level of overall classification resulted from the discriminant analysis of the two sets of the original sample, and the test sample are 93.75 %. Discriminant analysis could classify 320 vocabularies, confirming that there is an impact of 300 correct classifications by accuracy rate of 93.75 %, and 20 incorrect classifications by mistaking rate 6.25 %. The proportion of overall accurate prediction of discriminant analysis has been about 94%.
5.4. The results of Using Neural Networks The program of Neurointelligence 2.2 has been used to construct a neural network to characterize the responses of respondents between whether there is or is not an impact of social responsibility initiatives on competitive advantage, so that it can be emphasized the ability of neural networks to the classification and prediction. This program is based on five successive stages to reach the neural network. It begins with an analysis of the data file submitted to it, prepares this data, then designs the network and thus trained it and extracts the results. Eventually, the program conducts a test on the targeted network. The five stages to build the artificial neural network, using Neurointelligence 2.2 program are as follows: First Phase: The Analysis Phase: The program analyzes the data file converted from Excel program, and determines the data characteristics, the columns' number, and characterization of these columns. Eventually, it determines the last column to be predictable, which is ISRI column. Then, the program determines the way to divide the data into samples for training,
International Journal of Academic Research in Economics and Management Sciences Sep 2014, Vol. 3, No. 5
ISSN: 2226-3624
139 www.hrmars.com
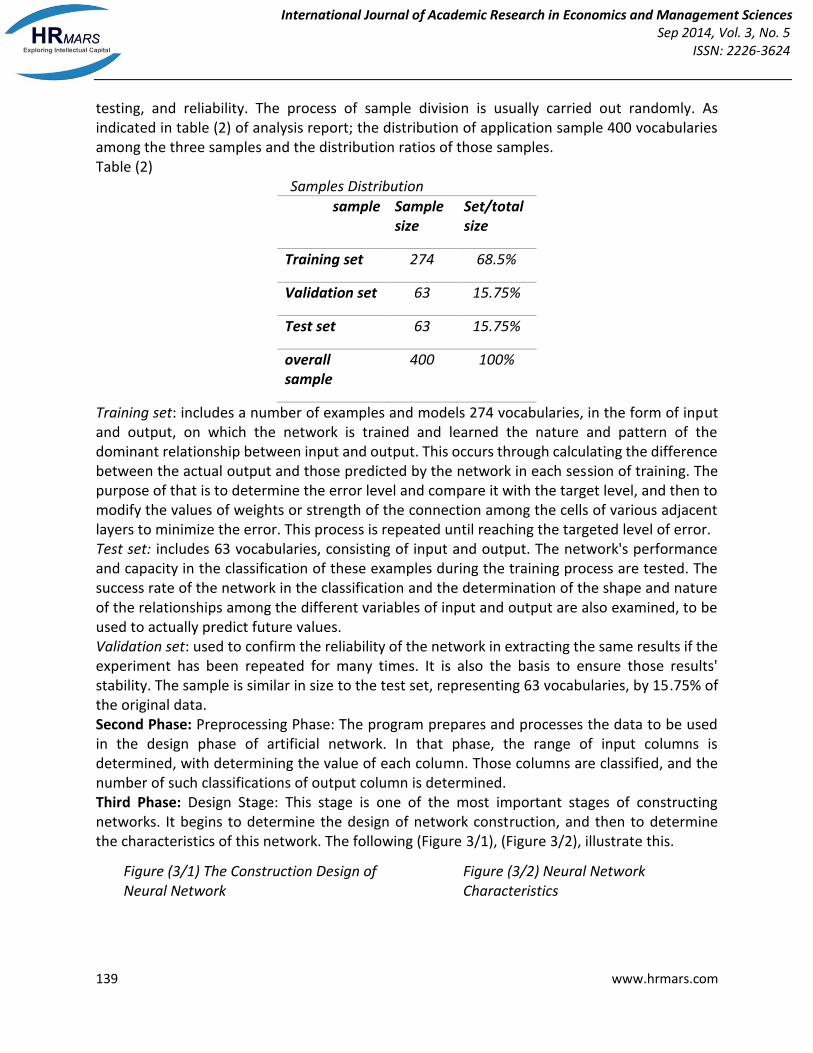
testing, and reliability. The process of sample division is usually carried out randomly. As indicated in table (2) of analysis report; the distribution of application sample 400 vocabularies among the three samples and the distribution ratios of those samples. Table (2) Samples Distribution
sample Sample size
Set/total size
Training set 274 68.5%
Validation set 63 15.75%
Test set 63 15.75%
overall sample
400 100%
Training set: includes a number of examples and models 274 vocabularies, in the form of input and output, on which the network is trained and learned the nature and pattern of the dominant relationship between input and output. This occurs through calculating the difference between the actual output and those predicted by the network in each session of training. The purpose of that is to determine the error level and compare it with the target level, and then to modify the values of weights or strength of the connection among the cells of various adjacent layers to minimize the error. This process is repeated until reaching the targeted level of error. Test set: includes 63 vocabularies, consisting of input and output. The network's performance and capacity in the classification of these examples during the training process are tested. The success rate of the network in the classification and the determination of the shape and nature of the relationships among the different variables of input and output are also examined, to be used to actually predict future values. Validation set: used to confirm the reliability of the network in extracting the same results if the experiment has been repeated for many times. It is also the basis to ensure those results' stability. The sample is similar in size to the test set, representing 63 vocabularies, by 15.75% of the original data. Second Phase: Preprocessing Phase: The program prepares and processes the data to be used in the design phase of artificial network. In that phase, the range of input columns is determined, with determining the value of each column. Those columns are classified, and the number of such classifications of output column is determined. Third Phase: Design Stage: This stage is one of the most important stages of constructing networks. It begins to determine the design of network construction, and then to determine the characteristics of this network. The following (Figure 3/1), (Figure 3/2), illustrate this.
Figure (3/1) The Construction Design of Neural Network
Figure (3/2) Neural Network Characteristics

International Journal of Academic Research in Economics and Management Sciences Sep 2014, Vol. 3, No. 5
ISSN: 2226-3624
140 www.hrmars.com
Figure (2/1) indicates that the number of hidden layers is one layer. This layer consists of 37 neurons. Figure (2/2) also illustrates that activation function used with the hidden layer is the logistic function. There is one neuron of the output. The activation function of output errors is the cross – entropy function. The activation function of output is a logistic function. The classification model used is the reliability limits and the level of acceptance from 0 to 1 is (0.5) and the same is applied for the rejection level. Twelve experiments have been conducted. That is, twelve different networks have been designed, in an attempt to gain access to the best of these networks, which are able to predict of the impact of SR initiatives on competitive advantage. Figure (4) below illustrates the results of the eleven networks that have been excluded after selecting the best designs, which have achieved the highest accuracy rates in the classification. Figure (4)
The Vesults of Various Experiments to Build the Neural Network (Phase III)
Figure (4) shows at the top of the middle, the excluded eleven designs. In the middle bottom, a chart shows the performance levels of the top five networks, the right side of the figure determines the best selected network. It also indicates its characteristics and the used functions. The left side of the figure shows the networking diagram of the selected network (74/ 37/1). This means that the network has consisted of three layers. Input layer is composed of 74 neurons because the input of data file of respondents consists of 38 columns including only one column represents the output of ISRI. The remaining columns represent the elements of used scale, which are covered by the twelve used dimensions. The number of input columns is 37. As already mentioned, we have represented the presence of

International Journal of Academic Research in Economics and Management Sciences Sep 2014, Vol. 3, No. 5
ISSN: 2226-3624
141 www.hrmars.com
impact of social responsibility initiatives with (1), and absence with (0). Therefore, we find that the program sets 74 neurons for input. The explanation of that the program has allocated two neurons for each input column; one of them is (1), and the other is (0). If the value in the column is less than the average, the value will be given (0); if it is equal or higher average, it will be given (1). This value transfers to the next layer, a hidden layer, where each column in this hidden layer represents only one neuron. This indicates that the number of hidden layer's neurons is 37 neurons. By calculating the average of hidden layer's values, the result will be either (1) or (0) in the output layer, and therefore it is represented by one neuron. Fourth phase: Training Phase: begins to identify the characteristics of the training process. The logarithm of quick propagation has been selected. Quick propagation coefficient has been identified by (1.75), which helps to speed the training process. Network learning rate has been identified by (0.1). The learning rate value usually ranges between (0, 1), which plays an important role in the training and stability of the network. This increases the speed of network training and ends the training phase with a relatively small number. Therefore, an initial value of learning rate is determined and adjusted thereafter to reach the best network giving the best results. This ratio is preferred to be smaller whenever possible. The mean squared error (MSE) has been allocated at 0.0000001 so that it can be the lowest. The number of learning rate has been determined to 500 iterations. After the completion of the identification of these options, the program is ordered to conduct the training process of the network. Figure (5) below shows the results of the training phase. Figure (5)
The figure is divided into four sections. The first section, in the top side, is dedicated for the chart of network performance form during the training process and credibility. The second section shows the level of network errors, and the network sophistication level in dealing with its mistakes depending on learning rate. This is evidenced by the third section of the errors distribution. It confirms the absence of errors in the final phase of training. Eventually, the most important part is the fourth section (Parameters), which determines the final results of the

International Journal of Academic Research in Economics and Management Sciences Sep 2014, Vol. 3, No. 5
ISSN: 2226-3624
142 www.hrmars.com
training phase. The network has achieved a very high level of accuracy estimated by 99.415 % for the training sample, and 100 % during the validity test. These results are the best that could be reached by using these networks, which extremely exceed the discriminant analysis method. The network errors have reached to lowest rates by 0.017108, and the improvement of errors rate has been (2.81 E – 11). The speed of training courses has been about 19.6 per second. Fifth phase: In testing phase, the test of that network results is conducted to the test sample (63 vocabularies). The results of this phase have been fully consistent with those of the previous phase. They have achieved accuracy level of 100%, See Figure (6). The graph shows the level of network response and that the network has already achieved the target. Figure (6)
5.5. Measuring the preference of two used methods (goodness-of-fit): To find out to what extent can be relied on the two methods, in the prediction process of the impact of social responsibility initiatives, the predictive ability should be tested for both methods, although the neural networks method has achieved a higher accuracy level of performance. The standards that neural networks method used are the mean squared errors, the root of mean squared errors, the absolute values mean of the error rate, Thiel coefficient, and the errors mean and its standard deviation. Applying the previous standards to measuring the predictive ability and calculating the errors values mean of models, we have concluded to measure the goodness-of-fit and a preference model, using discriminant analysis and neural networks methods. Table (3) indicates the criteria by which the errors of two methods are tested, and that goodness-of-fit has been measured accordingly.

International Journal of Academic Research in Economics and Management Sciences Sep 2014, Vol. 3, No. 5
ISSN: 2226-3624
143 www.hrmars.com
Table (3) Two Methods Goodness-of-Fit
Parameters used Discriminant analysis
Neural networks
Accuracy percentage obtained
96% 100%
Mean 0.8125 0.00
Standard deviation 1.18569 0.00
MSE 3.7009 0.0000001
RMSE 1.9237 0.0003163
MAPE 1.0427 0.0011
Theil Coefficient 0.08 0.00065
The results emphasize that the neural networks method is superior in all used standards to measure the goodness-of-fit of the model. The proportion of neural networks accuracy is 100% vs. 96% for discriminant analysis. The mean of errors and standard deviation of the neural networks method is 0.00, which indicates the model's goodness-of-fit. The standards of mean squared errors and its root, and the absolute value mean of error rate have demonstrated a very high level of goodness-of-fit of neural networks compared to the discriminant analysis method. Finally, Theil coefficient, as a criterion of the predictive ability confirmed the same results, with an almost zero, 0.00065. Consequently, these results emphasize that the neural networks method is the best and most appropriate methods to the prediction and classification.
6. Discussion, Managerial Implications, and Conclusion
The following results are concluded by our study: The perceptions of stakeholders, relating the CSR initiatives of Saudi companies, under study, have positive effects on CS, CR, and CA. The results have, on one side, illustrated that CS plays an intervening role in the relationship between CSR and CA. CR also has the same intervening role for the same relationship. In addition, the results involve that CS and corporate reputation have a positive relation, meaning that CS has a two-way effect on the CA. The 1st one, satisfaction has direct effects on CA; the 2nd one has indirect effects through CR. The results, in addition, demonstrated that CS and corporate reputation have an effect on the construction of corporate competitive advantage. They also play an intervening role between the initiatives of social responsibility and CA. The study briefly demonstrated that SR initiatives are affected and shaped by economic, legal, ethical, and discretionary activities of corporate. Furthermore, the results deduced that CS and CR have an intervening role between the initiatives of social responsibility and corporate competitive advantage. CS positively affects CR, which means that customer satisfaction has a very important role in constructing CA.

International Journal of Academic Research in Economics and Management Sciences Sep 2014, Vol. 3, No. 5
ISSN: 2226-3624
144 www.hrmars.com
Eventually, the analysis demonstrated that the construction of CA consists of 5 important elements, which are cost/price, quality, delivery credibility, product innovation, and time to market. Hence, the results show that Saudi Arabian companies in general, and those ones related to the social responsibility initiatives, particularly, must attempt to construct or enhance customer satisfaction since it has positive effects on corporate reputation on one side, and the CA on the other side. CS, therefore, affects the CA. It also affects the construction of corporate positive reputation. It should be noted that positive reputation reflects, at the same time, on CS. Basdeo, Smith, & Grimm, (2006) indicated that a corporate attempt to construct a good reputation or to support CS leads to positive perceptions of stakeholders, and then gets a positive evaluation about the corporate. Accordingly, it is suggested that the involvement in CSR forms a positive comprehension of stakeholders towards the corporate. It also sustains the corporate to be subsequently advantageous to achieve the best reputation and to improve CS. This virtually leads, as indicated in our study results, to achieve a sustainable competitive advantage. This study mainly contributes in supplying a new method to forecast the impact of CSR on CA through using neural networks.In this study, according to Elgaraihy et al. (2014), the responses of marketing managers about the impact of CSR on CA in Saudi industrial corporates have been utilized as input to a neural network model of CSR, using a standard established on our previous survey. The model could forecast comprehensive impact of CSR on CA according to marketing managers' view with 100% accuracy. As one study is not being introduced as convincing proof, this study indicates that it could be to utilize the neural networks to sufficiently model individual human decision-making attributes, as proposed by the biological roots of neural networks. The assessment of CSR is mostly established on human perception. The challenge of effective measurement and prediction of this unobjective evaluation requires to be identified searching for providing improved corporate social responsibility initiative to customers. In general, this study illustrates that the neural networks may be a significant method to comprehend the corporate evaluation of CSR and to provide an encouraging approach to data processing in the field of CSR.
References Alam, P., Booth, D., Lee, K., and Thordarson, T. (2000). The use of fuzzy clustering algorithm and
self-organizing neural networks for identifying potentially failing banks: an experimental study. Expert systems with applications, Vol. 18, pp. 185-199. http://dx.doi.org/10.1016/S0957-4174(99)00061-5
Anderson, E., and Sullivan, M. (1993). The antecedents and consequences of customer satisfaction for firms. Marketing Science, 12(2), 125–143. http://dx.doi.org/10.1287/mksc.12.2.125
Athanassopoulos, A. D. (2000). Customer satisfaction cues to support market segmentation and explain switching behavior. Journal of Business Research, 47, 191–207. http://dx.doi.org/ 10.1016/S0148-2963 (98)00060-5
Basdeo D., Smith K., and Grimm C. (2006). The impact of market actions on firm reputation. Strategic Management Journal, 27, 1205–1219. http://dx.doi.org/10.1002/smj.556
International Journal of Academic Research in Economics and Management Sciences Sep 2014, Vol. 3, No. 5
ISSN: 2226-3624
145 www.hrmars.com
Basu, K., and Palazzo, G. (2008). Corporate social responsibility: A process model of sense making. Academy of Management Review, 33(1), 122–136. http://dx.doi.org/10.5465/AMR.2008. 27745504
Bennell, J., Crabbe, D., Thomas, S., and Gwilym, O. (2006). Modelling sovereign credit ratings: neural networks versus ordered probit. Expert systems with applications, 30, 415–425. http://dx.doi.org/10.1016/j.eswa.2005.10.002
Bhattacharya, C., and Sen, S. (2003). Consumer–company identification: A framework for understanding consumers' relationships with companies. Journal of Marketing, 67(2), 76–88. http://dx.doi.org/ 10.1509/jmkg.67.2.76.18609
Bontis, N., Booker, L., and Serenko, A. (2007). The mediating effect of organizational reputation on customer loyalty and service recommendation in the banking industry. Management Decision, 45(9), 1426–1445. http://dx.doi.org/10.1108/00251740710828681
Bose, S., Sethuraman, J., and Raipet, S. (2006). Forecasting the term structure of interest rates using neural networks, IDEA group publishing, Vol.1, pp. 124-138.
Brady, M., and Robertson, C. (2001). Searching for a consensus on the antecedent role of service quality and satisfaction: An exploratory cross-national study. Journal of Business Research, 51, 53–60. http://dx.doi. org/10.1016/S0148-2963 (99)00041-7
Byrne, B. M. (2001). Structural equation modeling with AMOS: Basic concepts, applications, and programming. Mahwah, NJ: Lawrence Erlbaum Associates, Inc.
Carlisle, Y., and Faulkner, D. (2005). The strategy of reputation. Strategic Change, 8(14). http://dx.doi. org/10.1002/jsc.741
Carroll, A. (1979). A three-dimensional conceptual model of corporate performance. Academy of Management Review, 4, 497–505.
Caves, R., and Porter, M. (1997). From Entry Barriers to Mobility Barriers: Conjectural Decisions and Contrived Deterrence to New Competition. The Quarterly Journal of Economics, 91(2), 241–262. http://dx.doi.org/10.2307/1885416
Celik, A., and Karatepe, Y. (2006). Evaluating and forecasting banking crises through neural network models: An application for Turkish banking sector. Expert systems with applications, Vol. 27, pp. 211-229.
Chand, M., and Fraser, S. (2006). The Relationship between Corporate Social Performance and Corporate Financial Performance: Industry Type as a Boundary Condition. The Business Review, 5(1), 240–245.
Chen, A., and Leung, M. (2004). Regression neural network foe error correction in foreign forecasting and trading. Computers & Operations research, Vol. 31, pp. 1049-1068.http://dx.doi.org/ 10.1016/S0305-0548(03)00064-9
Chen, A., and leung, M. (2005). Performance evaluation of neural network architectures: the case of predicting foreign exchange correlations. Journal of forecasting, Vol. 24, pp. 403-420. http://dx.doi. org/10.1002/for.967
Cheung Y., and Wong, C. (2000). A survey of marketing practitioners views on exchange rate dynamics. Journal of international economics, Vol. 51, pp. 401-419. http://dx.doi.org/ 10.1016/S0022-1996(99)00009-4
Coakley, J., and Brown, C. (2000). Artificial neural networks in accounting and finance: modeling issues. International journal of intelligent systems in accounting, finance, and management, Vol. 9, No. 2, PP.119-144.

International Journal of Academic Research in Economics and Management Sciences Sep 2014, Vol. 3, No. 5
ISSN: 2226-3624
146 www.hrmars.com
Cronin, J., Jr., Brady, M., and Hult, G. (2000). Accessing the effects of quality, value and customer satisfaction on consumer behavior intentions in service environments. Journal of Retailing, 76(2), 193–218. http://dx.doi.org/10.1016/S0022-4359 (00)00028-2
Daniels, H., and Kamp, B., (1999). Application of MLP networks to bond rating and house pricing. Neural computing and applications, 8, 226–234. http://dx.doi.org/10.1007/s005210050025
Donio, J., Massari, P., and Passinate, G. (2006). Customer satisfaction and loyalty in a digital environment: An empirical test. Journal of Consumer Marketing, 23(7), 445–457. http://dx.doi.org/10.1108/ 07363760610712993
Dunis, C., and Chen, Y. (2005). Derivatives trading alternative volatility models for risk management and trading: application to the EUR/USD and USD/JPY rates". Derivatives use, trading & regulation, Vol. 11, No. 197-211.
Dunis, C., and Huang, X. (2002). Forecasting and trading currency volatility: an application of recurrent neural regression and model combination. Journal of forecasting, Vol. 21, No. 317-354.
Dunis, C., and Williams, M. (2002). Modeling and trading the EUR/US dollar exchange rates: Do neural network models perform better? Derivatives use, trading & regulation, Vol. 11, No. 211-239.
El-garaihy, W. H. (2013). Developing and Validating a Hospitality Service Quality Scale in Saudi Arabia (HOSP-SQ): A Structural Equation Model. International Journal of Business and Social Science, 4(14), November, 224-238.
Elgaraihy, W., Mobarak, A. and Albahussain, S. (2014). Measuring the Impact of Corporate Social Responsibility Practices on Competitive Advantage: A Mediation Role of Reputation and Customer Satisfaction. International Journal of Business and Management; Vol. 9, No. 5. http://dx.doi.org/ 10.5539/ijbm.v9n5p109
Feroz, E., Kwon, T., Pastena, V., and Park, K. (2000). The efficacy of red flags in predicting the SEC's targets: an artificial neural network approach. International journal of intelligent systems in accounting, finance, and management, Vol. 9, No. 3, PP. 145-157.
Fombrun, C. J. (2005). The leadership challenge: Building resilient corporate reputations. In J. P. Doh and S. A. Stumpf (Eds.), Handbook on responsible leadership and governance in global business (pp. 54–68). Cheltenham: Edward Elgar.
Freeman, R. E. (1984). Strategic management: A stakeholder perspective. Englewood Cliffs, NJ: Prentice Hall.
Gardberg, N., and Fombrun, C. (2006). Corporate citizenship: Creating intangible assets across institutional environments. Academy of Management Review, 31(2), 329–346. .http://dx.doi. org/10.5465 /AMR.2006.20208684
Gradojevic, N. and Yang, J. (2006). Non-linear, non-parametric, non-fundamental exchange rate forecasting. Journal of forecasting, Vol. 25, pp. 227-245. http://dx.doi.org/10.1002/for.986
Gueterbok, R. (2004). Greenpeace campaign case study – Stop Esso. Journal of Consumer Behavior. 33, 265–271. http://dx.doi.org/10.1002/cb.139
Hlavàcek, M., Cada, J., and Hake, F. (2005). The application of structured feed forward neural networks to the modeling of the daily series of currency in circulation. Periodical name N/A, pp. 1234-1246.

International Journal of Academic Research in Economics and Management Sciences Sep 2014, Vol. 3, No. 5
ISSN: 2226-3624
147 www.hrmars.com
Igalens, J. and Gond, J., (2003). La mesure de la performance sociale de l’entreprise: une analyse critique et empirique des donne´es ARESE. Revue Franc¸ aise de gestion des ressources humaines, 50, 111–130.
Igalens, J. and Gond, J. (2005). Measuring corporate social performance in France: a critical and empirical analysis of ARESE data. Journal of business ethics, 56, 131–148. http://dx.doi.org/10.1007/s10551-004-3529-7
Isabelle Maignan, O., Ferrell, Linda Ferrell, (2005). A stakeholder model for implementing social responsibility in marketing. European Journal of Marketing, Vol. 39 Iss: 9/10, pp.956 – 977. http://dx.doi .org/10.1108/03090560510610662
Juholin, E. (2004). For business or the good of all? A Finnish approach to corporate social responsibility. Corporate Governance, 4(3), 20–31. http://dx.doi.org/10.1108/14720700 410547477
Kaastra, I and Boyd, M. (1996). Designing a neural network for forecasting financial and economic time series. Neurocomputing, Vol. 10, pp. 215-236. http://dx.doi.org/10.1016/0925-2312(95) 00039-9
Kim, J., Weistroffer, H., and Redmond, R. (1993). Expert systems for bond rating: a comparative analysis of statistical, rule-based and neural network systems. Expert systems, 10, 167–188. http://dx.doi.org/10. 1111/j.1468-0394.1993.tb00093.x
Kumar, P., and Ravi, V. (2007).Invited review: Bankruptcy prediction in banks and firms via statistical and intelligent techniques-A review. European journal of operational research, Vol. 180, pp. 1-28. http://dx. doi.org/10.1016/j.ejor.2006.08.043
Leo´ n, R., Mun˜ oz, M., and Chalmeta, R. (2010). Methodology for sustainability strategic planning and management. Industrial management & data systems, 110 (2), 249–268.
Leung, M., Chen, A., and Daouk, H. (2000). Forecasting exchange rates using general regression neural networks. Computers & operation research, Vol. 27, No. 1093-1110.
Luo, X., and Bhattacharya, C. (2006). Corporate social responsibility, customer satisfaction, and market value. Journal of Marketing, 70, 1–18. http://dx.doi.org/10.1509/jmkg.70.4.1
Maignan, I., and Ferrell, O. (2000). Measuring corporate citizenship in two countries: The case of the United States and France. Journal of Business Ethics, 23(3), 283–297. http://dx.doi.org/10.1023/ A:1006262325211
Malhotra, R., and Malhotra, D. (2003). Evaluating consumer loans using neural networks". Omega, Vol. 31, pp. 83-96. http://dx.doi.org/10.1016/S0305-0483(03)00016-1
Matten, D., and Moon, J. (2004). Corporate Social Responsibility Education in Europe. Journal of Business Ethics, 54(4), 323–337. http://dx.doi.org/10.1007/s10551-004-1822-0
McWilliams, A., and Siegel, D. (2001). Corporate social responsibility: A theory of the firm perspective. Academy of Management Review, 26(1), 117–127.
McWilliams, A., Siegel, D, and Wright, P. (2006). Corporate social responsibility: Strategic implications. Journal of Management Studies, 43(1), 1–18. http://dx.doi.org/10.1111/j.1467-6486.2006. 005 80.x
Miles, M., and Covin, J. (2000). A Source of Reputational, Competitive, and Financial Advantage. Journal of Business Ethics, 23(3), 299–311. http://dx.doi.org/10.1023/A:1006214509281
Moneva, J., Rivera-Lirio, J., and Mun˜ oz-Torres, M. (2007). The corporate stakeholder commitment and social and financial performance. Industrial management & data systems, 107 (1), 84–102. http://dx.doi. org/10.1108/02635570710719070

International Journal of Academic Research in Economics and Management Sciences Sep 2014, Vol. 3, No. 5
ISSN: 2226-3624
148 www.hrmars.com
Moutinho, L. and Phillips, p. (2002). The impact of strategic planning on the competitiveness, performance and effectiveness of bank branches: a neural network Analysis. The international journal of bank marketing, Vol. 20, No. (2/3), pp. 102-110. http://dx.doi.org/10.1108/ 02652320210424188
Mun˜ oz, M., Rivera, J., and Moneva, J. (2008). Evaluating sustainability in organizations with a fuzzy logic approach. Industrial management and data systems, 108 (6), 829–841.
Ng, G., Quek, C., and Jiang, H. (2006).FCMAC-EWS: A bank failure early warning system based on a novel localized pattern learning and semantically associative fuzzy neural network. Expert systems with applications, vol.34, No.2, PP.989-1003. http://dx.doi.org/10.1016/j.eswa.2006. 10.027
Östermark, R., Aaltonen, J., Saxenèn, H., and Soderlund, K. (2004). Nonlinear modeling of the finish banking and finance branch index. The European journal of finance, Vol. 10, pp. 277-289. http://dx.doi.org/10. 1080/13518470210124641
Parag, C., and James, A. (2003). Technical efficiency – based selection of learning cases to improve forecasting accuracy of neural networks under monotonicity assumptions. Decision support systems, Vol. 36, No. 1, PP. 117-136. http://dx.doi.org/10.1016/S0167-9236(02)00138-0
Petrick, J. F. (2002). Development of a multi-dimensional scale for measuring the perceived value of a service. Journal of Leisure Research, 34(2), 119–134.
Poh, H. L., Yao, J. and Jasic, T. (2000) .neural networks for the analysis and forecasting advertising and promotion impact. International journal of intelligent systems in accounting, finance, and management, Vol. 9, No. 4, PP.253-268.
Porter, M., and Kramer, M. (2006). Strategy and society: The link between competitive advantage and corporate social responsibility. Harvard Business Review, 84, 78–92.
Powell, T. C. (2001). Competitive advantage: logical and philosophical considerations. Strategic Management Journal, 22(9), 875–888. http://dx.doi.org/10.1002/smj.173
Rama suramanian, P., and Kannan, A. (2006). A genetic-algorithm based neural network short-item forecasting framework for database intrusion prediction system. Soft compute, Vol. 10, No. 699-714.
Ravi. V., Kurniawan, H., Thai, P., and Kumar, P. (2007). Soft computing system for bank performance prediction. Applied soft computing, forth coming.
Rivera, J., and Mun˜ oz, M. (2010). The effectiveness of the public support policies for the European industry financing as a contribution to sustainable development. Journal of business ethics, 94 (4), 489–515. http://dx.doi.org/10.1007/s10551-009-0278-7
Rowley, T., and Berman, S. (2000). A brand new brand of corporate social performance. Business & Society, 39, 397–418. http://dx.doi.org/10.1177/000765030003900404
Saeed, M., and Arshad, F. (2012). Corporate social responsibility as a source of competitive advantage: The mediating role of social capital and reputational capital. Database Marketing & Customer Strategy Management, 19(4), 219–232. http://dx.doi.org/10.1057/dbm.2012.19
Schnietz, K., and Epstein, M. (2005). Exploring the financial value of a reputation for corporate social responsibility during a crisis. Corporate Reputation Review, 7(4), 327–345. ,http://dx.doi.org/ 10.1057/palgrave.crr.1540230

International Journal of Academic Research in Economics and Management Sciences Sep 2014, Vol. 3, No. 5
ISSN: 2226-3624
149 www.hrmars.com
Shin, H., and Sohn, Y. (2007). Application of a EWMA combining technique to the prediction of currency exchange rates. IIE transactions, Vol. 39, No. 639-644.
Smith, C. N. (2003). Corporate social responsibility: Whether or how? California Management Review, 45(4), 52–76. http://dx.doi.org/10.2307/41166188
Smith, K., and Lokmic, L. (2002). Combining of supervised and unsupervised neural networks for improved cash flow forecasting. IDEA group publishing, Vol. 14, pp. 236-244.
Soana, M.G., (2009). The relationship between corporate social performance and corporate financial performance in the banking sector. [Online] Available from: http://ssrn.com/abstract¼ 1325956 [Accessed 10 July 2014].
Stutz, F., and Warf, B. (2009). The World Economy. Prentice Hall. Surkan, A. and Singleton, J. (1990). Neural Networks for Bond Rating Improved by Multiple
Hidden Layers, Proceedings of IEEE International Conference on Neural Networks, IEEE Press, Alamitos, CA, Vol. 2, pp. 157-162
Sweeney, J., Soutar, G., and Johnson, L. (2001). Consumer perceived value: Development of a multiple item scale. Journal of Retailing, 77(2), 203–220. http://dx.doi.org/10.1016/S0022-4359 (01)00041-0
Swicegood, P. and Clark, J. (2001). Off-site monitoring systems for predicting bank underperformance: A comparison of neural networks, discriminate analysis and professional human judgment. International journal of intelligent systems in accounting, finance and management, 10:169-186. http://dx. doi.org/10.1002/isaf.201
Tan, T., Quke, C., and Ng, G. (2007). Biological brain-inspired genetic complementary learning for stock market and bank failure prediction. Computational intelligence, Vol. 23, No. 2, pp. 236-261. http://dx.doi. org/10.1111/j.1467-8640.2007.00303.x
Tung, W., Quke, C. and Cheng, P. (2004). GenSo-EWS: A novel neural-fuzzy based early warning system for predicting bank failures". Neural networks, Vol. 17, pp. 567-587. (http://dx.doi.org/10.1016/ j.neunet. 2003.11.006
Turker, D., (2009). Measuring corporate social responsibility: a scale development study. Journal of business ethics, 85 (4), 411–427. http://dx.doi.org/10.1007/s10551-008-9780-6
Vellido, A., Lisboa, P., and Vaughan, J., (1999). Neural networks in business: a survey of applications (1992–1998). Expert systems with applications, 17, 51–70. http://dx.doi.org/10.1016/S0957-4174(99)00016-0
Vojinovic, Z., Kecman, V. and Seidel, R. (2001). A data mining approach to financial time series modeling and forecasting. International journal of intelligent systems in accounting, finance, and management, Vol. 10, No. 4, PP. 225-239.
Waddock, S., and Graves, S. (1997). The corporate social performance – financial performance link. Strategic management journal, 18, 303–319. http://dx.doi.org/10.1002/(SICI)1097-0266(199704) 18:4<303::AID-SMJ869>3.0.CO;2-G
Walczak, S. (2001). An empirical analysis of data requirements for financial forecasting with neural networks. Journal of management information systems, vol.17, No.4: 203-222.
Yao, J. and Tan, C. (2000). A case study of using neural networks to perform technical forecasting of forex. Neurocomputing, Vol. 34, No. 79-98.
Zhang, G. P. (2001). An investigation of neural networks for linear time-series forecasting. Computers & Operations Research, Vol. 28, No. 1183-1202.

International Journal of Academic Research in Economics and Management Sciences Sep 2014, Vol. 3, No. 5
ISSN: 2226-3624
150 www.hrmars.com
Correspondence: Wael Hassan El-garaihy, University of Dammam, Saudi Arabia. Tel: 966-568-275-441. E-mail: [email protected]; [email protected]


![[Shiseido’s Corporate Social Responsibility] · Shiseido's Corporate Social Responsibility Back Issues 2010 [Shiseido’s Corporate Social Responsibility] "Beautiful Society, Bright](https://img.dokumen.tips/doc/110x75/5f170ccfbe73e76f437bb14c/shiseidoas-corporate-social-responsibility-shiseidos-corporate-social-responsibility.jpg)