Embed Size (px)
Citation preview

The Pittsburgh Economy
Challenges and Innovations
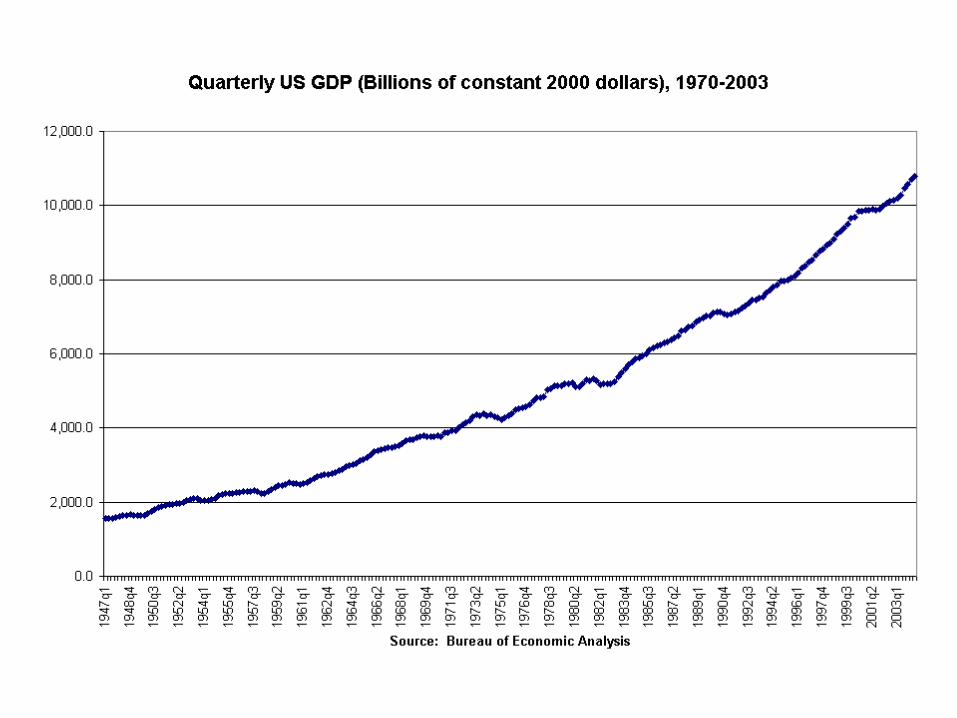
Corporate Profits
$-
$200
$400
$600
$800
$1,000
$1,200
$1,400
2001-I 2001-II 2001-III 2001-IV 2002-I 2002-II 2002-III 2002-IV 2003-I 2003-II 2003-III 2003-IV 2004-I 2004-II
Source: U.S. Bureau of Economic Analysis
Bill
ion
s o
f D
olla
rs
Corporate profits have increased by more than $395 Billion!
Bush signed the tax cut bill on June 7, 2001

Jobs Created vs. Jobs Needed
122,000
124,000
126,000
128,000
130,000
132,000
134,000
136,000
138,000
Jan
Feb
Mar
Apr
May
Jun
Jul
Aug
Sep Oct
Nov
Dec
Jan
Feb
Mar
Apr
May
Jun
Jul
Aug
Sep Oct
Nov
Dec
Jan
Feb
Mar
Apr
May
Jun
Jul
Aug
Sep Oct
Nov
Dec
Jan
Feb
Mar
Apr
May
Jun
Jul
Aug
Sep
2001 2002 2003 2004
Source: US Bureau of Labor Statistics
Th
ou
san
ds
of
Job
s
Actual Needed
Jobs created in 2004 have narrowed the jobs gap to more than 5.1 million jobs, down from a 7 million jobs deficit in 2003.

Key Points
Details on the transition Resources and programs Defining cluster connections Effective cluster policy
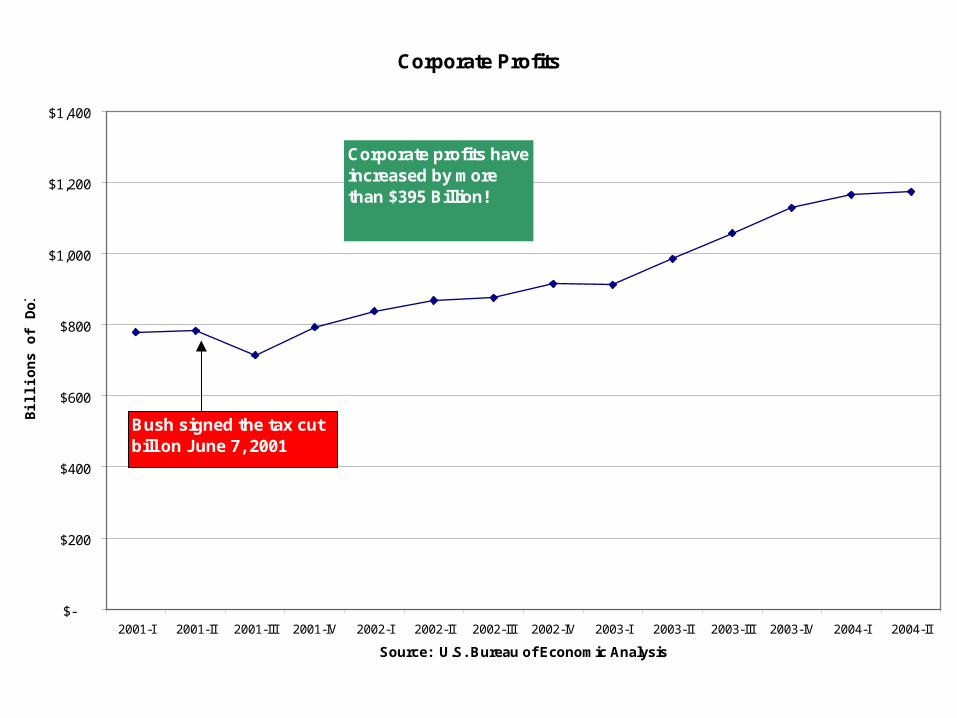
Initial Development Efforts
Smoke and Flood Control– 1907 – Chamber of Commerce– 1911 – Pittsburgh Industrial Development
Corporation
Rebuild Industrial Infrastructure– 1956 Pennsylvania Governor George Leader
created PA Industrial Development Authority
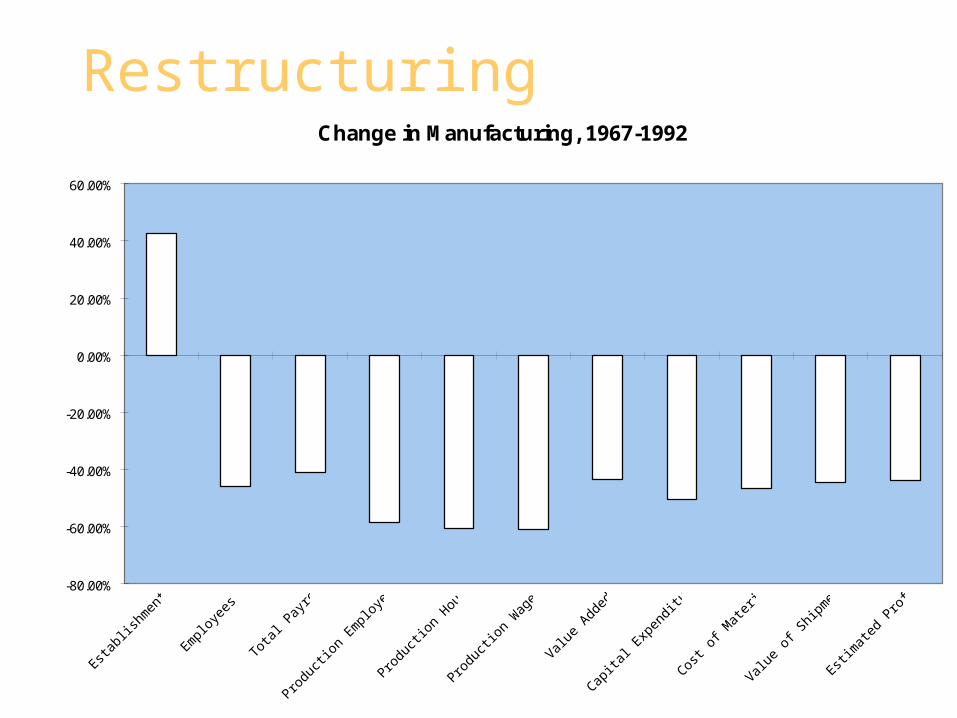
Change in Manufacturing, 1967-1992
-80.00%
-60.00%
-40.00%
-20.00%
0.00%
20.00%
40.00%
60.00%
Estab
lishm
ents
Emplo
yees
Tota
l Pay
roll
Produ
ction
Em
ploye
es
Produ
ction
Hou
rs
Produ
ction
Wag
es
Value A
dded
Capita
l Exp
endit
ures
Cost o
f Mat
erial
s
Value
of S
hipm
ent
Estim
ated
Pro
fit*
Restructuring

Change in Manufacturing
-80.00%
-60.00%
-40.00%
-20.00%
0.00%
20.00%
40.00%
60.00%
80.00%
1958-1967 1967-1977 1977-1987 1987-1992
Establishments
Employees
Total Payroll
Recovery
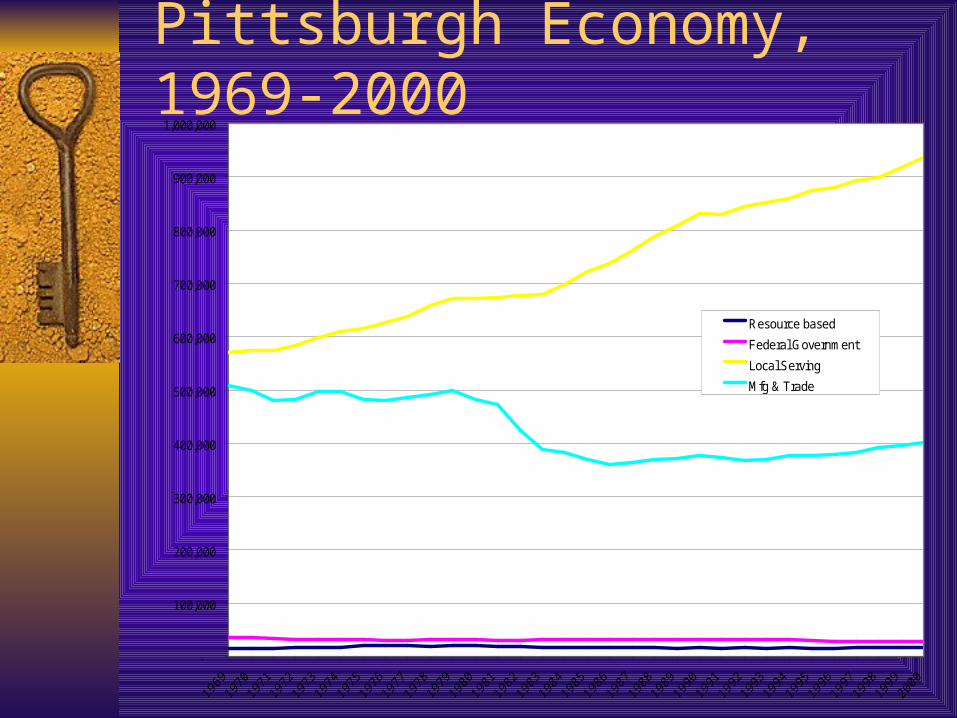
Pittsburgh Economy, 1969-2000
-
100,000
200,000
300,000
400,000
500,000
600,000
700,000
800,000
900,000
1,000,000
Resource based
Federal Government
Local Serving
Mfg & Trade

Tech & Mfg. Employment
-
20,000
40,000
60,000
80,000
100,000
120,000
140,000
160,000
180,000
200,00019
90
1991
1992
1993
1994
1995
1996
1997
1998
1999
2000
2001
Technology
Manfucturing

TimelineStrategic Role 1983 1987 1988 1994 1996 1998 1999 2000 2001 2002 2003Biomedical Pittsburgh
Biomedical Development Corporation
Pittsburgh Tissue Engineering Iinitiative
LaunchCyte Limbach Center McGowan Institute Pittsburgh Life Sciences Greenhouse
Pittsburgh NMR Center for Biomedical Research
Entrepreneurship Pittsburgh Seed Fund
PantherlabWorks
The Enterprise Corporation
General Pittsburgh Regional Alliance
Information Technology Pittsburgh Digital Greenhouse
Idea Foundry Robotics Foundry
Manufacturing SPIRC (Catalyst Connection)
Pittsburgh Gateways
Technology Pittsburgh High Technology Council (PHTC)
Ben Franklin Technology Center (Innovation Works) Innovation Works
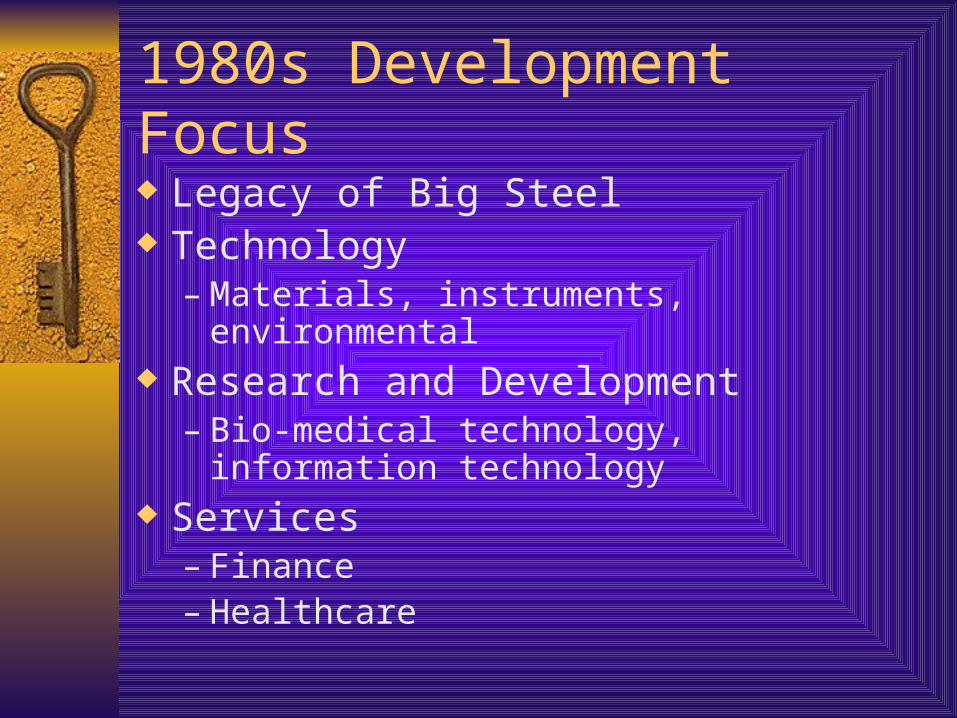
1980s Development Focus
Legacy of Big Steel Technology
– Materials, instruments, environmental Research and Development
– Bio-medical technology, information technology
Services– Finance– Healthcare
Team PA
SMC
Tech/ExtensionServices
Site Selection
Assistance
Finance & Incentives
Site DevelopmentCornerstone
Special Init. Workforce&
Talent
PRA
Cornerstone
RIDC
Permits andRegulatoryAssistance
PRA/WFC
PTC
WIB
IDC/URA
DCED / GAT
Catalyst
SPC
PRA
Cornerstone
Special Init.
RIDC
Commercial Real Estate
Catalyst
Special Init.
Networking& Industry
Info.
PTC
PRA
County/ Cornerstone
Navigators Marketing/Prospecting
PRA
Special Init.Catalyst
GAT
IW
Team PA
GAT
IW
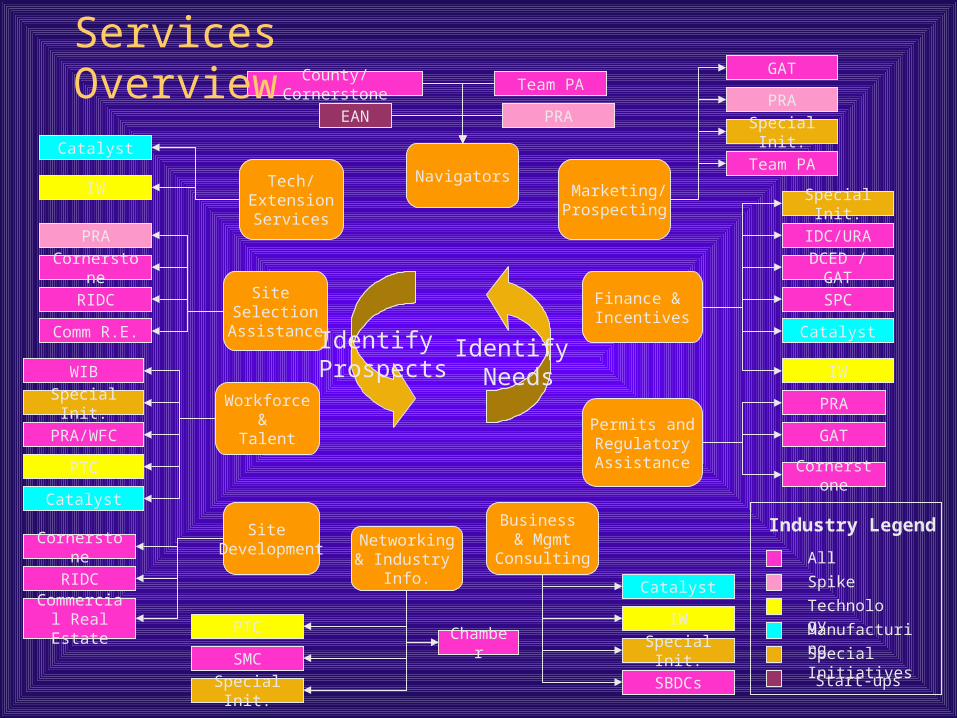
Industry Legend
All
Spike
Technology
Special Initiatives
Manufacturing
Start-ups
EAN
Comm R.E.
Chamber
SBDCs
Business & Mgmt
Consulting
IW
Special Init.
Catalyst
Identify Needs
Identify Prospects
Services Overview
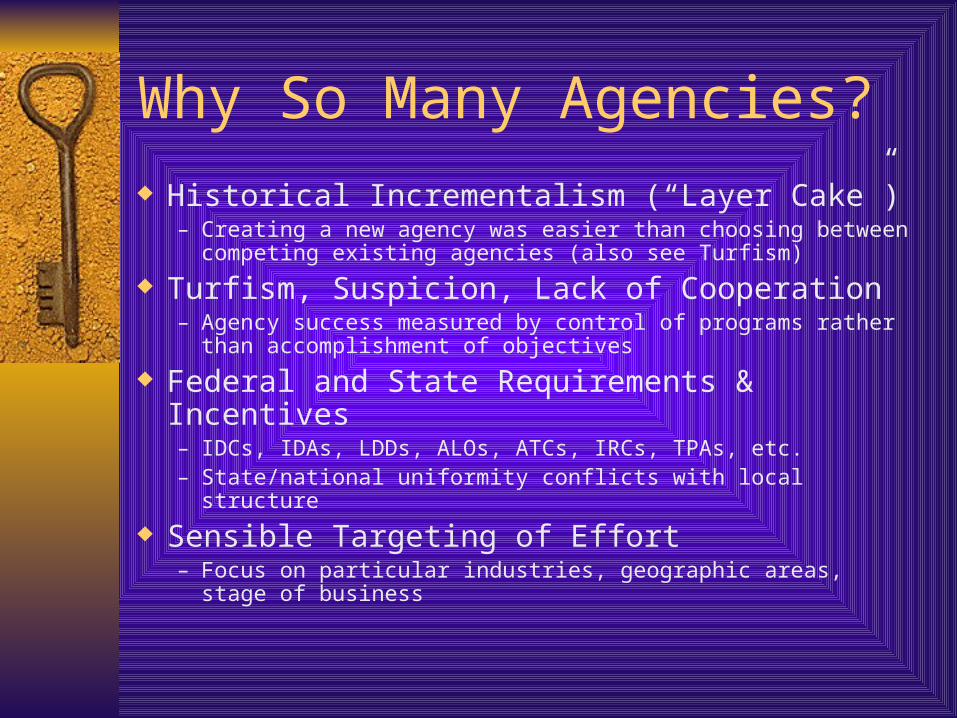
Why So Many Agencies?
Historical Incrementalism (“Layer Cake”)– Creating a new agency was easier than choosing between
competing existing agencies (also see Turfism)
Turfism, Suspicion, Lack of Cooperation– Agency success measured by control of programs rather than
accomplishment of objectives
Federal and State Requirements & Incentives– IDCs, IDAs, LDDs, ALOs, ATCs, IRCs, TPAs, etc.– State/national uniformity conflicts with local structure
Sensible Targeting of Effort– Focus on particular industries, geographic areas, stage of business
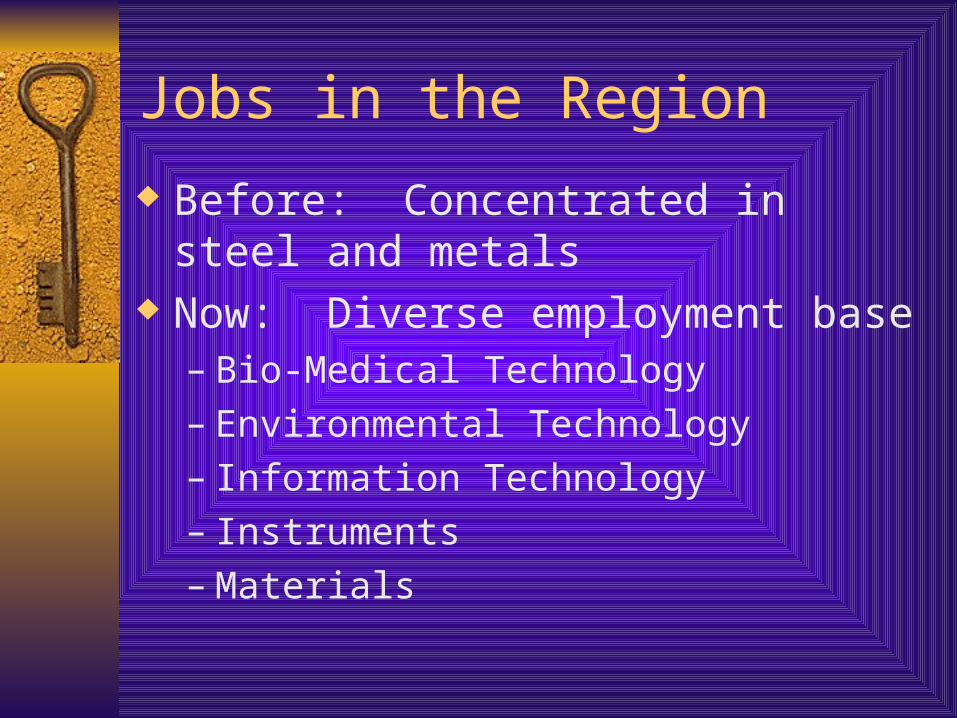
Jobs in the Region
Before: Concentrated in steel and metals Now: Diverse employment base
– Bio-Medical Technology– Environmental Technology– Information Technology– Instruments– Materials

1994-1998 Pittsburgh Region New Business Starts Per 10,000 Employees
0
2
4
6
8
10
12
14
16
1994 1995 1996 1997 1998
Year
To
tal
Sta
rts
Per
10,
000
Em
plo
yees
Source: Dun and Bradstreet, Bureau of Labor Statistics
Our rate of business starts is falling.
Business Creation
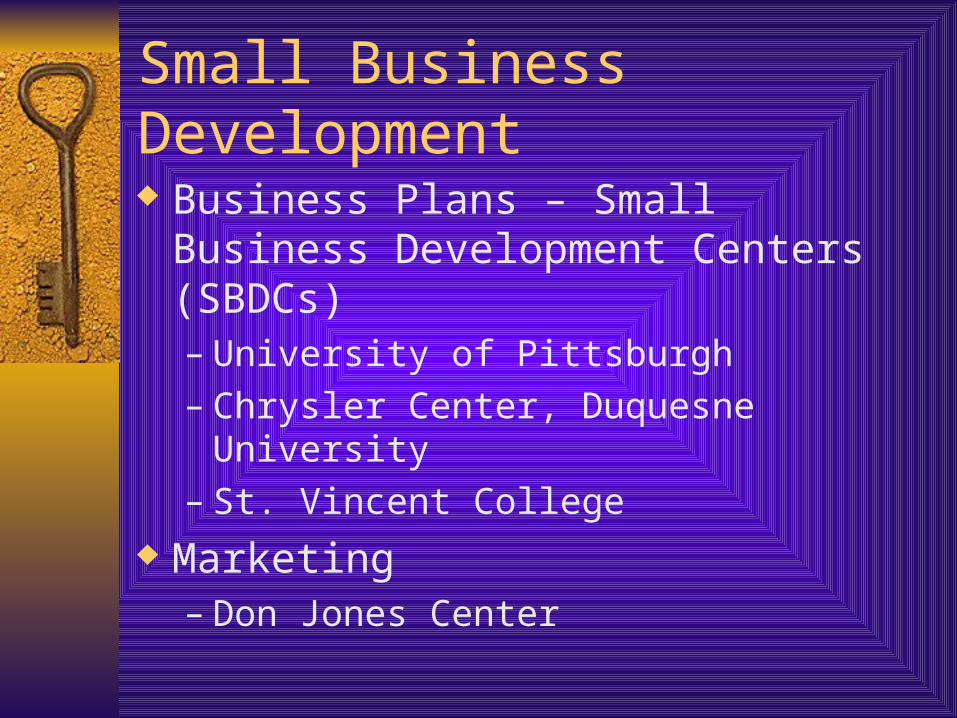
Small Business Development
Business Plans – Small Business Development Centers (SBDCs)– University of Pittsburgh– Chrysler Center, Duquesne University– St. Vincent College
Marketing– Don Jones Center
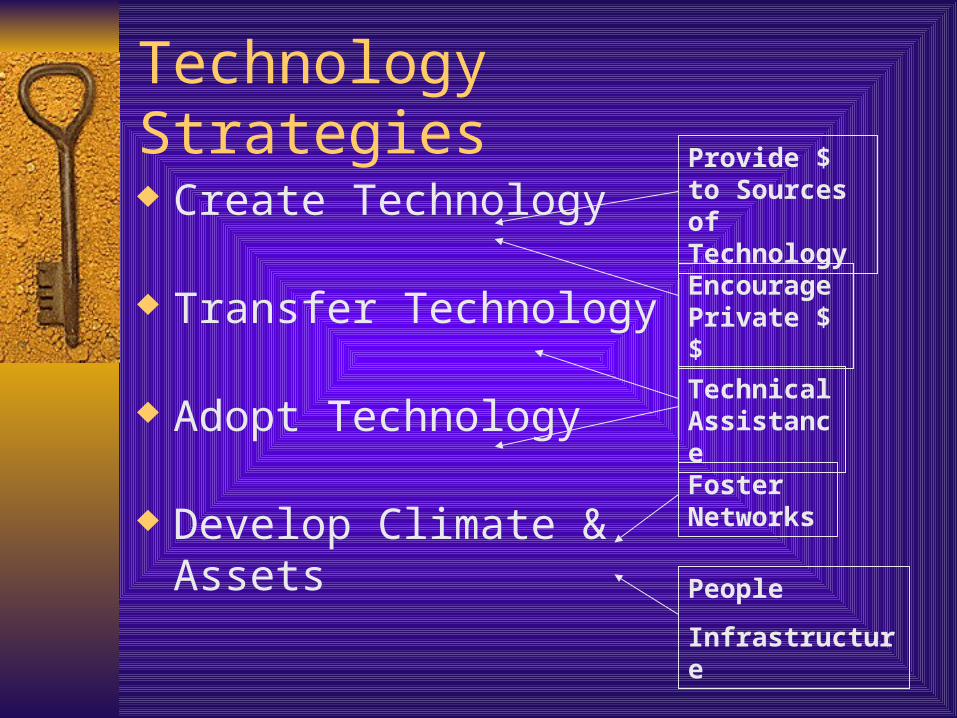
Technology Strategies
Create Technology
Transfer Technology
Adopt Technology
Develop Climate & Assets
Provide $ to Sources of TechnologyEncourage Private $$
Foster Networks
Technical Assistance
People
Infrastructure
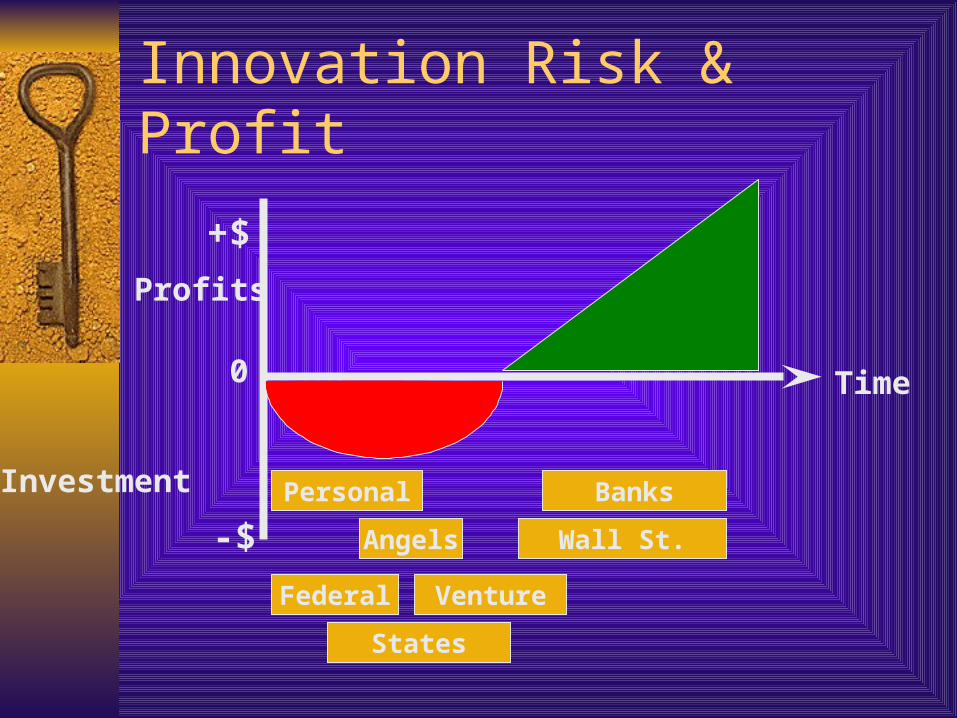
Innovation Risk & Profit
Time
+$
0
-$
Profits
Investment Personal
Federal
Banks
Angels
Venture
Wall St.
States
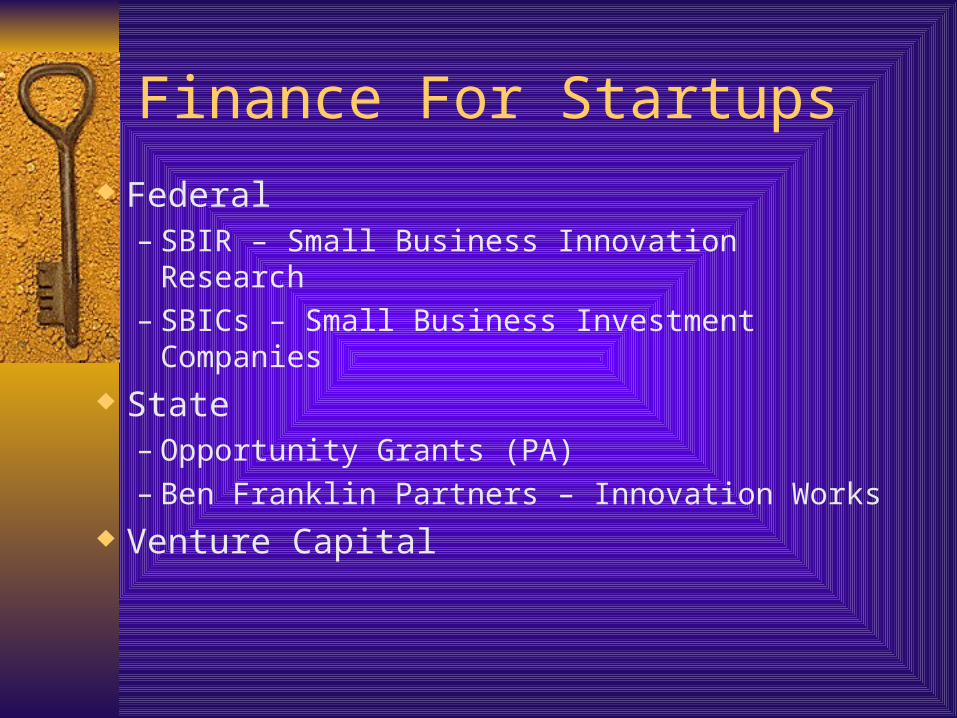
Finance For Startups
Federal– SBIR – Small Business Innovation Research– SBICs – Small Business Investment Companies
State– Opportunity Grants (PA)– Ben Franklin Partners – Innovation Works
Venture Capital

Innovation Works
A Pennsylvania Ben Franklin Partner Max of $100,000 for prototype and proof of
concept (x3) Max of $300,000 for market entry Equity investments up to $500,000 Disburse $1.5M per quarter Quarterly cycle, 60-90 day turn-around

BFP Impacts, 1983-1992
$-
$5,000,000
$10,000,000
$15,000,000
$20,000,000
$25,000,000
$30,000,000
$35,000,000
$40,000,000
$45,000,000
$50,000,000
Bio Info Tech Devices Env Tech Materials Chem & Ind Automation
Cu
rren
t D
olla
rs
-
100
200
300
400
500
600
700
Job
s
Technology Funds Technology Jobs

Pittsburgh Venture Investment
$-
$100
$200
$300
$400
$500
$600
$700
$800
$900
$1,000
1990 1991 1992 1993 1994 1995 1996 1997 1998 1999 2000 2001
Source: Thomson Financial VenturEconomics/NVCA
Inve
stm
ent
($ M
)
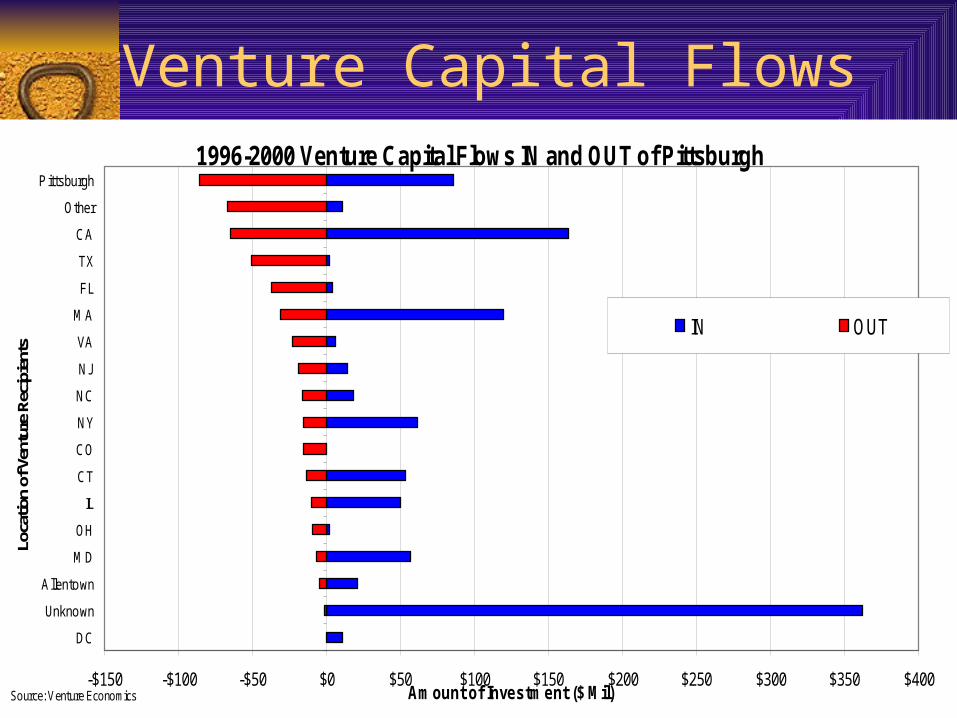
1996-2000 Venture Capital Flows IN and OUT of Pittsburgh
-$150 -$100 -$50 $0 $50 $100 $150 $200 $250 $300 $350 $400
DC
Unknown
Allentown
MD
OH
IL
CT
CO
NY
NC
NJ
VA
MA
FL
TX
CA
Other
P ittsburgh
Loca
tion
of V
entu
re R
ecip
ient
s
Amount of Investment ($ Mil)
IN OUT
Source: Venture Economics
Venture Capital Flows
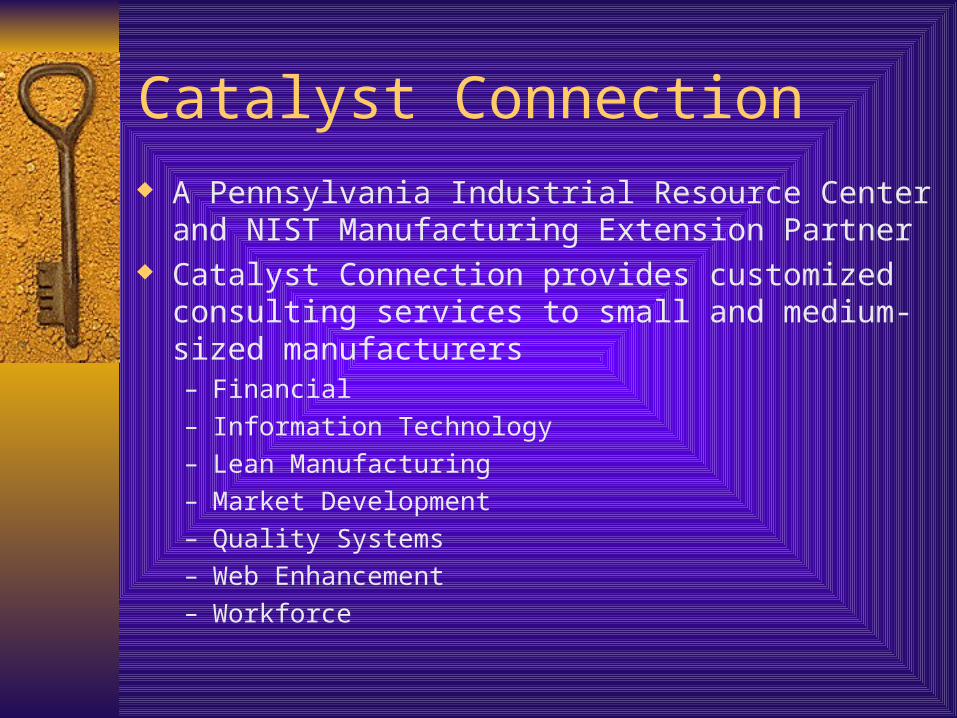
Catalyst Connection A Pennsylvania Industrial Resource Center and NIST
Manufacturing Extension Partner Catalyst Connection provides customized consulting
services to small and medium-sized manufacturers– Financial
– Information Technology
– Lean Manufacturing
– Market Development
– Quality Systems
– Web Enhancement
– Workforce
Doyle-TIDE Program
A new $5 Million initiative to implement COTS in the defense supply chain and to address issues like the rapid scaling of production that is required under the new dual-use, single production model of defense industries (www.sei.cmu.edu/tide/).

The transition from manufacturing to Life Sciences
-
50,000
100,000
150,000
200,000
250,000
300,000
350,000
1975
1976
1977
1978
1979
1980
1981
1982
1983
1984
1985
1986
1987
1988
1989
1990
1991
1992
1993
1994
1995
1996
1997
1998
1999
2000
ManufacturingHealth & Life Sciences

Life Science Employment
-
50,000
100,000
150,000
200,000
250,000
1975
1976
1977
1978
1979
1980
1981
1982
1983
1984
1985
1986
1987
1988
1989
1990
1991
1992
1993
1994
1995
1996
1997
1998
1999
2000
Research & Testing Labs
Drug Distribution
Electronics, Instruments & Devices
Metals
Plastic & Glass
Chemicals & Drugs
Textiles & Filters
Health Services
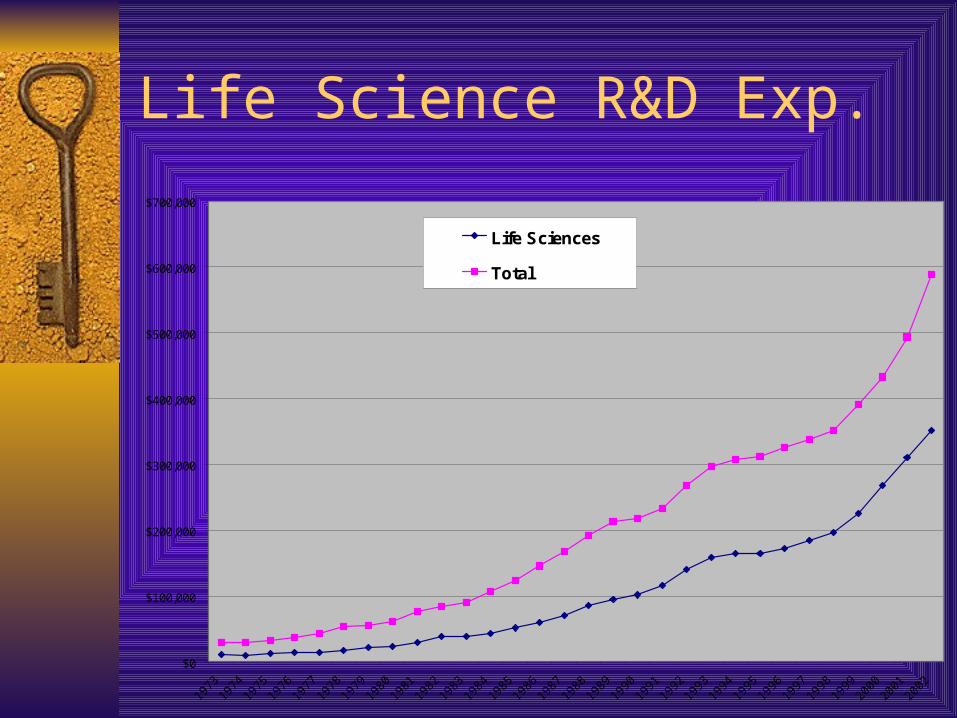
Life Science R&D Exp.
$0
$100,000
$200,000
$300,000
$400,000
$500,000
$600,000
$700,000
1973
1974
1975
1976
1977
1978
1979
1980
1981
1982
1983
1984
1985
1986
1987
1988
1989
1990
1991
1992
1993
1994
1995
1996
1997
1998
1999
2000
2001
2002
Life Sciences
Total

Pittsburgh’s areas of strengthEmployment Growth in Life Sciences, 2001-2002
-2%
-1%
0%
1%
2%
3%
4%
5%
6%
7%
Health Services Instruments and Devices Medical Equipment andSupplies
Pharmaceuticals Research
Life Science Clusters
Per
cen
t C
han
ge
Pittsburgh United States
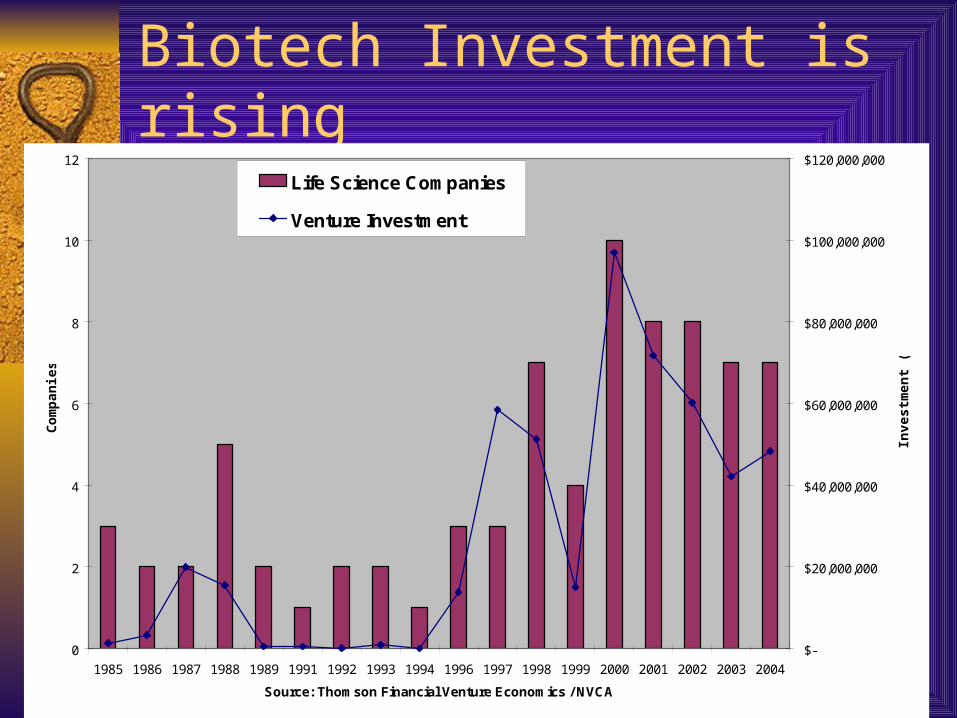
Biotech Investment is rising
0
2
4
6
8
10
12
1985 1986 1987 1988 1989 1991 1992 1993 1994 1996 1997 1998 1999 2000 2001 2002 2003 2004
Source: Thomson Financial Venture Economics / NVCA
Co
mp
anie
s
$-
$20,000,000
$40,000,000
$60,000,000
$80,000,000
$100,000,000
$120,000,000
Inve
stm
ent
($)
Life Science Companies
Venture Investment

Biotech Convergence
IT joining a new wave of Biotech Leverages Region’s Life Sciences R&D Center for Biomedical Informatics
(University of Pittsburgh) Pittsburgh Tissue Engineering Initiative BioVenture / Life Sciences Greenhouse

Human Capital and Amenities
Tech / Innovative Industries Growing Knowledge worker in high demand Areas with skilled labor attract good jobs Knowledge workers can choose their location Amenities / Quality of life become more important Education and Training are critical
– Highly competitive markets
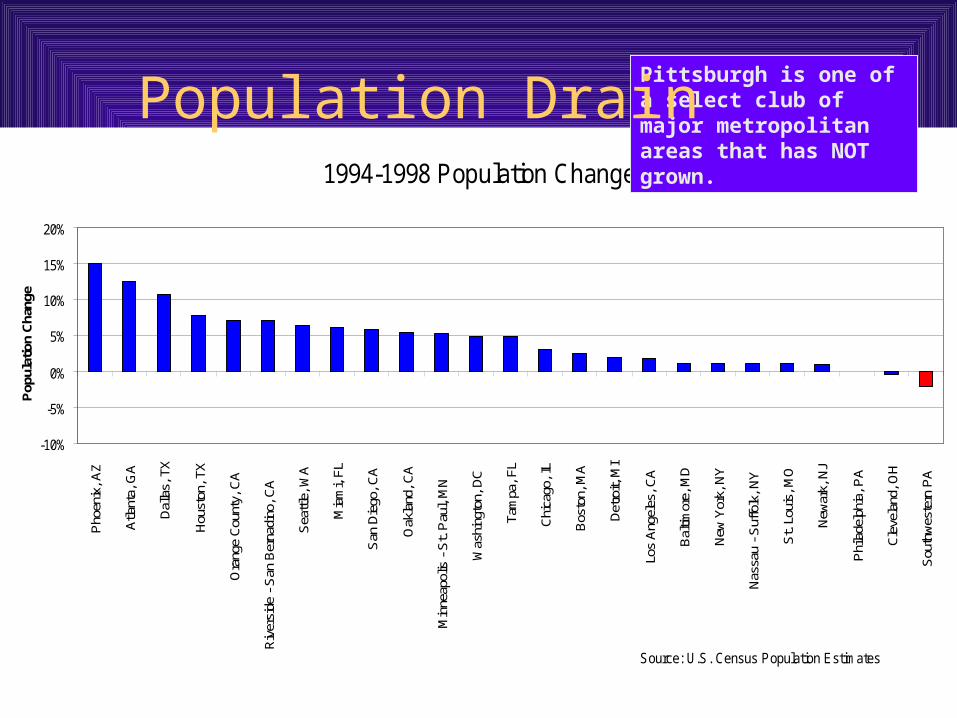
1994-1998 Population Change
-10%
-5%
0%
5%
10%
15%
20%
Pho
enix
, AZ
Atla
nta,
GA
Dal
las,
TX
Hou
ston
, TX
Ora
nge
Cou
nty,
CA
Riv
ersi
de -
San
Ber
nadi
no, C
A
Sea
ttle,
WA
Mia
mi,
FL
San
Die
go, C
A
Oak
land
, CA
Min
neap
olis
- S
t. P
aul,
MN
Was
hing
ton,
DC
Tam
pa, F
L
Chi
cago
, IL
Bos
ton,
MA
Det
roit,
MI
Los
Ang
eles
, CA
Bal
timor
e, M
D
New
Yor
k, N
Y
Nas
sau
- Suf
folk
, NY
St.
Loui
s, M
O
New
ark,
NJ
Phi
lade
lphi
a, P
A
Cle
vela
nd, O
H
Sou
thw
este
rn P
A
Pop
ulat
ion
Cha
nge
Source: U.S. Census Population Estimates
Pittsburgh is one of a select club of major metropolitan areas that has NOT grown.
Population Drain
People Do Matter
Region continues to lose population, albeit slowly
PSU study shows that disproportionate share of losses are young, well-educated
Push for amenities is in full swing Chicken and Egg –
– Jobs bring people OR– People attract job
What attracts them?
High quality, high paying jobs at cool companies still #1
Depth of job opportunity in local market Quality of life
– Coolness– Amenities – music, outdoor activities, culture– Diversity (or perceived openness to it)

The End
Thank you