Embed Size (px)
Citation preview

The Performance of Asphalt Concrete Mixture and Fiber Reinforcement Using Seawater Immersion Model to Indirect
Tensile Strength
Andi Alifuddin1, Antariksa2, Pitojo Tri Juwono3, Lambang Basri Said4*
1Doctor Program of Environmental Science, Postgraduate School, Universitas
Brawijaya, Veteran Malang 65145, Malang, Indonesia. 2 Faculty of Engineering, Universitas Brawijaya, Veteran Malang 65145, Malang,
Indonesia. 3 Faculty of Engineering, Universitas Brawijaya, Veteran Malang 65145, Malang,
Indonesia. 4 Faculty of Engineering, Indonesian Muslim University, Makassar, Urip Sumoharjo KM
5, Panaikang, Makassar, Indonesia.
Abstract : The objective of this research was to analyze the indirect tensile strength of the asphalt
concrete mixture with fiber reinforcement that was immersed on the sea water. The method of
research was an experimental testing on the mechanical properties of fibers and indirect tensile
strength of the mixture with a variation of length were 5 mm, 6 mm, 8 mm, 10 mm, 12 mm, 14
mm and the variation of fiber content for each composition was respectively 0.2%, 0.4%, 0.6%,
0.8%, 1.0% and 1.2% with the optimum diameter of fiber was 0.3 mm. Each composition of the
mixture was tested for each variation of length and fiber content with the optimum asphalt content
of 5.9%. The seawater-immersed fibers with the immersion duration of 3 weeks gave high tensile
strength and strain. The 0.3 mm diameter fibers with 3 weeks immersion had a maximum stress =
130.45 N / mm2, and maximum strain of 14.24% while those in control had a maximum stress =
13.71 N / mm2 and maximum strain of 13.89%. While the indirect tensile strength (ITS) test
results on five variations of length and percentage of fibers in the asphalt concrete mixture, the
0.6% fiber content composition provided ITS value of a maximum stress = 26795.84 kPa and
maximum strain in the fiber length of 8 mm was 0.01486 and an elastic modulus was 2318478.25
kPa. The composition yield a Poisson ratio = 0.44. The Poisson number is an indicator of the
ductility of a mixture.
Keywords: elastic modulus, indirect tensile strength, strain
Lambang Basri Said et al/ International Journal of ChemTech Research, 2018,11(03): 52-63.
DOI : http://dx.doi.org/10.20902/IJCTR.2018.110308
International Journal of ChemTech Research
CODEN (USA): IJCRGG, ISSN: 0974-4290, ISSN(Online):2455-9555
Vol.11 No.03, pp 52-63, 2018

Lambang Basri Said et al/ International Journal of ChemTech Research, 2018,11(03): 52-63. 53
1. Introduction
One of the functions of the pavement surface is to provide safety and comfort for the road users and reduce
the risk of accidents particularly in wet surface conditions1. To ensure resulting mixture has a robust performance
towards plastic deformation, rutting, fatigue and tensile strength, thus it is necessary to provide fiber reinforcement
as a composite material to asphalt binder of the mixture. The function of fiber in the mixture is expected as a
reinforcement material that provides tensile strength with lower stiffness modulus2. The fiber in the asphalt concrete
mixture is intended to improve the properties of the mixture, for instance by increasing the strength of the material
and the characteristic of fatigue, and increasing the ductility3,4
. Furthermore, it is known that fiber may contribute
to avoid crack formation and propagation5,6
, increasing the cohesive strength and tensile mixture, provide physical
changes to the asphalt mixture7, the absorption rate and surface area depending on fiber type
8. Basically, fiber
contributes to the change of the viscoelasticity in the modified asphalt, improves the dynamic modulus5, temperature
sensitivity9, creep resistance, rutting resistance
10, and reduces the reflective cracking of asphalt on the asphalt
mixture and structure. The concrete asphalt layer is reinforced by the fiber that currently is an alternative to repair
and strengthen pavement structures11
.
Some fibers have high tensile strength to the asphalt mixture, it was found that the fibers have a great
potential to increase the cohesive strength and tensile of the asphalt mixture and are believed to provide physical
changes to the asphalt mixture7. For the efficiency, the asphalt mixture that was mixed with fiber showed a slight
increase in optimum asphalt content6. The objective of this research was to analyze the indirect tensile strength of
the asphalt concrete mixture and fiber reinforcement using seawater immersion model.
2. Experimental
This research used experimental method by doing some experiment conducted to test some hypothesis to
find the relation of dependent variable and independent variable, then controlled in a scientific experiment as the
comparison.
2.1 Research Stages
This research was conducted experimentally with four stages of examination and testing. Stage 1 was the
preparation of materials; Stage 2 at this stage was done for two material testing and fiber characteristics. Stage 3
was planning of asphalt mixture based on standard asphalt content (s) with five variations of asphalt content as -
1%. -0.5%, s, + 0.5%, + 1% which aimed to obtain the optimum asphalt content (OAC). Furthermore, the mixture
design with variation of fiber length (0.5 mm to 14 mm at 0.2 mm intervals) and percentage variation of fibers
(0.2% to 1.2% with 0.2% intervals) based on OAC. Stage 4 was indirect tensile strength test based on length and
percentage of optimum fiber.
2.2 Mixing method
In this study there were two initial mixing methods used to obtain characteristic mixtures of elements and
specifications: mixture-I formula which the fiber was composited with aggregate and mixture-II formula which the
asphalt is composed with asphalt. Each mixture formulation was mixed and tested to determine the fiber treatment
model in the mixture which yielded mixed characteristics that fulfill all the parameters and mixed requirements.
2.3 Fiber material
a. Fiber
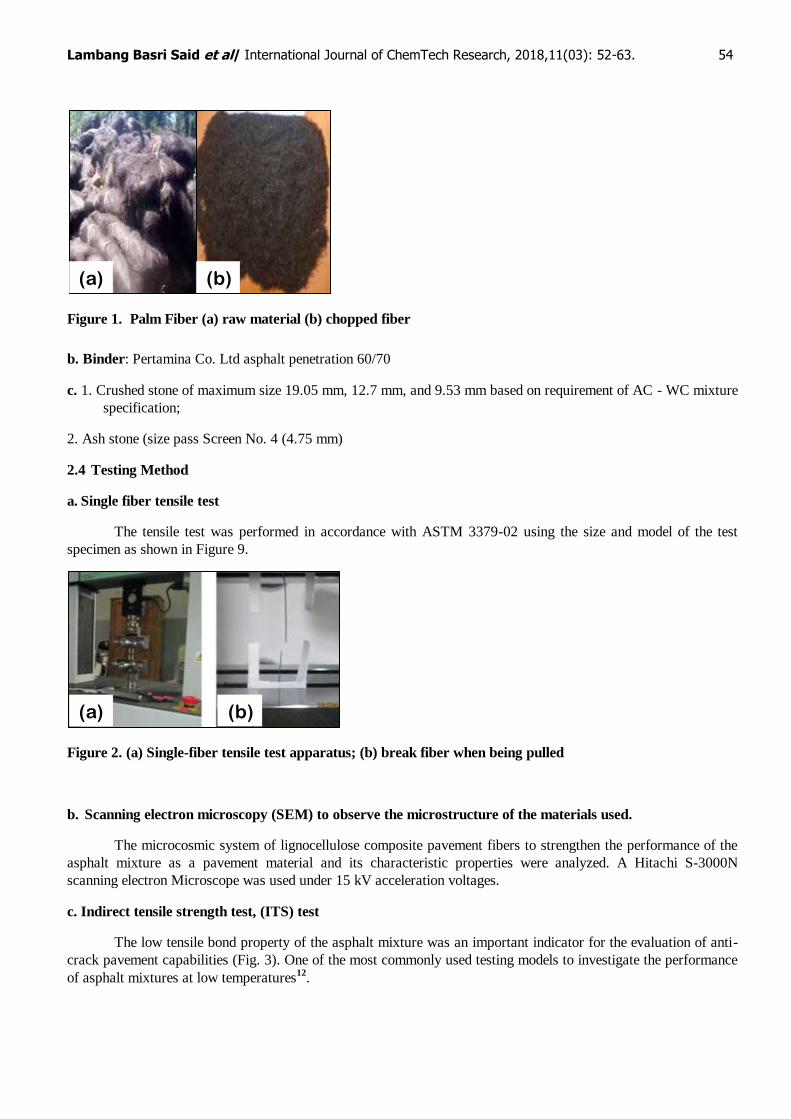
Fiber obtained from South Sulawesi with the age of palm trees above the age of 5 years with black fibers as
reinforced, fibers was selected at the lower and upper ends of the diameter of between 0.20 to 0.30 mm because it
had a solid part and there was no hole in it while at the base was perforated and it contained of a little cork. (Figure
1).
Lambang Basri Said et al/ International Journal of ChemTech Research, 2018,11(03): 52-63. 54
(a) (b)
Figure 1. Palm Fiber (a) raw material (b) chopped fiber
b. Binder: Pertamina Co. Ltd asphalt penetration 60/70
c. 1. Crushed stone of maximum size 19.05 mm, 12.7 mm, and 9.53 mm based on requirement of AC - WC mixture
specification;
2. Ash stone (size pass Screen No. 4 (4.75 mm)
2.4 Testing Method
a. Single fiber tensile test
The tensile test was performed in accordance with ASTM 3379-02 using the size and model of the test
specimen as shown in Figure 9.
(a) (b)
Figure 2. (a) Single-fiber tensile test apparatus; (b) break fiber when being pulled
b. Scanning electron microscopy (SEM) to observe the microstructure of the materials used.
The microcosmic system of lignocellulose composite pavement fibers to strengthen the performance of the
asphalt mixture as a pavement material and its characteristic properties were analyzed. A Hitachi S-3000N
scanning electron Microscope was used under 15 kV acceleration voltages.
c. Indirect tensile strength test, (ITS) test
The low tensile bond property of the asphalt mixture was an important indicator for the evaluation of anti-
crack pavement capabilities (Fig. 3). One of the most commonly used testing models to investigate the performance
of asphalt mixtures at low temperatures12
.

Lambang Basri Said et al/ International Journal of ChemTech Research, 2018,11(03): 52-63. 55
Figure 3. Indirect tensile strength test. (a) Before testing, (b) Cracking condition after the test
According to Standard Test Methods of Bitumen and Bituminous Mixtures for Highway Engineering (JTG
E20-2011), the test was performed at a temperature of 200° C13
. The specimen was compressed 75 times on each
side; the specimen size was 9.85 mm x 65.5 mm in diameter. The specimen was placed in a room at 200 ° C for 4
hours before the test.
d. Marshall test
This test aimed to know the characteristic of the asphalt concrete mixture with five variations of asphalt
content based on standard asphalt content (-1, -0.5, S, + 0.5, 1.0). Determination of optimum asphalt content
(OAC) based on Marshal Parameters that met the required mixed specifications that were included.
2.5 Data Analysis
The data obtained in this study were analyzed qualitatively and quantitatively. The process and data
analysis was done manually and using computer using Microsoft Office Excel program and SPSS 24. All data that
is described in matrix of the relationship between data source and data analysis method is intended to answer the
objectives in this research.
3. Results and Discussion
The effect of the immersion by using seawater on the percentage of fiber strain had decreased significantly.
Figure 4 a showed that the fibers with the diameter of 0.2 mm decreased significantly from 1 week to 4 weeks,
while the fibers with 0.3 mm and 0.4 mm diameter decreased the percentage of strain until 2nd
week and increased
in 3rd
week of the immersion. The increase in the percentage of this strain value was due to the increase in
cellulosic elements and the increase in tensile stress. This condition indicates that the larger diameter of fibers led to
the decrease of stress and strain values, in which the fibers that had diameters greater than 0.3 mm were brittle and
fragile.
(a) (b)

Lambang Basri Said et al/ International Journal of ChemTech Research, 2018,11(03): 52-63. 56
(c)
Figure 4. The relation between the stress and the duration of immersion for fiber diameter of (a) 0.2 mm, (b)
0.3 mm, and (c) 0.4 mm.
Lambang Basri Said et al/ International Journal of ChemTech Research, 2018,11(03): 52-63.
(a) (b)
(c)
Figure 5. The strain value percentage relation between fiber diameter and immersion duration. (a) The
percentage of fiber strain with diameter of 0.2 mm, (b) The percentage of fiber strain with diameter of 0.3
mm, (c) The percentage of fiber strain with diameter of 0.4 mm.

Lambang Basri Said et al/ International Journal of ChemTech Research, 2018,11(03): 52-63. 57
The Marshall Test results showed the mixed characteristics that meet the required parameters and
specifications, where as the percentage of asphalt content increased from 5.6% to 6%, the stability value increased
and the percentage the cavities in the mixture decreased. This showed that the fibers in the mixture are capable of
increasing the adherence and binding capacity of the mixture so that the density and the density level of the mixture
are increased to the optimum level of asphalt content. However, the increase in percentage of asphalt content 6.5%
to 7% led the value of stability to decrease (Table 1). This was due to an increase in the percentage of cavities filled
by asphalt and the value of VMA and VIM decreased.
The results of Electron Microscopy Scanning (SEM) showed the morphological shape of the fibers surface
without immersion having a smaller roughness (Fig 6 a), while fibers treated with sea water immersions were more
coarse (Fig 6 b, c and d). The effect of marine water immersion results in the removal of lignin and cellulose
elements that cause the surface to become rougher and improve the flexibility.
Based on the measurement of surface roughness of fiber in previous research, it showed that the model of
fibers with immersion was able to increase the roughness of the surface with the smallest surface roughness value
of fibers without immersion with a roughness value of 0.692 m14
. The highest value occurred at 2 weeks immersion
as 1.366 m, while for 1 week immersion value as 0.990 m, for 3 weeks as 0.946 m and 4 weeks as 1,400 m.
The influence of morphological shape of the fibers surface with the coarser surface contributes in
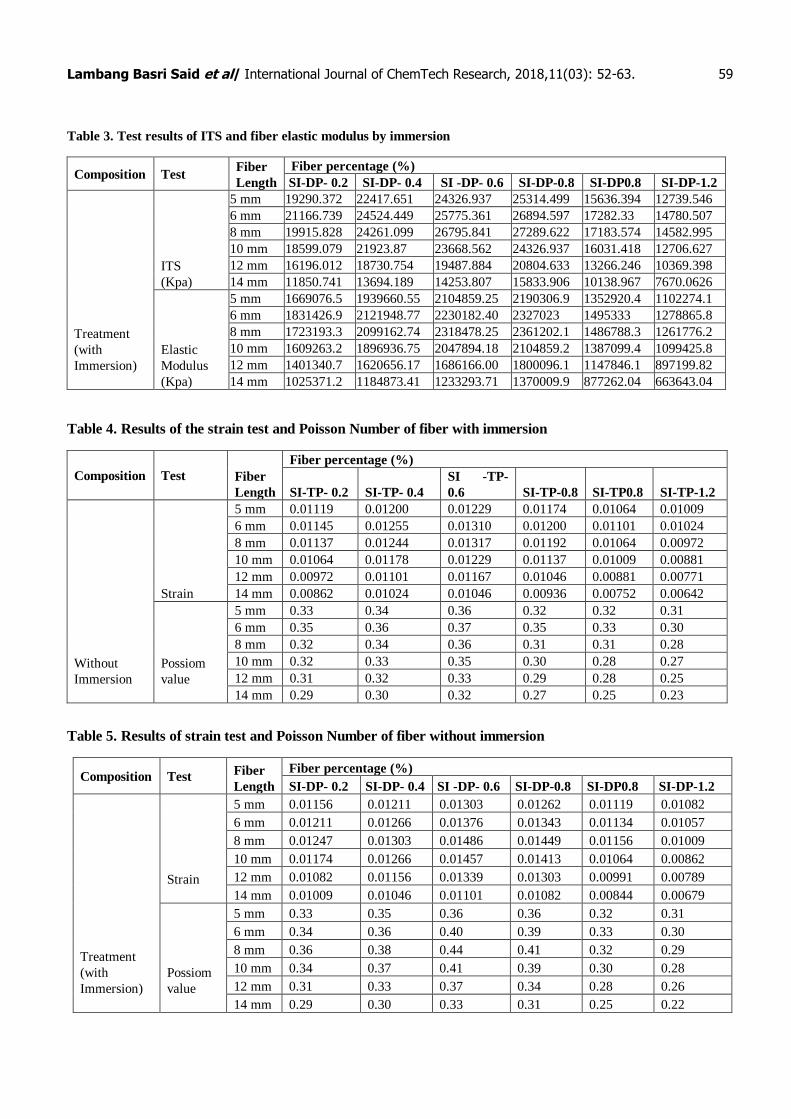
increasing the tensile strength and elastic modulus as in Table 2 and Table 3 where the fibers with the immersion
model show the mixture of asphalt concrete by immersion of the fibers of the tensile and elastic modulus values
increases and is higher than mixture of asphalt concrete with fibers without immersion. While in Table 4 and Table
5 the fiber with immersion has a maximum strain of 0.01486 and 0.01317 without immersion at a 0.6% percentage
with a fiber length of 0.8 mm.
This indicates that the immersion treatment to the fibers provided higher adhesion strength and higher
bonding by interlaying between aggregates and asphalt as a better bonding material, thus the risk of shear strength
between the larger surface areas due to the loading could be minimized.
(a)
(b)
(c)
(d)
Figure 6. The morphological structure of the fiber surface for after 3 weeks immersion: (a) control without
immersion with diameter of 0.3 mm, (b) treatment with the diameter of 0.2 mm, (c) application with the
diameter of 0.3 mm, and (d) with diameter of 0.4 mm

Lambang Basri Said et al/ International Journal of ChemTech Research, 2018,11(03): 52-63. 58
From the above results, the fiber in the asphalt concrete was used to improve the properties of the mixture,
for instance increasing material strength and fatigue characteristic while increasing ductility15,16
, changing the visco-
elastic properties of polymer modified by asphalt binder17
, having the potential to improve the dynamic modulus5,
waterproof9, flexible, resistant to rutting
18. In addition, it was known that fiber could contribute to avoid the
formation and crack propagation19
. Particularly, when the fiber has a relatively high tensile strength to the asphalt
mixture, the fibers could increase the cohesive and tensile strength of the asphalt mixtures20
. In addition, fiber-
reinforced concrete asphalt might have good resistance to aging, damp damage and crack reflections21
. Finally, the
fiber could also prevent the decrease of adhesive capacity of the binder in the asphalt mixture22
. As finely dispersed,
the fiber provided a high surface area for per unit of weight and acts like filler.
Fig. 7. Relationship of strain and fiber diameter
Table 1. Marshall Composite test results II (fiber + aggregate) + asphalt
Marshall
Parameters Unit
Asphalt level
5 5,5 6 6,5 7 Spec.
Density gr/cm3 2.207 2.253 2.293 2.328 2.351 -
Stability Kg/cm2 1298.94 1358.40 1390.65 1366.46 1330.18 > 800 kg
Flow mm 3.53 3.57 3.60 3.68 3.80 2 - 4
VIM % 8.88 6.88 5.91 4.73 4.07 3 – 5.
VMA % 18.99 17.21 16.35 15.30 14.71 Min. 15
VFB % 53.23 60.04 63.87 69.11 72.62 Min. 65
MQ kg/mm 365.18 377.43 369.2 381.6 367.3 Min. 250
Table 2. Test results of ITS and fiber modulus without immersion
Composition Test Fiber
Length
Fiber percentage (%)
SI-TP- 0.2 SI-TP- 0.4 SI -TP- 0.6 SI-TP-0.8 SI-TP0.8 SI-TP-1.2
Without
Immersion
ITS
(Kpa)
5 mm 17214.519 18797.851 20684.374 14351.048 13542.538 12632.964
6 mm 16810.265 18932.603 20785.437 13812.041 12936.156 11757.079
8 mm 15462.748 17046.08 18966.291 13037.219 11824.455 10712.754
10 mm 13273.035 14788.99 17113.456 11689.703 10140.059 9129.4223
12 mm 11622.327 12632.964 15260.621 9567.365 8590.4158 6906.0205
14 mm 10274.811 11588.639 13273.035 8354.6004 6703.8931 4817.3704
Elastic
Modulus
(Kpa)
5 mm 1538300.75 1679788.29 1848369.19 1282419.02 1210170.06 1128889.98
6 mm 1502176.27 1691829.78 1857400.31 1234253.05 1155983.34 1050620.28
8 mm 1381761.34 1523248.88 1694840.16 1165014.46 1056641.02 957298.70
10 mm 1186087.07 1321553.87 1529269.63 1044599.53 906122.36 815811.16
12 mm 1038578.78 1128889.98 1363699.10 854946.01 767645.19 617126.52
14 mm 918163.85 1035568.41 1186087.07 746572.57 599064.28 430483.38
Lambang Basri Said et al/ International Journal of ChemTech Research, 2018,11(03): 52-63. 59
Table 3. Test results of ITS and fiber elastic modulus by immersion
Composition Test Fiber
Length
Fiber percentage (%)
SI-DP- 0.2 SI-DP- 0.4 SI -DP- 0.6 SI-DP-0.8 SI-DP0.8 SI-DP-1.2
Treatment
(with
Immersion)
ITS
(Kpa)
5 mm 19290.372 22417.651 24326.937 25314.499 15636.394 12739.546
6 mm 21166.739 24524.449 25775.361 26894.597 17282.33 14780.507
8 mm 19915.828 24261.099 26795.841 27289.622 17183.574 14582.995
10 mm 18599.079 21923.87 23668.562 24326.937 16031.418 12706.627
12 mm 16196.012 18730.754 19487.884 20804.633 13266.246 10369.398
14 mm 11850.741 13694.189 14253.807 15833.906 10138.967 7670.0626
Elastic
Modulus
(Kpa)
5 mm 1669076.5 1939660.55 2104859.25 2190306.9 1352920.4 1102274.1
6 mm 1831426.9 2121948.77 2230182.40 2327023 1495333 1278865.8
8 mm 1723193.3 2099162.74 2318478.25 2361202.1 1486788.3 1261776.2
10 mm 1609263.2 1896936.75 2047894.18 2104859.2 1387099.4 1099425.8
12 mm 1401340.7 1620656.17 1686166.00 1800096.1 1147846.1 897199.82
14 mm 1025371.2 1184873.41 1233293.71 1370009.9 877262.04 663643.04
Table 4. Results of the strain test and Poisson Number of fiber with immersion
Composition Test Fiber
Length
Fiber percentage (%)
SI-TP- 0.2 SI-TP- 0.4
SI -TP-
0.6 SI-TP-0.8 SI-TP0.8 SI-TP-1.2
Without
Immersion
Strain
5 mm 0.01119 0.01200 0.01229 0.01174 0.01064 0.01009
6 mm 0.01145 0.01255 0.01310 0.01200 0.01101 0.01024
8 mm 0.01137 0.01244 0.01317 0.01192 0.01064 0.00972
10 mm 0.01064 0.01178 0.01229 0.01137 0.01009 0.00881
12 mm 0.00972 0.01101 0.01167 0.01046 0.00881 0.00771
14 mm 0.00862 0.01024 0.01046 0.00936 0.00752 0.00642
Possiom
value
5 mm 0.33 0.34 0.36 0.32 0.32 0.31
6 mm 0.35 0.36 0.37 0.35 0.33 0.30
8 mm 0.32 0.34 0.36 0.31 0.31 0.28
10 mm 0.32 0.33 0.35 0.30 0.28 0.27
12 mm 0.31 0.32 0.33 0.29 0.28 0.25
14 mm 0.29 0.30 0.32 0.27 0.25 0.23
Table 5. Results of strain test and Poisson Number of fiber without immersion
Composition Test Fiber
Length
Fiber percentage (%)
SI-DP- 0.2 SI-DP- 0.4 SI -DP- 0.6 SI-DP-0.8 SI-DP0.8 SI-DP-1.2
Treatment
(with
Immersion)
Strain
5 mm 0.01156 0.01211 0.01303 0.01262 0.01119 0.01082
6 mm 0.01211 0.01266 0.01376 0.01343 0.01134 0.01057
8 mm 0.01247 0.01303 0.01486 0.01449 0.01156 0.01009
10 mm 0.01174 0.01266 0.01457 0.01413 0.01064 0.00862
12 mm 0.01082 0.01156 0.01339 0.01303 0.00991 0.00789
14 mm 0.01009 0.01046 0.01101 0.01082 0.00844 0.00679
Possiom
value
5 mm 0.33 0.35 0.36 0.36 0.32 0.31
6 mm 0.34 0.36 0.40 0.39 0.33 0.30
8 mm 0.36 0.38 0.44 0.41 0.32 0.29
10 mm 0.34 0.37 0.41 0.39 0.30 0.28
12 mm 0.31 0.33 0.37 0.34 0.28 0.26
14 mm 0.29 0.30 0.33 0.31 0.25 0.22

Lambang Basri Said et al/ International Journal of ChemTech Research, 2018,11(03): 52-63. 60
Figure 8 shows that there was a difference in the value of ITS to the mixture in the percentage of 0.6% and
0.8% of the fiber weight with the same diameter (0.3 mm), but they were different in lengths; the use of longer
fibers provides lower density values of the mixture that indicates the cavities increase in the mixture with longer
fibers compared to the fibers with a shorter size. The increase of this cavity was caused by the length of the fiber,
also the damage and the changes in length caused by the compaction load; there was a reduction in length and the
increase in the percentage of fiber. Therefore, the percentage and the length of fibers that exceed the effective limits
usage have less profit effect to the characteristics of the resulting mixture6 [36].
Figure 9 shows the relationship of elastic modulus value with the ratio of fiber length. The elastic modulus
value of the fiber without immersion decreases with the ratio of fiber length. Fibers treated with immersion
increased in the ratio of 9.16 to 12.21 (x10-2
) and the highest at 1% percentage.
3000
6000
9000
12000
15000
18000
21000
24000
27000
30000
7.63 12.21 15.27 18.32 18.32 21.37
ITS
(K
pa)
Ratio of Fiber Length (x10-2)
SI-DP-0,2 % SI-DP-0,6 % SI-DP-0,8 %SI-DP-1,0 % SI-DP-1,2 % SI-DP-0,4 %
(a) (b)
Figure 8. The relation of ITS value and the ratio of fiber length: (a) Control; (b) application with immersion
3.00E+04
2.30E+05
4.30E+05
6.30E+05
8.30E+05
1.03E+06
1.23E+06
1.43E+06
1.63E+06
1.83E+06
2.03E+06
7.63 9.16 12.21 15.27 18.32 21.37
Ela
sti
c M
od
ulu
s (K
pa
)
Ratio of Fiber Length (%) SI-TP-0,2 % SI-TP-0,6 % SI-TP-0,8 %
0.00E+00
5.00E+05
1.00E+06
1.50E+06
2.00E+06
2.50E+06
7.63 9.16 12.21 15.27 18.32 21.37Ela
sti
c M
od
ulu
s, E
(K
pa)
Ratio of Fiber Length (x10-2) SI-DP-0,2% SI-DP-0,4% SI-DP-0,6%
(a) (b)
Figure 9. The relation of elastic modulus value and the ratio of fiber length (a) control, (b) application with
immersion
The length factor and the percentage of fiber optimal usage in the mixture showed a random distribution
pattern and forms of a strong structure on the asphalt mixture, which limits the displacement and deformation of the
mixture and provided the tensile stress of the mixture to the excess load. The existence of fibers in the mixture
caused greater tensile pressure with Asphalt Pavement, JTG / F40-20043. To ensure a good distribution of the
mixture, the fiber must have an optimal length6. The structure of the porous network in one bond attached to the

Lambang Basri Said et al/ International Journal of ChemTech Research, 2018,11(03): 52-63. 61
fiber surface, which significantly increased the cohesive strength between the fibers and the mixture, and limited the
slip of the fibers in the mixture6.
Figure 10. The relation of Poisson number with the ratio of fiber length
One of the indicators in determining the level of flexibility of an asphalt concrete mixture is the Poisson
number. Passion score is the ratio between horizontal strain (lateral strain) and vertical strain (axial strain) caused
by parallel load and axial strains24
. Figures 10 and Table 4 indicate the increase of the Poisson number was as the
percentage of fiber increases to the optimum limit of 0.6% with the fiber length of 8 mm and the maximum Poissom
value of 0.44 in treatment and of 0.37 at control, this composition indicates the characteristics of the mixture
having properties with high flexibility, in which the correlation of the balance between fiber length and percentage
gives a more flexible stiffness to maximum tensile stress and further it would decrease as the percentage and the
fiber length on asphalt concrete mixture increase. This indicates that the increase of the percentage and fiber length
would minimize the horizontal strain and vertical strain caused by the increase of cavity in the mixture so that the
mixture becomes inflexible and rigid. The decrease of Poisson number on fibers that were greater than 8 mm had no
significant effect on increasing flexibility and tensile stress on the mixture.
4. Conclusions
From the research results of fiber treatment model in improving the performance of asphalt concrete
mixture, we can conclude that:
a. The treatment of sea water immersion on the fiber made a higher morphological change of roughness on the
surface layer than without sea water immersion.
b. The fibers without an immersion had a higher stiffness modulus than the immersed fibers.
c. The use of fiber on asphalt concrete mixture improved the performance of tensile strength and elastic modulus
d. The optimum percentage of 0.6% fibers usage with 0.8 mm length provides a high ductility mixture in the
maximum strain of 0.01486 and indirect tensile strength.
e. It is necessary to adjust the temperatures of the mixing process in order to reduce the risk of damage to fiber
during the compaction process.

Lambang Basri Said et al/ International Journal of ChemTech Research, 2018,11(03): 52-63. 62
References
1. Oda S, Fernander JL, IIdefonso JS. Analysis of use of natural fibres and asphalt rubber binder in
discontinuous asphalt mixes. J Constr Build Mater., 2012, 26: 13–20.
2. Mahrez A, Karim M, Katman H. Fatigue and deformation properties of glass fiber reinforced bituminous
mixes. J East Asia Soc Trans Stud., 2005, 6: 997–1007.
3. García A, Contreras JN, Partl MN, Schuetz P. Uniformity and mechanical properties of dense asphalt
concrete with steel wool fibers. J Constr Build Mater., 2013, 43: 107–117.
4. Khattak MJ, Khattab A, Rizvi HR. Characterization of carbon nano-fiber modified hot mix asphalt
mixtures. J Constr Build Mater., 2013, 40: 738–745.
5. Wu S, Ye Q, Li N, Yue H. Effects of fibers on the dynamic properties of asphalt mixtures. J. Wuhan Univ
Technol – Mater Sci Ed, 2007, 22: 733–736.
6. Qiang X, Lei L, Yi-jun C. Study on the action effect of pavement straw composite fiber material in asphalt.
J Constr Build Mater., 43, 2013, 293–299.
7. Abathi SM, Sheikhzadeh M, Hejazi SM. Fiber-reinforced asphalt-concrete-a review. J Constr Build Mater.,
2010, 24: 871–877.
8. Abiola OS, Kupolati WK, Sadiku ER, Ndambuki JM. Utilization of natural fiber as Modifier in bituminous
mixes: a review. J Constr Build Mater., 2014, 54: 305–312.
9. Putman BJ, Amirkhanian SN. Utilization of waste fibers in stone matrix asphalt mixtures. J Resour
Conserv Recc, 2004, 42: 265–274.
10. Chen JS, Lin KY. Mechanism and behavior of bitumen strength reinforcement using fibers. J Mater Sci,
2005, 40: 87–95.
11. Isla F, Luccioni B, Ruano G, Torrijos MC, Morea F, Giaccio G, Zerbino R. Mechanical response of fiber
reinforced concrete overlays over asphalt concrete substrate: experimental results and numerical simulation.
J Constr Build Mater., 2015, 93: 1022-1033.
12. Yin AY, Yang XH, Zeng GW. Fracture simulation of pre-cracked heterogeneous asphalt mixture beam with
movable three-point bending load. J Constr Build Mater., 2014, 65: 232–242.
13. Highway Research Institute of the Transportation Department. Standard test methods of bitumen and
bituminous mixtures for highway engineering (JTG E20-2011). In: China communications Press, Beijing.
2011, 186-356.
14. Mardin. Sifat mekanik bio komposit serat ijuk dan matriks kanji sagu. PhD Thesis. Program Study of
Mechanical Engineering. Universitas Brawijaya, Malang, 2015.
15. Brown SF, Rowlett RD, Boucher JL. Asphalt modification. In: Proceedings of the Conference on the United
States Strategic Highway Research Program: Sharing the Benefits. London: Thomas Telford, 1990, 181–
203.
16. Fitzgerald RL. Novel applications of carbon fiber for hot mix asphalt reinforcement and carbon–carbon
pre-forms. MSc Thesis. Department of Chemical Engineering, Michigan Technological University; 2000.
17. Huang H, White TD. Dynamic properties of fiber-modified overlay mixture. Trans Res Recy., 1996, 1545:
98–104.
18. Chen H, Li N, Hu C, Zhang Z. Mechanical performance of fibers-reinforced asphalt mixture. J Chan Univ
– Nat Sci (Eds.), 2004, 24(2): 1–5.
19. Maurer AD, Gerald M. Field performance of fabrics and fibers to retard reflective cracking. Trans Res
Recy., 1989, 1248: 13–23.
20. Mahrez A, Karim M, Katman H. Prospect of using glass fiber reinforced bituminous mixes. J East Asia
Soc Trans Stud, 2003, 5: 794–807.
21. Goel A, Das A. Emerging road materials and innovative. In: National Conference on Materials and Their
Application in Civil Engineering. Hamipur, India; August, 2004.
22. Hansen R, McGennis B, Prowell B, Stonex A. Current and future uses of non-bituminous components of
bituminous paving mixtures. Transportation in the new millennium. Washington (USA): TRB A2D02,
2000.
23. Ministry of Transport of the People’s Republic of China. Technical specifications for construction of
highway. Asphalt Pavement, (JTG/F40-2004).
24. Yoder EY, Witczak MW. Principles of pavement design. New York: Wiley Interscience Publication, 1975.
Lambang Basri Said et al/ International Journal of ChemTech Research, 2018,11(03): 52-63. 63
*****
For Your Research Reference Requirements, always log on to –
www.sphinxsai.com
International Journal of ChemTech Research,
International Journal of PharmTech Research
*****