Embed Size (px)
Citation preview

ANO 2004/8
Oslo
April 16, 2004
Working PaperResearch Department
The market impact and timing of open market share repurchases in Norway
by
Johannes A. Skjeltorp

ISSN 0801-2504 (printed) 1502-8143 (online)
ISBN 82-7553-238-8 (printed), 82-7553-239-6 (online)
Working papers from Norges Bank can be ordered by e-mail:[email protected] from Norges Bank, Subscription service,P.O.Box. 1179 Sentrum N-0107Oslo, Norway.Tel. +47 22 31 63 83, Fax. +47 22 41 31 05
Working papers from 1999 onwards are available as pdf-files on the bank’sweb site: www.norges-bank.no, under “Publications”.
Norges Bank’s working papers presentresearch projects and reports(not usually in their final form)and are intended inter alia to enablethe author to benefit from the commentsof colleagues and other interested parties.
Views and conclusions expressed in working papers are the responsibility of the authors alone.
Working papers fra Norges Bank kan bestilles over e-post:[email protected] ved henvendelse til:Norges Bank, AbonnementsservicePostboks 1179 Sentrum0107 OsloTelefon 22 31 63 83, Telefaks 22 41 31 05
Fra 1999 og senere er publikasjonene tilgjengelige som pdf-filer på www.norges-bank.no, under “Publikasjoner”.
Working papers inneholder forskningsarbeider og utredninger som vanligvisikke har fått sin endelige form. Hensikten er blant annet at forfatteren kan motta kommentarer fra kolleger og andre interesserte.
Synspunkter og konklusjoner i arbeidene står for forfatternes regning.
The market impact and timing of open market
share repurchases in Norway∗
Johannes A. Skjeltorp†
Norges Bank, Bankplassen 2, 0107 Oslo, Norway andNorwegian School of Management (BI)
April 16, 2004
Abstract
This paper examines a detailed dataset on open market repurchase announcementsand actual repurchases conducted by Norwegian firms during the period 1998-2001.Firms that announce a repurchase plan experience a positive excess return around theannouncement date. However, these firms also experience an abnormal performanceafter the announcement, suggesting that the market underreacts to the positive signalconveyed through the announcement. When examining the sample of actual repur-chases, we find that there is a positive price impact around the execution dates,indicating that the market puts a positive value on the information conveyed throughthe actual repurchases. In the long run, only announcing firms that do not repurchaseexperience a significant positive abnormal performance, while a portfolio tracking therepurchasing firms perform according to expectations. In addition, announcing firmsthat do not repurchase are less liquid than repurchasing firms. One suggested explana-tion for the finding is that firms by executing repurchases mitigate the undervaluationby confirming their initial signal through actual transactions such that these firmsperform as expected in the long run. Due to the lower liquidity of non-repurchasingfirms, they are likely to be constrained from exploiting mispricing and unable to signalundervaluation to the market. If this is the case, the price remains too low, and in-formation surprises in later periods contribute to the long term abnormal return driftfor these companies.
Keywords: Open market share repurchases, asymmetric informationJEL Codes: G14, G32
∗The views expressed are those of the author and should not be interpreted as reflecting those ofNorges Bank. The author is grateful to Bernt-Arne Ødegaard, Randi Næs, Tommy Stamland, Bent Valeand participants at seminars in Norges Bank for providing useful comments and suggestions. All remainingerrors or omissions are the author’s.
†E-mail: [email protected] Phone: (+47) 22316740 Fax: (+47) 22424062
1

1 Introduction
Corporations distribute an increasingly larger amount of their cash to shareholders throughrepurchases relative to cash dividends. Grullon and Michaely (2002) show that, in the US,expenditures on share repurchase programs relative to total earnings increased from 4.8%in 1980 to 41.8% in 2000. Moreover, they also report that the number of firms repur-chasing shares as a fraction of firms initiating a cash distribution increased from 26.6% in1972 to 82% in 2000, and that US firms used as much money on repurchases as on cashdividends in 2000. This result suggests that share repurchases has become the preferredpayout method for many firms in the US. Also outside the US, in e.g. Canada, France,Australia and the UK, there has been a growth in the repurchase activity. In recent yearsseveral countries where repurchases previously were prohibited now allow firms to repur-chase their own shares. Among these countries is Norway, where share repurchases wereallowed from 1999. The main objective of this paper is to provide a detailed examinationof the open market repurchase activity among Norwegian firms from 1999 through 2001.Furthermore, we examine whether an announcement effect and support for the underre-action hypothesis in Ikenberry et al. (1995, 2000) is found in the Norwegian data. Theunderreaction hypothesis states that the market treats the announcement of an open mar-ket share repurchase program with scepticism, incompletely reacting to the informationconveyed through the announcement such that prices adjust slowly over time. One reasonfor this slow adjustment may be that information is incorporated into prices at later pointsin time when the firm disclose new information to the market. In line with results for othercountries, we find that announcing firms experience a positive announcement effect, anda long run drift in abnormal returns in the same direction as the announcement effectrelative to several model specifications.
Due to the strict disclosure rules in Norway, we are also able to study the price effectof actual repurchases at a daily level. By combining the announcement and repurchasedata, we investigate whether the abnormal performance after announcements of repurchaseprograms depend on the repurchase activity of announcing firms. The motivation for this isthat if the market treats the initial announcement with skepticism, the actual repurchasesmay be a more credible signal about undervaluation since it involves real transactions bythe firm. Thus, the actual repurchase may confirm the initial signal such that the marketadjust prices closer to the true value in response to the actual repurchases.
Our results provide additional insight into the long term performance of announcingfirms. The findings suggest that the abnormal performance of announcing firms as agroup, to a large degree is related to firms that do not execute any repurchases afterthey have announced. In addition, the results suggest that liquidity constraints mayrestrict these firms from executing repurchases. One interpretation of this finding is thatthese firms experience excess returns when information is revealed to the market throughpublic information surprises in later periods, and that they are unable to confirm theirinitial signal through actual repurchases. On the other hand, the firms that actuallyrepurchase shares, may successfully confirm their initial signal of undervaluation throughreal transactions such that subsequent returns (after the first repurchase) fall to expectedlevels. If this is the case, requiring firms to report their repurchase activity in a timelyfashion, as in Norway, may help improve price discovery and efficiency. An alternativeinterpretation of the result may also be that firms that actually repurchase shares areexpected to do so. In other words, these companies may be those that successfully (andmost credibly) are able to signal that they are undervalued through the announcement
2

such that they are no longer undervalued after the announcement. However, we would notexpect these firms to repurchase shares for undervaluation reasons after the announcement.In addition, we do not find that there is a significant different announcement effect forannouncements that result in subsequent repurchases and those that do not.
Overall, in addition to providing evidence on open market share repurchases in amarket where repurchases has recently been allowed, we believe that repurchases in Norwayare particularly interesting to study due to the legal requirement that firms report theirrepurchase activity on a daily basis. By exploiting these unique data, we provide newevidence with respect to open market repurchases, and how the market reacts to theactual repurchase executions.
Why firms choose to repurchase shares has gained a lot of attention, especially in theUS which has the longest history of repurchases. At a general level, a repurchase is merelyan alternative way of paying out cash to shareholders. Initially, whether a firm chooses onepayout method over the other should not matter for firm value, and hence the shareholdersof the firm. In a perfect world with no frictions or information asymmetries, whether thefirm chooses to pay out some of its cash pro rata through dividends, or use the same cashto buy shares back from some shareholders should not affect the value of the firm becausea buyback reduces assets in a way that offsets the reduced number of shares with cashflow rights, and should leave the price for the remaining stocks unaffected. In addition,since investors allocate their funds relative to their preferences and risk tolerances, anychanges in the payout policy of the firm can be offset by portfolio rebalancing. How-ever, several studies (e.g. Vermaelen (1981), Comment and Jarrell (1991), Ikenberry et al.(1995), Ikenberry et al. (2000)) find that firms announcing a repurchase plan experiencean abnormal price increase around the announcement, indicating that the announcementmust have some economical benefits to shareholders. This is not surprising in the sensethat we know that information asymmetries are important with respect to the pricing ofassets and that actions by the firm (e.g. payout announcements) may help the marketextract enough information to move the price closer to the full information value (Millerand Rock, 1985).
The literature on repurchases provides a vast amount of suggestions for why one shouldexpect a positive announcement effect. However, one of the most prevalent hypotheses,which is the main topic of this paper, is the signalling hypothesis discussed in e.g. Vermae-len (1981, 1984). The signalling hypothesis assumes that there is asymmetric informationbetween the managers and the market, and that the initiation of a repurchase plan is apositive signal about the value of the firm that the market yet has failed to incorporateinto prices. If the managers of a firm have better information about the current earningsand future prospects of the firm, and the firm is priced too low relative to their informa-tion set, they can convey this to the market by announcing a repurchase plan. In short,a repurchase announcement indicates that the firm’s managers believe that the stock istrading below fair value, such that the stock price should rise as the market reacts to thenew earnings information that it infers from the signal.1 The motivation for managers toinitiate a repurchase plan may be to increase the market value of the firm to avoid costsof undervaluation (such as e.g. reduce the probability of takeover which could replacethe managers). If the signalling hypothesis is true, and markets are semistrong efficient,the announcement of a repurchase plan should induce the market to quickly correct the
1In the early literature there is also a negative signal interpretation of stock repurchases which arguethat a repurchase is a signal that the firm does not have any profitable investment opportunities.
3

mispricing. To assess the market valuation of the repurchase signal, the price impact ofrepurchase announcements has been studied across several countries and time periods.The results in Vermaelen (1981), Dann (1981), Comment and Jarrell (1991), Stephensand Weisbach (1998), Ikenberry et al. (1995, 2000) among others, find support for thesignalling hypothesis in that there is a significant positive abnormal return of about 2%around the announcement date.2
Although the signalling hypothesis is the most frequently mentioned explanation forwhy firms announce repurchase programs, and the observed announcement effect, thereis also a vast amount of other explanations which will be discussed in more detail insection 2. Among these are capital structure adjustments (Vermaelen, 1981; Opler andTitman, 1996), disgorgement of excess cash (Jensen, 1986; Stephens and Weisbach, 1998;Jagannathan et al., 2000), substitution for cash dividends (Grullon and Michaely, 2002),takeover defense (Denis, 1990; Bagwell, 1991; Dittmar, 2000), shareholder expropriation(Brennan and Thakor, 1990), to counter the dilution effects of employee and managementoptions (Fenn and Liang, 1997), personal taxes (Masulis, 1980; Lie and Lie, 1999; Grullonand Michaely, 2002) and manipulating EPS figures (Bens et al., 2002).
Although, support for the signalling hypothesis has been found for many markets andtime periods, one puzzle is that the market seems to underreact to the announcementsignal. This lines up with an emerging body of empirical literature suggesting that themarket underreacts to new information about firms cash flows. Events that are likely tocontain relevant information about current or future cash flow, such as earnings surprises,dividend initiations and omissions, as well as the announcements of repurchase plans, arefollowed by an abnormal stock-price drift in the same direction as the initial announcementreturn. For repurchase announcements, this is documented by Ikenberry et al. (1995) forthe US, and for Canada by Ikenberry et al. (2000). Initially, if the market efficiently, and inan unbiased fashion, adjusts the price as a response to the announcement signal, these firmsshould not experience an abnormal performance following the announcement. However,both studies find that firms announcing an open market repurchase plan experience apositive drift in abnormal return in the long run (up to 4 years) after the announcement.This finding suggests that the market underreacts to the initial signal by ignoring a largepart of the signal value. In other words, the observed positive price adjustment around therepurchase announcement is not sufficient to correct the mispricing. In Ikenberry et al.(1995) the market’s valuation of the signal conveyed through the repurchase announcementis about 3.5% while a portfolio of the same firms experience a risk adjusted performanceof 12.1% the years following the announcement.
However, one problem with the signalling hypothesis is that, in the case of open mar-ket repurchases, the announcement of a repurchase plan is not a commitment from thefirm to repurchase shares. Furthermore, as argued in Comment and Jarrell (1991), theannouncement of an open market repurchase plan is a weak signal since it does not imposeany costs to the manager if it is false. Thus, the apparent underreaction observed for openmarket repurchases may be a rational reaction (as opposed to an irrational underreaction)
2Comment and Jarrell (1991) and Ikenberry et al. (1995) find an announcement effect in the US of 2.3%(for the period 1985-1988) and 3.5% (1980-1990) respectively. In addition Comment and Jarrell (1991)examine Dutch auction repurchases and tender offer repurchases, which have a 11% and 8% price impactrespectively. They argue that tender offer repurchases have the strongest signalling ability of the three.For Canada, Li and McNally (2002) find a announcement effect of 0.9% (for the period 1995-1999). Lasfer(2000) find the effect to be 1.64% in the UK, 1% for continental Europe, 0.78% in France and 0.63% forItaly over the period 1985 to 1998.
4

since the signalling power of the announcement is weak. Moreover, the market is unableto distinguish truly undervalued firms from falsely signalling firms, and treat the signalwith skepticism. On the other hand, if managers owns shares in the firm and committhemselves to retaining their shares during the repurchase period, the power of the signalwould be stronger.3 Such commitments are rarely observed for open market repurchases.However, as discussed by Comment and Jarrell (1991), one type of repurchase where man-agers often pre-commit to retaining their shares are tender offer repurchases. In thesecases, a false signal would be more costly to the manager since it would reduce his wealthif the firm distributes cash to tendering shareholders above the true value. Their findingssupport this as tender offer repurchases experience a much stronger announcement effectthan open market repurchases.
Further, tender offer repurchases are generally for larger volumes than open marketrepurchases, and the repurchases are executed very close in time to the announcement.Thus, there is no uncertainty with respect to whether the firm will repurchase or not. Inthe case of open market repurchases, on the other hand, the actual repurchases may occura long time after the announcement, if at all. Since actual repurchase executions reflectreal transactions, they potentially reduce the manager’s wealth if he has a stake in thecompany, retains his shares and execute repurchases when the firm is overvalued. Thus, itis plausible that an actual repurchase may constitute a stronger signal (or a confirmationof the initial signal) of undervaluation than the initial announcement. This is one of theissues we will investigate in this paper. An additional motivation for studying the actualrepurchases in detail is a survey in Institutional Investor (1998), which notes that less thanone quarter of the companies that had announced a repurchase plan during a specific periodin the US had actually completed the amount that they announced that they intended torepurchase. Furthermore, as discussed by Stephens and Weisbach (1998), an issue that hasnot been addressed in the academic literature, but has been a concern among practitionersand the popular press, is that the actual repurchase activity among firms that announcea repurchase plan is small relative to what the intention is at announcement.4 A concernthat has been raised in the popular press is that the announcement of a repurchase planis a way for the management to raise the stock price at little or no cost in the shortrun. In fact, Kracher and Johnson (1997) argue that many firms in the US announcerepurchase plans with no intention of repurchasing. One of their arguments is that sincethe reporting standards in the US, with respect to open market repurchases, are veryloose, it is difficult for investors to actually know whether announcing firms under normalcircumstances are actually going through with the repurchase plan. Their main suggestionis that US firms should be required to report the progress of the repurchase plan such thatthey are motivated to only announce a repurchase plan when their intentions are true.Interestingly, this is exactly the case for Norwegian firms, in that they are required bylaw to report their repurchases within the same trading day or before the trading sessionstarts the next day.
This brings us back to the main topic of this paper. If the market is concerned withthe announcements of repurchase plans being false signals due to the lack of commitmentto actually repurchase, it is interesting to examine whether the actual repurchases are
3However, managers rarely commit to retaining their shares during the repurchase period such thatthey may also use the repurchases to sell their own shares at a high price (Fried, 2002).
4They refer to two articles in The Wall Street Journal (March 7, 1995) and Fortune (September 4,1995). More recent articles expressing the same concern are articles in Fortune (September 8, 1997) andForbes (June 21, 2001).
5

perceived by the market as valuable information, confirming the firms’s initial intentions.It may be that requiring firms to report their repurchase activity help improve pricediscovery and price efficiency when there is asymmetric information between the managersof the firm and the market. Especially if the firm is unable to convey this informationthrough explicit announcements.
The paper has three contributions to the existing literature. First, we examine theannouncement effect and long-term performance of repurchasing firms in a market whererepurchases recently have been allowed. The paper provides a descriptive examinationof the growth of repurchases in Norway for the period 1999 through 2001, and examineswhether an announcement effect and a long term abnormal performance (underreaction)is observed for Norwegian firms that announce a repurchase program.
The second contribution is that we are able to examine the actual repurchase activity ofannouncing firms. While the literature to a large extent has focused on the announcementsof repurchase plans, we examine in more detail the market reaction to actual repurchasestransactions on a daily frequency as well. Due to the difficulty in measuring actual re-purchases in the US5 only a few studies examine the actual repurchase activity of firms.Notable exceptions are Stephens and Weisbach (1998), Jagannathan et al. (2000), Dittmar(2000), Ikenberry et al. (2000) and Chan et al. (2003).6 However, since these papers onlyhave access to monthly, quarterly and annual data, and use noisy measures of the actualrepurchase activity (for the US) they are unable to examine in detail any price effects andthe timing of these repurchases in the short term. Thus, by exploiting detailed informationon actual repurchases we are able study the timing of repurchase executions and the priceeffect around these repurchases on a daily frequency. Moreover, we are able to exam-ine whether the repurchases represent trading opportunities/undervaluations exploited bythe managers of these firms, and whether the market perceives the repurchase as a signalabout firm value. In a related paper by Stephens and Weisbach (1998), they examine thedeterminants of actual repurchases during the repurchase period and find that managersrepurchase more shares when the stock price falls and that firms adjust their repurchaseactivity to their cash position.
The third contribution of the paper is to combine the announcement and actual repur-chase data to examine wether the long run performance of firms that actually repurchaseshares is different from firms that do not repurchase any shares.
The empirical section of the paper consists of four main parts. The first part providesa description of the repurchase activity among Norwegian firms during the first threeyears that repurchases were allowed in Norway.7 The second part examines whether theempirical regularities (announcement effect and long term positive excess performance)found in other studies (especially in the US and Canada) also are evident in the Norwegiandata. The third part of the paper examines whether the performance of firms that actuallyrepurchase are different from announcing firms that do not. The fourth part of the paperexamines in more detail the price impact and timing of actual repurchases. Before wepresent the results we will in the next section go through the empirical and theoreticalliterature on repurchases in more detail to review the proposed reasons for why one should
5Due to the loose reporting requirements of repurchases in the US, previous studies have to rely onestimating the repurchase activity based on financial statements or other data sources.
6In a recent paper by Brockman and Chung (2004) they exploit a similar dataset as examined in thispaper from Hong Kong where the disclosure requirements are similar as in Norway.
7Note that firms were allowed to announce repurchase programs before 1999, but were not allowed toexecute any repurchases before 1999.
6

expect a positive price impact at the announcement. In section 3 we give an overview ofthe institutional and regulatory aspects of repurchases in Norway. In section 4 we discussthe dataset, and explain the empirical methodology in section 5 before the results fromthe various analyzes are presented in section 6 and a summary is provided in section 7.
2 Theoretical predictions
The decision taken by the firms to initiate a repurchase program is a strategic choice be-tween debt and equity as well as a choice of how much dividend to pay out. In a Miller andModigliani (1961) setting where capital markets are perfect, this choice does not matter forthe value of the firm. However, as the perfect market assumption is relaxed, one gains theinsight that capital market imperfections and taxes are important determinants of corpo-rate financial policies. Although this study mainly focuses on the signalling hypothesis, wealso review some of the most commonly proposed hypotheses aimed at explaining the priceimpact and its direction with respect to repurchase announcements. Many of the hypothe-ses are not mutually exclusive, and most of the hypotheses predict a positive price impact.
Asymmetric information explanations
The traditional signalling hypothesis is motivated by asymmetric information between themanagers of a firm and the market place. Since managers through their positions in thefirm are expected to have important private information, they, based on their informationset, may assess the true value of the firm to be different than the current market valuation.It is important to note that this relates to information that is not easy or impossibleto convey to the market through a public disclosure. For example, the company maynot want to explicitly disclose the information for competitive reasons or because it isconstrained by confidentiality agreements. This information may both indicate that thecurrent market valuation is above or below what the manager perceives as the true valueof the firm. The motivation for managers to initiate a repurchase plan may be to increasethe market value of the firm to avoid costs of undervaluation (e.g. reduce the probability oftakeover which could replace the management team). Vermaelen (1981), Dann (1981) andComment and Jarrell (1991) among others, argue that the announcement of a repurchaseplan is a valuable signal to the less informed marketplace about undervaluation becausethe managers of a firm potentially know more about the future prospects of the firm,current earnings and current investment opportunities. Thus, a repurchase is a vehicle forcommunicating valuable information to shareholders and the market, and is perceived byinvestors as a signal of management’s assessment of company value. Furthermore, in Bravet al. (2003), managers often mention undervaluation as an important motive for whythey repurchase shares. As a consequence, the observed stock-price increase around theannouncement of a repurchase program is often interpreted as support for the signallinghypothesis. Alternatively, a repurchase announcement may also be interpreted by themarket as if the firm does not have any profitable use of its internally generated funds.Thus, the direction of this signal may be ambiguous, but is most commonly hypothesizedto be positive.
However, there are a few sensitive issues with respect to the signalling hypothesis,especially with respect to open market repurchase announcements. First, for a signal aboutundervaluation to be credible, it needs to impose substantial costs on the manager. If
7

managers could commit to retaining their shares through the repurchase period, as well ascommitting the firm to actually execute repurchases, the credibility of the signal would bestronger the greater the ownership of the manager or other primary insiders. Through suchcommitments, it would be costly to the manager if the firm initiates a repurchase programwhen the firm is overvalued since the repurchase would increase the managers ownershipin the overvalued firm. However, since firms seldom commit to actually repurchasingany shares (unless in the case of tender offer repurchases), and managers rarely committhemselves to retaining their own shares through the repurchase period, the credibility ofthe open market repurchase announcement may be questionable.
As discussed in Fried (2002), there is a theoretical inconsistency with respect to thesignalling hypothesis in the sense that it requires managers to sacrifice their own wealthto increase that of shareholders. If managers act opportunistically, Fried (2002) arguesthat they will use open market share repurchases in two situations. First, they do notuse repurchases to signal undervaluation, but rather initiate repurchases when the firmis undervalued with the motivation of transferring wealth to themselves (and the remain-ing shareholders). This, however, is still consistent with the signalling hypothesis sincethe market will observe the repurchase announcement (and subsequent repurchases) andinterpret this as the firm being undervalued. Moreover, while the signalling hypothesispredicts that managers attempt to credibly communicate that the stock is underpriced, themanagerial opportunism theory predicts that managers try not to reveal that the stockis underpriced. However, this may be difficult or even impossible since repurchases, atleast in Norway, are observable (the day after the repurchase) to the rest of the market.8
In the US on the other had, the firm is not required to report their repurchase activity,such that it would be easier for the the manager to repurchase shares without revealingthis to the market. Furthermore, Fried (2002) argues that the second situation in whichopportunistic managers announce a repurchase plan is when they want to sell their ownshares.
A model that directly addresses the credibility issue related to open market sharerepurchase announcements is Isagawa (2000). In that model, the credibility of the an-nouncement is restored when the manager’s monetary compensation depends on the futurestock price (either through share-ownership or options). Whether the manager chooses toinvest free cash in an unprofitable project or not depends on the private benefits to themanager. Moreover, if the private benefit of investing in the unprofitable project (anddecreasing the firm value) is smaller than the monetary compensation from increased firmvalue, he will repurchase shares instead of investing in the unprofitable project. Thus, theannouncement of the repurchase program conveys information about the managers privatebenefits and signals to the market that the manager is committed not to waste cash onunprofitable projects. Thus, in firms where the manager has a high ownership stake oroptions, the announcement of a repurchase plan may be a credible signal to the market.In this model, the manager does not signal undervaluation, but rather convey informationthat agency costs of free cash is less likely to occur.
Another theoretical contribution related to asymmetric information between the firmand the market is a paper by Barclay and Smith (1988) who argue that the implicit costsof trading the stock in the market increases after the firm has announced a repurchaseplan. The main motivation of their model is to explain why firms in the US distribute
8Fried (2002) does not discuss another alternative in which an opportunistic manager instead buysundervalued shares on his own account without initiating a repurchase plan.
8

more cash through dividends relative to repurchases despite the tax benefit of repurchasesrelative to dividends. Their main argument is that the adverse selection component ofthe bid ask spread increases due to the increased probability of trading with an informedinvestor, the firm. The wider spread raises the required rate of return, reduces corporateinvestments and lowers firm value. Because of this they argue that firms prefer to usedividends to pay out cash. The early literature on repurchases in the US was puzzledby the fact that so few firms repurchased shares. However, later years there has been alarge increase in cash distributed through share repurchases relative to dividends in theUS (Grullon and Michaely, 2002).
In a model by Brennan and Thakor (1990), they argue that different incentives of be-coming informed among shareholders, when information gathering is costly, is importantwhen firms decide to repurchase shares. They argue that share repurchases causes a wealthredistribution from small, uninformed, shareholders to large, informed shareholders. Themain assumption is that information gathering is costly, inducing only large shareholdersto becoming informed. Thus, informed investors are able to bid for undervalued stocksand avoid over-valued ones. Since the small investors are unable to condition their tradingon the trading of the better informed investors, they will be left with a higher stake inovervalued firms and a lower stake in undervalued firms. Since dividends do not havethis problem because they are pro-rata, the Brennan and Thakor (1990) model predictsthat large shareholders will prefer cash to be distributed through repurchases, while smallinvestors prefer cash dividends. Thus, an implication of their model is that the choiceof cash distribution method depends on the ownership composition in the firm, and thatfirms with high ownership concentration would be more likely to use repurchases.
Free cash-flow hypothesis
As discussed in Jensen (1986), repurchases is an alternative to increasing dividends, orissue new debt, to pay out excess cash to mitigate agency costs of free cash.9 In line withthe suggestions in Jensen (1986), both Stephens and Weisbach (1998), Dittmar (2000) andJagannathan et al. (2000), among others, find that firms in fact use repurchases to pay outcash flows that have a low probability of being sustainable, while dividend increases reflecthigher expected permanent cash flows. Moreover, since firms seem to smooth dividends,and are reluctant to reducing dividends (Lintner, 1956; Brav et al., 2003), a repurchase isa way for firms with volatile cash flows to distribute temporary cash without increasingdividends. Thus, since a repurchase may mitigate agency costs of free cash, one wouldexpect a positive price impact from a repurchase announcement. In addition, as discussedearlier, in firms where the manager has an ownership in the firm, the announcement of arepurchase plan may be a credible signal that the manager does not want to waste freecash on unprofitable projects (Isagawa, 2000).
Personal taxes
The personal tax hypothesis argues that firms repurchase their own shares so that the9As defined by Jensen (1986), free cash flow is the remaining cash within a firm after all projects with
positive net present values have been funded. Alternative ways of reducing the agency cost of free cashflow is through e.g. new debt, dividends or repurchases. Debt is the most credible method to counter thefree cash flow agency problems since it is a binding commitment whereas repurchase announcements anddividend increases are not.
9

shareholders can benefit from the tax advantage of a repurchase, which (in the US) istaxed at capital gains rates, relative to dividends, that are taxed at higher ordinary in-come tax rates. Thus, if the cash payout is kept fixed, personal taxes are reduced if thefirm uses repurchases instead of dividends to distribute cash. This argument implies thatthe announcement should have a positive effect on the stock price due to the relativetax advantage to shareholders. However, there are several problems with this hypothesis.First, for the US, the tax differential is not necessarily the main explanation due to theUS tax code which states that repurchases only qualify as capital gains if the distributionis essentially not equivalent to paying dividend. Thus, if the repurchase program is ofthe same magnitude and at the same frequency as dividend payments, the repurchase isnot classified as capital gains, but instead taxed at ordinary income tax rates. On theother hand, as mentioned by Allen and Michaely (2003), they are not aware of any caseswhere the IRS has taxed a repurchase as ordinary income. Secondly, studies from coun-tries where there is no tax advantage to repurchases, find a positive announcement effectof the same magnitude as in the US. Thirdly, Black and Scholes (1974) argue that inan equilibrium where companies have adjusted their payout policies to match the payoutpolicies demanded by investors with different tax schedules, a further adjustment in pay-out policy should not affect the stock price. Finally, results in Brav et al. (2003) suggestthat the relative taxation of capital gains and dividends is unimportant when mangerschoose between dividends and repurchases. Thus, the predicted effect of the personal taxargument is not clear, and empirical results do not show strong support for it.10
Leverage hypothesis
Another explanation for the announcement effect is that the repurchase can be financedby an issue of debt. The leverage argument is that due to the tax subsidy from interestpayments, and that a part of this subsidy is passed on to the shareholders, the price ofthe stock is expected to rise in connection to the repurchase. Thus, the firm will exploitthe benefits of higher leverage by altering its capital structure and this will affect thevalue of the firm and the wealth of the remaining shareholders. Repurchases may also beused to obtain an optimal leverage ratio. As discussed in e.g. Vermaelen (1981) and Oplerand Titman (1996), repurchases are used by firms to reduce their equity and increase theleverage ratio. When firms are below their target ratio, firms are more likely to repurchasestock. A related hypothesis is the bondholder expropriation hypothesis discussed in Dann(1981), where a repurchase reduces the assets of the company in such a way that the valueof the claims of the bondholders is reduced. Thus, if this potential expropriation of thebondholders has not been taken into account in the pricing of the bond issues, there willbe a wealth transfer from bondholders to the stockholders of the firm.
Takeover defense
A repurchase may also be used by a firm as a defensive payout in response to hostiletakeover attempts. Denis (1990) examine defensive changes in corporate payout policy11
for a sample of firms in the US. The main finding is that repurchases is an effectivedevice for countering hostile takeovers, as there is a high probability of the target firm
10Much of the earlier literature on repurchases in the US were motivated by the puzzle that despite therelative tax advantage of repurchases to dividends, firms preferred dividends as the main payout method.
11Denis (1990) examine defensive share repurchases and special dividends.
10

maintaining independence.12 The effect of a firm announcing a defensive repurchase ishighly negative which suggests that defensive repurchases are associated with losses forthe shareholders of the target firm. This in the sense that defensive repurchases reduce theprobability that there will be a valuable restructuring within the firm that could lead to amore efficient use of firm resources. Bagwell (1991) proposes a model with heterogenousvaluations among current shareholders and an upward sloping supply curve for for thecompany shares. A repurchase removes current shareholders with the lowest valuationssuch that a more expensive pool of shareholders are left. Also Bagnoli and Lipman (1989)propose a model where there is asymmetric information between the manager and themarketplace, and that repurchases convince current shareholders that the firm value ishigher, revising their price upwards, such that a takeover attempt becomes more costlyfor the bidder.
Other hypotheses
There are also several other hypotheses that aim at explaining why firms repurchase sharesas well as the positive price effect associated with (non defensive) repurchase announce-ments. Dittmar (2000) find evidence that repurchases are used to counter the dilutioneffect of management- and employee options, while Fenn and Liang (1997, 2001) findevidence that repurchases are used to increase the value of such stock options and thatthe increase in management stock options may explain the increased use of repurchases.Bens et al. (2002) argue that repurchases are used to increase earnings per share (EPS)figures and Grullon and Michaely (2002) find evidence that dividends are substituted forrepurchases due to several of the issues discussed above.
3 Repurchases in Norway
3.1 Repurchase methods
There are mainly three methods for firms to repurchase their own shares; through tenderoffers (fixed price offers), open market transactions or via Dutch auction repurchases.The two first methods are used to a larger extent than the latter, and in the US, openmarket transactions are observed more frequently than tender offers. In fact, 90% of thecases between 1985 and 1993 were open market transactions as discussed in Ikenberryet al. (1995) and Stephens and Weisbach (1998). Open market repurchase programs,where there is an upper limit on how much shares the company can repurchase, are oftenreferred to as “Normal Course Issuer Bids”, whereas fixed price tender offers which donot have any limit to the amount of stock that can be repurchased is commonly called“Substantial Issuer Bids”. In a tender offer, the reacquiring firm offers to repurchase afraction of its shares at a specific price, usually at a premium to the market price. Inan open market repurchase, on the other hand, the purchase is executed through brokersin the open market at normal commissions rates, and no premium is paid.13 Thus, open
12Those firms that remain independent show a significantly lower abnormal returns after the takeoverattempt than those that were successful takeovers.
13At least no direct premium is paid. As argued by Barclay and Smith (1988), the announcement of arepurchase plan may lead to increased implicit transaction costs in the market due to an increased adverseselection component in the spread. Thus, by announcing a repurchase plan, the firm itself may experiencehigher trading costs in the primary market.
11

market repurchases may be viewed as a sequence of tender offer repurchases, where the bidprice of the order is the tender price. Since tender offers are generally larger in magnitudethan open market repurchases, the alternative of trading the shares directly in the marketmay induce a price impact to the firm that would exceed the premium offered through thetender price. With respect to Dutch auction repurchases, the repurchasing firm set a rangeof prices at which it is willing to repurchase shares. Then, each shareholder informs thefirm of their supply at these price levels. When all price schedules are collected, the firmhas an aggregate supply curve, and chooses the lowest price that will fill their demand,and the transactions are executed at this clearing price.
The 1st of January, 1999, the Securities Act of June 13 1997 (Aksjeloven) went intoeffect, and Norwegian firms were allowed to repurchase their own shares. The SecuritiesAct states that firms are not allowed to hold more than 10% of their issued shares at anypoint in time. In addition, the firm’s total equity value in excess of the firm’s own stock-holdings must at all times be higher than NOK 1 mill. For a company to be able to initiatea repurchase plan, it requires 2/3 of the voting shares represented at the shareholdermeeting to vote in favor of the repurchase plan.14 In addition, the maximum length thata repurchase plan can be in effect before it requires a new vote is 18 months, and a shortertime if specified. After the Securities Act went into the effect, Norwegian firms wereallowed to announce a repurchase plan, but not execute any repurchases before January1999. When a firm has repurchased shares, the shares are first assigned as treasurystock with no voting or cash flow rights as long as the company owns them. Firmsmay then reduce the number of treasury stock by retiring these shares or as a paymentin various transactions. What firms do with the shares after the repurchase varies, butcommonly firms use them as payment in acquisitions, sell them in the market or distributethem to employees or managers as a part of a bonus plan etc. The dataset also containdata on the sale of treasury stock. However, the paper only consider the part of thesample related to the repurchases. Table 14 in appendix B show some aggregate statisticsfor the sale/reduction of treasury stock. There are about six times as many repurchasetransactions as sales. However, the number of shares in the repurchases are only twice thatof the sales, and the average repurchase is about 1/3 of the size of a reduction in treasurystock. This is probably because firms accumulate treasury stock through many smallertransactions, and use the repurchased shares as payment in relatively large transactionsor retire relatively large amounts of shares in a single event.
The sample examined in this paper only includes announcements of open market sharerepurchase programs and actual repurchases related to these announcements. Other typesof repurchases are rarely observed during the sample period.15 Recall that open marketshare repurchase programs also are the most frequently observed repurchase method inthe U.S. and Canada as well. Furthermore, Norwegian listed firms do not have to receiveapproval from the stock exchange before initiating a repurchase program. In the U.S. thesame rule applies as in Norway. However, Canadian firms (see Ikenberry et al. (2000)),must receive approval from the exchange before they can initiate a repurchase program.When a firm actually execute an open market repurchase the law requires the firm toreport this to the OSE on the same day or before the trading starts the following day.This is very different from the US, where firms are not required to report their actual
14It also requires 2/3 vote of all shares represented at the meeting (including non-voting shares).15One example is Storebrand (STB) which at the beginning January 1999 gave an offer to shareholders
that owned less than 8 shares to sell their shares back to the company. Of the total 74000 shareholders atthe time, 39000 owned less than 8 shares.
12

repurchase activity. Moreover, several studies note that firms actual repurchase activityin the US is very hard to measure (see e.g. Jagannathan et al. (2000)). Canadian firmsare required to report their aggregate repurchase activity every quarter.
3.2 The Norwegian tax system
Dividends distributed from a Norwegian tax resident public- or private limited companywere taxed fully on the investor’s hand until 1992. As a result of an extensive tax-reform in 1992, dividends became tax-exempt while the capital gains tax was set at aflat rate of 28%, both for individuals, companies and private pension funds.16 However,shareholders in firms that retain a part of their after tax earnings, may experience thatsome of the capital gains when the shares are sold reflect a price increase due to theretained earnings. To eliminate the double taxation this would imply, an adjustment ismade. The retained earnings per share is added to the cost basis (usually the purchaseprice) such that the capital gain/tax basis is reduced accordingly (RISK adjustment).17
Thus, during the period 1992 until 2001, dividends were not taxed on the investor’s handat all, and tax on capital gains linked to retained earnings was eliminated. However, in2001, personal tax on dividends was re-introduced, at a rate of 11%, while the capitalgains tax and corporate tax remained at 28%. With respect to the dividend taxation, abasic deduction of NOK 10 000 was introduced. Thus, small investors in dividend payingfirms were not directly affected by the tax increase. However, for larger investors the totaltaxation on dividends increased from 28% to 35.92%, due to the double taxation of partsof the earnings. In 2002 the personal taxation of dividends was removed. With respectto foreign shareholders, dividends distributed from a Norwegian tax resident public orprivate limited company to its non-resident shareholders are subject to 25% withholdingtax. Tax treaties may make the withholding tax deductible in the shareholder’s homecountry. Non-resident shareholders gain on a sale of shares in a Norwegian companyis not subject to any Norwegian taxation, unless the shares form part of a permanentestablishment in Norway or the seller is an individual who fulfill certain conditions thatwould make the gain taxable at a rate of 28%.
With respect to the relative tax treatment of dividends and repurchases in Norway,we see that there has been a change during our sample period from 1999 through 2001.However, in 1999 and 2001, dividend distributions were not taxed. On the other handrepurchases where the shareholder sell shares above the tax basis was taxed at 28%. Thus,in cases where the firm uses already taxed earnings for repurchasing shares at a priceabove the tax basis, the shareholder that sell shares back to the firm would experiencea double taxation on the excess capital gains. In 2000, when a dividend tax of 11% wasintroduced, the tax differential between capital gains and dividends was reduced, favoringrepurchases. With respect to foreign investors, they have been subject to 25% withholdingtax on dividends through the entire sample period. However, since the capital gains forforeigners is subject to the tax in the home country, the preference between dividends andrepurchases may vary between foreign investors depending on the tax treatment in theirhome country.
16labor unions, non-profit organizations and public pension funds are exempt from taxation.17RISK is the acronym for ”Regulering av Inngangsverdien med Skattlagt Kapital”. Translated, it means
that there is an adjustment of the cost basis by the retained earnings after corporate tax. To be eligibleto the RISK adjustment within a given year, the shareholder must have owned the shares over the turn ofthe year.
13
4 Data description
4.1 Announcements of repurchase programs
In panel A of table 1, we report some general statistics for the announcement data. Overthe entire period period from 1998 through 2001 there were 318 announcements of repur-chase plans by 163 different firms. Of these firms, 70 announced one repurchase plan, 46announced two plans, 32 announced 3 plans and 15 announced 4 repurchase plans duringthe sample period. Over the different sample years, the number of announcing firms in-creased from 30 to 109, while the maximum number of announcements by a single firm inone year was two. For the individual years, we also show statistics on the announcementfrequencies in the middle section of panel A. In column n=1, the numbers represent thenumber of firms that announced for the first time in the respective year, column n=2report the number of firms that announce for the second time in the respective year andso on. Thus, in 2001 32 firms announced for the first time, 30 for the second time, 35 forthe third time and 12 for the fourth time. When looking at the distribution of authorizedrepurchase amounts across firms, we see that they are highly skewed with a maximum(and median) amount of 10% and a mean amount of 9.5% while the lowest repurchaseamount announced by a firm was 1% of outstanding shares. Thus, the majority of theannouncements was for the maximum legal limit of 10%.18
Panel B in table 1 report the completion rates across firms that announced a repurchaseplan. For the whole sample about 60% (100 firms) of the announcing firms repurchasedat least some shares following at least one of their announcements, while 63 of the firmsthat announced a repurchase program never repurchased any shares within the repurchaseperiod.19 With respect to the firms that actually executed repurchases, the mean fractionof outstanding shares that was repurchased was 2.9%, while the median firm repurchased1.8%. The maximum accumulated fraction repurchased by any firm during a repurchaseperiod was 22.1%. This is above the legal limit of 10%. And for some firms there isan apparent breach of the legal limit, but this is probably because these firms duringthe repurchase period used some of the repurchased shares as payment in transactions,wrote down some of the repurchased shares or distributed them to employees, managersas part of a bonus program or other events that is not captured in our data.20 Themedian number of days between the announcement of a repurchase plan and the firstrepurchase was 169 days, while the mean number of days was 198. Thus, on average itseems like the repurchase plan is put in place not for immediate executions. However, theminimum number of days indicate that some firms also repurchase shares immediatelyafter the announcement has been made. For announcements in 1998 these numbers arebiased upwards because firms were not allowed to execute repurchases before 1999, butcould announce a repurchase plan in 1998. Across months (not reported), there is somedegree of clustering in May and June. The reason for this is that many repurchase plansare voted on at the annual shareholders meetings, which for many firms are conductedduring spring.
18Since some firms do not explicitly report a maximum amount to be repurchased, we assume that thesefirms are subject to the maximum legal limit of 10%.
19The repurchase period is defined as the period in which the shareholders give the manager authorizationto repurchase shares.
20The Securities Act (Aksjeloven) only require the holding of treasury shares to be no more than 10%of the firms outstanding shares.
14

Table 1: Descriptive statistics of announcementsPanel A shows descriptive statistics for the announcements of repurchase plans for the entire sample period
from 1998 through 2001 as well as for separate years. The first column report the number of announcements,
the second column report the number of different firms that announced at least one repurchase plan, and
the third column report the maximum announcements by one firm within the specified period. The next
four columns decompose the frequency of repurchase announcements. For the whole sample, n=1 counts
the number of firms that announce once, and n=4 counts the number of firms that announce 4 times. For
the separate years, n=1 counts the number of firms that announce for the first time in the respective year,
while n=2 counts the number of firms announcing for the second time etc. For example, in 2001 there were
32 firms that announced for the first time, 30 firms that had announced once in one of the previous three
years, 35 firms that had announced a repurchase plan in two of the previous three years and 12 firms that
had announced four times during the previous four years. The last three columns of the table report the
cross-sectional minimum, mean and maximum amount of shares that the firm was authorized to repurchase
by the current owners. Panel B shows statistics with respect to the completion rates where ”Repo” denotes
the number of firms that actually repurchase after an announcement, and ”Norepo” denote the number of
firms that announce a repurchase plan but do not execute any repurchases. The median, mean and max
completion rates are calculated relative to the number of shares repurchased divided by the total number
of outstanding shares. The last four columns report distribution of days between announcement of a plan
and the first repurchase.
Panel A: Announcement statistics
Number of firms (i) Authorizedannouncing n times repurchase amount
Announce- Different MaxPeriod ments firms (i) ann. n=1 n=2 n=3 n=4 Min. Mean Max.
Whole sample 318 163 4 70 46 32 15 1.0% 9.5% 10.0%
1998 28 28 1 28 - - - 2.5% 9.1% 10.0%1999 85 85 1 70 15 - - 1.0% 9.5% 10.0%2000 93 90 2 33 47 10 - 1.0% 9.4% 10.0%2001 112 109 2 32 30 35 12 3.3% 9.6% 10.0%
Panel B: Completion rates for announcing firms
Repurchasing firms Completion rates Days until first repurchasePeriod Repo Norepo Median Mean Max Min Median Mean Max
Whole sample 100 63 1.8% 2.9% 22.1% 1 169 198 502
1998 15 13 1.9% 2.9% 10.0% 20 364 326 4691999 41 44 1.9% 3.2% 19.0% 9 203 216 5022000 65 25 1.8% 2.9% 16.1% 2 217 206 4982001 60 49 1.3% 2.7% 22.1% 1 123 138 459
15

4.2 Actual repurchases
The sample of actual repurchases reported to the OSE from January 1999 through De-cember 2002 was obtained from the Oslo Stock Exchange. In addition, the dataset wasupdated and cross checked using detailed records from the equity feed database of OsloExchange Information (OBI).21
Panel A in table 2 show various statistics for the actual repurchase activity acrossfirms for the whole sample as well as for separate years. The firms that repurchasedshares executed a total of 1719 repurchases including all repurchases executed in 2002(denoted as 2002a in the table). When excluding repurchases in 2002 that were notrelated to repurchase plans initiated in 2001 or earlier22 (denoted as 2002b in the table),the total number of repurchases related to announcements in 1998-2001 was 1375. In therest of the paper we will examine the repurchases related to these announcements andignore the 344 repurchases that was executed due to repurchase plans announced in 2002since we do not have this information yet. The median firm executed 7 repurchases forthe entire sample period, while the maximum number of repurchases executed by a singlefirm was 197. The average size of the repurchases was 166 thousand shares or about NOK7.8 mill. Overall, the repurchases related to plans announced in 1998-2001 resulted inNorwegian firms repurchasing 210 million shares worth more than NOK 15 bill. Duringthe same period, the total market value of all firms on the OSE was about NOK 600 bill.on average. The total dividends paid out by all firms at the OSE (including firms that didnot announce) during the same period amounted to about NOK 60 bill.23 Since Norwegianfirms were first allowed to repurchase shares in 1999, they have increased their spendingon repurchases as a percentage of cash dividends to 25% in 1999 and to 44% in 2000and 2001. However, for 2002 there was a drop in the repurchase activity, while dividendpayments was high compared to the other years. Examining the other statistics acrossdifferent years, the first thing to note is the increase in repurchasing firms and repurchases(N) from 1999 through 2001, and then a significant drop in repurchase activity in 2002.This trend is also evident when looking at the total number of shares and the NOK volumeof all repurchases. One main reason for this drop in repurchases in 2002 may be related tothe fact that the personal tax on dividends, which was introduced in 2001, was removedin 2002 which made it relatively more attractive for private investors to get cash paidout as dividends.24 Another interesting observation is that, while the repurchase volumeincreased from 1999 through 2001, the average NOK size of each repurchase decreasedwhile the average number of shares in each repurchase increased. Panel B in table 2report monthly summary statistics of our repurchase sample. The table shows the numberof different firms that executed repurchases, the number of repurchases conducted by thesefirms, as well as the aggregate share volume and NOK volume of these repurchases for eachsample month. As can seen from the table there is an increasing trend until September2001. In fact, for the entire sample, September 2001, was the month in the sample thatmost firms executed repurchases and the share volume of repurchases was the highest. Thisis probably related to the large drop in share-prices due to the terrorist attacks in the US
21More specifically, Record E 19, Trading in Company Shares, in the Equity Feed data from OsloExchange Information (OBI) was used to track companies repurchase activity.
22These repurchases are repurchases up until 18 months after the most recent announcement in2000/2001, or until a new announcement in 2002.
23Note that these dividend numbers are aggregates for all companies listed on the OSE, not only for thefirms executing repurchases. The dividend statistics are official numbers from the Oslo Stock Exchange.
24This reasoning require that firms take into account the tax schedule of their investors.
16
on September 11th. In fact, when looking more closely on the amount of repurchasesthat were executed within that specific month, there was a huge increase in repurchasesjust after the terror events. More than 75% of the repurchases and 65% of the share-volume that month occurred in the week after the attacks. This is similar to what wasobserved in the US when a large amount of US firms increased their repurchase activity tosupply liquidity and support their share prices. In fact, on September 13th, the Securitiesand Exchange Commission (SEC) suspended regulations on repurchases allowing firms torepurchase shares without any volume limits. About 75 corporations responded duringthe first day of trading after the attacks by announcing the initiation or renewal of arepurchase plan, and the dollar value of their buybacks on the opening day was estimatedat more than USD 45 billion.25
5 Estimation methodology
5.1 Measuring abnormal announcement returns
In the paper we investigate the short term price impact related both to the announce-ment of repurchase plans as well as when the market learns that the firm actually hasrepurchased shares. For these purposes, we apply a standard event study methodology.To investigate the short term effect around an event, we examine various event windowssurrounding the event. We use daily returns which are indexed relative to an event, anddefine τ as the event time, with the event date at τ=0. The event date is the date atwhich the event (the repurchase plan or actual repurchase) is announced to the market.For the various event windows we denote the beginning of the event window as τ1 andthe end of the event window as τ2. We apply three model specifications to characterizenormal returns; the market model, the Fama and French (1993) three factor model andthe Carhart (1997) four factor model. All benchmarks models are calibrated during theestimation period running from two years prior (τ=-571) to the event until the start ofthe event period at τ1 for each firm, i.26 Since many of the companies at the OSE, andhence in our sample, are not traded every day, our OLS beta estimates may be biased dueto the intervaling effect. To reduce the potential bias, we also estimate adjusted betas forthe market model as suggested by Scholes and Williams (1977) and Dimson (1979). Inthe regular market model, normal returns are expressed as,
E[Riτ] = αi + βiRmτ (1)
where Riτ is the return on security i on event date τ, Rmτ is the value weighted total return
on the OSE all share index, and E[εi,τ] = 0 and Var[εi,τ] = σ2εi
. In the Dimson (1979)specification, we run an multivariate version of eq.(1) of securities returns against lagged(Rm
τ−1), contemporaneous (Rmτ ) and leading (Rm
τ+1) market returns. As proposed in Dimson(1979), we obtain a consistent estimate of beta by summing the slope coefficients from thisregression. The Scholes and Williams (1977) procedure is similar, but instead of estimatingthe β’s simultaneously, the three betas are estimated separately and the aggregated beta
25Also during the market crash in 1987 there was a surge in repurchase activity after the market collapse.During the fourth quarter of 1987 Stephens and Weisbach (1998) report that 995 firms announced arepurchase plan.
26Some firms have a shorter price history. However, since none of these firms have less than half a yearof price observations, we do not exclude them from the analysis.
17

Tab
le2:
Des
crip
tive
stat
isti
csof
actu
alre
purc
hase
sPanel
Are
port
sth
eact
ual
repurc
hase
act
ivity
acr
oss
firm
sfo
rth
ew
hole
sam
ple
as
wel
las
for
separa
teyea
rs.
The
colu
mns
inpanel
Are
port
the
num
ber
of
diff
eren
tfirm
sth
at
exec
ute
dre
purc
hase
s(F
irm
s),th
ecr
oss
sect
ionaldis
trib
uti
on
ofre
purc
hase
s(m
inim
um
,m
edia
n,m
ean
and
max
repurc
hase
sacr
oss
firm
s),th
e
aver
age
size
ofre
purc
hase
sin
thousa
nd
share
sand
Norw
egia
nkro
ner
(NO
K)
and
the
tota
lsh
are
-volu
me
and
NO
Kvolu
me
inall
repurc
hase
s.T
he
last
colu
mn
of
the
table
report
the
aggre
gate
NO
Kva
lue
ofdiv
iden
dpay
men
tsfo
rall
firm
sat
the
OSE
.Panel
Bsh
ows
the
repurc
hase
act
ivity
for
each
month
wit
hin
each
yea
r.
For
each
month
,th
ere
port
edst
ati
stic
sis
the
num
ber
of
diff
eren
tfirm
sth
at
exec
ute
dre
purc
hase
sin
the
resp
ecti
ve
month
(Fir
ms)
,th
enum
ber
of
repurc
hase
s
exec
ute
dby
thes
efirm
s(N
),th
eto
talnum
ber
ofsh
are
s(i
nth
ousa
nds)
inth
ese
repurc
hase
sand
the
tota
lvolu
me
inm
illion
Norw
egia
nkro
ner
(NO
K).
PanelA
:C
ross
secti
onalrepurchase
stati
stic
s
Num
ber
ofre
purc
hase
sR
epurc
hase
size
Rep
urc
hase
volu
me
Div
iden
dsc
share
sN
OK
Fir
ms
Nm
inm
edia
nm
ean
max
(1000)
(1000)
Mill.
share
sM
ill.
NO
KM
ill.
NO
K
Whole
sam
ple
a100
1719
110
16.7
197
159
7223
247
16505
59760
Whole
sam
ple
b100
1375
17
13.3
195
166
7861
210
15219
-
1999
41
205
13
5.0
17
168
13259
35
3679
14444
2000
60
463
15
7.7
64
186
12770
65
5320
12194
2001
69
659
14
9.6
120
281
7480
107
5947
13767
2002
a39
392
15
10.1
50
122
3780
41
1560
19356
2002
b11
48
13
4.4
10
89
5420
4273
-
aIn
cludes
all
repurc
hase
sco
nduct
edin
the
per
iod
1999
thro
ugh
2002.
bIn
cludes
only
repurc
hase
sin
2002
that
was
rela
ted
toannounce
men
tsin
2000/2001
whic
hhad
not
yet
expir
ed.
Thes
ere
purc
hase
sare
repurc
hase
sco
nduct
edup
to18
month
saft
erth
em
ost
rece
nt
announce
men
t(in
2001
or
2000)
or
untila
new
announce
men
tin
2002.
cT
he
div
iden
dst
ati
stic
sare
offi
cialaggre
gate
sfr
om
the
Osl
oSto
ckE
xch
ange
(ww
w.o
se.n
o).
PanelB
:R
epurchase
acti
vity
by
month
1999
2000
2001
2002
Share
sM
ill.
Share
sM
ill.
Share
sM
ill.
Share
sM
ill.
Fir
ms
N(1
000)
NO
KFir
ms
N(1
000)
NO
KFir
ms
N(1
000)
NO
KFir
ms
N(1
000)
NO
K
January
57
1787
64
613
624
40
15
51
7130
315
10
34
11942
97
Feb
ruary
33
499
52
921
1987
153
717
2790
170
10
14
1471
78
Marc
h3
63581
57
11
34
6493
531
18
43
7482
567
11
16
2387
91
Apri
l5
10
780
16
718
2799
142
10
40
1914
133
912
1163
63
May
36
307
20
12
22
2827
159
19
80
11537
1097
819
1826
106
June
514
975
35
14
39
4095
251
20
86
11077
789
14
37
2705
267
July
511
2629
213
11
23
4499
426
21
69
5732
255
932
2251
229
August
14
35
7118
1118
14
35
5873
478
20
72
14001
712
15
35
5206
235
Sep
tem
ber
12
29
6463
816
17
56
5894
313
34
125
26003
1274
18
77
4125
203
Oct
ober
11
18
1967
234
817
3270
232
14
29
11880
287
12
50
4693
80
Novem
ber
15
47
6387
864
20
62
7072
935
11
24
3445
155
12
36
1596
57
Dec
ember
12
19
2064
189
26
123
19693
1661
13
23
3932
194
12
30
1206
55
18

estimate is adjusted for the autocorrelation in the market return to obtain a consistentestimate of β. Thus, by denoting the lagged-, matching- and leading beta estimates asβ+
i , βi and β−i respectively, the consistent beta estimate, relative to the Scholes/Williams
approach, is calculated as,
βSWi =
β+i + βi + β−
i
1 + 2ρM(2)
where ρM is the autocorrelation coefficient of the market index, and βSWi denotes the
Scholes/Williams estimate. In addition to applying the market model, we use the Famaand French (1993) three factor model as well as the four factor model suggested by Carhart(1997) adding momentum to the Fama/French factors.27 With respect to the four factormodel, expected returns are described as,
E[Riτ] = αi + βmi Rm
τ + βhi Rhml
τ + βsiR
smbτ + βmom
i Rmomτ (3)
where Rmτ , Rhml
τ , Rsmbτ and Rmom
τ are the returns on the market-, the book to market-,the size- and the momentum factors respectively, and the β’s are the factor exposures.The book-to-market and size factor returns are calculated as the difference between twovalue weighted portfolios containing firms with a book to market value (or size) abovethe median and below the median. All firms at the OSE are assigned to one of the twoportfolios at the beginning of each year. With respect to the momentum portfolios, firmsare assigned to one of two portfolios based on the return over the previous year.28 Theexposures are estimated over the same post-event period as the market model in eq.1.
Having estimated the parameters in the various model specifications described above,we measure the daily abnormal returns as the daily prediction errors relative to the ex-pected return, E[Riτ] as,
ARiτ = Riτ − E[Riτ] (4)
where E[Riτ] is the expected return of security i, defined by either the market model, theFama and French (1993) model or the Carhart (1997) model, on date τ given the returnon the market and the contemporaneous factor returns. For each firm in the sample, wecalculate cumulative abnormal returns (CAR) across the event window from τ1 to τ2. Bycumulating the ARiτ from τ1 up to, and including, τ2 for the different time windows, foreach firm, we can calculate the the estimated average CAR across all firms as,
CAR(τ1, τ2) =1
N
N∑i=1
τ2∑τ=τ1
ARiτ (5)
where N is the total number of firms/events.The main null hypothesis to be tested is that the cumulative abnormal return during
the main event-window across firms is equal to zero. We use the standard test statisticproposed in Brown and Warner (1985) who argue that standard procedures are typically
27However, Brown and Weinstein (1985) and Campbell et al. (1997) argue that the use of more sophisti-cated models has little practical advantages relative to an unrestricted market model when we examine theshort term market impact. The main reason is that the marginal explanatory power of additional factorsto the market factor is usually relatively small, and therefore there is little reduction in the variance ofabnormal returns.
28A number of filters are applied before a stock can enter the portfolios. Minimum number of tradingdays of 20, minimum price of 10 and minimum firm value of 1 mill NOK.
19

well-specified even when special daily data characteristics are ignored. The test statistic weapply is the ratio of the average cumulative abnormal return, across firms, to its estimatedstandard error, which can be expressed as,
t =CAR(τ1, τ2)
[σ2ε(τ1, τ2)]
1/2(6)
where σ2ε(τ1, τ2) is the average estimated variance for the abnormal returns across firms.
Two estimators of the variance is commonly used in event studies. The most frequentlyapplied estimator uses the standard deviation of abnormal returns from the expectedreturn model estimated in the estimation period prior to the event. The second estimatoruses the standard deviation of the cross-sectional CARs from the event window. The latterestimator is generally used when the event is expected to change the risk of the firm, andthe pre-event estimator for the variance may be biased. In our case, we use the firstestimator for variance when examining the announcement effect, since the announcementitself is not expected to affect the risk of the firm. When we later in the paper (section6.4) examine the abnormal returns around the actual repurchases, on the other hand, weprovide results using the second approach, since the transactions potentially change theriskiness of the firm.29
5.2 Measuring long run performance
Portfolio creation
We also examine the long run performance of portfolios of announcing firms and forportfolios conditional on whether the firm actually execute repurchases or not. To facilitatethis we apply a calendar time approach used in e.g. Ikenberry et al. (1995), Womack (1996)and Ikenberry et al. (2000) among others. To explain how this applied in this paper, wewill use the case when we construct a portfolio of firms conditional on that they haveannounced a repurchase plan.30
More specifically, we create a portfolio of firms given that they have announced arepurchase plan and calculate the daily returns of this portfolio through calendar time,t. We rebalance the portfolio the first day of every month. Moreover, all firms thathave announced a repurchase plan in the previous month are added to the portfolio, andall firms are rebalanced to equal weights. We write the return on the equally weightedportfolio, Rp,t on date t as,
Rpt =∑
i
witRit (7)
where wi,t denotes the weight of each firm in the portfolio which in our case is just1/Ni,t where Ni,t is the number of securities in the portfolio at date t. To minimize theidiosyncratic risk in our portfolio, we do not start our portfolio construction before 10companies have announced a repurchase plan. We also examine several holding periods,where firms are kept in the portfolio for one year, two years and three years as well as forthe remaining sample period (buy and hold). For e.g. the yearly holding period, a firm
29If the ARτ are independent identically distributed and normal, the test statistic is distributed Student-tunder the null hypothesis.
30However, later in the paper we will also use the same methodology when measuring the performanceof portfolios conditional on the actual repurchase activity of the announcing firms.
20

is removed from the portfolio after one year. These portfolio strategies represents simpleand realistic trading strategies, where the inclusion of stocks depends on whether theyhave announced a repurchase period in the previous month. It should be noted that we donot take into account transaction costs, but since we rebalance the portfolio on a monthlybasis, these costs would not be very large.31
Benchmark models
The long term abnormal performance may to a large degree depend on the benchmarkmodel against which we compare our portfolio returns. In addition, several papers notethat long-term abnormal performance tests may be due to misspecification rather thanmispricing. Thus, as argued by Kothari and Warner (1997) among others, caution shouldbe used when interpreting the results.32 We try to reduce this problem by measuring oursample portfolio returns generated from the trading strategy relative to several models.We evaluate the performance of our repurchase portfolio by estimating Jensen’s alpharelative to a one factor CAPM model as well as the Fama and French (1993) model andthe Carhart (1997) model, E.g. for the Carhart model we run the following regression,
Rpt − Rft = α + βm(Rm
t − Rft) + βhRhml
t + βsRsmbt + βmomRmom
t + εt (8)
where Rp,t is the return on the equally weighted portfolio of announcing firms createdthrough calendar time, Rf
t is our proxy for the risk free rate,33 Rmτ , Rhml
τ , Rsmbτ and
Rmomτ are the returns on the market-, the book to market-, the size- and the momentum
factors respectively, and the β’s are the factor exposures. The factor returns are calculatedsimilarly as in eq. 3 and α measures the average daily excess performance of the portfolio.
6 Results
Our empirical analysis consists of four parts. The first part in section 6.1 evaluate theshort term market reaction around the announcement of repurchase plans. The secondpart, in section 6.2, tests the underreaction hypothesis in Norway by examining the longterm performance of a portfolio of firms that have announced a repurchase plan. Thethird part, in section 6.3, combines the announcement data with the actual repurchasedata and examine whether the long-run performance depend on whether firms repurchaseor not. The fourth part, in section 6.4, examines the short term market impact of theactual repurchases.
31The transaction costs would in reality depend on the size of the portfolio. For a small portfolio, thetotal commissions related to the rebalancing could constitute a large fraction of invested wealth. For alarge portfolio, on the other hand, the commissions would be a smaller part of invested amount, while theimplicit costs related to price impact and delay when the portfolio is rebalanced is likely to constitute alarger fraction of total costs.
32Kothari and Warner (1997) argue that bootstrapping procedures may help mitigating the potentialbiases in long-term performance measurement. With respect to bootstrapping, it is important to havea large number of firms to match against. One problem in Norway is that there are very few similarcompanies, in addition to that we want to match against non-announcing firms, which makes this approachdifficult to implement in a satisfactory way in this study.
33As the risk free rate we use the 3 month Norwegian interbank offered rate (NIBOR).
21

6.1 The short term effect of announcing a repurchase plan
In table 3 we report the average cumulative abnormal returns surrounding the announce-ment of repurchase plans. For all announcements, the table shows the average excess returnrelative to the market model (unadjusted and adjusted as proposed in Dimson (1979) andScholes and Williams (1977)), the Fama and French (1993) three-factor model and theCarhart (1997) four-factor model. In the table we also show the average announcementeffect for separate years and when split the sample into announcements that specify thatthe firm will repurchase more or less than 5% of their outstanding shares. In these caseswe report results only from a Carhart (1997) specification for normal returns. In the tablewe use an event window staring two days before the announcement and ending two daysafter the event. The main reasons for why we use a relative large event window is that theannouncements of the outcome of the vote on the repurchase plans are in some cases onthe same day as the shareholder meeting, while it in other cases is announced up to a fewdays after the shareholder meeting. Thus, for those announcements that are delayed, theoutcome of the vote is likely to be known to the market before the announcement. In fact,when looking at the cumulative abnormal return from 60 days prior to the announcementof the repurchase plan through 60 days after the announcement in figure 1, there is someindication that there is a positive impact starting before the announcement. Thus, therelatively large window reduces the power of the tests, but since we want to capture theentire market reaction we use a relatively large window. In addition, the table report theaverage cumulative abnormal return from 60 days prior to the announcement and until 60days after the announcement.
The first thing to note from the table is that the announcement effect is positiveand significant for the whole sample, with an average significant announcement effect ofabout 2.5%. This is very similar to what is found for other markets and time periods ine.g. Comment and Jarrell (1991) and Ikenberry et al. (1995, 2000). With respect to thedifferent model specifications, the results are quantitatively similar. We do not, however,find a significantly negative CAR for the 60 day period prior to the announcement for allannouncements of for announcements within separate years. This is in contrast to otherstudies that find a significant negative abnormal return prior to the announcement. Thus,in the Norwegian market, it does not seem that firms decision to announce a repurchaseplan is influenced by the (risk adjusted) prior performance of the firm at least relative tothe three months prior to the announcement. This may be explained by the findings inpanel B in table 1, where we found that the number of days between the announcement ofthe plan and the first repurchase execution was almost 200 days. Thus, the announcementdoes not, on average, seem to be triggered by a negative drift prior to the announcement.
When examining the announcement effect for different years, we find a positive effectfor all years, but the announcement effect is only significantly different from zero forannouncements in 1999 and 2001. In addition, only firms that announce that they areplanning on repurchasing more than 5% of their outstanding shares experience a significantabnormal price impact, while the excess return for firms that announce a lower repurchasefraction is positive but insignificant. Table 13 in appendix A shows the results from arobustness check where all firms with an announcement CAR below the 5th and abovethe 95th percentile are removed from the sample. The announcement effect falls to about1.9%, but is still significant at the 1% level.
To examine in more detail what factors are important with respect to the size of theannouncement effect, we run the following regression with the cumulative abnormal return
22
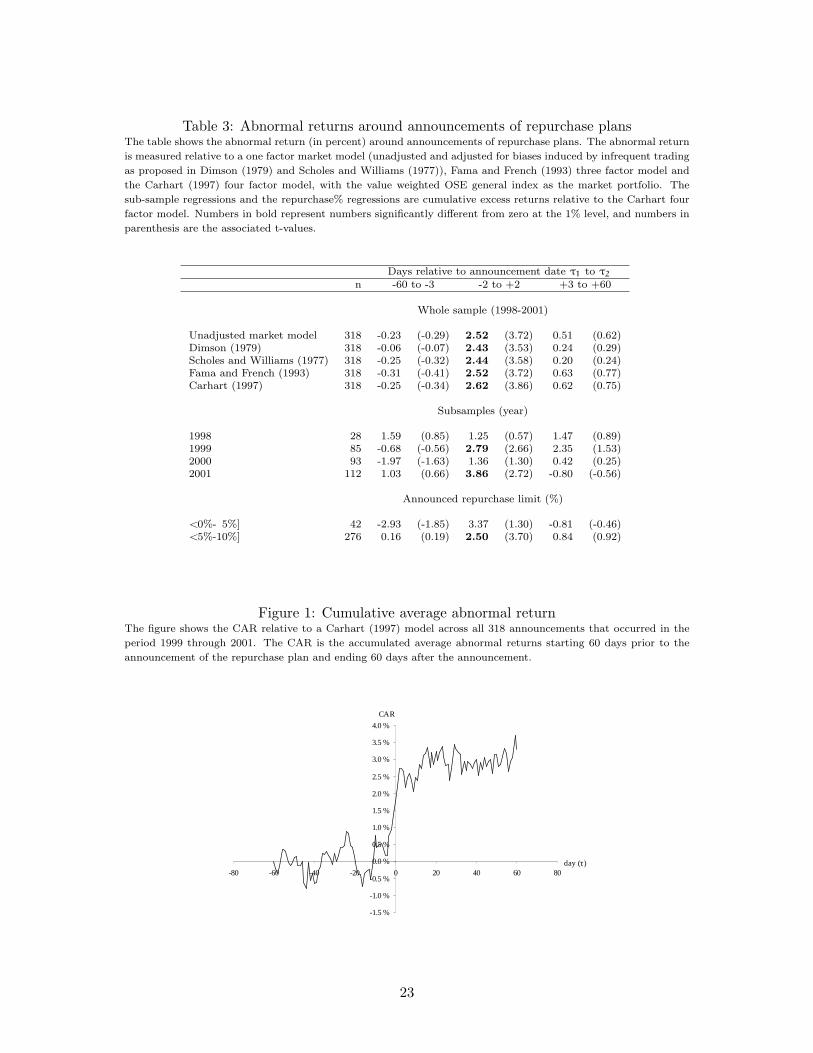
Table 3: Abnormal returns around announcements of repurchase plansThe table shows the abnormal return (in percent) around announcements of repurchase plans. The abnormal return
is measured relative to a one factor market model (unadjusted and adjusted for biases induced by infrequent trading
as proposed in Dimson (1979) and Scholes and Williams (1977)), Fama and French (1993) three factor model and
the Carhart (1997) four factor model, with the value weighted OSE general index as the market portfolio. The
sub-sample regressions and the repurchase% regressions are cumulative excess returns relative to the Carhart four
factor model. Numbers in bold represent numbers significantly different from zero at the 1% level, and numbers in
parenthesis are the associated t-values.
Days relative to announcement date τ1 to τ2
n -60 to -3 -2 to +2 +3 to +60
Whole sample (1998-2001)
Unadjusted market model 318 -0.23 (-0.29) 2.52 (3.72) 0.51 (0.62)Dimson (1979) 318 -0.06 (-0.07) 2.43 (3.53) 0.24 (0.29)Scholes and Williams (1977) 318 -0.25 (-0.32) 2.44 (3.58) 0.20 (0.24)Fama and French (1993) 318 -0.31 (-0.41) 2.52 (3.72) 0.63 (0.77)Carhart (1997) 318 -0.25 (-0.34) 2.62 (3.86) 0.62 (0.75)
Subsamples (year)
1998 28 1.59 (0.85) 1.25 (0.57) 1.47 (0.89)1999 85 -0.68 (-0.56) 2.79 (2.66) 2.35 (1.53)2000 93 -1.97 (-1.63) 1.36 (1.30) 0.42 (0.25)2001 112 1.03 (0.66) 3.86 (2.72) -0.80 (-0.56)
Announced repurchase limit (%)
<0%- 5%] 42 -2.93 (-1.85) 3.37 (1.30) -0.81 (-0.46)<5%-10%] 276 0.16 (0.19) 2.50 (3.70) 0.84 (0.92)
Figure 1: Cumulative average abnormal returnThe figure shows the CAR relative to a Carhart (1997) model across all 318 announcements that occurred in the
period 1999 through 2001. The CAR is the accumulated average abnormal returns starting 60 days prior to the
announcement of the repurchase plan and ending 60 days after the announcement.
-1.5 %
-1.0 %
-0.5 %
0.0 %
0.5 %
1.0 %
1.5 %
2.0 %
2.5 %
3.0 %
3.5 %
4.0 %
-80 -60 -40 -20 0 20 40 60 80
CAR
day (τ)
23
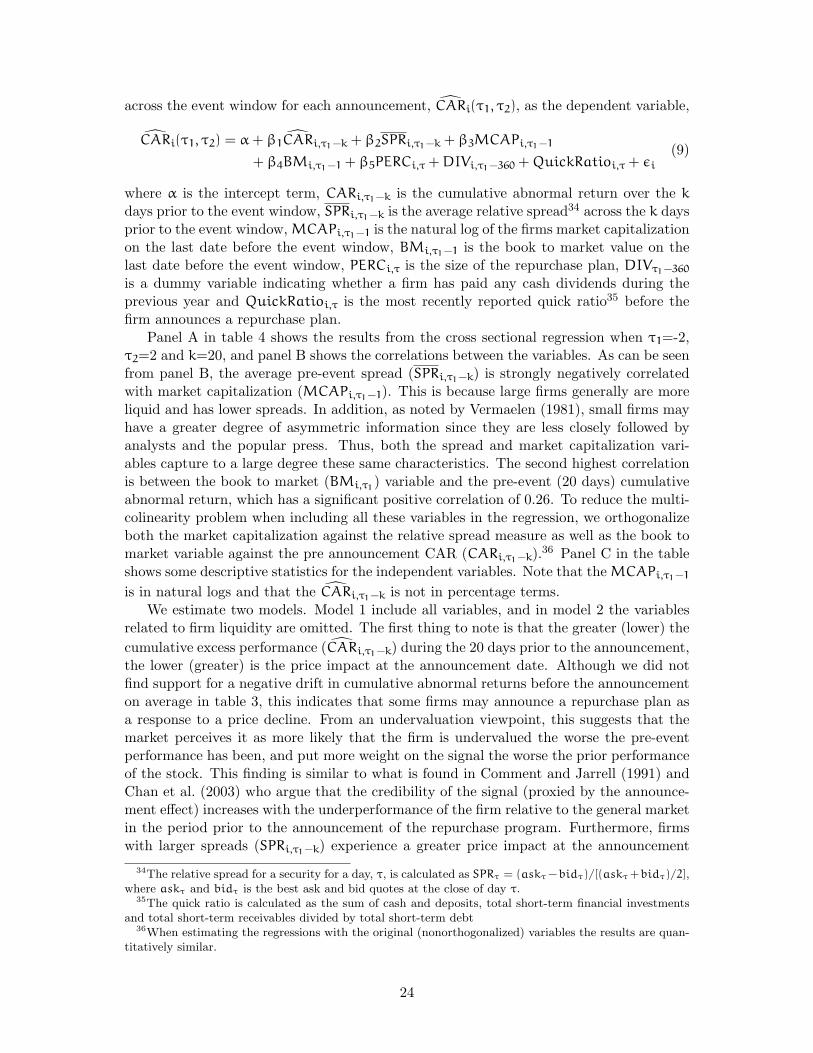
across the event window for each announcement, CARi(τ1, τ2), as the dependent variable,
CARi(τ1, τ2) = α + β1CARi,τ1−k + β2SPRi,τ1−k + β3MCAPi,τ1−1
+ β4BMi,τ1−1 + β5PERCi,τ + DIVi,τ1−360 + QuickRatioi,τ + εi
(9)
where α is the intercept term, CARi,τ1−k is the cumulative abnormal return over the k
days prior to the event window, SPRi,τ1−k is the average relative spread34 across the k daysprior to the event window, MCAPi,τ1−1 is the natural log of the firms market capitalizationon the last date before the event window, BMi,τ1−1 is the book to market value on thelast date before the event window, PERCi,τ is the size of the repurchase plan, DIVτ1−360
is a dummy variable indicating whether a firm has paid any cash dividends during theprevious year and QuickRatioi,τ is the most recently reported quick ratio35 before thefirm announces a repurchase plan.
Panel A in table 4 shows the results from the cross sectional regression when τ1=-2,τ2=2 and k=20, and panel B shows the correlations between the variables. As can be seenfrom panel B, the average pre-event spread (SPRi,τ1−k) is strongly negatively correlatedwith market capitalization (MCAPi,τ1−1). This is because large firms generally are moreliquid and has lower spreads. In addition, as noted by Vermaelen (1981), small firms mayhave a greater degree of asymmetric information since they are less closely followed byanalysts and the popular press. Thus, both the spread and market capitalization vari-ables capture to a large degree these same characteristics. The second highest correlationis between the book to market (BMi,τ1
) variable and the pre-event (20 days) cumulativeabnormal return, which has a significant positive correlation of 0.26. To reduce the multi-colinearity problem when including all these variables in the regression, we orthogonalizeboth the market capitalization against the relative spread measure as well as the book tomarket variable against the pre announcement CAR (CARi,τ1−k).36 Panel C in the tableshows some descriptive statistics for the independent variables. Note that the MCAPi,τ1−1
is in natural logs and that the CARi,τ1−k is not in percentage terms.We estimate two models. Model 1 include all variables, and in model 2 the variables
related to firm liquidity are omitted. The first thing to note is that the greater (lower) thecumulative excess performance (CARi,τ1−k) during the 20 days prior to the announcement,the lower (greater) is the price impact at the announcement date. Although we did notfind support for a negative drift in cumulative abnormal returns before the announcementon average in table 3, this indicates that some firms may announce a repurchase plan asa response to a price decline. From an undervaluation viewpoint, this suggests that themarket perceives it as more likely that the firm is undervalued the worse the pre-eventperformance has been, and put more weight on the signal the worse the prior performanceof the stock. This finding is similar to what is found in Comment and Jarrell (1991) andChan et al. (2003) who argue that the credibility of the signal (proxied by the announce-ment effect) increases with the underperformance of the firm relative to the general marketin the period prior to the announcement of the repurchase program. Furthermore, firmswith larger spreads (SPRi,τ1−k) experience a greater price impact at the announcement
34The relative spread for a security for a day, τ, is calculated as SPRτ = (askτ −bidτ)/[(askτ +bidτ)/2],where askτ and bidτ is the best ask and bid quotes at the close of day τ.
35The quick ratio is calculated as the sum of cash and deposits, total short-term financial investmentsand total short-term receivables divided by total short-term debt
36When estimating the regressions with the original (nonorthogonalized) variables the results are quan-titatively similar.
24

date than firms with smaller spreads. If the spread proxy for market liquidity, this resultis expected in the sense that the market price moves more for a less liquid stock. If theannouncement results in an excess demand for the stock, at the announcement, the supplyside of the order book will be exhausted more easily for a less liquid stock than a moreliquid stock. In addition, since the spread may also proxy for asymmetric information,the announcement of a repurchase plan may have a stronger signalling value for a securitywhere there is a higher uncertainty about firm value and potentially more private infor-mation is revealed through the announcement. With respect to the market capitalizationvariable (MCAP) we find that larger firms experience a lower abnormal price impact thansmaller firms. As mentioned earlier, the reason for this may be that smaller firms aregenerally less liquid and that an announcement is more valuable to the market for smallfirms if there is larger information asymmetries in smaller firms.
Further, we also find that value stocks, with a high book-to-market value, experiencea stronger price impact than growth stocks. One interpretation for this is that value firmsare more likely to be undervalued relative to growth firms, and that the announcement ofa repurchase plan may confirm the markets perception of undervaluation. With respectto the size of the repurchase plan, it does not explain any variation in the announcementeffect. Initially, one would expect that a larger repurchase plan would be a stronger signalabout undervaluation. However, as discussed earlier, a large fraction of the announcementsare for the maximum allowed size of 10%. Thus, there may be too little variation inthis variable to account for any variation in the CAR. Wether the firm has paid anydividend the previous year is not related to the announcement effect. With respect tothe dividend variable, one could initially expect this to be negative if firms that haspaid dividends the previous year is expected to continue paying dividends in the future(dividend smoothing). If firms are expected to continue using excess cash to pay dividends,this lowers the probability that they will repurchase, and the potential positive effectsrelated to repurchases discussed in section 2 are less likely to occur. Finally, the mostrecent quick ratio before the announcement, is negatively related to the announcementeffect. Initially, one would expect this variable to be positive in the sense that liquid firmsmay be expected to actually execute repurchases such that the signal is more crediblewhen firms are liquid. On the other hand, the announcement may to a greater extent beexpected by the market in these cases.
6.2 Long-term performance of firms announcing a repurchase plan
In this section we examine the long term performance of firms announcing a repurchaseplan. The main hypothesis to be investigated is the underreaction hypothesis of Ikenberryet al. (1995) who argue that, if a repurchase announcement is a positive signal, this signalshould be, in an efficient market, incorporated into prices completely and in an unbiasedfashion when the firm announces the repurchase plan. In the previous section we found asignificant positive announcement effect of about 2.5%. In panel A of table 5 we report theresults from evaluating the long term abnormal performance of a calendar time portfolioof announcing firms. The portfolio is rebalanced every month. All stocks that announcea repurchase plan during a month are added to the portfolio the first day of the followingmonth. At the beginning of each month, all firms receive equal weights in the portfolio.We also examine in panel B of table 5 the performance of our portfolio with respect tovarious fixed holding periods from 1 to 4 years in addition to a buy-and-hold strategy(“whole sample”) where the stock remains in the portfolio for the rest of the period.
25

Table 4: Cross-sectional CAR regressionPanel A in shows the results from the cross sectional regression of CARi(τ1, τ2) on various variables. Model 1 isestimated as,
CARi(τ1, τ2) = α + β1CARi,τ1−k + β2SPRi,τ1−k + β3MCAPi,τ1−1
+ β4BMi,τ1−1 + β5PERCi,τ + β6DIVi,τ1−360 + β7QuickRatioi,τ + εi
(10)
where i denotes the announcements, α is the intercept, CARi,τ1−k is the cumulative abnormal return over the
k days prior to the event window, SPRi,τ1−k is the average spread across the k days prior to the event window,
MCAPi,τ1−1 is the natural log market capitalization on the last date before the event window, BMi,τ1−1 is the book
to market value on the last date before the event window, PERCi,τ is the size of the repurchase plan and DIVτ1−360
is a dummy indicating whether a firm has paid any dividends during the last year and QuickRatioi,τ is the most
recent quick ratio before the announcement. In the regression τ1=-2, τ2=2 and k=20. Note that the market
capitalization is orthogonalized against the spread measure, and the book-to-market variable is orthogonalized
against the CARi,τ1−k variable. Panel B shows the Pearson’s correlations coefficients between the variables used
in the regressions in panel A. The correlations for MCAP and SPR are before they are orthogonalized. Numbers in
bold refer to correlations significantly different from zero at the 5% level. Panel C shows some descriptive statistics
for the variables.
Panel A: Cross sectional CAR regression
Model 1 Model 2Variable Est. std.err. p-val. Part.R2 Est. std.err. p-val. Part.R2
Constant 0.041 0.034 0.228 - 0.026 0.036 0.463 -
CARτ1−k -0.165 0.046 <0.001 0.027 -0.151 0.049 0.002 0.027
SPRτ1−k 0.338 0.067 <0.001 0.060 - - - -MCAPτ1−1 -0.013 0.005 0.008 0.016 - - - -BMτ1−1 0.023 0.006 <0.001 0.051 0.028 0.006 <0.001 0.051PERCi -0.179 0.350 0.609 0.000 0.054 0.364 0.882 0.000DIVi,τ1−360 -0.031 0.017 0.067 0.008 -0.035 0.018 0.045 0.012Quick ratioτ -0.007 0.002 0.002 0.026 - - - -
adj.R2 0.171 0.078N 318 318
Panel B: Variable correlations
CARτ1−k SPRτ1−k MCAPτ1−1 BMτ1−1 PERCi,τ DIVτ1−240
SPRτ1−k 0.06MCAPτ1−1 -0.05 -0.52BMτ1−1 0.26 0.13 -0.07PERC − i, τ 0.07 0.12 -0.15 -0.08DIVτ1−360 0.00 -0.01 0.08 0.12 -0.07Quick ratioi,τ 0.01 0.08 -0.13 -0.03 0.08 -0.02
Panel C: Variable statistics
Variable Mean std.dev min max
CARτ1−k -0.003 0.132 -0.43 0.33MCAPτ1−1 (log) 20.602 1.512 16.13 25.12BMτ1−1 1.328 1.111 0.24 8.54PERCi 0.095 0.018 0.01 0.10
SPRτ1−k 0.064 0.093 0.01 0.81DIVi,τ1−360 0.164 0.370 0 1Quick ratioτ 2.078 2.668 0.26 31.79
26

When a stock has been in the portfolio for the duration of the respective holding period,it is removed from the portfolio until it announces a new repurchase plan. To reducethe idiosyncratic risk of the portfolio, we require there to be at least 10 firms that hasannounced a repurchase plan before we start the portfolio.37
Panel A in table 5 shows that for a buy-and-hold portfolio, with no limit on theholding period, the portfolio significantly outperforms the market by about 0.9% permonth, or 11% per year, when we adjust for the Fama and French (1993) and Carhart(1997) risk factors. This is in line with results in Ikenberry et al. (1995, 2000) who findsan abnormal performance of 12.1% in the US and 7% per year in Canada respectively.Relative to the CAPM, the excess performance is almost 2% per month, or almost 27%per year, illustrating the importance of adjusting the portfolio performance for additionalrisk factors in addition to the market risk. When restricting the holding period in panelB, we find, for the Fama/French and Carhart models, that there is a significant excessperformance when the holding period is longer than 1 year. With respect to a CAPMspecification, the portfolio outperforms regardless of the chosen holding period.
One important point with respect to evaluating the long term abnormal performancein this type of study is that the expected return model may be misspecified. As shownby Kothari and Warner (1997), in a random sample of 200 firms, about 35% of the firms,independent of the benchmark model used, show an abnormal positive and negative ab-normal performance over a 36 month period. Although they do not examine these issuesin the context of calendar time portfolios (only with respect to the long run performancethrough event time), they argue that a calendar time approach may involve similar issues.In this study we do not attempt to adjust for such biases, but instead examine severalmodel specifications for expected returns. An alternative approach could be to create amatching portfolio of non announcing firms. However, since there are relatively few listedcompanies at the OSE,38 implementing a matching procedure in a satisfactory way maybe difficult. As noted by Kothari and Warner (1997), it is not necessarily enough to matchon size and book to market, but also other firm characteristics as well.
To examine the robustness of the results in table 5 we also estimate the excess returnswhen we start the portfolio construction in different years throughout the sample period(1999, 2000 and 2001) and vary the holding period from 1 to 4 years. The results fromthis analysis, relative to a Carhart (1997) specification is reported in table 5. We also notethat the results when we start the portfolio construction in 1999 are very similar to theresults in table 5. The reason for this that we do not start the portfolio construction in1998 before at least 10 firms have announced a repurchase plan, which is in October 1998.Thus, the portfolio construction only starts 3 months later for the portfolio starting in1999. In addition, since the time series becomes longer the earlier we start our portfolio,the data used in later years are subsets of the data we use when starting the portfolio inearlier years. However, the main point of the analysis is to check to what degree the resultschange when we change the starting point of the sample. The results are similar to thosein panel B in table 5. There is no significant excess performance for the announcementportfolio for holding periods of one year. However, for holding periods of two years orlonger, there is a significant abnormal performance regardless of the year when we startthe portfolio construction.
To summarize the analysis so far, both the results in table 5 and 6 support the under-37When we use the entire sample period, this result in our portfolio starting in October 1998, when 10
firms had announced a repurchase plan.38In the end of 1999, 2000 and 2001 there were respectively 215, 214 and 212 listed firms at the OSE.
27

Table 5: Long term performance of the announcement portfolioThe table shows the excess performance of a calendar time portfolio of firms announcing a repurchase plan. The
excess return on the portfolio is both measured relative to a one-factor CAPM model (i), a three factor Fama and
French (1993) model (ii) and a four factor Carhart (1997) model (iii),
(i) Rp,t − Rf,t = α + βm(Rm,t − Rf,t) + εt
(ii) Rp,t − Rf,t = α + βm(Rm,t − Rf,t) + βhmlRhml,t + βsmbRsmb,t + εt
(iii) Rp,t − Rf,t = α + βm(Rm,t − Rf,t) + βhmlRhml,t + βsmbRsmb,t + βmomRmom,t + εt
where Rp,t is the return on the equally weighted portfolio of announcing firms, Rft is our proxy for the risk free rate,
Rmτ , Rhml
τ , Rsmbτ and Rmom
τ are the returns on the market-, the book to market-, the size- and the momentum
factors respectively, and the β’s are the factor exposures. The factor returns are calculated similarly as in eq. 3
and α measures the average daily abnormal performance of the portfolio relative to the excess return on the factor
portfolios. The portfolio is rebalanced at the beginning of every month, and firms that announced a repurchase plan
during the previous month is included in the portfolio. Panel A shows the results for our buy-and-hold portfolio
when stocks are not sold (the stocks in the portfolio are hold through the entire sample from when they enter), and
Panel B shows the results when we vary the holding period from 1 months to the entire sample period. In both
panel A and panel B the average daily excess return, α, is reported in percent.
Panel A: Buy-hold portfolio performance (no limit on holding period)
Fama/CAPM t-value French t-value Carhart t-value
α (%) 0.10 4.71 0.04 2.29 0.04 2.30βm 0.58 33.79 0.72 38.88 0.72 37.94βsmb - - 0.27 13.51 0.27 13.38βhml - - 0.06 3.74 0.05 2.90βmom - - - - -0.02 -0.98
adj.R2 0.523 0.602 0.602N 1041 1041 1041
Panel B: Various holding periods
Holding CAPM Fama/French Carhartperiod
α(%) t-value α(%) t-value α(%) t-value
1 year 0.064 2.18 0.008 0.28 0.008 0.272 years 0.087 4.49 0.036 1.98 0.036 1.993 years 0.100 4.61 0.046 2.28 0.047 2.294 years 0.099 4.73 0.045 2.31 0.045 2.32Whole sample 0.098 4.71 0.044 2.29 0.045 2.30
28

reaction hypothesis of Ikenberry et al. (1995, 2000). The reaction to the announcement ofrepurchase plans found in table 3 seem to be incomplete relative to the true value of thesignal conveyed through the announcement proxied by the long term excess performancefollowing the announcement. The subsequent abnormal performance for announcing firmsmay be related to information surprises through e.g. public announcements or unexpectedearnings reports that occur after the announcement of the repurchase plan. However, wecannot exclude the possibility that the excess performance may be due to miss-specificationof the expected returns model as discussed in Kothari and Warner (1997) among others.We try to reduce the misspecification by using several model specifications for expectedreturns. Including the size, book to market and momentum factors, reduces the excessperformance estimate relative to a CAPM specification. However, for horizons longer thanone year, there is still evidence that the portfolio of announcing firms experience an excessperformance after having accounted for the portfolios exposure to these risk factors.
Table 6: Long term performance of announcement portfolio - varying starting yearThe table shows the excess performance of a calendar time portfolio of firms announcing a repurchase plan for
various starting years and holding periods. The excess return on the portfolio is measured relative to a four factor
Carhart (1997) model,
Rpt − Rft = α + βm(Rm
t − Rft) + βhRhml
t + βsRsmbt + βmomRmom
t + εt
where Rpt is the return on the equally weighted portfolio of announcing firms, Rft is our proxy for the risk free rate,
Rmτ , Rhml
τ , Rsmbτ and Rmom
τ are the returns on the market-, the book to market-, the size- and the momentum
factors respectively, and the β’s are the factor exposures. The factor returns are calculated similarly as in eq. 3
and α measures the average daily abnormal performance of the portfolio after having adjusted for the Carhart risk
factors. The portfolio is rebalanced at the beginning of every month, and firms that announced a repurchase plan
during the previous month is included in the portfolio. The results when starting the portfolio construction in 1998
and 1999 are quite similar. This is mainly because we do not start the portfolio in 1998 before enough firms (10
firms) have announced a repurchase plan which is in October 1998.
Year when starting portfolio construction
1999 2000 2001Holdingperiod α(%) t-value α(%) t-value α(%) t-value
1 year 0.009 0.31 0.008 0.23 0.02 0.462 years 0.038 2.11 0.044 2.09 0.07 2.593 years 0.049 2.40 0.059 2.38 - -4 years 0.048 2.44 - - - -
6.3 Long term performance conditional on repurchase activity
In the previous section we found support for the underreaction hypothesis in the Norwegianmarket. In this section we examine more closely the nature of the excess performance.Moreover, we study whether the fact that a firm actually execute a repurchase or not isimportant for the subsequent performance.
This is motivated by the fact that a repurchase announcement itself is not a commit-ment to actually repurchase shares. Furthermore, the announcement does not impose anycosts on the managers in the announcing firms if the announcement is false.39 Thus, as
39As proposed by Fried (2002), if managers act opportunistically they may also announce a repurchase
29

Table 7: Announcement CAR given subsequent repurchase activityThe table shows the abnormal returns (in percent) for different periods around the announcement of repurchase
programs that resulted in actual repurchases versus announcements that did not result in subsequent repurchases.
The table also show the p-value from a test that the means between the two groups are equal.
Days relative toannouncement date (τ1 to τ2)
n -60 to -3 -2 to +2 +3 to +60
Announcement, no repurchase 133 -0.05% 2.39% 0.89%Announcement, repurchase 185 -0.40% 2.78% 0.43%
Test for differencein means (p-value) 0.54 0.75 0.62
discussed in Fried (2002) and Comment and Jarrell (1991), the credibility of the signal maybe questionable. On the other hand, when a firm actually executes a repurchase, this maybe perceived as a stronger signal about undervaluation since it involves real transactions.Especially, if the manager or other insiders owns a stake in the company, since if theyrepurchase when the firm is overvalued, the managers will increase their ownership in anovervalued firm (assuming that they retain their shares). Thus, when the market observesthat the firm executes a repurchase it may be interpreted as a signal (or confirmation ofthe initial signal) that the the firm is actually undervalued.
Given that undervaluation is the main motivation for why firms repurchase shares,the actual repurchase executions should be a positive signal to the market about firmvalue. Moreover, one would expect the firm to execute repurchases until the firm is nolonger undervalued. If this is the case we expect the market to react positively to theactual repurchases, and increase prices closer to the true value. Furthermore, if the firmsrepurchase activity increases the price closer to the true value, reducing the mispricing,this should also reduce the subsequent long run excess performance for these firms.40
Announcements that do not result in subsequent repurchases, may be because of sev-eral reasons. First of all, the firm may simply not be mispriced after the announcement.If these firms are more able to credibly signal that they are undervalued through the an-nouncement of a repurchase plan, and the market fully reacts to the information conveyedby the announcement, one would not expect these firms to repurchase any shares after theannouncement (at least not for undervaluation reasons). If this is the case, we would ex-pect announcements that do not result in subsequent repurchases to experience a greaterannouncement effect than announcements that result in subsequent repurchases. To checkthis, we examine, in table 7, whether announcements that do not result in subsequent re-purchases experience a stronger announcement effect than announcements that result inrepurchases. The results suggest that the announcement effect (as well as the pre- andpost-announcement CAR) is similar for the two groups. Thus, there is no evidence thatannouncements which result in subsequent repurchases experience a greater underreactionthan announcements that do not result in repurchases. Rather, the market reaction in thetwo cases are remarkably similar.
plan when the firm is not undervalued to boost the stock price when selling.40As discussed in section 2, firms also repurchase shares for many other reasons than undervaluation.
However, our main discussion will be centered around the undervaluation hypothesis.
30

Another reason for why firms do not execute any repurchases may be because ofliquidity reasons. This can be due to low profitability or that they do not have anyexcess cash available for repurchasing shares. Thus, from an undervaluation perspective,the managers may want to repurchase shares due to undervaluation, but are unable todo so.41 An additional reason for why firms do not repurchase shares during the courseof a repurchase program is discussed in Ikenberry et al. (2000). Findings in Ikenberryet al. (2000) indicates that managers are sensitive to price movements. Thus, if the priceincreases, such that the stock potentially becomes overvalued, the manager may choosenot to execute repurchases.
Our main hypothesis is that if managers execute repurchases to exploit undervaluation,and the market efficiently reacts to the signal conveyed through the actual repurchases, therepurchase activity should mitigate the mispricing. Moreover, the price should increasetowards the ”true” value if the actual repurchases signal undervaluation. This shouldfurther reduce the subsequent excess returns closer to expected levels for a portfolio ofthese firms. In other words, we should observe a lower subsequent abnormal performancefor repurchasing firms if the initial repurchases are successful in reducing the mispricing.In addition, we should also see a positive, and permanent price impact from the actualrepurchases if the market respond favorably to the information that the firm has executedrepurchases (this will be examined more closely in section 6.4).
Relative to what we expect to see for the group of non-repurchasing firms, this isnot clear. As discussed earlier, these firms may both choose to repurchase because theyare not mispriced which imply that these firms should perform as expected. Alternatively,these firms may experience a price increase after the announcement such that the managerschoose not to repurchase any shares (Ikenberry et al., 2000), in which case we expect thesefirms to show an abnormal performance if the price increase is related to new information.Also, if these firms are undervalued after the announcement, but are unable to executerepurchases due to e.g. liquidity constraints, we would also expect these firms to show anlong run abnormal performance if prices are adjusted in response to favorable informationarrivals in later periods. On the other hand, if these firms choose not to repurchase becausethey are overvalued, we would expect these firms to underperform in the long run.
To examine these questions in more detail, we construct a portfolio through calendartime in the similar fashion as we did when we examined the long term performance ofannouncing firms in the previous section. However, instead of only selecting our portfoliostocks conditional on whether the firm has announced a repurchase plan, we now alsocondition our stock selection on whether a firm has executed its first repurchase as well.More specifically, we create two portfolios, assigning firms based on whether they haverepurchased shares in the previous period or not. In the first portfolio (P1) we includea firm the first day of the month following the month when it announced a repurchaseplan (similar to the portfolio created in the previous section). Next, if a firm in P1executes a repurchase, we remove the firm from P1 the following day and include it in asecond portfolio (P2) the first day of the following month after it for the first time hasexecuted a repurchase.42 Thus, P1 will at any point in time only contain firms that haveannounced a repurchase plan, but not yet repurchased, while P2 contains firms that have
41The managers could also issue debt to finance the repurchases, but this may be costly if the firmalready have a high leverage ratio or that the undervaluation is to small to justify an issue of debt.
42Firms may execute several repurchases before it is included in P2. However, the potential price effectof these repurchases will not be included in either P1 or P2. Only the effect of the first repurchase will beincluded in the return of P1.
31

Table 8: Long term performance conditional on repurchase activityThe table shows the excess performance of two calendar time portfolios. P1 is the portfolio with announcing firms
that do not execute any repurchases, only announces. P2 is a portfolio of repurchasing firms where a firm is included
in the portfolio the month after it has executed its first repurchase. The firm is excluded from P1 one day after it
has repurchased for the first time. Thus, at any point in time, P1 consists of firms that has announced a repurchase
plan, but has not executed any repurchases, while P2 consists of firms that has executed at least one repurchase.
The excess returns on the two portfolios are estimated relative to a one-factor CAPM model (i), a three factor
Fama and French (1993) (ii) and a four factor Carhart (1997) model (iii),
(i) Rp,t − Rf,t = α + βm(Rm,t − Rf,t) + εt
(ii) Rp,t − Rf,t = α + βm(Rm,t − Rf,t) + βhmlRhml,t + βsmbRsmb,t + εt
(iii) Rp,t − Rf,t = α + βm(Rm,t − Rf,t) + βhmlRhml,t + βsmbRsmb,t + βmomRmom,t + εt
where Rp,t is the return on the equally weighted portfolio of announcing firms, Rft is our proxy for the risk free rate,
Rmτ , Rhml
τ , Rsmbτ and Rmom
τ are the returns on the market-, the book to market-, the size- and the momentum
factors respectively, and the β’s are the factor exposures. The factor returns are calculated similarly as in eq. 3
and α measures the average daily abnormal performance of the portfolio relative to the excess return on the factor
portfolios. The table shows the results for buy-and-hold portfolios for which stocks are not sold (the stocks in the
portfolio are held through the entire sample from when they enter the portfolio). The estimated average daily excess
return, α, is reported in percent, and numbers in bold denote an α estimate significant at the 5% level.
CAPM Fama/French CarhartP1 (norep) P2 (rep) P1 (norep) P2 (rep) P1 (norep) P2 (rep)
α (%) 0.10 0.10 0.06 0.03 0.06 0.03p-value 0.00 0.00 0.03 0.20 0.03 0.20
βm 0.58 0.56 0.68 0.72 0.67 0.73βsmb 0.20 0.31 0.20 0.32βhml 0.05 0.04 0.01 0.06βmom -0.08 0.03
adj.R2 0.39 0.37 0.42 0.45 0.43 0.45Avg. firms 45 69 45 69 45 69
executed at least one repurchase following an announcement. The combined portfolio ofthe firms in P1 and P2, is the portfolio that was analyzed in section 6.2, such that P1and P2 represent a decomposition of the announcement portfolio.43 The fraction of firmsactually repurchasing and the fraction of outstanding shares actually repurchased amongNorwegian firms is reported in table 1. Thus, at the end of the sample period in thescenario with no limit on the holding period, and we start the portfolio construction atthe beginning of the sample, we will be left with 63 firms in P1 and 100 firms in P2 at theend of the sample period.
In table 8 we estimate the performance of the two portfolios relative to the CAPM,Fama and French (1993) three factor model and the Carhart (1997) four factor model. Onaverage the portfolio of firms that has not repurchased, P1, consists of 45 firms while theportfolio firms that execute at least one repurchase, P2, contains on average 69 firms. Fordiversification reasons, we do not start our portfolio construction before both portfolioseach contain at least 10 firms, which is in May 1999. Estimating Jensen’s alpha with
43One difference however, is that since firms are removed the day after they repurchase and not includedin P2 before the first day of the next month, there is a window where a repurchasing firm is excluded fromboth portfolios.
32

respect to the CAPM, both portfolios show a significant abnormal performance of 2%(P1) and 1.6% (P2) per month. However, relative to the Fama/French and Carhartspecifications, the results indicate that P2 does not experience an abnormal performancewhile P1 experience a significant abnormal performance of about 1.2% per month. In otherwords, the portfolio tracking the portfolio of repurchasing firms (after they have executedtheir first repurchases) perform as expected while the portfolio of firms that announces,but do not repurchase, experience an excess performance.
This result may indicate that actual repurchases provide useful information to themarket which may be related to the confirmation of the initial announcement signal,permanently increasing the price such that mispricing is mitigated, and subsequent returnsare reduced to expected levels. However, we cannot exclude the possibility that thesefirms do not repurchase shares for undervaluation reasons. In addition, the result may alsoindicate that managers repurchase shares when their underperforms, such that the averageperformance of this portfolio is lower than the portfolio where managers do not executeany repurchases. We will examine the abnormal price impact of the actual repurchasesin the next section to investigate whether it is likely that the actual repurchases mitigatemispricing.
Our results are also consistent with earlier findings. Stephens and Weisbach (1998)find, using quarterly repurchase data for Canada, that repurchases during one quarter ap-pear to be negatively related to unadjusted returns in the previous (and contemporaneous)quarter. This suggests that managers respond to previous price changes when determiningwhether to repurchase or not. In addition, they find that subsequent returns is lower in thequarters after the firm has repurchased. This finding is also confirmed in, Ikenberry et al.(2000), using monthly repurchase data from Canada. In addition, Ikenberry et al. (2000)find that stock performance in the year following the announcement of a repurchase plandecreases with the repurchase activity. They argue that this is because managers timetheir repurchases to times when the firm is perceived by the manager of the firm as beingundervalued, such that these firms experience a lower excess performance on average.
This points to an issue that is not examined in the paper. The decision to repurchase islikely to be related to events occurring after the announcement of the repurchase program,such that the repurchases (or non repurchases) observed ex post were not necessarilyintended ex ante. This is an important and interesting issue since announcing firms arelikely to “self select” into being repurchasers or non-repurchasers. Furthermore, this mayexplain the finding that repurchasing firms has a lower abnormal performance than nonrepurchasing firms. It may be that firms choose not to repurchase because the price of theirstock has increased reflected by the abnormal performance of P1, while non-repurchaserschoose to repurchase because their stock has performed poorly. An interesting extensionwould be to examine this self selection in more detail to study what are the importantdecision variables that induce announcing firms to execute repurchases or not.
Since the results in table 8 are for the whole sample period for a buy-an-hold strategy,we also check the robustness of our results by creating portfolios starting in different yearsas well as with various holding periods. The results from this analysis is reported in table9. With respect to the different starting years, the results are qualitatively the same asin table 8, but quantitatively stronger in the later part of the sample. When we alsovary the holding period, we find that the abnormal performance for P1 is significant forholding periods longer than one year. This is similar to the results when we examined theperformance for all firms in table 5.
So far we have not discussed in detail what may contribute to the abnormal perfor-
33

Table 9: Long term performance conditional on repurchase activity - varying starting yearand holding periodThe table shows the excess performance of two calendar time portfolios for varying starting years and holding
periods. P1 is the portfolio with announcing firms that do not execute any repurchases, only announces. P2 is a
portfolio of repurchasing firms where a firm is included in the portfolio the month after it has executed its first
repurchase. Thus, at any point in time, P1 consists of firms that has announced a repurchase plan, but has not
executed any repurchases, while P2 consists of firms that has executed at least one repurchase. The excess returns
on the two portfolios are both measured relative to a four factor Carhart (1997) model,
Rpt − Rft = α + βm(Rm,t − Rf
t) + βhmlRhml,t + βsmbRsmb,t + βmomRmom,t + εt
where Rpt is the return on the equally weighted portfolio of announcing firms, Rft is our proxy for the risk free rate,
Rmτ , Rhml
τ , Rsmbτ and Rmom
τ are the returns on the market-, the book to market-, the size- and the momentum
factors respectively, and the β’s are the factor exposures. The factor returns are calculated similarly as in eq. 3
and α measures the average daily abnormal performance of the portfolio relative to the excess return on the factor
portfolios. The average daily excess return, α, is reported in percent, numbers in parentheses are p-values for the
α estimates, and numbers in bold represent a significance at the 5% level.
Year when starting portfolio construction
Max. 1999 2000 2001holdingperiod α(P1) α(P2) α(P1) α(P2) α(P1) α(P2)
1 year 0.045 0.013 0.069 -0.007 0.134 0.028(0.191) (0.727) (0.128) (0.86) (0.039) (0.655)
2 years 0.066 0.012 0.089 -0.006 0.121 0.017(0.046) (0.658) (0.033) (0.832) (0.034) (0.665)
3 years 0.063 0.028 0.083 0.016 · ·(0.036) (0.231) (0.027) (0.533) · ·
4 years 0.061 0.029 · · · ·(0.025) (0.308) · · · ·
34

Table 10: Long term performance conditional on repurchase activity - removing initialrepurchase in P1The table shows the excess performance of two calendar time portfolios. P1 is the portfolio with announcing firms
that do not execute any repurchases, only announces. To examine whether the the effect of the initial repurchase
contribute to the excess performance of P1, we exclude a firm five days before it executes its first repurchase. P2
remains identical as in the previous analysis where firms are included in the first day of the month after it has
executed its first repurchase. Thus, at any point in time, P1 consists of firms that has announced a repurchase
plan, but has not executed any repurchases, while P2 consists of firms that has executed at least one repurchase.
The excess returns on the two portfolios are both measured relative to a one-factor CAPM model (i), a three factor
Fama and French (1993) (ii) and a four factor Carhart (1997) model (iii),
(i) Rp,t − Rf,t = α + βm(Rm,t − Rf,t) + εt
(ii) Rp,t − Rf,t = α + βm(Rm,t − Rf,t) + βhmlRhml,t + βsmbRsmb,t + εt
(iii) Rp,t − Rf,t = α + βm(Rm,t − Rf,t) + βhmlRhml,t + βsmbRsmb,t + βmomRmom,t + εt
where Rp,t is the return on the equally weighted portfolio of announcing firms, Rft is our proxy for the risk free rate,
Rmτ , Rhml
τ , Rsmbτ and Rmom
τ are the returns on the market-, the book to market-, the size- and the momentum
factors respectively, and the β’s are the factor exposures. The factor returns are calculated similarly as in eq. 3
and α measures the average daily abnormal performance of the portfolio relative to the excess return on the factor
portfolios. The table shows the results for buy-and-hold portfolios for which stocks are not sold (the stocks in the
portfolio are held through the entire sample from when they enter the portfolio). The estimated average daily excess
return, α, is reported in percent, and numbers in bold denote an α estimate significant at the 5% level.
CAPM Fama/French CarhartP1 (norepo) P2 (repo) P1 (norepo) P2 (repo) P1 (norepo) P2 (repo)
α (%) 0.09 0.10 0.06 0.03 0.06 0.03p-value 0.00 0.00 0.04 0.24 0.04 0.20
βm 0.58 0.56 0.68 0.72 0.66 0.73βsmb 0.20 0.31 0.19 0.32βhml 0.05 0.04 0.01 0.06βmom -0.08 0.03
adj.R2 0.39 0.37 0.42 0.45 0.42 0.45Avg. firms 45 69 45 69 45 69
mance of P1. As discussed in the beginning of this section, the abnormal performance ofthis portfolio may be due to several reasons. However, one issue that may affect the excessperformance of P1 is that a stock is removed after it has repurchased shares for the firsttime after the announcement. If there is an strong abnormal price impact related to thefirst repurchase execution, this may affect the performance of P1.
To examine to what degree this contributes to the abnormal performance of P1, we re-estimate the models in table 8, but exclude each firm from P1 five days before it execute itsfirst repurchase. Thus, the excess returns related to the initial repurchases should then notbe included in the performance of P1. The results from this analysis is reported in table10, and it does not change the results greatly relative to the results in table 8. However,the estimated alpha for P1 decreases slightly, as well as its p-value, but the alpha is stillsignificant at the 5% level for P1. Thus, the initial repurchase seem to have an impact onthe performance of P1, but it does not explain the overall abnormal performance of P1.
An alternative reason for why firms choose not to repurchase shares may be that thestock price increases such that the manager choose not to repurchase any shares (Ikenberry
35

et al., 2000). This may clearly be a potential reason for why P1 experience a long termabnormal performance. However, another explanation for why these firms do not executeany repurchases may be that the firms do not have any cash available to repurchase shares.Thus, if these firms experience an underreaction when they announce the repurchase plan,such that they are undervalued after the announcement, it may be that they are unable tosignal to the market that they are mispriced through actual repurchases due to liquidityconstraints. Moreover, given that the market underreacts to the signal conveyed throughthe initial announcement, and the firm is undervalued after the announcement, the lackof repurchase activity keeps the price at a low level, resulting in abnormal returns whenthe market is faced with positive information surprises in later periods.
To examine more closely whether low liquidity is a likely reason for why firms donot repurchase, we examine measures of liquidity from accounting data. The liquiditymeasures we use are the most recently reported quick ratios and current ratios prior tothe announcements of the repurchase plans. The current ratio is calculated as the totalshort-term assets divided by total short-term debt, and the quick ratio is calculated asthe sum of cash and deposits, total short-term financial investments and total short-termreceivables divided by total short-term debt. In table 11 we examine the difference inliquidity between the firms in the two groups. The “no repurchase” group contains firmsthat do not repurchase shares during the sample (the firms in portfolio P1 in the aboveanalysis). The first column of the table also contain the average liquidity measure for allfirms listed at the OSE.44 The results suggests that non-repurchasing firms are on averagesignificantly less liquid than repurchasing firms. Although this varies somewhat across theyears, the overall difference in liquidity between non-repurchasing and repurchasing firmssupport a hypothesis that at least some announcing firms do not execute repurchases dueto lack of liquidity. Furthermore, it also substantiates our story that since these firms areconstrained from repurchasing, and more credibly signal undervaluation, they experiencea long-term abnormal drift due to e.g. information surprises in later periods.
To summarize, the results in this section indicates that the long term abnormal per-formance experienced by firms that announce a repurchase plan, mainly is due to firmsthat do not repurchase shares (P1). These results does not provide an explanation forthe underreaction hypothesis proposed by Ikenberry et al. (1995). However, it offers analternative interpretation in that the market rationally underreacts at the announcementdate due to the low credibility of the signal. If a firm actually executes a repurchase,this may be a stronger signal of undervaluation, such that the market price is increasedand the subsequent performance is reduced to expected levels. With respect to why thefirms that do not repurchase experience a long term abnormal performance, we proposeseveral explanations. This may be because these firms experience a price increase after theannouncement reflected in the excess performance for this group, such that the mangerchooses not to execute any repurchases. An additional interpretation, may be that thesefirms are unable to signal undervaluation, such that they on average experience a positivedrift when positive information about the firms are announced in later periods.
44Before averaging across all the firms, we filter away the extreme observations in the upper 99% per-centile. This removes 6 observations (within different years) with the largest having a quick ratio of morethan 1000.
36

Table 11: Liquidity differenceThe table shows the average liquidity of firms announcing a repurchase plan conditional on whether they execute
repurchases for the duration of the repurchase plan or not. Results are supplied for the whole sample (All years) as
well as for announcements occurring within separate years. The first column report the average across all firms at
the OSE. The proxies used to measure liquidity are the ”current ratio” calculated as total short-term assets divided
by total short-term debt, and the ”quick ratio” calculated as the sum of cash and deposits, total short-term financial
investments and total short-term receivables divided by total short-term debt. The liquidity measure is the most
recently reported by the firm before it announces the repurchase plan. We perform t-tests for differences in means
between firms that announce a repurchase plan but do not repurchase (1) and firms that execute repurchases (2).
The first test is a one sided test with the null that non-repurchasing firms has a higher or equal liquidity to firms
that repurchase. The second test is a two sided test with the null hypothesis that the two means are equal. The
p-values are adjusted conditional on whether the variance of the two distributions are significantly different at the
5% level or not.
AllOSE firms No repurchase (1) Repurchase (2) Test for difference in means
Mean Mean Std.err N Mean Std.err N (2) <= (1) (1) = (2)p-value p-value
Quick ratio
All years 2.32 1.66 0.14 63 2.47 0.24 100 <0.01 <0.01
1998 2.48 1.97 0.38 13 1.91 0.31 15 0.54 0.911999 2.31 1.55 0.22 44 2.23 0.31 41 0.04 0.082000 2.36 1.41 0.18 25 2.88 0.43 65 <0.01 <0.012001 2.14 1.84 0.31 49 2.37 0.49 60 0.18 0.37
Current ratio
All years 2.65 1.98 0.14 63 2.72 0.23 100 <0.01 0.01
1998 2.96 2.31 0.35 13 2.10 0.29 15 0.68 0.631999 2.62 1.86 0.21 44 2.56 0.21 41 0.03 0.052000 2.63 1.74 0.22 25 3.13 0.42 65 <0.01 <0.012001 2.36 2.16 0.33 49 2.58 0.49 60 0.24 0.47
37

6.4 The timing and price impact of the actual repurchases
In the previous sections we found evidence that the market on average underreacted to theannouncement of a repurchase plan, suggesting that the information in the initial signalwas slowly incorporated into prices over time. In addition, we found that the apparentunderreaction seemed to be mainly related to firms that announced a repurchase plan,but did not execute any repurchases during the course of the plan.
In this section we look closer at the short term effect in the days surrounding the actualrepurchases. Moreover, we examine whether and to what degree the actual repurchasesare interpreted by the market as informative to the value of the firm. If the repurchase isinterpreted as a valuable positive signal, we should observe on average a positive abnormalreturn on the repurchase date, and that there is no reversal in the CAR after the repur-chase. This would be in line with our interpretation of the results in the previous sectionthat the repurchases mitigate mispricing. Alternatively, an effect from the repurchase mayalso be related to trading activity of the firm, in which case we would expect to see onlya temporary effect.
Initially, in the extreme case where undervaluation is the only motive for why a firmannounces a repurchase plan, undervaluation should also be the main motivation for whyfirms actually execute repurchases. However, as discussed in Ikenberry et al. (2000), themanager may also repurchase because he perceives the firm to be undervalued after largeprice declines. Relative to the initial announcement, the actual repurchases reflect realtransactions and may be more credible signals to the market than the announcement of theplan when there is no commitment to repurchase. Furthermore, when a firm announces arepurchase plan, this may not be related to the firm being undervalued at the time, butrather to give the managers the flexibility to exploit windows of opportunity some pointin the future. Thus, examining the price impact of the actual repurchases may give usmore information about whether undervaluation is a potential explanation for why firmsrepurchase shares and how the market react to the actual repurchase. If managers suc-cessfully identify when the firm is undervalued, one would expect their timing to coincidewith a preceding negative drift in abnormal returns. Results in Ikenberry et al. (2000)suggest that this is the case, but are unable to examine the pattern in excess return aroundthe repurchase date since they only have monthly repurchase aggregates. However, theirresults indicate that firms repurchase more in periods when the stock price falls.
To examine the effect of actual share repurchases, we apply a similar event studymethodology to the one used in section 6.1, and use the actual repurchase announcementdate as the event. This date is either the same day as the repurchase or before the tradingsession starts the next day. One main problem with analyzing the actual repurchasesis that there are about 1375 repurchase events over a 4 year period. Since firms oftenrepurchase shares on several days in a row, this clustering of events is problematic inseveral respects. First of all, if a firm execute several repurchases in sequence, the eventdates will be overlapping and dependent. This results in the post and pre-event excessreturns being averaged across overlapping periods. Thus, if firms repurchase when there isa negative drift in excess returns, the average negative excess return will be exaggerated.Figure 2 shows the average cumulative abnormal returns from 50 days before to 50 daysafter the repurchase when we ignore these problems and use all 1375 repurchase events.Although the numbers used in the figure are subject to several problems related to theclustering of events, and that firms that repurchase more gain a larger weight, it illustratesthat repurchases are executed in periods when the stock experience a downward drift
38

Figure 2: CAR around actual repurchases - unfilteredThe figure shows the CAR from 50 days before the actual repurchase until 50 days after the repurchase. In the
figure we average across all 1375 event dates.
-4.0 %
-3.5 %
-3.0 %
-2.5 %
-2.0 %
-1.5 %
-1.0 %
-0.5 %
0.0 %
0.5 %
1.0 %
-60 -40 -20 0 20 40 60
day (τ)
CAR
in abnormal performance. In addition, there seem to be a temporary increase in thestock price around the repurchases date. Thus, the normal performance of the repurchaseportfolio (P2) in the previous section, may be because these firms perform worse on averagethan non-repurchasing firms in (P1).
To reduce the bias related to the clustering of repurchases discussed above, we calculateshort term excess returns for two main cases. First, for each firm, we restrict repurchasesto be 40 days apart to be included in the sample. Although this reduces the bias relatedto overlapping, the excess returns both before and after the repurchase contain potentialabnormal price movements related to repurchases that are not included in the sample, butare still reflected in the returns. We also examine excess returns surrounding only the firstrepurchase executed by a firm, leaving us with 100 repurchase events. The results fromthis analysis is illustrated in figure 3. In both cases, there seem to be a negative drift inCAR prior to the repurchase and a price impact on the event date. However, pre eventCAR is not significant at any conventional levels. The most important thing to note is thatthe price impact is permanent, in the sense that there is no reversal in CAR at least 20days after the repurchase. If the impact was mainly a liquidity effect, we would expect tosee a reversal in the day after the actual repurchase. Thus, the abnormal permanent priceimpact is in line with the market interpreting the repurchase as a positive signal and/ora confirmation of the initial announcement of the repurchase plan. This support ourinterpretation of the results in the section 6.3, in the sense that repurchases permanentlyincrease prices, and mitigate the undervaluation.
One concern with the argument in section 6.3 is that many of the firms that have exe-cuted their first repurchase, execute several repurchases. In fact 81% of the firms executetwo repurchases, and 26% of the firms execute 10 repurchases. Thus, if each repurchasehas an impact on excess returns, we would expect to see an abnormal performance relatedto these subsequent repurchases which should create a positive drift in the repurchaseportfolio (P2). On the other hand, it may be that most of the signalling value of the
39

Figure 3: CAR around actual repurchases - filteredThe figure shows the CAR from 20 days before the firm announces that it has repurchased until 20 days after the
announcement, when we restrict repurchases not to be within 40 trading days of each other (40 day filter) and when
we only look at the first repurchase executed by a firm (first repurchase).
Tn�(S0
T1�(S0
Td�(S0
(�(S0
d�(S0
1�(S0
n�(S0
T1x T1( Tdx Td( Tx ( x d( dx 1( 1x
e%�t�SIsk
]Vi
3$�R�S��}Z�{YsR�
;(SIskSP$j���
repurchase activity is related to the first repurchase conducted by a firm, since it conveysto the market that the firm is committed to actually repurchasing shares. If so, most ofthe price correction occurs before the stock is included in the second portfolio (P2), suchthat the subsequent performance is not affected by the continuing repurchase activity. Toexamine this in more detail we estimate the CAR for the three day period surrounding theactual repurchase, from τ1=-1 (when the firm actually execute the repurchase), throughτ2=1 (one day after the firm has announced that it has repurchased). We do this for eachn’th repurchase event. In table 12 ”Repurchase number” denotes the sequence number ofthe repurchase. Thus, 100 firms executed one repurchase, 81 firms execute a second re-purchase etc. For each subsequent repurchase event we report the percentage CAR for theevent window, the standard deviation of the CARs related to the event and the associatedt-value. As opposed to the event study in section 6.1 where we estimated the variance forthe excess returns prior to the event, we use the event window standard deviation when weexamine the abnormal returns related to actual repurchases. This estimator of the vari-ance takes into account the possibility that the event itself increases the risk of the firm, assuggested in Campbell et al. (1997). In addition, the two last columns of the table showsthe average fraction that firms repurchase during the n’th repurchase, both with respectto the total number of shares they repurchase in the program as well as as a percentage ofoutstanding shares. The results in the table indicate that the first repurchase executed byfirms has the greatest price impact of about 0.88% which is highly significant. This maysuggests that the first repurchase contains the most value to the market. After the firstrepurchase there seem to be a decrease in the effect from the subsequent repurchases.
It is also interesting to note that firms on average repurchase about 38% of their totalrepurchase amount during their first repurchase. This is also evident when looking atthe repurchase volume as a fraction of outstanding shares, with about 1.1% of the firm
40

Table 12: CAR for subsequent repurchase eventsThe table shows the average cumulative abnormal return from τ1=-1 to τ2=1 for the 15 first repurchases executed
by firms. The first column (”Repurchase number”) denotes whether it is the first, second, third etc. repurchase
executed by the sample firms. Thus, we see from the table that 100 firms executed one repurchase, 81 firms executed
a second repurchase, 66 firms executed a third repurchase and so on. %CAR(τ1, τ2), is the average CAR around the
n’th repurchase executed by firms. The table also report the t-value from a test that the CAR is equal to zero, the
average fraction of the total volume repurchased by firms in the n’th repurchase and the average% of outstanding
shares repurchase by firms in the n’th repurchase.
Repurchase %CAR avg.fractionnumber Firms (τ1, τ2) std.dev t-value of rep.vol of outs. shares
1 100 0.877 0.023 3.83 38.1% 1.1%2 81 0.388 0.021 1.69 16.1% 0.6%3 66 0.398 0.018 1.77 13.1% 0.7%4 65 0.045 0.017 0.22 11.6% 0.5%5 54 0.012 0.015 0.06 8.7% 0.6%6 51 0.449 0.021 1.55 8.0% 0.6%7 41 0.298 0.019 1.00 6.6% 0.6%8 38 0.599 0.020 1.84 6.9% 0.7%9 33 0.218 0.018 0.68 3.1% 0.2%10 26 -0.051 0.017 -0.16 3.9% 0.3%11 22 0.365 0.023 0.75 2.8% 0.3%12 22 0.186 0.021 0.42 3.8% 0.4%13 18 0.154 0.043 0.15 3.8% 0.8%14 16 -0.116 0.014 -0.33 6.0% 0.7%15 15 -0.129 0.019 -0.26 4.4% 0.4%
shares bought back during the initial repurchase. Thus, the largest impact from the initialrepurchase may be due to a liquidity effect. On the other hand, a larger average volumemay also be perceived as a stronger signal in the market. From figure 3 there is noevidence of reversal, but rather that the CAR is relatively stable in the 20 days followingthe repurchase.
Overall it seems like the actual repurchases are greeted by the market as a positivesignal, and that the first repurchase executed by firms is perceived as the most valuablesignal.
7 Conclusion
This paper examines a sample of announcements of repurchase plans and actual repur-chases by Norwegian firms in the period 1998 through 2001. In addition to providingevidence on open market share repurchases in a market where repurchases recently hasbeen allowed, we believe that repurchases in Norway are particularly interesting to studybecause of the legal requirement that firms report their repurchase activity on a dailybasis. By exploiting these unique data, we improve the understanding of repurchases, andhow the market reacts to the actual repurchase executions.
Even during this short period, repurchases has become an important tool for Norwe-gian firms. With respect to the actual repurchase activity of Norwegian firms, we findthat about 60% of the firms that announces a repurchase plan execute at least one repur-chase during the repurchase period authorized by the shareholders. In addition, the cashdistributed through repurchases as a fraction of dividends was 25% in 1999 and 44% in2000 and 2001. Furthermore, these firms repurchased on average 2.9% of their outstanding
41

Figure 4: CAR for subsequent repurchase eventsThe figures plots the standardized CAR (t-values) calculated in table 12 for the 15 first repurchases by firms.
� ��� �� ��� ���� ���� ���� ���� ��� ��� ��� ��� ���� �
� �����������������������������������
���! �"$#&%!'�(�) �+*�"�,.-��/#
0 1 234 254 6 7849: ;< 1 =>2? @8A
shares during the repurchase period.We find support for the underreaction hypothesis investigated in Ikenberry et al. (1995)
also in Norwegian data. The excess performance around the announcement of a repurchaseplan is on average about 2.5%, while a calender time portfolio of the same firms experiencea significant long term excess performance of about 0.9% per month, or about 11% a year,relative to a Fama and French (1993) three factor model specification. Thus, althoughthe market puts a positive value on the signal conveyed through the announcement, thisindicate that it is not completely and immediately incorporated into prices.
In the long run, when creating two portfolios of firms that have announced a repurchaseplan and condition the portfolio construction on whether the firm actually execute anyrepurchases, we find that the portfolio consisting only of announcing firms that has not yetrepurchased show a significant excess performance of about 1.2% per month. The portfolioof firms that actually execute repurchases does not experience a significant abnormalperformance. We interpret this as the market assessing the actual repurchases as a valuablesignal, increasing the stock price and aligning the subsequent long term returns to expectedlevels.
For the firms that do not repurchase, we argue that their excess performance may berelated to several issues. First, it may be that these firms do not repurchase simply becausetheir stock price increases after the announcement such that the manager no longer assessthe firm as being undervalued. However, an additional explanation may be that thesefirms are restricted from repurchasing due to liquidity reasons. And by being unable tosignal undervaluation to the market through real transactions, their stock price experienceexcess performance as the information is conveyed through positive information surprisesin later periods. Consistent with this interpretation we find that firms that do not executeany repurchases are less liquid than firms that actually execute repurchases.
When examining in more detail the timing and price impact around the actual repur-chase executions, we find that there is a negative drift in excess returns during the 20
42

days prior to the actual repurchase. This suggests that managers execute repurchases inperiods when the stock underperforms relative to several model specifications for expectedreturns. When examining the market impact of the repurchases itself, we find that thereis a significant excess return on the day when the firm execute the repurchase. In theperiod after the repurchase, there is no reversal in excess returns suggesting that marketputs a positive value on the signal that the firm has actually repurchased shares.
Overall, our findings offer additional evidence for the underreaction hypothesis. Over-all, the market seem to underreact to the initial announcement. However, the abnormalperformance of announcing firms is to a large degree driven by firms that are unable to ex-ecute repurchases. If these firms are still undervalued after the announcement, and unableto signal undervaluation due to liquidity constraints, the price remains too. This resultindicate that requiring repurchasing firms to announce their repurchases immediately mayhelp improve price discovery.
43

A Robustness check for announcement effect
To check that the results in table 3 in section 6.1 are affected by extreme observations,firms with CARs below the 5th percentile and above the 95th percentile are removed fromthe sample. Table 13 shows the results from this analysis. Truncating the sample reducesthe average announcement CAR to about 1.9% for the Carhart specification.
Table 13: Abnormal returns around announcements of repurchase plans - a robustnesscheckThe table shows the abnormal return (in percent) around announcements of repurchase plans when the 5% lowest
and 5% highest CARs are removed from the sample. The abnormal return is measured relative to a one factor
market model (unadjusted and adjusted for biases induced by infrequent trading as proposed in Dimson (1979)
and Scholes and Williams (1977)), Fama and French (1993) three factor model and the Carhart (1997) four factor
model, with the value weighted OSE general index as the market portfolio. The sub-sample regressions and the
repurchase% regressions are cumulative excess returns relative to the Carhart four factor model. Numbers in bold
represent numbers significantly different from zero at the 1% level, and numbers in parenthesis are the associated
t-values.
Days relative to announcement daten -20 to -3 -2 to +2 +3 to +20
Whole sample regressionsUnadjusted market model 286 -0.56 (-1.20) 1.845 (4.39) 0.51 (0.62)Dimson(1979) 286 -0.32 (-0.67) 1.806 (4.21) 0.00 (0.01)Scholes/Williams(1977) 286 -0.51 (-1.08) 1.807 (4.23) -0.12 (-0.21)Fama/French 3 factor model 286 -0.74 (-1.54) 1.814 (4.28) 0.16 (0.29)Carhart 4 factor model 286 -0.60 (-1.27) 1.901 (4.44) 0.14 (0.26)
Subsample regression (year)1998 25 1.61 (1.18) 1.360 (0.74) 1.12 (0.86)1999 77 -0.59 (-0.69) 2.198 (2.82) 1.46 (1.19)2000 83 -1.55 (-1.62) 1.042 (1.30) -0.17 (-0.17)2001 101 -0.37 (-0.47) 2.515 (3.62) -0.87 (-0.96)
Max.repudchase %<0%-5%] 23 -4.27 (-2.08) 4.235 (1.00) -1.80 (-0.67)<5%-10%] 263 -0.33 (-0.69) 1.893 (4.48) 0.24 (0.41)
44

B Additional data for the sale of treasury stock
The paper only examines the gross repurchase activity by firms. However, the datasetalso contains the sale of repurchased shares (treasury stock). Table 14 shows aggregatestatistics for both repurchases as well as for the sale of treasury stock (“reverse repur-chases”). The reduction in treasury stock may be due to e.g. sales of shares in the openmarket, as payment in various transactions, management/employee option exercises, stockbonuses, stock dividends or that the treasury stock is retired. As can be seen from thetable, there are almost six times as many repurchase executions as sales, and the numberof repurchased shares are more than twice of what was sold. However, the size of therepurchases are on average about 1/3 of the amount that was sold. This indicate thatfirms aggregate treasury stock through many smaller repurchases, and reduce treasurystock in much larger volumes.
Table 14: Aggregate statistics for repurchases and sale of treasury stockThe table shows aggregate statistics for both stock repurchases as well as for “reverse” repurchases (sale of treasury
stock). The table shows the number of transactions, the total number of shares traded and the average size of the
transactions for repurchases and sales during the period from 1999 to 2002. The last part of the table shows the
fraction of buys to sales.
Size ofNumber of Shares transactions
transactions (mill.) (1000 shares)Repurchases
Whole period 1719 247.2 143.81999 205 35.3 172.22000 463 64.6 139.52001 659 107.4 163.02002 392 40.6 103.5
Sales
Whole period 293 109.4 373.51999 19 2.8 145.02000 68 26.2 385.02001 105 40.6 386.92002 101 39.9 394.9
Fraction of buys/sales
Whole period 5.87 2.26 0.381999 10.79 12.82 1.192000 6.81 2.47 0.362001 6.28 2.64 0.422002 3.88 1.02 0.26
45
References
Allen, F. and R. Michaely (2003). Payout Policy, in Handbooks of the Economics ofFinance, vol. 1A, chap. 7, 337–429. Elsevier.
Bagnoli, M. and B. I. Lipman (1989). “Stock repurchases as a takeover defense.” Reviewof Financial Studies, 2, 423–443.
Bagwell, L. (1991). “Share repurchases and takeover deterrence.” RAND Journal ofEconomics, 22, 72–88.
Barclay, M. J. and C. W. Smith (1988). “Corporate payout policy.” Journal of FinancialEconomics, 22, 61–82.
Bens, D. A., V. Nagar, and M. H. F. Wong (2002). “Real investment implications ofemployee stock option exercises.” Journal of Accounting Research, 2, 359–393.
Black, F. and M. Scholes (1974). “The effects of dividend yield and dividend policy oncommon stock prices and returns.” Journal of Financial Economics, 1, 1–22.
Brav, A., J. R. Graham, C. R. Harvey, and R. Michaely (2003). “Payout policy in the21st century.” NBER Working Paper No.9657.
Brennan, M. J. and A. V. Thakor (1990). “Shareholder preferences and dividend policy.”Journal of Finance, 45, 993–1018.
Brockman, P. and D. Y. Chung (2004). “Managerial timing and corporate liquidity: Evi-dence from actual share repurchases.” Forthcoming in Journal of Financial Economics.
Brown, S. and J. Warner (1985). “Using daily stock returns: The case of event studies.”Journal of Financial Economics, 14, 3–31.
Brown, S. and M. Weinstein (1985). “Dervied factors in event studies.” Journal ofFinancial Economics, 14, 491–495.
Campbell, J., A. Lo, and A. C. MacKinlay (1997). The Econometrics of Financial Markets.Princeton.
Carhart, M. (1997). “Dervied factors in event studies.” Journal of Finance, 52, 57–82.
Chan, K., D. Ikenberry, and I. Lee (2003). “Economic sources of gain in stock repurchases.”Working Paper.
Comment, R. and G. A. Jarrell (1991). “The relative signalling power of dutch-auctionand fixed-price tender offers and open-market share repurchases.” Journal of Finance,46, 1243–1271.
Dann, L. Y. (1981). “Common stock repurchases: An analysis of returns to bondholdersand stockholders.” Journal of Financial Economics, 9, 113–138.
Denis, D. J. (1990). “Defensive changes in corporate payout policy: Share repurchasesand special dividends.” Journal of Finance, 45, 1433–1456.
46

Dimson, E. (1979). “Risk measurement when shares are subject to infrequent trading.”Journal of Financial Economics, 7, 197–226.
Dittmar, A. K. (2000). “Why do firms repurchase stock?” Journal of Business, 73,331–355.
Fama, E. F. and K. R. French (1993). “Common risk factors in the returns on stocks andbonds.” Journal of Financial Economics, 33, 3–56.
Fenn, G. W. and N. Liang (1997). “Good news and bad news about share repurchases.”Working Paper, Board of Governors of the Federal Reserve, Washington D.C.
Fenn, G. W. and N. Liang (2001). “Corporate payout policy and managerial stock incen-tives.” Journal of Financial Economics, 60, 45–72.
Fried, J. M. (2002). “Open market repurchases: Signaling or manegerial opportunism?”UC Berkeley Public Law and Legal Theory Research Paper Series, no. 64.
Grullon, G. and R. Michaely (2002). “Dividends, share repurchases, and the substitutionhypothesis.” Journal of Finance, 57, 1649–1684.
Ikenberry, D., J. Lakonishok, and T. Vermaelen (1995). “Market underreaction to openmarket share repurchases.” Journal of Financial Economics, 39, 181–208.
Ikenberry, D., J. Lakonishok, and T. Vermaelen (2000). “Stock repurchases in canada:Performance and strategic trading.” Journal of Finance, 55, 2373–2397.
Institutional Investor (1998). “The buyback track.”
Isagawa, N. (2000). “Open-market stock repurchase and stock price behavior when man-agement values real investment.” The Financial Review, 35, 95–108.
Jagannathan, M., C. P. Stephens, and M. S. Weisbach (2000). “Financial flexibility andthe choice between dividends and stock repurchases.” Journal of Financial Economics,57, 355–384.
Jensen, M. C. (1986). “Agency costs of free cash flow, corporate finance, and takeovers.”American Economic Review, 76, 323–329.
Kothari, S. P. and J. B. Warner (1997). “Measuring long-horizon security performance.”Journal of Financial Economics, 43, 301–339.
Kracher, B. and R. R. Johnson (1997). “Repurchase announcements, lies and false signals.”Journal of Business Ethics, 16, 1677–1685.
Lasfer, M. A. (2000). “The market valuation of share repurchases in europe.” WorkingPaper, City University Business School.
Li, K. and W. J. McNally (2002). “The decision to repurchase, announcement returns andinsider holdings: A conditional event study.” University of British Columbia, WorkingPaper UBCFIN01-2.
Lie, E. and H. J. Lie (1999). “The role of personal taxes in corporate descisions: An empir-ical analysis of share repurchases and dividends.” Journal of Financial and QuantitativeAnalysis, 34, 533–552.
47

Lintner, J. (1956). “Distribution of incomes of corporations among dividends, retainedearnings, and taxes.” American Economic Review, 46, 97–113.
Masulis, R. W. (1980). “Stock repurchase by tender offer: An analysis of the causes ofcommon stock price changes.” Journal of Finance, 35, 305–319.
Miller, M. and F. Modigliani (1961). “Dividend policy, growth, and the valuation ofshares.” The Journal of Business, 34, 411–433.
Miller, M. H. and K. Rock (1985). “Dividend policy under asymmetric information.”Journal of Finance, 40, 1031–1051.
Opler, T. and S. Titman (1996). “The debt-equity choice: An analysis of issuing firms.”Working Paper, Ohio State University.
Scholes, M. and J. Williams (1977). “Estimating betas from nonsynchronous data.” Jour-nal of Financial Economics, 5, 309–327.
Stephens, C. P. and M. S. Weisbach (1998). “Actual share reacquisitions in open marketrepurchase programs.” Journal of Finance, 53, 313–333.
Vermaelen, T. (1981). “Common stock repurchases and market signalling.” Journal ofFinancial Economics, 9, 139–183.
Vermaelen, T. (1984). “Repurchase tender offers, signaling, and managerial incentives.”Journal of Financial and Quantitative Analysis, 19, 163–181.
Womack, K. (1996). “Do brokerage analysts’ recommendations have investment value?”Journal of Finance, 51, 137–167.
48

49
WORKING PAPERS (ANO) FROM NORGES BANK 2002-2004 Working Papers were previously issued as Arbeidsnotater from Norges Bank, see Norges Bank’s
website http://www.norges-bank.no 2002/1 Bache, Ida Wolden Empirical Modelling of Norwegian Import Prices Research Department 2002, 44p 2002/2 Bårdsen, Gunnar og Ragnar Nymoen Rente og inflasjon Forskningsavdelingen 2002, 24s 2002/3 Rakkestad, Ketil Johan Estimering av indikatorer for volatilitet Avdeling for Verdipapirer og internasjonal finans Norges Bank 33s 2002/4 Akram, Qaisar Farooq PPP in the medium run despite oil shocks: The case of Norway Research Department 2002, 34p 2002/5 Bårdsen, Gunnar, Eilev S. Jansen og Ragnar Nymoen Testing the New Keynesian Phillips curve Research Department 2002, 38p 2002/6 Lindquist, Kjersti-Gro The Effect of New Technology in Payment Services on Banks’Intermediation Research Department 2002, 28p 2002/7 Sparrman, Victoria Kan pengepolitikken påvirke koordineringsgraden i lønnsdannelsen? En empirisk analyse. Forskningsavdelingen 2002, 44s 2002/8 Holden, Steinar The costs of price stability - downward nominal wage rigidity in Europe Research Department 2002, 43p 2002/9 Leitemo, Kai and Ingunn Lønning Simple Monetary Policymaking without the Output Gap Research Department 2002, 29p 2002/10 Leitemo, Kai Inflation Targeting Rules: History-Dependent or Forward-Looking? Research Department 2002, 12p 2002/11 Claussen, Carl Andreas Persistent inefficient redistribution International Department 2002, 19p 2002/12 Næs, Randi and Johannes A. Skjeltorp Equity Trading by Institutional Investors: Evidence on Order Submission Strategies Research Department 2002, 51p 2002/13 Syrdal, Stig Arild A Study of Implied Risk-Neutral Density Functions in the Norwegian Option Market Securities Markets and International Finance Department 2002, 104p 2002/14 Holden, Steinar and John C. Driscoll A Note on Inflation Persistence Research Department 2002, 12p 2002/15 Driscoll, John C. and Steinar Holden Coordination, Fair Treatment and Inflation Persistence Research Department 2002, 40p 2003/1 Erlandsen, Solveig Age structure effects and consumption in Norway, 1968(3) – 1998(4) Research Department 2003, 27p

50
2003/2 Bakke, Bjørn og Asbjørn Enge Risiko i det norske betalingssystemet Avdeling for finansiell infrastruktur og betalingssystemer 2003, 15s 2003/3 Matsen, Egil and Ragnar Torvik Optimal Dutch Disease Research Department 2003, 26p 2003/4 Bache, Ida Wolden Critical Realism and Econometrics Research Department 2002, 18p 2003/5 David B. Humphrey and Bent Vale Scale economies, bank mergers, and electronic payments: A spline function approach Research Department 2003, 34p 2003/6 Harald Moen Nåverdien av statens investeringer i og støtte til norske banker Avdeling for finansiell analyse og struktur 2003, 24s 2003/7 Geir H. Bjønnes, Dagfinn Rime and Haakon O.Aa. Solheim Volume and volatility in the FX market: Does it matter who you are? Research Department 2003, 24p 2003/8 Olaf Gresvik and Grete Øwre Costs and Income in the Norwegian Payment System 2001. An application of the Activity
Based Costing framework Financial Infrastructure and Payment Systems Department 2003, 51p 2003/9 Randi Næs and Johannes A.Skjeltorp Volume Strategic Investor Behaviour and the Volume-Volatility Relation in Equity Markets Research Department 2003, 43p 2003/10 Geir Høidal Bjønnes and Dagfinn Rime Dealer Behavior and Trading Systems in Foreign Exchange Markets Research Department 2003, 32p 2003/11 Kjersti-Gro Lindquist Banks’ buffer capital: How important is risk Research Department 2003, 31p 2004/1 Tommy Sveen and Lutz Weinke Pitfalls in the Modelling of Forward-Looking Price Setting and Investment Decisions Research Department 2004, 27p 2004/2 Olga Andreeva Aggregate bankruptcy probabilities and their role in explaining banks’ loan losses Research Department 2004, 44p 2004/3 Tommy Sveen and Lutz Weinke New Perspectives on Capital and Sticky Prices Research Department 2004, 23p 2004/4 Gunnar Bårdsen, Jurgen Doornik and Jan Tore Klovland A European-type wage equation from an American-style labor market: Evidence from a
panel of Norwegian manufacturing industries in the 1930s Research Department 2004, 22p 2004/5 Steinar Holden and Fredrik Wulfsberg Downward Nominal Wage Rigidity in Europe Research Department 2004, 33p 2004/6 Randi Næs Ownership Structure and Stock Market Liquidity Research Department 2004, 50p 2004/7 Johannes A. Skjeltorp and Bernt-Arne Ødegaard The ownership structure of repurchasing firms Research Department 2004, 54p

51
2004/8 Johannes A. Skjeltorp The market impact and timing of open market share repurchases in Norway Research Department 2004, 51p

Johannes A
. Skjeltorp
: The m
arket imp
act and tim
ing o
f op
en market share rep
urchases in No
rway
W
orking
Paper 2
00
4/
8
KEYWORDS:
Open market share repurchasesAsymmetric information
- 28348