Embed Size (px)
Citation preview

© Transamerica Institute®, 2017
The Many Faces of Caregivers:
A Close-Up Look at Caregiving and Its ImpactsPrimary vs. Non-Primary
September 2017TI 0001-0917
©2017, Transamerica Institute®

Welcome to this compendium of insights and findings from the Inaugural Transamerica Institute Survey on
Caregiving in the United States
This report is an exploration of the nature of non-professional family caregiving in the U.S., offering portraits
of caregivers and care recipients as well as perspectives on caregiving responsibilities and the impact
caregiving has on caregivers’ health, finances and well-being.
It is comprised of these chapters:
• Primary vs. Non-Primary. This chapter contains a portrait of today’s caregivers based 26 key
indicators measuring caregiving’s impacts on both the caregiver and care recipient.
• Influences of Demographics on Caregiving. These chapters are demographic segmentation
analyses by voluntary status, employment status, gender, generations, household income, and
ethnicity.
Each chapter presents a concise set of 26 key measures for each demographic segment.
We hope that you find this compendium to be a helpful source of caregiving research and survey data.
If you are seeking survey data that you do not find in this report, please contact Transamerica Institute at
[email protected] and we will do our best to assist you.
Thank you.
2
Welcome to the Inaugural Transamerica Caregivers Survey

Catherine Collinson serves as CEO and president of Transamerica Institute® and Transamerica Center for
Retirement Studies®, and is a retirement and market trends expert and champion for Americans who are at
risk of not achieving a financially secure retirement. Catherine oversees all research, publications and
outreach initiatives, including the Annual Transamerica Retirement Survey. She also serves as executive
director of the Aegon Center for Longevity and Retirement.
With two decades of retirement services experience, Catherine has become a nationally recognized voice on
retirement trends for the industry. She has testified before Congress on matters related to employer-
sponsored retirement plans among small business, which featured the need to raise awareness of the
Saver’s Credit among those who would benefit most from the important tax credit. Catherine serves on the
Advisory Board of the Milken Institute’s Center for the Future of Aging. In 2016, she was honored with a Hero
Award from the Women’s Institute for a Secure Retirement (WISER) for her tireless efforts in helping improve
retirement security among women.
Hector De La Torre is the executive director of the Transamerica Center for Health Studies®, which is
focused on empowering consumers and employers to achieve the best value and protection from their health
coverage, as well as the best outcomes in their personal health and wellness. Hector served as a State
Assemblymember for California’s 50th District from 2004-2010. Among his accomplishments as an elected
official were expanding access to doctors in underserved communities, consumer protections against
retroactive cancellation of health insurance, and supporting facilities improvements at Children’s Hospitals.
Prior to that, he was Mayor and Councilmember in his hometown of South Gate.
Hector serves on the board of L.A. Care, the largest public health plan in the United States, a member of the
Board of Trustees at Occidental College (his alma mater) in Los Angeles, and is a member of the California
Air Resources Board (CARB) as a gubernatorial appointee.
3
About the Authors

• Transamerica Institute® (TI) is a nonprofit, private foundation dedicated to identifying, researching and
educating the public about retirement, health coverage, and other relevant financial issues facing
Americans today. It is comprised of two research centers: Transamerica Center for Retirement Studies®
(TCRS) and Transamerica Center for Health Studies® (TCHS). Its mission is to help educate and empower
people to make informed decisions about important matters that can improve their health and wealth.
• TI is funded by contributions from Transamerica Life Insurance Company and its affiliates and may
receive funds from unaffiliated third parties.
• TI and its representatives cannot give ERISA, tax, investment or legal advice. This material is provided for
informational purposes only and should not be construed as ERISA, tax, investment or legal advice.
Interested parties must consult and rely solely upon their own independent advisors regarding their
particular situation and the concepts presented here.
• Although care has been taken in preparing this material and presenting it accurately, TI disclaims any
express or implied warranty as to the accuracy of any material contained herein and any liability with
respect to it.
4
About Transamerica Institute
About the Inaugural Caregivers Survey
• The Many Faces of Caregivers is a comprehensive examination of the state of unpaid caregiving in
America. Unpaid caregivers face a host of financial and health-related challenges – both for themselves
and those they care for.
• A large proportion of the population is entering the age range where the need for them to become
caregivers becomes more likely. At the same time, many find themselves financially unprepared for
retirement and need to stay in the workforce longer. These factors, coupled with a healthcare system
that is often difficult to navigate, result in an environment that is challenging for all concerned.
• The analysis contained in this report, The Many Faces of Caregivers: A Close-Up Look at Caregiving and
Its Impacts, was prepared internally by the research team at Transamerica Institute.
• The survey uncovers the various challenges caregivers are facing as well as insight into their health,
both physical and financial, and the support they desire.
5

Methodology• The national online survey was conducted by Harris Poll between March 13 - April 21, 2017 among 3,074 non-professional
caregivers.
• A comprehensive demographic profile of the target population of interest of all U.S. non-professional caregivers is not available. Therefore, in order to ensure that this sample is properly representative, U.S. adults age 18+ who were notcaregivers were also screened and asked certain demographic questions. However, the full survey was only administered to non-professional caregivers.
• The combined data for non-professional U.S. caregivers plus all other age 18+ respondents were weighted to make them representative of the general U.S. age 18+ population.
— Data were weighted by race/ethnic groups [Hispanic, Black/African American (not Hispanic), Asian (not Hispanic), All Other (not Hispanic)] to each group's U.S. Census Bureau population distributions of U.S. adults age 18+ for gender, education, household income, household size, marital status, and employment status.
— The weighting also adjusts for attitudinal and behavioral differences between those who are online versus those who are not, those who join online panels versus those who do not, and those who responded to this survey versus those who did not.
• The caregiver respondents were then analyzed as a representative subgroup of the general population age 18+.
• Caregivers for this survey met the following criteria:
— U.S. residents, age 18 or older
— Non-professional caregivers (who may or may not receive compensation for caregiver role)
— Provided care for a relative or friend with an episodic, permanent, or temporary condition who needs help taking care of themselves at any time in the preceding 12 months. The care recipient could be an adult or a child.
• The average survey length was 32 minutes. Respondents were given the option to complete the survey in Spanish, and 199 respondents did so, including 79 percent Hispanics and 21 percent non-Hispanics.
• Percentages are rounded to the nearest whole percent. Differences in the sums of combined categories/answers are due to rounding.
• Main sub-sample:
— Primary caregivers = 2,137
— Non-Primary caregivers = 829
6
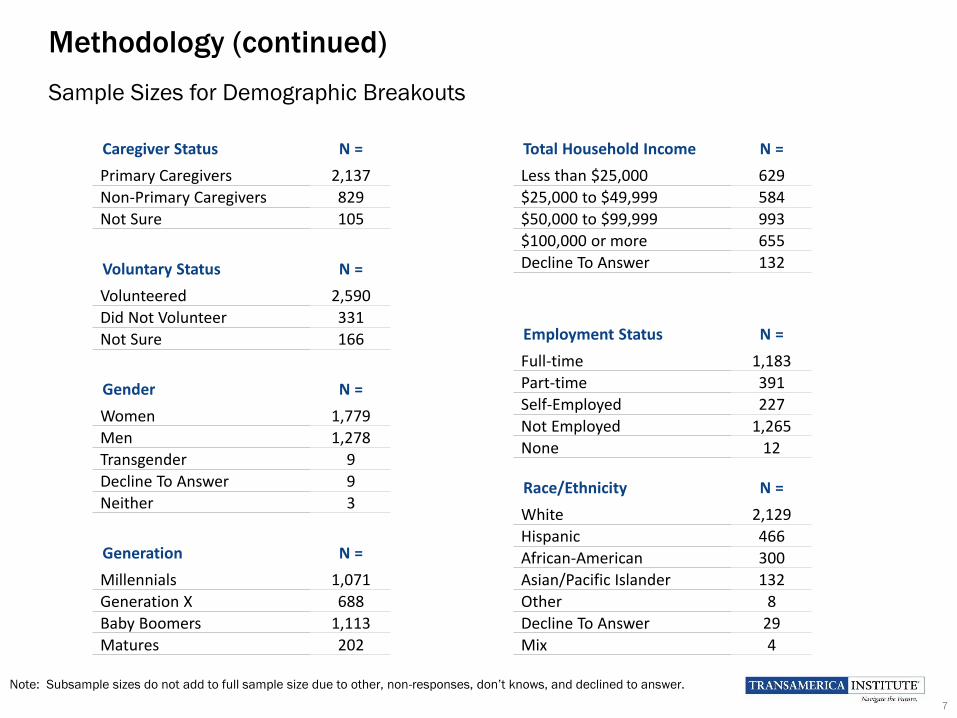
Methodology (continued)
7
Caregiver Status N =
Primary Caregivers 2,137
Non-Primary Caregivers 829
Not Sure 105
Voluntary Status N =
Volunteered 2,590
Did Not Volunteer 331
Not Sure 166
Gender N =
Women 1,779
Men 1,278
Transgender 9
Decline To Answer 9
Neither 3
Sample Sizes for Demographic Breakouts
Generation N =
Millennials 1,071
Generation X 688
Baby Boomers 1,113
Matures 202
Total Household Income N =
Less than $25,000 629
$25,000 to $49,999 584
$50,000 to $99,999 993
$100,000 or more 655
Decline To Answer 132
Employment Status N =
Full-time 1,183
Part-time 391
Self-Employed 227
Not Employed 1,265
None 12
Race/Ethnicity N =
White 2,129
Hispanic 466
African-American 300
Asian/Pacific Islander 132
Other 8
Decline To Answer 29
Mix 4
Note: Subsample sizes do not add to full sample size due to other, non-responses, don’t knows, and declined to answer.

Terminology
This report uses the following terminology:
Care Recipient: person for whom the caregiver provides care
Caregiver and Voluntary Status
• Caregiver: 18+ year old living in the U.S. who has provided care for a relative or friend at any time in the past 12 months
• Primary Caregivers: caregivers who self-identify as the primary caregiver
• Non-Primary Caregivers: caregivers who do not self-identify as the primary caregiver
• Voluntary: caregivers who self-identify as voluntarily becoming a caregiver
• Non-Voluntary: caregivers who do not self-identify as voluntarily becoming a caregiver
Employment Status
• Employed full-time
• Employed part-time
• Self-employed including full-time and part-time self-employed
• Not employed including retired, stay-at-home spouse or partner, student, not employed but looking for work, not employed and not looking for work, not employed due to the caregiver’s own disability or illness, and on leave of absence from employer
Generation
• Millennial: born 1979 – 2000
• Generation X: born 1965 – 1978
• Baby Boomer: born 1946 – 1964
• Mature: born prior to 1946
8
9
The Many Faces of Family Caregivers:
A Close-Up Look at Caregiving and Its Implications
Executive Summary
A Portrait of Today’s Caregivers
Key Highlights
• A Portrait of Today’s Caregivers
• Insights About Care Recipients and Their Needs
• The Diverse Duties, Daily Lives, and Dedication of Caregivers
• The Employment Situation of Caregivers
• The Personal Financial Implications of Being a Caregiver
• The Health Effects of Being a Caregiver
• Ways to Help Caregivers with Their Responsibilities
Key Highlights
Introduction
Millions of Americans are serving as unpaid caregivers for a relative or friend with a temporary, episodic, or permanent
condition who needs help taking care of themselves. With people living longer, the high cost of long-term care and the aging of
the Baby Boomer generation, the number of unpaid caregivers is likely to increase.
Transamerica Institute®, including its Center for Retirement Studies and Center for Health Studies, has undertaken a large-
scale survey of 3,000+ caregivers to gain a better understanding of their duties and the impact of caregiving on their own
health and well-being, employment, finances and retirement preparations. The survey provides an in-depth analysis by primary
versus non-primary caregivers and demographic portraits by those who volunteered to become a caregiver compared to those
who didn’t volunteer, gender, generation, household income, employment status, and race/ethnicity. The survey also offers
detailed findings about the care recipients, including their health status and financial situation.
A Portrait of Today’s Caregivers
Caregivers and their care recipients represent two highly diverse populations. Some caregivers play a greater role than others
in providing care. In order to better understand the nature, time commitment, and personal impact of their duties, the survey
examined the similarities and differences between the 68 percent caregivers who consider themselves to be the Primary
caregiver of the care recipient and the 29 percent who do not consider themselves to be such or Non-Primary caregivers. (The
remaining 3 percent were “not sure.”)
A Portrait of Caregivers. Among all caregivers, the population is split almost evenly with slightly more women (53 percent)
than men (47 percent). Millennials (34 percent) and Baby Boomers (37 percent) are more likely to be caregivers than
Generation X (22 percent). Fifty-one percent are employed either full-time or part-time. Household income is $57,000
(estimated median). These findings are relatively consistent between Primary and Non-Primary caregivers.
The Majority of Caregivers Are Caring for a Family Member. Eighty-seven percent of all caregivers are caring for a family
member, a finding which is higher among Primary (91 percent) compared to Non-Primary (79 percent) caregivers. Parents
are the most frequently cited recipients of care among both Primary (34 percent) and Non-Primary (35 percent)
caregivers. Primary caregivers are more likely than Non-Primary caregivers to be caring for a spouse/partner (27 percent
vs. 2 percent, respectively) or a child (13 percent vs. 6 percent, respectively).
10

Key Highlights
Three in Four Caregivers Provide Care for One Person. Seventy-five percent of all caregivers provide care for only one
person. Twenty-five percent care for two or more individuals. These findings are consistent among Primary and Non-
Primary caregivers.
Most Caregivers Do So Out of Love. People become caregivers for a variety of reasons, including: a desire to care for their
loved one (63 percent), having a close relationship to the care recipient (58 percent), having the time and capacity to do
so (43 percent), and living in close proximity to the care recipient (36 percent). These reasons are commonly shared
among Primary and Non-Primary caregivers with a higher percentage of Primary caregivers citing these responses.
However, the survey found two major differences between Primary and Non-Primary caregivers. Primary caregivers are
more likely than Non-Primary caregivers to indicate that nobody else was available (25 percent vs. 16 percent,
respectively) or that nobody else was willing to do so (20 percent vs. 9 percent respectively).
Four Out of Five Caregivers Came to it Voluntarily. Eighty-four percent of all caregivers became a caregiver voluntarily, a
finding which is slightly higher among Primary (85 percent) versus Non-Primary (82 percent) caregivers. Eleven percent of
all caregivers say they did not become a caregiver voluntarily and the other 5 percent are “not sure.”
Most Caregivers Have Provided Care for Years. Among all caregivers, the providing of care has been two years (median).
Primary caregivers have been providing care for three years (median) while Non-Primary caregivers have been providing
care for two years (median). Seventy-four percent of all caregivers have been providing care for one or more years.
Primary caregivers (80 percent) are more likely to have been providing care for one or more years compared to Non-
Primary caregivers (63 percent). Twenty-seven percent of all caregivers have been providing care for five or more years, a
finding which is higher among Primary (32 percent) than Non-Primary (17 percent) caregivers.
Family Members Often Work Together to Provide Care. Seventy-six percent of all caregivers indicate that other people
(excluding medical professionals and care facility staff) are involved in providing care for the care recipient, a finding
which is higher among Non-Primary (92 percent) than Primary (68 percent) caregivers. Family members (65 percent) are
the most frequently cited type of individual involved in caregiving, a finding which is also higher among Non-Primary (82
percent) than Primary (58 percent) caregivers.
11

Key Highlights
Almost Half of Caregivers Live with Their Care Recipient. Almost half of caregivers (47 percent) live with their care
recipient, a finding which is significantly higher among Primary caregivers (59 percent) than Non-Primary caregivers (19
percent). Primary caregivers (43 percent) are more than three times more likely than Non-Primary caregivers (12 percent)
to have the care recipient living in their home. Similarly, Primary caregivers (16 percent) are also more likely than Non-
Primary caregivers (7 percent) to live in the care recipient’s home.
Caregivers Tend to Live in Close Proximity to the Care Recipient. Among those who do not live with the care recipient,
approximately half of all caregivers (49 percent) live within 10 miles of the care recipient, a finding which is relatively
consistent between Primary (52 percent) and Non-Primary (45 percent) caregivers.
Insights About Care Recipients and Their Needs
Caregivers are serving care recipients who are diverse in terms of their conditions and level of activity. Some more than other
care recipients have discussed and/or documented their medical and financial wishes.
Care Recipients Have a Range of Conditions. Caregivers provide care for a range of different ailments and health
conditions. The three most common conditions are arthritis (26 percent), dementia/Alzheimer’s disease (Net, 25
percent), and high blood pressure (22 percent).
Most Care Recipients Are at Least Somewhat Active. Sixty-four percent of caregivers indicate their care recipient is
somewhat active, a finding which is more frequently cited among Primary (66 percent) than Non-Primary (59 percent)
caregivers. Among all caregivers, one in five (20 percent) indicate the care recipient is completely inactive, a finding which
is more frequently cited among Non-Primary (25 percent) than Primary (18 percent) caregivers. Sixteen percent of all
caregivers, including Primary and Non-Primary, say their care recipient is fully active.
Approximately Half of Care Recipients Have a Permanent Condition. Fifty-four percent of all caregivers indicate that their
care recipient has a permanent health condition while 21 percent indicate that their care recipient has a temporary
primary condition and 16 percent have a reoccurring condition. These findings are consistent between Primary and Non-
Primary caregivers.
12

Key Highlights
Most Say Care Recipients Have Discussed Their Wishes. The majority of caregivers indicate that their care recipients have
discussed health directives with them or another close friend/relative, and almost half have written documentation for
health information (HIPPA) waiver, and wills or trusts in place. While 74 percent of care recipients have discussed allowing a
designated individual to make medical decisions (power of attorney), only 50 percent have documented the arrangement.
o Primary Caregivers’ Discussions with Care Recipients. Most Primary caregivers indicate their care recipients have
discussed various matters related to their care with them or another close relative or friend, including medical power
of attorney (78 percent), health information (HIPPA) waivers (77 percent), advance directives (72 percent),
guardianship (63 percent), funeral and burial arrangements (71 percent), and wills or trusts (72 percent).
o Non-Primary Caregivers Are Having Discussions About Health Directives. Most Non-Primary caregivers indicate their
care recipients have discussed various matters related to their care with them or another close relative or friend,
including medical power of attorney (68 percent), health information (HIPPA) waivers (67 percent), advance directives
(59 percent), guardianship (51 percent), funeral and burial arrangements (58 percent), and wills or trusts (57
percent).
The Diverse Duties, Daily Lives, and Dedication of Caregivers
Caregiving responsibilities involve commitments of time and energy performing a wide variety of tasks, ranging from personal
care to household management and administering medications and treatments. These tasks can be fulfilling but may also be
exhausting. Primary caregivers spend much more time providing care than Non-Primary caregivers and, in many ways, are more
personally impacted.
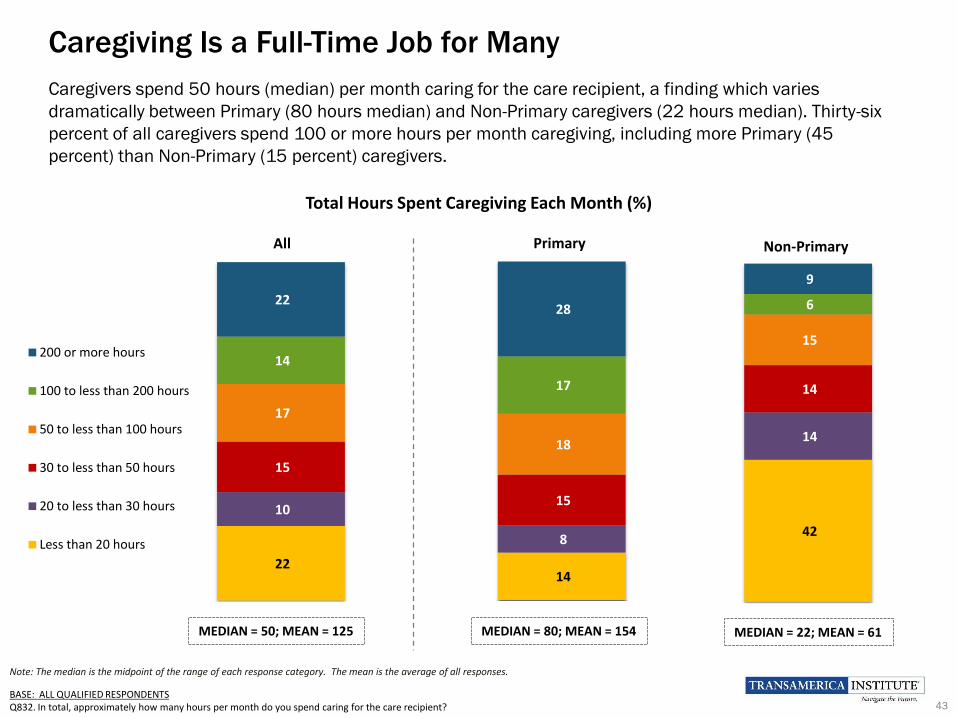
Caregiving Is a Full-Time Job for Many. Caregivers spend 50 hours (median) per month caring for the care recipient, a finding
which varies dramatically between Primary (80 hours median) and Non-Primary caregivers (22 hours median). Thirty-six
percent of all caregivers spend 100 or more hours per month caregiving, including more Primary (45 percent) than Non-
Primary (15 percent) caregivers.
13
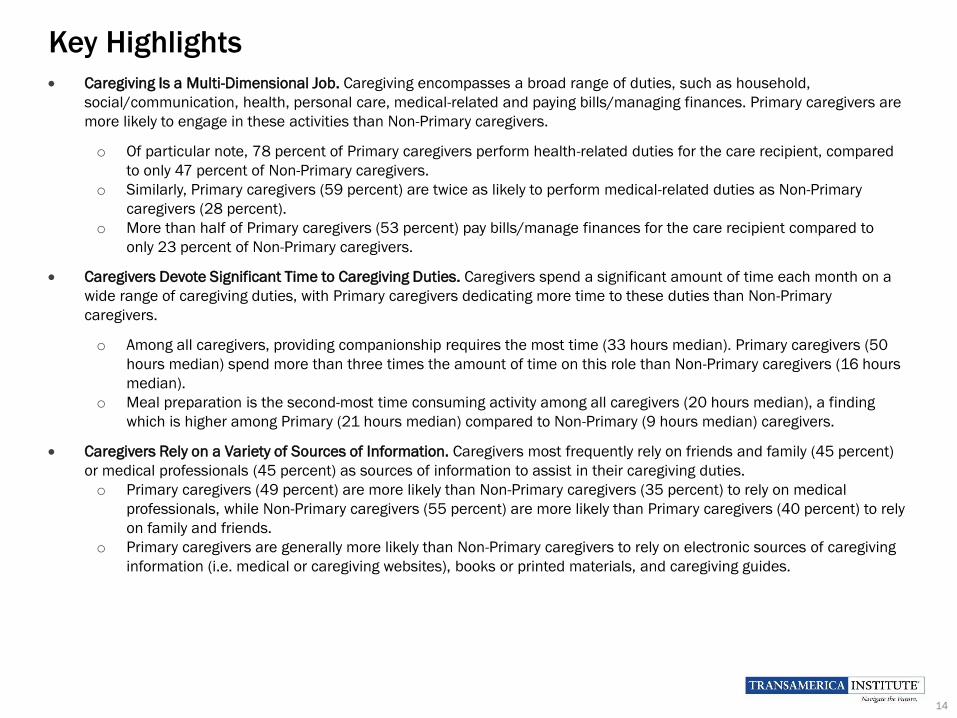
Key Highlights
Caregiving Is a Multi-Dimensional Job. Caregiving encompasses a broad range of duties, such as household,
social/communication, health, personal care, medical-related and paying bills/managing finances. Primary caregivers are
more likely to engage in these activities than Non-Primary caregivers.
o Of particular note, 78 percent of Primary caregivers perform health-related duties for the care recipient, compared
to only 47 percent of Non-Primary caregivers.
o Similarly, Primary caregivers (59 percent) are twice as likely to perform medical-related duties as Non-Primary
caregivers (28 percent).
o More than half of Primary caregivers (53 percent) pay bills/manage finances for the care recipient compared to
only 23 percent of Non-Primary caregivers.
Caregivers Devote Significant Time to Caregiving Duties. Caregivers spend a significant amount of time each month on a
wide range of caregiving duties, with Primary caregivers dedicating more time to these duties than Non-Primary
caregivers.
o Among all caregivers, providing companionship requires the most time (33 hours median). Primary caregivers (50
hours median) spend more than three times the amount of time on this role than Non-Primary caregivers (16 hours
median).
o Meal preparation is the second-most time consuming activity among all caregivers (20 hours median), a finding
which is higher among Primary (21 hours median) compared to Non-Primary (9 hours median) caregivers.
Caregivers Rely on a Variety of Sources of Information. Caregivers most frequently rely on friends and family (45 percent)
or medical professionals (45 percent) as sources of information to assist in their caregiving duties.
o Primary caregivers (49 percent) are more likely than Non-Primary caregivers (35 percent) to rely on medical
professionals, while Non-Primary caregivers (55 percent) are more likely than Primary caregivers (40 percent) to rely
on family and friends.
o Primary caregivers are generally more likely than Non-Primary caregivers to rely on electronic sources of caregiving
information (i.e. medical or caregiving websites), books or printed materials, and caregiving guides.
14

Key Highlights
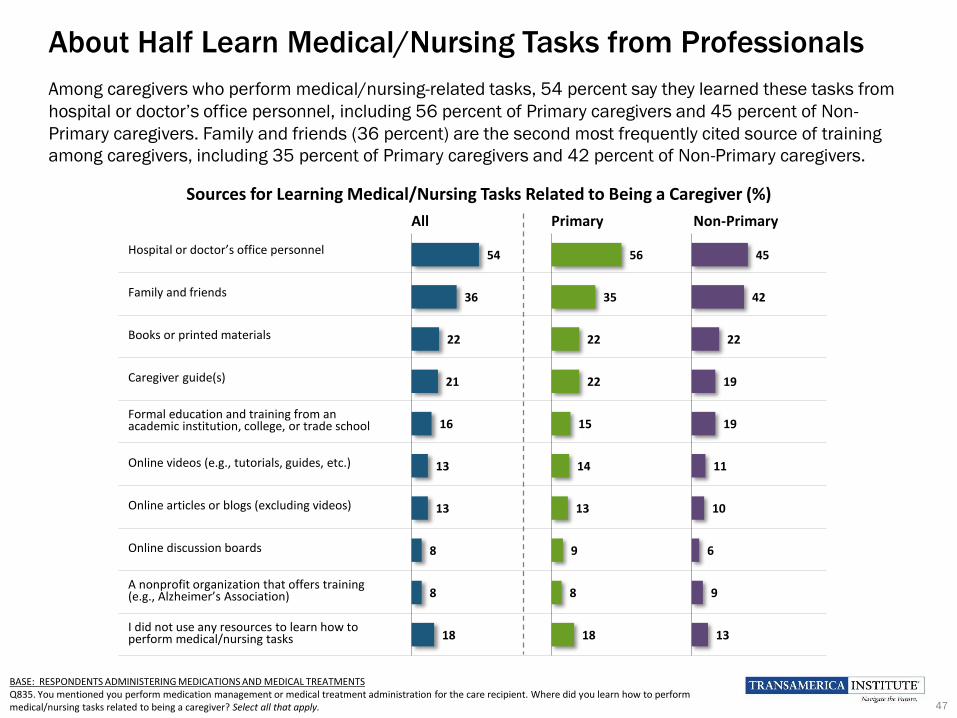
About Half Learn Medical/Nursing Tasks from Professionals. Among caregivers who perform medical/nursing-related
tasks, 54 percent say they learned these tasks from hospital or doctor’s office personnel, including 56 percent of Primary
caregivers and 45 percent of Non-Primary caregivers. Family and friends (36 percent) are the second most frequently
cited source of training among caregivers, including 35 percent of Primary caregivers and 42 percent of Non-Primary
caregivers.
Caregivers’ Sentiments About Their Caregiving Duties. The vast majority of all caregivers cite positive aspects of
caregiving, including that they like helping and enjoy spending time with their care recipient (both 91 percent). However,
more than half of all caregivers agree that their caregiving duties leave them feeling emotionally or physically exhausted
(both 55 percent). Primary caregivers (61 percent) are far more likely than Non-Primary caregivers (41 percent) to indicate
their own health is taking a backseat to the health of their care recipients.
The Employment Situation of Caregivers
Many caregivers are also holding down jobs, in addition to their caregiving duties, which requires a delicate balancing act. The
survey examined how these caregiving duties may be negatively impacting their employment situation.
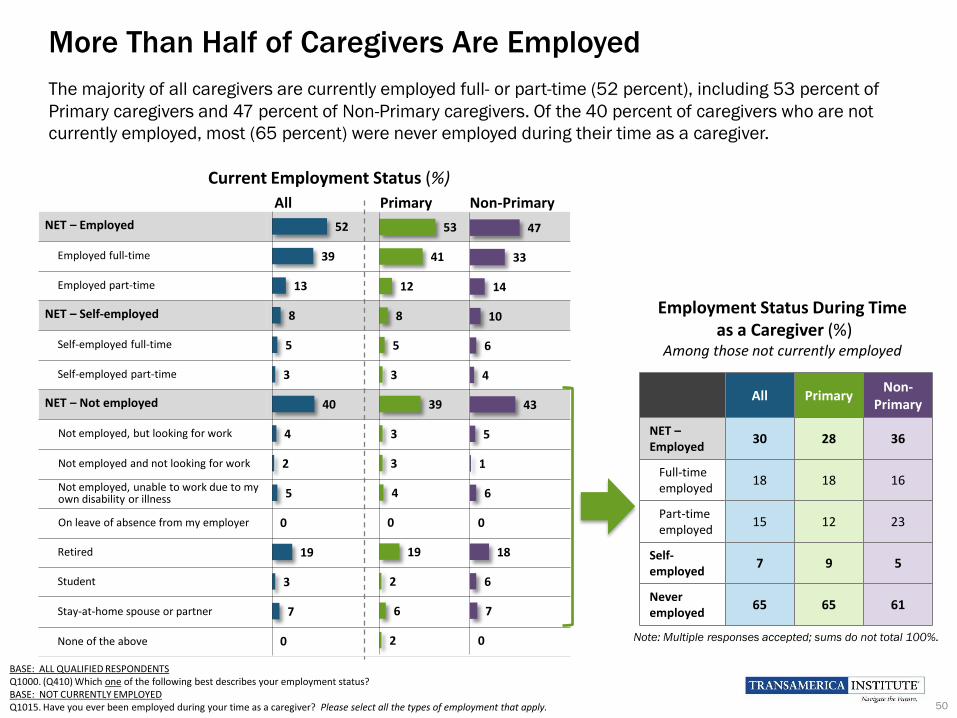
More Than Half of Caregivers Are Employed. The majority of all caregivers are currently employed full- or part-time (52
percent), including 53 percent of Primary caregivers and 47 percent of Non-Primary caregivers. Of the 40 percent of
caregivers who are not currently employed, most (65 percent) were never employed during their time as a caregiver.
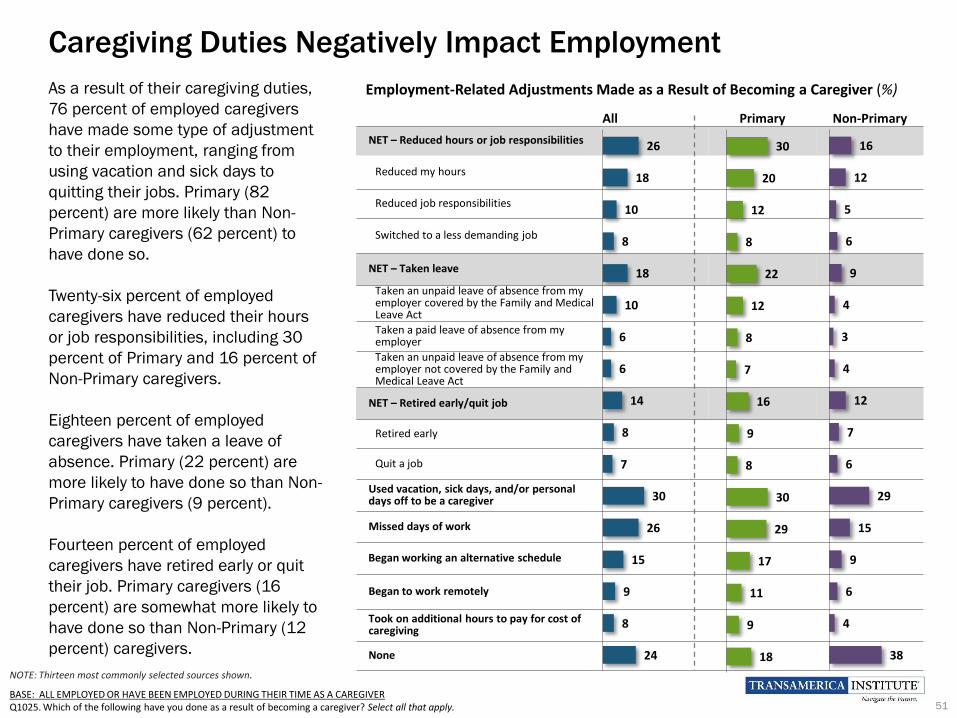
Caregiving Duties Negatively Impact Employment. As a result of their caregiving duties, 76 percent of employed caregivers
have made some type of adjustment to their employment, ranging from using vacation and sick days to quitting their jobs.
Primary (82 percent) are more likely than Non-Primary caregivers (62 percent) to have done so.
o Twenty-six percent of employed caregivers have reduced their hours or job responsibilities, including 30 percent of
Primary and 16 percent of Non-Primary caregivers.
o Eighteen percent of employed caregivers have taken a leave of absence. Primary (22 percent) are more likely to
have done so than Non-Primary caregivers (9 percent).
o Fourteen percent of employed caregivers have retired early or quit their job. Primary caregivers (16 percent) are
somewhat more likely to have done so than Non-Primary (12 percent) caregivers.
15
Key Highlights
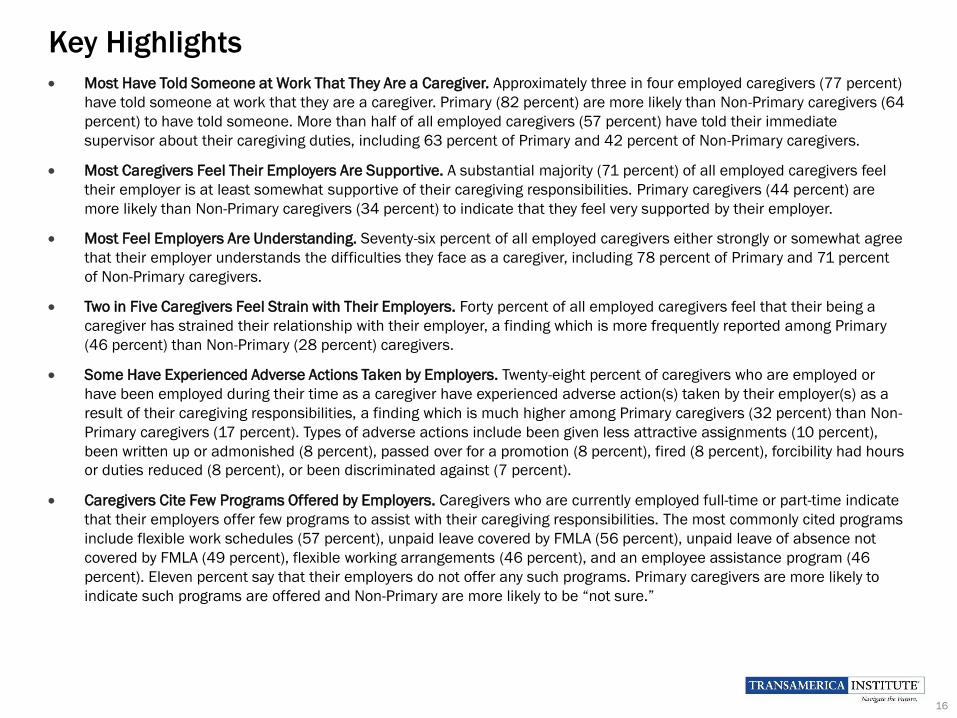
Most Have Told Someone at Work That They Are a Caregiver. Approximately three in four employed caregivers (77 percent)
have told someone at work that they are a caregiver. Primary (82 percent) are more likely than Non-Primary caregivers (64
percent) to have told someone. More than half of all employed caregivers (57 percent) have told their immediate
supervisor about their caregiving duties, including 63 percent of Primary and 42 percent of Non-Primary caregivers.
Most Caregivers Feel Their Employers Are Supportive. A substantial majority (71 percent) of all employed caregivers feel
their employer is at least somewhat supportive of their caregiving responsibilities. Primary caregivers (44 percent) are
more likely than Non-Primary caregivers (34 percent) to indicate that they feel very supported by their employer.
Most Feel Employers Are Understanding. Seventy-six percent of all employed caregivers either strongly or somewhat agree
that their employer understands the difficulties they face as a caregiver, including 78 percent of Primary and 71 percent
of Non-Primary caregivers.
Two in Five Caregivers Feel Strain with Their Employers. Forty percent of all employed caregivers feel that their being a
caregiver has strained their relationship with their employer, a finding which is more frequently reported among Primary
(46 percent) than Non-Primary (28 percent) caregivers.
Some Have Experienced Adverse Actions Taken by Employers. Twenty-eight percent of caregivers who are employed or
have been employed during their time as a caregiver have experienced adverse action(s) taken by their employer(s) as a
result of their caregiving responsibilities, a finding which is much higher among Primary caregivers (32 percent) than Non-
Primary caregivers (17 percent). Types of adverse actions include been given less attractive assignments (10 percent),
been written up or admonished (8 percent), passed over for a promotion (8 percent), fired (8 percent), forcibility had hours
or duties reduced (8 percent), or been discriminated against (7 percent).
Caregivers Cite Few Programs Offered by Employers. Caregivers who are currently employed full-time or part-time indicate
that their employers offer few programs to assist with their caregiving responsibilities. The most commonly cited programs
include flexible work schedules (57 percent), unpaid leave covered by FMLA (56 percent), unpaid leave of absence not
covered by FMLA (49 percent), flexible working arrangements (46 percent), and an employee assistance program (46
percent). Eleven percent say that their employers do not offer any such programs. Primary caregivers are more likely to
indicate such programs are offered and Non-Primary are more likely to be “not sure.”
16
Key Highlights
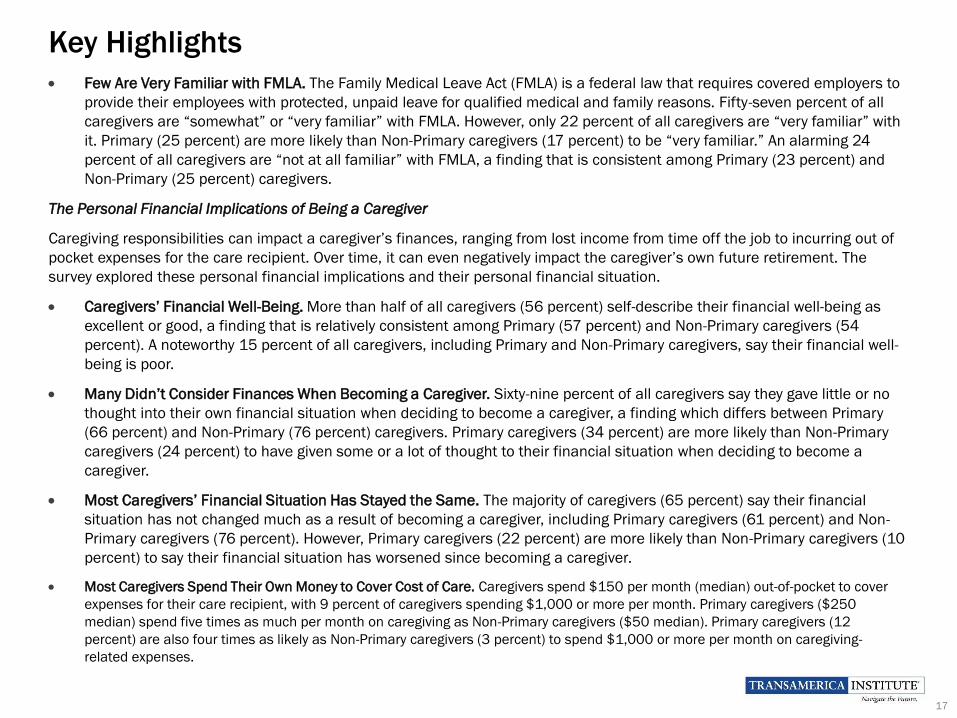
Few Are Very Familiar with FMLA. The Family Medical Leave Act (FMLA) is a federal law that requires covered employers to
provide their employees with protected, unpaid leave for qualified medical and family reasons. Fifty-seven percent of all
caregivers are “somewhat” or “very familiar” with FMLA. However, only 22 percent of all caregivers are “very familiar” with
it. Primary (25 percent) are more likely than Non-Primary caregivers (17 percent) to be “very familiar.” An alarming 24
percent of all caregivers are “not at all familiar” with FMLA, a finding that is consistent among Primary (23 percent) and
Non-Primary (25 percent) caregivers.
The Personal Financial Implications of Being a Caregiver
Caregiving responsibilities can impact a caregiver’s finances, ranging from lost income from time off the job to incurring out of
pocket expenses for the care recipient. Over time, it can even negatively impact the caregiver’s own future retirement. The
survey explored these personal financial implications and their personal financial situation.
Caregivers’ Financial Well-Being. More than half of all caregivers (56 percent) self-describe their financial well-being as
excellent or good, a finding that is relatively consistent among Primary (57 percent) and Non-Primary caregivers (54
percent). A noteworthy 15 percent of all caregivers, including Primary and Non-Primary caregivers, say their financial well-
being is poor.
Many Didn’t Consider Finances When Becoming a Caregiver. Sixty-nine percent of all caregivers say they gave little or no
thought into their own financial situation when deciding to become a caregiver, a finding which differs between Primary
(66 percent) and Non-Primary (76 percent) caregivers. Primary caregivers (34 percent) are more likely than Non-Primary
caregivers (24 percent) to have given some or a lot of thought to their financial situation when deciding to become a
caregiver.
Most Caregivers’ Financial Situation Has Stayed the Same. The majority of caregivers (65 percent) say their financial
situation has not changed much as a result of becoming a caregiver, including Primary caregivers (61 percent) and Non-
Primary caregivers (76 percent). However, Primary caregivers (22 percent) are more likely than Non-Primary caregivers (10
percent) to say their financial situation has worsened since becoming a caregiver.
Most Caregivers Spend Their Own Money to Cover Cost of Care. Caregivers spend $150 per month (median) out-of-pocket to cover
expenses for their care recipient, with 9 percent of caregivers spending $1,000 or more per month. Primary caregivers ($250
median) spend five times as much per month on caregiving as Non-Primary caregivers ($50 median). Primary caregivers (12
percent) are also four times as likely as Non-Primary caregivers (3 percent) to spend $1,000 or more per month on caregiving-
related expenses.
17

Key Highlights
Most Caregivers Do Not Receive Any Financial Assistance. Only 25 percent of all caregivers receive any sort of financial
assistance for their caregiving duties, a finding which is higher among Primary (27 percent) than Non-Primary (21 percent)
caregivers. With regards to possible sources of financial assistance, caregivers’ most frequently cited source of funds are
from the care recipient (10 percent), a finding which is relatively consistent between Primary (11 percent) and Non-
Primary (8 percent) caregivers.
Almost Half of Caregivers Are Paying Off Debt. Caregivers’ most frequently cited financial priorities include just getting by --
covering basic living expenses (43 percent) and saving for retirement (37 percent). A noteworthy and alarming 49 percent
of caregivers cite paying off some form of debt as a financial priority including 32 percent who mentioned paying off credit
card or consumer debt. These financial priorities are directionally similar among Primary and Non-Primary caregivers.
However, Primary caregivers (34 percent) are more likely than Non-Primary caregivers (25 percent) to mention paying
healthcare expenses. Primary caregivers are also more likely than Non-Primary caregivers to mention supporting children
and supporting parents.
Household Income Among Caregivers Spans a Wide Spectrum. The household income of caregivers is $57,000 per year
(estimated median). Twenty-eight percent of caregivers report a household income of $100,000 or more per year,
including 29 percent of Primary caregivers and 25 percent of Non-Primary caregivers. Thirty-five percent of caregivers
report a household income of less than $50,000 per year.
Most Are Confident About Retiring Comfortably. Sixty percent of caregivers are “somewhat” or “very confident” that they
will be able to fully retire with a comfortable lifestyle, including 24 percent who are “very confident” and 36 percent who
are “somewhat confident.” However, one in five caregivers (21 percent) are “not at all confident.” These findings are
consistent between Primary and Non-Primary caregivers.
Six in 10 Caregivers Are Saving for Retirement. Most caregivers (61 percent) are saving for retirement in some way. The
two most frequently cited savings vehicles that caregivers are using to save are employer-sponsored 401(k)s or similar
programs (34 percent) and IRAs (29 percent). These findings are consistent between Primary and Non-Primary caregivers.
Are Caregivers Saving Enough For Retirement? Caregivers have saved $68,000 (estimated median) in all household
retirement accounts, a finding which is relatively consistent among Primary and Non-Primary caregivers. Sixteen percent
of all caregivers have saved $500k or more in all retirement accounts, a finding which is slightly higher among Primary
caregivers (17 percent) than Non-Primary caregivers (14 percent). Fifteen percent of all caregivers have no savings in
retirement accounts.
18
Key Highlights
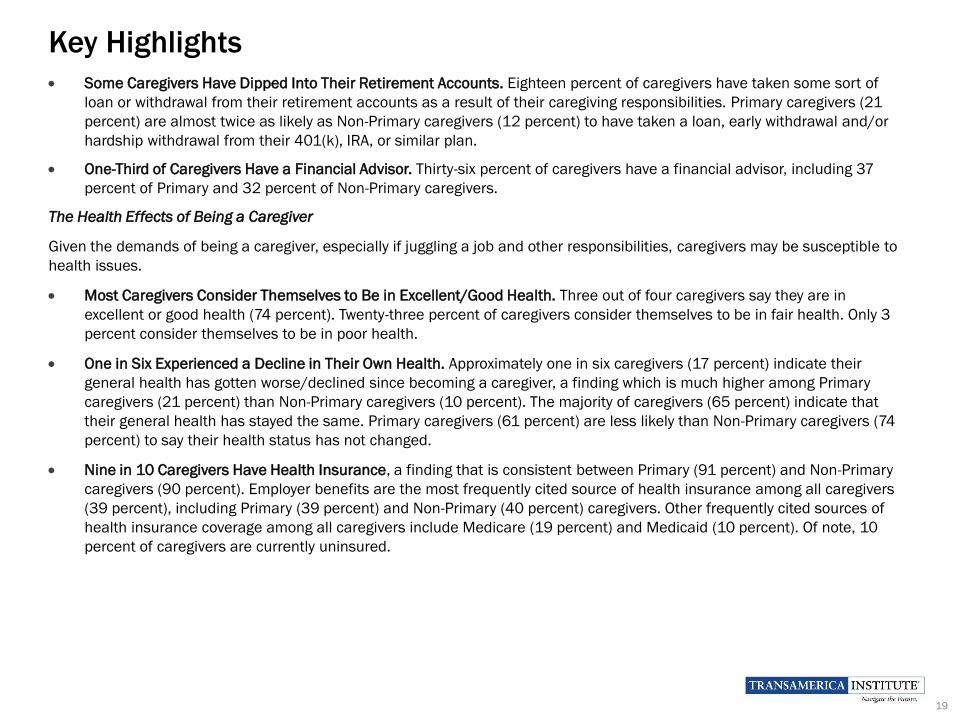
Some Caregivers Have Dipped Into Their Retirement Accounts. Eighteen percent of caregivers have taken some sort of
loan or withdrawal from their retirement accounts as a result of their caregiving responsibilities. Primary caregivers (21
percent) are almost twice as likely as Non-Primary caregivers (12 percent) to have taken a loan, early withdrawal and/or
hardship withdrawal from their 401(k), IRA, or similar plan.
One-Third of Caregivers Have a Financial Advisor. Thirty-six percent of caregivers have a financial advisor, including 37
percent of Primary and 32 percent of Non-Primary caregivers.
The Health Effects of Being a Caregiver
Given the demands of being a caregiver, especially if juggling a job and other responsibilities, caregivers may be susceptible to
health issues.
Most Caregivers Consider Themselves to Be in Excellent/Good Health. Three out of four caregivers say they are in
excellent or good health (74 percent). Twenty-three percent of caregivers consider themselves to be in fair health. Only 3
percent consider themselves to be in poor health.
One in Six Experienced a Decline in Their Own Health. Approximately one in six caregivers (17 percent) indicate their
general health has gotten worse/declined since becoming a caregiver, a finding which is much higher among Primary
caregivers (21 percent) than Non-Primary caregivers (10 percent). The majority of caregivers (65 percent) indicate that
their general health has stayed the same. Primary caregivers (61 percent) are less likely than Non-Primary caregivers (74
percent) to say their health status has not changed.
Nine in 10 Caregivers Have Health Insurance, a finding that is consistent between Primary (91 percent) and Non-Primary
caregivers (90 percent). Employer benefits are the most frequently cited source of health insurance among all caregivers
(39 percent), including Primary (39 percent) and Non-Primary (40 percent) caregivers. Other frequently cited sources of
health insurance coverage among all caregivers include Medicare (19 percent) and Medicaid (10 percent). Of note, 10
percent of caregivers are currently uninsured.
19
Key Highlights
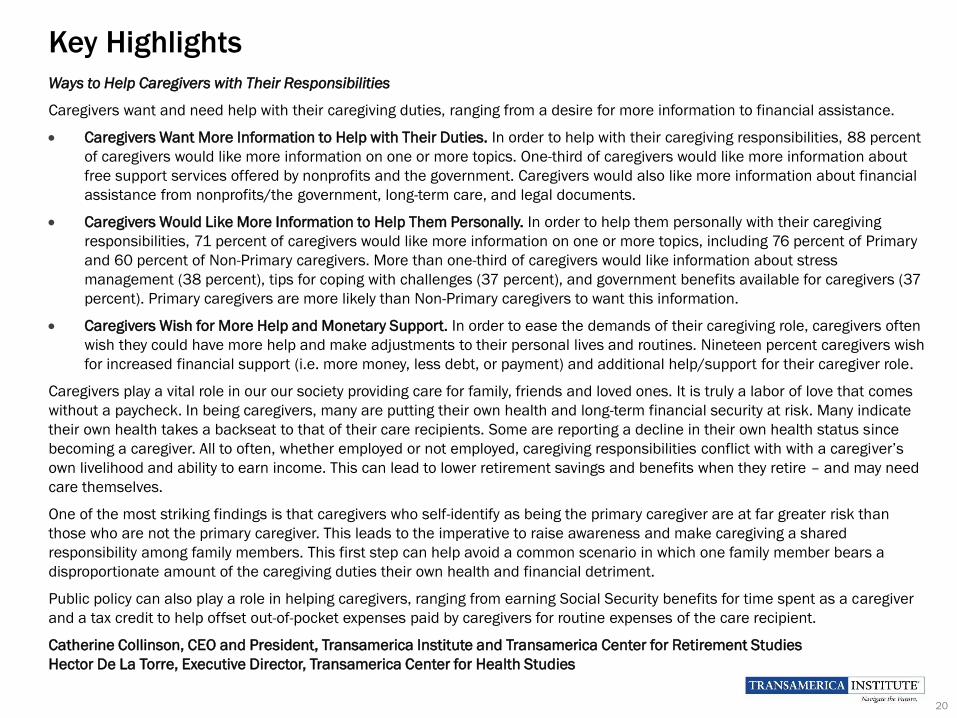
Ways to Help Caregivers with Their Responsibilities
Caregivers want and need help with their caregiving duties, ranging from a desire for more information to financial assistance.
Caregivers Want More Information to Help with Their Duties. In order to help with their caregiving responsibilities, 88 percent
of caregivers would like more information on one or more topics. One-third of caregivers would like more information about
free support services offered by nonprofits and the government. Caregivers would also like more information about financial
assistance from nonprofits/the government, long-term care, and legal documents.
Caregivers Would Like More Information to Help Them Personally. In order to help them personally with their caregiving
responsibilities, 71 percent of caregivers would like more information on one or more topics, including 76 percent of Primary
and 60 percent of Non-Primary caregivers. More than one-third of caregivers would like information about stress
management (38 percent), tips for coping with challenges (37 percent), and government benefits available for caregivers (37
percent). Primary caregivers are more likely than Non-Primary caregivers to want this information.
Caregivers Wish for More Help and Monetary Support. In order to ease the demands of their caregiving role, caregivers often
wish they could have more help and make adjustments to their personal lives and routines. Nineteen percent caregivers wish
for increased financial support (i.e. more money, less debt, or payment) and additional help/support for their caregiver role.
Caregivers play a vital role in our our society providing care for family, friends and loved ones. It is truly a labor of love that comes
without a paycheck. In being caregivers, many are putting their own health and long-term financial security at risk. Many indicate
their own health takes a backseat to that of their care recipients. Some are reporting a decline in their own health status since
becoming a caregiver. All to often, whether employed or not employed, caregiving responsibilities conflict with with a caregiver’s
own livelihood and ability to earn income. This can lead to lower retirement savings and benefits when they retire – and may need
care themselves.
One of the most striking findings is that caregivers who self-identify as being the primary caregiver are at far greater risk than
those who are not the primary caregiver. This leads to the imperative to raise awareness and make caregiving a shared
responsibility among family members. This first step can help avoid a common scenario in which one family member bears a
disproportionate amount of the caregiving duties their own health and financial detriment.
Public policy can also play a role in helping caregivers, ranging from earning Social Security benefits for time spent as a caregiver
and a tax credit to help offset out-of-pocket expenses paid by caregivers for routine expenses of the care recipient.
Catherine Collinson, CEO and President, Transamerica Institute and Transamerica Center for Retirement Studies
Hector De La Torre, Executive Director, Transamerica Center for Health Studies
20

© Transamerica Institute®, 2017
A Portrait of Today’s Caregivers: Primary vs. Non-Primary
©2017, Transamerica Institute®

22
The Many Faces of Family Caregivers:
A Close-Up Look at Caregiving and Its Implications
Executive Summary
A Portrait of Today’s Caregivers
• Key Highlights
A Portrait of Today’s Caregivers
• Insights About Care Recipients and Their Needs
• The Diverse Duties, Daily Lives, and Dedication of Caregivers
• The Employment Situation of Caregivers
• The Personal Financial Implications of Being a Caregiver
• The Health Effects of Being a Caregiver
• Ways to Help Caregivers with Their Responsibilities

Over Two-Thirds Consider Themselves to Be a Primary Caregiver
Sixty-eight percent of caregivers consider themselves to be the Primary caregiver of the care recipient.
Twenty-nine percent do not consider themselves to be such, hence, the report refers to them as Non-Primary
caregivers. The remaining 3 percent of caregivers are “not sure.”
23BASE: ALL QUALIFIED RESPONDENTSQ810. Would you consider yourself to be the Primary caregiver?
“Would you consider yourself to be the Primary caregiver?” (%)
68
29
3
Yes No Not Sure

A Portrait of Caregivers
Among all caregivers, the population is split almost evenly with slightly more women (53 percent) than men
(47 percent). Millennials (34 percent) and Baby Boomers (37 percent) are more likely to be caregivers than
Generation X (22 percent). Fifty-one percent are employed either full-time or part-time. Caregivers’
household income is $57,000 (estimated median).
24BASE: ALL QUALIFIED RESPONDENTSQ268. Gender, Q364. Marital Status, Q1265. Household Income, Q280. Generation, Q434. Education, Q1000. Employment
GENDER
GENERATION
MARITAL STATUS
56 23
13 4 4 Married
Single, Never Married
Divorced/Separated
Living with Partner
Widow/Widower
CAREGIVER PORTRAITDEMOGRAPHICS
34 22 37 7
Millennials Gen X Baby Boomers Mature
EDUCATION
19
52
23
6 High School or Less
Attended College/Degree
Attended Grad/Degree
Job Specific Training
HOUSEHOLDINCOME
18
17
30
28
7
Less than $25k
$25k to $49k
$50k to $99k
$100k or more
Decline to answer
EMPLOYMENT
39
13
8
40
Employed Full-Time
Employed Part-Time
Self-Employed
Not Employed
4753
Men
Women
Transgender*
Not Identify/Decline*
Estimated Median: $ 57,000
*Note: Sample size for Transgender and Not Identify/Decline too small to report
Median Age: 48
60 20
12 4 4 Married
Single, Never Married
Divorced/Separated
Living with Partner
Widow/Widower
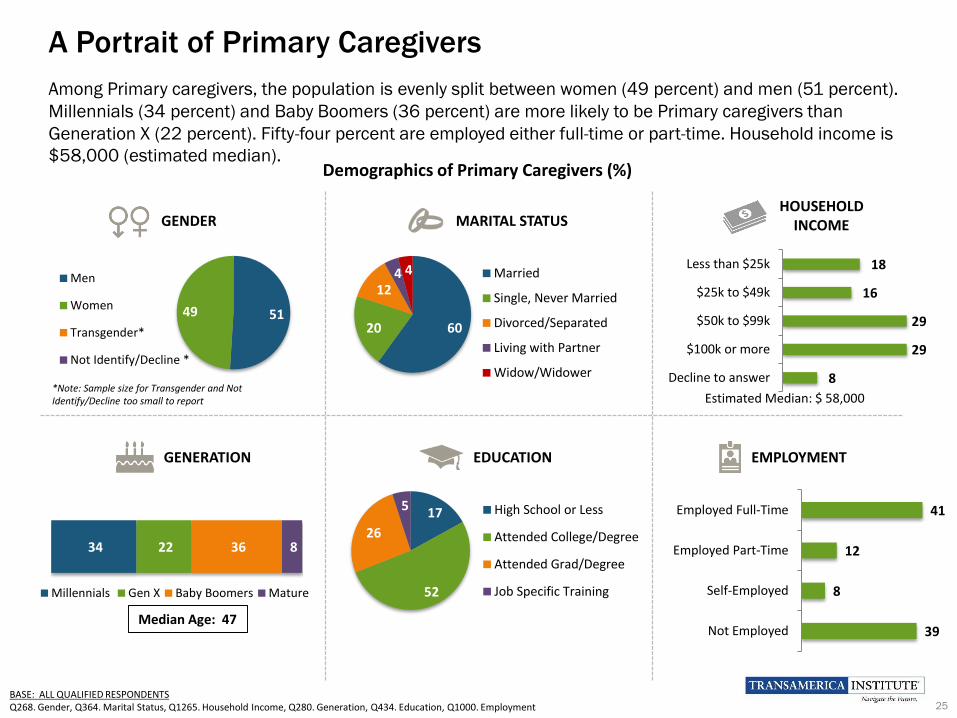
A Portrait of Primary Caregivers
Among Primary caregivers, the population is evenly split between women (49 percent) and men (51 percent).
Millennials (34 percent) and Baby Boomers (36 percent) are more likely to be Primary caregivers than
Generation X (22 percent). Fifty-four percent are employed either full-time or part-time. Household income is
$58,000 (estimated median).
25
GENDER
5149
Men
Women
Transgender*
Not Identify/Decline *
GENERATION
MARITAL STATUS
CAREGIVER PORTRAITDEMOGRAPHICS
34 22 36 8
Millennials Gen X Baby Boomers Mature
EDUCATION
17
52
26
5 High School or Less
Attended College/Degree
Attended Grad/Degree
Job Specific Training
18
16
29
29
8
Less than $25k
$25k to $49k
$50k to $99k
$100k or more
Decline to answer
EMPLOYMENT
41
12
8
39
Employed Full-Time
Employed Part-Time
Self-Employed
Not Employed
Demographics of Primary Caregivers (%)
BASE: ALL QUALIFIED RESPONDENTSQ268. Gender, Q364. Marital Status, Q1265. Household Income, Q280. Generation, Q434. Education, Q1000. Employment
HOUSEHOLDINCOME
Estimated Median: $ 58,000*Note: Sample size for Transgender and Not Identify/Decline too small to report
Median Age: 47
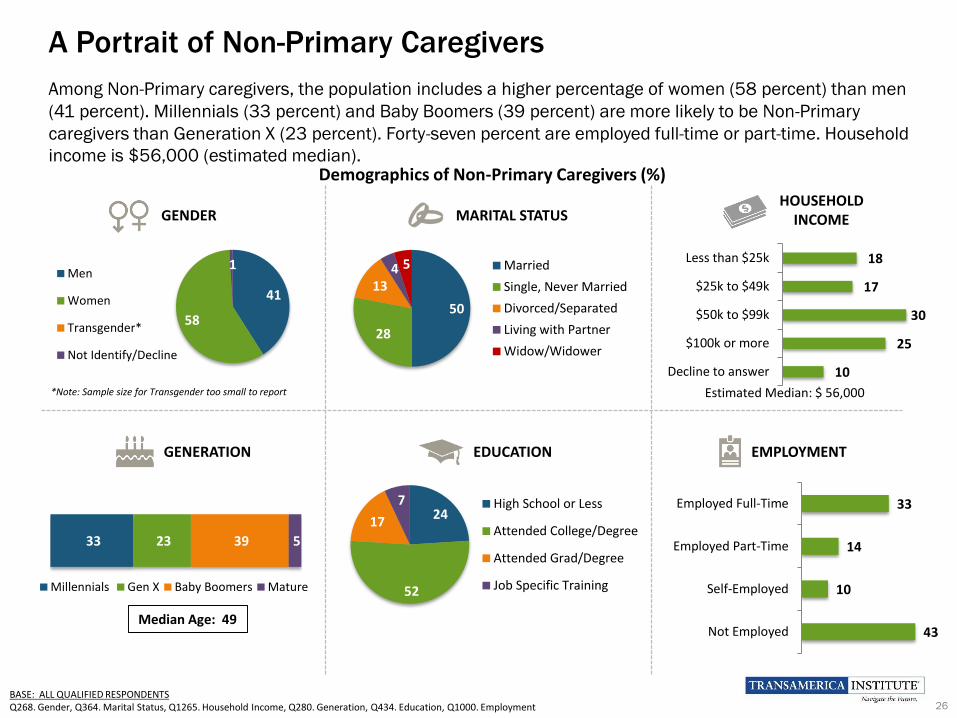
A Portrait of Non-Primary Caregivers
Among Non-Primary caregivers, the population includes a higher percentage of women (58 percent) than men
(41 percent). Millennials (33 percent) and Baby Boomers (39 percent) are more likely to be Non-Primary
caregivers than Generation X (23 percent). Forty-seven percent are employed full-time or part-time. Household
income is $56,000 (estimated median).
26
50
28
13 4 5 Married
Single, Never Married
Divorced/Separated
Living with Partner
Widow/Widower
33 23 39 5
Millennials Gen X Baby Boomers Mature
24
52
17
7 High School or Less
Attended College/Degree
Attended Grad/Degree
Job Specific Training
18
17
30
25
10
Less than $25k
$25k to $49k
$50k to $99k
$100k or more
Decline to answer
33
14
10
43
Employed Full-Time
Employed Part-Time
Self-Employed
Not Employed
Demographics of Non-Primary Caregivers (%)
41
58
1Men
Women
Transgender*
Not Identify/Decline
GENDER
GENERATION
MARITAL STATUS
EDUCATION EMPLOYMENT
BASE: ALL QUALIFIED RESPONDENTSQ268. Gender, Q364. Marital Status, Q1265. Household Income, Q280. Generation, Q434. Education, Q1000. Employment
HOUSEHOLDINCOME
Estimated Median: $ 56,000*Note: Sample size for Transgender too small to report
Median Age: 49

All Primary Non-Primary
NET – Family
Parent
Spouse/Partner
Child
Grandparent
Sibling
Parent-in-Law
Aunt/Uncle
Niece/Nephew
Great Grandparent
Cousin
Neighbor
Friend
Other
87
34
19
10
9
5
4
2
2
1
1
2
8
3
91
33
27
13
8
4
2
2
1
1
1
1
6
2
79
35
2
6
11
7
8
2
3
1
1
6
11
4
The Majority of Caregivers Are Caring for a Family Member
Eighty-seven percent of all caregivers are caring for a family member, a finding which is higher among
Primary (91 percent) compared to Non-Primary (79 percent) caregivers. Parents are the most frequently
cited recipients of care among both Primary (34 percent) and Non-Primary (35 percent) caregivers. Primary
caregivers are more likely than Non-Primary caregivers to be caring for a spouse/partner (27 percent vs. 2
percent, respectively) or a child (13 percent vs. 6 percent, respectively).
27
BASE: ALL QUALIFIED RESPONDENTSQ700. You mentioned providing care for [INSERT ANSWER FROM Q610] individual(s). Please let us know your relationship to the person, their age, and their gender.
Relationship to Care Recipient (%)
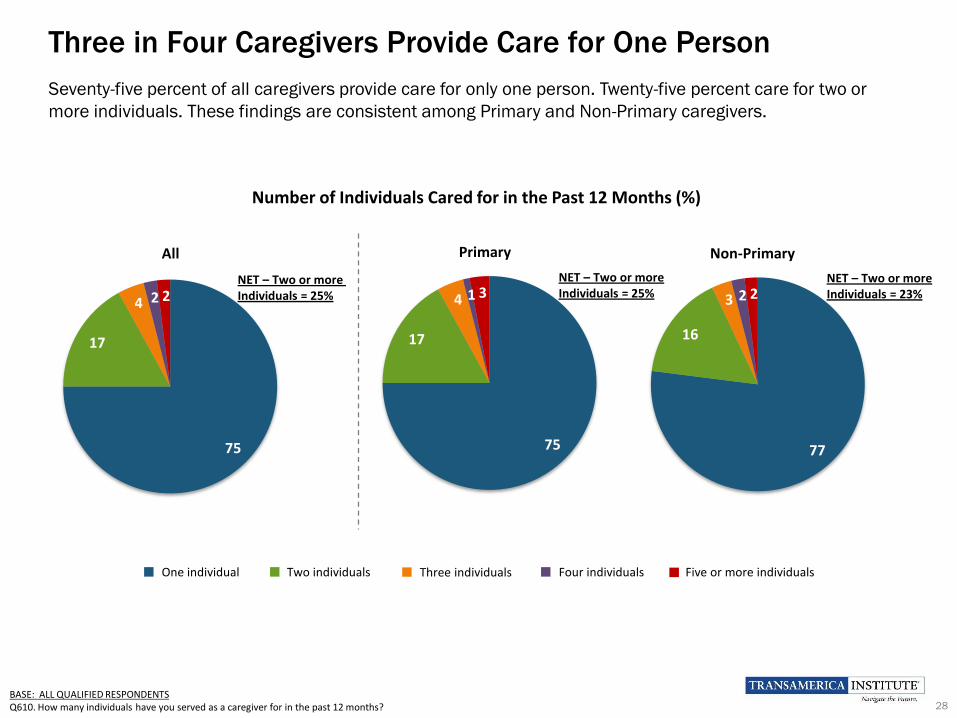
Three in Four Caregivers Provide Care for One Person
Seventy-five percent of all caregivers provide care for only one person. Twenty-five percent care for two or
more individuals. These findings are consistent among Primary and Non-Primary caregivers.
28BASE: ALL QUALIFIED RESPONDENTSQ610. How many individuals have you served as a caregiver for in the past 12 months?
Number of Individuals Cared for in the Past 12 Months (%)
One individual Two individuals Three individuals Four individuals Five or more individuals
75
17
4 2 2
All
75
17
4 1 3
Primary
77
16
3 2 2
Non-Primary
NET – Two or more Individuals = 23%
NET – Two or more Individuals = 25%
NET – Two or moreIndividuals = 25%

I want to care for my loved one
I have a close relationship to the care recipient
I have the time and capacity to do so
I live in close proximity to the care recipient
Nobody else was available to do so
My job is flexible
Nobody else was willing to do so
A court ordered my duties
Other
63
58
43
36
23
20
17
3
4
69
58
44
36
25
21
20
3
2
Most Caregivers Do So Out of Love
People become caregivers for a variety of reasons, including: a desire to care for their loved one (63 percent),
having a close relationship to the care recipient (58 percent), having the time and capacity to do so (43
percent), and living in close proximity to the care recipient (36 percent). These reasons are commonly shared
among Primary and Non-Primary caregivers with a higher percentage of Primary caregivers citing these
responses. However, the survey found two major differences between Primary and Non-Primary caregivers.
Primary caregivers are more likely than Non-Primary caregivers to indicate that nobody else was available (25
percent vs. 16 percent, respectively) or that nobody else was willing to do so (20 percent vs. 9 percent
respectively).
29BASE: ALL QUALIFIED RESPONDENTSQ815. How did you come to be a caregiver? Please select all that apply.
Reasons for Becoming a Caregiver (%)
53
56
42
35
16
18
9
1
7
Primary Non-PrimaryAll

Four Out of Five Caregivers Came to it Voluntarily
Eighty-four percent of all caregivers became a caregiver voluntarily, a finding which is slightly higher among
Primary (85 percent) versus Non-Primary (82 percent) caregivers. Eleven percent of all caregivers say they
did not become a caregiver voluntarily and the other 5 percent are “not sure.”
30BASE: ALL QUALIFIED RESPONDENTSQ820. Do you feel that you came to be a caregiver voluntarily?
85
10
5
Primary
84
11
5
All Caregivers
82
13
5
Non-Primary
“Do you feel that you became a caregiver voluntarily?” (%)
Yes No Not sure

Most Caregivers Have Provided Care for Years
Among all caregivers, the providing of care has been two years (median). Primary caregivers have been
providing care for three years (median) while Non-Primary caregivers have been providing care for two years
(median). Seventy-four percent of all caregivers have been providing care for one or more years. Primary
caregivers (80 percent) are more likely to have been providing care for one or more years compared to Non-
Primary caregivers (63 percent). Twenty-seven percent of all caregivers have been providing care for five or
more years, a finding which is higher among Primary (32 percent) than Non-Primary (17 percent) caregivers.
31
6
20
47
16
11
Years Providing Care
10 or more years
5 to 9 years
1 to 4 years
Less than 1 year
Not Sure
BASE: ALL QUALIFIED RESPONDENTSQ800. How long have you been providing care for your care recipient?
MEDIAN = 2; MEAN = 4
Duration of Time as a Caregiver (%)
9
28
46
10
7
Years Providing Care
4
16
48
19
13
Years Providing CareMEDIAN = 3; MEAN = 5 MEDIAN = 2; MEAN = 3
Primary Non-PrimaryAll
MEDIAN (number of other people involved in care) 3 2 4
MEAN (number of other people involved in care) 2 1 3
All Primary Non-Primary
NET – People involved
Family members
Paid, professional caregivers
Friends
Volunteers
Other
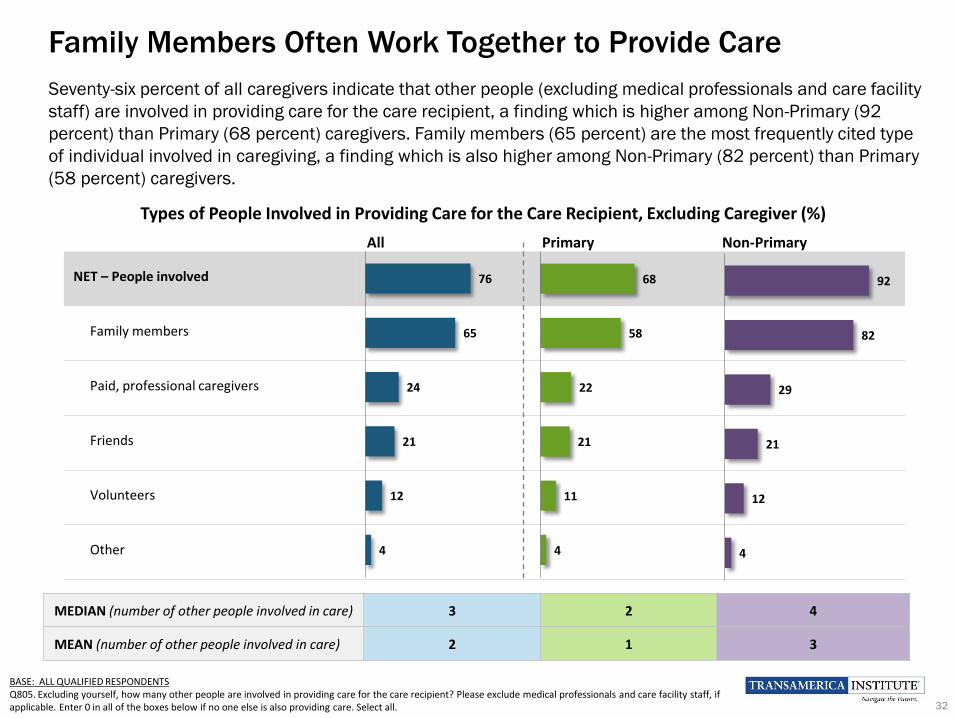
Family Members Often Work Together to Provide Care
Seventy-six percent of all caregivers indicate that other people (excluding medical professionals and care facility
staff) are involved in providing care for the care recipient, a finding which is higher among Non-Primary (92
percent) than Primary (68 percent) caregivers. Family members (65 percent) are the most frequently cited type
of individual involved in caregiving, a finding which is also higher among Non-Primary (82 percent) than Primary
(58 percent) caregivers.
32
BASE: ALL QUALIFIED RESPONDENTSQ805. Excluding yourself, how many other people are involved in providing care for the care recipient? Please exclude medical professionals and care facility staff, if applicable. Enter 0 in all of the boxes below if no one else is also providing care. Select all.
Types of People Involved in Providing Care for the Care Recipient, Excluding Caregiver (%)
76
65
24
21
12
4
68
58
22
21
11
4
92
82
29
21
12
4

33
14
53
Recipient lives in my home Live in recipient's home Recipient lives at another location
43
16
41
12
7
81
All Primary Non-PrimaryNET – Lives withCare Recipient= 47%
NET – Lives withCare Recipient= 59%
NET – Lives withCare Recipient= 19%
Almost Half of Caregivers Live with Their Care Recipient
Almost half of caregivers (47 percent) live with their care recipient, a finding which is significantly higher among
Primary caregivers (59 percent) than Non-Primary caregivers (19 percent). Primary caregivers (43 percent) are
more than three times more likely than Non-Primary caregivers (12 percent) to have the care recipient living in
their home. Similarly, Primary caregivers (16 percent) are also more likely than Non-Primary caregivers (7
percent) to live in the care recipient’s home.
33BASE: ALL QUALIFIED RESPONDENTSQ1230. How far does the care recipient live from where you live? Your best estimate is fine
Where Care Recipients Live (%)
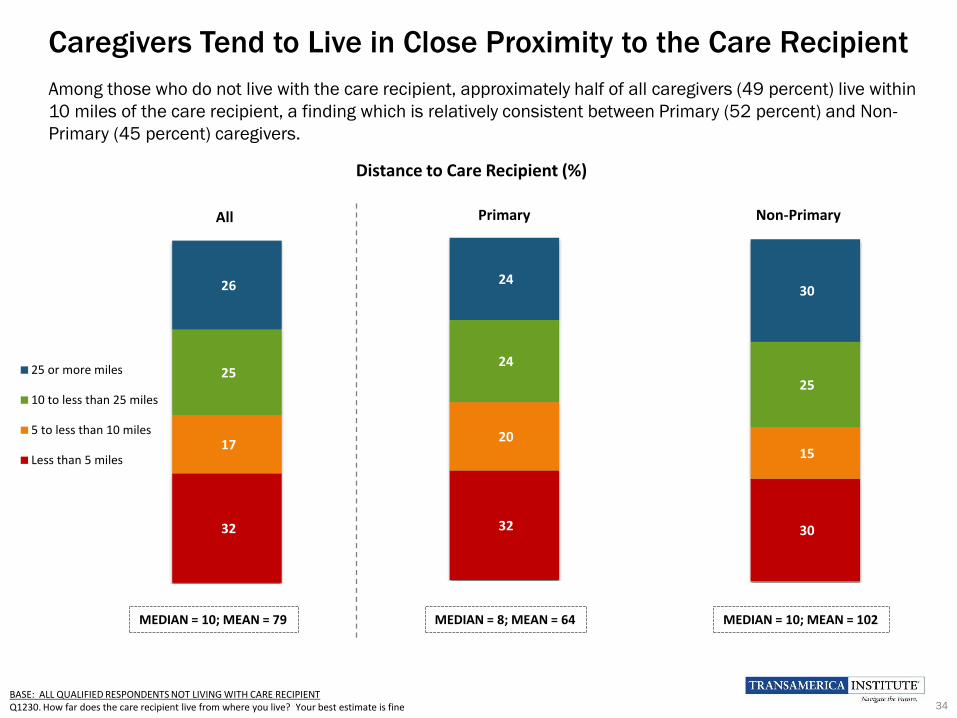
Caregivers Tend to Live in Close Proximity to the Care Recipient
Among those who do not live with the care recipient, approximately half of all caregivers (49 percent) live within
10 miles of the care recipient, a finding which is relatively consistent between Primary (52 percent) and Non-
Primary (45 percent) caregivers.
34
32
17
25
26
25 or more miles
10 to less than 25 miles
5 to less than 10 miles
Less than 5 miles
BASE: ALL QUALIFIED RESPONDENTS NOT LIVING WITH CARE RECIPIENTQ1230. How far does the care recipient live from where you live? Your best estimate is fine
MEDIAN = 10; MEAN = 79
Distance to Care Recipient (%)
MEDIAN = 8; MEAN = 64 MEDIAN = 10; MEAN = 102
Primary Non-PrimaryAll
32
20
24
24
30
15
25
30

35
The Many Faces of Family Caregivers:
A Close-Up Look at Caregiving and Its Implications
Executive Summary
A Portrait of Today’s Caregivers
• Key Highlights
• A Portrait of Today’s Caregivers
Insights About Care Recipients and Their Needs
• The Diverse Duties, Daily Lives, and Dedication of Caregivers
• The Employment Situation of Caregivers
• The Personal Financial Implications of Being a Caregiver
• The Health Effects of Being a Caregiver
• Ways to Help Caregivers with Their Responsibilities

Care Recipients Have a Range of Conditions
Caregivers provide care for a range of different ailments and health conditions. The three most common
conditions are arthritis (26 percent), dementia/Alzheimer’s disease (Net, 25 percent), and high blood
pressure (22 percent). Refer to the Appendix for the full list of conditions.
36BASE: ALL QUALIFIED RESPONDENTSQ725. Which of the following condition(s) apply to the care recipient? Please select all that apply.
Top 10 Most Frequently Cited Conditions of Care Recipient (%)
All Primary Non-Primary
Arthritis
NET – Dementia/Alzheimer's
Dementia/Memory Loss
Alzheimer's
High blood pressure
Diabetes
Depression
Anxiety
Heart disease
Cancer
Immobility
Incontinence
26
25
16
12
22
18
16
14
14
12
11
11
28
26
16
13
24
20
17
15
14
11
10
10
20
25
17
10
19
13
12
12
14
14
12
12
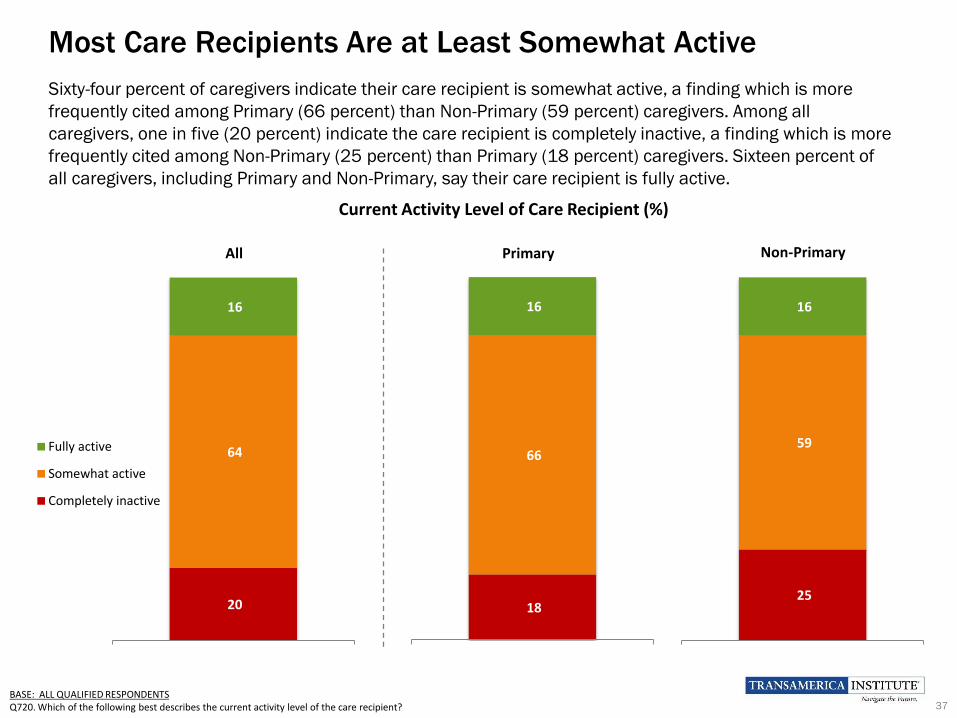
Most Care Recipients Are at Least Somewhat Active
Sixty-four percent of caregivers indicate their care recipient is somewhat active, a finding which is more
frequently cited among Primary (66 percent) than Non-Primary (59 percent) caregivers. Among all
caregivers, one in five (20 percent) indicate the care recipient is completely inactive, a finding which is more
frequently cited among Non-Primary (25 percent) than Primary (18 percent) caregivers. Sixteen percent of
all caregivers, including Primary and Non-Primary, say their care recipient is fully active.
37BASE: ALL QUALIFIED RESPONDENTSQ720. Which of the following best describes the current activity level of the care recipient?
Primary Non-PrimaryAll
Current Activity Level of Care Recipient (%)
20
64
16
Fully active
Somewhat active
Completely inactive
18
66
16
25
59
16

Approximately Half of Care Recipients Have a Permanent Condition
Fifty-four percent of all caregivers indicate that their care recipient has a permanent health condition while
21 percent indicate that their care recipient has a temporary primary condition and 16 percent have a
reoccurring condition. These findings are consistent between Primary and Non-Primary caregivers.
38BASE: ALL QUALIFIED RESPONDENTSQ715. Focusing on the individual you provide the most care for, is the primary condition of the care recipient permanent, episodic or temporary?
Condition of the Care Recipient (%)
2 7
21
16
54
Permanent
Reoccuring
Temporary
Unclear
Unknown
1 6
21
17
55
2 8
21
14
55
Primary Non-PrimaryAll
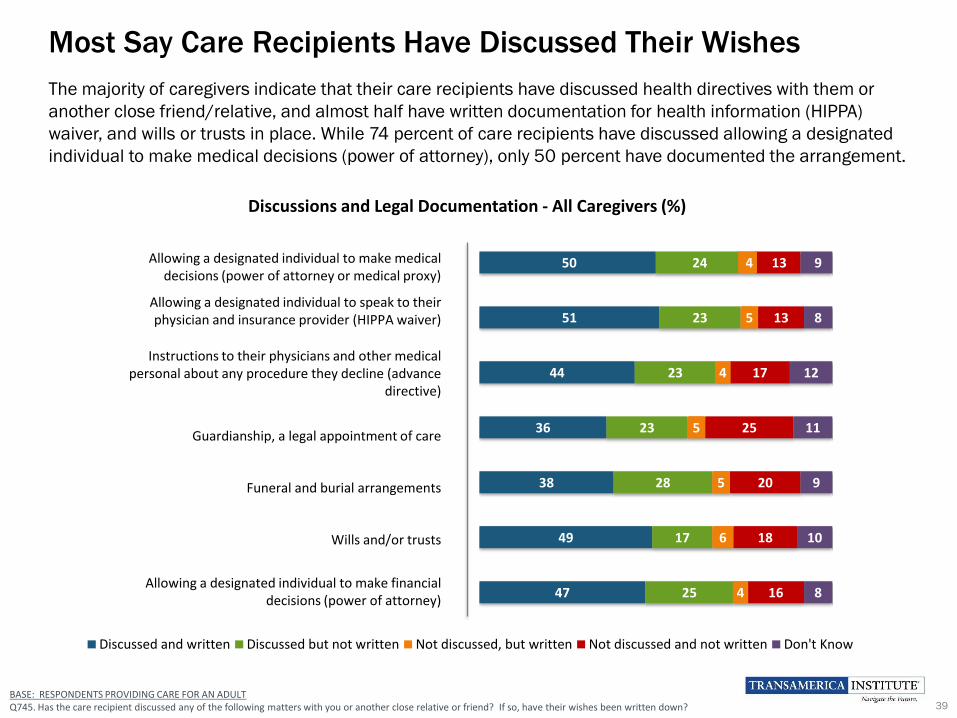
Most Say Care Recipients Have Discussed Their Wishes
The majority of caregivers indicate that their care recipients have discussed health directives with them or
another close friend/relative, and almost half have written documentation for health information (HIPPA)
waiver, and wills or trusts in place. While 74 percent of care recipients have discussed allowing a designated
individual to make medical decisions (power of attorney), only 50 percent have documented the arrangement.
39
Discussions and Legal Documentation - All Caregivers (%)
50
51
44
36
38
49
47
24
23
23
23
28
17
25
4
5
4
5
5
6
4
13
13
17
25
20
18
16
9
8
12
11
9
10
8
Discussed and written Discussed but not written Not discussed, but written Not discussed and not written Don't Know
Allowing a designated individual to make medical decisions (power of attorney or medical proxy)
Allowing a designated individual to speak to their physician and insurance provider (HIPPA waiver)
Instructions to their physicians and other medical personal about any procedure they decline (advance
directive)
Guardianship, a legal appointment of care
Funeral and burial arrangements
Wills and/or trusts
Allowing a designated individual to make financialdecisions (power of attorney)
BASE: RESPONDENTS PROVIDING CARE FOR AN ADULTQ745. Has the care recipient discussed any of the following matters with you or another close relative or friend? If so, have their wishes been written down?

Primary Caregivers’ Discussions with Care Recipients
Most Primary caregivers indicate their care recipients have discussed various matters related to their care
with them or another close relative or friend, including medical power of attorney (78 percent), health
information (HIPPA) waivers (77 percent), advance directives (72 percent), guardianship (63 percent),
funeral and burial arrangements (71 percent), and wills or trusts (72 percent).
40
52
53
46
37
40
52
48
26
24
26
26
31
20
27
4
4
4
5
5
5
4
14
13
18
26
20
19
16
4
6
6
6
4
4
5
Discussed and written Discussed but not written Not discussed, but written Not discussed and not written Don't Know
Allowing a designated individual to make medical decisions (power of attorney or medical proxy)
Allowing a designated individual to speak to their physician and insurance provider (HIPPA waiver)
Instructions to their physicians and other medical personal about any procedure they decline (advance
directive)
Guardianship, a legal appointment of care
Funeral and burial arrangements
Wills and/or trusts
Allowing a designated individual to make financialdecisions (power of attorney)
BASE: RESPONDENTS PROVIDING CARE FOR AN ADULTQ745. Has the care recipient discussed any of the following matters with you or another close relative or friend? If so, have their wishes been written down?
Discussions and Legal Documentation – Primary Caregivers (%)
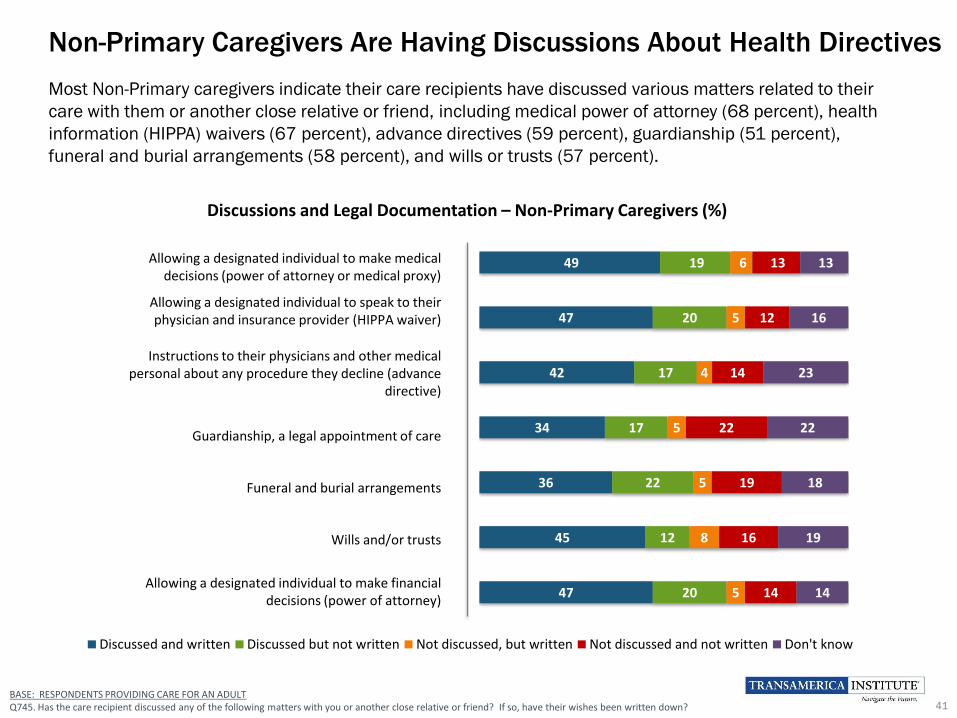
Non-Primary Caregivers Are Having Discussions About Health Directives
Most Non-Primary caregivers indicate their care recipients have discussed various matters related to their
care with them or another close relative or friend, including medical power of attorney (68 percent), health
information (HIPPA) waivers (67 percent), advance directives (59 percent), guardianship (51 percent),
funeral and burial arrangements (58 percent), and wills or trusts (57 percent).
41
49
47
42
34
36
45
47
19
20
17
17
22
12
20
6
5
4
5
5
8
5
13
12
14
22
19
16
14
13
16
23
22
18
19
14
Discussed and written Discussed but not written Not discussed, but written Not discussed and not written Don't know
Allowing a designated individual to make medical decisions (power of attorney or medical proxy)
Allowing a designated individual to speak to their physician and insurance provider (HIPPA waiver)
Instructions to their physicians and other medical personal about any procedure they decline (advance
directive)
Guardianship, a legal appointment of care
Funeral and burial arrangements
Wills and/or trusts
Allowing a designated individual to make financialdecisions (power of attorney)
BASE: RESPONDENTS PROVIDING CARE FOR AN ADULTQ745. Has the care recipient discussed any of the following matters with you or another close relative or friend? If so, have their wishes been written down?
Discussions and Legal Documentation – Non-Primary Caregivers (%)

42
The Many Faces of Family Caregivers:
A Close-Up Look at Caregiving and Its Implications
Executive Summary
A Portrait of Today’s Caregivers
• Key Highlights
• A Portrait of Today’s Caregivers
• Insights About Care Recipients and Their Needs
The Diverse Duties, Daily Lives, and Dedication of Caregivers
• The Employment Situation of Caregivers
• The Personal Financial Implications of Being a Caregiver
• The Health Effects of Being a Caregiver
• Ways to Help Caregivers with Their Responsibilities
Caregiving Is a Full-Time Job for Many
Caregivers spend 50 hours (median) per month caring for the care recipient, a finding which varies
dramatically between Primary (80 hours median) and Non-Primary caregivers (22 hours median). Thirty-six
percent of all caregivers spend 100 or more hours per month caregiving, including more Primary (45
percent) than Non-Primary (15 percent) caregivers.
43BASE: ALL QUALIFIED RESPONDENTSQ832. In total, approximately how many hours per month do you spend caring for the care recipient?
14
8
15
18
17
28
42
14
14
15
6
9
MEDIAN = 50; MEAN = 125
22
10
15
17
14
22
200 or more hours
100 to less than 200 hours
50 to less than 100 hours
30 to less than 50 hours
20 to less than 30 hours
Less than 20 hours
MEDIAN = 80; MEAN = 154 MEDIAN = 22; MEAN = 61
All Primary Non-Primary
Total Hours Spent Caregiving Each Month (%)
Note: The median is the midpoint of the range of each response category. The mean is the average of all responses.

Caregiving Is a Multi-Dimensional Job
Caregiving encompasses a broad
range of duties, such as household,
social/communication, health,
personal care, medical-related and
paying bills/managing finances.
Primary caregivers are more likely to
engage in these activities than Non-
Primary caregivers.
Of particular note, 78 percent of
Primary caregivers perform health-
related duties for the care recipient,
compared to only 47 percent of Non-
Primary caregivers.
Similarly, Primary caregivers (59
percent) are twice as likely to
perform medical-related duties as
Non-Primary caregivers (28
percent).
More than half of Primary caregivers
(53 percent) pay bills/manage
finances for the care recipient
compared to only 23 percent of Non-
Primary caregivers.
44BASE: ALL QUALIFIED RESPONDENTSQ825. Which of the following are duties you perform for the care recipient? Select all that apply
Types of Caregiving Duties Performed All Primary Non-Primary
NET – Household 89% 92% 83%
Running errands 68% 71% 62%
Housework 60% 66% 47%
Meal preparation 58% 65% 46%
Home repairs 30% 35% 20%
Home modifications 19% 24% 10%
NET – Social/Communication 72% 74% 69%
Companionship 61% 62% 61%
Basic communications 31% 32% 27%
Language translation 7% 8% 5%
NET – Health-Related 69% 78% 47%
Accompanying to medical appointments 61% 69% 42%
Healthcare coordination 44% 55% 19%
Health insurance coordination 30% 38% 11%
NET – Personal Care 62% 67% 54%
Mobility 39% 41% 34%
Personal care 35% 39% 28%
Feeding 27% 29% 24%
Incontinence care 15% 17% 11%
NET – Medical-Related 49% 59% 28%
Medication management 45% 54% 26%
Medical treatment administration 16% 20% 7%
Paying bills/Managing finances 43% 53% 23%
Other 4% 3% 7%

Caregivers Devote Significant Time to Caregiving Duties
Caregivers spend a significant
amount of time each month on a
wide range of caregiving duties,
with Primary caregivers
dedicating more time to these
duties than Non-Primary
caregivers.
Among all caregivers, providing
companionship requires the most
time (33 hours median). Primary
caregivers (50 hours median)
spend more than three times the
amount of time on this role than
Non-Primary caregivers (16 hours
median).
Meal preparation is the second-
most time consuming activity
among all caregivers (20 hours
median), a finding which is higher
among Primary (21 hours
median) compared to Non-
Primary (9 hours median)
caregivers.
45BASE: ALL QUALIFIED RESPONDENTSQ830. On average, approximately how many hours per month do you spend performing the following duties for the care recipient?
Time Spent On Caregiving DutiesEach Month (hours per month)
All Primary Non-Primary
Median Mean Median Mean Median Mean
Household
Running errands 8 18 10 19 4 14
Housework (e.g., cleaning, laundry) 10 28 12 31 6 17
Meal preparation 20 32 21 35 9 18
Home repairs 3 9 3 10 2 6
Home modifications 2 8 2 8 3 9
Social/Communication
Companionship 33 92 50 114 16 42
Basic communications 10 46 12 52 6 23
Language translation 5 15 5 14 4 17
Health-Related
Accompanying to medical appointments 4 11 5 11 4 7
Healthcare coordination 3 9 3 10 3 4
Health insurance coordination 2 9 2 9 2 3
Personal Care
Mobility 10 23 10 26 6 13
Personal care 12 26 15 29 8 14
Feeding 12 34 15 38 10 23
Incontinence care 6 22 8 24 4 9
Medical-Related
Medication management 5 16 5 17 4 10
Medical treatment administration 5 18 5 18 3 11
Paying bills/Managing finances 3 9 4 10 2 4
Other 5 63 8 50 5 83Note: The median is the midpoint of the range of each response category. The mean is the average of all responses.

Caregivers Rely on a Variety of Sources of Information
Caregivers most frequently rely on friends and family (45 percent) or medical professionals (45 percent) as
sources of information to assist in their caregiving duties. Primary caregivers (49 percent) are more likely
than Non-Primary caregivers (35 percent) to rely on medical professionals, while Non-Primary caregivers (55
percent) are more likely than Primary caregivers (40 percent) to rely on family and friends. Primary
caregivers are generally more likely than Non-Primary caregivers to rely on electronic sources of caregiving
information (i.e. medical or caregiving websites), books or printed materials, and caregiving guides.
46BASE: ALL QUALIFIED RESPONDENTSQ840. Which of the following do you rely on as sources of information to assist in your caregiving duties? Please select all that apply.
All Primary Non-Primary
Family and friends
Medical professionals
Medical websites
Books or other printed materials
Websites that focus on caregiving
Caregiver guide(s)
Medicare website
Medicaid website
Medicare service representative
Other
None
45
45
23
16
16
14
11
9
9
7
18
40
49
27
17
17
15
13
11
10
5
18
55
35
15
12
12
9
8
5
6
9
19
Sources of Information to Assist in Caregiving Duties (%)
About Half Learn Medical/Nursing Tasks from Professionals
Among caregivers who perform medical/nursing-related tasks, 54 percent say they learned these tasks from
hospital or doctor’s office personnel, including 56 percent of Primary caregivers and 45 percent of Non-
Primary caregivers. Family and friends (36 percent) are the second most frequently cited source of training
among caregivers, including 35 percent of Primary caregivers and 42 percent of Non-Primary caregivers.
47
BASE: RESPONDENTS ADMINISTERING MEDICATIONS AND MEDICAL TREATMENTSQ835. You mentioned you perform medication management or medical treatment administration for the care recipient. Where did you learn how to perform medical/nursing tasks related to being a caregiver? Select all that apply.
All Primary Non-Primary
Hospital or doctor’s office personnel
Family and friends
Books or printed materials
Caregiver guide(s)
Formal education and training from an academic institution, college, or trade school
Online videos (e.g., tutorials, guides, etc.)
Online articles or blogs (excluding videos)
Online discussion boards
A nonprofit organization that offers training (e.g., Alzheimer’s Association)
I did not use any resources to learn how to perform medical/nursing tasks
54
36
22
21
16
13
13
8
8
18
56
35
22
22
15
14
13
9
8
18
45
42
22
19
19
11
10
6
9
13
Sources for Learning Medical/Nursing Tasks Related to Being a Caregiver (%)

Caregivers’ Sentiments About Their Caregiving Duties
The vast majority of all caregivers cite positive aspects of caregiving, including that they like helping and enjoy
spending time with their care recipient (both 91 percent). However, more than half of all caregivers agree that
their caregiving duties leave them feeling emotionally or physically exhausted (both 55 percent). Primary
caregivers (61 percent) are far more likely than Non-Primary caregivers (41 percent) to indicate their own health
is taking a backseat to the health of their care recipients.
48BASE: ALL QUALIFIED RESPONDENTSQ855. How much do you agree or disagree with the following statements about performing your duties as a caregiver?
Caregivers’ Sentiments About Their Caregiving DutiesAll Primary Non-Primary
Strongly/Somewhat Agree (NET)
Positive
It’s important for me to provide a good quality of life for the care recipient 94% 96% 93%
I like helping the care recipient 91% 92% 89%
I enjoy spending time with the care recipient 91% 91% 89%
Being a caregiver gives me a strong sense of purpose 83% 85% 78%
Being a caregiver has led me to take better care of my own health 70% 72% 65%
Being a caregiver has inspired me to document my own health and legal wishes 66% 68% 63%
Negative
My own health takes a backseat to the health of my care recipient 55% 61% 41%
My caregiving duties leave me feeling physically exhausted 55% 59% 44%
My caregiving duties leave me feeling emotionally exhausted 55% 58% 46%
I need more help with my caregiving duties 47% 52% 38%
With all of my caregiving duties, I barely have time for anything else 45% 52% 32%
My caregiving duties leave me feeling completely overwhelmed 44% 50% 30%
49
The Many Faces of Family Caregivers:
A Close-Up Look at Caregiving and Its Implications
Executive Summary
A Portrait of Today’s Caregivers
• Key Highlights
• A Portrait of Today’s Caregivers
• Insights About Care Recipients and Their Needs
• The Diverse Duties, Daily Lives, and Dedication of Caregivers
The Employment Situation of Caregivers
• The Personal Financial Implications of Being a Caregiver
• The Health Effects of Being a Caregiver
• Ways to Help Caregivers with Their Responsibilities
All Primary Non-Primary
NET – Employed
Employed full-time
Employed part-time
NET – Self-employed
Self-employed full-time
Self-employed part-time
NET – Not employed
Not employed, but looking for work
Not employed and not looking for work
Not employed, unable to work due to my own disability or illness
On leave of absence from my employer
Retired
Student
Stay-at-home spouse or partner
None of the above
47
33
14
10
6
4
43
5
1
6
0
18
6
7
0
More Than Half of Caregivers Are Employed
The majority of all caregivers are currently employed full- or part-time (52 percent), including 53 percent of
Primary caregivers and 47 percent of Non-Primary caregivers. Of the 40 percent of caregivers who are not
currently employed, most (65 percent) were never employed during their time as a caregiver.
50
BASE: ALL QUALIFIED RESPONDENTSQ1000. (Q410) Which one of the following best describes your employment status? BASE: NOT CURRENTLY EMPLOYED Q1015. Have you ever been employed during your time as a caregiver? Please select all the types of employment that apply.
Current Employment Status (%)
Employment Status During Timeas a Caregiver (%)
Among those not currently employed
52
39
13
8
5
3
40
4
2
5
0
19
3
7
0
53
41
12
8
5
3
39
3
3
4
0
19
2
6
2
All PrimaryNon-
Primary
NET –Employed
30 28 36
Full-timeemployed
18 18 16
Part-timeemployed
15 12 23
Self-employed
7 9 5
Never employed
65 65 61
Note: Multiple responses accepted; sums do not total 100%.
Caregiving Duties Negatively Impact Employment
As a result of their caregiving duties,
76 percent of employed caregivers
have made some type of adjustment
to their employment, ranging from
using vacation and sick days to
quitting their jobs. Primary (82
percent) are more likely than Non-
Primary caregivers (62 percent) to
have done so.
Twenty-six percent of employed
caregivers have reduced their hours
or job responsibilities, including 30
percent of Primary and 16 percent of
Non-Primary caregivers.
Eighteen percent of employed
caregivers have taken a leave of
absence. Primary (22 percent) are
more likely to have done so than Non-
Primary caregivers (9 percent).
Fourteen percent of employed
caregivers have retired early or quit
their job. Primary caregivers (16
percent) are somewhat more likely to
have done so than Non-Primary (12
percent) caregivers.
51BASE: ALL EMPLOYED OR HAVE BEEN EMPLOYED DURING THEIR TIME AS A CAREGIVERQ1025. Which of the following have you done as a result of becoming a caregiver? Select all that apply.
All Primary Non-Primary
NET – Reduced hours or job responsibilities
Reduced my hours
Reduced job responsibilities
Switched to a less demanding job
NET – Taken leave
Taken an unpaid leave of absence from my employer covered by the Family and Medical Leave Act
Taken a paid leave of absence from my employer
Taken an unpaid leave of absence from my employer not covered by the Family and Medical Leave Act
NET – Retired early/quit job
Retired early
Quit a job
Used vacation, sick days, and/or personal days off to be a caregiver
Missed days of work
Began working an alternative schedule
Began to work remotely
Took on additional hours to pay for cost of caregiving
None
26
18
10
8
18
10
6
6
14
8
7
30
26
15
9
8
24
30
20
12
8
22
12
8
7
16
9
8
30
29
17
11
9
18
16
12
5
6
9
4
3
4
12
7
6
29
15
9
6
4
38
Employment-Related Adjustments Made as a Result of Becoming a Caregiver (%)
NOTE: Thirteen most commonly selected sources shown.

All Primary Non-Primary
NET – Told someone at work
My immediate supervisor
My direct reports
Human resources
Other management
Other coworkers
I have not told anyone at work that I am a caregiver
Most Have Told Someone at Work That They Are a Caregiver
Approximately three in four employed caregivers (77 percent) have told someone at work that they are a
caregiver. Primary (82 percent) are more likely than Non-Primary caregivers (64 percent) to have told
someone. More than half of all employed caregivers (57 percent) have told their immediate supervisor about
their caregiving duties, including 63 percent of Primary and 42 percent of Non-Primary caregivers.
52BASE: EMPLOYED FULL-TIME OR PART-TIMEQ1035. Which of the following people at work have you told that you are a caregiver? Please select all that apply.
82
63
24
24
23
29
18
64
42
12
13
12
33
35
“Which of the following people at work have you told that you are a caregiver?” (%)
77
57
21
21
19
31
23
NOTE: Self-employed and not employed were excluded from this question.

23
7
6
30
34
Non-Primary
8
10
8
30
44
Primary
13
9
7
30
41
All
Very Supportive
Somewhat Supportive
Not Too Supportive
Not At All Supportive
Don't Know
Most Caregivers Feel Their Employers Are Supportive
A substantial majority (71 percent) of all employed caregivers feel their employer is at least somewhat
supportive of their caregiving responsibilities. Primary caregivers (44 percent) are more likely than Non-
Primary caregivers (34 percent) to indicate that they feel very supported by their employer.
53BASE: CURRENTLY EMPLOYED FULL-TIME OR PART-TIMEQ1045. How supportive is your employer of your caregiving responsibilities?
Employer Support of Caregiver Responsibilities (%)
NET – Very/ Somewhat Supportive:
71%
NET – Very/ Somewhat Supportive:
74%
NET – Very/ Somewhat Supportive:
64%
NOTE: Self-employed and not employed were excluded from this question.
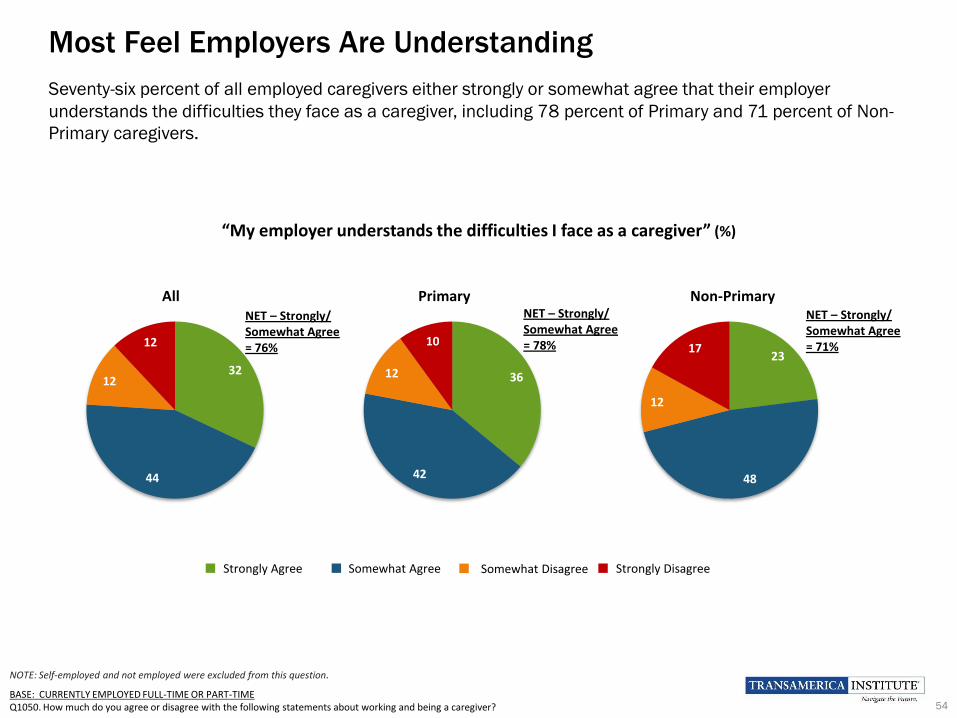
Most Feel Employers Are Understanding
Seventy-six percent of all employed caregivers either strongly or somewhat agree that their employer
understands the difficulties they face as a caregiver, including 78 percent of Primary and 71 percent of Non-
Primary caregivers.
54BASE: CURRENTLY EMPLOYED FULL-TIME OR PART-TIMEQ1050. How much do you agree or disagree with the following statements about working and being a caregiver?
“My employer understands the difficulties I face as a caregiver” (%)
32
44
12
12
All
36
42
12
10
Primary
23
48
12
17
Non-Primary
Strongly Agree Somewhat Agree Somewhat Disagree Strongly Disagree
NET – Strongly/Somewhat Agree= 76%
NET – Strongly/Somewhat Agree= 78%
NET – Strongly/Somewhat Agree= 71%
NOTE: Self-employed and not employed were excluded from this question.
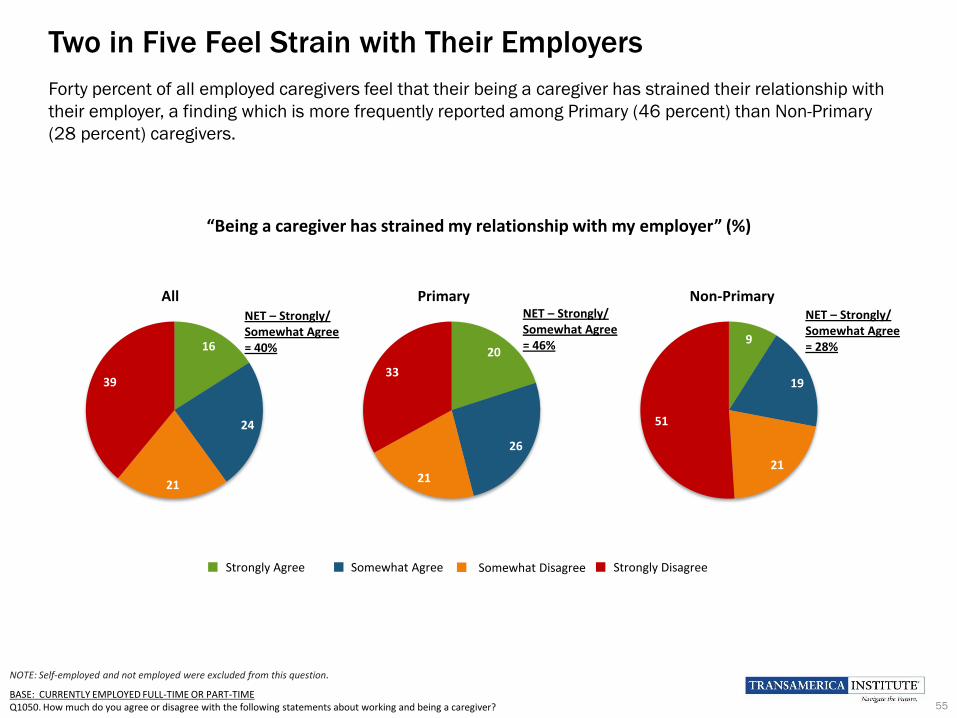
Two in Five Feel Strain with Their Employers
Forty percent of all employed caregivers feel that their being a caregiver has strained their relationship with
their employer, a finding which is more frequently reported among Primary (46 percent) than Non-Primary
(28 percent) caregivers.
55
“Being a caregiver has strained my relationship with my employer” (%)
16
24
21
39
All
20
26
21
33
Primary
9
19
21
51
Non-Primary
Strongly Agree Somewhat Agree Somewhat Disagree Strongly Disagree
NET – Strongly/Somewhat Agree= 40%
NET – Strongly/Somewhat Agree= 46%
NET – Strongly/Somewhat Agree= 28%
BASE: CURRENTLY EMPLOYED FULL-TIME OR PART-TIMEQ1050. How much do you agree or disagree with the following statements about working and being a caregiver?
NOTE: Self-employed and not employed were excluded from this question.
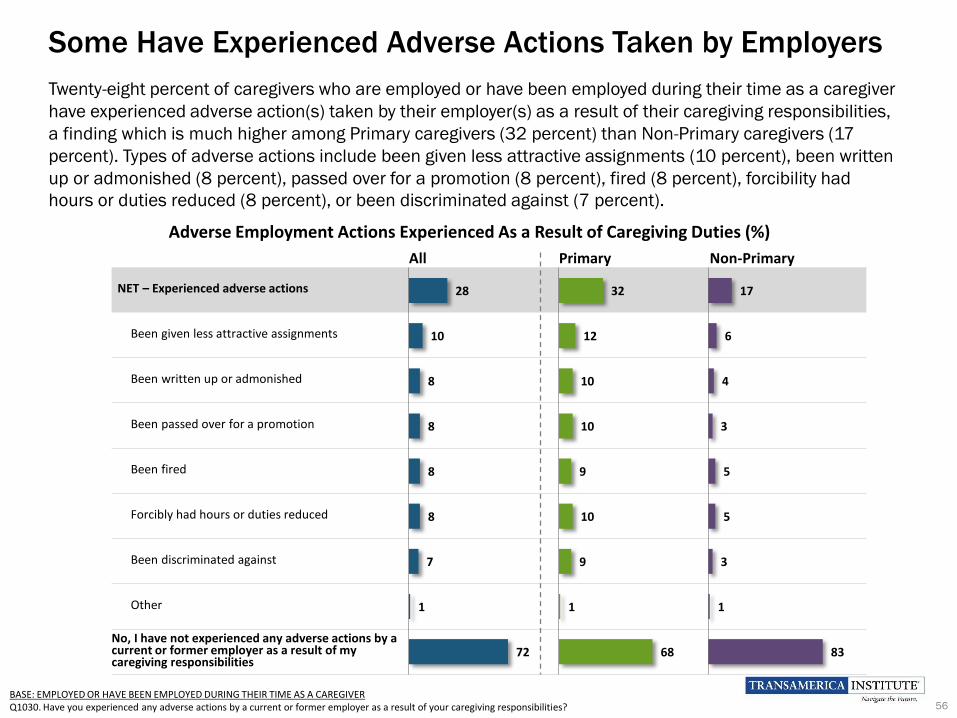
Some Have Experienced Adverse Actions Taken by Employers
Twenty-eight percent of caregivers who are employed or have been employed during their time as a caregiver
have experienced adverse action(s) taken by their employer(s) as a result of their caregiving responsibilities,
a finding which is much higher among Primary caregivers (32 percent) than Non-Primary caregivers (17
percent). Types of adverse actions include been given less attractive assignments (10 percent), been written
up or admonished (8 percent), passed over for a promotion (8 percent), fired (8 percent), forcibility had
hours or duties reduced (8 percent), or been discriminated against (7 percent).
56BASE: EMPLOYED OR HAVE BEEN EMPLOYED DURING THEIR TIME AS A CAREGIVERQ1030. Have you experienced any adverse actions by a current or former employer as a result of your caregiving responsibilities?
All Primary Non-Primary
NET – Experienced adverse actions
Been given less attractive assignments
Been written up or admonished
Been passed over for a promotion
Been fired
Forcibly had hours or duties reduced
Been discriminated against
Other
No, I have not experienced any adverse actions by a current or former employer as a result of my caregiving responsibilities
28
10
8
8
8
8
7
1
72
32
12
10
10
9
10
9
1
68
17
6
4
3
5
5
3
1
83
Adverse Employment Actions Experienced As a Result of Caregiving Duties (%)
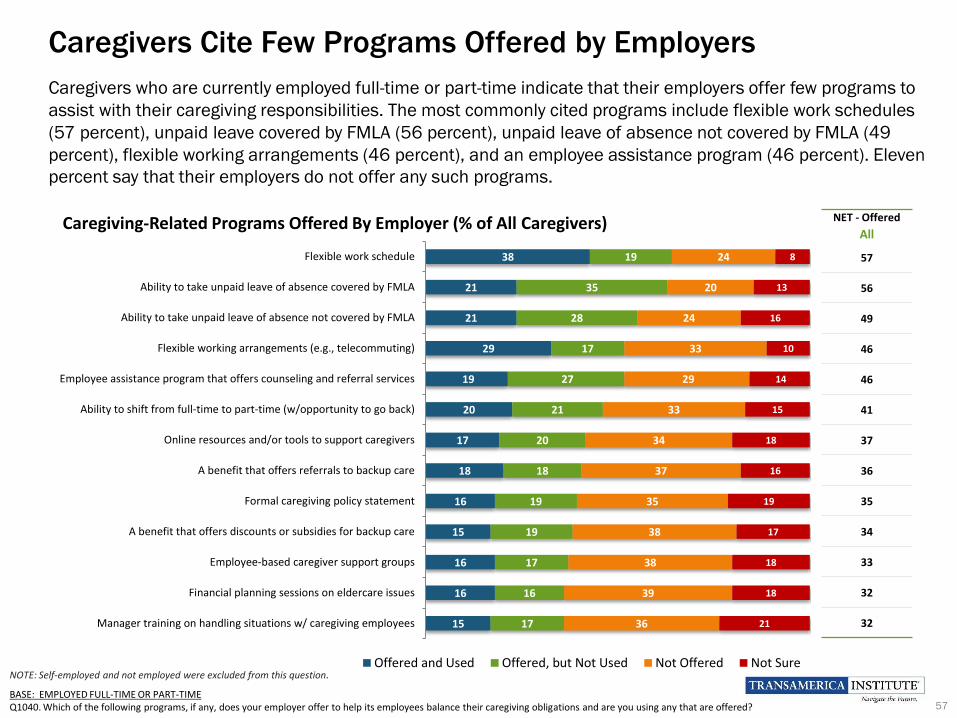
38
21
21
29
19
20
17
18
16
15
16
16
15
19
35
28
17
27
21
20
18
19
19
17
16
17
24
20
24
33
29
33
34
37
35
38
38
39
36
8
13
16
10
14
15
18
16
19
17
18
18
21
Flexible work schedule
Ability to take unpaid leave of absence covered by FMLA
Ability to take unpaid leave of absence not covered by FMLA
Flexible working arrangements (e.g., telecommuting)
Employee assistance program that offers counseling and referral services
Ability to shift from full-time to part-time (w/opportunity to go back)
Online resources and/or tools to support caregivers
A benefit that offers referrals to backup care
Formal caregiving policy statement
A benefit that offers discounts or subsidies for backup care
Employee-based caregiver support groups
Financial planning sessions on eldercare issues
Manager training on handling situations w/ caregiving employees
Offered and Used Offered, but Not Used Not Offered Not Sure
Caregivers Cite Few Programs Offered by Employers
Caregivers who are currently employed full-time or part-time indicate that their employers offer few programs to
assist with their caregiving responsibilities. The most commonly cited programs include flexible work schedules
(57 percent), unpaid leave covered by FMLA (56 percent), unpaid leave of absence not covered by FMLA (49
percent), flexible working arrangements (46 percent), and an employee assistance program (46 percent). Eleven
percent say that their employers do not offer any such programs.
57BASE: EMPLOYED FULL-TIME OR PART-TIMEQ1040. Which of the following programs, if any, does your employer offer to help its employees balance their caregiving obligations and are you using any that are offered?
Caregiving-Related Programs Offered By Employer (% of All Caregivers) NET - Offered
All
57
56
49
46
46
41
37
36
35
34
33
32
32
NOTE: Self-employed and not employed were excluded from this question.

25
42
24
34
22
24
20
21
19
19
19
20
18
35
17
29
18
27
22
22
20
21
21
20
18
19
20
24
24
32
29
32
35
36
36
37
37
38
38
9
6
12
5
11
11
12
12
13
12
13
13
14
Ability to take unpaid leave of absence covered by FMLA
Flexible work schedule
Ability to take unpaid leave of absence not covered by FMLA
Flexible working arrangements (e.g., telecommuting)
Employee assistance program that offers counseling and referral services
Ability to shift from full-time to part-time (w/opportunity to go back)
Online resources and/or tools to support caregivers
A benefit that offers referrals to backup care
Formal caregiving policy statement
A benefit that offers discounts or subsidies for backup care
Employee-based caregiver support groups
Financial planning sessions on eldercare issues
Manager training on handling situations w/ caregiving employees
Offered and Used Offered, but Not Used Not Offered Not Sure
Primary Caregivers Cite Few Programs Offered by Employers
Primary caregivers who are employed full-time or part-time indicate their employers offer few programs to assist
with their caregiving duties. The most commonly cited programs offered include unpaid leave covered by FMLA
(60 percent), flexible work schedules (59 percent), unpaid leave of absence not covered by FMLA (53 percent),
flexible working arrangements (52 percent), and an employee assistance program (49 percent). Only 37 percent
mentioned their employers offer manager training on handling situations with caregiving employees. Eleven
percent say that their employers do not offer programs.
58BASE: EMPLOYED FULL-TIME OR PART-TIMEQ1040. Which of the following programs, if any, does your employer offer to help its employees balance their caregiving obligations and are you using any that are offered?
Caregiving-Related Programs Offered By Employer (% of Primary Caregivers) NET - Offered
Primary
60
59
53
52
49
46
42
41
40
40
39
38
37
NOTE: Self-employed and not employed were excluded from this question.

28
13
14
10
17
10
8
8
9
6
10
8
7
22
33
25
28
15
18
15
13
11
14
9
11
11
26
17
22
28
37
33
32
31
41
41
43
32
40
11
24
26
21
18
26
32
35
26
26
25
36
29
Flexible work schedule
Ability to take unpaid leave of absence covered by FMLA
Ability to take unpaid leave of absence not covered by FMLA
Employee assistance program that offers counseling and referral services
Flexible working arrangements (e.g., telecommuting)
Ability to shift from full-time to part-time (w/opportunity to go back)
Online resources and/or tools to support caregivers
Formal caregiving policy statement
A benefit that offers referrals to backup care
A benefit that offers discounts or subsidies for backup care
Employee-based caregiver support groups
Manager training on handling situations w/ caregiving employees
Financial planning sessions on eldercare issues
Offered and Used Offered, but Not Used Not Offered Not Sure
Non-Primary Caregivers Cite Few Programs Offered by Employers
Non-Primary caregivers who are employed full-time or part-time indicate that their employers offer relatively few
programs to assist with their caregiving duties. The most commonly cited programs offered include flexible work
schedules (50 percent), unpaid leave covered by FMLA (46 percent), unpaid leave of absence not covered by
FMLA (39 percent), an employee assistance program (38 percent), and flexible working arrangements (32
percent). Non-Primary caregivers are much more likely than Primary caregivers to be “not sure” whether their
employers offer various types of programs.
59BASE: EMPLOYED FULL-TIME OR PART-TIMEQ1040. Which of the following programs, if any, does your employer offer to help its employees balance their caregiving obligations and are you using any that are offered?
Caregiving-Related Programs Offered By Employer (% of Non-Primary Caregivers) NET - Offered
Non-Primary
50
46
39
38
32
28
23
21
20
20
19
19
18
NOTE: Self-employed and not employed were excluded from this question.

Few Are Very Familiar with FMLA
The Family Medical Leave Act (FMLA) is a federal law that requires covered employers to provide their
employees with protected, unpaid leave for qualified medical and family reasons. Fifty-seven percent of all
caregivers are “somewhat” or “very familiar” with FMLA. However, only 22 percent of all caregivers are “very
familiar” with it. Primary (25 percent) are more likely than Non-Primary caregivers (17 percent) to be “very
familiar.” An alarming 24 percent of all caregivers are “not at all familiar” with FMLA, a finding that is
consistent among Primary (23 percent) and Non-Primary (25 percent) caregivers.
60BASE: ALL QUALIFIED RESPONDENTS Q1020. How familiar are you with the Family and Medical Leave Act?
22
35
19
24
All
25
35
17
23
Primary
17
36 22
25
Non-Primary
Very familiar Somewhat familiar Not too familiar Not at all familiar
Caregiver Familiarity with the Family and Medical Leave Act (%)
NET – Somewhat/Very familiar= 57%
NET – Somewhat/Very familiar= 60%
NET – Somewhat/Very familiar= 54%

61
The Many Faces of Family Caregivers:
A Close-Up Look at Caregiving and Its Implications
Executive Summary
A Portrait of Today’s Caregivers
• Key Highlights
• A Portrait of Today’s Caregivers
• Insights About Care Recipients and Their Needs
• The Diverse Duties, Daily Lives, and Dedication of Caregivers
• The Employment Situation of Caregivers
The Personal Financial Implications of Being a Caregiver
• The Health Effects of Being a Caregiver
• Ways to Help Caregivers with Their Responsibilities

Caregivers’ Financial Well-Being
More than half of all caregivers (56 percent) self-describe their financial well-being as excellent or good, a
finding that is relatively consistent among Primary (57 percent) and Non-Primary caregivers (54 percent). A
noteworthy 15 percent of all caregivers, including Primary and Non-Primary caregivers, say their financial
well-being is poor.
BASE: ALL QUALIFIED RESPONDENTSQ1100. How would you describe your own financial well-being?
“How would you describe your own financial well-being?” (%)
Excellent Good PoorFair
62
16
40
29
15
All
16
41
28
15
Primary
17
37
31
15
Non-Primary
NET – Excellent/Good= 56%
NET – Excellent/Good= 57%
NET – Excellent/Good= 54%

Many Didn’t Consider Finances When Becoming a Caregiver
Sixty-nine percent of all caregivers say they gave little or no thought into their own financial situation when
deciding to become a caregiver, a finding which differs between Primary (66 percent) and Non-Primary
(76 percent) caregivers. Primary caregivers (34 percent) are more likely than Non-Primary caregivers (24
percent) to have given some or a lot of thought to their financial situation when deciding to become a
caregiver.
63BASE: ALL QUALIFIED RESPONDENTSQ1110. To what extent did you consider your own financial situation when deciding to become a caregiver?
13
18
19
50
All
16
18
18
48
Primary
8
16
20
56
Non-Primary
A lot Some A little None
NET – A little/None = 69%
NET – A little/None = 66%
NET – A little/None = 76%
“To what extent did you consider your own financial situation when deciding to become a caregiver?” (%)

Most Caregivers’ Financial Situation Has Stayed the Same
The majority of caregivers (65 percent) say their financial situation has not changed as a result of becoming
a caregiver, including Primary caregivers (61 percent) and Non-Primary caregivers (76 percent). However,
Primary caregivers (22 percent) are more likely than Non-Primary caregivers (10 percent) to say their
financial situation has worsened since becoming a caregiver.
64BASE: ALL QUALIFIED RESPONDENTSQ1115. How has your financial situation changed as a result of becoming a caregiver?
13
65
18
4
All
14
61
22
3
Primary
9
76
10 5
Non-Primary
“How has your financial situation changed as a result of becoming a caregiver?” (%)
Improved Stayed the same Worsened Not sure
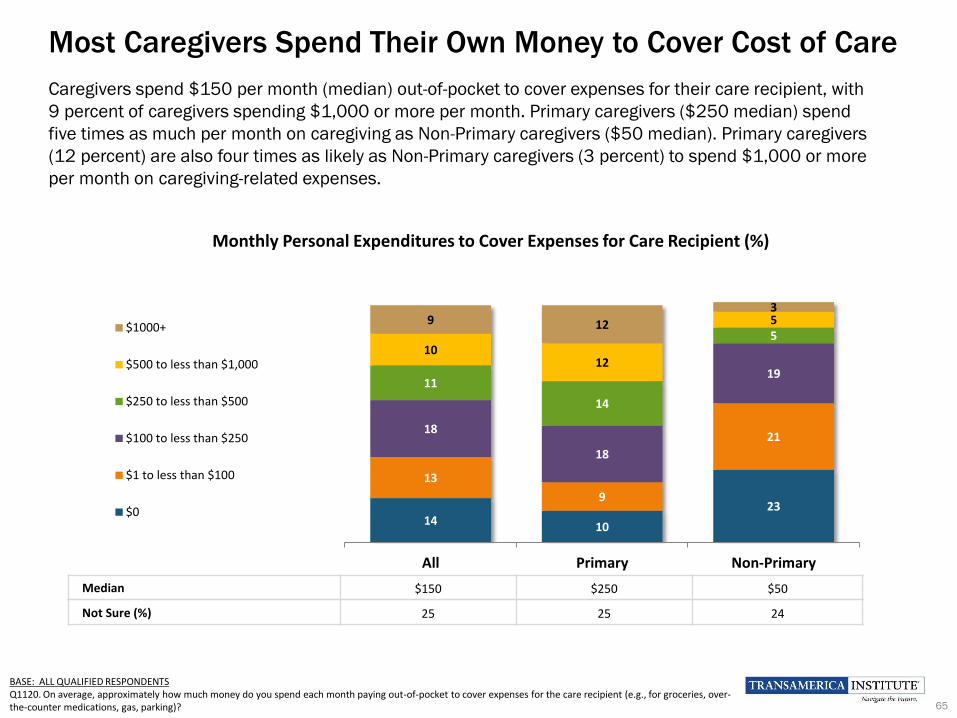
Most Caregivers Spend Their Own Money to Cover Cost of Care
Caregivers spend $150 per month (median) out-of-pocket to cover expenses for their care recipient, with
9 percent of caregivers spending $1,000 or more per month. Primary caregivers ($250 median) spend
five times as much per month on caregiving as Non-Primary caregivers ($50 median). Primary caregivers
(12 percent) are also four times as likely as Non-Primary caregivers (3 percent) to spend $1,000 or more
per month on caregiving-related expenses.
65
BASE: ALL QUALIFIED RESPONDENTSQ1120. On average, approximately how much money do you spend each month paying out-of-pocket to cover expenses for the care recipient (e.g., for groceries, over-the-counter medications, gas, parking)?
14 10
23
13
9
2118
18
1911
14
510
12
59 12
3
All Primary Non-Primary
$1000+
$500 to less than $1,000
$250 to less than $500
$100 to less than $250
$1 to less than $100
$0
Monthly Personal Expenditures to Cover Expenses for Care Recipient (%)
Median $150 $250 $50
Not Sure (%) 25 25 24

Most Caregivers Do Not Receive Any Financial Assistance
Only 25 percent of all caregivers receive any sort of financial assistance for their caregiving duties, a finding
which is higher among Primary (27 percent) than Non-Primary (21 percent) caregivers. With regards to
possible sources of financial assistance, caregivers’ most frequently cited source of funds are from the care
recipient (10 percent), a finding which is relatively consistent between Primary (11 percent) and Non-Primary
(8 percent) caregivers.
66BASE: ALL QUALIFIED RESPONDENTSQ1260. Which of the following do you receive for your caregiving duties? Please select all that apply.
All Primary Non-Primary
NET – Financial Assistance for Caregiver Duties
I receive funds from the care recipient
I receive funds from family members other than the care recipient
I receive funds from Cash for Care through Medicaid
I receive funding from my home state or municipality
I receive funds from In Home Supportive Services
I receive funds from a church or charity
I receive another form of payment
I do not receive any form of payment as a caregiver
25
10
8
5
5
4
4
4
75
27
11
9
6
6
6
5
4
73
21
8
6
2
2
1
2
5
79
Sources of Financial Assistance Received for Caregiving Duties, If Any (%)

Almost Half of Caregivers Are Paying Off Debt
Caregivers’ most frequently cited financial priorities include just getting by -- covering basic living expenses
(43 percent) and saving for retirement (37 percent). A noteworthy and alarming 49 percent of caregivers cite
paying off some form of debt as a financial priority including 32 percent who mentioned paying off credit
card or consumer debt. These financial priorities are directionally similar among Primary and Non-Primary
caregivers. However, Primary caregivers (34 percent) are more likely than Non-Primary caregivers (25
percent) to mention paying healthcare expenses. Primary caregivers are also more likely than Non-Primary
caregivers to mention supporting children and supporting parents.
67BASE: ALL QUALIFIED RESPONDENTSQ1105. Which of the following are your financial priorities right now? Please select all that apply.
All Primary Non-Primary
NET – Paying off debt
Paying off credit card or consumer debt
Paying off mortgage
Paying off student debt
Just getting by – covering basic living expenses
Saving for retirement
Paying healthcare expenses
Supporting children
Supporting parents
Contributing to an education (for any children, grandchildren or other)
Creating an inheritance or financial legacy
Other
49
32
26
13
43
37
31
31
17
16
12
8
49
32
26
12
43
36
34
33
19
17
12
7
49
31
26
14
42
40
25
25
12
14
12
8
“Which of the following are your financial priorities right now?” (%)

Household Income Among Caregivers Spans a Wide Spectrum
The household income of caregivers is $57,000 per year (estimated median). Twenty-eight percent of
caregivers report a household income of $100,000 or more per year, including 29 percent of Primary
caregivers and 25 percent of Non-Primary caregivers. Thirty-five percent of caregivers report a household
income of less than $50,000 per year.
68BASE: ALL QUALIFIED RESPONDENTSQ1265. Which of the following income categories best describes your total household income in 2016?
10 10 10
8 8 8
7 7 6
10 9 11
16 16 16
14 13 14
25 26 24
3 3 1
All Primary Non-Primary
$250k or more
$100k to less than $250k
$75k to less than $100k
$50k to less than $75k
$35k to less than $50k
$25k to less than $35k
$15k to less than $25k
Less than $15k
Total Household Income in 2016 (%)
Decline to answer 7 8 10
Estimated Median $57,000 $58,000 $56,000
Note: The median is estimated based on the approximate midpoint of the range of each response category. Non-responses are excluded from the estimate

Most Are Confident About Retiring Comfortably
Sixty percent of caregivers are “somewhat” or “very confident” that they will be able to fully retire with a
comfortable lifestyle, including 24 percent who are “very confident” and 36 percent who are “somewhat
confident.” However, one in five caregivers (21 percent) are “not at all confident.” These findings are
consistent between Primary and Non-Primary caregivers.
69BASE: ALL QUALIFIED RESPONDENTSQ1135. How confident are you that you will be able to fully retire with a lifestyle you consider comfortable?
“How confident are you that you will be able to fully retire with a lifestyle you consider comfortable?” (%)
24
36
19
21
All
24
35
19
22
Primary
24
37
20
19
Non-Primary
Very Confident Somewhat Confident Not too Confident Not at all Confident
NET – Very /Somewhat Confident = 59%
NET – Very /Somewhat Confident = 61%
NET – Very /Somewhat Confident = 60%
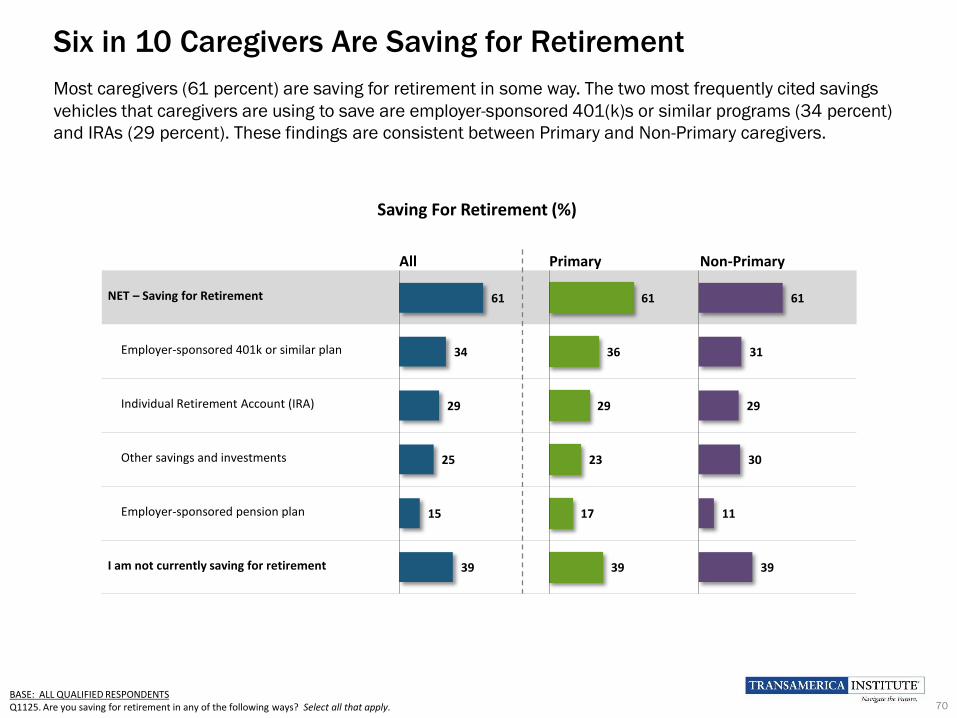
Six in 10 Caregivers Are Saving for Retirement
Most caregivers (61 percent) are saving for retirement in some way. The two most frequently cited savings
vehicles that caregivers are using to save are employer-sponsored 401(k)s or similar programs (34 percent)
and IRAs (29 percent). These findings are consistent between Primary and Non-Primary caregivers.
70BASE: ALL QUALIFIED RESPONDENTSQ1125. Are you saving for retirement in any of the following ways? Select all that apply.
All Primary Non-Primary
NET – Saving for Retirement
Employer-sponsored 401k or similar plan
Individual Retirement Account (IRA)
Other savings and investments
Employer-sponsored pension plan
I am not currently saving for retirement
61
34
29
25
15
39
61
36
29
23
17
39
61
31
29
30
11
39
Saving For Retirement (%)
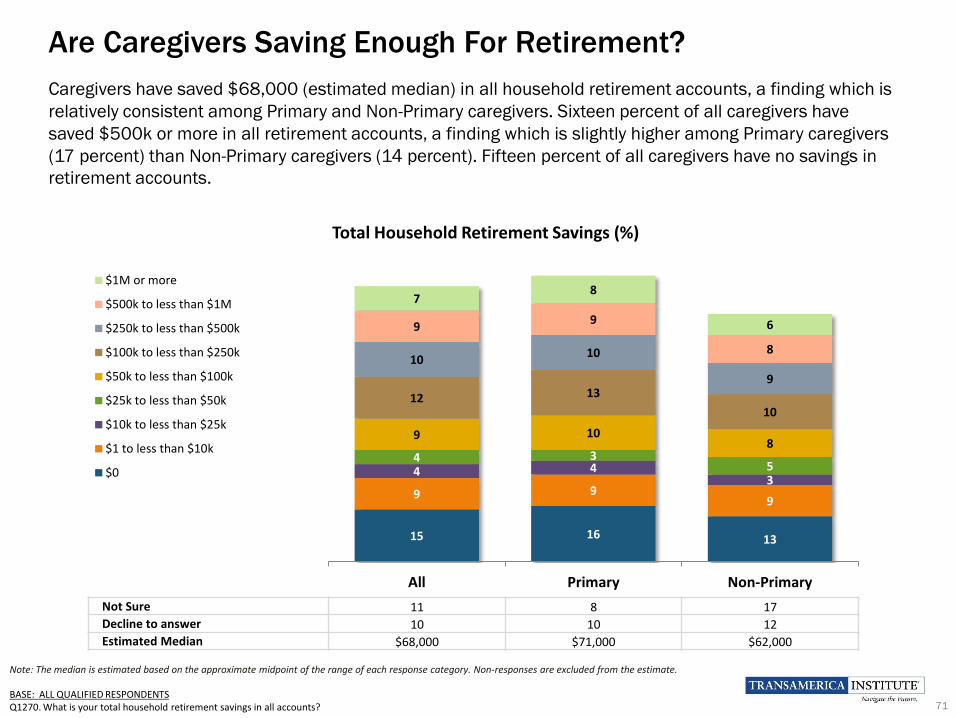
Are Caregivers Saving Enough For Retirement?
Caregivers have saved $68,000 (estimated median) in all household retirement accounts, a finding which is
relatively consistent among Primary and Non-Primary caregivers. Sixteen percent of all caregivers have
saved $500k or more in all retirement accounts, a finding which is slightly higher among Primary caregivers
(17 percent) than Non-Primary caregivers (14 percent). Fifteen percent of all caregivers have no savings in
retirement accounts.
71BASE: ALL QUALIFIED RESPONDENTSQ1270. What is your total household retirement savings in all accounts?
15 16 13
9 99
4 43
4 35
9 108
12 13
10
1010
9
99
8
78
6
All Primary Non-Primary
$1M or more
$500k to less than $1M
$250k to less than $500k
$100k to less than $250k
$50k to less than $100k
$25k to less than $50k
$10k to less than $25k
$1 to less than $10k
$0
Total Household Retirement Savings (%)
Not Sure 11 8 17
Decline to answer 10 10 12
Estimated Median $68,000 $71,000 $62,000
Note: The median is estimated based on the approximate midpoint of the range of each response category. Non-responses are excluded from the estimate.
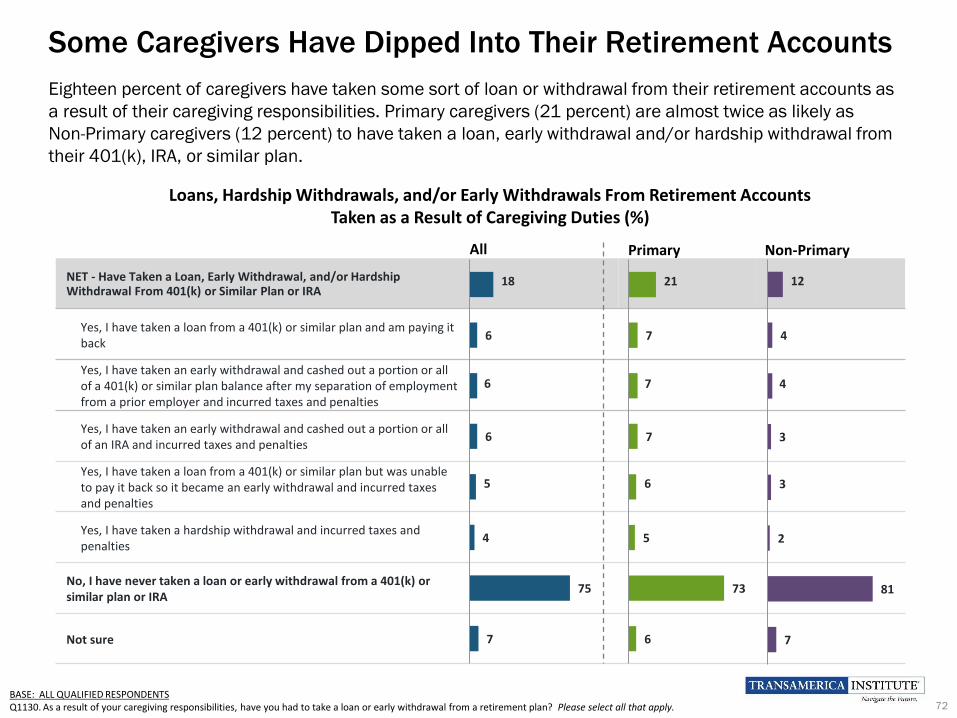
Some Caregivers Have Dipped Into Their Retirement Accounts
Eighteen percent of caregivers have taken some sort of loan or withdrawal from their retirement accounts as
a result of their caregiving responsibilities. Primary caregivers (21 percent) are almost twice as likely as
Non-Primary caregivers (12 percent) to have taken a loan, early withdrawal and/or hardship withdrawal from
their 401(k), IRA, or similar plan.
72BASE: ALL QUALIFIED RESPONDENTSQ1130. As a result of your caregiving responsibilities, have you had to take a loan or early withdrawal from a retirement plan? Please select all that apply.
Loans, Hardship Withdrawals, and/or Early Withdrawals From Retirement Accounts Taken as a Result of Caregiving Duties (%)
All Primary Non-Primary
NET - Have Taken a Loan, Early Withdrawal, and/or Hardship Withdrawal From 401(k) or Similar Plan or IRA
Yes, I have taken a loan from a 401(k) or similar plan and am paying it back
Yes, I have taken an early withdrawal and cashed out a portion or all of a 401(k) or similar plan balance after my separation of employment from a prior employer and incurred taxes and penalties
Yes, I have taken an early withdrawal and cashed out a portion or all of an IRA and incurred taxes and penalties
Yes, I have taken a loan from a 401(k) or similar plan but was unable to pay it back so it became an early withdrawal and incurred taxes and penalties
Yes, I have taken a hardship withdrawal and incurred taxes and penalties
No, I have never taken a loan or early withdrawal from a 401(k) or similar plan or IRA
Not sure
18
6
6
6
5
4
75
7
21
7
7
7
6
5
73
6
12
4
4
3
3
2
81
7

One-Third of Caregivers Have a Financial Advisor
Thirty-six percent of caregivers have a financial advisor, including 37 percent of Primary and 32 percent of
Non-Primary caregivers.
73BASE: ALL QUALIFIED RESPONDENTSQ1140. Do you have a financial advisor?
36
64
All
37
63
Primary
32
68
Non-Primary
“Do you have a financial advisor?” (%)
Yes No

74
The Many Faces of Family Caregivers:
A Close-Up Look at Caregiving and Its Implications
Executive Summary
A Portrait of Today’s Caregivers
• Key Highlights
• A Portrait of Today’s Caregivers
• Insights About Care Recipients and Their Needs
• The Diverse Duties, Daily Lives, and Dedication of Caregivers
• The Employment Situation of Caregivers
• The Personal Financial Implications of Being a Caregiver
The Health Effects of Being a Caregiver
• Ways to Help Caregivers with Their Responsibilities
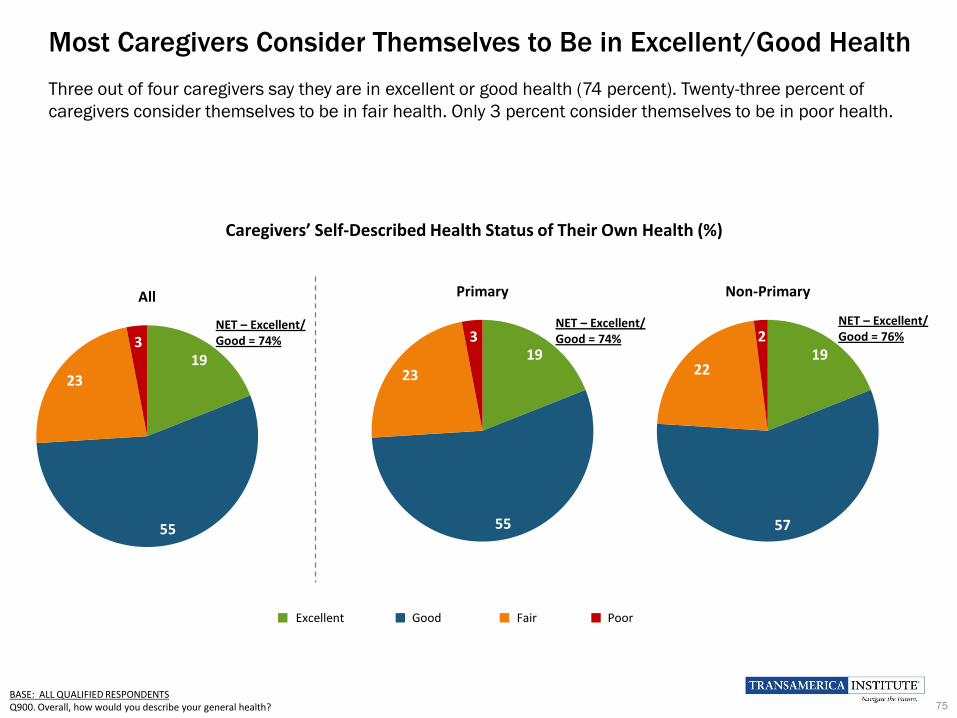
Most Caregivers Consider Themselves to Be in Excellent/Good Health
Three out of four caregivers say they are in excellent or good health (74 percent). Twenty-three percent of
caregivers consider themselves to be in fair health. Only 3 percent consider themselves to be in poor health.
75BASE: ALL QUALIFIED RESPONDENTSQ900. Overall, how would you describe your general health?
Caregivers’ Self-Described Health Status of Their Own Health (%)
Excellent Good Fair Poor
19
55
23
3
All
19
55
23
3
Primary
19
57
22
2
Non-Primary
NET – Excellent/Good = 74%
NET – Excellent/Good = 74%
NET – Excellent/Good = 76%

17
61
21
1
Primary
15
65
17
3
All
13
74
10 3
Non-Primary
One in Six Experienced a Decline in Their Own Health
Approximately one in six caregivers (17 percent) indicate their general health has gotten worse/declined
since becoming a caregiver, a finding which is much higher among Primary caregivers (21 percent) than
Non-Primary caregivers (10 percent). The majority of caregivers (65 percent) indicate that their general
health has stayed the same. Primary caregivers (61 percent) are less likely than Non-Primary caregivers (74
percent) to say their health status has not changed.
76BASE: ALL QUALIFIED RESPONDENTSQ905. Since becoming a caregiver, has your general health…?
Changes in General Health Since Becoming a Caregiver (%)
Improved Stayed the same Got worse/Declined Not sure

Nine in 10 Caregivers Have Health Insurance
Nine out of 10 caregivers currently have health insurance, a finding that is consistent between Primary (91
percent) and Non-Primary caregivers (90 percent). Employer benefits are the most frequently cited source of
health insurance among all caregivers (39 percent), including Primary (39 percent) and Non-Primary (40
percent) caregivers. Other frequently cited sources of health insurance coverage among all caregivers include
Medicare (19 percent) and Medicaid (10 percent). Of note, 10 percent of caregivers are currently uninsured.
All Primary Non-Primary
NET – Have Insurance
I receive benefits through an employer (mine or someone else’s)
I receive benefits through a union(mine or someone else’s)
I receive benefits through a trade association (mine or someone else’s)
I receive benefits from a private insurance plan in the traditional market from my spouse
I receive benefits from a private insuranceplan in the traditional market from my parents
I receive benefits through Medicare(for age or disability reasons)
I receive benefits through Medicaid or another state funded program
I receive benefits through military service (mine or someone else’s)
I receive VA benefits from my own service or through my spouse
I receive benefits through my college or university
I buy my own health insurance from a private health insurance company
I buy my own health insurance public health insurance exchange, such as healthcare.gov or the state-based exchange
I do not have health insurance at this time
BASE: ALL QUALIFIED RESPONDENTSQ1255. Which of the following best describes how you primarily receive health insurance?
“Which of the following best describes how you primarily receive health insurance?” (%)
77
90
39
3
1
3
2
19
10
1
1
<1
8
4
10
91
39
4
1
3
1
20
9
1
1
<1
8
3
9
90
40
1
1
3
2
17
10
2
1
1
6
5
10

78
The Many Faces of Family Caregivers:
A Close-Up Look at Caregiving and Its Implications
Executive Summary
A Portrait of Today’s Caregivers
• Key Highlights
• A Portrait of Today’s Caregivers
• Insights About Care Recipients and Their Needs
• The Diverse Duties, Daily Lives, and Dedication of Caregivers
• The Employment Situation of Caregivers
• The Personal Financial Implications of Being a Caregiver
• The Health Effects of Being a Caregiver
Ways to Help Caregivers with Their Responsibilities
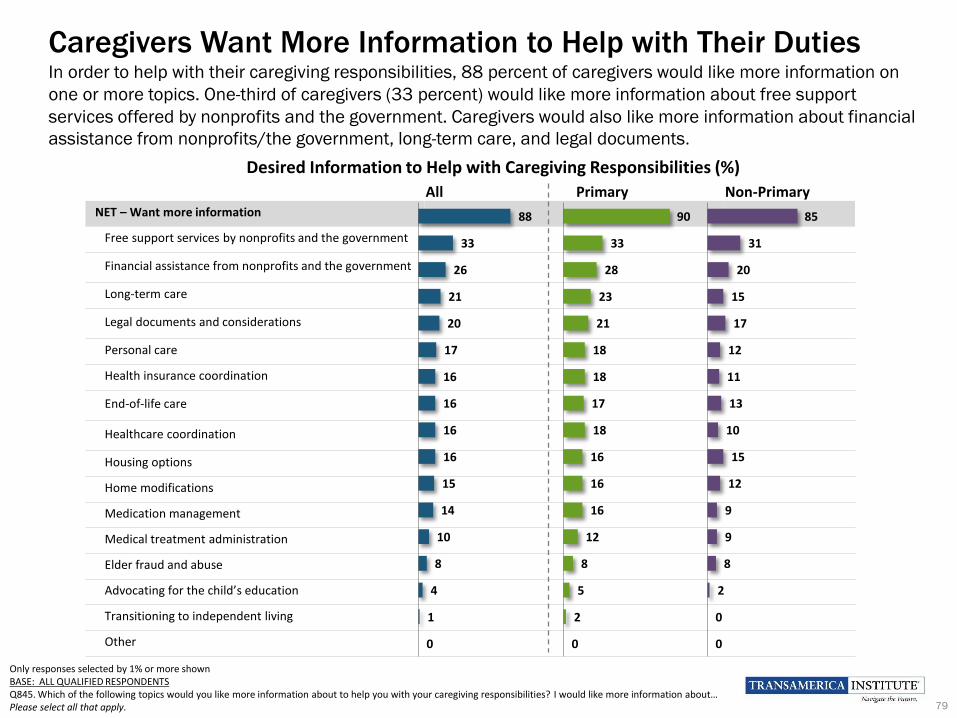
Caregivers Want More Information to Help with Their DutiesIn order to help with their caregiving responsibilities, 88 percent of caregivers would like more information on
one or more topics. One-third of caregivers (33 percent) would like more information about free support
services offered by nonprofits and the government. Caregivers would also like more information about financial
assistance from nonprofits/the government, long-term care, and legal documents.
79
Only responses selected by 1% or more shownBASE: ALL QUALIFIED RESPONDENTSQ845. Which of the following topics would you like more information about to help you with your caregiving responsibilities? I would like more information about… Please select all that apply.
All Primary Non-PrimaryNET – Want more information
Free support services by nonprofits and the government
Financial assistance from nonprofits and the government
Long-term care
Legal documents and considerations
Personal care
Health insurance coordination
End-of-life care
Healthcare coordination
Housing options
Home modifications
Medication management
Medical treatment administration
Elder fraud and abuse
Advocating for the child’s education
Transitioning to independent living
Other
88
33
26
21
20
17
16
16
16
16
15
14
10
8
4
1
0
90
33
28
23
21
18
18
17
18
16
16
16
12
8
5
2
0
85
31
20
15
17
12
11
13
10
15
12
9
9
8
2
0
0
Desired Information to Help with Caregiving Responsibilities (%)

Caregivers Would Like More Information to Help Them Personally
In order to help them personally with their caregiving responsibilities, 71 percent of caregivers would like
more information on one or more topics, including 76 percent of Primary and 60 percent of Non-Primary
caregivers. More than one-third of caregivers would like information about stress management (38 percent),
tips for coping with challenges (37 percent), and government benefits available for caregivers (37 percent).
Primary caregivers are more likely than Non-Primary caregivers to want this information.
80
BASE: ALL QUALIFIED RESPONDENTSQ850. Which of the following topics would you like more information to help you personally with your caregiving responsibilities? I would like more information about... Please select all that apply
All Primary Non-Primary
Managing my stress
Tips for coping with caregiving challenges
Government benefits available for caregivers
Support groups for caregivers
Employer-sponsored workplace benefits for caregivers
None
38
37
36
22
15
29
41
39
41
26
18
24
30
32
26
13
9
40
Desired Topics of Information to Help Caregivers Personally with Their Caregiving Responsibilities (%)
NOTE: Five most commonly selected sources shown.
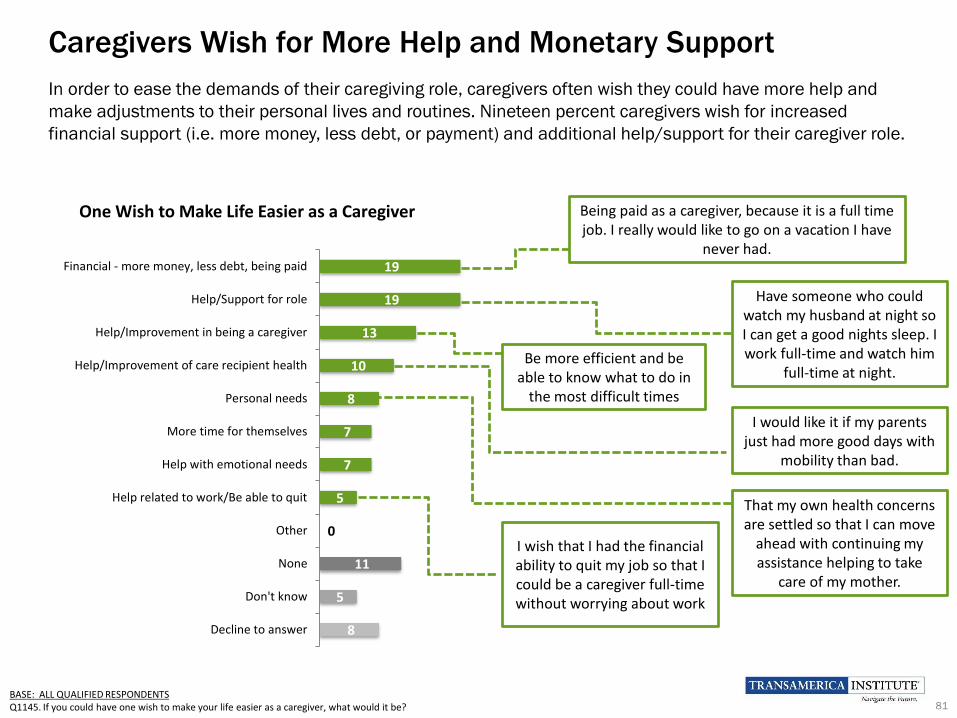
Caregivers Wish for More Help and Monetary Support
In order to ease the demands of their caregiving role, caregivers often wish they could have more help and
make adjustments to their personal lives and routines. Nineteen percent caregivers wish for increased
financial support (i.e. more money, less debt, or payment) and additional help/support for their caregiver role.
81BASE: ALL QUALIFIED RESPONDENTSQ1145. If you could have one wish to make your life easier as a caregiver, what would it be?
One Wish to Make Life Easier as a Caregiver
19
19
13
10
8
7
7
5
0
11
5
8
Financial - more money, less debt, being paid
Help/Support for role
Help/Improvement in being a caregiver
Help/Improvement of care recipient health
Personal needs
More time for themselves
Help with emotional needs
Help related to work/Be able to quit
Other
None
Don't know
Decline to answer
Being paid as a caregiver, because it is a full time job. I really would like to go on a vacation I have
never had.
Have someone who could watch my husband at night so I can get a good nights sleep. I work full-time and watch him
full-time at night. Be more efficient and be
able to know what to do in the most difficult times
I would like it if my parents just had more good days with
mobility than bad.
That my own health concerns are settled so that I can move
ahead with continuing my assistance helping to take
care of my mother.
I wish that I had the financial ability to quit my job so that I could be a caregiver full-time without worrying about work

© Transamerica Institute®, 2017
© Transamerica Institute®, 2017