Embed Size (px)
Citation preview
SOEPpaperson Multidisciplinary Panel Data Research
The GermanSocio-EconomicPanel study
The Linked Employer–Employee Study of the Socio-Economic Panel (SOEP-LEE): Project Report
Michael Weinhardt, Alexia Meyermann, Stefan Liebig, Jürgen Schupp
829 201
6SOEP — The German Socio-Economic Panel study at DIW Berlin 829-2016
SOEPpapers on Multidisciplinary Panel Data Research at DIW Berlin This series presents research findings based either directly on data from the German Socio-Economic Panel study (SOEP) or using SOEP data as part of an internationally comparable data set (e.g. CNEF, ECHP, LIS, LWS, CHER/PACO). SOEP is a truly multidisciplinary household panel study covering a wide range of social and behavioral sciences: economics, sociology, psychology, survey methodology, econometrics and applied statistics, educational science, political science, public health, behavioral genetics, demography, geography, and sport science. The decision to publish a submission in SOEPpapers is made by a board of editors chosen by the DIW Berlin to represent the wide range of disciplines covered by SOEP. There is no external referee process and papers are either accepted or rejected without revision. Papers appear in this series as works in progress and may also appear elsewhere. They often represent preliminary studies and are circulated to encourage discussion. Citation of such a paper should account for its provisional character. A revised version may be requested from the author directly. Any opinions expressed in this series are those of the author(s) and not those of DIW Berlin. Research disseminated by DIW Berlin may include views on public policy issues, but the institute itself takes no institutional policy positions. The SOEPpapers are available at http://www.diw.de/soeppapers Editors: Jan Goebel (Spatial Economics) Martin Kroh (Political Science, Survey Methodology) Carsten Schröder (Public Economics) Jürgen Schupp (Sociology) Conchita D’Ambrosio (Public Economics, DIW Research Fellow) Denis Gerstorf (Psychology, DIW Research Director) Elke Holst (Gender Studies, DIW Research Director) Frauke Kreuter (Survey Methodology, DIW Research Fellow) Frieder R. Lang (Psychology, DIW Research Fellow) Jörg-Peter Schräpler (Survey Methodology, DIW Research Fellow) Thomas Siedler (Empirical Economics) C. Katharina Spieß ( Education and Family Economics) Gert G. Wagner (Social Sciences)
ISSN: 1864-6689 (online)
German Socio-Economic Panel (SOEP) DIW Berlin Mohrenstrasse 58 10117 Berlin, Germany Contact: Uta Rahmann | [email protected]
1
The Linked Employer–Employee Study of the Socio-Economic Panel (SOEP-LEE): Project Report
Michael Weinhardt,1,2 Alexia Meyermann,2 Stefan Liebig,2 and Jürgen Schupp1,3
1German Institute for Economic Research (DIW) Berlin, 2Bielefeld University, 3Free University Berlin
Data Service Center for Business and Organizational Data (DSC-BO)
Bielefeld, December 2015
Abstract In 2012/13, a survey of German employers was conducted using face-to-face and paper-and-pencil
interviews (N = 1,708; response rate = 30.1%). Establishments were sampled based on address
information provided by employed participants in the Socio-Economic Panel (SOEP) study. The
information obtained from both surveys can be linked in order to create a linked employer–
employee data set concerning organizational strategies and labor market outcomes (N = 1,834).
Paradata were collected regarding several aspects of the survey: contact forms informed about the
fieldwork process; an interviewer survey provided information about the interviewer staff; every
interview situation was evaluated separately by interviewers to learn more about the response
process in establishments; the editing process was reassessed; and 31 interviews were audiotaped to
gain insights into the interviewing process. This project report covers the design of the study, the
data collection stage, and field outcomes. It evaluates the establishment survey itself, as well as the
linked SOEP-LEE data set, by looking at selectivity in nonresponse and at measurement errors overall.
The establishment data and the linked SOEP-LEE data are available for secondary use at the research
data centers of the SOEP at DIW Berlin and at the Data Service Center for Business and
Organizational Data (DSC-BO) at Bielefeld University (DOI:10.7478/s0549.1.v1).
2
Content 1 Introduction ..................................................................................................................................... 5
2 General information about the study ............................................................................................. 6
2.1 Objectives and scope of the study .......................................................................................... 6
2.2 Topics covered in the SOEP-LEE study..................................................................................... 6
2.3 Previous studies and research ................................................................................................. 7
2.4 Employee-first method: Population, sampling procedure, and sample ................................. 7
2.5 Main establishment questionnaire ......................................................................................... 9
2.6 Questionnaire mode .............................................................................................................. 11
2.7 Paradata: Contact form, interview form, interviewer questionnaire ................................... 12
2.7.1 Documenting the contact process: Contact forms ........................................................ 12
2.7.2 Documenting the interview process: Interview form and audio recordings ................ 13
2.7.3 Documenting the interview staff: Interviewer questionnaire ...................................... 14
2.8 Summary................................................................................................................................ 14
3 Project planning and development ............................................................................................... 15
3.1 Pre–data collection phase ..................................................................................................... 15
3.1.1 Collection of employers’ addresses from SOEP participants ........................................ 15
3.1.2 Verification and validation of employer addresses ....................................................... 16
3.1.3 Study and questionnaire design .................................................................................... 18
3.1.4 Questionnaire development: Designing questions for establishment surveys ............ 19
3.1.5 Pretest: Cognitive interviews ........................................................................................ 20
3.1.6 Pretest ........................................................................................................................... 20
3.1.7 Institutional support to boost response ........................................................................ 21
3.1.8 Interviewer training and payment................................................................................. 21
3.2 Data collection and fieldwork ............................................................................................... 22
3.2.1 Contacting the establishments: Call record data and interviewer evaluations ............ 23
3.2.2 Fieldwork progress ........................................................................................................ 25
3.2.3 The respondent ............................................................................................................. 26
3.2.4 Interviewer reports on the contact process .................................................................. 27
3.3 Post–data collection phase ................................................................................................... 29
3.3.1 Interviewer control, data entry, quality checks, and edits by the fieldwork organization
29
3.4 Project report for establishments ......................................................................................... 30
3.5 Summary................................................................................................................................ 31
4 Outcomes and response rates ....................................................................................................... 31
3
4.1 Step 1: Collecting employer addresses from employees ...................................................... 31
4.2 Step 2: The establishment survey of employers ................................................................... 32
4.2.1 Sample eligibility ............................................................................................................ 33
4.2.2 SOEP-LEE survey outcomes and outcome codes........................................................... 33
4.2.3 Calculating outcome rates ............................................................................................. 35
4.3 Linkage to administrative data .............................................................................................. 36
4.4 Summary................................................................................................................................ 38
5 Survey quality: Representation and measurement....................................................................... 38
5.1 Representation and selectivity .............................................................................................. 38
5.1.1 The individual SOEP data as a representative sample of German employees .............. 39
5.1.2 The SOEP-LEE data as a representative sample of German employers ........................ 39
5.1.3 Selectivity and nonresponse at the employee level ...................................................... 42
5.1.4 Selectivity and unit nonresponse at the employer level ............................................... 43
5.2 Measurement ........................................................................................................................ 47
5.2.1 Interviewer reports with regard to measurement ........................................................ 47
5.2.2 Item nonresponse ......................................................................................................... 53
5.2.3 The SOEP-LEE interviewer staff ..................................................................................... 56
5.2.4 Comparison of establishment size between SOEP data and establishment survey ..... 59
5.3 Summary................................................................................................................................ 60
6 Data edits, confidentiality, anonymization, dissemination, and linkage ...................................... 61
6.1 Edits and checks by the project team ................................................................................... 61
6.1.1 Back-coding of open responses ..................................................................................... 61
6.1.2 Filter errors .................................................................................................................... 61
6.1.3 Multiple-response items ............................................................................................... 61
6.2 Confidentiality and anonymization ....................................................................................... 62
6.3 Dissemination of the data ..................................................................................................... 63
6.4 Data structure and data linkage ............................................................................................ 63
6.5 Publications and presentations ............................................................................................. 64
7 Discussion and outlook .................................................................................................................. 66
7.1 Merits of the SOEP-LEE study ................................................................................................ 66
7.2 Choosing the organizational level to be interviewed ............................................................ 67
7.3 Sampling procedures ............................................................................................................. 67
7.4 Questionnaire design ............................................................................................................ 68
7.5 Fieldwork and outcomes ....................................................................................................... 69
7.6 Representativeness and selectivity ....................................................................................... 70
4
7.7 Data quality and measurement error .................................................................................... 71
7.8 Outlook and concluding comments ...................................................................................... 72
Funding and acknowledgments............................................................................................................. 72
References ............................................................................................................................................. 73
List of Tables Table 1. Comparison of three previous employee-first LEE studies ....................................................... 9
Table 2. Content and corresponding questions in the SOEP-LEE establishment questionnaire ........... 10
Table 3. Outcomes and response rates of the SOEP-LEE study ............................................................ 32
Table 4. SOEP-LEE outcome codes of the establishment survey .......................................................... 35
Table 5. Establishment types according to economic sector in the SOEP-LEE sample ......................... 40
Table 6. Comparison of SOEP-LEE sample and official statistics ........................................................... 41
Table 7. Logit models – likelihood of SOEP respondents providing an establishment address ............ 48
Table 8. Logistic regression analysis – likelihood of achieving an establishment interview ................. 50
Table 9. Items exhibiting item nonresponse rates greater than 5 percent .......................................... 55
Table 10. Anonymized variables in the SOEP-LEE data set. .................................................................. 62
List of Figures Figure 1. Interview duration and number of interviews per interviewer in the SOEP-LEE study ......... 23
Figure 2. Length of fieldwork period and number of interviews achieved ........................................... 26
Figure 3. Difficulty in locating a suitable response person in the establishment and number of visits
necessary to complete the survey ......................................................................................................... 28
Figure 4. Dropout stages in the SOEP-LEE study ................................................................................... 37
Figure 5. Knowledge and accuracy of the response person as perceived by the interviewer and
reported difficulty in responding to two selected complex questionnaire items (e27a and e27e of the
establishment questionnaire) ............................................................................................................... 51
Figure 6. Missing responses per item .................................................................................................... 54
Figure 7. Interview duration and total amount of missing items per interviewer ................................ 57
Figure 8. Size of establishment—SOEP data vs. establishment survey ................................................. 59
5
1 Introduction There is increasing consensus in the economic and social sciences that a person’s workplace or
establishment (i.e., the organizational level) plays a crucial role for life outcomes. However, for a long
time, the workplace has been only a subordinate factor as a unit of study in the German social
sciences. For this reason, interest has been growing in what is commonly known as linked employer–
employee (LEE) data sets, in which employees’ individual data are linked to information about their
employers.
The social sciences in Germany are marked by a significant lack of LEE data, especially data sets that
contain information about (a) the human resource strategies and organizational features of
establishments and (b) the social and economic situation of establishments and the attitudes and
behavior of their employees. The purpose of this project, therefore, was to fill this gap and to
generate an LEE data set containing a rich collection of information concerning both employers and
employees.
The data for this study stem from a project to produce an LEE data set for the Socio-Economic Panel
(SOEP). The SOEP is a longitudinal study of German households that are representative of the
German population, including about 20,000 individuals and 10,000 households. The information
collected in the LEE study reported here will enrich and enhance the existing individual-level and
household-level SOEP data with supplemental data about the workplace and the individual
employees’ working conditions. In contrast to the traditional SOEP survey, the LEE study provides
more detailed and independent information concerning the work context. By expanding the
household and family context to include that of the workplace, the LEE data can be of use when one
is examining such topics as the genesis of social inequalities and the individual development of the
life course. However, contexts vary not only between but also within workplaces. It can be assumed
that different groups of employees at a given establishment experience different restrictions and
opportunities (e.g., different employee groups differ in their access to further education or career
opportunities). Therefore, this study has been designed to obtain information about intra-
organizational heterogeneities such as forms of employment (part-time, full-time), temporary work,
and similar atypical forms of employment, as well as about other factors, such as gender
composition, the age of the employees, and the wage structure of the establishment, as well as the
effects of these factors on individual life outcomes.
This report is structured as follows: Chapter 2 presents a general overview of the LEE study, including
its scope, objectives, topical focus, and design—from the composition of the sample to the content
of the questionnaire(s). In Chapter 3, we describe the project in chronological order, including tasks
and development before, during, and after the data collection phase. This chapter will be of special
interest to researchers who plan to conduct a similar study or who would like to find out about the
practical challenges involved in realizing a project such as this. In Chapter 4, we discuss the outcomes
of the different sampling stages in detail and explain how we computed the response rates for the
employer survey. Chapter 5 focuses on representation and measurement and on several threats to
the quality of the data. The structure and specific features of the data are described in Chapter 6,
along with how and where to obtain the data and how the data were made anonymous to ensure
confidentiality. This section will be of interest to researchers who would like to use and analyze these
data. Finally, in Chapter 7, we discuss the merits and achievements of this project, as compared with
6
similar studies, and offer insights from our work on this survey that may prove useful in the
development of future establishment surveys.
2 General information about the study This chapter provides a broad overview of the general features of the survey, including its contents,
set-up, and design. Designated “SOEP-LEE” (The Linked Employer–Employee Study of the Socio-
Economic Panel), the study involved cooperation between the SOEP department at DIW Berlin and
Bielefeld University. The authors include Prof. Dr. Jürgen Schupp (of DIW Berlin and the Free
University Berlin) and Prof. Dr. Stefan Liebig (of Bielefeld University), who served as the principal
investigators, and Michael Weinhardt (of DIW Berlin) and Alexia Meyermann (of Bielefeld University),
who made up the scientific research staff. The project ran from January 1, 2012, to December 31,
2013, and received funding from the Wissenschaftsgemeinschaft Leibniz e. V. for these two years.
For employers approached in the field, the study was referred to as “Employers in Germany”
(Arbeitgeber in Deutschland).
2.1 Objectives and scope of the study The general and central objective of this research project was to create a linked employer–employee
data set for secondary use. The more specific objectives of the study were:
To design and carry out a representative survey of employers and workplaces;
To provide a data set of establishments that can either be used individually or be linked to
individual and household data compiled by the SOEP; and
To undertake a methodological analysis of the data collection process and of the quality of
the survey data in organizational studies.
The resulting data set is unique within Germany; no linked data set of the size and richness of the
information contained here has so far been available. The data collected in this project will
substantially augment the information available through the SOEP regarding the work contexts and
working conditions of the SOEP respondents. In addition, linking these data to the individual- and
household-level data from the SOEP will add a longitudinal dimension to the database. Thus, the LEE
data set opens up new possibilities for a wide range of secondary analyses to answer innovative
research questions from the fields of economics and social sciences, such as the effect of
interorganizational income inequalities (an organizational characteristic) on the perception of justice
with respect to overall wage differentials (an individual characteristic, as surveyed in the SOEP 2011
survey).
2.2 Topics covered in the SOEP-LEE study This project was designed to investigate social inequalities and their relation to employers and
organizations (e.g., to determine how organizational structures and practices influence social
inequality at the individual level). The SOEP-LEE survey includes important topics such as income and
career opportunities, as well as measures to achieve a balance between work and life. Within
establishments, different groups of employees are offered different opportunities and restrictions
(training, work–life balance, working hours, flexibility). The SOEP-LEE data can be used to study the
consequences of job heterogeneity in establishments with respect to inequality (i.e., different forms
of atypical employment such as temporary or temporary agency) and of personnel structures (sex,
7
age, and qualifications). The questionnaire was designed to collect information about the following
topics:
Job-specific practices and structures concerning central dimensions of inequality;
Interorganizational variance, assessed by measuring aggregated characteristics on the
organizational level, as well as intraorganizational variance (e.g., differences between groups
of employees within the establishment); and
The central dimensions of specific inequalities of interest: income, prospects of a promotion,
gratifications, opportunities to balance work and family life, work load, and work pressure.
Because our questionnaire was constructed to match the information collected in the 2011 wave of
the SOEP survey, the SOEP-LEE data set substantively enhances the information on individual work
contexts and working conditions of respondents to the SOEP survey and offers new research
opportunities in the field of organizational inequality and beyond.
A second, methodological objective of the SOEP-LEE study was to measure and analyze the quality of
the employer survey data using additional paradata (Kreuter, 2013) obtained during data collection.
Methodological research on establishment surveys has been scarce, and this project will contribute
to the further development of survey methodology in the field of organizational studies. Because the
quality of the data can and should be evaluated, we recorded a portion of the interviews as a way to
study participants’ response behavior. Paradata were also drawn from detailed contact and
interviewer forms and from a short interviewer questionnaire. All these data allowed us to analyze
the survey process from a methodological standpoint.
2.3 Previous studies and research
The design of this project was inspired by the National Organizations Survey (NOS) in the United
States, which used an employee-first approach as an addendum to the General Social Survey (GSS) in
1991. Since that time, the NOS has been repeated twice, in 2002 and in 2010. Although the NOS
studies included interviews with as many as 727 establishments, the samples were considerably
smaller than the sample used in the SOEP-LEE study. The SOEP-LEE project drew on experiences from
two earlier studies: a SOEP-based pilot study, during which the procedure was tested first in
Germany (Meyermann, Elsner, Schupp, & Liebig, 2009), and the ALLBUS establishment survey (Liebig
& Gerhards 2012), during which the design and implementation of such a study were refined. These
studies will serve as points of comparison for different steps of the survey, ranging from the design
stage to the final results.
2.4 Employee-first method: Population, sampling procedure, and sample The SOEP-LEE study differs from many other surveys in the way its sample was derived. Although it
can be thought of as a probability sample of German establishments, the sample was not drawn from
a sampling frame of establishments; rather, a random sample of employees was used as the basis for
the study. How the sample of establishments was derived from the employee sample will be
explained in the following.
In this approach, the starting point was not the establishments but individuals who worked in the
establishments (the “employee-first” method). A sample of employees who had responded to a
previous survey were asked for the name and contact details of their employers. Based on this
information, a separate establishment survey of employers was conducted. The information
8
collected from the employer survey can be matched with the survey data on the individual
employees to form a linked employer–employee (LEE) data set (Kmec, 2003).
A model for the LEE studies was the National Organizations Survey (NOS, 1991, 2002). (Table 1
compares three previous employee-first LEE studies.) In the GSS of 1991, all the people who took
part in the survey and who were employed at that time were asked to provide the names and
addresses of their employers (in 2002, only part of the GSS sample was used). In the case of larger
organizations, the immediate local branch or office in which the person in question was working was
targeted. This contact information formed the basis of a separate, autonomous telephone study that
focused on those particular establishments. After information had been collected from the
establishments, it was matched to the information on the individual level that had initially been
collected through the GSS, resulting in a linked employer–employee data set (see Kalleberg et al.
1996; Smith et al. 2004). This method allowes to link about half the NOS data regarding individual
respondents (51% in 1991 and 48% in 2002) to the corresponding establishment data.
In contrast to other LEE data sets, the linked NOS data do not conform to the classic hierarchical data
structure because information was available for only one respondent per establishment. At the same
time, the data set is cross-sectional in nature and does not lend itself to an analysis of trends over
time, unlike the LIAB data (Linked employer-employee data of the IAB). Still, it allows to analyze the
structures and processes that define establishments and that are relevant to a wide range of social
and economic phenomena. By combining these two sources of information, much more information
became available than would have been possible from the individual-level data alone. Information
regarding the establishments was surveyed independently to avoid any bias resulting from the
individuals’ subjective perceptions (Gupta, Shaw, & Delery, 2000).
The SOEP-LEE project followed the NOS example to generate a linked employer–employee sample
using the employee-first method. In 2012 all dependent employees in the SOEP sample were asked
to provide contact information of the local employer they had been working for in 2011. (In the
month of the SOEP interview, self-employed persons were excluded.) The response rate was
approximately 85 percent (N = 6,549) (see Section 4). These employer contact data formed the basis
of a standardized employer survey conducted separately from the rest of the SOEP. For the study, it
was decided that the population of interest should consist of all establishments in Germany that had
at least five employees and that the number of employees should not be fewer than five so that the
employee who provided the employer’s contact information could remain anonymous. Before the
addresses were turned over to the interviewers, a multilayered address validation process was
undertaken to be sure that the addresses provided by the SOEP respondents were valid.
Use of the employee-first method resulted in a highly heterogeneous sample of employers.
Employers throughout Germany across all types of businesses from the private, public, and tertiary
sectors (associations and foundations) were interviewed. The establishment survey resulted in 1,708
successful interviews. The information on the employers could then be linked back to the individual
and household data obtained in the SOEP study. The whole data collection procedure, including all
the steps involved, is described in more detail in Section 3.
9
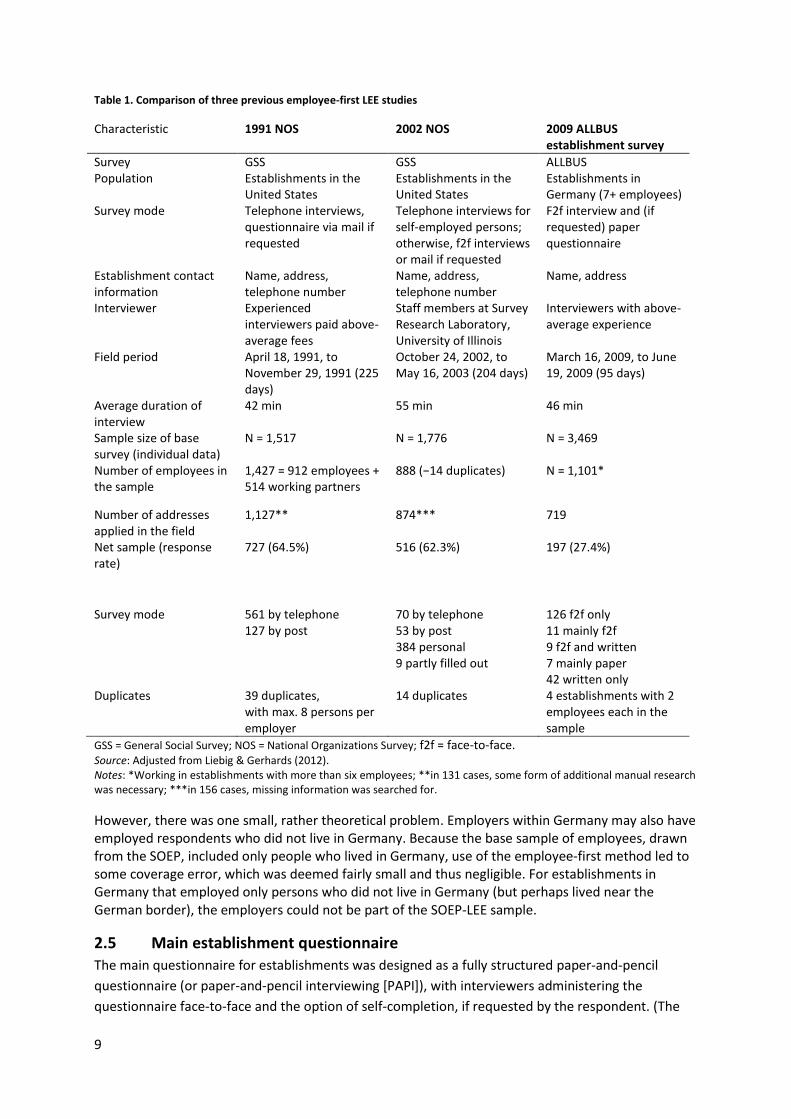
Table 1. Comparison of three previous employee-first LEE studies
Characteristic 1991 NOS 2002 NOS 2009 ALLBUS establishment survey
Survey GSS GSS ALLBUS Population Establishments in the
United States Establishments in the United States
Establishments in Germany (7+ employees)
Survey mode Telephone interviews, questionnaire via mail if requested
Telephone interviews for self-employed persons; otherwise, f2f interviews or mail if requested
F2f interview and (if requested) paper questionnaire
Establishment contact information
Name, address, telephone number
Name, address, telephone number
Name, address
Interviewer Experienced interviewers paid above-average fees
Staff members at Survey Research Laboratory, University of Illinois
Interviewers with above-average experience
Field period April 18, 1991, to November 29, 1991 (225 days)
October 24, 2002, to May 16, 2003 (204 days)
March 16, 2009, to June 19, 2009 (95 days)
Average duration of interview
42 min 55 min 46 min
Sample size of base survey (individual data)
N = 1,517 N = 1,776 N = 3,469
Number of employees in the sample
1,427 = 912 employees + 514 working partners
888 (−14 duplicates) N = 1,101*
Number of addresses applied in the field
1,127** 874*** 719
Net sample (response rate)
727 (64.5%) 516 (62.3%) 197 (27.4%)
Survey mode 561 by telephone 127 by post
70 by telephone 53 by post 384 personal 9 partly filled out
126 f2f only 11 mainly f2f 9 f2f and written 7 mainly paper 42 written only
Duplicates 39 duplicates, with max. 8 persons per employer
14 duplicates 4 establishments with 2 employees each in the sample
GSS = General Social Survey; NOS = National Organizations Survey; f2f = face-to-face. Source: Adjusted from Liebig & Gerhards (2012). Notes: *Working in establishments with more than six employees; **in 131 cases, some form of additional manual research was necessary; ***in 156 cases, missing information was searched for.
However, there was one small, rather theoretical problem. Employers within Germany may also have employed respondents who did not live in Germany. Because the base sample of employees, drawn from the SOEP, included only people who lived in Germany, use of the employee-first method led to some coverage error, which was deemed fairly small and thus negligible. For establishments in Germany that employed only persons who did not live in Germany (but perhaps lived near the German border), the employers could not be part of the SOEP-LEE sample.
2.5 Main establishment questionnaire
The main questionnaire for establishments was designed as a fully structured paper-and-pencil
questionnaire (or paper-and-pencil interviewing [PAPI]), with interviewers administering the
questionnaire face-to-face and the option of self-completion, if requested by the respondent. (The
10
full version of the original questionnaire, as well as an English translation, can be found in TNS
Infratest Sozialforschung (2016). The questionnaire was designed to measure the role organizations
play as both contexts and actors in the generation of social inequality. Hence, measures of inequality
between and within organizations were addressed, taking into account additional information
available from SOEP on the individual level.
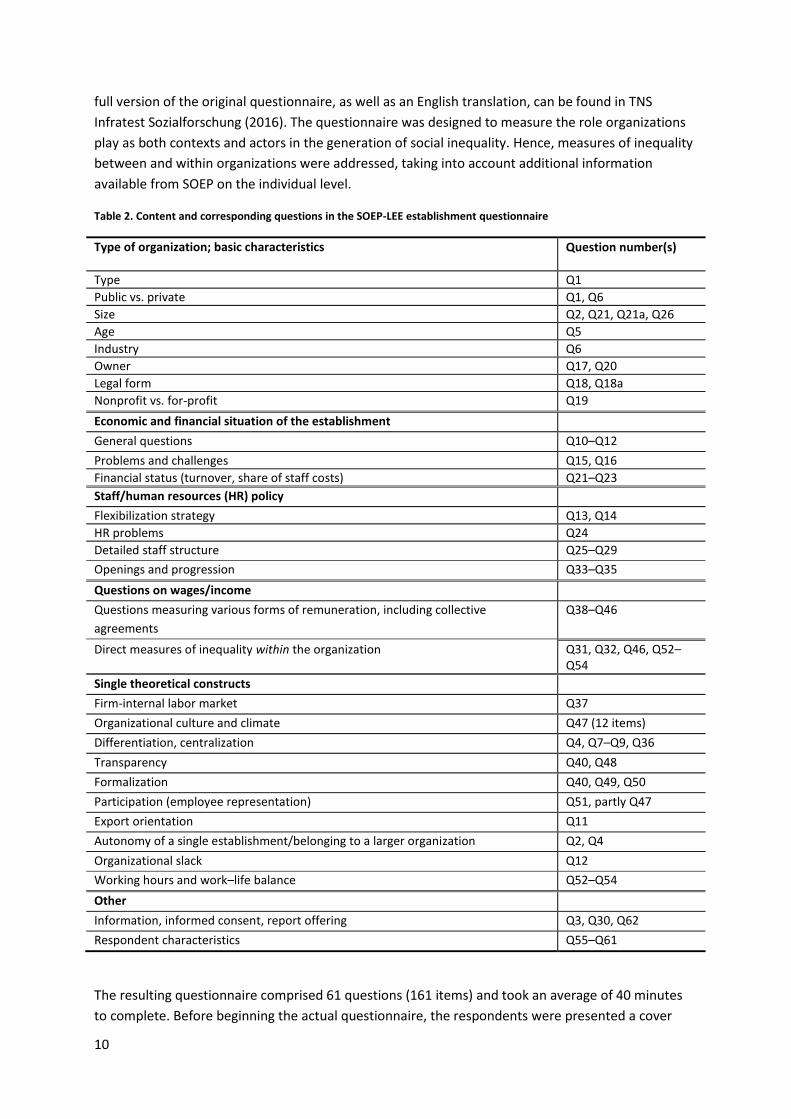
Table 2. Content and corresponding questions in the SOEP-LEE establishment questionnaire
Type of organization; basic characteristics Question number(s)
Type Q1
Public vs. private Q1, Q6
Size Q2, Q21, Q21a, Q26
Age Q5
Industry Q6
Owner Q17, Q20
Legal form Q18, Q18a
Nonprofit vs. for-profit Q19
Economic and financial situation of the establishment
General questions Q10–Q12
Problems and challenges Q15, Q16
Financial status (turnover, share of staff costs) Q21–Q23
Staff/human resources (HR) policy
Flexibilization strategy Q13, Q14
HR problems Q24
Detailed staff structure Q25–Q29
Openings and progression Q33–Q35
Questions on wages/income
Questions measuring various forms of remuneration, including collective
agreements
Q38–Q46
Direct measures of inequality within the organization Q31, Q32, Q46, Q52–Q54
Single theoretical constructs Firm-internal labor market Q37
Organizational culture and climate Q47 (12 items)
Differentiation, centralization Q4, Q7–Q9, Q36
Transparency Q40, Q48
Formalization Q40, Q49, Q50
Participation (employee representation) Q51, partly Q47
Export orientation Q11
Autonomy of a single establishment/belonging to a larger organization Q2, Q4
Organizational slack Q12
Working hours and work–life balance Q52–Q54
Other
Information, informed consent, report offering Q3, Q30, Q62
Respondent characteristics Q55–Q61
The resulting questionnaire comprised 61 questions (161 items) and took an average of 40 minutes
to complete. Before beginning the actual questionnaire, the respondents were presented a cover
11
sheet and a page containing general information. This introductory material included information
about the establishment and about the person within the establishment at which the questionnaire
was directed, general instructions for filling out the questionnaire, information about the topics
covered, an assurance of data confidentiality, and contact information if respondents had queries
regarding the study. This initial section was particularly important in cases of self-administered
interviews.
The establishment questionnaire was divided into seven sections:
Basic workplace information (Allgemeine Angaben);
Economic situation and human resource policies (Wirtschaftliche Situation und
Personalpolitik);
Personnel statistics (Fragen zur Personalstatistik);
Career and income (Karriere und Einkommen);
Work organization (Arbeitsorganisation); and
Final comments (Abschließende Angaben).
In addition, the SOEP offers rich information on a wide range of inequality dimensions, such as health
and income. Social and economic characteristics (personal finances) are included, as are measures of
attitudes and personality traits. This information can be analyzed in conjunction with the
establishment data after the two data sources have been linked (see Section 6.4). For more detailed
information on the topics addressed by the questionnaire and the constructs underlying specific
operationalizations, see Table 2. At the end of the questionnaire, some basic information about the
respondent was also requested, including position within the establishment, tenure, age, sex, and
education. This information can also be used for methodological analyses of the response process.
Section 3.2.3 provides a descriptive analysis of these data.
2.6 Questionnaire mode
A mixed-mode design was realized by combining interviewer-administered and self-administered
paper questionnaires, the former being the main and default mode. We chose face-to-face
interviewing over other modes, such as telephone interviewing or postal survey, based on the
positive results in the ALLBUS-BB study and the expectation that this strategy increases the response
rate. Only those establishments that were already participating were in certain cases given the
opportunity to choose self-administration of the paper-and-pencil questionnaire in order to prevent
refusals. Here, two different cases can be distinguished:
(1) Establishments could fill out the questionnaire on their own if they were reluctant to be
interviewed face-to-face (e.g., because of time constraints). In these cases, a paper questionnaire
was dropped off at the establishment by the interviewer and picked up again within a few days after
it had been completed.
(2) If the questionnaire could not be finalized during the face-to-face visit with the interviewer, the
respondent could switch to the paper-and-pencil mode during the interview itself. In these cases, a
(full) paper questionnaire was left at the establishment for the respondents to complete it
themselves. Based on the experience of the fieldwork organization, this option appears to be
common in establishment surveys in Germany. Informants could then have the chance to look up
information and complete the form. The face-to-face-interviewers were responsible for dropping off
12
and collecting the paper questionnaires and sending them back to the fieldwork team of the survey
agency.
The mode of completion was distributed as follows: 1,136 interviews (67.1%) were conducted orally
in face-to-face interviews; in 427 cases (25.2%), the interviewers left the paper questionnaires to be
filled out later by establishment personnel; and 131 interviews (7.7%) were in part conducted as oral
interviews and in part filled out by establishment staff. This distribution is in line with the intention of
the survey design. With regard to the people involved during the response process, in the vast
majority of cases (1,459; 86.0%), the questionnaires were completed by only one person, whereas
more than one person was involved in 160 cases (9.4%).1
2.7 Paradata: Contact form, interview form, interviewer questionnaire
In addition to the main questionnaire, which was addressed directly to the responding
establishments, we used three other forms: a contact form; an interview form in which interviewers
were asked to rate their experience during the interview; and an interviewer questionnaire, which
was used to collect information about the interviewer workforce. These documents will now be
described in detail.
2.7.1 Documenting the contact process: Contact forms
The contact form included twelve questions (two pages on one sheet of paper) and served two main
purposes:
First, the contact form was designed to aid the interviewer in the process of locating and identifying
the correct establishment. The contact form included the establishment’s address as provided by the
SOEP respondents. Despite a thorough validation procedure, the collected addresses could still be
prone to errors or the establishment might have relocated. Therefore, one of the field interviewers’
tasks was to locate the correct establishment, which sometimes required further research (e.g.,
asking neighbors or using the Internet). One question on the contact form involved reporting the
measures taken by the interviewer to locate the correct establishment. Also included was a question
about the number of people employed by the establishments to ensure that none with fewer than
five employees was asked to participate (i.e., only eligible units were to be interviewed).
Second, the contact form reiterated the designated main respondent within the establishment. This
information not only served as a guide for the interviewers but also helped to control and to
document their work to ensure that the data collection process could be compared across
interviewers. Interviewers were asked to record the time and mode of the contact attempt and to
comment on any difficulties they encountered. Unfortunately, owing to limitations by the fieldwork
organization, it was not possible to document more than five contact calls (the first four contacts and
then the final one). Once the establishment was located successfully, interviewers were asked to
speculate about the type of establishment. These interviewer observation data could be used for
analyses of nonresponses and possibly nonresponse adjustments. Interviewers were paid for filling
out the contact form and sending it back.
1 For 37 interviews (2.1%) information about the mode of completion was missing. In 77 cases (4.5%) there was
no information about the number of persons involved in completing the questionnaire.
13
2.7.2 Documenting the interview process: Interview form and audio recordings
For each interview they completed, the interviewers were asked to fill out a short form concerning
the interview experience. This enabled us to learn more about the interview process within
establishments and about any quality issues that might arise at this stage of the establishment
survey. The form (three pages and a cover sheet) consisted of 14 questions (17 items) concerning the
response process within the establishment. The cover sheet provided instructions to the interviewer
(e.g., to fill out the form immediately after the interview). To motivate interviewers to comply, the
form also explained the reasons for gathering these paradata and their value to the researchers.
Specifically, the interview form solicited the following information:
Mode of data collection: Face-to-face interview, self-administered, or a combination of the
two, as well as a list of the self-completed items;
Number of visits necessary to complete the interview;
Respondents within the establishments: Difficulties in identifying and selecting a suitable
informant within the establishment, how many respondents were involved in each interview,
and the accuracy and depth of their responses;
Details regarding two individual, selected questionnaire items: Whether the interviewer had
difficulties and whether any records/files or coworkers were consulted during the response
process; and
Information about any disruptions during the interview, as well as general comments and
remarks on the interview process.
Interviewers were paid for each interview form they filled out and sent back. Some descriptive
results from this questionnaire can be found in Section 5.2.3 on data quality.
To further facilitate our study of the response process, we arranged for 31 survey interviews to be
audiotaped. Prior to the fieldwork, interviewers were provided with additional training materials on
the use of audio recording devices. During the fieldwork, 109 experienced interviewers were
entrusted with an audio recording device. Permission to audiotape the interview was requested from
the respondents, and their consent had to be recorded. Interviewers were paid for the additional
effort of taping. Although the original goal was to obtain 100 audiotapes, obtaining consent to record
from survey respondents proved to be rather difficult. Although other surveys, especially the
Programme for the International Assessment of Adult Competencies (PIAAC), have reported few
problems in recording survey interviews, the survey agency reported that respondents often refused
to be audiotaped during the interviews.
After the data were collected, several steps were taken to ensure the confidentiality of any audio
recordings, and all personal information (e.g., names and regional information) was deleted by the
fieldwork organization. The SOEP-LEE team anonymized the data further so they could be archived
and made available for secondary use. Although the audio sample was too small for a quantitative
analysis of individual questions, it can be used qualitatively to study the response process by
providing anecdotal evidence of problems and challenges pertaining to particular topics or questions
and can reveal otherwise hidden mechanisms and problems in the current response process.
Behavior coding can be used to analyze the response process during the course of the interviews.
Transcripts from the audio recordings will be provided on request for further analysis by survey
methodologists so that future studies may benefit from our questionnaire design process.
14
2.7.3 Documenting the interview staff: Interviewer questionnaire
Finally, interviewers were asked to fill out a questionnaire about themselves. Participation in this
interviewer survey was voluntary; interviewers were not paid for responding to this questionnaire,
which was sent out along with all the other materials on July 27, 2012. The overall response rate for
this interviewer survey was 71.6 percent; for interviewers who successfully interviewed at least one
establishment, the response rate was 79.9 percent.
The questionnaire (four pages on two sheets of paper) consisted of 15 questions (39 items) and
covered the following topics:
Interviewer experience and experiences with establishment surveys;
Attitudes to data protection;
Personality traits;
Job-related questions: Working hours, employment status, industry, etc.;
Sociodemographic characteristics (sex, age, formal education, income); and
Internet usage.
This information allowed us to analyze correlations between interviewer characteristics and
establishment survey outcomes (e.g., unit and item response rates, features of the contact process
or the interview situation). However, it should be noted that this interviewer survey included
potentially sensitive questions (e.g., those concerning personality traits and income) that the
interviewers might have been reluctant to answer, especially because the survey agency (their
employer) was responsible for collecting and processing this information.2 For this reason, the
responses to three items regarding “conscientiousness,” for example, might have been positively
biased. However, since most of the items were relatively less sensitive in terms of the employer–
employee relationship, the data collected about the interviewing staff who worked on the SOEP-LEE
study should be considered valid and valuable information.
2.8 Summary
In this section, we provided an overview of and some general information about the SOEP-LEE study
to help orient potential users of the data. We discussed the objectives and scope of the study,
including the topics covered, previous studies, and the research on which the study was built, the
sampling procedure, the “employee-first” method, and information about the main establishment
questionnaire and its mixed-mode design. In addition, paradata were collected regarding the survey
and the response process, from which a range of quality indicators can be derived. Besides
contributing to survey methodology as such, these indicators of data quality serve various other
purposes, such as facilitating the interpretation of results for secondary users and as an aid in future
design optimization.
2 The project team proposed that these interviewer questionnaires be processed separately in a different
department of the survey agency, apart from the survey data. Unfortunately, the survey agency could not be
convinced of the value of this additional effort, so we were unable to implement this distinct processing.
15
3 Project planning and development This section describes in greater detail the organizational aspects of the project and how it developed
chronologically. For the (field) outcomes and an evaluation of the data collected, please refer to
Sections 5 and 6.
3.1 Pre–data collection phase The following steps were taken before the actual data could be collected from the establishments.
Address information for their employers was collected from employees among the SOEP participants;
these addresses were verified and validated; the questionnaire (including a pretest) was designed;
and the data collection phase was planned (e.g., support material was prepared for the interviewers
and respondents).
3.1.1 Collection of employers’ addresses from SOEP participants
Because the overall goal of the project was to complement the SOEP survey information about
individuals and households with information about their employers, the 2011 SOEP respondents who
were employed (abhängig beschäftigt), and specifically the organizations that employed them,
became the target population for the SOEP-LEE study. Thus, the gross sample of the employer survey
consisted of all employers who had at least one employee who had participated in both the SOEP
surveys of 2011 and 2012. Employers were defined as the local workplace of the employee, not the
whole organization (e.g., in case of multi-establishment companies). To address issues concerning
data protection, the sample was restricted to employers with a minimum of five employees.
Consequently, as part of the SOEP 2012 survey, respondents were asked for the name and address of
their employer in 2011 if they had taken part in the SOEP 2011 and had been recorded as employed
back then. In addition to the standard SOEP questionnaire, a paper-and-pencil questionnaire (four
double-sided pages) requesting their employers’ name and address was handed to these specific
SOEP participants (see Bechmann & Sleik 2016). To avoid problems due to fluctuation since the last
wave, respondents were asked for this information in 2011, during the month in which they had
been interviewed. Besides its comprehensive instructions, and to ensure that the above-mentioned
criteria were adhered to, the address questionnaire asked about the respondents’ employment
status at the time of the interview in 2011 and the number of employees of the establishment the
respondents worked for at the time.3 For methodological reasons, this questionnaire also required
the date and mode of the interview and a space for comments and remarks.
Unfortunately, some of these address questionnaires were not returned to the survey agency. The
reason for this is not clear, but perhaps the respondent forgot to fill out the address questionnaire or
overlooked the extra form, or both, which is a downside of presenting it on a separate sheet of
paper. However, because funding was not available until late in 2011, the design and programming
for the main SOEP questionnaire had already been completed when the address questionnaire was
3 The establishment address questionnaire was handed to every person recorded as employed in 2011 who still
took part in the SOEP in 2012. In the SOEP, only information on the size of the whole employer organization
was available, not the single establishment. Hence, the address questionnaire asked for the size of the actual
establishment at which respondents worked in order to be able to select only establishments with more than
five employees for the following steps of the study.

16
drafted, which led to the decision to include it as a paper addendum. Of the 9,804 original employees
who took part in the SOEP 2012 survey, 9,261 respondents (94.5%) provided the address
information, either themselves or through the interviewer. Among those respondents who returned
the questionnaire and were eligible for the study (i.e., were not self-employed and were employed in
establishments with at least five employees), 85.2 percent responded to the request for their
employer’s name and address. A total of 6,549 employer addresses were collected; the resulting list
constituted the gross sample for the subsequent establishment survey once the addresses were
checked and validated.
3.1.2 Verification and validation of employer addresses
The goal of the address verification and editing step was to generate a definitive list of addresses (the
gross sample) of all workplaces that should be contacted to request an interview. At this stage,
validation (address editing) was necessary for quality assurance so the invitation letters could be sent
by mail and so the first face-to-face contact in the field could be attempted by the interviewers.
Ideally, telephone numbers were also included. The addresses supplied by the SOEP 2012 survey
respondents had to be checked thoroughly to be sure they were not incomplete or incorrect as a
result of deliberate or inadvertent errors or merely a lack of knowledge. Moreover, some
establishments might have turned out to be ineligible because they had fewer than five employees or
were located outside Germany. Finally, simple misunderstandings on the part of the interviewers
and/or interviewees might also have led to false or erroneous data.
A further difficulty in the collection of employer addresses was the extended fieldwork period of the
SOEP-Core study. In each wave, typically around 80 percent of all SOEP interviews took place
between February and May of the corresponding calendar year, but it could take until October of the
same year to complete the remaining interviews. Thus, the SOEP survey was still under way in the
field when the validation process was begun and continued through several steps. Also, not all
addresses were fielded in the beginning of the field period but instead were processed at some later
point, resulting in batches of addresses being fielded at different points in time.
Prior to the checking procedure, the following cases were excluded: addresses of 800 employers who
were ineligible because the SOEP respondent who provided them had been self-employed in 2011,
and 489 enterprises with fewer than five employees (based on statements made by the SOEP
respondents). The resulting sample contained 6,549 addresses that had to be validated and checked
for duplicate entries. After the removal of 505 duplicates, 5,919 organizational entities were
identified, and the contact details were used to construct the employer sample.
Three external sources were used to verify whether an address existed, had to be corrected, or had
to be discarded completely: (1) the list of German municipalities from official statistics, including
their postal codes; (2) a georeferencing tool by which addresses could be matched to geocodes; and
(3) lists of telephone numbers from official registers and professional providers. In a reiterative
process, the survey agency matched this information to the addresses provided by the SOEP
respondents. When matches were not possible, the addresses were inspected manually for errors.
These validation steps will now be described in detail.
1. Because linking the municipality codes derived from official statistics often failed because of
missing or false postal codes, the correct codes had to be inserted based on reasonable
17
assumptions. In most cases, errors involved transposed numbers and could easily be
corrected.
2. In a second validation step, the collected addresses were geocoded using the full address.
Again, if no linkage was possible, addresses were inspected for obvious errors, such as wrong
street names, and were corrected manually. Here, mainly typos or wrong labels, such as
Straße instead of Weg, were revised. After these manual adjustments, addresses without
linked geocodes were geocoded a second time. A total of 94 addresses could not be matched
to an official municipality code based on postal codes, and 261 could not be linked to a
geocode based on the full address. The remaining cases were subjected to further manual
checks. Eventually, 125 addresses could not be used because either the information from the
SOEP employees was simply incomplete or wrong (72 cases), because during the validation
procedure it was found that the establishment had fewer than five employees (23 cases), or
because the address was outside Germany and therefore beyond the reach of the survey
organization’s field operations (30 cases).
3. Unlike the two previous steps, the third step of the validation procedure did not focus on the
addresses but rather on the telephone numbers of the establishments. In addition to
professional research tools and external service providers who made telephone numbers
available to market research companies, we made use of telephone directories and other
public registers. Overall, telephone numbers were identified for all but 425 addresses.
Previous experience indicated that the addresses should be edited by qualified personnel who were
trained specifically for this purpose (Gerhards & Liebig 2012). In the ALLBUS-BB study, which
employed a similar design, 240 addresses were found automatically, but 551 were found manually.
For this reason, an automatic address search alone did not appear to be feasible for the SOEP-LEE
study, so this task was delegated to the survey agency, which had some experience in validating
addresses. To ensure the quality of their work, the SOEP-LEE project team double-checked a sample
of 100 addresses that were validated through the automated procedure using georeferencing and
then manually researched the listed establishments. These addresses were sampled from the first
batch of 2,125 eligible addresses returned to the survey company by early SOEP respondents. Of
these, 1,865 addresses could be identified through the automated procedure while 260 addresses
had to be researched manually. In all but one case, the addresses could be identified and the name
of the employer given by the respondent matched that identified through the manual check-up; in
the single remaining case, the picture was more complicated. In the space for inserting “employer,”
the respondent wrote “Schulamt” (meaning “supervisory school authority”), but the address was
that of a school, so most likely the respondent was a teacher at that school and inserted “Schulamt”
instead of the actual name of the employer. In this case, the stated address (i.e., the school) would
be considered the establishment of interest and would also be the address to which the interviewer
would be sent. Overall, however, the method of address validation by matching municipality codes
and geocodes appears to have worked well, with the corresponding establishments identified
successfully on manual check-up in all but one case.
In order to control the manual validation and editing process undertaken by the survey company, we
randomly sampled 100 addresses from the first batch of 260 addresses that could not be validated
automatically. In eleven cases in which the manual research identified an establishment, some
differences emerged (e.g., different postal codes or street numbers) between the manual researches
done by the SOEP-LEE team and those done by the survey agency (note that it was not possible to

18
determine which of the results was the “true” address.). However, it seemed likely that the
interviewer would eventually have arrived at the same location regardless of which source provided
the information. In one case, the respondent gave two separate addresses, but this difficulty was
resolved by contacting the one that appeared first on the address sheet. In six cases, the survey
agency thought that no establishment could be identified with the given information; for two of
these cases, the SOEP team agreed with this decision, but for the remaining four cases, the SOEP
team believed that the establishments were identifiable (two clearly and two with some doubt).
Overall, the difference between the two manual researches was small and appeared negligible when
an establishment was identified. However, all agreed that it was important for the project team to
double-check all addresses that had been deemed unidentifiable by the survey company.
There was one limitation to the way the address editing procedure was applied here. The automatic
checks focused on whether an address existed at all rather than on identifying and verifying the
presence of an establishment at that address. Thus, although a validated address might exist, one
could not be certain that the establishment actually existed at that address. Such an error was
detectable only by the field interviewer, who in such cases had to do additional research. Because of
this, it was important for interviewers to document their course of action when they detected false
addresses; the contact form was designed to accommodate this situation (see Section 2.7.1), and the
interviewer training material covered such situations as well.
3.1.3 Study and questionnaire design
For the purpose of study development and conceptualization, we conducted a literature review, had
discussions within the scientific team, and gave presentations at several colloquia. In addition, two
international mailing lists were used to locate methodological experts and consult with them by mail.
During a review workshop that took place in March 2012, the initial concept for the study design was
discussed with and evaluated by experts.4 The invited experts were from several fields of research
and had methodological experience with data collection in organizational studies as well as having
been involved in substantial research on organizations and inequality. Staff from the fieldwork
organization were also present. All attendees were asked to review and comment on the research
design and the questionnaire topics. As a result of the literature reviews and the expert discussion at
this workshop, several challenges relevant to establishment surveys were identified:
The key problem was low response rates. In the German IAB establishment panel, an annual
study of 16,000 establishments, response rates were only about 30 percent in face-to-face
mode and 12 percent in paper-and-pencil mode (Fischer et al. 2008). Other surveys report
similar response rates (e.g., 27% in the ALLBUS-BB study).
Nowadays, the interlocking of establishments in organizational networks or the outsourcing
of organizational functions such as reporting or human resources are becoming increasingly
4 The following experts on organizational studies from various disciplines volunteered to participate in the
workshop: Dorothea Alewell (University of Hamburg), Alexander Eickelpasch (DIW Berlin), Peter Ellguth (IAB
Nuremberg), Johannes Giesecke (University of Bamberg), Jan Goebel (DIW Berlin), Sandra Gottschalk (ZEW
Mannheim), Wenzel Matiaske (Helmut Schmidt University, Hamburg), Eckhard Priller (WZB Berlin), Daniel
Schnitzlein (DIW Berlin), Roland Verwiebe (University of Vienna), and Hendrik Vollmer (Bielefeld University), as
well as Josef Hartmann, Sebastian Bechmann, Nico Siegel, and Simon Huber of the survey agency, TNS Infratest
Sozialforschung.
19
common and widespread, making it necessary to be clear and specific about which entity
should be the focus of the study.
The identification and selection of the “most knowledgeable” person in the establishment—
that is, the one who would be asked to represent the organization—could be expected to
present difficulties.
The excessive use of abstract and/or industry-specific terminology in establishment
questionnaires could render them difficult to comprehend.
Possible mismatches between the information requested and the information available at
the establishment (due to diverging reference periods or different levels of accuracy in the
way information is stored and managed in the organizations) might also present challenges.
Given these potential problems, we felt that it would be important for establishments to be highly
motivated to participate in the SOEP-LEE survey, and the best way to persuade them was by
engaging well-trained and experienced interviewers. The fieldwork organization recommended
personal, face-to-face interviewing for two reasons: first, this approach was likely to yield higher
response rates, and second, in their view, the questionnaire included complex questions that would
be too difficult to answer over the telephone.
3.1.4 Questionnaire development: Designing questions for establishment surveys
The schedule for developing the questionnaire was tight because the survey was to start in early
August 2012, so the questionnaire had to be finalized by mid-July. The first draft version was
discussed at the expert workshop in March 2012; a second version was used in cognitive interviews
conducted by project members; and a third version was piloted by the fieldwork organization in June
2012. In addition, numerous rounds of discussions took place within the project team itself, as well
as among members of the survey agency and other scientific experts.
The process of designing questions for establishment surveys differs from that for individual surveys
in important ways. Characteristics specific to an organizational survey must be considered. These
include (1) the varying degrees to which organizations are dependent on and interrelated with other
organizations; (2) the varying heterogeneity of employment groups within organizations; (3) the
different terminologies used by different types of establishments (especially with respect to industry
and size); and (4) the fact that information is provided by proxy respondents who provide
information on behalf of the organization rather than as individual, independent informants.
The first point is particularly challenging on both the theoretical and the practical level. Often,
establishments are not independent, autonomous entities but rather are part of a larger organization
or even a group or network of organizations. In such cases, institutional boundaries become blurred,
and problems can arise when information is gathered and recorded indirectly someplace other than
at the establishment being sampled (e.g., the head office of the organization) or when information is
not available about that specific establishment (e.g., rates of turnover) but rather at a more
aggregate level. The questionnaire includes several questions to measure an establishment’s
dependency on or interrelatedness with the larger organization (see Table 2, Q1, Q2, Q4).
In addition, this establishment survey was not intended to focus on a certain branch or size; it was
intended to include the entire universe of establishments in all their diversity, including all sectors,
branches, and sizes. Hence, we did not expect all the questions to be similarly relevant for all
establishments. One obvious example is the question concerning business volume, which differs
20
considerably among such establishments as retail industries (e.g., supermarkets), businesses in the
financial sector, and public schools. However, we could not create complex filter structures or
tailored questionnaires that would contain different wording for different establishments because
this was not a computer-assisted survey. Still, some questions included filters, special instructions, or
special response options to account for this issue (e.g., Q18a, Q21a). Also, in consideration of the
heterogeneity of the target population, certain questions were formulated in a certain way (e.g.,
Q49, Q52, Q53, and Q54) depending on whether the question applied to all employees or only some
of them. Clearly, some establishments would still find it difficult to correlate their specific situation
with the questions being asked. Whether or not the questions were acceptable in general was tested
through cognitive interviews and a pretest conducted under field conditions.
3.1.5 Pretest: Cognitive interviews
In order to detect problems related to comprehension (language/terminology, length of sentences,
concepts, definitions), completeness (e.g., lists of categories), availability of records, and the
comparability of requested and recorded data, the first version of the questionnaire was tested in
five cognitive interviews. Cognitive interviewing is used to investigate the response process by doing
the interview and probing the respondents on their thoughts about the questions and how they
would compose the answers in their minds (see Willis 2004 for a detailed method description and its
use in establishment surveys). Furthermore, the use and usefulness of instructions were tested, and
respondents’ general reactions to the questionnaire were recorded (e.g., signs of response burden,
interest, difficulty). Also noted were respondents’ suggestions about the questions, clarifications, and
the response task in general.
Cognitive interviews were carried out by members of the project team and were conducted with
respondents representing different industries and types of organizations.5 Owing to limited resources
and time constraints, only selected parts of the questionnaire were pretested within these
interviews. Questionnaire items chosen for the cognitive pretests were supposed to be potentially
problematic. The number of interviews and questions that could be pretested was limited, and the
questionnaire at that stage was still preliminary, so improvements to the questionnaire based on the
results of these cognitive interviews had to be kept to a minimum. Moreover, different experts
sometimes disagreed about how to word particular questions. Nevertheless, the process revealed
the complexity of the task at hand; that is, producing a single questionnaire that would be applicable
to establishments of different sizes and in different industries. These interviews helped to identify
issues and solutions for further development of the questionnaire. For future survey designs, we
recommend that cognitive interviews be conducted later in the design stage or even that two rounds
of cognitive interviews be conducted, if time allows.
3.1.6 Pretest
The major pretest (or pilot survey) was carried out in the field under “realistic” conditions from May
30 to June 13, 2012. It was intended to evaluate the questionnaire and the interview procedure,
specifically to assess the terminology used, the clarity of the wording, the filtering of the questions,
5 Chamber of crafts (Handwerkskammer, private sector), chamber of industry and commerce (Industrie- und
Handelskammer [IHK], private sector), education (public sector, as well as nonprofit and private sector), and
banking and finance (private sector).
21
the process (such as the duration of the interview), the use and usefulness of the instructions and
additional materials, the reactions of the interviewer, and general reactions. A total of 33 interviews
were conducted, 31 of them in a face-to-face mode and 2 in paper-and-pencil mode. The
establishments included three groups of different sizes (13 establishments with 10 to 49 employees,
11 establishments with 50 to 199 employees, and 9 establishments with 200 and more employees).
Five interviews were observed by project members from Bielefeld University (two) and DIW (three).
The observations, as well as the related (informal) interviewer debriefings, proved to be very helpful
for these evaluations.
The mean interview duration in the pretest was more than one hour, with the largest establishments
having the longest interviews (79 minutes, as compared with 63 and 61 minutes, respectively).
Accordingly, the questionnaire was shortened substantially. The recommendations of the fieldwork
organization (especially regarding layout, filters, instructions, and wording) were followed as far as
possible. After the pretest, the questionnaire was redesigned considerably; in particular, questions
were cut in order to meet the length requirements outlined at the project design stage.
3.1.7 Institutional support to boost response
In order to increase participation in and legitimation of the study, the research team sought support
from official bodies and institutions. During May and June 2012, the project team contacted 23
industry organizations, chambers, and trade unions by mail and telephone. Five of these institutions
eventually agreed to support the study; their names appear in the information leaflet handed to
potential respondents.6 Although such support might improve the study’s reputation and give the
appearance of serious intent, emphasizing its noncommercial background, the implication that the
participating companies or establishments might also be dependent on these supporting bodies
could have a negative effect. Without experimental manipulation, this concern remains an open
question. Yet, we contend that the attempt was worthwhile because the interviewers could allude to
this institutional support when attempting to persuade potential respondents to participate.
3.1.8 Interviewer training and payment
The tasks involved in face-to-face interviewing are manifold and demanding. For example, locating
establishments can be a burdensome undertaking, with considerable responsibility. Addresses might
not be correct, or there might be other problems such as employers having moved, changed their
name, or undergone a restructuring process. Finding the right person to interview can be difficult as
well, and there might be no person at the establishment level who has authority or information to
impart. These two problems come on top of the “usual” problems encountered during face-to-face
interviewing (related to response, refusal conversion, data collection, etc.) as carried out in individual
or household surveys. Thus, interviewers recruited for establishment studies must be thoroughly
trained. In view of the high costs of this design feature, and because the survey agency assured us
that only interviewers who were already well trained and experienced in establishment surveys
6 These supporting institutions were the Stifterverband für die deutsche Wissenschaft, the Bundesverband der
Deutschen Industrie (BDI), the Handelsverband Deutschland (HDE), the Verband deutscher Betriebs- und
Werksärzte (VdBW), the Arbeitgeberverband Pflege, and the Bundesverband Druck und Medien (bvdm).
22
would be used,7 the interviewers received no training and were provided with written training
materials only. These materials are described below.
For the development and conceptualization of such interviewer training material, a search for
training materials used in previous studies was undertaken. Although available information is scarce
(Schnell et al. 2010, 218), materials used in studies such as the European Social Survey (ESS), the
National Educational Panel Study (NEPS), and the Workplace Employment Relations Study (WERS)
are available online, and additional information on this topic can also be found in handbooks (e.g.,
Schnell 2010 et al., 218 ff.). The materials we selected comprised some general interviewer
instructions and a project-specific interviewer manual developed by the SOEP-LEE team in
consultation with the fieldwork organization, on whose behalf information was provided in a
separate document (supplementary material) on how to encourage participation
(Argumentationshilfen) and response follow-ups (i.e., procedures in case of soft refusals, e.g.,
hesitation or problems with regard to participation). The interviewer instructions (five pages) were
designed by the fieldwork organization and included information that was also part of the
interviewer handbook (i.e., general information about the study), as well as information concerning
the payment scheme applied in the SOEP-LEE study. Interviewers were paid for every successful
interview (i.e., questionnaires that were completed and sent back to the fieldwork agency), for filling
out the contact and interview forms, and for the audio recordings. The exact amounts of such
payments were unknown to the project team.
3.2 Data collection and fieldwork The task of data collection for the SOEP-LEE study was assigned to the survey institute TNS Infratest
Sozialforschung Munich. The survey was conducted in the field from the beginning of August 2012
until mid-March 2013. Personal interviewing involved a fully structured paper-and-pencil interview
(PAPI) questionnaire, with the option of self-completion if requested. As previously stated, the
questionnaire was administered face-to-face and comprised 61 questions and 161 items, which took
an average of about 40 minutes to complete (median = 40 min; mean = 42 min). All in all, 502
interviewers worked on the survey in the field, but only 397 secured interviews. Figure 1 shows the
distribution of interviews by duration and by number of interviews per interviewer.
7 Interviewers of the fieldwork organization undergo general training after their recruitment, which covers
topics such as sampling, data security, and good practices of standardized interviewing. At a later stage,
experienced and successful interviewers are trained to become special contact interviewers
(Kontaktinterviewer), who oversee other and new interviewers.
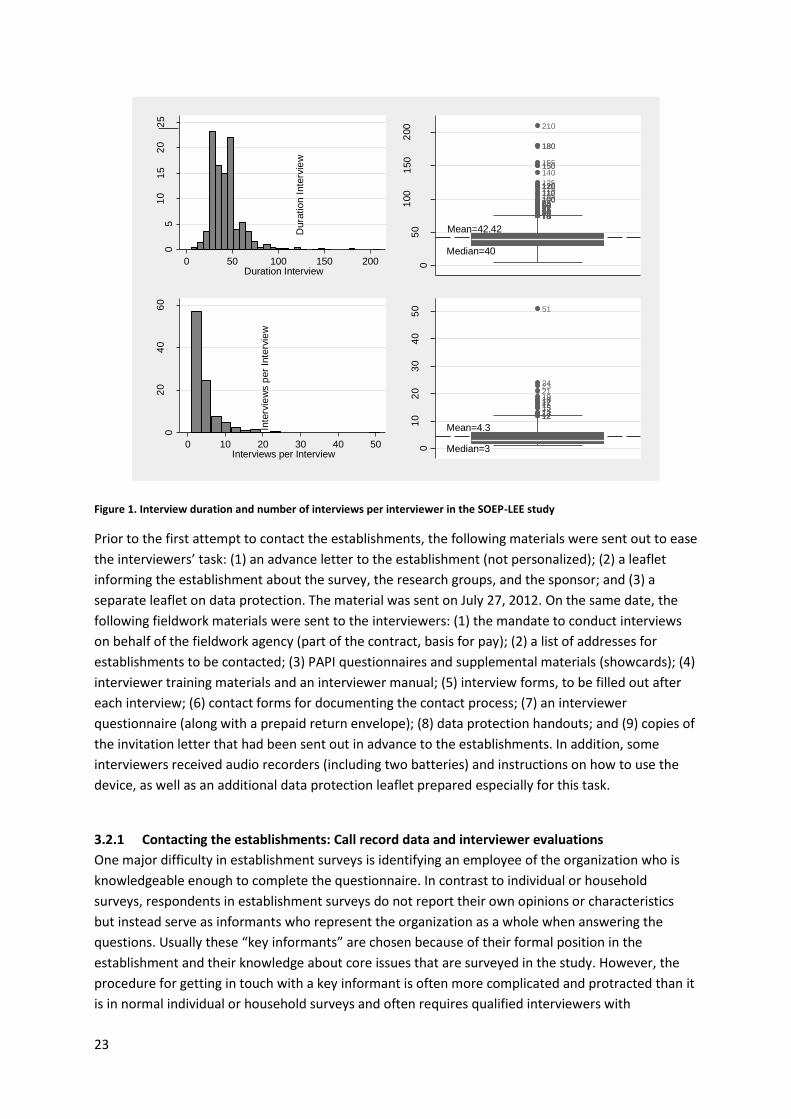
23
Figure 1. Interview duration and number of interviews per interviewer in the SOEP-LEE study
Prior to the first attempt to contact the establishments, the following materials were sent out to ease
the interviewers’ task: (1) an advance letter to the establishment (not personalized); (2) a leaflet
informing the establishment about the survey, the research groups, and the sponsor; and (3) a
separate leaflet on data protection. The material was sent on July 27, 2012. On the same date, the
following fieldwork materials were sent to the interviewers: (1) the mandate to conduct interviews
on behalf of the fieldwork agency (part of the contract, basis for pay); (2) a list of addresses for
establishments to be contacted; (3) PAPI questionnaires and supplemental materials (showcards); (4)
interviewer training materials and an interviewer manual; (5) interview forms, to be filled out after
each interview; (6) contact forms for documenting the contact process; (7) an interviewer
questionnaire (along with a prepaid return envelope); (8) data protection handouts; and (9) copies of
the invitation letter that had been sent out in advance to the establishments. In addition, some
interviewers received audio recorders (including two batteries) and instructions on how to use the
device, as well as an additional data protection leaflet prepared especially for this task.
3.2.1 Contacting the establishments: Call record data and interviewer evaluations
One major difficulty in establishment surveys is identifying an employee of the organization who is
knowledgeable enough to complete the questionnaire. In contrast to individual or household
surveys, respondents in establishment surveys do not report their own opinions or characteristics
but instead serve as informants who represent the organization as a whole when answering the
questions. Usually these “key informants” are chosen because of their formal position in the
establishment and their knowledge about core issues that are surveyed in the study. However, the
procedure for getting in touch with a key informant is often more complicated and protracted than it
is in normal individual or household surveys and often requires qualified interviewers with
05
10
15
20
25
Perc
ent
0 50 100 150 200Duration Interview
75757575757575757575757575757575757575788080808080808585858585909090909090909090909295959595100100100105110110110115120120120120120120125
140150150155
180180
210
Mean=42.42
Median=40
05
01
00
150
200
Dura
tion
Inte
rvie
w
02
04
06
0
Perc
ent
0 10 20 30 40 50Interviews per Interview
12121212131313131315151516171717181819212324
51
Mean=4.3
Median=301
02
03
04
05
0
Inte
rvie
ws p
er
Inte
rvie
w
24
experience in conducting business surveys who must expend some effort to contact the right person
within the establishment.
In order to facilitate the contact process, the fieldwork organization sends the enterprises an
advance letter and an information leaflet explaining the purpose of the upcoming survey. The
information materials were designed through collaboration between DIW and Bielefeld University
and included a sheet informing the enterprises about the organizations and institutions involved in
the project, the processing of the collected data, and the absolute confidentiality of the collected
information and how it is secured. The fieldwork started on schedule on August 1, 2012, and ended
on March 18, 2013.8 The following materials were sent to the sampled establishments by the
fieldwork organization on July 27, 2012:
An advance letter (not personalized);
An information leaflet with information about the survey, the scientific research team, and
the sponsor; and
A handout on data protection.
As an incentive to participate, establishments were promised a report on the results. In order to
receive the report, they were asked to provide an e-mail address at the end of the questionnaire.
After some preliminary analyses of the data had been conducted, the report was sent to them
electronically.
The advance letters were not personalized but instead were sent to the establishment itself. In order
to send personalized letters, we would have needed to identify the key informants beforehand (e.g.,
by telephone prescreening, which often is used in the English-speaking countries). Personalized
advance letters increase the chances that they will be read, ease the burden for interviewers, and
ensure a higher degree of standardization in the contact process, because, ideally, it is known who
reads the letter. However, a prescreening by telephone comes at considerable cost, which is why this
option was not considered for the SOEP-LEE study. Therefore, it is interesting to see whether the
advance letter was noticed within the establishment. Based on data available from the contact form,
only one in five (22%) of the establishments reported that they had received the advance letter.
Thus, sending a personalized letter is recommended. If the letter got through, an interview was
realized in almost 44 percent of the cases; if the establishment did not receive the letter, only 35
percent of the establishments answered the questionnaire. This result suggests that a letter of
introduction sent in advance could help to establish a relationship between the researcher and the
informant and in the end is likely to increase the total response rate.
In total, 502 interviewers worked on the survey overall, whereas only 397 also conducted at least one
interview. Because the SOEP-LEE study was conducted using a face-to-face mode, one central task of
the interviewer was to confirm the location of the establishment at the given address. If the given
8 Originally, the fieldwork was supposed to start earlier, but it was delayed to allow more time for the
development of the questionnaire and so as not to collide with fieldwork being conducted by the IAB
establishment panel. The latter point was emphasized by the fieldwork agency; still, from the contact data, one
can see that in some cases the establishments had just responded to the IAB panel when they were contacted
to participate in the SOEP-LEE survey.
25
address was not correct, the interviewers were instructed to execute a search on their own (e.g.,
through the Internet or directories) to find the correct address of the establishment. In the vast
majority of the cases, the given address was correct. More than 85 percent of the establishments
could be found at the address provided by the SOEP respondents, and only 7 percent of the
addresses were incorrect. In the case of an incorrect address, the preferred method of finding the
correct address was an on-site search (31%). This means that the interviewer tried to find the
establishment in the area surrounding the given address or asked people in the neighborhood if they
knew the establishment. Almost 19 percent of the interviewers tried to find the correct address with
the help of the Internet, and more than 14 percent tried to look it up in the telephone book or local
directories (e.g., the Yellow Pages). In 39 percent of the cases, the research was successful and the
interviewer was able to find the correct address.
Once the establishments were located, interviewers would attempt to arrange an interview. If this
could not take place immediately, establishments were offered the option of receiving the
questionnaire by mail in advance of the actual interview to save time; 28 percent of the
establishments accepted this offer. The data show that more than 40 percent of the establishments
that received the questionnaire in advance subsequently took part in the study. If the questionnaire
was not sent to the establishment, only 27 percent were willing to give an interview. These results
suggest that mailing the questionnaire in advance is a useful way to get in touch or even stay in
contact with the informant and to increase the chances of receiving a completed questionnaire; they
also indicate whether or not an establishment is likely to grant an interview.
3.2.2 Fieldwork progress
At the same time as the advance letter was sent out to the establishments, the interviewer materials
were submitted, and the interviewers were permitted to begin interviewing immediately after
receiving them. Thus, fieldwork effectively started at the beginning of August 2012. In order to
monitor progress in the field, the project team received monthly progress reports from the fieldwork
organization. These reports included information on current response rates and refusal codes.9
Figure 2 shows the fieldwork progress according to total number of completed interviews after each
week of fieldwork and provides an overview of the different fieldwork stages.
Overall, the survey was in the field for more than seven months. The first tranche with the vast
majority of cases (5,147) was fielded at the beginning of August. This contained all addresses
collected in the SOEP main survey until the end of June 2012. Because data collection in the SOEP-
Core continued until late summer, not all addresses were available at the beginning of August, and a
second tranche of 772 additional addresses from the remaining SOEP respondents was fielded on
October 25, 2012. In order to increase the response rate, a set of 561 addresses from soft refusals
was reissued on November 6, 2012, and yielded 104 interviews (conversion rate = 19.5%).10 At the
9 Information by sample points, region, or interviewer was not provided.
10 It was decided that cases with the following outcome codes would be reissued: “Establishment cannot be
located” if the address was validated through the survey agency beforehand; “No appointment was possible
within fieldwork period”; “Refusal to name response person”; “Lack of competence or authority (e.g., referral
to headquarters)/Participation not authorized/Advised by higher authority”; “Contact attempts with response
person not successful, difficulties in communication, complex structures, refused already, participated
already.”
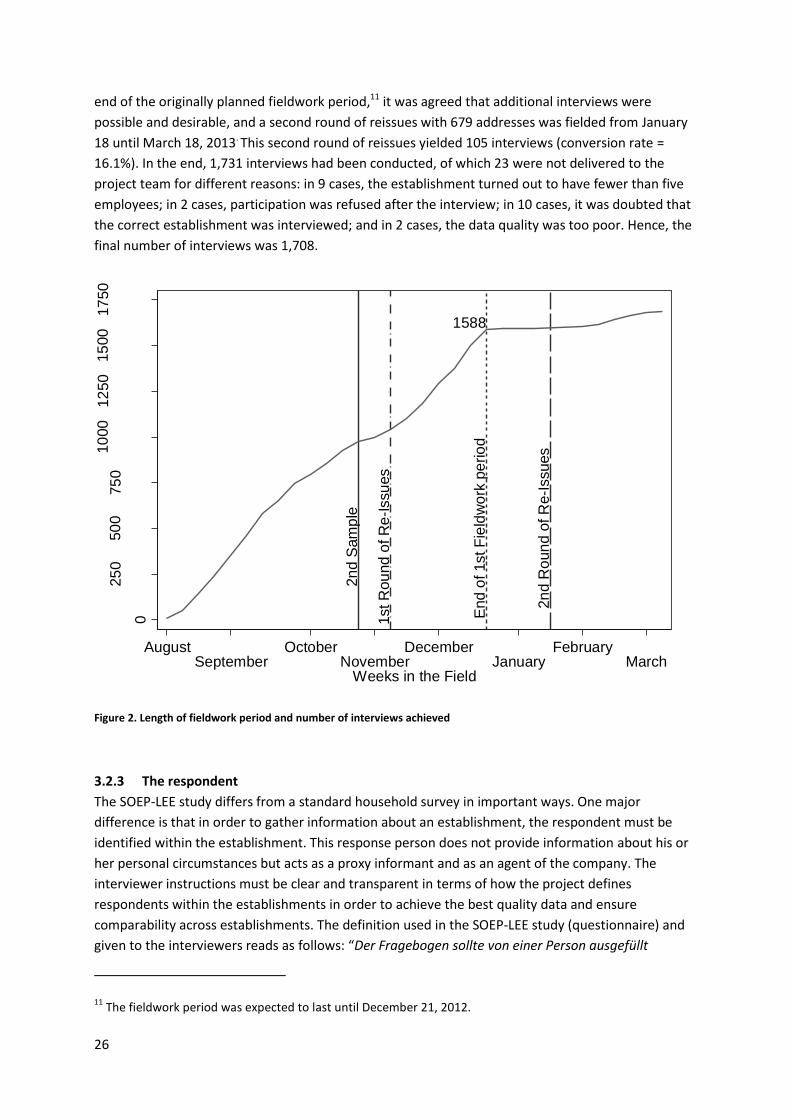
26
end of the originally planned fieldwork period,11 it was agreed that additional interviews were
possible and desirable, and a second round of reissues with 679 addresses was fielded from January
18 until March 18, 2013. This second round of reissues yielded 105 interviews (conversion rate =
16.1%). In the end, 1,731 interviews had been conducted, of which 23 were not delivered to the
project team for different reasons: in 9 cases, the establishment turned out to have fewer than five
employees; in 2 cases, participation was refused after the interview; in 10 cases, it was doubted that
the correct establishment was interviewed; and in 2 cases, the data quality was too poor. Hence, the
final number of interviews was 1,708.
Figure 2. Length of fieldwork period and number of interviews achieved
3.2.3 The respondent
The SOEP-LEE study differs from a standard household survey in important ways. One major
difference is that in order to gather information about an establishment, the respondent must be
identified within the establishment. This response person does not provide information about his or
her personal circumstances but acts as a proxy informant and as an agent of the company. The
interviewer instructions must be clear and transparent in terms of how the project defines
respondents within the establishments in order to achieve the best quality data and ensure
comparability across establishments. The definition used in the SOEP-LEE study (questionnaire) and
given to the interviewers reads as follows: “Der Fragebogen sollte von einer Person ausgefüllt
11 The fieldwork period was expected to last until December 21, 2012.
2n
d S
am
ple
1st R
ou
nd
of R
e-I
ssu
es
End
of 1st F
ield
wo
rk p
erio
d
2n
d R
oun
d o
f R
e-I
ssues
1588
0
25
050
075
010
00
12
50
15
00
17
50
Inte
rvie
ws
AugustSeptember
OctoberNovember
DecemberJanuary
FebruaryMarch
Weeks in the Field
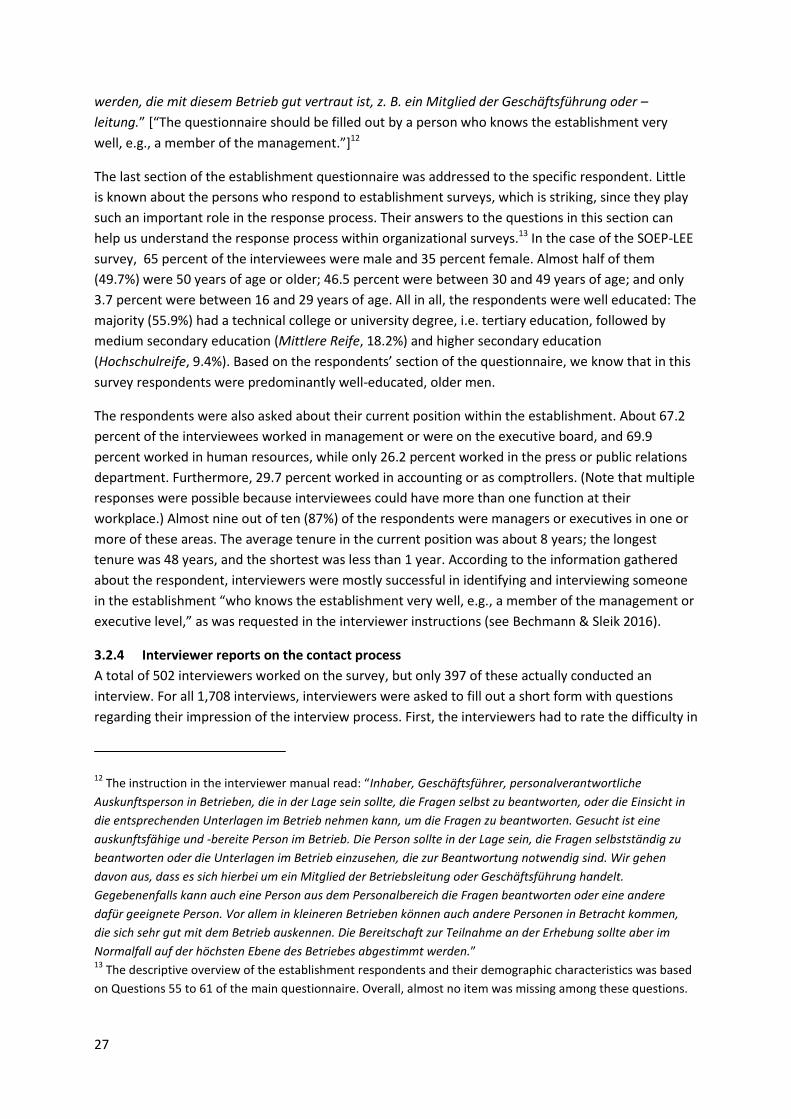
27
werden, die mit diesem Betrieb gut vertraut ist, z. B. ein Mitglied der Geschäftsführung oder –
leitung.” [“The questionnaire should be filled out by a person who knows the establishment very
well, e.g., a member of the management.”]12
The last section of the establishment questionnaire was addressed to the specific respondent. Little
is known about the persons who respond to establishment surveys, which is striking, since they play
such an important role in the response process. Their answers to the questions in this section can
help us understand the response process within organizational surveys.13 In the case of the SOEP-LEE
survey, 65 percent of the interviewees were male and 35 percent female. Almost half of them
(49.7%) were 50 years of age or older; 46.5 percent were between 30 and 49 years of age; and only
3.7 percent were between 16 and 29 years of age. All in all, the respondents were well educated: The
majority (55.9%) had a technical college or university degree, i.e. tertiary education, followed by
medium secondary education (Mittlere Reife, 18.2%) and higher secondary education
(Hochschulreife, 9.4%). Based on the respondents’ section of the questionnaire, we know that in this
survey respondents were predominantly well-educated, older men.
The respondents were also asked about their current position within the establishment. About 67.2
percent of the interviewees worked in management or were on the executive board, and 69.9
percent worked in human resources, while only 26.2 percent worked in the press or public relations
department. Furthermore, 29.7 percent worked in accounting or as comptrollers. (Note that multiple
responses were possible because interviewees could have more than one function at their
workplace.) Almost nine out of ten (87%) of the respondents were managers or executives in one or
more of these areas. The average tenure in the current position was about 8 years; the longest
tenure was 48 years, and the shortest was less than 1 year. According to the information gathered
about the respondent, interviewers were mostly successful in identifying and interviewing someone
in the establishment “who knows the establishment very well, e.g., a member of the management or
executive level,” as was requested in the interviewer instructions (see Bechmann & Sleik 2016).
3.2.4 Interviewer reports on the contact process
A total of 502 interviewers worked on the survey, but only 397 of these actually conducted an
interview. For all 1,708 interviews, interviewers were asked to fill out a short form with questions
regarding their impression of the interview process. First, the interviewers had to rate the difficulty in
12 The instruction in the interviewer manual read: “Inhaber, Geschäftsführer, personalverantwortliche
Auskunftsperson in Betrieben, die in der Lage sein sollte, die Fragen selbst zu beantworten, oder die Einsicht in
die entsprechenden Unterlagen im Betrieb nehmen kann, um die Fragen zu beantworten. Gesucht ist eine
auskunftsfähige und -bereite Person im Betrieb. Die Person sollte in der Lage sein, die Fragen selbstständig zu
beantworten oder die Unterlagen im Betrieb einzusehen, die zur Beantwortung notwendig sind. Wir gehen
davon aus, dass es sich hierbei um ein Mitglied der Betriebsleitung oder Geschäftsführung handelt.
Gegebenenfalls kann auch eine Person aus dem Personalbereich die Fragen beantworten oder eine andere
dafür geeignete Person. Vor allem in kleineren Betrieben können auch andere Personen in Betracht kommen,
die sich sehr gut mit dem Betrieb auskennen. Die Bereitschaft zur Teilnahme an der Erhebung sollte aber im
Normalfall auf der höchsten Ebene des Betriebes abgestimmt werden.” 13
The descriptive overview of the establishment respondents and their demographic characteristics was based
on Questions 55 to 61 of the main questionnaire. Overall, almost no item was missing among these questions.
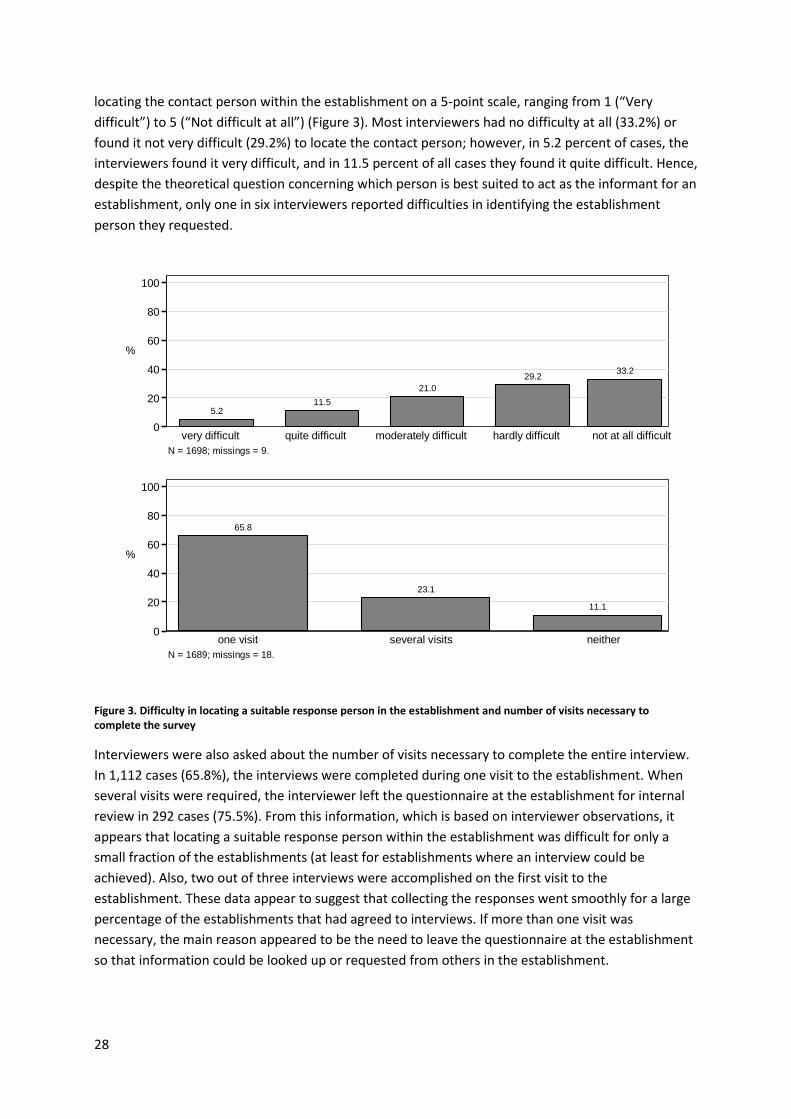
28
locating the contact person within the establishment on a 5-point scale, ranging from 1 (“Very
difficult”) to 5 (“Not difficult at all”) (Figure 3). Most interviewers had no difficulty at all (33.2%) or
found it not very difficult (29.2%) to locate the contact person; however, in 5.2 percent of cases, the
interviewers found it very difficult, and in 11.5 percent of all cases they found it quite difficult. Hence,
despite the theoretical question concerning which person is best suited to act as the informant for an
establishment, only one in six interviewers reported difficulties in identifying the establishment
person they requested.
Figure 3. Difficulty in locating a suitable response person in the establishment and number of visits necessary to complete the survey
Interviewers were also asked about the number of visits necessary to complete the entire interview.
In 1,112 cases (65.8%), the interviews were completed during one visit to the establishment. When
several visits were required, the interviewer left the questionnaire at the establishment for internal
review in 292 cases (75.5%). From this information, which is based on interviewer observations, it
appears that locating a suitable response person within the establishment was difficult for only a
small fraction of the establishments (at least for establishments where an interview could be
achieved). Also, two out of three interviews were accomplished on the first visit to the
establishment. These data appear to suggest that collecting the responses went smoothly for a large
percentage of the establishments that had agreed to interviews. If more than one visit was
necessary, the main reason appeared to be the need to leave the questionnaire at the establishment
so that information could be looked up or requested from others in the establishment.
5.211.5
21.0
29.233.2
0
20
40
60
80
100
%
very difficult quite difficult moderately difficult hardly difficult not at all difficult
N = 1698; missings = 9.
65.8
23.1
11.1
0
20
40
60
80
100
%
one visit several visits neither
N = 1689; missings = 18.
29
3.3 Post–data collection phase
In this section, we describe what was done with the data after the fieldwork had been completed.
The tasks mainly involved checking and editing the data, preparing documentation, and finalizing the
data for release.
3.3.1 Interviewer control, data entry, quality checks, and edits by the fieldwork organization
The survey agency was responsible for interviewer control (i.e., back-checking the work of the
interviewers), ensuring quality back-checks for 10 percent of all interviews conducted. Back-checks
involved either mailing or calling the respondents. Such controls of the interviewers working within
the SOEP-LEE project were performed as part of the editing step, in which many of the
establishments were contacted to clarify their specific responses whenever errors were found during
the checking process (see below). Based on the checking routines and interviewer back-checks, 23 of
the interviews achieved were deemed invalid. The following sections describe the checking and
editing procedures that were applied to the data.
Information from the paper questionnaires that were returned to the fieldwork organization by the
interviewers was entered manually into an electronic format. This data entry was performed by two
separate coders in order to prevent errors. During this process, any handwritten comments (either in
place of a response or as a comment next to a survey item) or improper use of response scales (e.g.,
more than one response box was ticked) were highlighted for further investigation. After this
digitalization of the paper questionnaires, the data underwent a thorough checking and editing
procedure. The checking process of the fieldwork organization consisted of different automated and
manual steps that involved checks for plausibility, consistency, completeness, and the correct use of
filters.14 The checking routines were based on the survey institute’s experience in organizational
surveys15 and were agreed on in advance by the scientific project team. Overall, 52 different checking
routines were implemented and 59 different items (out of a total of 161 items) were subjected to
these checks, as outlined below.
Plausibility checks are checks of values or figures that are considered implausible or highly
unlikely. These checks are based on the experience of the survey institute regarding what
constitutes plausible values and what does not. For example, whenever the establishment
was older or the turnover per employee was lower or higher than would be plausible
according to previous experience, the response was deemed implausible.
Consistency checks are performed to evaluate the consistency of two or more responses to
different survey items within one questionnaire. For example, if the number of part-time
employees was given as zero (Question 27) and the income of part-time staff was given as
higher than zero (Question 32), this inconsistency was evaluated.
Sum checking refers to Questions 26, 31, 32, 27f, and 27g, in which the individual items
should add up to a certain total or make sense in that context (e.g., 100%).
14 See Bechmann & Sleik 2016 for the editing routines used.
15 The survey agency was responsible for data collection in the large-scale IAB establishment survey
(N = 16,000), from which the checking and editing procedures were adapted. The agency reported some
overlap of the SOEP-LEE sample with the IAB establishment sample, although the fieldwork for the latter is
usually done during spring and summer.
30
Completeness checks evaluate whether the response to an item was missing. They were
performed for a selection of important items only, such as number of employees, because
the survey is so resource intensive.
Filter checks are used to control whether the routing in the questionnaire worked as
intended.
In total, there were 13 plausibility checks, 24 consistency checks, three sum checks of numerical
values, four checks of missing values (i.e., completeness of information), and eight filter checks,
which were entered into a computer program and run automatically. According to these checking
procedures, 19 percent of the completed interviews were error-free. Those interviews for which an
error was detected, either by the automated checking routines or by the data entry group, were
subjected to manual inspection by the fieldwork organization’s editing team first. If an error could
not be settled by manual inspection of the original paper questionnaire, an attempt was made to
recontact the establishment by telephone. Of the 1,401 cases for which the checking procedure
indicated an error, 79 percent were recontacted by telephone; 4 percent of the establishments could
not be reached during the period of editing; in 16 percent of the cases, contacting was not necessary
because the errors could be corrected on the basis of the available data. All in all, 64 percent of the
surveyed establishments were successfully recontacted by telephone during the editing procedure
(see Bechmann & Sleik 2016).
In four cases, the contacted respondent could not remember having been interviewed earlier. An
inspection of these four cases revealed that all the interviews had been completed by different
interviewers. Because the standard interviewer controls showed no evidence that the work of these
interviewers was improper, and because several weeks elapsed between the interview and the
follow-up telephone call during which time the questionnaires showed no further indications that the
interview did not take place, all four interviews remained in the data set. Although there were no
signs of fraud in these four cases, they raise a question about interviewer control. Within the editing
procedure, the work of 345 interviewers was controlled through direct contact with the respondent,
which represents 69 percent of the interviewers who worked on the study. Thus, in combination with
the standard interview control procedure, we assessed the work of 87 percent of all interviewers
working on this project at least for a major part of the interview. According to the survey institute,
the intensity of interviewer control in our study was considerably higher than what appears to be
standard in other surveys.
To summarize, for the purpose of data validation, a range of automatic checking routines were put in
place to assess the plausibility and consistency of the collected data. We attempted to reconcile
inconsistencies or implausible values by first referring to the original paper questionnaire. When
these attempts were not successful, the respective establishments were contacted again by
telephone. As a result, a large portion of the completed questionnaires had to be edited at the
testing and editing stage: in over three quarters of the interviews, the information was edited. More
than two edits were necessary in almost half the interviews, while in one quarter of the interviews,
five or more edits were necessary; 10 or more edits were made in 7.5 percent of the interviews.
3.4 Project report for establishments In an attempt to boost the rate of responses, we offered the respondents a brief report on the
results of the survey. Interviewers were free to use this offer in their attempts to gain an interview.
At the very end of the questionnaire, participating respondents were asked whether they would like
31
to receive such a report and, if they answered yes, to which e-mail address it should be sent. The
e-mail addresses remained with the fieldwork organization, which was also responsible for
distributing the report. The report itself was prepared by the SOEP-LEE team. It consisted of some
preliminary descriptive analyses of some of the questionnaire content, mainly on human resource
practices. It was e-mailed to respondents who had shown an interest in late summer 2013.
3.5 Summary
The pre–data collection phase mainly involved designing the questionnaire and collecting the
employers’ addresses from the SOEP survey respondents. This was an important step because it
served as the basis for the gross sample of the employer survey. For this purpose, the quality of the
address sample was validated by an extensive procedure. Fortunately, only a small fraction of the
collected addresses had to be discarded as nontraceable.
The data collection phase (i.e., the fieldwork period) was longer than expected, from August 2012 to
March 2013, because an additional round of refusal conversion was necessary to reach the targeted
number of interviews. In part, the reason for the prolonged data collection phase was that the SOEP-
Core study was still in the field in late summer. Therefore, some of the employer addresses were not
ready to be fielded in August 2012, but only later on. In the end, the number of interviews achieved
met the expectations, so the fieldwork could be closed successfully in March 2013. Overall, only a
few establishments could not be located at the addresses provided, which speaks for a successful
address validation procedure. If we look at the information that was collected about the
respondents, it appears that the interviewers were mostly successful in finding a person from the
executive level with experience working in the establishment.
During the post–data collection phase, the data underwent an extensive checking and editing
procedures in order to achieve high data quality. Many of the establishments were contacted by
telephone to verify certain data and to control the work of the interviewers. Little of the information
had to be revised at this step. Based on the preliminary data, the project team wrote a report on
some of the main themes of the survey, which was later sent to interested establishments.
4 Outcomes and response rates In this section, we present the field outcomes, the final disposition codes, and a computation of
response rates for the survey of employer addresses (Step 1) and the subsequent employer survey
(Step 2).
4.1 Step 1: Collecting employer addresses from employees
As outlined above, the target population of the SOEP-LEE study included employed (abhängig
beschäftigt) persons who responded to the SOEP in 2011 and their employing organizations, because
the overall goal of the SOEP-LEE survey is to complement the information collected by the SOEP
about individuals and households with information about their employers. In the SOEP 2012,
respondents were asked to provide the names and addresses of their employers as of 2011. The
resulting list of employers was the basis of the gross sample for the subsequent establishment survey
described in this report. However, the number of SOEP respondents in 2011 was much larger than
the number of addresses that could be fielded as the gross sample for the employer survey.
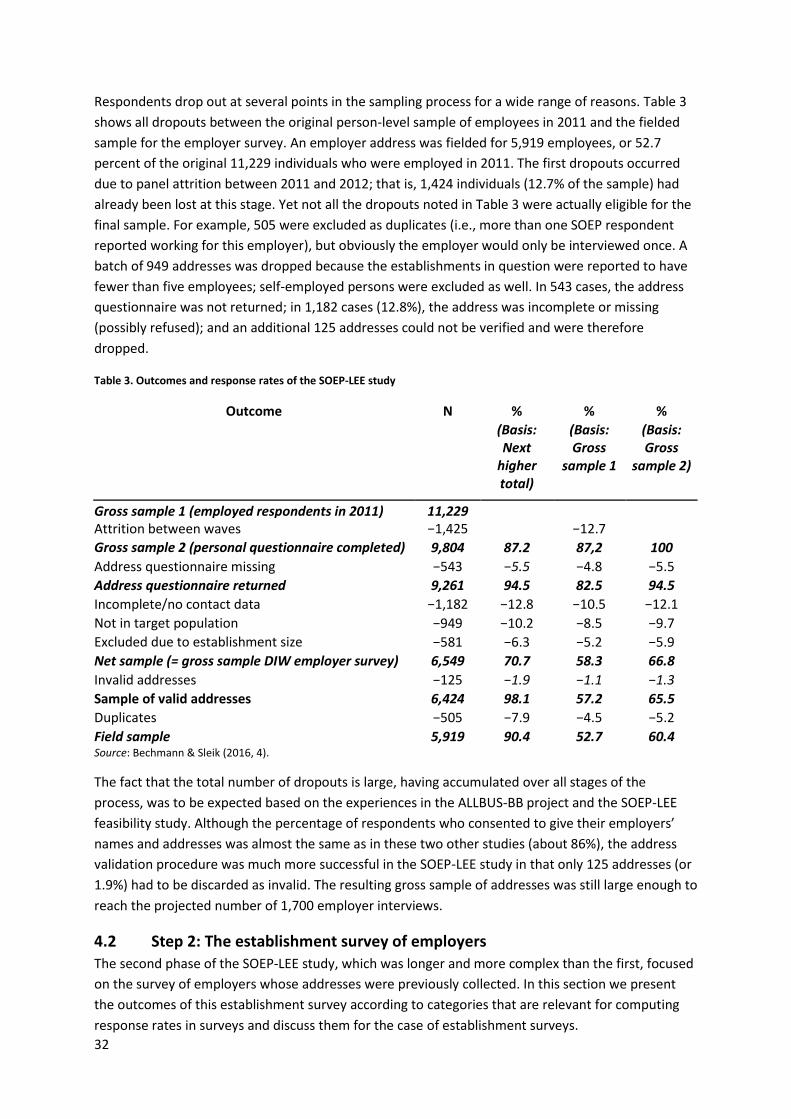
32
Respondents drop out at several points in the sampling process for a wide range of reasons. Table 3
shows all dropouts between the original person-level sample of employees in 2011 and the fielded
sample for the employer survey. An employer address was fielded for 5,919 employees, or 52.7
percent of the original 11,229 individuals who were employed in 2011. The first dropouts occurred
due to panel attrition between 2011 and 2012; that is, 1,424 individuals (12.7% of the sample) had
already been lost at this stage. Yet not all the dropouts noted in Table 3 were actually eligible for the
final sample. For example, 505 were excluded as duplicates (i.e., more than one SOEP respondent
reported working for this employer), but obviously the employer would only be interviewed once. A
batch of 949 addresses was dropped because the establishments in question were reported to have
fewer than five employees; self-employed persons were excluded as well. In 543 cases, the address
questionnaire was not returned; in 1,182 cases (12.8%), the address was incomplete or missing
(possibly refused); and an additional 125 addresses could not be verified and were therefore
dropped.
Table 3. Outcomes and response rates of the SOEP-LEE study
Outcome N % % %
(Basis: Next
higher total)
(Basis: Gross
sample 1
(Basis: Gross
sample 2)
Gross sample 1 (employed respondents in 2011) 11,229
Attrition between waves −1,425 −12.7
Gross sample 2 (personal questionnaire completed)
in 2012)
9,804 87.2 87,2 100
Address questionnaire missing −543 −5.5 −4.8 −5.5
Address questionnaire returned 9,261 94.5 82.5 94.5
Incomplete/no contact data −1,182 −12.8 −10.5 −12.1
Not in target population
(not employed or self-employed in 2011)
−949 −10.2 −8.5 −9.7
Excluded due to establishment size
(< 5 employees)
−581 −6.3 −5.2 −5.9
Net sample (= gross sample DIW employer survey) 6,549 70.7 58.3 66.8
Invalid addresses −125 −1.9 −1.1 −1.3
Sample of valid addresses 6,424 98.1 57.2 65.5
Duplicates −505 −7.9 −4.5 −5.2
Field sample 5,919 90.4 52.7 60.4 Source: Bechmann & Sleik (2016, 4).
The fact that the total number of dropouts is large, having accumulated over all stages of the
process, was to be expected based on the experiences in the ALLBUS-BB project and the SOEP-LEE
feasibility study. Although the percentage of respondents who consented to give their employers’
names and addresses was almost the same as in these two other studies (about 86%), the address
validation procedure was much more successful in the SOEP-LEE study in that only 125 addresses (or
1.9%) had to be discarded as invalid. The resulting gross sample of addresses was still large enough to
reach the projected number of 1,700 employer interviews.
4.2 Step 2: The establishment survey of employers The second phase of the SOEP-LEE study, which was longer and more complex than the first, focused
on the survey of employers whose addresses were previously collected. In this section we present
the outcomes of this establishment survey according to categories that are relevant for computing
response rates in surveys and discuss them for the case of establishment surveys.

33
4.2.1 Sample eligibility
The question of sample eligibility is very important for the computation of valid response rates. Cases
that are not eligible should not be included when computing outcome rates. Eligibility means that a
sampled unit belongs to the universe under study and that the members of this unit should be
interviewed if possible. Cases that are not eligible (NE) include establishments that do not belong to
this same universe and should be kept out of the sample. Cases that are considered out-of-sample
should be excluded from the denominator when one is calculating the response rate. In the SOEP-LEE
study, whether an establishment is out-of-sample can be determined either by the interviewer or in
advance by checking the list and addresses of sampled establishments. Unknown eligibility (UE)
occurs when the survey team has been unable to contact the establishment or determine anything
about its eligibility (AAPOR 2011, 22f.).
A major difference between an employer survey based on the employee-first method and standard
household surveys is that the sample is built from a list based on a separate survey of individuals.
“The reliance on an exogenous list gives rise to operational issues regarding sample integrity that do
not generally affect household surveys” (AAPOR 2011). For example, it is not clear whether all cases
on the list should actually be in the sample. The following potential scenarios should be checked in
advance but might be detected only by the interviewer in the field:
1. In the interval between the building of the list and the conducting of the survey, the
establishment might have split into several entities or merged with another entity on the list.
2. Not all cases on the list reflect the same unit of analysis. In some cases, it is not the
employer’s local establishment but the head office or other parts of the larger organization
that might appear on the list.
3. It is also possible that the establishments were erroneously duplicated on the list.
These three points all relate to the problem of eligibility among the establishments being sampled. In
the SOEP-LEE study, an establishment was defined as not eligible (NE) for an interview if one of the
three following conditions was met: (1) the establishments had fewer than five employees; (2) the
address of the establishment was not in Germany; or (3) the address appeared on the list of sample
units more than once (duplicates). Duplicates identified on the list were not fielded (N = 505); in a
small number of cases, interviewers reported further duplicates (see Section 4.2.2 on SOEP-LEE
outcome codes). However, it is not always clear whether or not a case is eligible. For example,
unknown eligibility (UE) occurs when the interviewer is unable to locate an address that, typically,
involves an incorrect street name or is otherwise insufficient. The remaining addresses were treated
as eligible cases.
4.2.2 SOEP-LEE survey outcomes and outcome codes
For eligible cases, according to AAPOR (2011, 7), we distinguished three groups of outcome cases:
interviews (group 1) and two forms of nonresponse, refusals (group 2) and noncontacts (group 3).16 It
is important to distinguish among these different forms of possible outcomes because, together with
eligibility, they are used to compute sensible response rates.
16 I = complete interview (1.1), P = partial interview (1.2), R = refusal and break-off (2.10), NC = noncontact
(2.20), O = other (2.30), UH = unknown if household/occupied HU (3.10), UO = unknown/other (3.20, 3.30,
3.40, 3.90), e = estimated proportion of cases of unknown eligibility that are eligible.
34
The desired outcome for every study is a completed interview (I), in which case contact with the
sampled unit was made, an interview took place, and more than 80 percent of the questionnaire
items were answered. Partial interviews (P) occur when the percentage of questions answered lies
between 50 and 80 percent. Break-offs (B) occurs when an interview took place but less than 50
percent of it was completed;17 this outcome did not occur in the SOEP-LEE study.
A nonresponse is case that was eligible but did not lead to a successful interview.18 The literature
distinguishes between two forms of nonresponse: noncontacts (NC) are cases that are eligible but
where no one could be reached at the establishment or the respondent was away or unavailable, and
a case is considered a refusal (R) if contact was made but a responsible member of the establishment
declined to do the interview.19
On the contact form, interviewers were asked to indicate the outcome for each case in the sample
using the outcome codes defined in Table 4. Eight codes were provided as preformulated categories
in a closed-question format; a ninth category, “Other,” was also provided for which interviewers
were asked to briefly describe the outcome in writing. These interviewer comments were coded
afterwards, and in many cases, these open comments could be back-coded into the first eight
preconceived categories. For the remaining cases, ten new categories were built. Table 4 indicates
the number of cases that fell within each category both before and after the answers were recoded
and whether a category should be treated as a noncontact (NC), not eligible (NE) unknown eligibility
(UE), a refusal (R), or something else (O or UO).
In a substantial percentage of cases, the establishment of interest had ceased to exist by the time the
interviewer attempted to contact it. This event is comparable to the death of a sampled response
person in surveys of individuals. “Whether death makes a case a non-respondent or an ineligible
respondent depends on fieldwork timing. Surveys should define a date on which eligibility status is
determined. This would usually be either the first day of the field period or the first day that a
particular case was fielded” (AAPOR 2011, 21f.). Following this suggestion and the conception that
eligibility status depends on the belonging of the establishment to the universe of interest,
establishments that had ceased to exist were treated as eligible but nonresponding or, more
specifically, as noncontacts.
17 According to the standards described in AAPOR (2011), an interview was defined as a break-off if less than 50
percent of all questions were answered; as a partial interview if the percentage of questions answered was
between 50 and 80 percent; and as a complete interview if more than 80 percent of the questionnaire items
were answered (AAPOR 2011, 13ff., 20, 26). (An explicit refusal, “Don’t know” *DK+, and “Not applicable” *NA+
were treated as acceptable answers in this case.) 18
Establishment survey codes 2.11, 2.111, and 2.112. 19
In this case, who refused is also of interest, as are the questions of whether it happened before or after
respondent selection and the reason for the refusal or break-off.
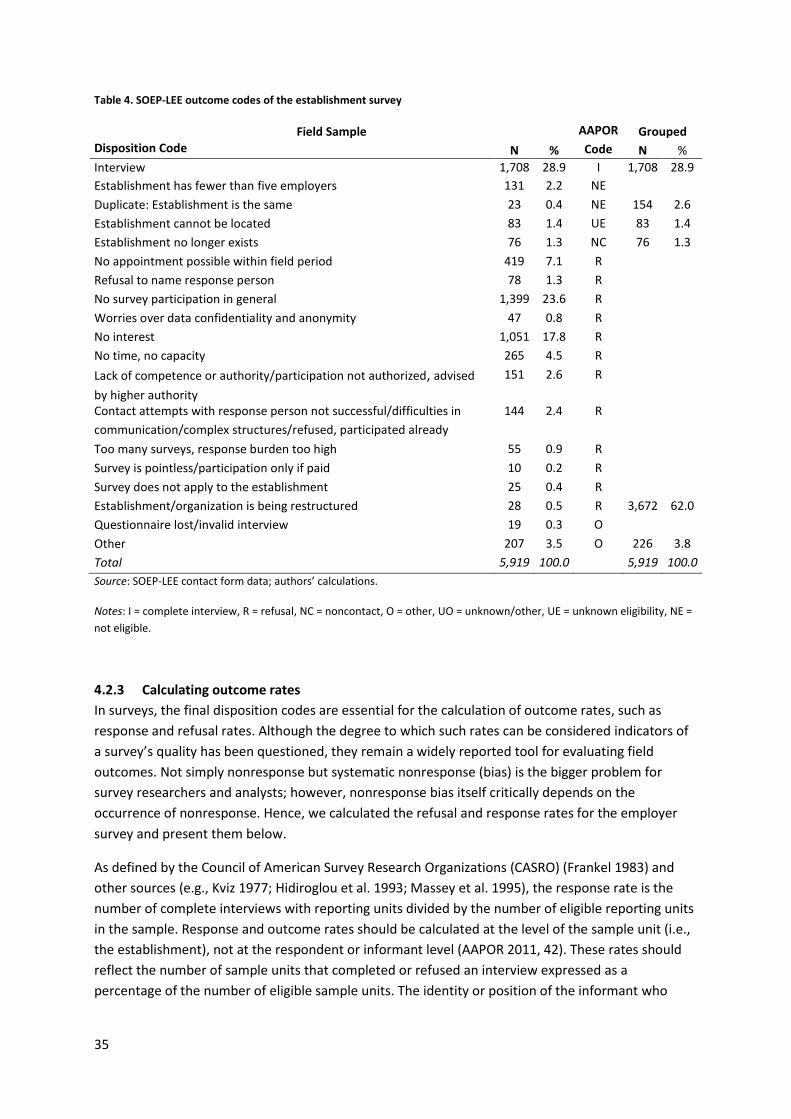
35
Table 4. SOEP-LEE outcome codes of the establishment survey
Field Sample AAPOR Grouped Disposition Code N % Code N %
Interview 1,708 28.9 I 1,708 28.9
Establishment has fewer than five employers 131 2.2 NE
Duplicate: Establishment is the same 23 0.4 NE 154 2.6
Establishment cannot be located 83 1.4 UE 83 1.4
Establishment no longer exists 76 1.3 NC 76 1.3
No appointment possible within field period 419 7.1 R
Refusal to name response person 78 1.3 R
No survey participation in general 1,399 23.6 R
Worries over data confidentiality and anonymity 47 0.8 R
No interest 1,051 17.8 R
No time, no capacity 265 4.5 R
Lack of competence or authority/participation not authorized, advised
by higher authority
151 2.6 R
Contact attempts with response person not successful/difficulties in
communication/complex structures/refused, participated already
144 2.4 R
Too many surveys, response burden too high 55 0.9 R
Survey is pointless/participation only if paid 10 0.2 R
Survey does not apply to the establishment 25 0.4 R
Establishment/organization is being restructured 28 0.5 R 3,672 62.0
Questionnaire lost/invalid interview 19 0.3 O
Other 207 3.5 O 226 3.8
Total 5,919 100.0 5,919 100.0
Source: SOEP-LEE contact form data; authors’ calculations.
Notes: I = complete interview, R = refusal, NC = noncontact, O = other, UO = unknown/other, UE = unknown eligibility, NE =
not eligible.
4.2.3 Calculating outcome rates
In surveys, the final disposition codes are essential for the calculation of outcome rates, such as
response and refusal rates. Although the degree to which such rates can be considered indicators of
a survey’s quality has been questioned, they remain a widely reported tool for evaluating field
outcomes. Not simply nonresponse but systematic nonresponse (bias) is the bigger problem for
survey researchers and analysts; however, nonresponse bias itself critically depends on the
occurrence of nonresponse. Hence, we calculated the refusal and response rates for the employer
survey and present them below.
As defined by the Council of American Survey Research Organizations (CASRO) (Frankel 1983) and
other sources (e.g., Kviz 1977; Hidiroglou et al. 1993; Massey et al. 1995), the response rate is the
number of complete interviews with reporting units divided by the number of eligible reporting units
in the sample. Response and outcome rates should be calculated at the level of the sample unit (i.e.,
the establishment), not at the respondent or informant level (AAPOR 2011, 42). These rates should
reflect the number of sample units that completed or refused an interview expressed as a
percentage of the number of eligible sample units. The identity or position of the informant who
36
completed the questionnaire is not important to response rates, although the project may wish to
track this information for operational purposes.
By now the AAPOR definitions are widely used as the standard for calculating such outcome rates.
However, these definitions do not exactly match all possible circumstances in survey research. For
example, because there are no official registers in the U.S. from which one can draw samples,
outcomes may arise that are not covered in the AAPOR definitions if one uses, say, the administrative
registers for sampling in Germany. Similarly, the AAPOR framework does not perfectly fit the SOEP-
LEE employer survey. For the calculation of outcome rates, we follow the AAPOR definitions as much
as possible and approximate their instructions when necessary. AAPOR (2011) distinguishes between
several outcome rates. The four outcome rates defined below are the response rate, the cooperation
rate, the refusal rate, and the contact rate and are explained using the disposition codes presented in
Table 4 (which are based on the SOEP-LEE outcome codes).
Response rate (RR): All cases interviewed of all eligible (and unknown eligible) units
RR = I / I + R + NC + O = 30.1%
Cooperation rate (COOP): All cases interviewed among all eligible units contacted
(Household and respondent rates can be distinguished)
COOP = I / I + R + O = 30.5%
Refusal rate (REF): All cases refused/break-offs of all eligible units
REF = R / I + R + NC + O + UO = 64.6%
Contact rate (CON): All cases contacted
(Household and respondents can be distinguished)
CON = I + R + O / I + R + O + UO + NC = 96.1%
The response rate of 30.1 percent in the SOEP-LEE study compares favorably with the response rates
in two previous, smaller studies that were undertaken to test the employee-first method in the
German context. In a small pilot study already within the SOEP (2007), 11.7 percent of the
establishments granted an interview, and in the 2009 ALLBUS establishment survey, 27.4 percent of
the establishments did. In the SOEP innovation study, conducted as a postal survey, the response
rate was just about 10 percent. In general, however, response rates among establishments in
Germany are much lower than they are in other countries (e.g., as noted earlier, the response rate in
the NOS studies was above 50%). Low response rates, which are common in organization studies in
Germany, do not necessarily indicate nonresponse bias (Groves et al., 2008), but the two are likely to
be related. The next section therefore investigates whether the representativeness of the collected
data is threatened by selectivity in nonresponse at different levels.
4.3 Linkage to administrative data
To enrich the study by adding information drawn from administrative data, the SOEP-LEE data on
employers were linked to data from the Establishment History Panel (BHP) of the Institute for
Employment Research (IAB Nuremberg). The BHP consists of aggregated data on employees who are
subject to social insurance contributions and on their incomes as reported by their employers to the
Federal Employment Agency (Bundesagentur für Arbeit [BA]). Aggregated to the establishment level,
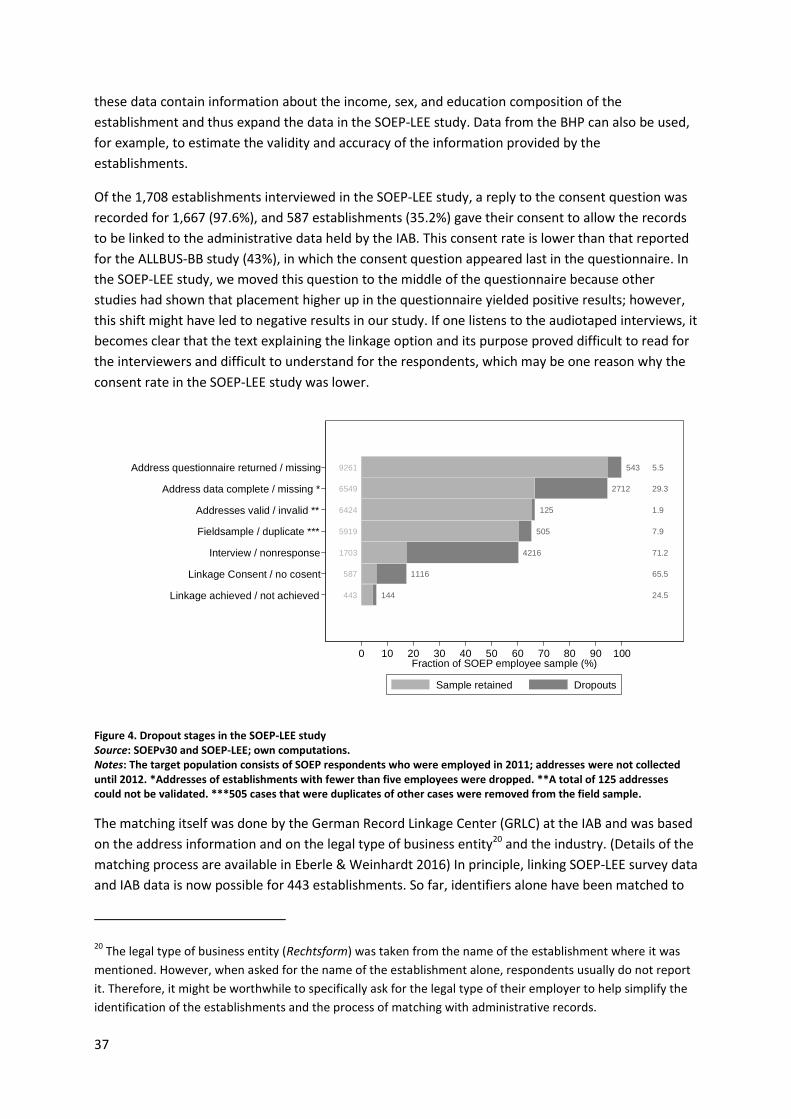
37
these data contain information about the income, sex, and education composition of the
establishment and thus expand the data in the SOEP-LEE study. Data from the BHP can also be used,
for example, to estimate the validity and accuracy of the information provided by the
establishments.
Of the 1,708 establishments interviewed in the SOEP-LEE study, a reply to the consent question was
recorded for 1,667 (97.6%), and 587 establishments (35.2%) gave their consent to allow the records
to be linked to the administrative data held by the IAB. This consent rate is lower than that reported
for the ALLBUS-BB study (43%), in which the consent question appeared last in the questionnaire. In
the SOEP-LEE study, we moved this question to the middle of the questionnaire because other
studies had shown that placement higher up in the questionnaire yielded positive results; however,
this shift might have led to negative results in our study. If one listens to the audiotaped interviews, it
becomes clear that the text explaining the linkage option and its purpose proved difficult to read for
the interviewers and difficult to understand for the respondents, which may be one reason why the
consent rate in the SOEP-LEE study was lower.
Figure 4. Dropout stages in the SOEP-LEE study Source: SOEPv30 and SOEP-LEE; own computations. Notes: The target population consists of SOEP respondents who were employed in 2011; addresses were not collected until 2012. *Addresses of establishments with fewer than five employees were dropped. **A total of 125 addresses could not be validated. ***505 cases that were duplicates of other cases were removed from the field sample.
The matching itself was done by the German Record Linkage Center (GRLC) at the IAB and was based
on the address information and on the legal type of business entity20 and the industry. (Details of the
matching process are available in Eberle & Weinhardt 2016) In principle, linking SOEP-LEE survey data
and IAB data is now possible for 443 establishments. So far, identifiers alone have been matched to
20 The legal type of business entity (Rechtsform) was taken from the name of the establishment where it was
mentioned. However, when asked for the name of the establishment alone, respondents usually do not report
it. Therefore, it might be worthwhile to specifically ask for the legal type of their employer to help simplify the
identification of the establishments and the process of matching with administrative records.
443
587
1703
5919
6424
6549
9261
144
1116
4216
505
125
2712
543
24.5
65.5
71.2
7.9
1.9
29.3
5.5Address questionnaire returned / missing
Address data complete / missing *
Addresses valid / invalid **
Fieldsample / duplicate ***
Interview / nonresponse
Linkage Consent / no cosent
Linkage achieved / not achieved
Dro
po
ut sta
ge
0 10 20 30 40 50 60 70 80 90 100Fraction of SOEP employee sample (%)
Sample retained Dropouts
38
facilitate linkage. In order to use the actual linked data of both data sources, one must apply
separately to the IAB and comply with strict data confidentiality regulations regarding BHP data.
4.4 Summary
In summarizing the outcomes of the two survey stages, we look specifically at the dropout rates at
different stages of the survey process (Figure 4). As described previously, the SOEP-LEE study draws
on those SOEP respondents who were employed in 2011 (N = 11,229). The first major dropout stage
was when panel attrition occurred between 2011 and 2012, when employer addresses were
collected from these employee respondents. The numbers of cases that dropped out were highest at
two stages: (1) when the SOEP respondents were asked to provide their employers’ contact
information and (2) when employers agreed to participate in the establishment survey.
The final SOEP-LEE data set in which individual and employer level data were linked contains 1,834
records (including duplicates when more than one respondent belongs to the same establishment),
which is only 16.3 percent of the original individual sample. Use of the linked BHP data from the IAB
would be possible for 443 cases, which represents 25.5 percent of surveyed establishments, or 3.9
percent of the original individual sample. Therefore, in order to use the employee-first method
successfully and to have a linked data set large enough to allow for detailed analysis, it becomes
apparent that one would need a sample of individuals that is large enough to begin with. Although
the dropout rates were high throughout all stages of the study, this is not uncommon when the
employee-first approach is used. By the end of the ALLBUS-BB study, establishment data were
collected from 17.0 percent of the original sample of employees. Overall, the dropout rates were not
higher than in previous studies, but the different dropout stages can be problematic and lead to bias
if the process of nonparticipation is systematic and not random. In the following section, we will look
at the issue of sample selectivity in more detail.
5 Survey quality: Representation and measurement This section discusses two characteristics of survey quality: the extent to which the sample can be
regarded as a representative snapshot of the population of establishments and individuals (see
Section 5.1) and the level of accuracy with which the desired information was collected (see Section
5.2). Perhaps the biggest issue in survey research is the problem of missing data, which can result in
nonresponse bias. Bias in survey estimates can lead to incorrect conclusions about the population of
interest. It is well known that nonresponse affects the results of surveys and can even cause bias due
to selectivity if the responses cannot be regarded as missing at random. Hence, it is important to
assess patterns of missingness when assessing the quality of a study’s data. This is true for both
representation, where missingness relates to unit nonresponse, and measurement, where
missingness relates to item nonresponse. Hence, missingness and nonresponse are important
aspects of a survey; they will be discussed in the following sections, along with other aspects of
survey quality, such as interviewer impressions of the survey situation.
5.1 Representation and selectivity
In this section, we focus on representation and selectivity at both the individual level and the
establishment level. Data on the individual and organizational levels are compared with the
population based on a set of characteristics for which their distribution in the population is known,
from either the 2011 census (in the case of individuals) or the BA establishment data. Selectivity is
39
assessed by running logit models, with individual and organizational responses, respectively, as
dependent variables.
5.1.1 The individual SOEP data as a representative sample of German employees
Because the employee-first method starts with a sample made up of employees, it is important that
the sample be representative of the working population of Germany. To accomplish this, weighted
and unweighted distributions of some basic characteristics were compared between the samples of
employees found in the SOEP data and in data from the 2011 census, which is publically available.
The latter should provide a “true” picture of these distributions for occupational classification and for
branch of the employer—characteristics that were also of interest in the SOEP study. Although the
weighting scheme used for the SOEP incorporated data (such as household composition) obtained
from official statistics, occupational category and branch were not directly accounted for. Therefore,
discrepancies may still remain between the census and the SOEP sample, unweighted or weighted;
however, these discrepancies should be small, because the household sample in the SOEP study was
representative of the situation in Germany. Unfortunately, with regard to these two characteristics,
the comparison between the SOEP 2011 data and the census 2011 data is not trivial. For comparing
occupations, the SOEP still uses the 1988 International Standard Classification of Occupations (ISCO-
88), whereas the census uses the Classification of Occupations 2010 (Klassifikation der Berufe, KldB
2010), which is more similar to the more recent ISCO-08 classification. For information on industries,
the SOEP still uses the Statistical Classification of Economic Activities (NACE) Rev. 1 codes, whereas
the census data refers to the newer classification, NACE Rev. 2.
5.1.2 The SOEP-LEE data as a representative sample of German employers
In this section, we investigate how the overall composition of the sample compares with official
statistics (when available). This is mainly true for the size of organizations (i.e., employers) and the
distribution of industries. The SOEP-LEE sample can be regarded as a random sample, representative
of German establishments, and as an organizations study in its own right, from which nationally
representative statistics about establishments can be computed. The employee-first method mimics
a sampling design in which establishments are drawn randomly, with inclusion probability
proportional to their size (i.e., their number of employees) (see Hansen & Hurwitz 1943). The
inclusion probability is
( )
∑
where is the sample size, 𝑖 is the number of employees in the establishment, and Σ 𝑖 ∈𝐸 𝑖 is the
total number of employees in the population. Accordingly, the design weight for the employer survey
is computed as the inverse of the inclusion probability. A full weighting scheme will also have to take
into account the selection probability of SOEP respondents by combining the design weight at the
employer level with SOEP weights at the individual level, depending on the requested level of
analysis. In addition, it would be possible to compute some post-stratification adjustments based on
the BA employer data (which comes close to a census of all establishments in Germany), taking into
account the size and branch of the establishment.
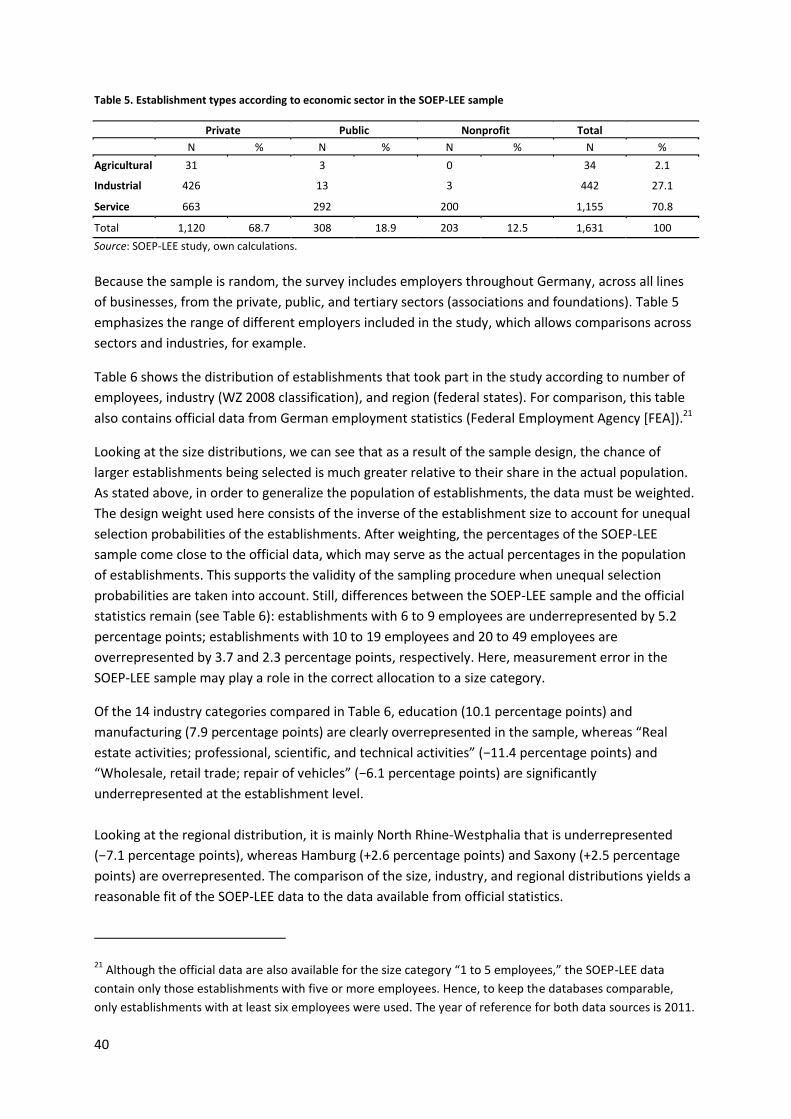
40
Table 5. Establishment types according to economic sector in the SOEP-LEE sample
Private Public Nonprofit Total
N % N % N % N %
Agricultural 31 3 0 34 2.1
Industrial 426 13 3 442 27.1
Service 663 292 200 1,155 70.8
Total 1,120 68.7 308 18.9 203 12.5 1,631 100
Source: SOEP-LEE study, own calculations.
Because the sample is random, the survey includes employers throughout Germany, across all lines
of businesses, from the private, public, and tertiary sectors (associations and foundations). Table 5
emphasizes the range of different employers included in the study, which allows comparisons across
sectors and industries, for example.
Table 6 shows the distribution of establishments that took part in the study according to number of
employees, industry (WZ 2008 classification), and region (federal states). For comparison, this table
also contains official data from German employment statistics (Federal Employment Agency [FEA]).21
Looking at the size distributions, we can see that as a result of the sample design, the chance of
larger establishments being selected is much greater relative to their share in the actual population.
As stated above, in order to generalize the population of establishments, the data must be weighted.
The design weight used here consists of the inverse of the establishment size to account for unequal
selection probabilities of the establishments. After weighting, the percentages of the SOEP-LEE
sample come close to the official data, which may serve as the actual percentages in the population
of establishments. This supports the validity of the sampling procedure when unequal selection
probabilities are taken into account. Still, differences between the SOEP-LEE sample and the official
statistics remain (see Table 6): establishments with 6 to 9 employees are underrepresented by 5.2
percentage points; establishments with 10 to 19 employees and 20 to 49 employees are
overrepresented by 3.7 and 2.3 percentage points, respectively. Here, measurement error in the
SOEP-LEE sample may play a role in the correct allocation to a size category.
Of the 14 industry categories compared in Table 6, education (10.1 percentage points) and
manufacturing (7.9 percentage points) are clearly overrepresented in the sample, whereas “Real
estate activities; professional, scientific, and technical activities” (−11.4 percentage points) and
“Wholesale, retail trade; repair of vehicles” (−6.1 percentage points) are significantly
underrepresented at the establishment level.
Looking at the regional distribution, it is mainly North Rhine-Westphalia that is underrepresented
(−7.1 percentage points), whereas Hamburg (+2.6 percentage points) and Saxony (+2.5 percentage
points) are overrepresented. The comparison of the size, industry, and regional distributions yields a
reasonable fit of the SOEP-LEE data to the data available from official statistics.
21 Although the official data are also available for the size category “1 to 5 employees,” the SOEP-LEE data
contain only those establishments with five or more employees. Hence, to keep the databases comparable,
only establishments with at least six employees were used. The year of reference for both data sources is 2011.
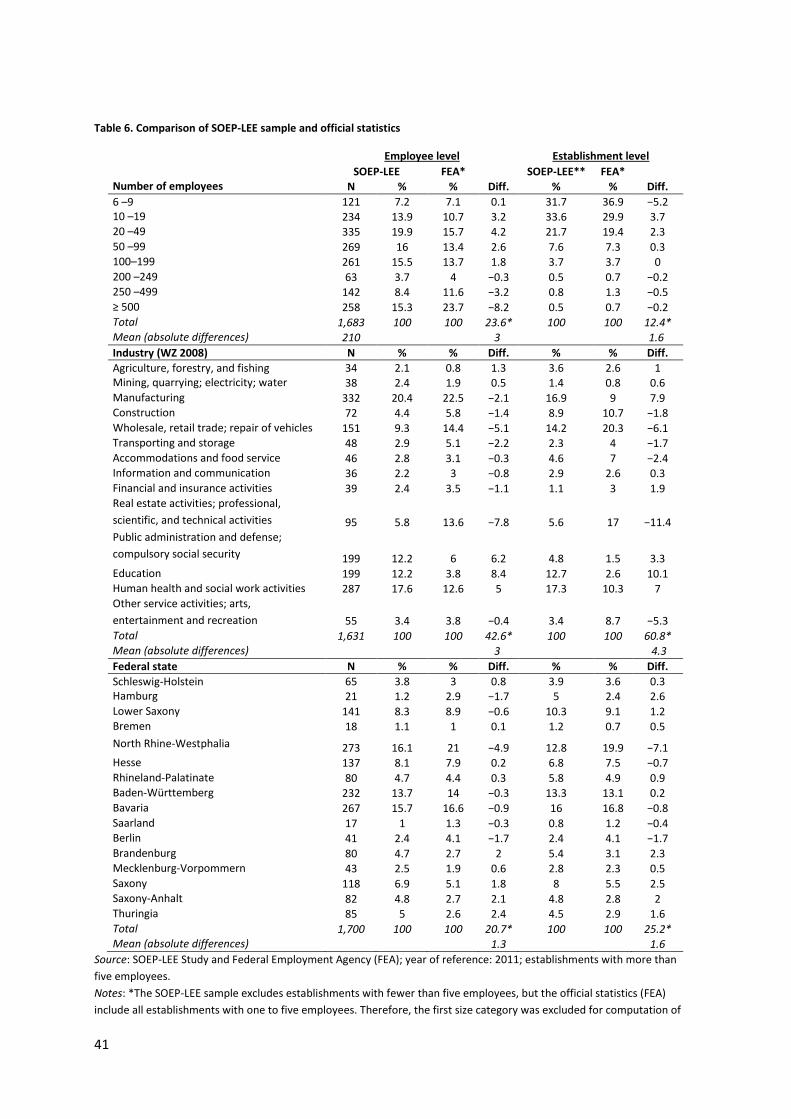
41
Table 6. Comparison of SOEP-LEE sample and official statistics
Employee level Establishment level
SOEP-LEE FEA* SOEP-LEE** FEA*
Number of employees N % % Diff. % % Diff.
6 –9 121 7.2 7.1 0.1 31.7 36.9 −5.2 10 –19 234 13.9 10.7 3.2 33.6 29.9 3.7
20 –49 335 19.9 15.7 4.2 21.7 19.4 2.3
50 –99 269 16 13.4 2.6 7.6 7.3 0.3
100–199 261 15.5 13.7 1.8 3.7 3.7 0
200 –249 63 3.7 4 −0.3 0.5 0.7 −0.2
250 –499 142 8.4 11.6 −3.2 0.8 1.3 −0.5
≥ 500 258 15.3 23.7 −8.2 0.5 0.7 −0.2
Total 1,683 100 100 23.6* 100 100 12.4*
Mean (absolute differences) 210
3 1.6
Industry (WZ 2008) N % % Diff. % % Diff.
Agriculture, forestry, and fishing 34 2.1 0.8 1.3 3.6 2.6 1 Mining, quarrying; electricity; water
supply, sewerage
38 2.4 1.9 0.5 1.4 0.8 0.6
Manufacturing 332 20.4 22.5 −2.1 16.9 9 7.9
Construction 72 4.4 5.8 −1.4 8.9 10.7 −1.8
Wholesale, retail trade; repair of vehicles 151 9.3 14.4 −5.1 14.2 20.3 −6.1
Transporting and storage 48 2.9 5.1 −2.2 2.3 4 −1.7
Accommodations and food service
activities
46 2.8 3.1 −0.3 4.6 7 −2.4
Information and communication 36 2.2 3 −0.8 2.9 2.6 0.3
Financial and insurance activities 39 2.4 3.5 −1.1 1.1 3 1.9
Real estate activities; professional,
scientific, and technical activities 95 5.8 13.6 −7.8 5.6 17 −11.4
Public administration and defense;
compulsory social security 199 12.2 6 6.2 4.8 1.5 3.3
Education 199 12.2 3.8 8.4 12.7 2.6 10.1
Human health and social work activities 287 17.6 12.6 5 17.3 10.3 7
Other service activities; arts,
entertainment and recreation 55 3.4 3.8 −0.4 3.4 8.7 −5.3
Total 1,631 100 100 42.6* 100 100 60.8*
Mean (absolute differences)
3 4.3
Federal state N % % Diff. % % Diff.
Schleswig-Holstein 65 3.8 3 0.8 3.9 3.6 0.3 Hamburg 21 1.2 2.9 −1.7 5 2.4 2.6
Lower Saxony 141 8.3 8.9 −0.6 10.3 9.1 1.2
Bremen 18 1.1 1 0.1 1.2 0.7 0.5
North Rhine-Westphalia 273 16.1 21 −4.9 12.8 19.9 −7.1
Hesse 137 8.1 7.9 0.2 6.8 7.5 −0.7
Rhineland-Palatinate 80 4.7 4.4 0.3 5.8 4.9 0.9
Baden-Württemberg 232 13.7 14 −0.3 13.3 13.1 0.2
Bavaria 267 15.7 16.6 −0.9 16 16.8 −0.8
Saarland 17 1 1.3 −0.3 0.8 1.2 −0.4
Berlin 41 2.4 4.1 −1.7 2.4 4.1 −1.7
Brandenburg 80 4.7 2.7 2 5.4 3.1 2.3
Mecklenburg-Vorpommern 43 2.5 1.9 0.6 2.8 2.3 0.5
Saxony 118 6.9 5.1 1.8 8 5.5 2.5
Saxony-Anhalt 82 4.8 2.7 2.1 4.8 2.8 2
Thuringia 85 5 2.6 2.4 4.5 2.9 1.6
Total 1,700 100 100 20.7* 100 100 25.2*
Mean (absolute differences) 1.3 1.6
Source: SOEP-LEE Study and Federal Employment Agency (FEA); year of reference: 2011; establishments with more than
five employees.
Notes: *The SOEP-LEE sample excludes establishments with fewer than five employees, but the official statistics (FEA)
include all establishments with one to five employees. Therefore, the first size category was excluded for computation of
42
percentages. **Data are weighted; weights take into account the unequal selection probability based on the size of the
establishments.
5.1.3 Selectivity and nonresponse at the employee level
As outlined above, the sample of employers was based on address information provided by
employees who took part in the SOEP in 2012. Although the overall rate of responses to the address
questionnaire was high among employees (about 85%), a possibility of selectivity in the response
process remains and may lead to a biased sample of organizations. Fortunately, a range of work-
related variables are available from the SOEP, as is some information on the employers themselves,
which are also part of the SOEP questionnaire. This information can be used to investigate the
response process at the first stage of the sampling procedure.22
The following variables were looked at in detail (see Table 6): characteristics of the employer (size of
the organization, industry, region, existence of a work council); employment characteristics
(employment status, years worked for the current employer, job change since the last interview,
temporary work, public sector employment, type of contract, work council membership, union
membership, membership in a professional association, labor income, and socio-economic status);
personal demographics (age, gender, migration background, education, and subjective health); and
survey characteristics (mode of collection and panel membership duration).
To test the influence of these variables on the likelihood of providing the employers’ names and
addresses, we used multivariate logistic regression models. The dependent variable was a binary
indicator equaling 1 if the name and address were provided, and 0 if otherwise. For those
respondents who worked for an establishment that was suitable for the survey (i.e., at least five
employees), the response rate was about 85 percent. The analyses proceeded by entering different
sets of covariates in a stepwise fashion: the organizational characteristics were entered into the
model first, followed by employment characteristics, personal demographics, and characteristics of
the survey. The resulting estimates are shown in Table 7.
Organizational characteristics: Model 1 (see Table 7) contains all characteristics of the employer at
the organizational level. The size of the organization for which the SOEP respondents worked had a
strong impact on the likelihood that they would name their employer: overall, the larger the
organization, the higher the propensity to provide the researchers with this information. The industry
of the employer also mattered: employees who worked in the education industry (i.e., schools,
universities) showed the highest response rate. Hence, this category was selected to be the
reference category for the analysis. Employees from almost all the other industries showed a
significantly lower propensity to respond to the employer question (at a 10% level of significance, at
least), with those working in real estate, renting, and business activities exhibiting the lowest overall
propensity, followed by transport, storage, and construction. Another significant yet positive
influence on the likelihood to name the employer was the existence of a works council at the
establishment. Geographic location did not appear to be important; that is, there was no significant
difference with regard to whether the establishment was in East or West Germany. These effects all
22 The ALLBUS-BB project offered a similar opportunity to investigate patterns of nonresponse when survey
respondents were asked to provide the name and address of their employer.
43
remained after the other sets of covariates were introduced into the model (Model 5, Table 7, last
column).
Job and workplace characteristics: The next group of explanatory variables consisted of specific job
and workplace characteristics of the SOEP respondents (Table 7). The first variable refers to the
employment status of the SOEP respondents. Persons doing their apprenticeship were particularly
willing to provide their employer’s name and address. Also important was the type of employer
contract. For respondents whose contract situation was unclear, the likelihood of naming their
employer was much smaller than for those who had a standard, unlimited contract. Whether the
organization was part of the public sector also played an important role, because respondents who
work in this sector are significantly more likely to name the address of their employer. In addition,
being a member of a professional association had a significant negative effect. These effects
remained significant after the other set of variables was controlled for, whereas the positive effects
of income and union membership vanished in the final model. Temporary work, job status (prestige),
and membership in a union or a works council were insignificant in either model.
Personal characteristics: A third group of variables refers to the personal characteristics of the SOEP
respondent, two of which had a significant effect. First, the better the subjective health of the
respondent, the greater the likelihood of a response to the employer question. Second, the higher
the education level of the respondent, the smaller the likelihood of such a response. Other personal
characteristics had no significant effect (e.g., age ceased to be significant after we controlled for
other variables). Gender and migration status had no effect in either model.
Survey characteristics: Finally, a group of variables related to the survey process were included in the
model. Only the interview mode was significant: when the interview was conducted in the PAPI
mode or the computer-assisted personal interviewing (CAPI) mode, the likelihood was significantly
greater than in cases where respondents filled out the form themselves. Duration in years since the
person participated in the SOEP had no effect (possibly indicating trust in the survey and its
coordinators).
Looking at the R2 values of the different models, we can see that the establishment level and
job/workplace characteristics appear to have the strongest influence on address naming. The size of
the organization appears to be by far the most important factor in the process. The person most
likely to respond to this request would be an apprentice with a lower secondary school degree who is
not a member of a professional association, who was interviewed face-to-face by an interviewer, and
who has a fixed-term contract at a public school or university that employs more than 2,000 people
and has a works council.
5.1.4 Selectivity and unit nonresponse at the employer level
A systematic process leading to unit nonresponse is likely be to cause biased estimates for variables
which are correlated with the factors that define the selection process. An example could be found at
the employer level when nonresponse is not random but due to self-selection of establishments into
the sample. Hence, it is important to know which characteristics determine the response process in
establishment surveys.
In contrast to household surveys, studies on response behavior in establishment surveys are rare in
the literature. A good overview of existing studies up to 2002 can be found in Willimack et al. (2001),
who adapted the standard model of participation in population surveys devised by Groves and
44
Couper (1998) to the context of business surveys. An update of their work in which they investigated
response patterns of large firms can be found in Willimack and Nichols (2010). A theoretical model of
the motivation to respond based on rational choice theories can be found in Schnabel (1997). There
are also a few unit nonresponse studies using German data; these studies are mainly based on the
IAB establishment panel. Janik (2011) looked at first-time participation in the panel, and by far the
strongest predictor he found was establishment size; that is, smaller establishments have a higher
response propensity than larger ones do. There also appeared to be interviewer effects: experienced,
professional interviewers were more successful in recruiting establishments for the survey.
Also regarding the IAB panel, Hartmann and Kohaut (2000) investigated attrition and found only
three substantial variables with significant effects: whether the establishment was looking for
employees, whether it was based in municipalities with a population of at least 100,000, and
whether the establishment belonged to the agricultural sector. Janik and Kohaut (2012), also looking
at attrition, noted that
the main influential factors are accordingly the size of the establishment, the
independence of the establishment surveyed, refusal to provide sensitive
information in the previous year and a number of variables which indirectly
suggest motivation (duration of participation, refusal in the previous year) (Janik
and Kohaut 2012, 21).
Here, large establishments refused to participate more frequently than small establishments did.
In investigating attrition in the Ifo Business Survey (IBS), Seiler (2013) reported differences across
economic sectors, and larger firms tended to drop out less often than smaller ones did:
the main reasons for different response behaviour are among the business’
characteristics since major differences were found across economic sectors and
larger firms tend less to nonresponse than smaller ones. Survey characteristics,
such as an additional survey request or a brief field period seem to play only a
minor role in the participation process. After controlling for these ’survey design
related’ effects, the willingness to participate also depends to a small extent on
the overall economic situation. In particular, in economic good times the
companies respond less often (Seiler 2013, 31f.).
Thus, the strongest and most robust predictor of participation, cross-sectionally or longitudinally,
appears to be size of establishment.
In the literature for Germany cited above, only one study investigated the first-time participation of
establishments empirically. Generally, unit nonresponse at the establishment level is difficult to
investigate because little is known about establishments that did not take part in the survey. The
situation is somewhat better in employee-first studies, because some of the information already
collected from the employees can be used to study unit nonresponse at the establishment level.
Information on establishments (e.g., the size of the organization or establishment and the industry in
which it is active) is often already available from individual surveys.
In the ALLBUS-BB study, particularly high response propensities were found in the health and social
sectors, as well as in public administration. It becomes apparent that these industries belong mainly
45
to the public or the social sector, or at least not to the private, profit-oriented sector, so perhaps the
capacity to respond to survey requests is less restricted in such organizations. Another possibility is
that such organizations feel obligated to respond to requests from other public bodies for the sake of
public interest and disclosure. In contrast, establishments that compete in the free market may feel
less inclined to disclose information of any kind. A particularly high response propensity was found
for establishments from interest groups and lobby organizations, which is not surprising because it is
usually their job to communicate with the public and express their views. In addition, it was found
that the larger the establishment, the greater the likelihood of a response. One reason for this could
be the existence of organization policies that prohibit participation in surveys for reasons related to
data confidentiality. It is also likely that “survey burden” plays a role here: typically, larger
organizations tend to be of particular interest to researchers in both the scientific and the
commercial context, so these establishments receive a large number of survey requests. This fact is
of note because, as indicated previously, employees of smaller establishments are less likely to
divulge their employer’s name and address (probably because it is more difficult to maintain
anonymity in these circumstances). Thus, when using the employee-first method, these effects
cancel each other out, at least partially.
Theoretical literature on the response process in establishment surveys is also scarce. Tomaskovic-
Devey et al. (1994) developed a model of organizational response to explain organizational unit
nonresponse to surveys. The so-called CAM Model has three main components: capacity (C),
authority (A), and motive (M). Capacity refers to the availability of the facts being requested so they
can actually be retrieved by the response person in the organization. Authority refers to the fact that
the decision to take part in the survey must be made by a person who actually has the right to do so.
Motive refers to readiness to take part in the survey; both the organization and the response person
must be willing and motivated to provide responses. Tomaskovic-Devey et al. (1994) assume that
these three factors determine the level of item nonresponse in the survey and that these factors
themselves depend on the structural characteristics of the organization. These authors prominently
allude to three types of organizational characteristics—structures, processes, and environments—
and introduce concepts such as “organizational slack,” “boundary spanning,” and “resource
dependence” (Tomaskovic-Devey et al. 1994, 82). This link to concepts of organizational theory
allows the CAM Model to stand out when compared with other research in the field of organizational
nonresponse and serves as a theoretical background here.
The remainder of this section is devoted to the results of our analysis of the response process among
establishments in the SOEP-LEE study. Variables of different levels were entered as three different
sets of covariates in a stepwise fashion. The pseudo-R2 of the different models gives some indication
as to which level of characteristics had the strongest impact on the likelihood to participate. Table 8
shows the results of the logistic regression models, and the variables used to predict participation in
the study will be presented next.
Organizational characteristics: Variables that relate to the establishment level included information
obtained from those SOEP respondents who named their employer. In our analysis, these variables
were the number of employees of the employer (categorized), the industry, and the presence of a
works council at the establishment (as reported by the SOEP respondent). One variable was the
interviewer’s assessment of the type of establishment, to be furnished on first contacting it,
combined with the same question from the employer questionnaire, hence available for both
respondents and nonrespondents. Based on the results after the first set of covariates was included
46
in the model, the results showed that, as expected, larger organizations were less likely to participate
in the interviews; however, this effect was significant only for the employers in the largest
organizations (i.e., those with more than 2,000 employees). There were also significant differences
between the different types of establishments: compared with independent establishments (the
reference category), public agencies in particular showed a significantly higher propensity to
respond. The same appeared to hold true for the headquarters of larger organizations.23 The
presence of a works council had no effect at this level.
Contact process: A second set of covariates stem from the contact form, in which the interviewers
had to describe the entire process of contacting the establishments. These variables included
number of contacts and information about whether the address provided was correct, whether the
advance letter was received by the company, whether the questionnaire was sent in advance to the
establishment by the interviewer, which mode of contact was used for the first contact, and who the
first contact person in the establishment was. All these variables were significantly related to the
likelihood that the establishment would respond to the survey process. The only exception was the
accuracy of the establishment’s address: even though interviewers reported errors for about 10
percent of the addresses they were assigned to visit, this condition did not appear to be related to
nonresponse, which is good news. Perhaps not surprisingly, the number of contacts with the
establishments was positively related to the likelihood to respond. The following conditions were
also positively related to the likelihood of a response: (a) the establishment reported having received
the advance letter; (b) the establishment had requested a copy of the questionnaire prior to the
interviewer’s visit; (c) the first contact was established in person rather than by telephone or other
methods; and (d) the first contact person was the actual target person.
However, although many of these contact-process variables were significantly related to
nonresponse, a causal relationship between these variables and the survey response remains
unclear. For example, requesting the questionnaire in advance might be a sign of potential interest in
the survey and therefore an indication of greater willingness to participate in surveys in general. Also,
whether an advance letter was received (and remembered) by the establishment might have to do
with internal structures of the establishment, which also affect the likelihood of responding. This also
holds for the mode of first contact attempt and the first contact person, two variables that surely
depend on the survey instructions and preferences of the interviewer, but also on organizational
characteristics, such as location, industry, size, internal structure, and others factors. Still, these
variables remained significant in Model 3 (Table 8) after the available establishment characteristics
had been controlled for.
These results basically remained the same when both sets of covariates were entered together.
Comparing the pseudo-R2 of the different sets of variables, it is striking that this value was relatively
low, even though a large number of establishment variables were included. This is an indication that
it is not the establishment level per se that plays a prominent role in explaining consent in
establishment surveys; rather, it is the personal characteristics of the individual response person who
receives the survey request. Overall, establishments most likely to respond were a public sector
23 For nonresponding establishments, this variable was collected on the contact form as an interviewer
observation.
47
agency or the headquarters of an organization with fewer than 200 employees from education that
had received the advance letter, and those in which the advance letter target person could be
directly contacted in person after the questionnaire had been sent beforehand.
5.2 Measurement
Threats to valid and reliable measurement can arise at different levels of the survey process, partly
because the respondents do not reply for themselves but as proxy informants on behalf of the
establishment. Depending on the position of the respondent and the topics covered in the survey,
the collection of relevant information may be burdensome and time-consuming (see Tomaskovic-
Devey et al. 1994, 1995). In this section, we examine the magnitude of measurement error in the
SOEP-LEE survey mainly by investigating the question of item nonresponse and its occurrence and
selectivity. Information about the response process is also available from the interview forms, which
solicited interviewers’ impressions regarding the accuracy and knowledge of the response person,
which may provide some indication of the quality of measurement in the survey. Some of the
responses to these questions will be presented next.
5.2.1 Interviewer reports with regard to measurement
To gather information on the response process as it took place within the establishments,
interviewers were asked to fill out a short questionnaire on the interview experience for each
interview they completed. These data can help provide additional impressions about data quality and
measurement issues in the SOEP-LEE study. Here, we present a descriptive overview of the results
from these interview reports.

48
Table 7. Logit models – likelihood of SOEP respondents providing an establishment address
Model 1 Model 2 Model 3 Model 4 Model 5
OR SE OR SE OR SE OR SE OR SE
Address provided
Size: 5–10 ref.
ref.
Size: 11–20 2.585*** −0.303
2.174*** −0.292
Size: 21–100 2.970*** −0.295
2.467*** −0.287
Size: 101–200 4.226*** −0.624
3.693*** −0.647
Size: 201–2,000 3.870*** −0.487
3.087*** −0.454
Size: > 2,001 4.497*** −0.594
3.767*** −0.587
Industry: Education ref.
ref.
Industry: Agriculture, hunting, and forestry 0.975 −0.263
1.039 −0.339
Industry: Manufacturing 0.866 −0.125
0.895 −0.184
Industry: Electricity, gas, and water supply 0.596+ −0.186
0.671 −0.258
Industry: Construction 0.731+ −0.131
0.627* −0.148
Industry: Wholesale and retail trade 0.748+ −0.114
0.745 −0.154
Industry: Hotels and restaurants 0.703+ −0.145
0.721 −0.19
Industry: Transport, storage, and communication 0.630* −0.119
0.591* −0.14
Industry: Financial intermediation 0.628* −0.132
0.654+ −0.168
Industry: Real estate, renting, and business activities 0.445*** −0.07
0.491*** −0.1
Industry: Public administration and defense; social security 0.824 −0.149
0.725 −.155
Industry: Health and social work 0.766+ −0.115
0.774 −0.146
Industry: Other community, social, and personal service
activities
0.663* −0.129
0.644+ −0.152
Industry: Activities of households 0.72 −0.215
0.587 −0.214
Region: West 0.983 −0.076
1.023 −0.096
Workers council present 1.628*** −0.155
1.417** −0.161
Employment status: FT
ref.
ref.
Employment status: Part-time
1.075 −0.104
0.989 −0.116
Employment status: Apprenticeship
1.545+ −0.353
1.856* −0.579
Employment status: Minor/irregular
1.167 −0.19
1.082 −0.211
Years with employer
1.010** −0.004
1.003 −0.005
Job change: No
ref.
ref.
Job change: None
0.98 −0.099
0.852 −0.097
Job change: First job
1.759 −0.63
2.164 −1.106
Temporary work
1.187 −0.249
0.686 −0.16
Public service
2.140*** −0.19
1.382* −0.184
Contract: Unlimited
ref.
ref.
Contract: Fixed-term
1.003 −0.122
1.017 −0.144
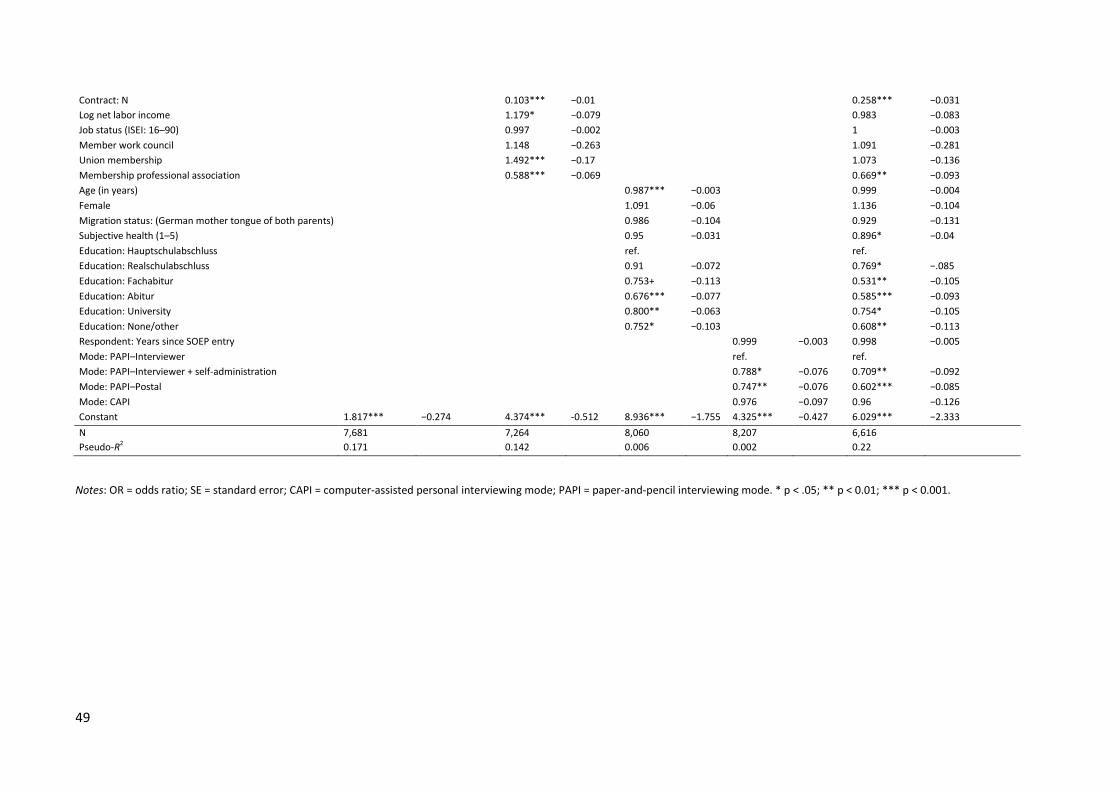
49
Contract: N
one
0.103*** −0.01
0.258*** −0.031
Log net labor income
1.179* −0.079
0.983 −0.083
Job status (ISEI: 16–90)
0.997 −0.002
1 −0.003
Member work council
1.148 −0.263
1.091 −0.281
Union membership
1.492*** −0.17
1.073 −0.136
Membership professional association
0.588*** −0.069
0.669** −0.093
Age (in years)
0.987*** −0.003
0.999 −0.004
Female
1.091 −0.06
1.136 −0.104
Migration status: (German mother tongue of both parents)
0.986 −0.104
0.929 −0.131
Subjective health (1–5)
0.95 −0.031
0.896* −0.04
Education: Hauptschulabschluss
ref.
ref.
Education: Realschulabschluss
0.91 −0.072
0.769* −.085
Education: Fachabitur
0.753+ −0.113
0.531** −0.105
Education: Abitur
0.676*** −0.077
0.585*** −0.093
Education: University
0.800** −0.063
0.754* −0.105
Education: None/other
0.752* −0.103
0.608** −0.113
Respondent: Years since SOEP entry
0.999 −0.003 0.998 −0.005
Mode: PAPI–Interviewer
ref.
ref.
Mode: PAPI–Interviewer + self-administration
0.788* −0.076 0.709** −0.092
Mode: PAPI–Postal
0.747** −0.076 0.602*** −0.085
Mode: CAPI
0.976 −0.097 0.96 −0.126
Constant 1.817*** −0.274 4.374*** -0.512 8.936*** −1.755 4.325*** −0.427 6.029*** −2.333
N 7,681
7,264
8,060
8,207
6,616
Pseudo-R2 0.171
0.142
0.006
0.002
0.22
Notes: OR = odds ratio; SE = standard error; CAPI = computer-assisted personal interviewing mode; PAPI = paper-and-pencil interviewing mode. * p < .05; ** p < 0.01; *** p < 0.001.
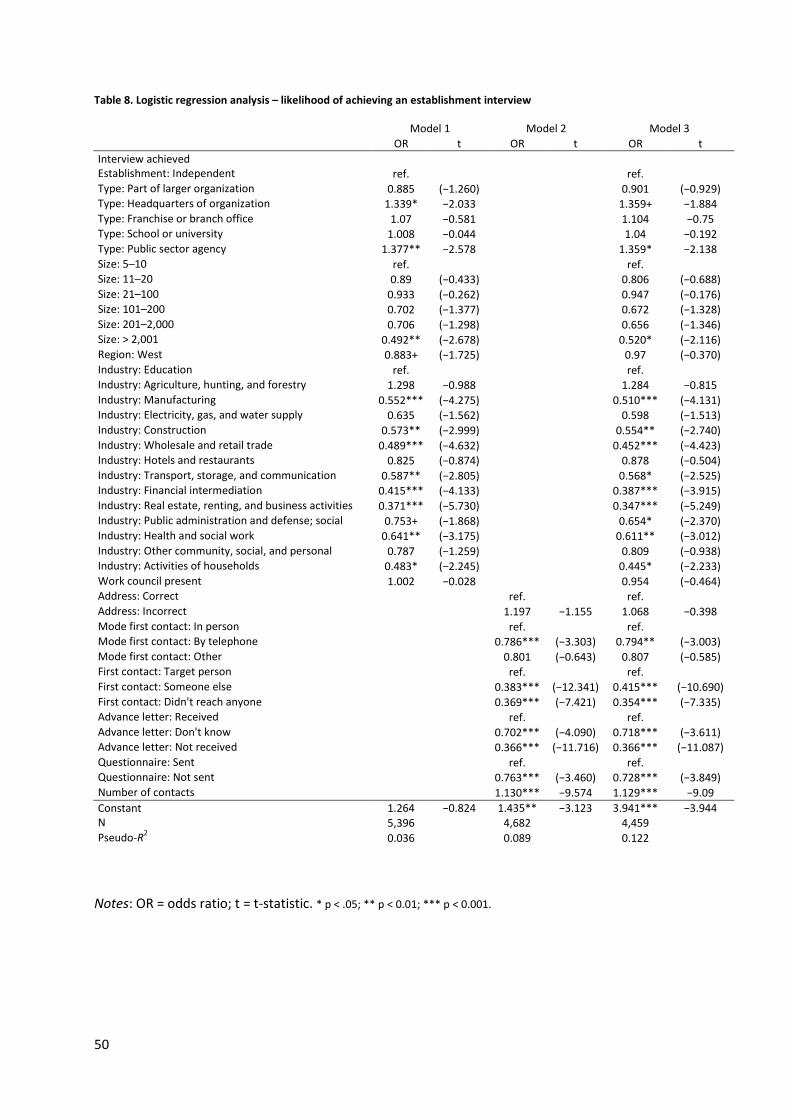
50
Table 8. Logistic regression analysis – likelihood of achieving an establishment interview
Model 1 Model 2 Model 3 OR t OR t OR t
Interview achieved
Establishment: Independent ref.
ref.
Type: Part of larger organization 0.885 (−1.260)
0.901 (−0.929)
Type: Headquarters of organization 1.339* −2.033
1.359+ −1.884
Type: Franchise or branch office 1.07 −0.581
1.104 −0.75
Type: School or university 1.008 −0.044
1.04 −0.192
Type: Public sector agency 1.377** −2.578
1.359* −2.138
Size: 5–10 ref.
ref.
Size: 11–20 0.89 (−0.433)
0.806 (−0.688)
Size: 21–100 0.933 (−0.262)
0.947 (−0.176)
Size: 101–200 0.702 (−1.377)
0.672 (−1.328)
Size: 201–2,000 0.706 (−1.298)
0.656 (−1.346)
Size: > 2,001 0.492** (−2.678)
0.520* (−2.116)
Region: West 0.883+ (−1.725)
0.97 (−0.370)
Industry: Education ref.
ref.
Industry: Agriculture, hunting, and forestry 1.298 −0.988
1.284 −0.815
Industry: Manufacturing 0.552*** (−4.275)
0.510*** (−4.131)
Industry: Electricity, gas, and water supply 0.635 (−1.562)
0.598 (−1.513)
Industry: Construction 0.573** (−2.999)
0.554** (−2.740)
Industry: Wholesale and retail trade 0.489*** (−4.632)
0.452*** (−4.423)
Industry: Hotels and restaurants 0.825 (−0.874)
0.878 (−0.504)
Industry: Transport, storage, and communication 0.587** (−2.805)
0.568* (−2.525)
Industry: Financial intermediation 0.415*** (−4.133)
0.387*** (−3.915)
Industry: Real estate, renting, and business activities 0.371*** (−5.730)
0.347*** (−5.249)
Industry: Public administration and defense; social
security
0.753+ (−1.868)
0.654* (−2.370)
Industry: Health and social work 0.641** (−3.175)
0.611** (−3.012)
Industry: Other community, social, and personal
service activities
0.787 (−1.259)
0.809 (−0.938)
Industry: Activities of households 0.483* (−2.245)
0.445* (−2.233)
Work council present 1.002 −0.028
0.954 (−0.464)
Address: Correct
ref.
ref.
Address: Incorrect
1.197 −1.155 1.068 −0.398
Mode first contact: In person ref.
ref.
Mode first contact: By telephone 0.786*** (−3.303) 0.794** (−3.003) Mode first contact: Other
0.801 (−0.643) 0.807 (−0.585)
First contact: Target person ref.
ref.
First contact: Someone else 0.383*** (−12.341) 0.415*** (−10.690) First contact: Didn't reach anyone 0.369*** (−7.421) 0.354*** (−7.335) Advance letter: Received
ref.
ref.
Advance letter: Don't know 0.702*** (−4.090) 0.718*** (−3.611) Advance letter: Not received 0.366*** (−11.716) 0.366*** (−11.087) Questionnaire: Sent
ref.
ref.
Questionnaire: Not sent
0.763*** (−3.460) 0.728*** (−3.849)
Number of contacts
1.130*** −9.574 1.129*** −9.09
Constant 1.264 −0.824 1.435** −3.123 3.941*** −3.944 N 5,396
4,682
4,459
Pseudo-R2 0.036
0.089
0.122
Notes: OR = odds ratio; t = t-statistic. * p < .05; ** p < 0.01; *** p < 0.001.
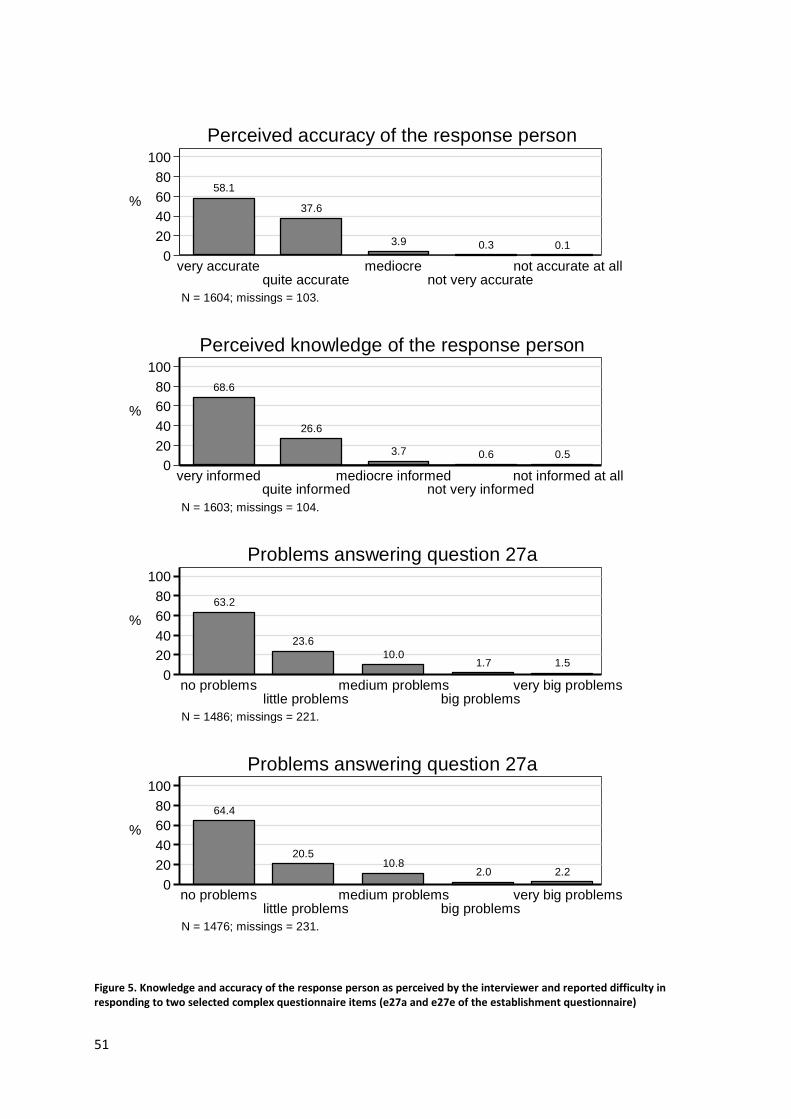
51
Figure 5. Knowledge and accuracy of the response person as perceived by the interviewer and reported difficulty in responding to two selected complex questionnaire items (e27a and e27e of the establishment questionnaire)
58.1
37.6
3.9 0.3 0.10
20
40
60
80
100
%
very accuratequite accurate
mediocrenot very accurate
not accurate at all
N = 1604; missings = 103.
Perceived accuracy of the response person
68.6
26.6
3.7 0.6 0.50
20
40
60
80
100
%
very informedquite informed
mediocre informednot very informed
not informed at all
N = 1603; missings = 104.
Perceived knowledge of the response person
63.2
23.6
10.01.7 1.5
0
20
40
60
80
100
%
no problemslittle problems
medium problemsbig problems
very big problems
N = 1486; missings = 221.
Problems answering question 27a
64.4
20.510.8
2.0 2.2
0
20
40
60
80
100
%
no problemslittle problems
medium problemsbig problems
very big problems
N = 1476; missings = 231.
Problems answering question 27a
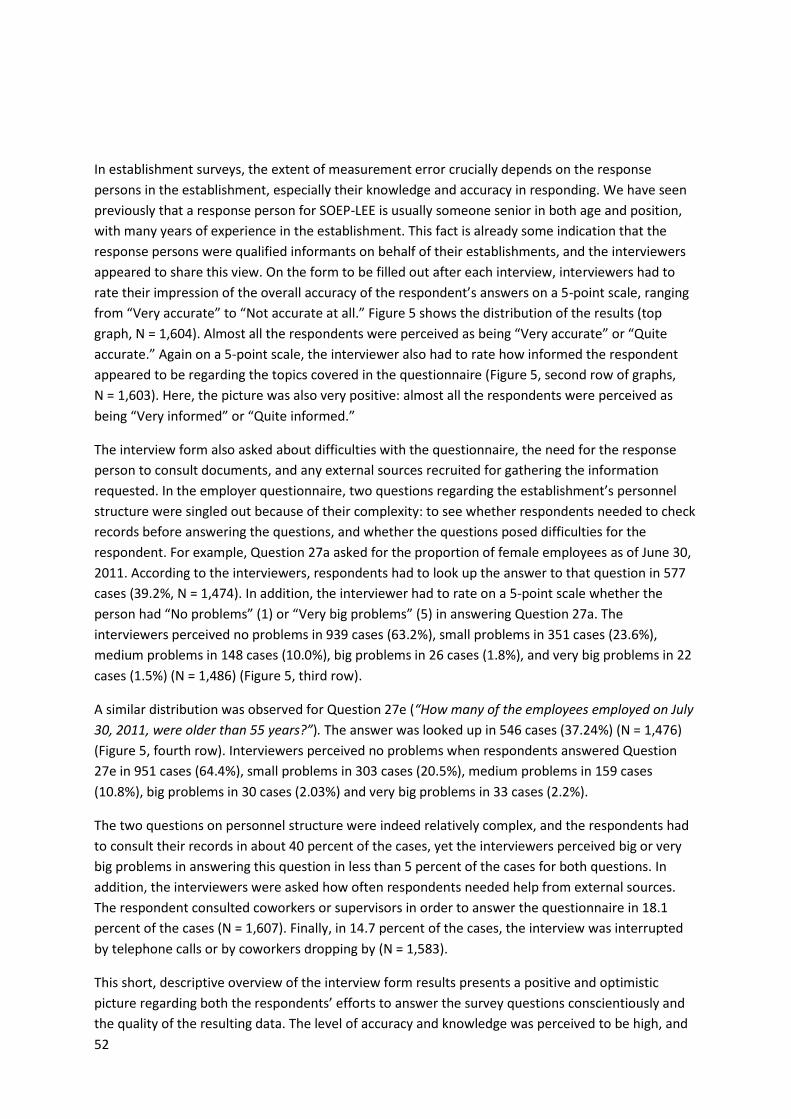
52
In establishment surveys, the extent of measurement error crucially depends on the response
persons in the establishment, especially their knowledge and accuracy in responding. We have seen
previously that a response person for SOEP-LEE is usually someone senior in both age and position,
with many years of experience in the establishment. This fact is already some indication that the
response persons were qualified informants on behalf of their establishments, and the interviewers
appeared to share this view. On the form to be filled out after each interview, interviewers had to
rate their impression of the overall accuracy of the respondent’s answers on a 5-point scale, ranging
from “Very accurate” to “Not accurate at all.” Figure 5 shows the distribution of the results (top
graph, N = 1,604). Almost all the respondents were perceived as being “Very accurate” or “Quite
accurate.” Again on a 5-point scale, the interviewer also had to rate how informed the respondent
appeared to be regarding the topics covered in the questionnaire (Figure 5, second row of graphs,
N = 1,603). Here, the picture was also very positive: almost all the respondents were perceived as
being “Very informed” or “Quite informed.”
The interview form also asked about difficulties with the questionnaire, the need for the response
person to consult documents, and any external sources recruited for gathering the information
requested. In the employer questionnaire, two questions regarding the establishment’s personnel
structure were singled out because of their complexity: to see whether respondents needed to check
records before answering the questions, and whether the questions posed difficulties for the
respondent. For example, Question 27a asked for the proportion of female employees as of June 30,
2011. According to the interviewers, respondents had to look up the answer to that question in 577
cases (39.2%, N = 1,474). In addition, the interviewer had to rate on a 5-point scale whether the
person had “No problems” (1) or “Very big problems” (5) in answering Question 27a. The
interviewers perceived no problems in 939 cases (63.2%), small problems in 351 cases (23.6%),
medium problems in 148 cases (10.0%), big problems in 26 cases (1.8%), and very big problems in 22
cases (1.5%) (N = 1,486) (Figure 5, third row).
A similar distribution was observed for Question 27e (“How many of the employees employed on July
30, 2011, were older than 55 years?”). The answer was looked up in 546 cases (37.24%) (N = 1,476)
(Figure 5, fourth row). Interviewers perceived no problems when respondents answered Question
27e in 951 cases (64.4%), small problems in 303 cases (20.5%), medium problems in 159 cases
(10.8%), big problems in 30 cases (2.03%) and very big problems in 33 cases (2.2%).
The two questions on personnel structure were indeed relatively complex, and the respondents had
to consult their records in about 40 percent of the cases, yet the interviewers perceived big or very
big problems in answering this question in less than 5 percent of the cases for both questions. In
addition, the interviewers were asked how often respondents needed help from external sources.
The respondent consulted coworkers or supervisors in order to answer the questionnaire in 18.1
percent of the cases (N = 1,607). Finally, in 14.7 percent of the cases, the interview was interrupted
by telephone calls or by coworkers dropping by (N = 1,583).
This short, descriptive overview of the interview form results presents a positive and optimistic
picture regarding both the respondents’ efforts to answer the survey questions conscientiously and
the quality of the resulting data. The level of accuracy and knowledge was perceived to be high, and
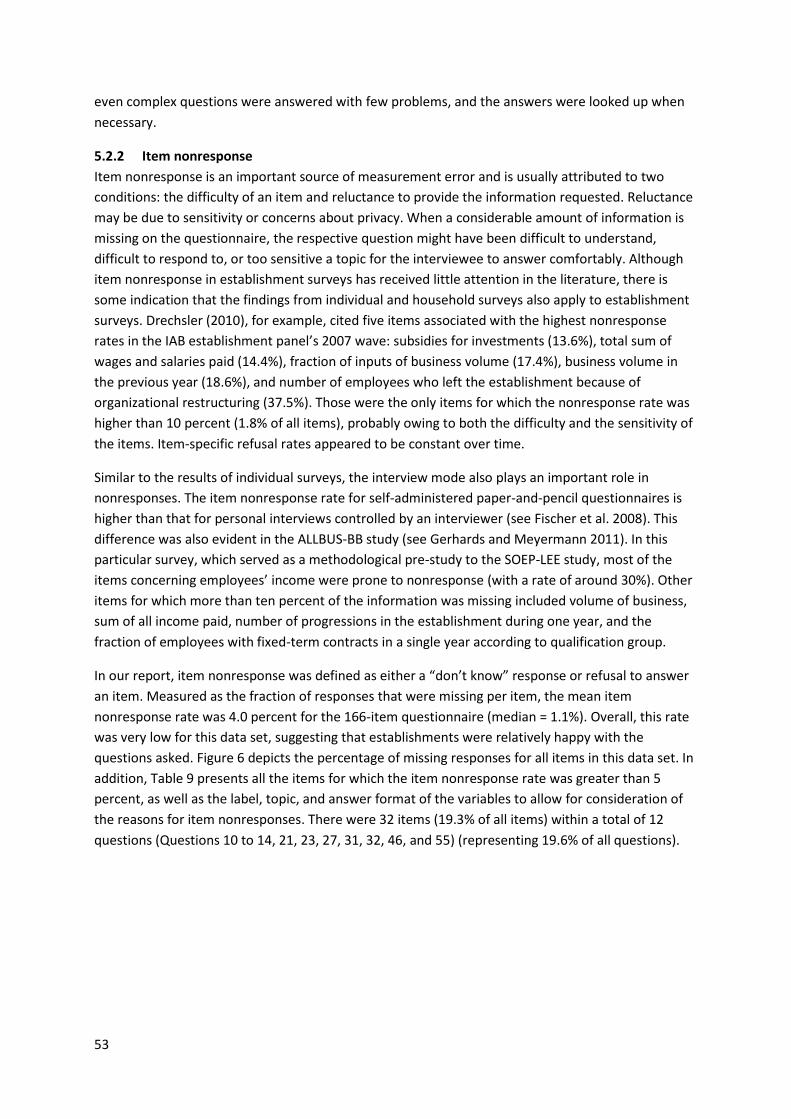
53
even complex questions were answered with few problems, and the answers were looked up when
necessary.
5.2.2 Item nonresponse
Item nonresponse is an important source of measurement error and is usually attributed to two
conditions: the difficulty of an item and reluctance to provide the information requested. Reluctance
may be due to sensitivity or concerns about privacy. When a considerable amount of information is
missing on the questionnaire, the respective question might have been difficult to understand,
difficult to respond to, or too sensitive a topic for the interviewee to answer comfortably. Although
item nonresponse in establishment surveys has received little attention in the literature, there is
some indication that the findings from individual and household surveys also apply to establishment
surveys. Drechsler (2010), for example, cited five items associated with the highest nonresponse
rates in the IAB establishment panel’s 2007 wave: subsidies for investments (13.6%), total sum of
wages and salaries paid (14.4%), fraction of inputs of business volume (17.4%), business volume in
the previous year (18.6%), and number of employees who left the establishment because of
organizational restructuring (37.5%). Those were the only items for which the nonresponse rate was
higher than 10 percent (1.8% of all items), probably owing to both the difficulty and the sensitivity of
the items. Item-specific refusal rates appeared to be constant over time.
Similar to the results of individual surveys, the interview mode also plays an important role in
nonresponses. The item nonresponse rate for self-administered paper-and-pencil questionnaires is
higher than that for personal interviews controlled by an interviewer (see Fischer et al. 2008). This
difference was also evident in the ALLBUS-BB study (see Gerhards and Meyermann 2011). In this
particular survey, which served as a methodological pre-study to the SOEP-LEE study, most of the
items concerning employees’ income were prone to nonresponse (with a rate of around 30%). Other
items for which more than ten percent of the information was missing included volume of business,
sum of all income paid, number of progressions in the establishment during one year, and the
fraction of employees with fixed-term contracts in a single year according to qualification group.
In our report, item nonresponse was defined as either a “don’t know” response or refusal to answer
an item. Measured as the fraction of responses that were missing per item, the mean item
nonresponse rate was 4.0 percent for the 166-item questionnaire (median = 1.1%). Overall, this rate
was very low for this data set, suggesting that establishments were relatively happy with the
questions asked. Figure 6 depicts the percentage of missing responses for all items in this data set. In
addition, Table 9 presents all the items for which the item nonresponse rate was greater than 5
percent, as well as the label, topic, and answer format of the variables to allow for consideration of
the reasons for item nonresponses. There were 32 items (19.3% of all items) within a total of 12
questions (Questions 10 to 14, 21, 23, 27, 31, 32, 46, and 55) (representing 19.6% of all questions).
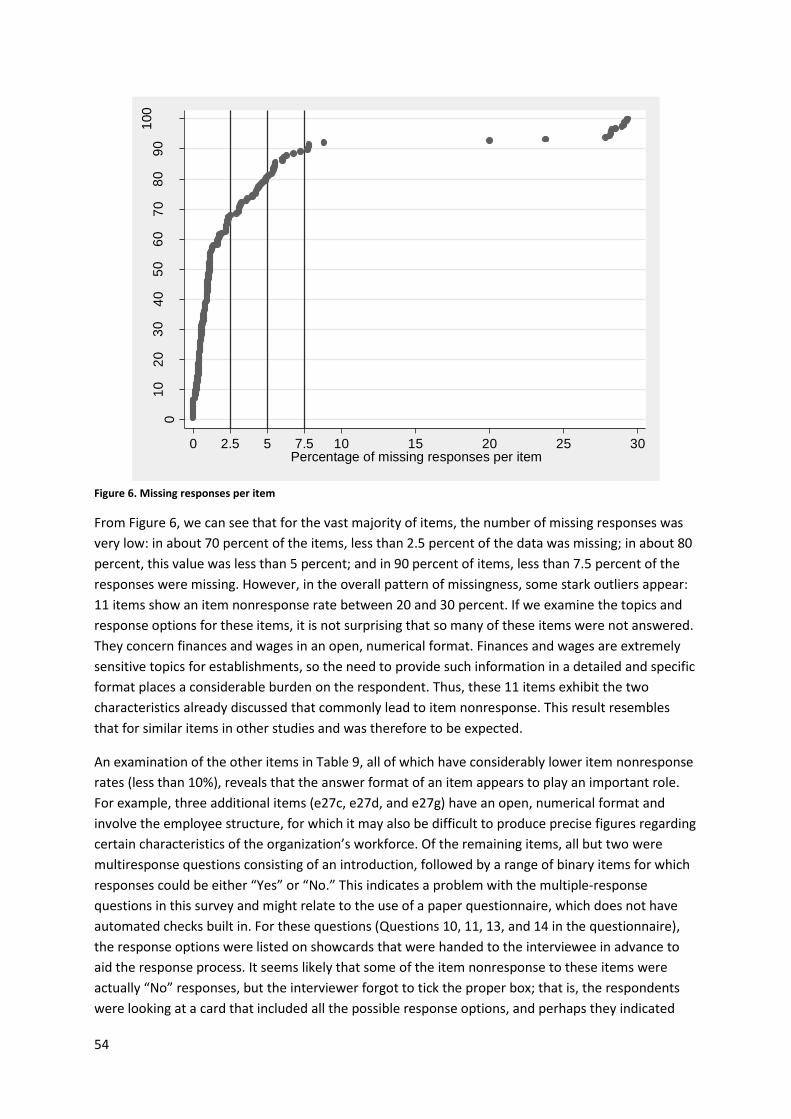
54
Figure 6. Missing responses per item
From Figure 6, we can see that for the vast majority of items, the number of missing responses was
very low: in about 70 percent of the items, less than 2.5 percent of the data was missing; in about 80
percent, this value was less than 5 percent; and in 90 percent of items, less than 7.5 percent of the
responses were missing. However, in the overall pattern of missingness, some stark outliers appear:
11 items show an item nonresponse rate between 20 and 30 percent. If we examine the topics and
response options for these items, it is not surprising that so many of these items were not answered.
They concern finances and wages in an open, numerical format. Finances and wages are extremely
sensitive topics for establishments, so the need to provide such information in a detailed and specific
format places a considerable burden on the respondent. Thus, these 11 items exhibit the two
characteristics already discussed that commonly lead to item nonresponse. This result resembles
that for similar items in other studies and was therefore to be expected.
An examination of the other items in Table 9, all of which have considerably lower item nonresponse
rates (less than 10%), reveals that the answer format of an item appears to play an important role.
For example, three additional items (e27c, e27d, and e27g) have an open, numerical format and
involve the employee structure, for which it may also be difficult to produce precise figures regarding
certain characteristics of the organization’s workforce. Of the remaining items, all but two were
multiresponse questions consisting of an introduction, followed by a range of binary items for which
responses could be either “Yes” or “No.” This indicates a problem with the multiple-response
questions in this survey and might relate to the use of a paper questionnaire, which does not have
automated checks built in. For these questions (Questions 10, 11, 13, and 14 in the questionnaire),
the response options were listed on showcards that were handed to the interviewee in advance to
aid the response process. It seems likely that some of the item nonresponse to these items were
actually “No” responses, but the interviewer forgot to tick the proper box; that is, the respondents
were looking at a card that included all the possible response options, and perhaps they indicated
01
02
03
04
05
06
07
08
09
01
00
Pe
rcen
tage
of Item
s
0 2.5 5 7.5 10 15 20 25 30Percentage of missing responses per item
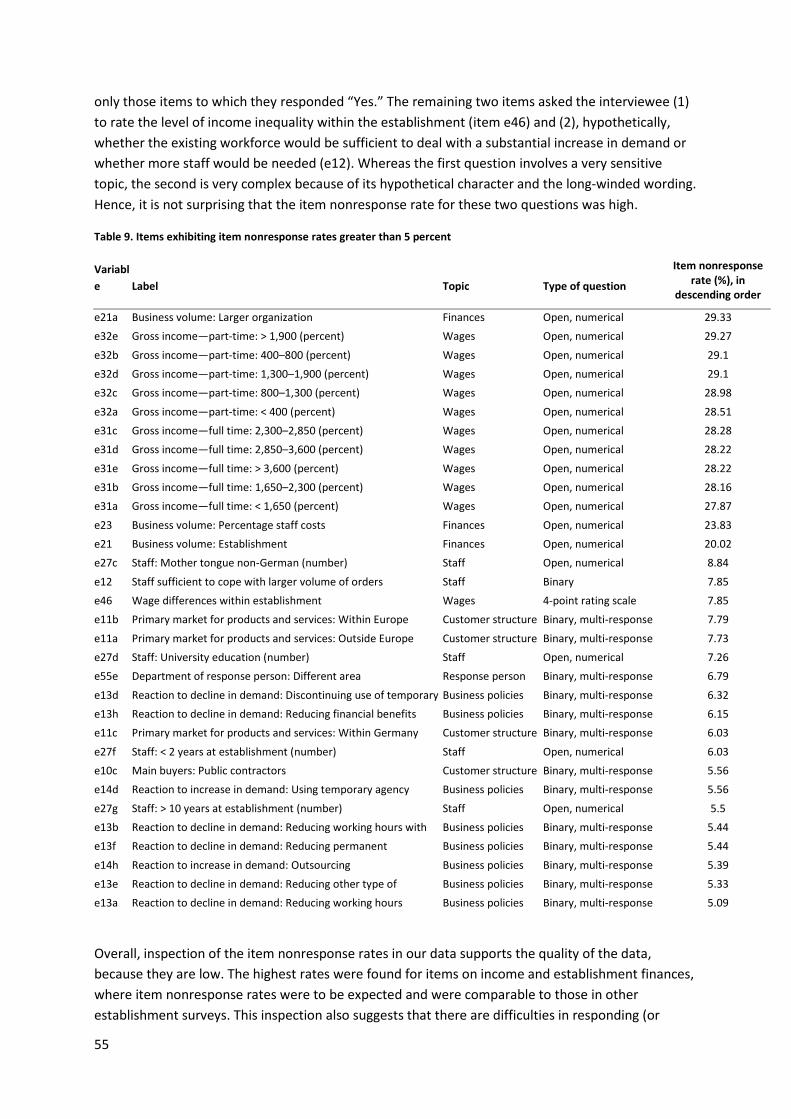
55
only those items to which they responded “Yes.” The remaining two items asked the interviewee (1)
to rate the level of income inequality within the establishment (item e46) and (2), hypothetically,
whether the existing workforce would be sufficient to deal with a substantial increase in demand or
whether more staff would be needed (e12). Whereas the first question involves a very sensitive
topic, the second is very complex because of its hypothetical character and the long-winded wording.
Hence, it is not surprising that the item nonresponse rate for these two questions was high.
Table 9. Items exhibiting item nonresponse rates greater than 5 percent
Variabl
e Label Topic Type of question
Item nonresponse rate (%), in
descending order
e21a Business volume: Larger organization Finances Open, numerical 29.33
e32e Gross income—part-time: > 1,900 (percent) Wages Open, numerical 29.27
e32b Gross income—part-time: 400–800 (percent) Wages Open, numerical 29.1
e32d Gross income—part-time: 1,300–1,900 (percent) Wages Open, numerical 29.1
e32c Gross income—part-time: 800–1,300 (percent) Wages Open, numerical 28.98
e32a Gross income—part-time: < 400 (percent) Wages Open, numerical 28.51
e31c Gross income—full time: 2,300–2,850 (percent) Wages Open, numerical 28.28
e31d Gross income—full time: 2,850–3,600 (percent) Wages Open, numerical 28.22
e31e Gross income—full time: > 3,600 (percent) Wages Open, numerical 28.22
e31b Gross income—full time: 1,650–2,300 (percent) Wages Open, numerical 28.16
e31a Gross income—full time: < 1,650 (percent) Wages Open, numerical 27.87
e23 Business volume: Percentage staff costs Finances Open, numerical 23.83
e21 Business volume: Establishment Finances Open, numerical 20.02
e27c Staff: Mother tongue non-German (number) Staff Open, numerical 8.84
e12 Staff sufficient to cope with larger volume of orders Staff Binary 7.85
e46 Wage differences within establishment Wages 4-point rating scale 7.85
e11b Primary market for products and services: Within Europe Customer structure Binary, multi-response 7.79
e11a Primary market for products and services: Outside Europe Customer structure Binary, multi-response 7.73
e27d Staff: University education (number) Staff Open, numerical 7.26
e55e Department of response person: Different area Response person Binary, multi-response 6.79
e13d Reaction to decline in demand: Discontinuing use of temporary
agency workers
Business policies Binary, multi-response 6.32
e13h Reaction to decline in demand: Reducing financial benefits Business policies Binary, multi-response 6.15
e11c Primary market for products and services: Within Germany Customer structure Binary, multi-response 6.03
e27f Staff: < 2 years at establishment (number) Staff Open, numerical 6.03
e10c Main buyers: Public contractors Customer structure Binary, multi-response 5.56
e14d Reaction to increase in demand: Using temporary agency
workers
Business policies Binary, multi-response 5.56
e27g Staff: > 10 years at establishment (number) Staff Open, numerical 5.5
e13b Reaction to decline in demand: Reducing working hours with
reduction in wage costs
Business policies Binary, multi-response 5.44
e13f Reaction to decline in demand: Reducing permanent
employees
Business policies Binary, multi-response 5.44
e14h Reaction to increase in demand: Outsourcing Business policies Binary, multi-response 5.39
e13e Reaction to decline in demand: Reducing other type of
temporary workers
Business policies Binary, multi-response 5.33
e13a Reaction to decline in demand: Reducing working hours
without wage compensation
Business policies Binary, multi-response 5.09
Overall, inspection of the item nonresponse rates in our data supports the quality of the data,
because they are low. The highest rates were found for items on income and establishment finances,
where item nonresponse rates were to be expected and were comparable to those in other
establishment surveys. This inspection also suggests that there are difficulties in responding (or

56
recording responses) with multiple-response questions in paper-and-pencil surveys with long lists of
response categories. In addition, questions about hypothetical situations are prone to high item
nonresponse rates, at least when they are not worded succinctly. Finally, the high rate of item
nonresponse to the question about within-establishment wage inequality suggests that this is a
sensitive topic to broach in organizational surveys.
5.2.3 The SOEP-LEE interviewer staff
Being an interviewer in SOEP-LEE was particularly demanding. For this study, the interviewers had a
wide range of tasks and functions to carry out that went far beyond simply asking the right questions
correctly, namely:
Locating and contacting establishments;
Selecting and identifying informants within the establishment;
Informing respondents about the survey: its purpose, topics addressed, sponsorship, and
data security;
Gaining cooperation;
Scheduling a date for the interview and conducting the interview;
Picking up the completed paper questionnaire after a few days (when self-administered);
Documenting the entire process by filling out the contact form and the interview form; and
Filling out the interviewer questionnaire.
Because of this wide range of diverse tasks, which were central to the success of the study,
interviewers could have a significant impact on the quality of the survey. Two survey characteristics
the interviewers could influence during the survey process were the duration of the interview and
the number of missing responses. Figure 7 shows the interview duration per interviewer and missing
items per interviewer. As can be seen, there were some outliers regarding both characteristics
representing high average values of either duration or missing items. Overall, one must keep in mind
that there were a large number of interviewers working on the SOEP-LEE study (N = 502), which led
to a small number of interviews per interviewer, thereby reducing the potential effects of
interviewers on data quality.
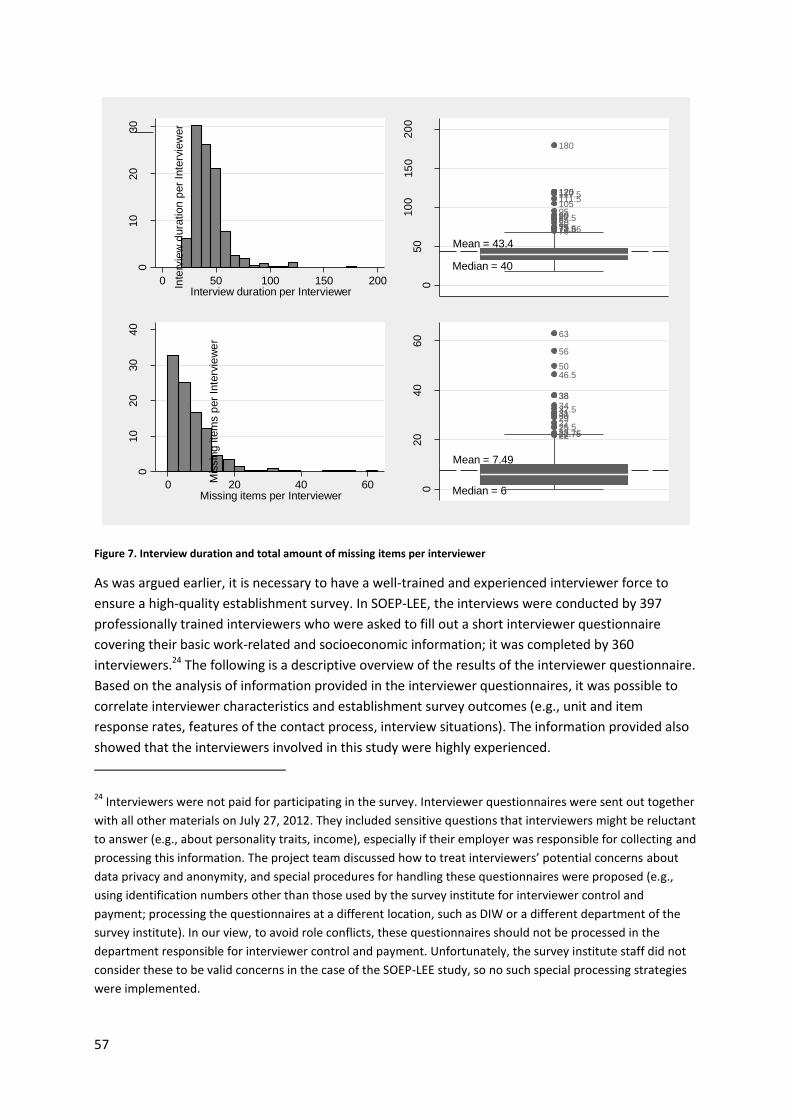
57
Figure 7. Interview duration and total amount of missing items per interviewer
As was argued earlier, it is necessary to have a well-trained and experienced interviewer force to
ensure a high-quality establishment survey. In SOEP-LEE, the interviews were conducted by 397
professionally trained interviewers who were asked to fill out a short interviewer questionnaire
covering their basic work-related and socioeconomic information; it was completed by 360
interviewers.24 The following is a descriptive overview of the results of the interviewer questionnaire.
Based on the analysis of information provided in the interviewer questionnaires, it was possible to
correlate interviewer characteristics and establishment survey outcomes (e.g., unit and item
response rates, features of the contact process, interview situations). The information provided also
showed that the interviewers involved in this study were highly experienced.
24 Interviewers were not paid for participating in the survey. Interviewer questionnaires were sent out together
with all other materials on July 27, 2012. They included sensitive questions that interviewers might be reluctant
to answer (e.g., about personality traits, income), especially if their employer was responsible for collecting and
processing this information. The project team discussed how to treat interviewers’ potential concerns about
data privacy and anonymity, and special procedures for handling these questionnaires were proposed (e.g.,
using identification numbers other than those used by the survey institute for interviewer control and
payment; processing the questionnaires at a different location, such as DIW or a different department of the
survey institute). In our view, to avoid role conflicts, these questionnaires should not be processed in the
department responsible for interviewer control and payment. Unfortunately, the survey institute staff did not
consider these to be valid concerns in the case of the SOEP-LEE study, so no such special processing strategies
were implemented.
010
20
30
Pe
rcen
t
0 50 100 150 200Interview duration per Interviewer
7072.572.8673.5757575808587.5909095105111.5117.5120120120
180
Mean = 43.4
Median = 40
050
10
015
020
0
Inte
rvie
w d
ura
tion
per
Inte
rvie
wer
010
20
30
40
Pe
rcen
t
0 20 40 60Missing items per Interviewer
222222.7522.752525.5272930313132.5343838
46.550
56
63
Mean = 7.49
Median = 6020
40
60
Mis
sin
g ite
ms p
er
Inte
rvie
we
r
58
First, the interviewer questionnaire collected some basic sociodemographic information regarding
the interviewer force: 65 percent of the interviewers were male, and the mean age of the force was
63 years (median = 64 years); the youngest interviewer was 34 and the oldest 90 years of age. The
majority of interviewers (53.6%) had at least a Fachhochschulreife degree, and almost one in four
(23.7%) had a university degree. The most frequent single degree, however, was the
Realschul-/Mittlere Reife degree (31%). Thus, the demographic profile of the interviewer force is
typical for face-to-face studies in Germany, which consists of mostly male interviewers close to
retirement age.
Another set of questions concerned the interviewers’ work experience. On average, the length of
time they were employed as interviewers by the fieldwork organization or another survey institute
was 12.4 years (median = 10 years). The least experienced interviewer had work experience totaling
2 months, whereas for the most experienced interviewer this term was 52 years. The force spent an
average of 18.6 hours (median = 17 hours) per week working as interviewers for the survey agency,
3.8 hours (median = 0 hours) working as interviewers for other survey institutes, and 9 hours
(median = 0 hours) working in other occupations.25 The estimated average number of interviews
conducted per year was 330 (maximum = 2,500; minimum = 4). When asked which other surveys
they had worked on in the same year, 80 percent of the interviewers stated that they had also
worked as interviewers for the SOEP study (known to the participants as “Leben in Deutschland”), 90
percent conducted the IAB Establishment Panel, and 74 percent worked on other establishment
surveys. Thus most of the interviewers in the SOEP-LEE study were indeed well qualified, had worked
as interviewers for a long time, and had also worked on establishment surveys and were therefore
familiar with the specific challenges of such a survey.
The interviewers were also asked about their use of communication technology and their opinion
about data protection, because the former could influence their approach to contacting and locating
establishments, while the latter could affect how they handled and requested confidential
information. Of all the interviewers, 93 percent reported that they had access to the Internet; all
used the Internet for e-mail communication; 96 percent used it for online banking; 93 percent to
search for addresses and telephone numbers; 61 percent for online shopping; 71 percent for social
networking; and 24 percent for route planning. Regarding concerns about the protection of personal
data, 14 percent of all the interviewers stated that they were very concerned; 30 percent stated that
they were quite concerned; 45 percent stated that they were somewhat concerned; and 12 percent
stated that they were not all concerned. Finally, they were asked whether they thought it was more
difficult to achieve an interview in establishment surveys than in standard household surveys.
Establishment surveys were considered much more difficult by 15 percent; somewhat more difficult
by 20 percent; for 45 percent there was no difference; for 15 percent they were a little easier; and
for 5 percent they were much easier. Thus, there was no indication that establishment surveys were
generally perceived to be more difficult to conduct than household surveys; rather, this appeared to
depend on the individual interviewer.
25 In addition to their jobs as interviewers, 45 persons stated that they were fully employed, and 21 were
employed part-time (19 were in minor subsidized jobs, and 10 were unemployed). 178 interviewers were
pensioners; 28 were doing mainly household chores; and 5 were students.
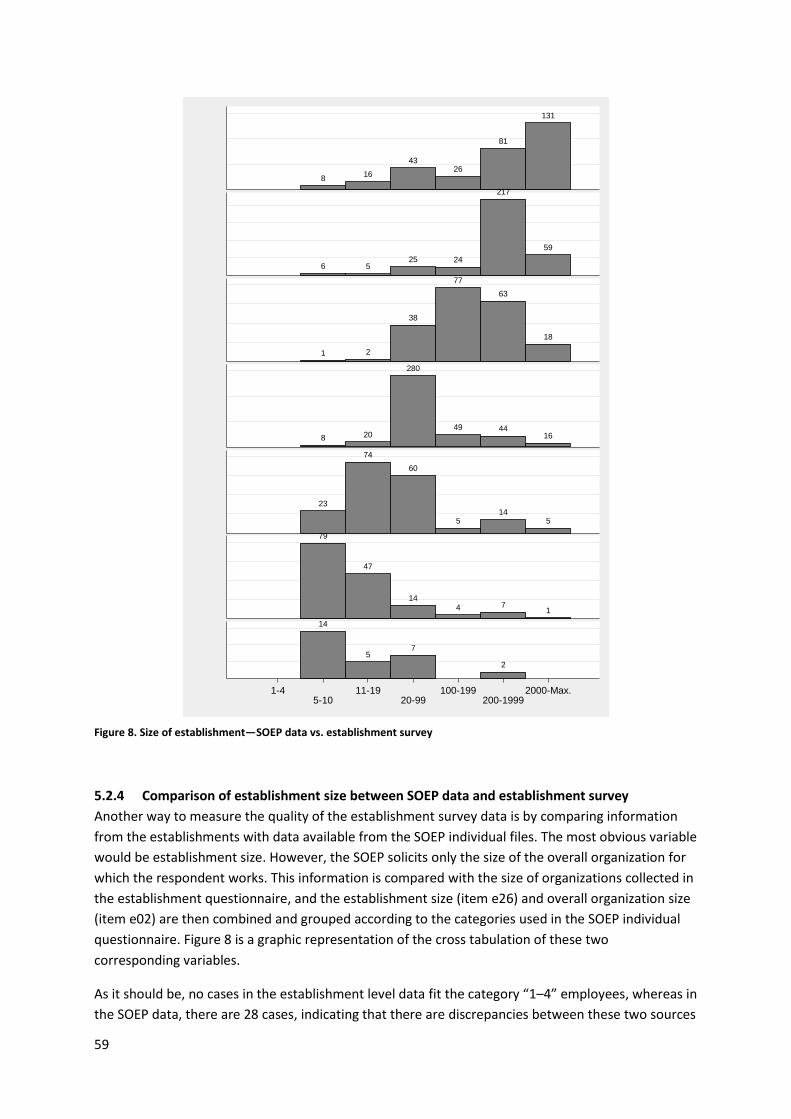
59
Figure 8. Size of establishment—SOEP data vs. establishment survey
5.2.4 Comparison of establishment size between SOEP data and establishment survey
Another way to measure the quality of the establishment survey data is by comparing information
from the establishments with data available from the SOEP individual files. The most obvious variable
would be establishment size. However, the SOEP solicits only the size of the overall organization for
which the respondent works. This information is compared with the size of organizations collected in
the establishment questionnaire, and the establishment size (item e26) and overall organization size
(item e02) are then combined and grouped according to the categories used in the SOEP individual
questionnaire. Figure 8 is a graphic representation of the cross tabulation of these two
corresponding variables.
As it should be, no cases in the establishment level data fit the category “1–4” employees, whereas in
the SOEP data, there are 28 cases, indicating that there are discrepancies between these two sources
816
4326
81
131
SO
EP
: 2000-M
ax.
6 525 24
217
59
SO
EP
: 200-1
999
1 2
38
77
63
18
SO
EP
: 100-1
99
8 20
280
49 4416S
OE
P: 20-9
9
23
74
60
514
5SO
EP
: 11-1
9
79
47
14
4 71
SO
EP
: 5-1
0
14
57
2
SO
EP
: 1-4
1-45-10
11-1920-99
100-199200-1999
2000-Max.
Fre
quency
60
of information. One has to keep in mind that the individual SOEP data may also contain errors,
especially because this particular question does not clearly define what is being asked for—some
respondents infer the local establishment, while others infer the upper level of the employer’s
organization. Judging from the overall pattern, however, a clear correlation can be detected. This is
underscored by the polychoric correlation rho for the two ordinal categorical variables, which is 0.70,
indicating a strong interrelationship. Another candidate for such a comparison would be the category
industry, but, again, this is hampered by the use of different industry classifications in the two data
sources.
5.3 Summary
We began this section by investigating the representativeness of the sample. When using the
employee-first approach, it is important to start from a sample of individuals that represents the
population or, more precisely, the workforce within the population. The SOEP team does everything
possible to achieve a sample which is a good representations of the general population in Germany,
at both the household and the individual levels; the weighting scheme, which includes post-
stratification adjustments to the distribution of major characteristics, is based on the German
microcensus. Employees in Germany can be conceived of as a subsample of the general population,
which should not be biased if the overall sample is unbiased. Because they use different
classifications, it is not feasible to compare the distribution of SOEP employees with official statistics
in terms of occupation or industry classifications. However, the SOEP can still be considered a
suitable and valid starting point for the employee-first method owing to its overall
representativeness. In addition, the final sample of establishments is broadly representative of the
population of establishments in Germany. A comparison of the weighted SOEP-LEE data with
employer data derived from the German employment agency yielded an acceptable fit for the
distribution of three characteristics: size, region (federal states), and industry.
Next, we analyzed nonresponses at two levels: (1) employees providing the names and addresses of
their employers and (2) establishments participating in the establishment survey. The analyses
showed that the response process and the losses that occurred at these two steps of the sampling
process were not entirely random but exhibited patterns of systematic nonresponse. This is
important information and must be kept in mind when analyzing the data. It is also interesting to see
how the different effects at the two levels interacted with each other: for example, the larger an
organization, the more likely it was that the SOEP respondents would provide this contact
information, but the less likely it was that the establishment would actually respond to the survey
request. Here, the two effects at the two levels potentially canceled each other out. However,
cumulative effects were also present: public sector employees were more likely to name their
employer, and public sector establishments were more likely to respond, potentially leading to
overrepresentation of the public sector (especially educational agencies) in the SOEP-LEE sample.
Thus, analysts of the data should look into the sample composition and the factors influencing
responses before they run their analyses and interpret their results.
Finally, data quality and measurement error were investigated through the interviewers’ evaluations
of the interview situation and an analysis of item nonresponses in the final data set. The interviewers
noted only a few problems with the response process and the interview situation. Overwhelmingly,
they perceived the response persons to be knowledgeable and accurate, and according to the
interviewers, even complex and burdensome questions were answered to the best of their abilities.
61
Overall, the analysis of item nonresponses showed that missingness in the data is low. The item
nonresponse rate was high (up to 30%) for only a few items, especially those concerning financial
information about the establishment. Yet, all in all, missing information at the item level was not a
major problem in the SOEP-LEE study. Both the inspection of item nonresponse rates and the
interviewer observations concerning the response process appear to confirm that the quality of the
data was good.
6 Data edits, confidentiality, anonymization, dissemination, and linkage In this section, we focus on how the data collected from the establishment surveys were handled.
This includes its dissemination and use, as well as a consideration of data confidentiality and how the
anonymization of the data is ensured, which can be particularly challenging in establishment surveys.
First, we discuss edits made to the data by the SOEP-LEE team so data users are aware of these
changes. Also covered is some basic information about the data sets and how to handle them; for
example, how to link the establishment data and SOEP-LEE data is done practically.
6.1 Edits and checks by the project team This paragraph describes edits to the data made by the project team after the data were delivered by
the fieldwork organization and before they were published.
6.1.1 Back-coding of open responses
In Question 55, verbatim answers to the “other” response category were permissible. Whenever
possible, these open responses were checked and coded back into the pre-existing answer
categories. A total of 62 responses were coded into the original response categories. A similar
procedure was applied to Question 18a, which asked for a verbatim response concerning the legal
structure of the larger organization when applicable. Verbatim responses to this question were
coded back into the answer format of Question 18, which asked about the legal form of the
establishment (i.e., the smaller unit). A total of 21 responses were recoded by this method into a
new, categorical variable that was provided as part of the published data set.
6.1.2 Filter errors
Filter errors occur when filters in the questionnaire are not followed correctly, resulting in one of two
situations: either a question was asked that should not have been posed to specific respondents or,
vice versa, questions that should have been posed to certain respondents were not asked. In the
former case, the question usually does not apply to the respondent (and should therefore not be
asked), whereas the latter situation results in missing values. The number of errors was relatively
high because the filter instructions were not strictly followed, which may have been due to
difficulties in routing, insufficient training of the interviewers, or poor questionnaire design.
Nevertheless, most of the filter errors led to unnecessary questions being asked, which can be a
nuisance for respondents but at least does not lead to missing data. Hence, in cases where
respondents were asked questions incorrectly, the responses were designated “not applicable” at
the editing stage.
6.1.3 Multiple-response items
There also appeared to be a problem with Question 55, for which missing data were common. Upon
examining the question, the project team attributed the problem to its multi-response nature, which
had not been recognized by some respondents (or interviewers). In many instances, the respondent
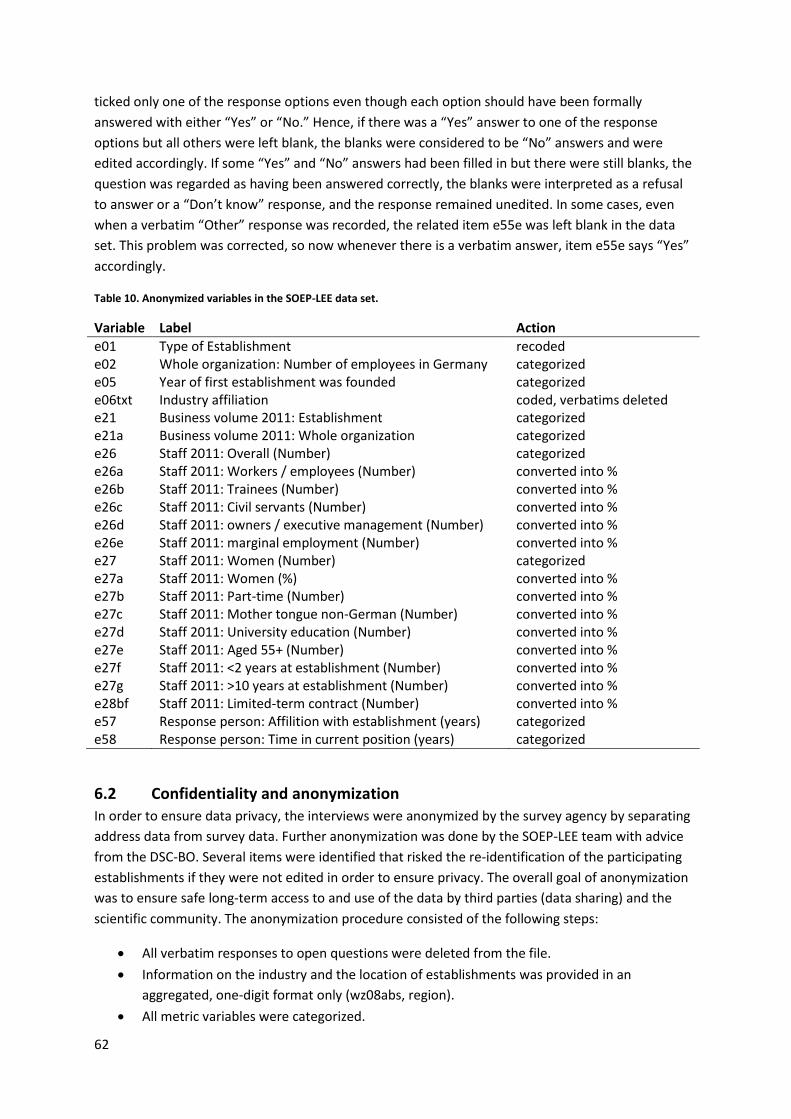
62
ticked only one of the response options even though each option should have been formally
answered with either “Yes” or “No.” Hence, if there was a “Yes” answer to one of the response
options but all others were left blank, the blanks were considered to be “No” answers and were
edited accordingly. If some “Yes” and “No” answers had been filled in but there were still blanks, the
question was regarded as having been answered correctly, the blanks were interpreted as a refusal
to answer or a “Don’t know” response, and the response remained unedited. In some cases, even
when a verbatim “Other” response was recorded, the related item e55e was left blank in the data
set. This problem was corrected, so now whenever there is a verbatim answer, item e55e says “Yes”
accordingly.
Table 10. Anonymized variables in the SOEP-LEE data set.
Variable Label Action
e01 Type of Establishment recoded e02 Whole organization: Number of employees in Germany categorized e05 Year of first establishment was founded categorized e06txt Industry affiliation coded, verbatims deleted e21 Business volume 2011: Establishment categorized e21a Business volume 2011: Whole organization categorized e26 Staff 2011: Overall (Number) categorized e26a Staff 2011: Workers / employees (Number) converted into % e26b Staff 2011: Trainees (Number) converted into % e26c Staff 2011: Civil servants (Number) converted into % e26d Staff 2011: owners / executive management (Number) converted into % e26e Staff 2011: marginal employment (Number) converted into % e27 Staff 2011: Women (Number) categorized e27a Staff 2011: Women (%) converted into % e27b Staff 2011: Part-time (Number) converted into % e27c Staff 2011: Mother tongue non-German (Number) converted into % e27d Staff 2011: University education (Number) converted into % e27e Staff 2011: Aged 55+ (Number) converted into % e27f Staff 2011: <2 years at establishment (Number) converted into % e27g Staff 2011: >10 years at establishment (Number) converted into % e28bf Staff 2011: Limited-term contract (Number) converted into % e57 Response person: Affilition with establishment (years) categorized e58 Response person: Time in current position (years) categorized
6.2 Confidentiality and anonymization
In order to ensure data privacy, the interviews were anonymized by the survey agency by separating
address data from survey data. Further anonymization was done by the SOEP-LEE team with advice
from the DSC-BO. Several items were identified that risked the re-identification of the participating
establishments if they were not edited in order to ensure privacy. The overall goal of anonymization
was to ensure safe long-term access to and use of the data by third parties (data sharing) and the
scientific community. The anonymization procedure consisted of the following steps:
All verbatim responses to open questions were deleted from the file.
Information on the industry and the location of establishments was provided in an
aggregated, one-digit format only (wz08abs, region).
All metric variables were categorized.
63
Absolute values/numbers for the structure of the workforce were transformed into
percentages of the total workforce, and the original absolute values were deleted from the
file.26
In one variable (e01), categories C (“A branch, subsidiary, etc.”) and D (“Franchise”) were
merged because there were only twelve franchises in the entire data set.
A list of all variables affected by the anonymization procedure can be found in table 10. The
questionnaire / code plan (TNS Infratest Sozialforschung 2016) and the data manual (Weinhardt
2016) also indicate anonymized variables.
6.3 Dissemination of the data
The SOEP-LEE establishment data set (DOI:10.7478/s0549.1.v1) is available for secondary use at two
data archives in Germany, the SOEP-RDC at DIW Berlin and the DSC-BO at Bielefeld University. By the
end of 2013, the data had been delivered to the Research Data Center of the SOEP (FDZ) and the
DSC-BO. The dissemination of these data, along with the normal SOEP data, is restricted owing to the
sensitivity of the data and the risk that individual establishments might be identified. Researchers can
analyze the entire database either during a research stay at the SOEP or from the DSZ-BO. All outputs
will be checked to ensure that the data provided remain confidential. To facilitate research and
analysis, the questionnaire and code plan is provided (TNS Infratest Sozialforschung 2016) together
with a data manual describing the establishment data set, including frequency distributions of the
variables (Weinhardt 2016).
6.4 Data structure and data linkage
The data collected in the SOEP-LEE project is held in several data sets, as described below. The data
were delivered by the fieldwork agency as a single data set and were then split up in the editing
process to better reflect the different levels of data included (individual SOEP respondents,
establishments, interviewers, interviews). All the data sets include both German and English labels.
Missing codes have been adjusted to those known from the SOEP-Core study (−3= “Invalid,” −2 =
“Not applicable,” and −1 = “No answer”). Data from the establishment questionnaire are stored in
the corresponding data set slee_estab; the prefix for the establishment level variables is e, and eid is
the variable that serves as the establishment identifier and holds the establishment identification
number. The sample file that contains the outcome codes for the different steps of the survey
process is stored in the corresponding data set slee_sample. This file must also be used to link the
establishment level data to the SOEP individual data. For such linkage, the usual persistent SOEP
person identifier persnr must be used, which is also contained in slee_sample. Linking survey data to
establishment data is possible for 1,834 individuals (110 establishments with more than one SOEP
employee; the maximum number of employees per establishment is six). What follows is a brief
description of how to link the data on establishments that were collected during our study with the
SOEP-Core data using STATA.
26 Questions 26, 27, and 28 asked about the personnel structure of the organization, and the respondents could
answer either in absolute numbers or in percentages of the overall workforce. For the data distribution, percentages were computed from the absolute values and written into the variables referring to percentages.
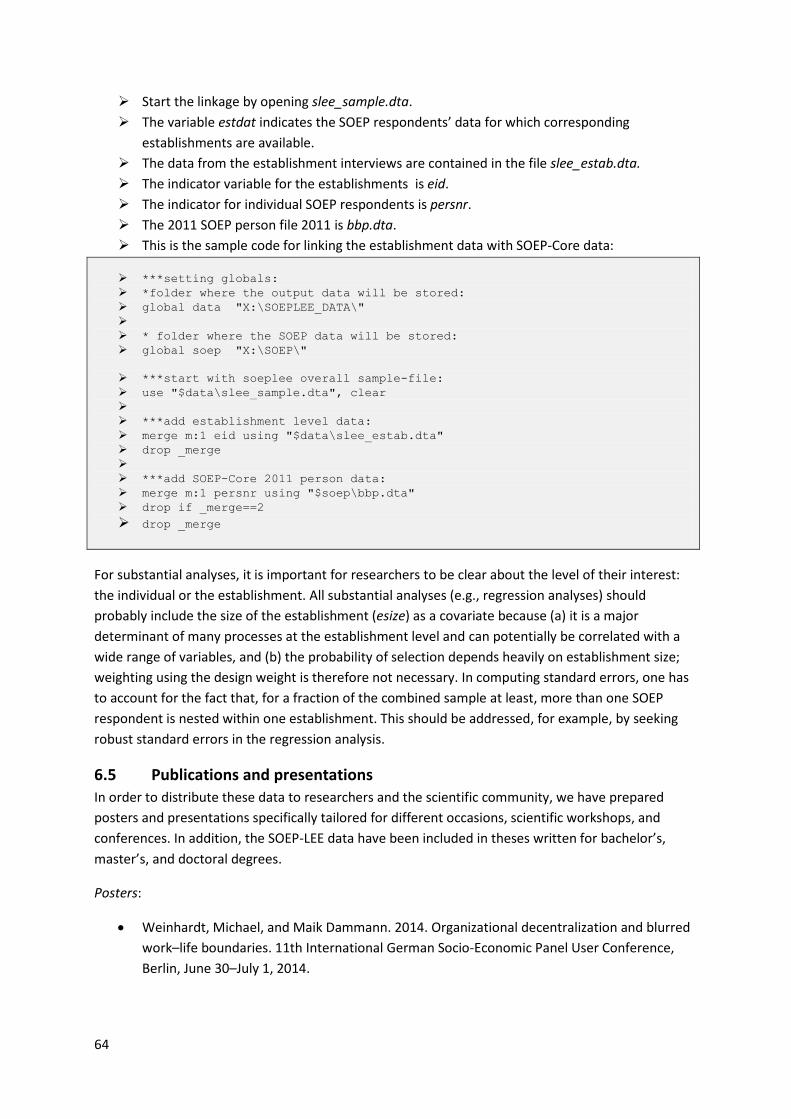
64
Start the linkage by opening slee_sample.dta.
The variable estdat indicates the SOEP respondents’ data for which corresponding
establishments are available.
The data from the establishment interviews are contained in the file slee_estab.dta.
The indicator variable for the establishments is eid.
The indicator for individual SOEP respondents is persnr.
The 2011 SOEP person file 2011 is bbp.dta.
This is the sample code for linking the establishment data with SOEP-Core data:
***setting globals:
*folder where the output data will be stored:
global data "X:\SOEPLEE_DATA\"
* folder where the SOEP data will be stored:
global soep "X:\SOEP\"
***start with soeplee overall sample-file:
use "$data\slee_sample.dta", clear
***add establishment level data:
merge m:1 eid using "$data\slee_estab.dta"
drop _merge
***add SOEP-Core 2011 person data:
merge m:1 persnr using "$soep\bbp.dta"
drop if _merge==2
drop _merge
For substantial analyses, it is important for researchers to be clear about the level of their interest:
the individual or the establishment. All substantial analyses (e.g., regression analyses) should
probably include the size of the establishment (esize) as a covariate because (a) it is a major
determinant of many processes at the establishment level and can potentially be correlated with a
wide range of variables, and (b) the probability of selection depends heavily on establishment size;
weighting using the design weight is therefore not necessary. In computing standard errors, one has
to account for the fact that, for a fraction of the combined sample at least, more than one SOEP
respondent is nested within one establishment. This should be addressed, for example, by seeking
robust standard errors in the regression analysis.
6.5 Publications and presentations
In order to distribute these data to researchers and the scientific community, we have prepared
posters and presentations specifically tailored for different occasions, scientific workshops, and
conferences. In addition, the SOEP-LEE data have been included in theses written for bachelor’s,
master’s, and doctoral degrees.
Posters:
Weinhardt, Michael, and Maik Dammann. 2014. Organizational decentralization and blurred
work–life boundaries. 11th International German Socio-Economic Panel User Conference,
Berlin, June 30–July 1, 2014.
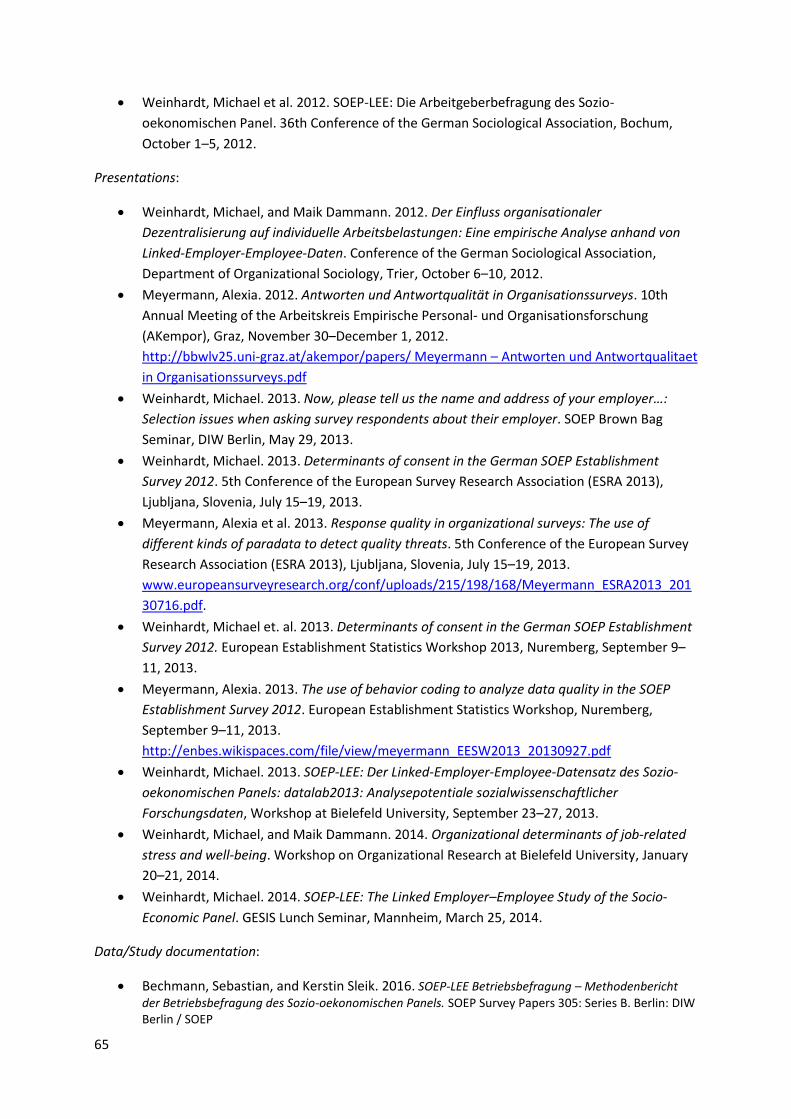
65
Weinhardt, Michael et al. 2012. SOEP-LEE: Die Arbeitgeberbefragung des Sozio-
oekonomischen Panel. 36th Conference of the German Sociological Association, Bochum,
October 1–5, 2012.
Presentations:
Weinhardt, Michael, and Maik Dammann. 2012. Der Einfluss organisationaler
Dezentralisierung auf individuelle Arbeitsbelastungen: Eine empirische Analyse anhand von
Linked-Employer-Employee-Daten. Conference of the German Sociological Association,
Department of Organizational Sociology, Trier, October 6–10, 2012.
Meyermann, Alexia. 2012. Antworten und Antwortqualität in Organisationssurveys. 10th
Annual Meeting of the Arbeitskreis Empirische Personal- und Organisationsforschung
(AKempor), Graz, November 30–December 1, 2012.
http://bbwlv25.uni-graz.at/akempor/papers/ Meyermann – Antworten und Antwortqualitaet
in Organisationssurveys.pdf
Weinhardt, Michael. 2013. Now, please tell us the name and address of your employer…:
Selection issues when asking survey respondents about their employer. SOEP Brown Bag
Seminar, DIW Berlin, May 29, 2013.
Weinhardt, Michael. 2013. Determinants of consent in the German SOEP Establishment
Survey 2012. 5th Conference of the European Survey Research Association (ESRA 2013),
Ljubljana, Slovenia, July 15–19, 2013.
Meyermann, Alexia et al. 2013. Response quality in organizational surveys: The use of
different kinds of paradata to detect quality threats. 5th Conference of the European Survey
Research Association (ESRA 2013), Ljubljana, Slovenia, July 15–19, 2013.
www.europeansurveyresearch.org/conf/uploads/215/198/168/Meyermann_ESRA2013_201
30716.pdf.
Weinhardt, Michael et. al. 2013. Determinants of consent in the German SOEP Establishment
Survey 2012. European Establishment Statistics Workshop 2013, Nuremberg, September 9–
11, 2013.
Meyermann, Alexia. 2013. The use of behavior coding to analyze data quality in the SOEP
Establishment Survey 2012. European Establishment Statistics Workshop, Nuremberg,
September 9–11, 2013.
http://enbes.wikispaces.com/file/view/meyermann_EESW2013_20130927.pdf
Weinhardt, Michael. 2013. SOEP-LEE: Der Linked-Employer-Employee-Datensatz des Sozio-
oekonomischen Panels: datalab2013: Analysepotentiale sozialwissenschaftlicher
Forschungsdaten, Workshop at Bielefeld University, September 23–27, 2013.
Weinhardt, Michael, and Maik Dammann. 2014. Organizational determinants of job-related
stress and well-being. Workshop on Organizational Research at Bielefeld University, January
20–21, 2014.
Weinhardt, Michael. 2014. SOEP-LEE: The Linked Employer–Employee Study of the Socio-
Economic Panel. GESIS Lunch Seminar, Mannheim, March 25, 2014.
Data/Study documentation:
Bechmann, Sebastian, and Kerstin Sleik. 2016. SOEP-LEE Betriebsbefragung – Methodenbericht
der Betriebsbefragung des Sozio-oekonomischen Panels. SOEP Survey Papers 305: Series B. Berlin: DIW Berlin / SOEP
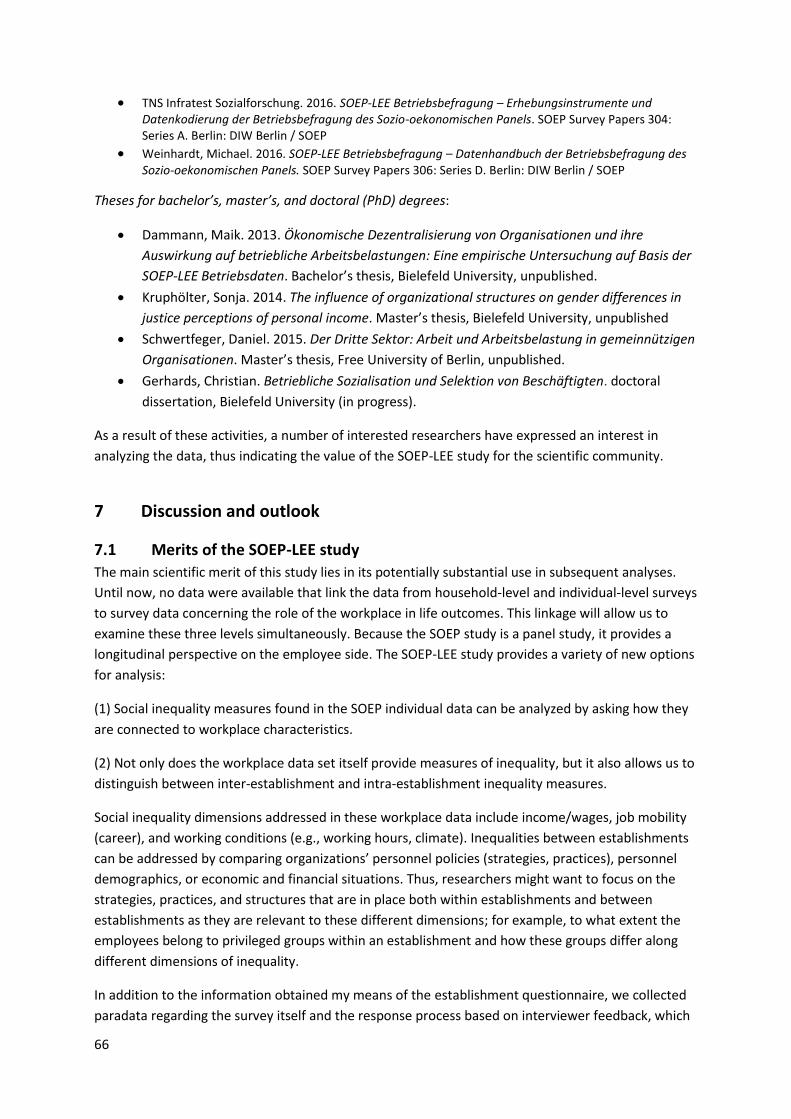
66
TNS Infratest Sozialforschung. 2016. SOEP-LEE Betriebsbefragung – Erhebungsinstrumente und Datenkodierung der Betriebsbefragung des Sozio-oekonomischen Panels. SOEP Survey Papers 304: Series A. Berlin: DIW Berlin / SOEP
Weinhardt, Michael. 2016. SOEP-LEE Betriebsbefragung – Datenhandbuch der Betriebsbefragung des Sozio-oekonomischen Panels. SOEP Survey Papers 306: Series D. Berlin: DIW Berlin / SOEP
Theses for bachelor’s, master’s, and doctoral (PhD) degrees:
Dammann, Maik. 2013. Ökonomische Dezentralisierung von Organisationen und ihre
Auswirkung auf betriebliche Arbeitsbelastungen: Eine empirische Untersuchung auf Basis der
SOEP-LEE Betriebsdaten. Bachelor’s thesis, Bielefeld University, unpublished.
Kruphölter, Sonja. 2014. The influence of organizational structures on gender differences in
justice perceptions of personal income. Master’s thesis, Bielefeld University, unpublished
Schwertfeger, Daniel. 2015. Der Dritte Sektor: Arbeit und Arbeitsbelastung in gemeinnützigen
Organisationen. Master’s thesis, Free University of Berlin, unpublished.
Gerhards, Christian. Betriebliche Sozialisation und Selektion von Beschäftigten. doctoral
dissertation, Bielefeld University (in progress).
As a result of these activities, a number of interested researchers have expressed an interest in
analyzing the data, thus indicating the value of the SOEP-LEE study for the scientific community.
7 Discussion and outlook
7.1 Merits of the SOEP-LEE study
The main scientific merit of this study lies in its potentially substantial use in subsequent analyses.
Until now, no data were available that link the data from household-level and individual-level surveys
to survey data concerning the role of the workplace in life outcomes. This linkage will allow us to
examine these three levels simultaneously. Because the SOEP study is a panel study, it provides a
longitudinal perspective on the employee side. The SOEP-LEE study provides a variety of new options
for analysis:
(1) Social inequality measures found in the SOEP individual data can be analyzed by asking how they
are connected to workplace characteristics.
(2) Not only does the workplace data set itself provide measures of inequality, but it also allows us to
distinguish between inter-establishment and intra-establishment inequality measures.
Social inequality dimensions addressed in these workplace data include income/wages, job mobility
(career), and working conditions (e.g., working hours, climate). Inequalities between establishments
can be addressed by comparing organizations’ personnel policies (strategies, practices), personnel
demographics, or economic and financial situations. Thus, researchers might want to focus on the
strategies, practices, and structures that are in place both within establishments and between
establishments as they are relevant to these different dimensions; for example, to what extent the
employees belong to privileged groups within an establishment and how these groups differ along
different dimensions of inequality.
In addition to the information obtained my means of the establishment questionnaire, we collected
paradata regarding the survey itself and the response process based on interviewer feedback, which
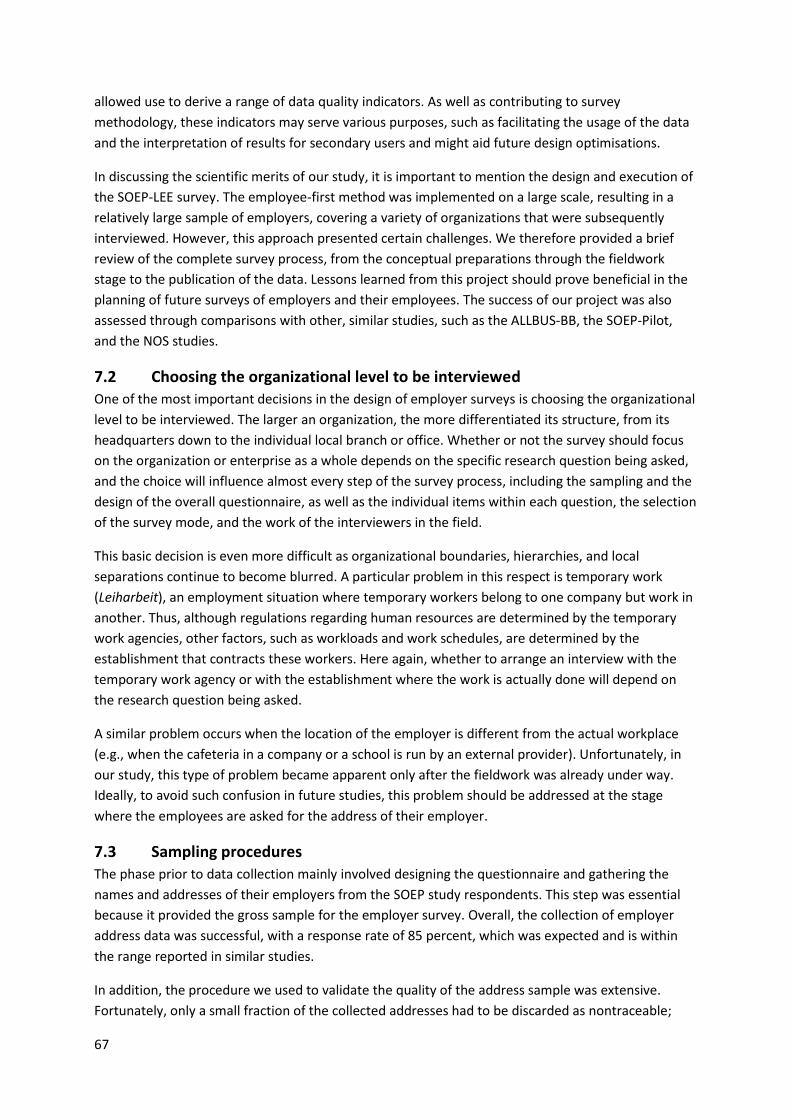
67
allowed use to derive a range of data quality indicators. As well as contributing to survey
methodology, these indicators may serve various purposes, such as facilitating the usage of the data
and the interpretation of results for secondary users and might aid future design optimisations.
In discussing the scientific merits of our study, it is important to mention the design and execution of
the SOEP-LEE survey. The employee-first method was implemented on a large scale, resulting in a
relatively large sample of employers, covering a variety of organizations that were subsequently
interviewed. However, this approach presented certain challenges. We therefore provided a brief
review of the complete survey process, from the conceptual preparations through the fieldwork
stage to the publication of the data. Lessons learned from this project should prove beneficial in the
planning of future surveys of employers and their employees. The success of our project was also
assessed through comparisons with other, similar studies, such as the ALLBUS-BB, the SOEP-Pilot,
and the NOS studies.
7.2 Choosing the organizational level to be interviewed
One of the most important decisions in the design of employer surveys is choosing the organizational
level to be interviewed. The larger an organization, the more differentiated its structure, from its
headquarters down to the individual local branch or office. Whether or not the survey should focus
on the organization or enterprise as a whole depends on the specific research question being asked,
and the choice will influence almost every step of the survey process, including the sampling and the
design of the overall questionnaire, as well as the individual items within each question, the selection
of the survey mode, and the work of the interviewers in the field.
This basic decision is even more difficult as organizational boundaries, hierarchies, and local
separations continue to become blurred. A particular problem in this respect is temporary work
(Leiharbeit), an employment situation where temporary workers belong to one company but work in
another. Thus, although regulations regarding human resources are determined by the temporary
work agencies, other factors, such as workloads and work schedules, are determined by the
establishment that contracts these workers. Here again, whether to arrange an interview with the
temporary work agency or with the establishment where the work is actually done will depend on
the research question being asked.
A similar problem occurs when the location of the employer is different from the actual workplace
(e.g., when the cafeteria in a company or a school is run by an external provider). Unfortunately, in
our study, this type of problem became apparent only after the fieldwork was already under way.
Ideally, to avoid such confusion in future studies, this problem should be addressed at the stage
where the employees are asked for the address of their employer.
7.3 Sampling procedures
The phase prior to data collection mainly involved designing the questionnaire and gathering the
names and addresses of their employers from the SOEP study respondents. This step was essential
because it provided the gross sample for the employer survey. Overall, the collection of employer
address data was successful, with a response rate of 85 percent, which was expected and is within
the range reported in similar studies.
In addition, the procedure we used to validate the quality of the address sample was extensive.
Fortunately, only a small fraction of the collected addresses had to be discarded as nontraceable;
68
nevertheless, collecting address information by means of a separate paper questionnaire, in addition
to drawing on the SOEP main survey data, proved problematic. Owing to design and timing
constraints, a certain percentage of these paper questionnaires could not be returned to the survey
agency, so it is not known whether they were simply forgotten or overlooked by the respondents
and/or the interviewers or whether the respondents refused to complete and submit those
questionnaires.
Also, ideally, employees should be asked to name their current employer, not those from the past.
Otherwise, the former place of employment may have ceased to exist by the time of the survey
request, or the establishment may have lost staff and now has fewer than five employees (making it
ineligible for the survey). Obviously, such problems would be exacerbated the longer the interval
between the reference point in time and the actual interview request.
Another difficulty specific to our study occurred when employees falsely reported that they had
been, or had not been, employed in 2011. Such recall errors are likely to be emphasized the more
time has elapsed between the reference and survey points. Another drawback to employees
referencing the previous year was the issue of nonresponse, in this case owing to panel attrition
between 2011 and 2012 in the SOEP itself, which reduced the number of cases available to provide
their employers’ contact information (the attrition among employed SOEP respondents between
2011 and 2012 was 12.7%) and introduced the possibility of selective dropouts. Fortunately, there
was little indication of any strong and consistent patterns of systematic attrition between waves in
the SOEP study (see Kroh 2013).
The survey was conducted using the PAPI mode of data collection, with the option of dropping off
the questionnaire in certain circumstances. The decision about which survey mode to use must be
considered carefully because it has far-reaching consequences for other components of the study
design. Most critically, the fieldwork—and therefore the costs—will be affected. Also, the survey
mode will determine the type of information that can be asked for in the questionnaire. Although
interviewer-administered PAPI questionnaires are a more costly form of gathering information
compared with interviewing by telephone, it would be almost impossible to collect complex
information about staff composition over the telephone, because in many cases the response person
at the establishment will have to consult company records (which may be in electronic or paper
format) to answer such questions.
7.4 Questionnaire design Perhaps the most demanding task in the pre-fieldwork phase was designing the employer
questionnaire. Several important points must be kept in mind when approaching the design process.
First, one must consider what information is to be collected, and at which level, because certain
information about the establishment can be obtained from the employees without the need for an
additional employer survey. Notwithstanding the issues of accuracy and measurement error,
employees can most likely provide basic facts, such as whether there is a works council at the
establishment. However, questions about the staff structure of the organization would be difficult for
an employee to answer.
Second, there is the question of comparability across establishments. In the SOEP-LEE employer
survey, which did not focus on establishments of a certain size or industry but instead represented a
69
true cross-section of the entire population of establishments, the final sample included
establishments that were diverse in many respects. In such cases, it can be challenging to design
questions that apply to companies that range from private, for-profit firms to public sector agencies,
from globalized multinational enterprises to small-scale craft shops. Therefore, a classic pretest
should be used to determine whether the questions will apply to a wide range of establishments, and
a cognitive pretest should be used to determine how the questions will be perceived by the
respondents. (The use of such testing is exemplified in the work of the IAB establishment panel.)
Although different questions can be asked of different kinds of establishments, this diverse approach
requires routing and filtering that quickly becomes too complex for a PAPI questionnaire. We
rejected this option for the SOEP-LEE study, although it raises questions about the functional
equivalence of the collected data and how they can be obtained if different questions are asked of
different establishments.
Third, the reference point—the period referred to in the questionnaire—must be made clear to the
respondents. Certain financial facts, such as the establishment’s volume of business, may be known
only for the past, and data concerning the personnel structure may reflect seasonal fluctuations.
Therefore, one should consider asking certain questions that relate not to the time of the interview
but to the past or to a specific date (in the case of the SOEP-LEE study, June 30, 2011).
Finally, the designers of the questionnaire should carefully consider who the response person within
the establishment should be and how the interviewer can identify that person. There is some
consensus that this should be someone from the executive level of the establishment because such a
person has the authority to decide whether to participate in the survey and respond to the request.
In addition, an executive would have the information (or at least access to the information) being
requested by survey researchers, such as the structure of the staff. Again, this decision will depend
on the research question. For some topics, for example, a representative of the works council might
be a better informant than someone from the management level.
7.5 Fieldwork and outcomes In the SOEP-LEE study, the fieldwork period for the employer survey took longer than expected (from
August 2012 to March 2013). This was necessary to allow for an additional round of refusals in order
to reach the targeted number of interviews. The data collection phase was also drawn out because
the SOEP-Core study was still active in the field late in the summer. Therefore, some employer
addresses were not ready to be fielded in August 2012, as scheduled. Only a few establishments
could not be located at the addresses provided, which speaks to the success of our validation
procedures. Considering the amount of information we were able to collect about the response
persons, it appears that the interviewers were fairly successful in finding respondents from the
executive level who had experience working in the respective establishments.
In summarizing the outcomes of the two survey stages, we will look specifically at the dropout rates
at different stages of the survey process (Figure 1). As noted above, the overall basis of the study was
formed by those SOEP respondents who were employed in 2011 (N = 11,229). A first major dropout
stage resulted from panel attrition between 2011 and 2012, during which time the employer
addresses were collected. The two stages with the largest number of dropouts were (1) when the
SOEP respondents were providing the contact information of their employers and (2) when the
employers were asked to participate in the establishment survey. By the time we established the
final SOEP-LEE data set in which individual-level and employer-level data were linked together, there

70
were a total of 1,834 records, representing only 16.3 percent of the original sample. Of these cases,
only 443 (25.5% of surveyed establishments, or 3.9% of the original individual sample) are currently
linked to the BHP data from the IAB. Thus, in order for the employee-first method to be successful
and result in a linked data set that is large enough to allow for detailed analysis, one needs a large
enough sample to begin with. Although the rate of dropouts over all phases of the study may appear
to be high, it is in line with other similar studies, such as ALLBUSS-BB and NOS, and is therefore not
uncommon when the employee-first approach is used. Nevertheless, dropout at certain stages can
be problematic and can lead to bias if the process of nonparticipation is systematic and not random.
In the following section, we will look at the issue of sample selectivity in more detail.
7.6 Representativeness and selectivity
Overall, the employee-first method ensures that the data will be representative of the universe of
establishments. The SOEP sample of employees, which constituted the basis of the study, can be
regarded as a valid cross-sectional snapshot of the population. At the level of the establishments, the
representation looks similar. When the final establishment sample is compared with official statistics
in terms of three characteristics—size, region (Bundesländer) and industry—one finds broad
representativeness (two exceptions being that the establishments in North Rhine–Westphalia were
underrepresented and public sector agencies were overrepresented). In order to make such a
comparison, one must account for variations in the inclusion probability of establishments, which is
proportional to their size; the larger the employer, the more likely it is to be selected for the survey.
Therefore, in order to make inferences about the population of German establishments, it is
necessary to weight the data using the inverse of establishment size.
At several stages during this survey, unit nonresponse and item nonresponse occurred. If the process
that leads to missingness is not random, the sample becomes selective, resulting in potential bias. As
described in this report, we obtained the employer addresses for the establishment survey from the
SOEP respondents who were employed. These persons were asked to provide the names and
addresses of their current employers at the time of their interview in 2011. In the selectivity analysis,
we used information from the SOEP-Core individual files to see who would or would not be willing to
provide this information. The selectivity analysis of this first survey stage showed that the following
variables were connected to the response process: type of employment, contract status, and
education (at the individual level), and establishment size, public sector membership, and
educational institution (at the organizational level). These factors should be kept in mind by
researchers who analyze these data in the future.
When we analyzed the response probability on the part of establishments, taking into account
features of the response process, we obtained the following results. The response probability
increased in the public sector as well as in companies in the health and social services industries, but
it decreased as the size of the requested organization decreased and was particularly low in financial
intermediation, in basic services, and in real estate, renting, and business activities. When we
considered additional characteristics of the contact process, the response probability increased with
the number of contact attempts and was higher in cases in which the advance letter had arrived, the
first person contacted at the establishment turned out to be the target person, and the organization
had previously asked to review the questionnaire. We also discovered that these contact process
characteristics were better predictors of response probability than were the establishment
characteristics, such as size or type of industry. At the same time, it must be noted that the causal
71
direction is unclear for the characteristics of the contact history. It might be that a company that has
received the advance letter participates because of this letter. It might also be that the cover letter is
passed on and read in the organization, which is an indication of other internal practices and
characteristics of the establishment that are tied to survey response. The true explanation is not
possible without further research. In either case, these variables are potentially interesting
candidates for additional nonresponse adjustments, because in most cases, they are available for
both responding and non-responding entities, and they are correlated to the response process. For
the purpose of nonresponse adjustment the causal direction of the relationship is not important.
Selectivity should also be kept in mind by researchers who analyze these data. Potential ways of
dealing with this issue include the use of a Heckman-type econometric selection model and the
computation of selection weights to be used later in regression analyses. However, within the
framework of this report, we can only highlight the problems that occur when data are not randomly
missing. It will be up to data analysts to decide how to address the problem in the analyses they wish
to conduct.
7.7 Data quality and measurement error During the stage after the data had been collected, extensive checking and editing procedures
ensured that the data would be of a high quality. A set of consistency checks was performed to
evaluate the plausibility of the data. Many establishments were contacted by telephone to verify
certain responses and to oversee the work done by the interviewers. At this step in the process, little
information had to be revised. This type of quality control is unusual in individual or household
surveys, but it was necessary in order to address some of the difficulties specific to establishment
surveys. By double-checking information with the establishment, measurement errors could be
considerably reduced.
In addition, this report includes a short, descriptive overview of the response process in the
establishments, as based on information obtained from the interviewer forms. In general, the
respondents made every effort to answer the survey questionnaires to the best of their abilities.
Also, the level of accuracy and knowledge was perceived as high, and even complex questions were
answered with little difficulty, and, when necessary, the respondent made use of additional sources
of information. Thus, we believe that researchers can rely on the quality of the data in the SOEP-LEE
survey and expect that any measurement errors introduced by the response person within each
establishment will be low.
The low rate of item nonresponse also speaks to the good quality of the data. Most of the missing
items concerned income and establishment finances, for which a higher rate of item nonresponse
would be expected and that is comparable to the rates reported in other establishment surveys. An
inspection of this item also suggested that the interviewees had difficulty in responding to (or in
recording responses to) the multi-response questions that are often found in paper-and-pencil
surveys that contain long lists of response categories. In addition, questions involving hypothetical
situations, at least when they were not worded carefully, tended to be confusing and were prone to
nonresponse. Finally, the high rate of item nonresponse to the question concerning within-
establishment wage inequality suggests that the employers were particularly sensitive to this issue.
Finally, we anticipate that systematic interviewer effects are likely to be low. Results from the
interviewer questionnaire indicated that the interviewers employed for the SOEP-LEE study were
72
experienced, had worked as interviewers for a long time, and had usually worked on other
establishment surveys as well. On average, the number of interviews conducted per interviewer was
very low (median = 3), which most likely limited interviewer effects.
7.8 Outlook and concluding comments
This project generated several new ideas, such as the ability to link records from establishment
surveys (such as the SOEP-LEE study) and other data sources to the IAB data. Two sources in
particular may prove fruitful for future endeavors: the Böckler Tarifarchiv, which holds data on trade
agreements for a wide range of branches and establishments, and the Unternehmensregister, an
administrative data source containing information from legally required public information held by
the statistical offices of the German federal states. Neither of these sources has been used for
enriching LEE data sets, but both offer valid information that could complement and validate the
data gathered in surveys such as ours. The Unternehmensregister could also serve as an alternative
to the IAB data as a comprehensive sampling frame, although on the level of companies and
enterprises rather than on the level of establishments.
We hope that the experience gained during the SOEP-LEE project, as documented in this report, can
benefit other projects and researchers in their efforts to collect and link their own employer–
employee data. These researchers might collect employer address data from employees but, rather
than following up with their own survey of employers, might consider linking these data directly to
the establishment data held at the IAB. However, before this option could be pursued, the
researchers would have to determine whether such a step would be feasible from the standpoint of
data protection and confidentiality. Still, it would mean that individual SOEP data might be linked to
data about their establishments without fear of losing a vast amount of cases owing to unit
nonresponse at the establishment level. Another possibility would be to directly ask the SOEP
respondents for the consent to their records being linked with individual IAB records. From there,
one could link to the aggregated establishment-level data. However, if one relies on the
administrative data alone, the range of characteristics available for analysis would end up being quite
limited. Also, as indicated, one should solicit legal advice concerning this issue before such a design is
implemented.
Funding and acknowledgments The SOEP-LEE study was awarded a research grant from the Leibniz Association based on a successful
proposal to the Leibniz Competition (Senatsausschusswettbewerb [SAW]). We would like to express
our gratitude to the following colleagues without whose support and assistance this project would
not have been possible: Maik Dammann, Andreas Deneke, Florian Griese, Daniel Höhmann, Regina
Fischer, Peter Jacobebbinghaus, Julian Klassen, Izumi Klockmann, Janine Napieraj, Mirjam Priemer,
Aljoscha Richter, and Daniel Schwertfeger. We would also like to thank the following institutions for
lending their symbolic support to the study and allowing us to use their logos in the materials sent to
the establishments: Stifterverband für die deutsche Wissenschaft, Bundesverband der Deutschen
Industrie (BDI), Handelsverband Deutschland (HDE), Verband deutscher Betriebs- und Werksärzte
(VdBW), Arbeitgeberverband Pflege, and Bundesverband Druck und Medien (bvdm). Finally, for
sharing their expertise and their support, we would like to thank all the participants in the expert
workshop that took place in March 2013: Dorothea Alewell (University of Hamburg), Alexander
Eickelpasch (DIW Berlin), Peter Ellguth (IAB Nuremberg), Johannes Giesecke (University of Bamberg),
73
Jan Goebel (DIW Berlin), Sandra Gottschalk (ZEW Mannheim), Wenzel Matiaske (Helmut Schmidt
University, Hamburg), Eckhard Priller (WZB Berlin), Daniel Schnitzlein (DIW Berlin), Roland Verwiebe
(University of Vienna), Hendrik Vollmer (Bielefeld University), and Josef Hartmann, Sebastian
Bechmann, Nico Siegel, and Simon Huber (TNS Infratest Sozialforschung).
References AAPOR. 2011. Standard definitions: Final dispositions of case codes and outcome rates for surveys.
Ann Arbor: American Association for Public Opinion Research.
Bechmann, Sebastian, and Kerstin Sleik. 2016. SOEP-LEE Betriebsbefragung – Methodenbericht der Betriebsbefragung des Sozio-oekonomischen Panels. SOEP Survey Papers 305: Series B. Berlin: DIW Berlin / SOEP
Drechsler, Jörg. 2010. Multiple imputation of missing values in the wave 2007 of the IAB Establishment Panel. IAB Discussion Paper No. 6/2010. Nuremberg: Institute for Employment Research, http://doku.iab.de/discussionpapers/2010/dp0610.pdf.
Eberle, Johanna, and Michael Weinhardt. 2016. Record Linkage of the Linked Employer-Employee Survey of the Socio-Economic Panel Study (SOEP-LEE) and the Establishment History Panel (BHP). German RLC Working Paper No. wp-grlc-2016-01.
Fischer, Gabriele, Florian Janik, Dana Müller, and Alexandra Schmucker. 2008. Das IAB-Betriebspanel – von der Stichprobe über die Erhebung bis zur Hochrechnung. FDZ-Methodenreport No. 1/2008(DE). Nuremberg: Research Data Centre (FDZ) of the Federal Employment Service in the Institute for Employment Research, http://doku.iab.de/fdz/reporte/2008/MR_01-08.pdf.
Frankel, Lester R. 1983. The report of the CASRO task force on response rates. Pp. 1–11 in Improving data quality in a sample survey, edited by F. Wiseman. Cambridge, MA: Marketing Science Institute.
Gerhards, Christian, and Stefan Liebig. 2011. Methodenbericht: Projekt “Verknüpfte Personen-Betriebsdaten im Anschluss an den ALLBUS 2008”: ALLBUS Betriebsbefragung 2009. Bielefeld: Bielefeld University.
Gerhards, Christian, Stefan Liebig, and Jennifer Elsner. 2010. Datenhandbuch: Projekt “Verknüpfte Personen-Betriebsdaten im Anschluss an den ALLBUS 2008”: ALLBUS-Betriebsbefragung 2009. Bielefeld: Bielefeld University.
Gerhards, Christian, and Alexia Meyermann. 2011. Determinanten von Item Nonresponse bei Betriebsbefragungen. Unpublished manuscript.
Groves, Robert M., and Mick P. Couper. 2012. Nonresponse in household interview surveys. New York: John Wiley & Sons.
Gupta, Nina, Jason D. Shaw, and John E. Delery. 2000. Correlates of response outcomes among organizational key informants. Organizational Research Methods, 3(4): 323–347.
Hansen, Morris H., and William N. Hurwitz. 1943. On the theory of sampling from finite populations. The Annals of Mathematical Statististics, 14(4): 333–362.
74
Hartmann, Josef, and Susanne Kohaut. 2000. Analysen zu Ausfällen (Unit-Nonresponse) im IAB-Betriebspanel. Mitteilungen aus der Arbeitsmarkt- und Berufsforschung, 33(4): 609–618.
Hidiroglou, Michael A., J. Douglas Drew, and Gerald B. Gray. 1993. A framework for measuring and reducing nonresponse in surveys. Survey Methodology, 19(1): 81–94.
Janik, Florian. 2011. Unit non-response in establishments surveyed for the first time in the IAB Establishment Panel. FDZ-Methodenreport No. 4/2011. Nuremberg: Research Data Centre (FDZ) of the Federal Employment Service in the Institute for Employment Research.
Janik, Florian, and Susanne Kohaut. 2012. Why don’t they answer? Unit non-response in the IAB establishment panel. Quality & Quantity, 46(3): 917–934.
Kalleberg, Arne L., David Knoke, Peter V. Marsden, and Joe L. Spaeth. 1996. Organizations in America: Analyzing their structures and human resource practices. Thousand Oaks: Sage.
Kmec, Julie A. 2003. Collecting and using employer–worker matched data. Sociological Focus, 36(1): 81–95.
Kreuter, Frauke, ed. 2013. Improving surveys with paradata: Analytic uses of process information. Hoboken: John Wiley & Sons.
Kroh, Martin. 2013. Documentation of sample sizes and panel attrition in the German Socio Economic Panel (SOEP) (1984 until 2012). Data Documentation No. 66. Berlin: German Institute for Economic Research (DIW).
Kviz, Frederick J. 1977. Toward a standard definition of response rate. Public Opinion Quarterly, 41(2): 265–267.
Liebig, Stefan, and Jürgen Schupp. 2014. SOEP-LEE Betriebsbefragung – Die Betriebsbefragung des Sozio-oekonomischen Panels. doi:10.7478/s0549.1.v1
Massey, James T., Dan O’Connor, and Karol Krotki. 1997. Response rates in random digit dialing (RDD) telephone surveys. Pp. 707–712 in 1997 proceedings of the Section on Survey Research Methods. Arlington, VA: American Statistical Association.
Meyermann, Alexia, Jennifer Elsner, Jürgen Schupp, and Stefan Liebig. 2009. Pilotstudie einer surveybasierten Verknüpfung von Personen- und Betriebsdaten: Durchführung sowie Generierung einer Betriebsstudie als nachgelagerte Organisationserhebung zur SOEP-Innovationsstichprobe 2007. SOEP Papers on Multidisciplinary Panel Data Research No. 170. Berlin: German Institute for Economic Research (DIW).
Schnabel, Annette. 1997. Teilnahmeverhalten bei Unternehmensbefragungen. Arbeit – Zeitschrift für Arbeitsforschung, Arbeitsgestaltung und Arbeitspolitik, 6(2): 154–172.
Schnell, R., Hill, P. B., & Esser, E. (2011). Methoden der empirischen Sozialforschung. München/Wien: Oldenbourg.
Seiler, Christian. 2013. Nonresponse in business tendency surveys: Theoretical discourse and empirical evidence. ifo Beiträge zur Wirtschaftsforschung No. 52. Munich: Ifo Institute for Economic Research.
Smith, Tom W., Arne L. Kalleberg, and Peter V. Marsden. 2004. National Organization Survey (NOS), 2002. Ann Arbor: Inter-University Consortium for Political and Social Research.
75
TNS Infratest Sozialforschung. 2016. SOEP-LEE Betriebsbefragung – Erhebungsinstrumente und Datenkodierung der Betriebsbefragung des Sozio-oekonomischen Panels. SOEP Survey Papers 304: Series A. Berlin: DIW Berlin / SOEP
Weinhardt, Michael. 2016. SOEP-LEE Betriebsbefragung – Datenhandbuch der Betriebsbefragung des Sozio-oekonomischen Panels. SOEP Survey Papers 306: Series D. Berlin: DIW Berlin / SOEP
Willimack, Diane K., and Elizabeth Nichols. 2001. Building an alternative response process model for business surveys. In Proceedings of the Annual Meeting of the American Statistical Association, Alexandria, VA: American Statistical Association.
Willimack, Diane K., and Elizabeth Nichols. 2010. A hybrid response process model for business surveys. Journal of Official Statistics, 26(1): 3–24.
Willimack, Diane K., Elizabeth Nichols, and Seymour Sudman. 2002. Understanding unit and item nonresponse in business surveys. Pp. 213–27 in Survey nonresponse, edited by R. M. Groves, D. A. Dillman, J. L. Eltinge, and R. J. A. Little. New York: Wiley.
Willis, Gordon B. 2004. Cognitive interviewing: A tool for improving questionnaire design. Thousand Oaks: Sage.