Embed Size (px)
Citation preview
The Life Cycle of Corporate Venture Capital
Song Ma∗
This Version: January 26, 2016Lastest Version: Click Here
Abstract
This paper establishes the life-cycle dynamics of Corporate Venture Capital (CVC) to
explore the information-acquisition role of CVC investment in the process of corporate
innovation. I exploit an identification strategy that allows me to isolate exogenous
shocks to a firm’s ability to innovate. Based on this strategy, I first find that the CVC
life cycle typically begins following a period during which corporate innovation has
deteriorated and external information is valuable, lending support to the hypothesis
that firms conduct CVC investment to acquire information and innovation knowledge
from startups. Building on this analysis, I show that CVCs acquire information by
investing in companies that are technologically proximate but have a different knowledge
base. Following CVC investment, parent firms internalize the acquired knowledge into
internal R&D and external acquisition decisions. Human capital renewal, such as hiring
additional inventors who are capable of integrating new innovation knowledge, is integral
in this step. The CVC life cycle lasts about four years, terminating as innovation in
the parent firms rebounds. These findings shed new light on discussions about firm
boundaries, managing innovation, and corporate information choices.
JEL Classification: G24 G34 O32 D83
Keywords: Corporate Venture Capital, Information Acquisition, Innovation, Entrepreneurship
∗Job Market Paper. Duke University’s Fuqua School of Business. Email: [email protected]. I amindebted to Manuel Adelino, Alon Brav, John Graham, Manju Puri, David Robinson, and Ronnie Chatterji.Sincere thanks also go to Lauren Cohen, John de Figueiredo, Joan Farre-Mensa, Simon Gervais, CamHarvey, Thomas Hellmann, Hyunseob Kim, Bruce Petersen, Jillian Popadak, Adriano Rampini, Ming Yang,speakers and participants at the NBER Entrepreneurship Research Boot Camp, seminar participants atDuke, Entrepreneurship and Innovation seminar, NC State (Finance Brownbag), Washington University in St.Louis Corporate Finance Conference, and my fellow students at Duke. I also benefited from discussions withseveral practitioners. All errors are my own. The most recent version of the paper and the Online Appendixare available at: http://people.duke.edu/~sm274.
I. Introduction
In the past three decades corporations have created in-house Corporate Venture
Capital (CVC) divisions to make systematic minority equity investments in early-stage
entrepreneurial ventures. These CVC investments account for about 20% of VC investment,1
and are undertaken not only by technology firms in the media spotlight (such as Google
Venture and Intel Capital), but also commonly by moderate-size firms in a variety of industries.
Both academicians and practitioners seek to understand CVC’s potential as an innovation
model for Corporate America (Macmillan et al., 2008; Lerner, 2012), yet the economic
rationale behind CVC and its role in a corporation have been understudied (Chemmanur
and Fulghieri, 2014).
Why do firms engage in CVC investment and connect to the entrepreneurial sector? A
well-accepted yet hard-to-test view is that “acquiring information and innovative knowledge”
is a primary mission of CVC (Siegel et al., 1988; Macmillan et al., 2008). To fit this argument
into the context of economic theories, Nelson (1982) frames the innovation process as a
two-stage sequential process, in which corporations “acquire information and generate ideas”
(first stage) before investing and organizing R&D activities (second stage). In the information
acquisition stage, corporations search for new innovative ideas and seek better understanding
of those ideas. Including this stage in studying innovation can reconcile several important
patterns in economic growth and innovation dynamics (Jovanovic and Rob, 1989; Kortum,
1997).2 Despite the importance of acquiring information, very little empirical work has
studied how firms organize their investment to actively acquire innovative knowledge to
1In 1999 and 2000, CVC investment peaked at almost $20 billion a year. Although the numbers throughoutthe VC industry fell in the 2000s, CVC growth has rebounded in recent years (69% increase in 2014, NVCA).CVC is thus an important component of the overall VC investment, and, as I show later, has a “multipliereffect” on a firm’s internal and external investment and R&D. For more readings on VC, please refer toGompers and Lerner (2000b); Kortum and Lerner (2000); Hellmann and Puri (2002); Hsu (2004); Sørensen(2007); Bottazzi et al. (2008); Da Rin et al. (2011).
2Existing studies have overwhelmingly focused on the second stage of the innovation process—investingand organizing innovation with an exogenous idea and pre-determined informational structure. Aghion andTirole (1994) model several cases in which, taking the research idea and informational environment as given,equity investment is optimal to provide incentive for R&D projects; Mathews (2006) and Fulghieri and Sevilir(2009) study the problem of strategic equity investment from the industrial organization perspective, andtheorize the benefits of coordinating market entry and obtaining competitive advantages; Hellmann (2002)emphasizes that asset complementarity and product market synergies lead firms to invest in synergisticentrepreneurial ventures, particularly when external financing is costly (Allen and Phillips, 2000).
1
generate ideas.
Testing the information acquisition view of CVC, therefore, not only allows us to un-
derstand a primary rationale of CVC investment, but also provides an empirical setting to
understand how firms search and generate new ideas in the broad innovation process. This
paper examines this “information acquisition” hypothesis in the context of the life-cycle
dynamics of Corporate Venture Capital, using a hand-collected comprehensive CVC data
set. At each stage of the CVC life cycle—initiation, operation, and termination—the evi-
dence is consistent: CVC is used to acquire information and innovation knowledge from the
entrepreneurial sector. Essentially, CVC serves as a transitory information-acquiring step in
regaining an upward innovation trajectory, typically after a firm experiences a deterioration
in internal innovation. Figure 1 summarizes the CVC life cycle.
[FIGURE 1 AROUND HERE]
The CVC life cycle begins with the initiation stage in which a firm launches CVC
investment, typically following a deterioration in internal innovation. Quantitatively, a
two-standard-deviation decline in innovation quantity (quality) increases the probability that
a firm will initiate CVC by about 52% (67%). To mitigate endogeneity issues that could drive
this result, I identify exogenous shocks to innovation performance. The instrumental variable,
Knowledge Obsolescence, captures the rate of obsolescence that results from exogenous
technological evolution of each firm’s technology base. This instrumental variable captures the
exogenous change in a firm’s ability to innovate by tracking the usefulness of its accumulated
knowledge. This should be independent of current CVC decisions. The empirical strategy
helps to establish a causal link between innovation deterioration and CVC investment.
One explanation for the above finding is that firms with deteriorating innovation have
lower productivity in generating ideas and producing innovation and thus have larger po-
tential informational gains from connecting to highly innovative entrepreneurs.3 Consistent
with this explanation, the effect of innovation deterioration is stronger when a firm faces
higher informational uncertainty in its technological areas. Several potential alternative
3Startups are an important source of technological and market knowledge, as well as innovative ideas(Scherer, 1965; Acs and Audretsch, 1988; Kortum and Lerner, 2000; Zingales, 2000).
2
interpretations of the result, such as the effects of financial constraints, excess cash, and weak
corporate governance, do not explain this finding.
When studying the operation stage of the CVC life cycle, I first examine how CVCs
strategically choose portfolio companies to acquire information from. Specifically, how does
the trade-off between complementarity and substitutability (Hellmann, 2002) shape CVC
portfolio formation? I find that CVCs primarily invest in startups that are innovating in
technological areas that are close to the CVC parent, suggesting that CVCs prefer to invest
in companies with substitute technologies. Moreover, the portfolio companies appear to
possess different knowledge (which I measure using overlaps of innovation profiles and patent
citations) from the parent firms, which suggests that CVC parents aim to acquire updated
knowledge in their key areas of expertise.4 For example, an automobile CVC parent firm is
likely to invest in an engine startup, particularly when this startup specializes in cutting-edge
clean-tech that the firm does not possess.
I then examine how the information acquired through CVC investment benefits the parent
firm. After investing in startups through CVC, firms begin to innovate more and with
higher quality. Importantly, CVC parent firms appear to internalize acquired knowledge by
conducting research involving more intense usage of the new information acquired from their
portfolio companies. Meanwhile, the informational benefit is also capitalized through increased
efficiency when making external acquisitions of companies and innovations. Moreover, human
capital renewal, such as hiring additional inventors who are capable of using the newly
acquired knowledge, is integral to this information acquisition and integration.
The CVC life cycle ends with the termination stage as CVC parents stop making incre-
mental investment in startups, typically when internal innovation begins to recover. The
median duration of the life cycle is about four years. When CVC divisions last more than
four years, firms typically hibernate CVC activities during years when internal innovation
remains productive. This evidence is consistent with the information acquisition rationale,
which predicts decreased CVC activity when the marginal benefit shrinks after information
4Interestingly, CVC investment appears to have a “reverse home bias”—even though CVCs are less likelyto invest in geographically distant companies, they are also less likely to invest in companies in their owngeographic regions, from which they may acquire information through local innovation spillover (Peri, 2005;Matray, 2014).
3
is assimilated into parent firms. Interestingly, if innovation again deteriorates at the parent
firm, the CVC life cycle begins anew.
By analyzing the rationale for CVC investment, this paper adds to the existing CVC
literature, which has largely taken CVC activities as given.5 Closer to this paper, Dushnitsky
and Lenox (2005a) and Basu et al. (2011) study the environmental variables affecting CVC
investment using small samples, with analyses tilted toward industry-level factors rather than
firm-level dynamics. The CVC life cycle described herein is consistent with the rationale
of information acquisition and documents the intertemporal dynamics, also contributes to
existing studies of CVCs and strategic investment in broad terms (Allen and Phillips, 2000;
Hellmann, 2002; Mathews, 2006; Fee et al., 2006; Fulghieri and Sevilir, 2009), which mainly
build static models to examine non-informational strategic benefits.
This paper also provides an opportunity to revisit classic issues at the intersection of
information economics and corporate finance. Firms search, process, and use information to
guide their information-sensitive decisions, such as investment and innovation.6 Identifying
firms’ information choices and their direct effects has been difficult due to data limitations
(Van Nieuwerburgh and Veldkamp, 2010; Gargano et al., 2014): When do firms actively
acquire information and how? What information do firms pursue? How do firms use acquired
information? As discussed above, the CVC life cycle is a promising setting in which to
answer those questions: Firms actively acquire information during innovation downturns;
information acquisition often focuses on updated knowledge in core business areas; the
acquired information is used for both internal operation and external acquisitions; and
information acquisition activities slow down when the marginal informational gain shrinks.
This paper also naturally connects to the literature on financing and managing innovation
and the boundaries of the firm, and contributes to this agenda in two ways. First, I highlight
the informational motivation behind organizing innovation, complementing existing studies
that typically assume that the information structure is predetermined (Aghion and Tirole,
5See, e.g., Siegel, Siegel, and MacMillan (1988); Gompers and Lerner (2000a); Bottazzi, Da Rin, andHellmann (2004); Dushnitsky and Lenox (2006); Benson and Ziedonis (2010); Chemmanur, Loutskina, andTian (2013); Dimitrova (2013); Ceccagnoli, Higgins, and Kang (2015); Wadhwa, Phelps, and Kotha (2015).For more background readings on CVC, please refer to Dushnitsky (2006); Maula (2007); Macmillan, Roberts,Livada, and Wang (2008); Lerner (2012).
6See, for example, Dow and Gorton (1997); Chen, Goldstein, and Jiang (2007); Bond, Edmans, andGoldstein (2012); Yang (2013).
4
1994; Robinson, 2008; Bena and Li, 2014; Seru, 2014). Second, rather than studying CVC
alone, I explicitly identify the process of integrating CVC-acquired knowledge into R&D
and acquisition decisions. Ideally, these analyses can be viewed as stepping stones toward
understanding the whole system of financing and organizing innovation, in which different
organizational structures interact with each other.
The remainder of the paper proceeds as follows. Section II describes the data. Section
III presents how information acquisition motivates CVC initiation following innovation
deterioration. Section IV examines how CVCs operate to acquire and use information.
Section V describes the staying power and exit dynamics of CVCs. Section VI discusses the
findings in the context of the literatures on the boundaries of the firm, information economics,
and entrepreneurship.
II. Sample and Data
I exploit a hand-collected sample of Corporate Venture Capitals affiliated with US-based
public firms. To identify CVC investors, I start with a list of CVCs identified by the
VentureXpert Venture Capital Firms database (accessed through Thomson Reuters SDC
Platinum), which is standard in VC studies (Chemmanur, Loutskina, and Tian, 2013). For
each CVC on the list, I manually match it to its unique corporate parent in Compustat by
checking multiple sources (Factiva, Google, etc.). I remove VC divisions operated by financial
firms, which are different from CVC arms of industrial firms (Hellmann, Lindsey, and Puri,
2008). From VentureXpert I obtain the investment history of each CVC, including basic
information about the startup company, and the timing and characteristics of each CVC deal.
[TABLE I AROUND HERE]
The main sample consists of 381 CVC firms initiated between 1980 and 2006.7 Table I
summarizes this CVC sample by tabulating the time-series dynamic and the industry com-
position. Panel A presents the number of CVC division initiations and investment deals by
year. CVC activities are heavily concentrated in the first half of the 1980s and the second
7I focus on CVCs initiated no later than 2006 to allow for investment behaviors to realize (after 2006) andto ensure the quality of the innovation database, as will be described later.
5
half of the 1990s. This is consistent with existing studies on “CVC waves” (Gompers and
Lerner, 2000a; Dushnitsky, 2006). Panel B summarizes the industry distribution of CVC
parent firms, where industries are defined by the Fama-French 48 Industry Classification.
The Business Services industry (including IT) was the most active sector in CVC investment,
with 90 firms investing in 821 venture companies. Electronic Equipment firms initiated 46
CVC divisions that invested in 921 companies. Pharmaceutical firms launched 28 CVCs and
invested in 254 deals. Other active sectors include Computers and Communications.
The CVC sample is augmented with Compustat for financial statement data and with
CRSP for stock market performance. Variable constructions are described in the Appendix.
All data items are pre-winsorized at the 1% and 99% levels. SDC Platinum provides
organizational information on mergers and acquisitions and strategic alliances. For corporate
governance data, I extract institutional shareholding information from the WRDS Thomson
Reuters 13(f) data and obtain G-index data from Andrew Metrick’s data library.8
Innovation is a crucial data component of this paper for three reasons. First, innovation
knowledge generate from the entrepreneurial sector could create great value for CVC parent
firms (Macmillan et al., 2008), therefore it is an important part of the information acquisition
motive. Second, the system of citation network creates a valuable setting to measure
informational relationship and knowledge flows (Gonzalez-Uribe, 2013). Third, the quality of
detailed innovation data maintained and updated by the United States Patent and Trademark
Office (USPTO) is superior to most alternative data sources on corporate activities.
I obtain the basic innovation database from the NBER Patent Data Project and from
Bhaven Sampat’s patent and citation data.9 The combined database provides detailed
patent-level records on more than 3 million patents granted by USPTO between 1976 and
2012. I link this database to Compustat using the bridge file provided by NBER.
I employ two main variables to measure corporate innovation performance. First, I
measure innovation quantity by calculating the number of patent applications, which are
eventually granted, filed by a firm in each year. I use the patent’s year of application instead
8Accessed using http://faculty.som.yale.edu/andrewmetrick/data.html.9For more information on the NBER Patent Data Project, please refer to Hall, Jaffe, and Trajtenberg (2001).
The data used in this paper were downloaded from https://sites.google.com/site/patentdataproject/.Sampat’s data can be accessed using http://thedata.harvard.edu/dvn/dv/boffindata.
6
of the year it is granted because that better captures the actual timing of innovation. I use the
logarithm of one plus this variable, that is, ln(1 +NewPatent) (denoted as ln(NewPatent)),
to fix the skewness problem for better empirical properties. Second, I measure the quality
of innovation, based on the average lifetime citations of all new patents produced by a
firm in each year. Similar to the logarithm transformation performed on quantity, I use
ln(1 + Pat.Quality) (denoted as ln(Pat.Quality)).
I preview three additional steps in constructing innovation data.10 First, I link the
USPTO database to entrepreneurial companies in VentureXpert using a fuzzy matching
method based on company name, basic identity information, and innovation profiles, similar
to Gonzalez-Uribe (2013) and Bernstein, Giroud, and Townsend (2014). This step allows
me to construct variables capturing the technological relation between CVCs and startups
and to create a dynamic citation network. Second, I introduce the Harvard Business School
inventor-level database in order to examine how firms adjust their innovative human capital
as a specific channel to facilitate information acquisition and integration. Third, I construct a
full set of patent transactions from the Google Patent database, which allows me to examine
how information acquisition improves the efficiency of acquiring external innovation.
III. CVC Initiations: The Effect of Innovation Deterioration
Why do firms initiate CVC programs? Indeed, the cost of investing in CVC is not
negligible—when doing so, firms devote capital, time, and such intangible resources as
industry knowledge and marketing channels (Lerner, 2012; Chemmanur, Loutskina, and Tian,
2013), which could otherwise be used for R&D, acquisitions, or other corporate activities.11
The entrepreneurs they support, meanwhile, could potentially grow to be strong competitors
that are detrimental to the CVC parent firms themselves in the long run.
Is CVC just another example of pet-project that allows managers to act as venture
capitalists, or a conscious corporate decision on firm boundaries in the pursuit of long-term
growth opportunities? If the latter, are firms more likely to engage in CVC investment under
10These steps are detailed in related sections and the Appendix.11These requirements for capital and other resources explain why CVC parents tend to possess stronger
cummulated technological and marketing resources than their peers (Dushnitsky and Lenox, 2006; Basu,Phelps, and Kotha, 2011).
7
certain situations than others? Siegel, Siegel, and MacMillan (1988), Chesbrough (2002),
and Macmillan et al. (2008) argue that CVC serves as a window to new technology, new
ideas, and industry trends generated in the entrepreneurial sector.12 This learning process,
moreover, is structured to be flexible and with lower adjustment cost (Lerner, 2012). Under
this information acquisition hypothesis, CVC investment should be more appealing when
acquiring information could more significantly improve the firm’s performance of a firm. One
such occasion is when a firm experiences a negative innovation shock and exhausts innovative
ideas internally, thereby benefiting more through learning from startups.
A. A Graphical Illustration
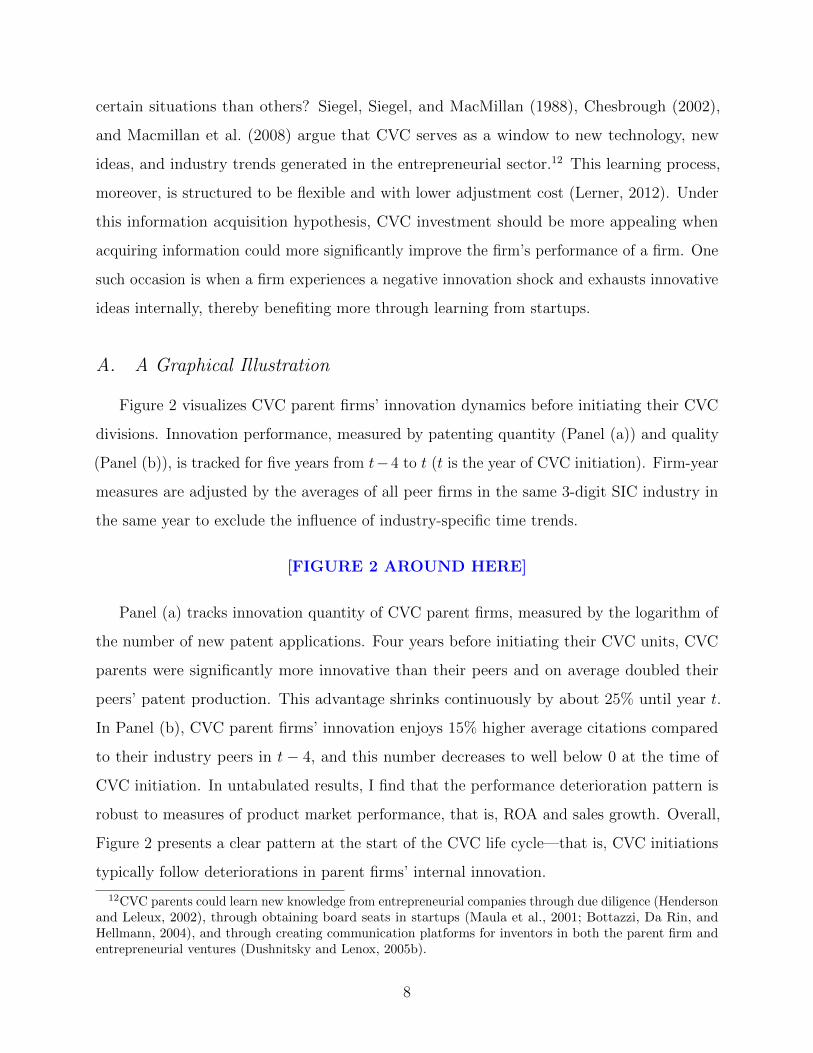
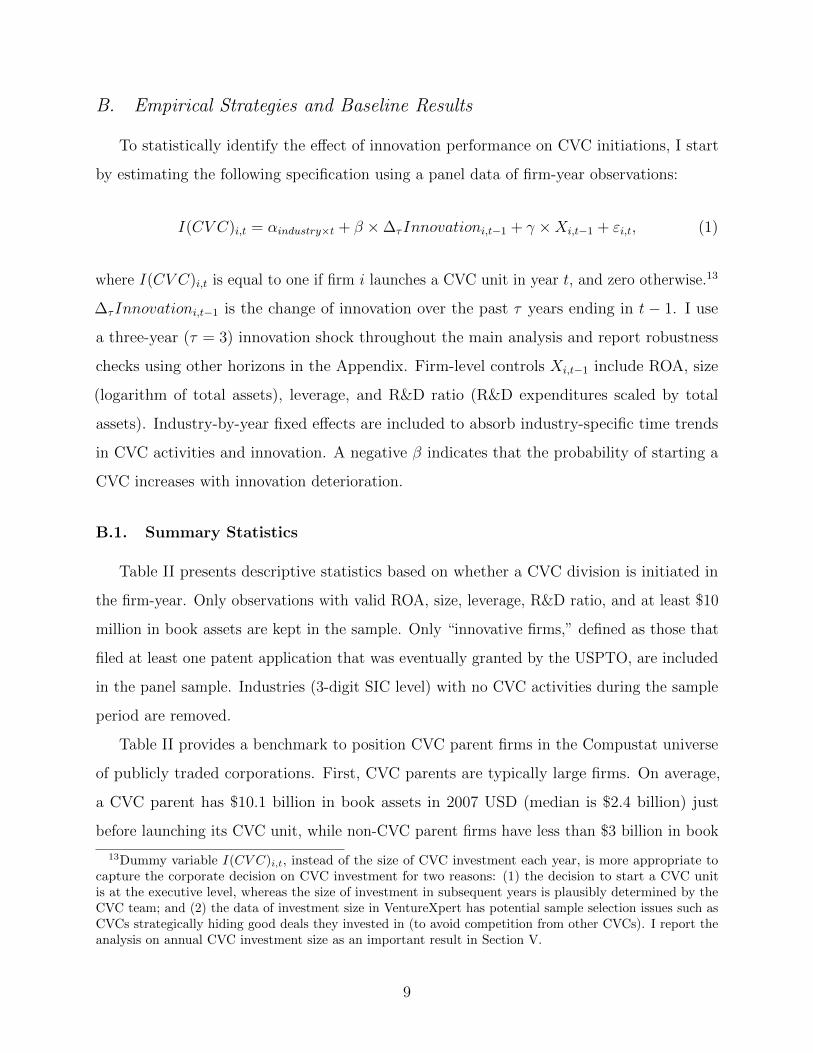
Figure 2 visualizes CVC parent firms’ innovation dynamics before initiating their CVC
divisions. Innovation performance, measured by patenting quantity (Panel (a)) and quality
(Panel (b)), is tracked for five years from t−4 to t (t is the year of CVC initiation). Firm-year
measures are adjusted by the averages of all peer firms in the same 3-digit SIC industry in
the same year to exclude the influence of industry-specific time trends.
[FIGURE 2 AROUND HERE]
Panel (a) tracks innovation quantity of CVC parent firms, measured by the logarithm of
the number of new patent applications. Four years before initiating their CVC units, CVC
parents were significantly more innovative than their peers and on average doubled their
peers’ patent production. This advantage shrinks continuously by about 25% until year t.
In Panel (b), CVC parent firms’ innovation enjoys 15% higher average citations compared
to their industry peers in t − 4, and this number decreases to well below 0 at the time of
CVC initiation. In untabulated results, I find that the performance deterioration pattern is
robust to measures of product market performance, that is, ROA and sales growth. Overall,
Figure 2 presents a clear pattern at the start of the CVC life cycle—that is, CVC initiations
typically follow deteriorations in parent firms’ internal innovation.
12CVC parents could learn new knowledge from entrepreneurial companies through due diligence (Hendersonand Leleux, 2002), through obtaining board seats in startups (Maula et al., 2001; Bottazzi, Da Rin, andHellmann, 2004), and through creating communication platforms for inventors in both the parent firm andentrepreneurial ventures (Dushnitsky and Lenox, 2005b).
8
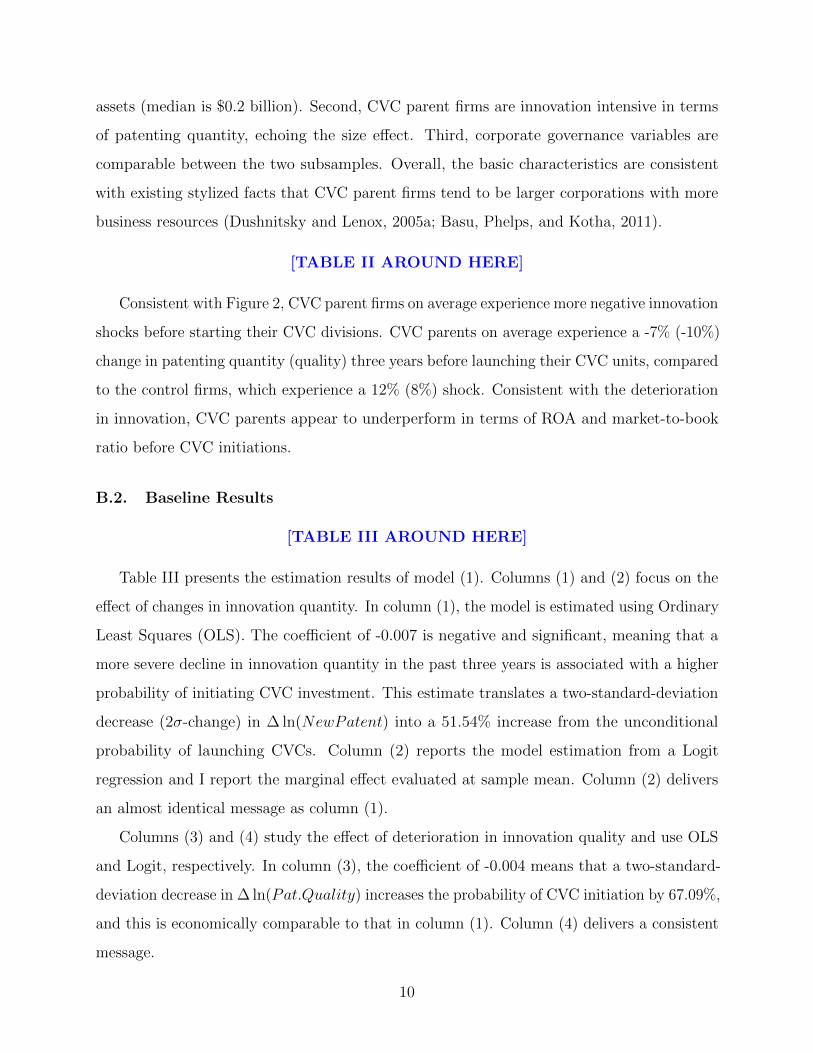
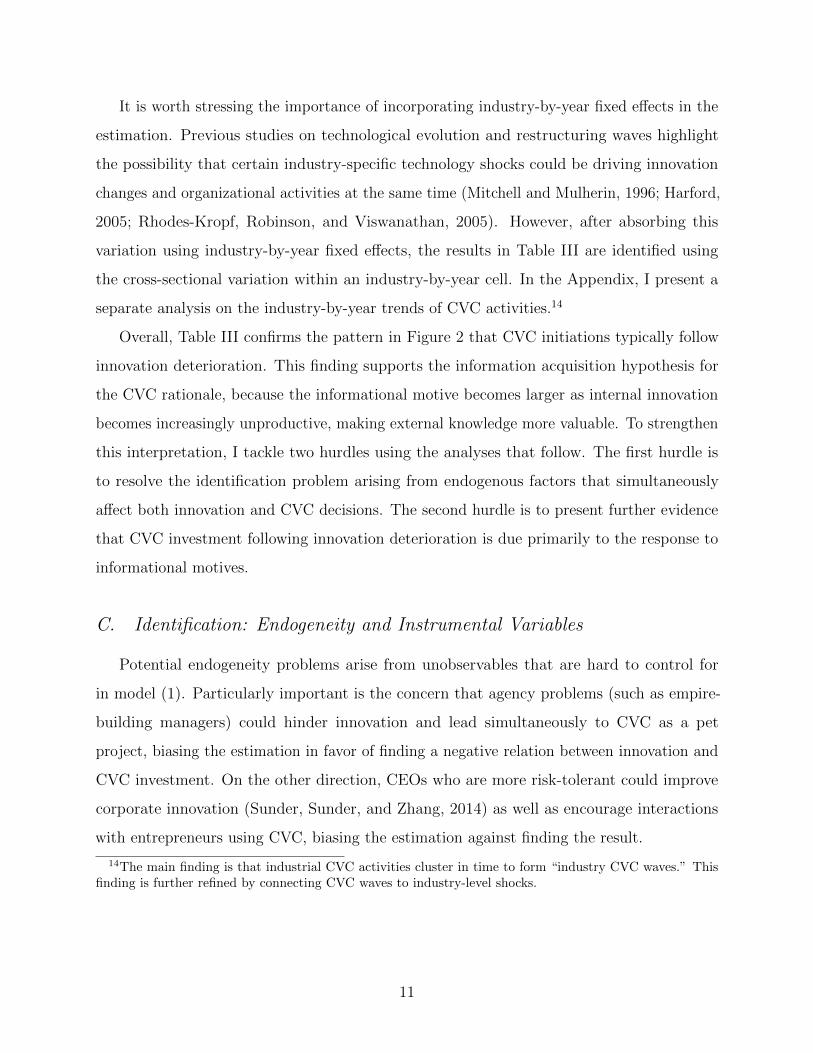
B. Empirical Strategies and Baseline Results
To statistically identify the effect of innovation performance on CVC initiations, I start
by estimating the following specification using a panel data of firm-year observations:
I(CV C)i,t = αindustry×t + β ×∆τInnovationi,t−1 + γ ×Xi,t−1 + εi,t, (1)
where I(CV C)i,t is equal to one if firm i launches a CVC unit in year t, and zero otherwise.13
∆τInnovationi,t−1 is the change of innovation over the past τ years ending in t − 1. I use
a three-year (τ = 3) innovation shock throughout the main analysis and report robustness
checks using other horizons in the Appendix. Firm-level controls Xi,t−1 include ROA, size
(logarithm of total assets), leverage, and R&D ratio (R&D expenditures scaled by total
assets). Industry-by-year fixed effects are included to absorb industry-specific time trends
in CVC activities and innovation. A negative β indicates that the probability of starting a
CVC increases with innovation deterioration.
B.1. Summary Statistics
Table II presents descriptive statistics based on whether a CVC division is initiated in
the firm-year. Only observations with valid ROA, size, leverage, R&D ratio, and at least $10
million in book assets are kept in the sample. Only “innovative firms,” defined as those that
filed at least one patent application that was eventually granted by the USPTO, are included
in the panel sample. Industries (3-digit SIC level) with no CVC activities during the sample
period are removed.
Table II provides a benchmark to position CVC parent firms in the Compustat universe
of publicly traded corporations. First, CVC parents are typically large firms. On average,
a CVC parent has $10.1 billion in book assets in 2007 USD (median is $2.4 billion) just
before launching its CVC unit, while non-CVC parent firms have less than $3 billion in book
13Dummy variable I(CV C)i,t, instead of the size of CVC investment each year, is more appropriate tocapture the corporate decision on CVC investment for two reasons: (1) the decision to start a CVC unitis at the executive level, whereas the size of investment in subsequent years is plausibly determined by theCVC team; and (2) the data of investment size in VentureXpert has potential sample selection issues such asCVCs strategically hiding good deals they invested in (to avoid competition from other CVCs). I report theanalysis on annual CVC investment size as an important result in Section V.
9
assets (median is $0.2 billion). Second, CVC parent firms are innovation intensive in terms
of patenting quantity, echoing the size effect. Third, corporate governance variables are
comparable between the two subsamples. Overall, the basic characteristics are consistent
with existing stylized facts that CVC parent firms tend to be larger corporations with more
business resources (Dushnitsky and Lenox, 2005a; Basu, Phelps, and Kotha, 2011).
[TABLE II AROUND HERE]
Consistent with Figure 2, CVC parent firms on average experience more negative innovation
shocks before starting their CVC divisions. CVC parents on average experience a -7% (-10%)
change in patenting quantity (quality) three years before launching their CVC units, compared
to the control firms, which experience a 12% (8%) shock. Consistent with the deterioration
in innovation, CVC parents appear to underperform in terms of ROA and market-to-book
ratio before CVC initiations.
B.2. Baseline Results
[TABLE III AROUND HERE]
Table III presents the estimation results of model (1). Columns (1) and (2) focus on the
effect of changes in innovation quantity. In column (1), the model is estimated using Ordinary
Least Squares (OLS). The coefficient of -0.007 is negative and significant, meaning that a
more severe decline in innovation quantity in the past three years is associated with a higher
probability of initiating CVC investment. This estimate translates a two-standard-deviation
decrease (2σ-change) in ∆ ln(NewPatent) into a 51.54% increase from the unconditional
probability of launching CVCs. Column (2) reports the model estimation from a Logit
regression and I report the marginal effect evaluated at sample mean. Column (2) delivers
an almost identical message as column (1).
Columns (3) and (4) study the effect of deterioration in innovation quality and use OLS
and Logit, respectively. In column (3), the coefficient of -0.004 means that a two-standard-
deviation decrease in ∆ ln(Pat.Quality) increases the probability of CVC initiation by 67.09%,
and this is economically comparable to that in column (1). Column (4) delivers a consistent
message.
10
It is worth stressing the importance of incorporating industry-by-year fixed effects in the
estimation. Previous studies on technological evolution and restructuring waves highlight
the possibility that certain industry-specific technology shocks could be driving innovation
changes and organizational activities at the same time (Mitchell and Mulherin, 1996; Harford,
2005; Rhodes-Kropf, Robinson, and Viswanathan, 2005). However, after absorbing this
variation using industry-by-year fixed effects, the results in Table III are identified using
the cross-sectional variation within an industry-by-year cell. In the Appendix, I present a
separate analysis on the industry-by-year trends of CVC activities.14
Overall, Table III confirms the pattern in Figure 2 that CVC initiations typically follow
innovation deterioration. This finding supports the information acquisition hypothesis for
the CVC rationale, because the informational motive becomes larger as internal innovation
becomes increasingly unproductive, making external knowledge more valuable. To strengthen
this interpretation, I tackle two hurdles using the analyses that follow. The first hurdle is
to resolve the identification problem arising from endogenous factors that simultaneously
affect both innovation and CVC decisions. The second hurdle is to present further evidence
that CVC investment following innovation deterioration is due primarily to the response to
informational motives.
C. Identification: Endogeneity and Instrumental Variables
Potential endogeneity problems arise from unobservables that are hard to control for
in model (1). Particularly important is the concern that agency problems (such as empire-
building managers) could hinder innovation and lead simultaneously to CVC as a pet
project, biasing the estimation in favor of finding a negative relation between innovation and
CVC investment. On the other direction, CEOs who are more risk-tolerant could improve
corporate innovation (Sunder, Sunder, and Zhang, 2014) as well as encourage interactions
with entrepreneurs using CVC, biasing the estimation against finding the result.
14The main finding is that industrial CVC activities cluster in time to form “industry CVC waves.” Thisfinding is further refined by connecting CVC waves to industry-level shocks.
11
C.1. Instrumental Variable and Empirical Strategy
To address the endogeneity concern and rule out competing interpretations, I construct a
new instrumental variable by exploiting the influence of exogenous technological evolution on
firm-specific innovation.
The idea that technological evolution affects firms’ innovation is intuitive—a firm special-
izing in 14-inch hard disk drive (HHD) was less likely to produce valuable innovation when
8-inch HHD technology came, and this happened repeatedly along the development of HHDs
(5.25-inch, 3.5-inch, 2.5-inch, Solid State Drives). Indeed, “new technologies come and go,
taking generations of companies with them” (Igami, 2014). Earlier studies formalize this
intuition and identify several mechanisms that technological evolution affects firms’ ability to
innovate. A negative shock to the value of a firm’s accumulated knowledge space implies a
longer distance to the knowledge frontier and a higher knowledge burden to identify valuable
ideas and produce radical innovation (Jones, 2009). Firms working in a fading area will
benefit less from knowledge spillover (Bloom, Schankerman, and Van Reenen, 2013), which
in turn dampens growth in innovation and productivity.15
To implement the idea and measure the influence of exogenous technological evolution
on each firm, I build on bibliometrics and scientometrics literature, which measure obsoles-
cence and aging of a discipline/technology using the dynamics of citations referring to the
discipline/technology. The instrument, termed as Knowledge Obsolescence (Obsolescence
hereafter), attempts to capture the τ -year (between t− τ and t) rate of obsolescence of the
knowledge possessed by a firm. For each firm i in year t, this instrument is constructed in
three steps (formally defined in formula (2)). First, firm i’s predetermined knowledge space
in year t− τ is defined as all the patents cited by firm i (but not belonging to i) up to year
t− τ . I then calculate the number of citations received by this KnowledgeSpacei,t−τ in t− τ
and in t, respectively. Last, Obsolescenceτi,t is defined as the change between the two, and a
15One concern is that when a firm’s knowledge space becomes hotter, product market competition becomesmore severe, which in turn could disincentivize innovation and imply that emerging knowledge value could leadto lower innovation performance. This concern, however, is shown to be secondary by Bloom, Schankerman,and Van Reenen (2013), and is further resolved by the first-stage regression in Table IV.
12
larger Obsolescence means a larger decline of the value and usefulness of a firm’s knowledge,
Obsolescenceτi,t = −[ln(Citt(KnowledgeSpacei,t−τ ))− ln(Citt−τ (KnowledgeSpacei,t−τ ))].
(2)
The validity of the exclusion restriction rests on the assumption that, controlling for
industry-specific technological trends and firm-specific characteristics, the technological
evolution regarding a firm’s knowledge space, which is predetermined and accumulated along
its path, is orthogonal to its current decision on CVC other than through affecting innovation
performance. One might worry that a firm’s knowledge space could be affected by the type
and capability of its managers, but this concern should be minimized by using a predetermined
knowledge space formed along the corporate history rather than the concurrent one. One
might also worry that the firm itself could be the main driver of the technological evolution.
This concern is addressed first by excluding patents owned by the firm from its own knowledge
space and by excluding all citations made by the firm itself in the variable construction. It is
mitigated further by a robustness check on a subsample of medium and small firms, which
are less likely to endogenize technological evolution.
In Table II, I report summary statistics for Obsolescence. The activeness of a firm’s
predetermined knowledge space decays by 8% in the control group, which can be interpreted
as a very mild three-year natural decay of knowledge. The knowledge space on average decays
by 29% in the three years before a parent firm initiates its CVC arm, which is a much more
severe hit by the technological evolution.
I exploit the instrument in a standard 2SLS framework. In the first stage, I instrument
the change in innovation with Obsolescenceτi,t using the following form:
∆τInnovationi,t−1 = π′0,industry×t + π′1 ×Obsolescenceτi,t−1 + π′2 ×Xi,t−1 + ηi,t−1. (3)
The predicted change in innovation is then used in the second stage to deliver a consistent
estimator, that is,
I(CV C)i,t = αindustry×t + β × ∆τInnovationi,t−1 + γ ×Xi,t−1 + εi,t. (4)
13
C.2. 2SLS Results
Table IV presents the estimation results of models (3) and (4). Column (1) reports a
reduced-form regression in which Obsolescence is used to explain the decision to launch
a CVC program. The positive coefficient 0.001 indicates that firms experiencing larger
technological decays are more likely to initiate CVC activities.
Columns (2) and (4) report first-stage regressions where ∆Innovation (Innovation mea-
sured by the quantity and quality of new patents) is predicted using Obsolescence and a larger
Obsolescence (faster rate of technological decaying) is associated with poorer innovation
performance. The estimate of -0.114 in column (2) translates a 10% increase in the rate of
obsolescence of a firm’s knowledge space into a 1.14% decrease in its patent applications;
this same change is associated with a 1.28% decrease in the quality of its patent quality as
measured by lifetime citations. The F -statistics of these first-stage regressions are both well
above the conventional threshold for weak instruments (Stock and Yogo, 2005).
[TABLE IV AROUND HERE]
Columns (3) and (5) show the second-stage estimation results. The key explanatory
variables are now fitted innovation changes predicted from the first stage. The causal effect
of innovation shocks on starting a CVC unit is both economically and statistically significant.
The coefficient of -0.007 in column (2) translates a 2σ-change in ∆ ln(NewPatent) to a 52%
change in the probability of launching CVC investment.
The gaps between the OLS estimates (in Table III) and the 2SLS estimates are very
small. This comparison suggests that endogeneity issues are not biasing the OLS estimation
in any clear direction on net. This does not mean, however, that there are no endogeneity
issues involved—as discussed earlier, competing endogenous forces could drive the OLS bias
in either direction and the net effect is therefore mitigated. The Appendix shows that the
result is robust to several sampling criteria, such as excluding the IT and Pharmaceutical
sectors, excluding California-based firms, and excluding very big or very small firms.
14
D. Interpretation: Uncertainty of Informational Environment
Table IV overcomes the identification hurdle in establishing causality between innovation
deterioration and CVC initiations. This subsection attempts to strengthen the interpretation
of this relation, that is, innovation deterioration affects CVC investment through the mecha-
nism of changing the information acquisition motive. Specifically, I explore heterogeneous
effects of innovation deteriorations on CVC initiations across uncertainty levels that firms face
in their informational environment. The working hypothesis is that the impact of innovation
deterioration should be stronger when the uncertainty level is higher, that is, identifying
valuable innovation opportunities and methods becomes more difficult and information is
therefore more valuable.
I estimate an extended model based on the OLS model (1) and 2SLS models (3) and
(4). The sample is categorized into two subgroups by the median of uncertainty levels of
firms’ informational environment, indicated by Iuncertainty. I then introduce Iuncertainty and
its interaction with ∆Innovation into the model. Formally, the model is extended to
I(CV C)i,t = αindustry×t + β ×∆τInnovationi,t−1
+ β′ ×∆τInnovationi,t−1 × Iuncertainty,it
+ γ′ × Iuncertainty,it + γ ×Xi,t−1 + εi,t.
(5)
The interaction term β′ can be interpreted as the “additional responsiveness” to innovation
changes of firms that are under a more uncertain environment. The coefficient γ′ is the stand-
alone effect of uncertainty. When estimating using 2SLS, I instrument ∆τInnovationi,t−1 with
Obsolescence, and the interaction term is instrumented by the interaction of Obsolescence
and Iuncertainty,it.
For the purpose of interpretation, the uncertainty measure needs to capture the difficulty
of identifying valuable innovative ideas and promising innovation trajectories. To fulfill
this criterion, I construct a spread-based variable to measure the quality dispersion of new
innovation opportunities that a firm exposes to, in the same spirit as many existing uncertainty
proxies (Bloom, 2009; Bloom, Floetotto, Jaimovich, Saporta-Eksten, and Terry, 2012; Jurado,
Ludvigson, and Ng, 2013).
15
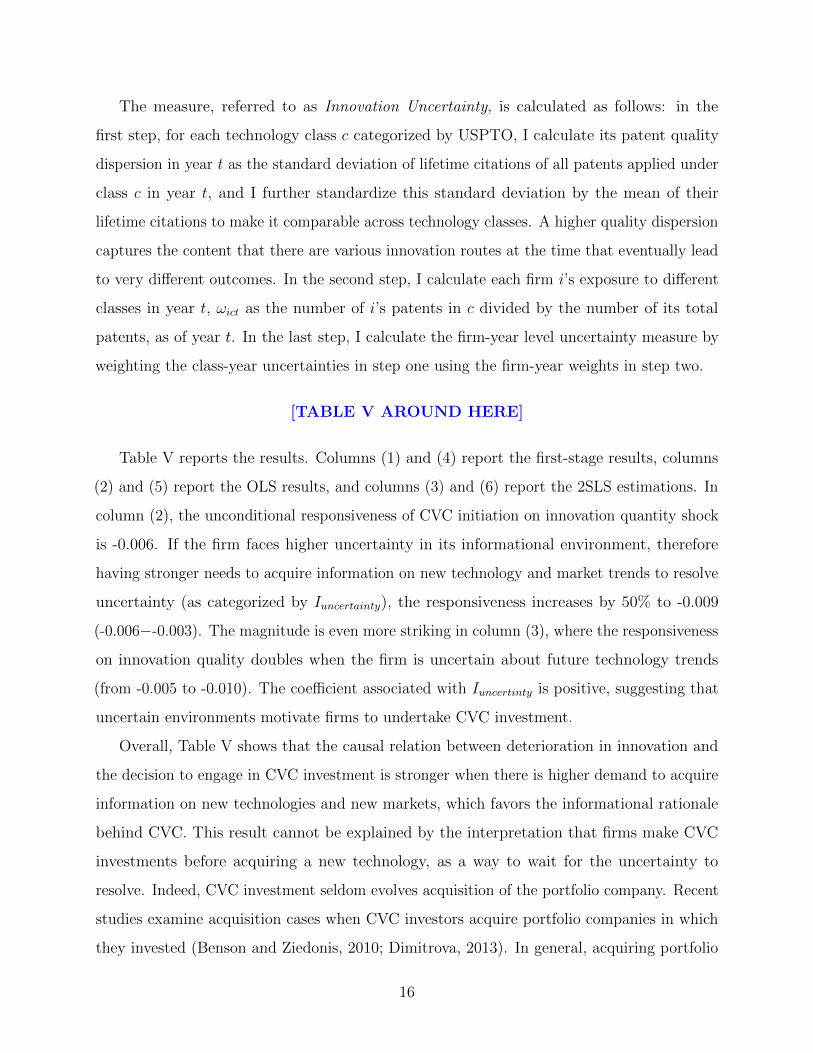
The measure, referred to as Innovation Uncertainty, is calculated as follows: in the
first step, for each technology class c categorized by USPTO, I calculate its patent quality
dispersion in year t as the standard deviation of lifetime citations of all patents applied under
class c in year t, and I further standardize this standard deviation by the mean of their
lifetime citations to make it comparable across technology classes. A higher quality dispersion
captures the content that there are various innovation routes at the time that eventually lead
to very different outcomes. In the second step, I calculate each firm i’s exposure to different
classes in year t, ωict as the number of i’s patents in c divided by the number of its total
patents, as of year t. In the last step, I calculate the firm-year level uncertainty measure by
weighting the class-year uncertainties in step one using the firm-year weights in step two.
[TABLE V AROUND HERE]
Table V reports the results. Columns (1) and (4) report the first-stage results, columns
(2) and (5) report the OLS results, and columns (3) and (6) report the 2SLS estimations. In
column (2), the unconditional responsiveness of CVC initiation on innovation quantity shock
is -0.006. If the firm faces higher uncertainty in its informational environment, therefore
having stronger needs to acquire information on new technology and market trends to resolve
uncertainty (as categorized by Iuncertainty), the responsiveness increases by 50% to -0.009
(-0.006−-0.003). The magnitude is even more striking in column (3), where the responsiveness
on innovation quality doubles when the firm is uncertain about future technology trends
(from -0.005 to -0.010). The coefficient associated with Iuncertinty is positive, suggesting that
uncertain environments motivate firms to undertake CVC investment.
Overall, Table V shows that the causal relation between deterioration in innovation and
the decision to engage in CVC investment is stronger when there is higher demand to acquire
information on new technologies and new markets, which favors the informational rationale
behind CVC. This result cannot be explained by the interpretation that firms make CVC
investments before acquiring a new technology, as a way to wait for the uncertainty to
resolve. Indeed, CVC investment seldom evolves acquisition of the portfolio company. Recent
studies examine acquisition cases when CVC investors acquire portfolio companies in which
they invested (Benson and Ziedonis, 2010; Dimitrova, 2013). In general, acquiring portfolio
16
companies is rare—fewer than one-fifth of CVC investors acquired their portfolio companies.
CVCs that did conduct such acquisitions acquired fewer than 5% of their portfolio companies
(that is, one out of 20 investments).
In the Online Appendix, I explore several alternative CVC rationale which could be
consistent with the finding that innovation deterioration leads to CVC investment, such as
financial constraints and managerial desperation (Higgins and Rodriguez, 2006), and these
factors cannot explain the finding.
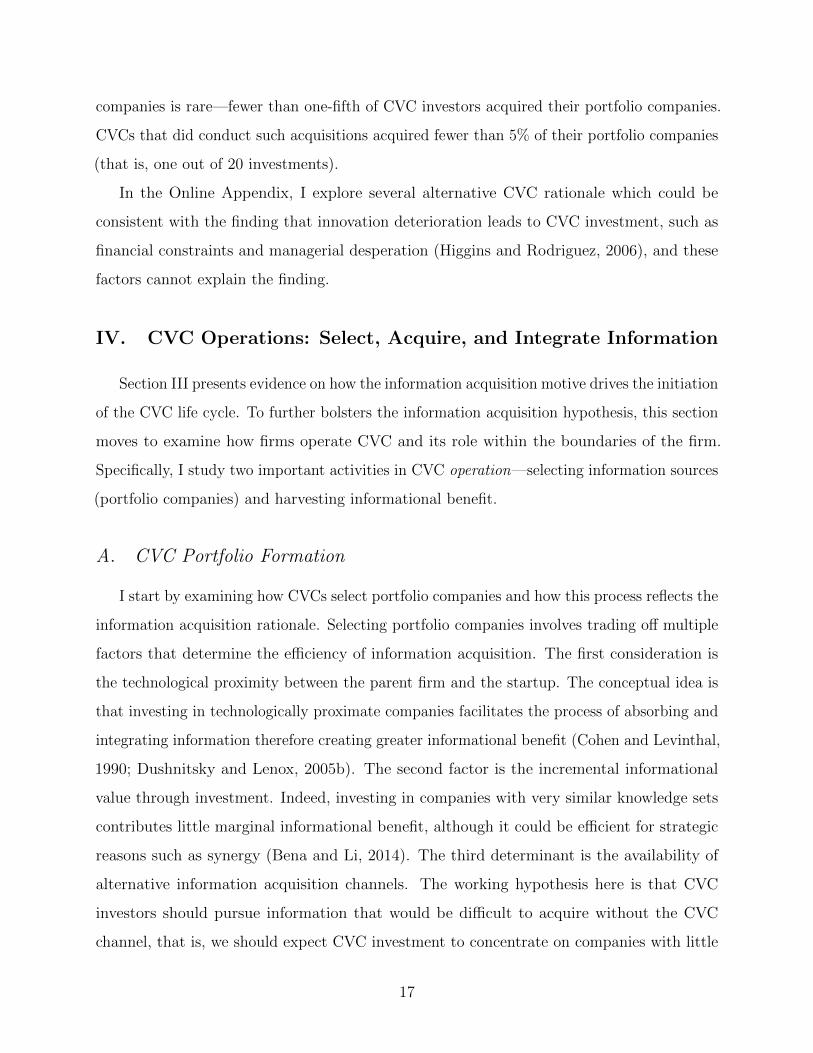
IV. CVC Operations: Select, Acquire, and Integrate Information
Section III presents evidence on how the information acquisition motive drives the initiation
of the CVC life cycle. To further bolsters the information acquisition hypothesis, this section
moves to examine how firms operate CVC and its role within the boundaries of the firm.
Specifically, I study two important activities in CVC operation—selecting information sources
(portfolio companies) and harvesting informational benefit.
A. CVC Portfolio Formation
I start by examining how CVCs select portfolio companies and how this process reflects the
information acquisition rationale. Selecting portfolio companies involves trading off multiple
factors that determine the efficiency of information acquisition. The first consideration is
the technological proximity between the parent firm and the startup. The conceptual idea is
that investing in technologically proximate companies facilitates the process of absorbing and
integrating information therefore creating greater informational benefit (Cohen and Levinthal,
1990; Dushnitsky and Lenox, 2005b). The second factor is the incremental informational
value through investment. Indeed, investing in companies with very similar knowledge sets
contributes little marginal informational benefit, although it could be efficient for strategic
reasons such as synergy (Bena and Li, 2014). The third determinant is the availability of
alternative information acquisition channels. The working hypothesis here is that CVC
investors should pursue information that would be difficult to acquire without the CVC
channel, that is, we should expect CVC investment to concentrate on companies with little
17
informational communication otherwise.
To empirically analyze how CVC parent firms balance these economic forces in selecting
portfolio companies, I construct a data set by pairing each CVC i with each entrepreneurial
company j that was ever invested by a VC. I remove cases when the active investment years
(between initiation and termination) of CVC firm i and active financing years of company j
(between the first and the last round of VC financing) do not overlap. I estimate a probability
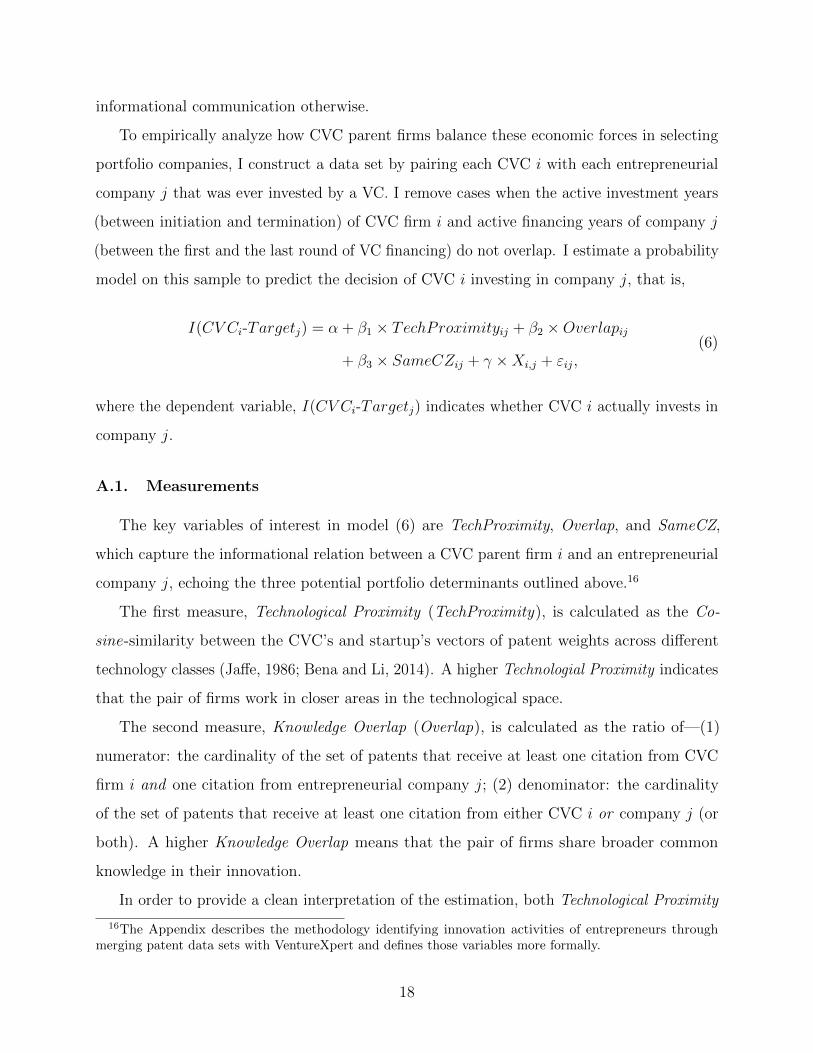
model on this sample to predict the decision of CVC i investing in company j, that is,
I(CV Ci-Targetj) = α + β1 × TechProximityij + β2 ×Overlapij
+ β3 × SameCZij + γ ×Xi,j + εij,(6)
where the dependent variable, I(CV Ci-Targetj) indicates whether CVC i actually invests in
company j.
A.1. Measurements
The key variables of interest in model (6) are TechProximity, Overlap, and SameCZ,
which capture the informational relation between a CVC parent firm i and an entrepreneurial
company j, echoing the three potential portfolio determinants outlined above.16
The first measure, Technological Proximity (TechProximity), is calculated as the Co-
sine-similarity between the CVC’s and startup’s vectors of patent weights across different
technology classes (Jaffe, 1986; Bena and Li, 2014). A higher Technologial Proximity indicates
that the pair of firms work in closer areas in the technological space.
The second measure, Knowledge Overlap (Overlap), is calculated as the ratio of—(1)
numerator: the cardinality of the set of patents that receive at least one citation from CVC
firm i and one citation from entrepreneurial company j; (2) denominator: the cardinality
of the set of patents that receive at least one citation from either CVC i or company j (or
both). A higher Knowledge Overlap means that the pair of firms share broader common
knowledge in their innovation.
In order to provide a clean interpretation of the estimation, both Technological Proximity
16The Appendix describes the methodology identifying innovation activities of entrepreneurs throughmerging patent data sets with VentureXpert and defines those variables more formally.
18
and Knowledge Overlap are measured as of the last year before CVC i and company j both
enter the VC-startup community. For example, if firm i initiates the CVC in 1995 while
company obtained its first round of financing in 1998, the measure is constructed using the
patent profiles in 1997. The rationale for this criterion is to mitigate the potential interactions
between CVCs and startups before investment.
To construct a proxy for the availability of alternative information acquisition channels, I
rely on recent studies showing that geographic proximity influences the intensity of knowledge
spillover between firms (Peri, 2005). The main variable is a dummy indicating whether
CVC firm i and company j are located in the same Commuting Zone (CZ). I use CZ as the
geographic delineation because it has been shown that CZ is more relevant for geographic
economic activities (Autor, Dorn, and Hanson, 2013; Adelino, Ma, and Robinson, 2014) and
innovation spillover (Matray, 2014). Projecting the information acquisition hypothesis on
this context, we should expect that CVCs invest less in companies that are in the same
geographic location, from which they could learn through the more inexpensive mechanism
of local knowledge spillover.
A.2. Results
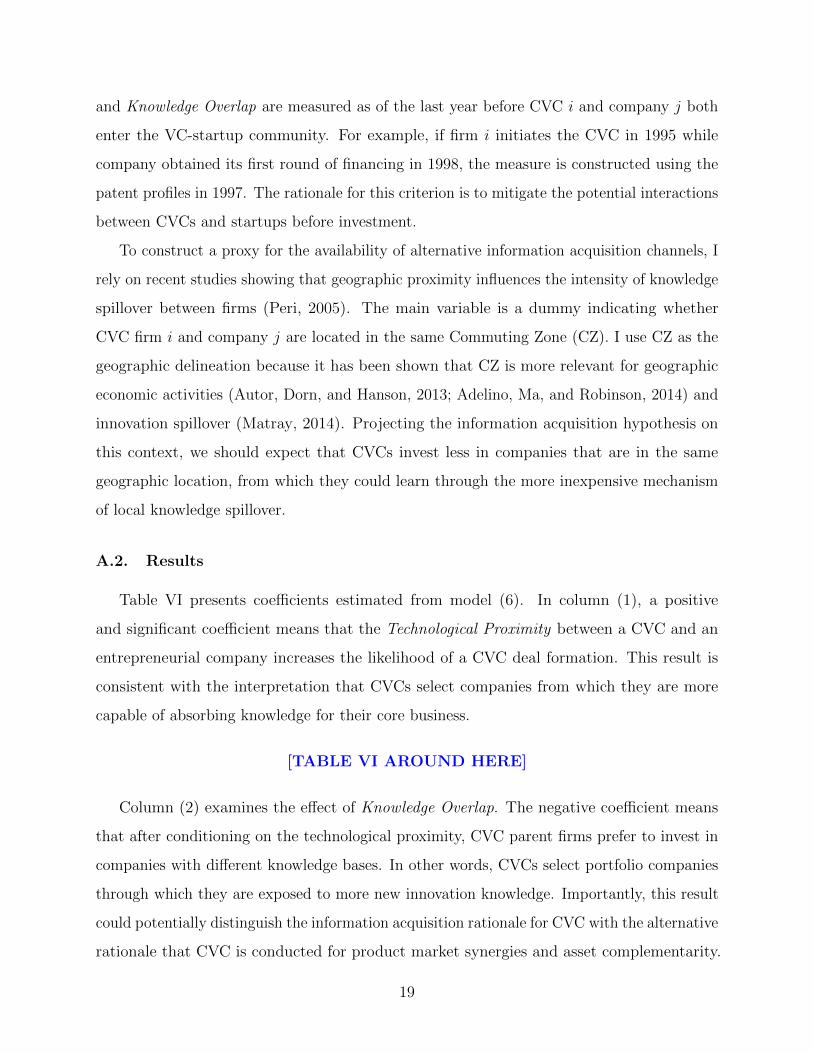
Table VI presents coefficients estimated from model (6). In column (1), a positive
and significant coefficient means that the Technological Proximity between a CVC and an
entrepreneurial company increases the likelihood of a CVC deal formation. This result is
consistent with the interpretation that CVCs select companies from which they are more
capable of absorbing knowledge for their core business.
[TABLE VI AROUND HERE]
Column (2) examines the effect of Knowledge Overlap. The negative coefficient means
that after conditioning on the technological proximity, CVC parent firms prefer to invest in
companies with different knowledge bases. In other words, CVCs select portfolio companies
through which they are exposed to more new innovation knowledge. Importantly, this result
could potentially distinguish the information acquisition rationale for CVC with the alternative
rationale that CVC is conducted for product market synergies and asset complementarity.
19
Under non-informational strategic concerns, firms favor targets with both close technological
proximity and high knowledge overlap in order to achieve economic synergies (Bena and Li,
2014).
In column (3), I study the effect of alternative information acquisition channels, knowledge
spillover specifically, on CVC’s portfolio selection. The literature on VCs, and on investment
more broadly, has documented a “home (local) bias” phenomenon—when investing in compa-
nies that are geographically closer, investors can better resolve the information asymmetry
problem and conduct more efficient monitoring (Da Rin, Hellmann, and Puri, 2011). In
column (3), however, I find that CVCs do not really invest in their “home” companies. The
dummy variable indicating that the CVC and the startup are located in the same Commuting
Zone negatively affects the probability of investment, which is consistent with the explanation
that CVC parent firms can acquire information from startups in the same CZ through local
innovation spillover (Matray, 2014), which decreases the marginal benefit of making a CVC
investment in them.
Overall, Table VI shows that CVCs strategically select information sources and invest in
companies from which they could acquire beneficial information. They invest in companies
that work in similar technological areas and possess knowledge new to the parent firm. They
are less likely to invest in companies located in the same geographic areas from which they
could gain information through inexpensive local knowledge spillover.
B. Internalizing Acquired Information into R&D
The rationale of information acquisition for CVC investment is convincing only if CVC
parents can use newly gathered information to improve their operations. In this subsection, I
study how CVC parent firms internalize acquired information into organic R&D.
Several economic frictions could hinder CVCs from gathering and integrating information
from startups, challenging the information acquisition rationale. Hellmann (2002) theoretically
shows that entrepreneurs could intentionally avoid CVC investment to protect their own
innovation. Dushnitsky and Lenox (2005b) and Kim, Gopal, and Hoberg (2013) argue that
the absorptive ability (Cohen and Levinthal, 1990) of CVC parent firms imposes a limit on
the knowledge transferred through the relationship. Gompers and Lerner (2000a) suggest that
20
the efficiency of CVC is constrained by the incentive problem embedded in its organizational
and compensation structure. Additionally, high adjustment costs of R&D investment (Hall,
Griliches, and Hausman, 1986; Lach and Schankerman, 1989) can decrease the speed and
intensity of the integration of new knowledge acquired through CVC.
B.1. Internal Innovation during CVC
To set the stage, I first examine how CVC investment influences internal innovation.
Under the information acquisition hypothesis, parent firms should be able to harvest the
informational benefit, particularly through improvements in information-sensitive activities
such as innovation; moreover, newly gathered information should be reflected in those
activities.
I assess this idea by characterizing the innovation dynamic of CVC parents around their
CVC investment across several dimensions. The first set of measurements is simply innovation
quantity and quality as employed in Section III. The second set of variables is New Cite Ratio
and Explorativeness, which measure the proportion of new knowledge used in innovation. New
knowledge is identified using patent citations referring to patents that never previously cited
by the firm. Specifically, I first define firm i’s existing knowledge in year t as all patents that
are owned by i or that were cited by firm i’s patents filed up to t; other patents are considered
new knowledge to the firm. New Cite Ratio of a patent is calculated as the ratio between
citations made to new knowledge and the total number of citations made by the patent.
Based on this measure, a patent is flagged as Explorative if at least 80% of its citations are
based on new knowledge (New Cite Ratio≥ 80%). I transform these patent-level measures to
firm-year level by averaging across all patents produced by firm i in year t.17 Higher New
Cite Ratio and Explorativeness suggest an innovation scheme focusing on exploring new ideas
using new knowledge.
To construct a proper control group for CVC parents, I use a propensity score matching
method and match each CVC parent firm that launches its CVC unit in year t with two non-
CVC firms from the same year t and 2-digit SIC industry that have the closest propensity score
17This measure is motivated by theoretical work on motivating innovation (e.g., Manso (2011)), and recentlyimplemented in empirical studies (Almeida, Hsu, and Li, 2013; Custodio, Ferreira, and Matos, 2013; Brav,Jiang, Ma, and Tian, 2015).
21
estimated using firm size (the logarithm of total assets), market-to-book ratio, ∆Innovation,
and patent stock,18 similar to the sample construction strategy in Bena and Li (2014). The
CVC launching year for a CVC parent firm is also the “pseudo-CVC” year for its matched
firms, and I include firm data beginning five years before the (pseudo-) event year through
five years after the event.
I characterize corporate innovation dynamics around CVC investment under a standard
difference-in-differences (DiD) framework:
yi,t = αFE + β · I(CV CParent)i × I(Post)i,t
+ β′ · I(CV CParent)i + β′′ · I(Post)i,t + γ ×Xi,t + εi,t,(7)
where dependent variables yi,t are innovation quantity, quality, new cite ratio, and explo-
rativeness. I(CV CParent)i is a dummy variable indicating whether firm i is a CVC parent
or a matched control firm. I(Post)i,t indicates whether the firm-year observation is within
the [t+ 1, t+ 5] window after (pseudo-) CVC initiations. The model includes industry-by-year
fixed-effects αindustry×t to absorb industry-specific technological trends.19 The coefficient of
interest β measures the incremental changes in innovation benchmarked by those of the
matched firms.
[TABLE VII AROUND HERE]
Table VII reports the results. Columns (1) to (4) study the dynamics of patent quantity
and quality. The β-coefficients associated with the difference-in-differences term are positive
and significant across all columns, meaning that CVC parent firms’ innovation performance
improves following CVC investment. The coefficients should be interpreted in semi-elasticity
terms. Following CVC investment, parent firms’ innovation quantity increase is 23.9% larger
than the matched firms (column (1)), and these new innovations collect on average 21.7%
more lifetime citations (column (3)) compared to the level before CVC investment.
Columns (5) and (6) study the ratio of new knowledge used in innovation. After CVC
initiations, firms conduct innovation that involves more intense use of knowledge that they
18Patent stock is constructed as the total number of patents applied for by the firm up to year t− 1.19The result is robust to controlling for firm fixed effects and year fixed effects.
22
have not used before—the estimate of 0.097 in column (5) can be interpreted as a 9.7%
increase in using new information (that is, one out of ten citations). Similarly, in columns (7)
and (8), the proportion of explorative patents that are mainly (≥ 80%) produced based on
new knowledge increases by around 4%.20
B.2. Direct Spillover from Portfolio Companies to CVC Parents
Is this information integrated into organic innovation acquired through the CVC channel?
I answer this question by further identifying the specific information flow from portfolio
companies to CVC parent firms, attributing innovation changes to knowledge acquired
through CVCs.
Empirically, I study whether CVC parent firms more intensely cite innovation knowledge
possessed by their portfolio companies. I first identify all the patents applied by a CVC
parent firm (or a matched control firm) i, and all the patents cited by those patents. I then
identify all the patents applied by an entrepreneurial company j. These data further allow
me to determine whether firm i makes a new citation, which it never cited before, to a patent
that is possessed by company j.
The analysis estimates whether CVC parent firm i makes new citations to company j’s
patents or knowledge after the CVC invests in the portfolio company, using the following
model:
Citeijt = α + β · I(CV CParent)× I(Post)× I(Portfolio)
+ Φ[I(CV CParent), I(Post), I(Portfolio)] + εijt.(8)
The sample is at the i-j-t level. The full set of i-j pairs then denotes the potential information
flow that could happen between a CVC parent firm (or a matched firm) and a startup,
captured by patent citations. I(CV CParent) is a dummy variable indicating whether firm i
is a CVC parent or a matched control firm. I(Portfolio) indicates whether company j is
in the CVC portfolio of firm i. For each i-j pair, two observations are constructed, one for
the five-year window before firm i invests in company j, and one for the five-year window
20Some might worry that this result merely means that CVC parent firms start to diversify and thusinnovate in areas that they had not explored before. In unreported results, I find that the increase in usingnew information concentrates on technological areas closer to the firm’s core expertise, which is inconsistentwith the “diversification” story.
23
after the investment.21 I(Post) indicates whether the observation is within the five-year
post-investment window. The dependent variable, Citeijt, indicates whether firm i makes
new citations to company j’s innovation knowledge during the corresponding time period.
[TABLE VIII AROUND HERE]
The key variable of interest, I(CV CParent) × I(Post) × I(Portfolio), captures the
incremental intensity of integrating a portfolio company’s innovation knowledge into organic
innovation after a CVC invests in the company. Table VIII column (1) shows the regression
results. The coefficient of 0.159, means that the citing probability increases by 15.9% after
establishing the link through CVC investment.
I further explore the depth of information acquisition from portfolio companies. Specifically,
column (3), I perform an analysis similar to that in column (1) except that I look at the
probability that a CVC parent firm cites not only patents owned by the startup but also
patents previously cited by the startup. In other words, the potential citation now covers
a broader technological area that the startup works in. Column (3) extends the message
conveyed in column (1)—CVC parent firms not only cite the portfolio company’s own patents,
but also benefit from the knowledge indirectly carried by portfolio companies, reaching to
the broader knowledge behind.
Does information acquisition concentrate only on successful investment? I explore this
question by modifying model (8) and separately estimate the intensity of citing knowledge
possessed by companies that either exit successfully (acquired or publicly listed) or fail at
last. The result is reported in columns (2) and (4), and it appears that CVC parents acquire
knowledge from both successful and failed ventures.
C. Using Information through External Acquisitions
After presenting how firms integrate acquired innovation knowledge into internal R&D, in
this section, I explore an alternative channel through which firms could benefit from CVC-
acquired information—acquiring external innovation. Acquiring innovation has become an
21A matched control firm is assumed to have the same investment history as the CVC parent firm to whichit is matched to.
24
important component of corporate innovation (Bena and Li, 2014; Seru, 2014), and identifying
promising acquisition targets (companies or innovation) requires a valuable information set,
such as great understandings on markets and technological trends. Under the information
acquisition hypothesis, CVC-acquired information allows parent firms to form more precise
expectations on acquisition deals, thereby improving efficiencies when making acquisition
decisions.22
C.1. Efficiency of Acquiring Companies
I first study how efficiently CVC parent firms conduct acquisitions of companies. Following
the literature, acquisition efficiency is measured using three-day, five-day, and seven-day
cumulative abnormal returns (CAR) of an acquisition deal centered on the acquisition
announcement day. The analysis is performed on a cross section of mergers and acquisitions
deals conducted by CVCs and their matched control firms between five years before and five
years after (pseudo-) CVC initiations, and the unit of observation is an acquisition deal. The
key variable of interest is the difference-in-differences variable I(CV CParent)i × I(Post)i,t
indicating whether the acquirer i is within five years after launching its CVC division. If
firms could conduct more efficient external acquisitions based on the information gathered
from CVC investment, one would expect the abnormal announcement returns to be higher
for these deals.
[TABLE IX AROUND HERE]
Table IX Panel A presents the result. Columns (1) to (3) examine three-day, five-day and
seven-day CAR (in basis points, bps), respectively. The positive and significant coefficients
across all three columns confirm that firms conduct more successful external acquisitions
as they internalize the information acquired through their CVC investment. Quantitatively,
compared to their industry peers, acquisitions made by CVC parent firms experience a 65
bps improvement in the three-day abnormal return from one-day before the announcement
to one-day after the announcement, and a greater than 130 bps increase in abnormal return
during the [−3, 3] window.
22Those acquisitions are not necessarily limited to their CVC portfolio companies, and can reach to abroader domain using the general innovation and industry knowledge they learn from CVC experience.
25
C.2. Acquisition of External Innovation
To study how CVC-acquired information is capitalized through acquisitions of innovation,
I compile a detailed data set on firms’ acquisition of patents (either “company and patents” or
“patents only”). The database on patent transactions is based on USPTO patent assignment
files, hosted by Google Patents. This database provides useful information for identifying
patent transactions: the assignment date; the participating parties, including the assignee—
the “buyer” in a transaction—and the assignor—the “seller” in a transaction; and comments
on the reason for the assignment. To gather additional information on the original assignee
and patent technology classes, I merge the raw assignment data with the USPTO patent
databases, and with the HBS inventor database. I then follow a procedure, based on Serrano
(2010) and Akcigit, Celik, and Greenwood (2013), in which I separate patent transactions
from all patent reassignment records, that is, I remove reassignments associated with cases
such as a patent transfer from the employee inventor to the employer firm, or a patent
transfer between different subsidiaries of a firm. A more detailed description of the data and
methodology is provided in the Appendix.
I perform the analysis on the sample of patent purchases conducted by CVC parent firms
and their control firms, and the unit of observation is a patent transaction.23 The dependent
variable is calculated as the citation growth from the n-year (n = 1, 2, 3) period before the
patent transaction to the same length after the transaction.24 This variable intends to capture
whether the purchased patents better fit the buyer than the seller, thereby signaling a more
efficient transaction. As in Panel A, the key variable of interest is the difference-in-differences
term I(CV CParent)i × I(Post)i,t, indicating whether the patent buyer i is within five years
after launching its CVC division. If firms could capitalize the information learned from CVC
by conducting more efficient patent purchases, one would expect a positive coefficient to be
associated with the difference-in-differences term.
In Panel B of Table IX, I report the citation growth around patent transactions. The
23To be clear, some patents are transacted under one “deal,” and I necessarily treat each of them as oneindividual observation.
24For example, when n = 3, ∆Citation[−3,+3] is calculated as total citations received by the transactedpatent from one year to three years after the transaction minus total citations received from 3 years to oneyear before the transaction.
26
positive coefficient in column (1), 0.200, means that after benchmarked by patent transactions
conducted by their matched control firms and pre-CVC transactions, patents purchased by
CVC parent firms receive on average 0.2 more citations during the first year under the new
owner than the last year under the old owner. Column (2) uses a two-year horizon to calculate
citation increases, and the economic magnitude increases to 0.607. Column (3) shows an
amplified result due to a three-year horizon.
It is worth discussing the economic interpretation behind this spike in citations after CVC
firms’ patent transactions. In principle, a spike in citations indicates that the underlying
patent becomes increasingly visible and popular, plausibly because it better fits the overall
innovation profile of the new owner or is commercialized more successfully after the transaction.
Specifically in our context, this particularly strong increase in citations is consistent with the
interpretation that CVC parent firms acquire innovation that is in turn better commercialized
and made visible to the industry.
D. Human Capital Renewal and Information Acquisition
Evidence thus far suggests that CVC parent firms devote effort to integrating and utilizing
information acquired from the entrepreneurial sector. Identifying, processing, and integrating
new information is difficult, how do CVC parents accomplish this task? I identify one
important channel that CVC parents actively manage: human capital renewal. Indeed,
inventors, usually highly educated scientists and engineers, are key in absorbing, processing,
and using information to produce new innovation. Recent studies also find that firms actively
reallocate innovative human resources to spur innovation and adjust the scope of innovation
(Lacetera, Cockburn, and Henderson, 2004; Bernstein, 2015; Brav, Jiang, Ma, and Tian,
2015). In this section, I explore the role of inventors in facilitating knowledge gathering and
use.
I rely on Harvard Business School patenting database for inventor-level information.25
This database includes unique inventor identifiers that are constructed based on a refined
disambiguation algorithm employing multiple characteristics (Lai, D’Amour, and Fleming,
2009). After matching inventors to employer firms, I track the employment history and
25Available at: http://dvn.iq.harvard.edu/dvn/dv/patent.
27
annual patenting activities of each inventor.26 Using a similar criterion as in Bernstein (2015)
and Brav et al. (2015), I identify the number of inventors who leaves the company and the
number of inventors who are newly hired in each year.
[TABLE X AROUND HERE]
I start by examining the intensity of human resource adjustment around the years of
initiating CVC investment. The analysis is performed on the same firm-year panel of CVC
firms and control firms as in Table VII, using model (7). In Table X Panel A, I study the
number of inventors leaving the firm (columns (1) and (2)) and the number of inventors
newly hired by the firm (columns (3) and (4)). The coefficient, 0.119 in column (1), can be
interpreted as showing that CVC parent firms have 11.9% more inventors leaving the firm
(leavers) than the period before CVC investment. The vacancies created by leavers are filled
by inventors newly hired by the firm; the 0.110 estimated in column (3) means that CVC
parents hire about 11% more new inventors compared to the years before CVC investment,
benchmarked by their industry peers.
In columns (5) and (6), I examine the proportion of patents mainly contributed by
inventors new to the firm. A patent is considered as “mainly contributed by new inventors”
if at least half of the patent’s inventor team have three or fewer years of patenting experience
in the firm as of the patent application year. The positive coefficient of 17.1% in column (5)
means that CVC parent firms rely more heavily on new inventors when operating a CVC,
consistent with the proposition that firms hire new inventors to process new information and
produce innovation.
Table X Panel B presents new inventors’ intensity of incorporating new knowledge. The
patent-level sample consists of all the patents produced by CVC parent firms and their matched
control firms from five years before the event to five years after it. Beyond the standard
terms I(CV CParents)i and I(Post)i,t, I introduce an indicator variable INew Inventor’s Pat
that equals one if new inventors contribute at least half of the patent and zero otherwise.
26One limitation of this analysis is that we detect inventor mobility conditional on new patent filings;the observed mobility is thus associated with inventors who patent more frequently. But at any rate, thesepeople should be those who are economically more important to the firm. See Bernstein (2015) for a detaileddiscussion of the limitations associated with this database.
28
The unconditional effect of INew Inventor’s Pat is positive, meaning that patents produced
by firms’ new inventors typically incorporate more knowledge new to the firm. Meanwhile,
the interaction term I(CV CParents)× I(Post) is associated with higher New Cite Ratio
and Explorativeness, consistent with Table VII. A key result in this table is the positive
coefficient in front of the triple difference INew Inventors’ Pat × I(CV CParent) × I(Post),
which implies that new inventors in CVC parent firms concentrate more heavily on processing
and integrating new information and innovation knowledge. In column (3), I focus on the
sample of all patents produced by CVC parent firms during the five-year window after CVC
initiation (that is, I(CV CParents) = I(Post) = 1), and find that new inventors are more
likely to use knowledge acquired from CVC portfolio companies in their new innovation.
V. CVC Terminations: Staying Power and Investment Dynamics
As firms assimilate information into their innovation decisions and begin to have an
upward innovation trajectory, the benefit of keeping a standalone CVC unit shrinks. In this
scenario, CVC investment may fade out as internal innovation recovers and firms devote
more resources to this regained innovation path. This section examines this implication of
the information acquisition hypothesis by focusing on the termination stage of the CVC life
cycle.
The analysis provides further opportunities to distinguish the important strategic motiva-
tion behind CVC investment. Under alternative CVC rationales, CVC remains advantageous
in organizing innovation due to its superior ability to obtain asset complementarity (Hellmann,
2002), motivate entrepreneurs (Aghion and Tirole, 1994; Chemmanur, Loutskina, and Tian,
2013), and obtain competitive advantages (Mathews, 2006; Fulghieri and Sevilir, 2009). Even
though these studies focuses primarily on static trade-offs and does not concern intertemporal
dynamics, it implicitly implies that firms might invest persistently in CVCs long periods of
time.
29
A. The Staying Power of Corporate Venture Capital
I start by examining the staying power of Corporate Venture Capital. To do so, it is
necessary to define the date of terminating each CVC unit, which is not widely disclosed. When
this termination date is not available, I define it as the date of the CVC’s last investment in a
portfolio company. As a result, the staying power analysis could underestimate the duration
of CVCs, particularly toward the end of the sample. To mitigate bias, I categorize a CVC
as “active” if its last investment happened after 2012 (as of March 2015) and VentureXpert
codes its investment status as “Actively seeking new investments,” and I exclude those active
CVCs from the analysis. The duration of a CVC is calculated as the period between the
initiation and termination of the division.
[TABLE XI AROUND HERE]
Table XI tabulates the duration of CVC divisions. The median duration of a CVC is four
years, and a significant portion (46%) of CVCs actively invest for three years or less,27 lending
support to the argument that the benefit from CVC investment shrinks as information is
assimilated. However, a large number of firms (27%) operate CVCs for a long period (more
than 10 years). To understand why this is so, I report the median number of total and longest
consecutive years that a CVC is put into hibernation, defined as a year when no incremental
investment was made. When the CVC duration is short, the years between initiation and
termination are mostly active. As their duration increases, an increasing proportion of
years are under hibernation. When I examine these hibernation periods, I find a pattern of
consecutive hibernating years—for example, CVCs with eight-year durations have a median
of four years of consecutive hibernation. In other words, these CVCs typically have a length
pause in their CVC experience, bridging two shorter active periods of investment.
One might conclude that the short average CVC life cycle indicates that some CVC
parent firms are incompetent in the VC business and thus terminate their CVC divisions
quickly. To rule out this concern, in the last column of Table XI, I calculate the success rate
of deals invested by CVCs categorized by CVC durations. An investment deal is defined
27They certainly could interact with their portfolio companies for longer periods of time after terminatingincremental investment.
30
as a “success” if the entrepreneurial company was acquired or went public (I exclude cases
when the company is still alive without a successful exit). Success rates of investments do
not correlate with CVC duration, inconsistent with the idea of CVC incompetence.
B. Innovation Improvements and CVC Termination
What determines the termination and hibernation of CVCs? To echo Table III, which
shows that innovation deterioration motivates CVC initiations, I conclude my analysis of the
CVC life cycle by examining corporate innovation at termination. Table XII Panel A performs
simple statistical tests that compare innovation levels at the initiation and termination of the
CVC life cycle. The analysis is performed on all CVCs that can be assigned a termination
date (upper panel) and on the subgroup that stayed in business for at least five years. When
examining the industry-year adjusted innovation measures, we observe statistically significant
improvements at the CVC termination point compared to the initiation stage.
[TABLE XII AROUND HERE]
I exploit a hazard model to statistically relate innovation improvements and the decision
to terminate a CVC. A CVC parent firm enters the sample in the year of CVC initiation. The
key variable of interest is ∆Innovation, which measures the difference between innovation
level in year t and that of the initiation year. The result is shown in columns (1) and (2) of
Table XII Panel B. The positive and significant coefficients mean that larger improvements
of innovation from the initiation year motivate parent firms to terminate CVC investment.
To capture how innovation improvements affect the decision to put CVC into hibernation,
I investigate the intensive margin of CVC investment—the number of portfolio companies
a CVC invests in each year and the key variables of interests, ∆Innovation, are defined as
above. Columns (3) and (4) present the results, and the findings are consistent with columns
(1) and (2)—innovation improvements are associated with a lower level of CVC activities.
Overall, Table XII matches the finding at the initiation stage, and is consistent with
the information acquisition hypothesis, which predicts that when firms regain their upward
trajectory in corporate innovation, the marginal informational benefit of CVC shrinks, which
in turn leads to the termination or hibernation of CVC.
31
VI. Conclusion and Literature Revisited
How do corporations manage their boundaries of the firm in the pursuit of long-term
growth? This paper shed new light on this ultimate question at the intersection of organi-
zational economics and corporate finance by studying an emerging economic phenomenon,
Corporate Venture Capital (CVC), which is VC investment systematically made by estab-
lished corporations and bridges the corporate sector with the entrepreneurial sector. Is CVC
a pet-project for empire-building managers, or a conscious corporate decision? Armed with
an identification strategy that allows me to isolate firm-specific innovation shocks, I find that
firms launch CVC programs following innovation deterioration, and the main motivation
is to acquire information and innovation knowledge from the entrepreneurial sector. This
information acquisition rationale leads me to further characterize the life-cycle dynamics of
CVC—evolving through initiation, operation, and termination stage—in which CVC parent
firms strategically select information sources (portfolio companies), actively integrate newly
acquired information into corporate decisions, and terminate CVCs when informational
benefit shrinks.
Beyond establishing the CVC life cycle and the information acquisition rationale behind
these activities, I view this paper as a stepping stone toward understanding several broad
economic questions.
Organizing Innovation. This paper joins the endeavor to understand the architecture
of innovation and contributes to this literature by suggesting three areas for future work.
First, more work should be done to achieve a better understanding of details in CVC
operations. Second, this paper highlights the information acquisition motive behind organizing
innovation, which has been largely overlooked in the literature (Tirole, 2010) but is worth
future exploration. Third, this paper explicitly considers the interaction between CVC
investment and alternative organizational forms, calling for future studies that could consider
the system of organizing innovation as a whole, by seriously incorporating the interactions
among different organizational structures and a dynamic intertemporal scope.
Information Economics. Information is important in all areas of finance, yet infor-
mation choices have been hard to study both in asset pricing and in corporate finance,
32
either theoretically or empirically (Van Nieuwerburgh and Veldkamp, 2010). Empirical work
on corporate decisions regarding information management is particularly limited by the
unobservability of related behaviors. By examining the CVC life cycle, we obtain several
results regarding information acquisition and utilization that would be hard to show under
alternative settings. Future work could explore the CVC setting to answer more questions at
the intersection of information economics and corporate finance.
Creative Destruction. In broader terms, this paper provides new evidence concerning
the co-movement of entrepreneurship, creative destruction, and economic growth. En-
trepreneurial companies and incumbent firms differ in their ability to develop radical and
disruptive innovation and to capture new investment opportunities (Hall, 1993; Henderson,
1993; Jensen, 1993; Adelino, Ma, and Robinson, 2014; Acemoglu and Cao, 2015), and this
difference generates the creative destruction momentum. By highlighting CVC as an effective
incumbent-entrepreneur bridge, this paper essentially suggests that the two seemingly disen-
tangled sectors could be closely intertwined, which in turn affects both micro-level corporate
behaviors and the aggregate process of creative destruction.
33
REFERENCES
Acemoglu, Daron, and Dan Cao, 2015, Innovation by entrants and incumbents, Journal ofEconomic Theory 157, 255–294.
Acs, Zoltan J., and David B. Audretsch, 1988, Innovation in large and small firms: anempirical analysis, The American Economic Review 678–690.
Adelino, Manuel, Song Ma, and David T. Robinson, 2014, Firm age, investment opportunities,and job creation .
Aghion, Philippe, and Jean Tirole, 1994, The management of innovation, The QuarterlyJournal of Economics 109, 1185–1209.
Akcigit, Ufuk, Murat Alp Celik, and Jeremy Greenwood, 2013, Buy, keep or sell: Economicgrowth and the market for ideas .
Allen, Jeffrey W, and Gordon M Phillips, 2000, Corporate equity ownership, strategic alliances,and product market relationships, The Journal of Finance 55, 2791–2815.
Almeida, Heitor, Po-Hsuan Hsu, and Dongmei Li, 2013, Less is more: Financial constraintsand innovative efficiency .
Autor, David H, David Dorn, and Gordon H Hanson, 2013, The china syndrome: Local labormarket effects of import competition in the united states., American Economic Review103, 2121–2168.
Basu, Sandip, Corey Phelps, and Suresh Kotha, 2011, Towards understanding who makescorporate venture capital investments and why, Journal of Business Venturing 26, 153–171.
Bena, Jan, and Kai Li, 2014, Corporate innovations and mergers and acquisitions, TheJournal of Finance 69, 1923–1960.
Benson, David, and Rosemarie H Ziedonis, 2010, Corporate venture capital and the returnsto acquiring portfolio companies, Journal of Financial Economics 98, 478–499.
Bernstein, Shai, 2015, Does going public affect innovation?, The Journal of Finance .
Bernstein, Shai, Xavier Giroud, and Richard R Townsend, 2014, The impact of venture capitalmonitoring: Evidence from a natural experiment, Rock Center for Corporate Governanceat Stanford University Working Paper .
Bloom, Nicholas, 2009, The impact of uncertainty shocks, Econometrica 77, 623–685.
Bloom, Nicholas, Max Floetotto, Nir Jaimovich, Itay Saporta-Eksten, and Stephen J Terry,2012, Really uncertain business cycles, Technical report, National Bureau of EconomicResearch, Inc.
34
Bloom, Nicholas, Mark Schankerman, and John Van Reenen, 2013, Identifying technologyspillovers and product market rivalry, Econometrica 81, 1347–1393.
Bond, Philip, Alex Edmans, and Itay Goldstein, 2012, The real effects of financial markets,The Annual Review of Financial Economics is 4, 339–60.
Bottazzi, Laura, Marco Da Rin, and Thomas Hellmann, 2004, The changing face of theeuropean venture capital industry: Facts and analysis, The Journal of Private Equity 7,26–53.
Bottazzi, Laura, Marco Da Rin, and Thomas Hellmann, 2008, Who are the active investors?:Evidence from venture capital, Journal of Financial Economics 89, 488–512.
Brav, Alon, Wei Jiang, Song Ma, and Xuan Tian, 2015, Shareholder power and corporateinnovation: Evidence from hedge fund activism, Available at SSRN 2409404 .
Ceccagnoli, Marco, Matthew J Higgins, and Hyunsung D Kang, 2015, Corporate venturecapital as a real option in the markets for technology, Technical report, National Bureau ofEconomic Research.
Chemmanur, Thomas, Elena Loutskina, and Xuan Tian, 2013, Corporate venture capital,value creation, and innovation, The Review of Financial Studies .
Chemmanur, Thomas J, and Paolo Fulghieri, 2014, Entrepreneurial finance and innovation:An introduction and agenda for future research, Review of Financial Studies 27, 1–19.
Chen, Qi, Itay Goldstein, and Wei Jiang, 2007, Price informativeness and investment sensi-tivity to stock price, Review of Financial Studies 20, 619–650.
Chesbrough, Henry W, 2002, Making sense of corporate venture capital, Harvard BusinessReview 80, 90–99.
Cohen, Wesley M, and Daniel A Levinthal, 1990, Absorptive capacity: a new perspective onlearning and innovation, Administrative science quarterly 128–152.
Custodio, Claudia, Miguel A Ferreira, and Pedro Matos, 2013, Do general managerial skillsspur innovation? .
Da Rin, Marco, Thomas F Hellmann, and Manju Puri, 2011, A survey of venture capitalresearch, Technical report, National Bureau of Economic Research.
Dimitrova, Lora, 2013, Strategic acquisitions by corporate venture capital investors .
Dow, James, and Gary Gorton, 1997, Stock market efficiency and economic efficiency: Isthere a connection?, The Journal of Finance 52, 1087–1129.
Dushnitsky, Gary, 2006, Corporate venture capital: past evidence and future directions (OxfordUniversity Press: Oxford, UK).
35
Dushnitsky, Gary, and Michael J Lenox, 2005a, When do firms undertake r&d by investingin new ventures?, Strategic Management Journal 26, 947–965.
Dushnitsky, Gary, and Michael J Lenox, 2005b, When do incumbents learn from en-trepreneurial ventures?: Corporate venture capital and investing firm innovation rates,Research Policy 34, 615–639.
Dushnitsky, Gary, and Michael J Lenox, 2006, When does corporate venture capital investmentcreate firm value?, Journal of Business Venturing 21, 753–772.
Fee, C Edward, Charles J Hadlock, and Shawn Thomas, 2006, Corporate equity ownershipand the governance of product market relationships, The Journal of Finance 61, 1217–1251.
Fulghieri, Paolo, and Merih Sevilir, 2009, Organization and financing of innovation, andthe choice between corporate and independent venture capital, Journal of Financial andQuantitative Analysis 44, 1291.
Gargano, Antonio, Alberto G Rossi, and Russ Wermers, 2014, The freedom of informationact and the race towards information acquisition, Available at SSRN 2517075 .
Gompers, Paul, and Josh Lerner, 2000a, The determinants of corporate venture capital success:Organizational structure, incentives, and complementarities , 17–54 (University of ChicagoPress).
Gompers, Paul, and Josh Lerner, 2000b, Money chasing deals? the impact of fund inflows onprivate equity valuation, Journal of financial economics 55, 281–325.
Gonzalez-Uribe, Juanita, 2013, Venture Capital and Innovation, Ph.D. thesis, ColumbiaUniversity.
Hall, Bronwyn H, 1993, The stock market’s valuation of r&d investment during the 1980’s,The American Economic Review 259–264.
Hall, Bronwyn H, Zvi Griliches, and Jerry A Hausman, 1986, Patents and r and d: Is there alag?, International Economic Review 265–283.
Hall, Bronwyn H, Adam B Jaffe, and Manuel Trajtenberg, 2001, The nber patent citationdata file: Lessons, insights and methodological tools .
Harford, Jarrad, 2005, What drives merger waves?, Journal of financial economics 77,529–560.
Hellmann, Thomas, 2002, A theory of strategic venture investing, Journal of FinancialEconomics 64, 285–314.
Hellmann, Thomas, Laura Lindsey, and Manju Puri, 2008, Building relationships early:Banks in venture capital, Review of Financial Studies 21, 513–541.
36
Hellmann, Thomas, and Manju Puri, 2002, Venture capital and the professionalization ofstart-up firms: Empirical evidence, The Journal of Finance 57, 169–197.
Henderson, James, and Benoit Leleux, 2002, Corporate venture capital: effecting resourcecombinations and transfers, Babson Entrepreneurial Review 2, 31–46.
Henderson, Rebecca, 1993, Underinvestment and incompetence as responses to radicalinnovation: Evidence from the photolithographic alignment equipment industry, TheRAND Journal of Economics 248–270.
Higgins, Matthew J, and Daniel Rodriguez, 2006, The outsourcing of r&d through acquisitionsin the pharmaceutical industry, Journal of Financial Economics 80, 351–383.
Hsu, David H, 2004, What do entrepreneurs pay for venture capital affiliation?, The Journalof Finance 59, 1805–1844.
Igami, Mitsuru, 2014, Estimating the innovator’s dilemma: Structural analysis of creativedestruction in the hard disk drive industry, Available at SSRN 1733174 .
Jaffe, Adam B, 1986, Technological opportunity and spillovers of r & d: Evidence from firms’patents, profits, and market value, The American Economic Review 984–1001.
Jensen, Michael C, 1993, The modern industrial revolution, exit, and the failure of internalcontrol systems, the Journal of Finance 48, 831–880.
Jones, Benjamin F, 2009, The burden of knowledge and the death of the renaissance man: isinnovation getting harder?, The Review of Economic Studies 76, 283–317.
Jovanovic, Boyan, and Rafael Rob, 1989, The growth and diffusion of knowledge, The Reviewof Economic Studies 56, 569–582.
Jurado, Kyle, Sydney C Ludvigson, and Serena Ng, 2013, Measuring uncertainty, New YorkUniversity, mimeo .
Kim, Keongtae, Anandasivam Gopal, and Gerard Hoberg, 2013, Product market competitionand corporate venture capital investment in the it industry: An empirical analysis, Availableat SSRN 2259967 .
Kortum, Samuel, and Josh Lerner, 2000, Assessing the contribution of venture capital toinnovation, RAND Journal of Economics 674–692.
Kortum, Samuel S, 1997, Research, patenting, and technological change, Econometrica1389–1419.
Lacetera, Nicola, Iain M Cockburn, and Rebecca Henderson, 2004, Do firms change capabilitiesby hiring new people? a study of the adoption of science-based drug discovery, Advancesin strategic management 21, 133–160.
37
Lach, Saul, and Mark Schankerman, 1989, Dynamics of r & d and investment in the scientificsector, The Journal of Political Economy 880–904.
Lai, Ronald, Alexander D’Amour, and Lee Fleming, 2009, The careers and co-authorshipnetworks of us patent-holders since 1975 .
Lerner, Josh, 2012, The architecture of innovation: The economics of creative organizations(Harvard Business Press).
Li, Kai, Jiaping Qiu, and Jin Wang, 2014, Technological competition and strategic alliances,Available at SSRN 2480547 .
Macmillan, Ian, E Roberts, V Livada, and A Wang, 2008, Corporate venture capital (cvc)seeking innovation and strategic growth. recent patterns in cvc mission, structure, andinvestment, NIST GCR 08–96.
Manso, Gustavo, 2011, Motivating innovation, The Journal of Finance 66, 1823–1860.
Mathews, Richmond D, 2006, Strategic alliances, equity stakes, and entry deterrence, Journalof Financial Economics 80, 35–79.
Matray, Adrien, 2014, Essays in Empirical Corporate Finance, Ph.D. thesis, Jouy-en Josas,HEC.
Maula, Markku VJ, 2007, 15 corporate venture capital as a strategic tool for corporations,Handbook of research on venture capital 371.
Maula, Markku VJ, et al., 2001, Corporate venture capital and the value-added for technology-based new firms (Helsinki University of Technology).
Mitchell, Mark L, and J Harold Mulherin, 1996, The impact of industry shocks on takeoverand restructuring activity, Journal of financial economics 41, 193–229.
Nelson, Richard R, 1982, The role of knowledge in r&d efficiency, The Quarterly Journal ofEconomics 453–470.
Peri, Giovanni, 2005, Determinants of knowledge flows and their effect on innovation, Reviewof Economics and Statistics 87, 308–322.
Rhodes-Kropf, Matthew, David T Robinson, and S Viswanathan, 2005, Valuation waves andmerger activity: The empirical evidence, Journal of Financial Economics 77, 561–603.
Robinson, David T, 2008, Strategic alliances and the boundaries of the firm, Review ofFinancial Studies 21, 649–681.
Scherer, Frederic M, 1965, Firm size, market structure, opportunity, and the output ofpatented inventions, The American Economic Review 1097–1125.
38
Serrano, Carlos J, 2010, The dynamics of the transfer and renewal of patents, The RANDJournal of Economics 41, 686–708.
Seru, Amit, 2014, Firm boundaries matter: Evidence from conglomerates and r&d activity,Journal of Financial Economics 111, 381–405.
Siegel, Robin, Eric Siegel, and Ian C MacMillan, 1988, Corporate venture capitalists: Auton-omy, obstacles, and performance, Journal of Business Venturing 3, 233–247.
Sørensen, Morten, 2007, How smart is smart money? a two-sided matching model of venturecapital, The Journal of Finance 62, 2725–2762.
Stock, James H, and Motohiro Yogo, 2005, Testing for weak instruments in linear iv regres-sion, Identification and Inference for Econometric Models: Essays in Honor of ThomasRothenberg 80.
Sunder, Jayanthi, Shyam V Sunder, and Jingjing Zhang, 2014, Ceo sensation seeking andcorporate innovation, Available at SSRN 2474909 .
Tirole, Jean, 2010, The theory of corporate finance (Princeton University Press).
Van Nieuwerburgh, Stijn, and Laura Veldkamp, 2010, Information acquisition and under-diversification, The Review of Economic Studies 77, 779–805.
Wadhwa, Anu, Corey Phelps, and Suresh Kotha, 2015, Corporate venture capital portfoliosand firm innovation, Journal of Business Venturing, Forthcoming .
Yang, Ming, 2013, Optimality of debt under flexible information acquisition, Available atSSRN 2103971 .
Zingales, Luigi, 2000, In search of new foundations, The Journal of Finance 55, 1623–1653.
39
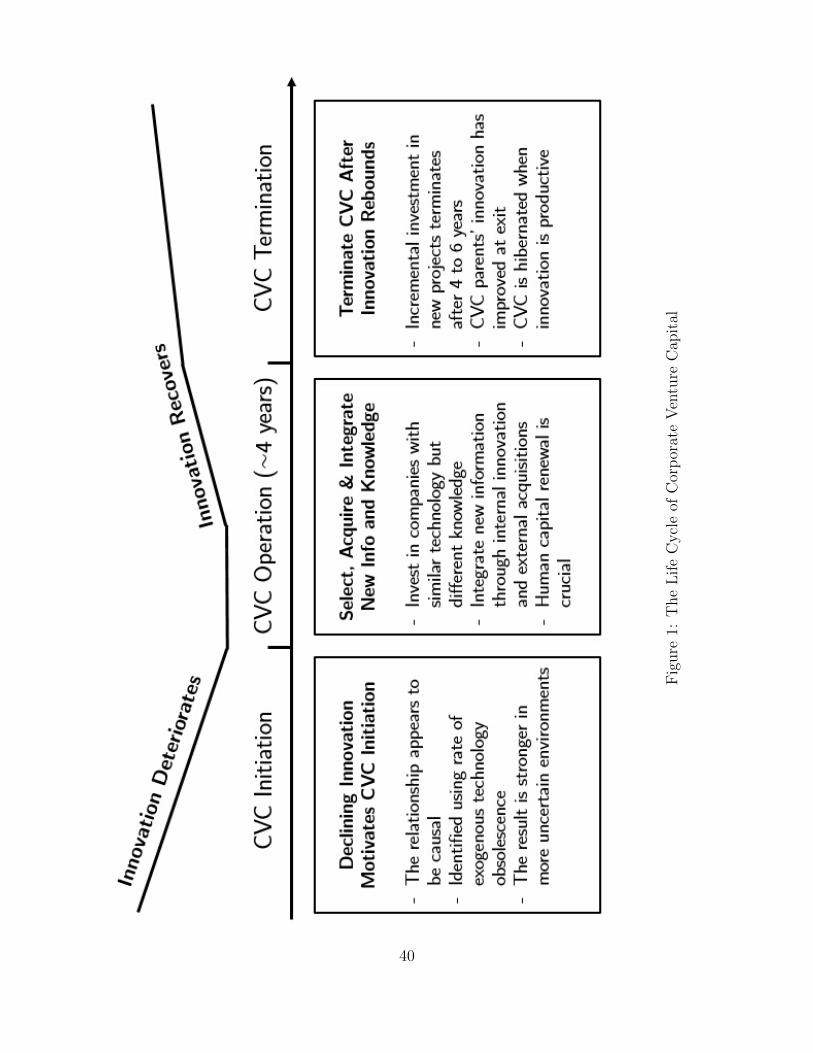
Fig
ure
1:T
he
Lif
eC
ycl
eof
Cor
por
ate
Ven
ture
Cap
ital
40
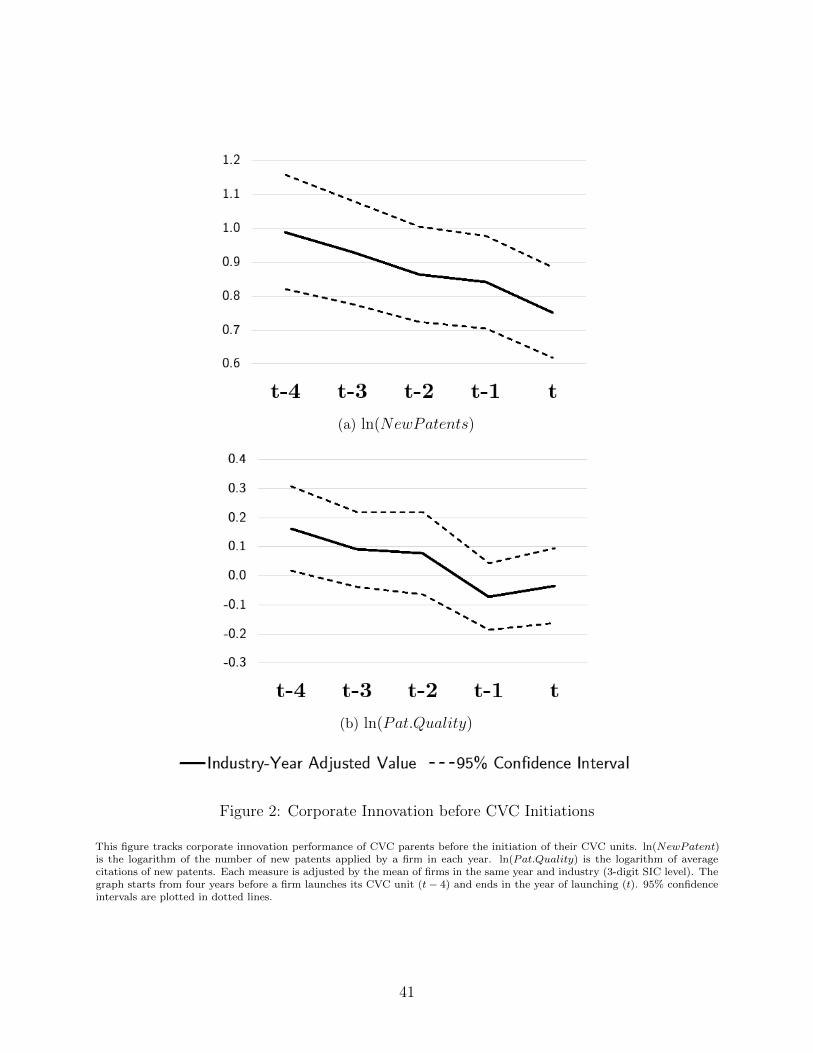
(a) ln(NewPatents)
(b) ln(Pat.Quality)
Figure 2: Corporate Innovation before CVC Initiations
This figure tracks corporate innovation performance of CVC parents before the initiation of their CVC units. ln(NewPatent)is the logarithm of the number of new patents applied by a firm in each year. ln(Pat.Quality) is the logarithm of averagecitations of new patents. Each measure is adjusted by the mean of firms in the same year and industry (3-digit SIC level). Thegraph starts from four years before a firm launches its CVC unit (t− 4) and ends in the year of launching (t). 95% confidenceintervals are plotted in dotted lines.
41
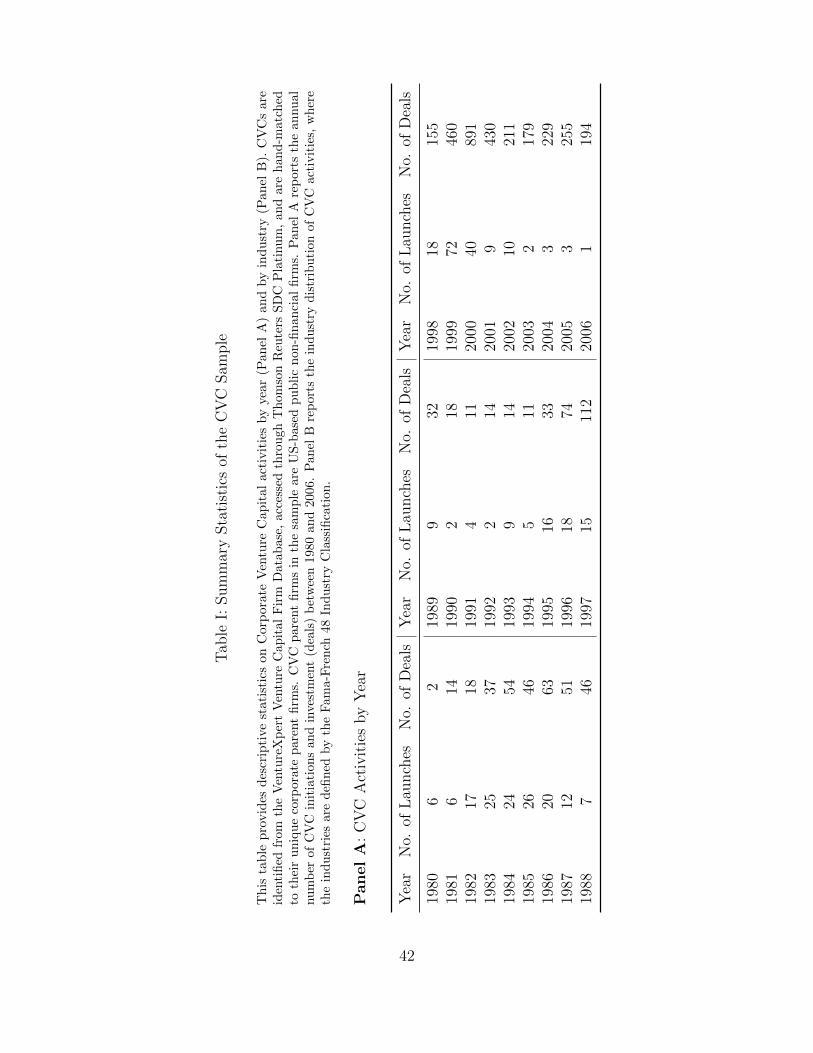
Tab
leI:
Sum
mar
ySta
tist
ics
ofth
eC
VC
Sam
ple
This
table
pro
vid
esdes
crip
tive
stati
stic
son
Corp
ora
teV
entu
reC
apit
al
act
ivit
ies
by
yea
r(P
anel
A)
and
by
indust
ry(P
anel
B).
CV
Cs
are
iden
tified
from
the
Ven
ture
Xp
ert
Ven
ture
Cap
ital
Fir
mD
atab
ase,
acce
ssed
thro
ugh
Thom
son
Reu
ters
SD
CP
lati
num
,an
dar
ehan
d-m
atch
edto
thei
runiq
ue
corp
orat
epar
ent
firm
s.C
VC
par
ent
firm
sin
the
sam
ple
are
US-b
ased
public
non
-finan
cial
firm
s.P
anel
Are
por
tsth
ean
nual
nu
mb
erof
CV
Cin
itia
tion
san
din
vest
men
t(d
eals
)b
etw
een
1980
and
2006
.P
anel
Bre
por
tsth
ein
dust
ryd
istr
ibu
tion
ofC
VC
acti
vit
ies,
wh
ere
the
ind
ust
ries
are
defi
ned
by
the
Fam
a-F
ren
ch48
Ind
ust
ryC
lass
ifica
tion
.
Panel
A:
CV
CA
ctiv
itie
sby
Yea
r
Yea
rN
o.of
Lau
nch
esN
o.of
Dea
lsY
ear
No.
ofL
aunch
esN
o.of
Dea
lsY
ear
No.
ofL
aunch
esN
o.of
Dea
ls
1980
62
1989
932
1998
1815
519
816
1419
902
1819
9972
460
1982
1718
1991
411
2000
4089
119
8325
3719
922
1420
019
430
1984
2454
1993
914
2002
1021
119
8526
4619
945
1120
032
179
1986
2063
1995
1633
2004
322
919
8712
5119
9618
7420
053
255
1988
746
1997
1511
220
061
194
42
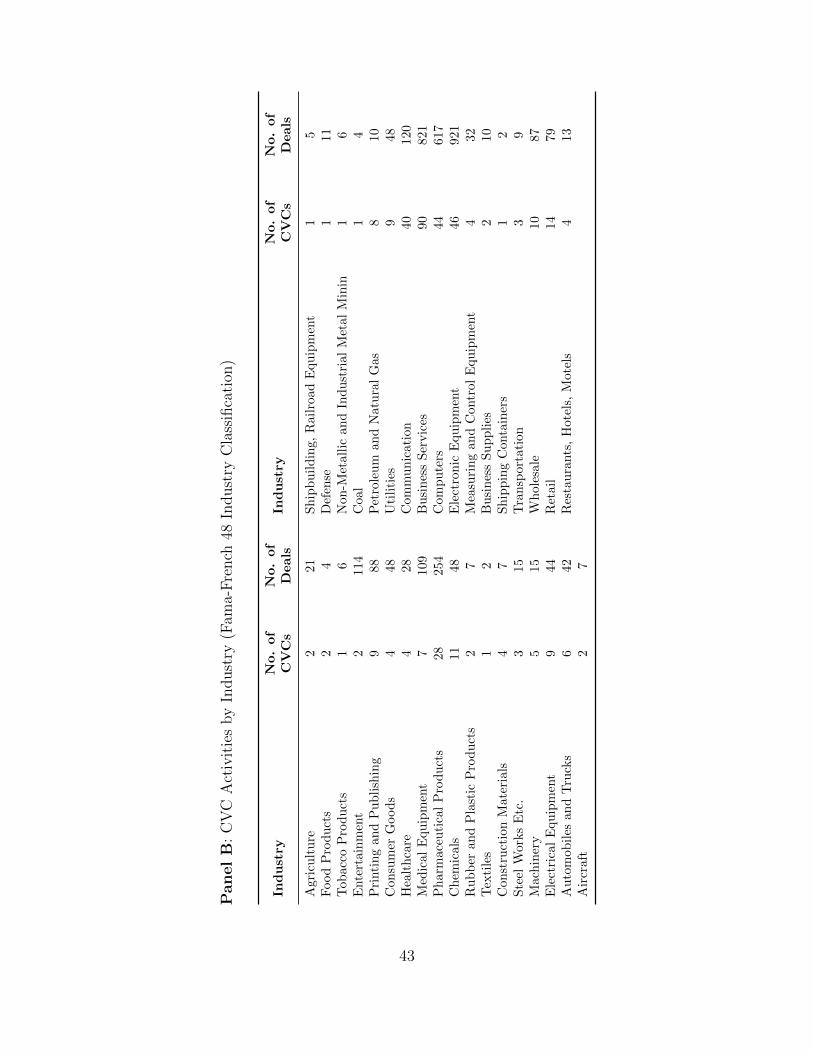
Panel
B:
CV
CA
ctiv
itie
sby
Indust
ry(F
ama-
Fre
nch
48In
dust
ryC
lass
ifica
tion
)
Ind
ust
ryN
o.
of
CV
Cs
No.
of
Deals
Ind
ust
ryN
o.
of
CV
Cs
No.
of
Deals
Agr
icu
ltu
re2
21
Sh
ipb
uil
din
g,
Rail
road
Equ
ipm
ent
15
Food
Pro
du
cts
24
Def
ense
111
Tob
acco
Pro
du
cts
16
Non
-Met
all
ican
dIn
du
stri
al
Met
al
Min
in1
6E
nte
rtai
nm
ent
2114
Coal
14
Pri
nti
ng
and
Pu
bli
shin
g9
88
Pet
role
um
an
dN
atu
ral
Gas
810
Con
sum
erG
ood
s4
48
Uti
liti
es9
48
Hea
lth
care
428
Com
mu
nic
ati
on
40
120
Med
ical
Equ
ipm
ent
7109
Bu
sin
ess
Ser
vic
es90
821
Ph
arm
aceu
tica
lP
rod
uct
s28
254
Com
pu
ters
44
617
Ch
emic
als
11
48
Ele
ctro
nic
Equ
ipm
ent
46
921
Ru
bb
eran
dP
last
icP
rod
uct
s2
7M
easu
rin
gan
dC
ontr
ol
Equ
ipm
ent
432
Tex
tile
s1
2B
usi
nes
sS
up
pli
es2
10
Con
stru
ctio
nM
ater
ials
47
Sh
ipp
ing
Conta
iner
s1
2S
teel
Wor
ks
Etc
.3
15
Tra
nsp
ort
ati
on
39
Mac
hin
ery
515
Wh
ole
sale
10
87
Ele
ctri
cal
Equ
ipm
ent
944
Ret
ail
14
79
Au
tom
obil
esan
dT
ruck
s6
42
Res
tau
rants
,H
ote
ls,
Mote
ls4
13
Air
craf
t2
7
43
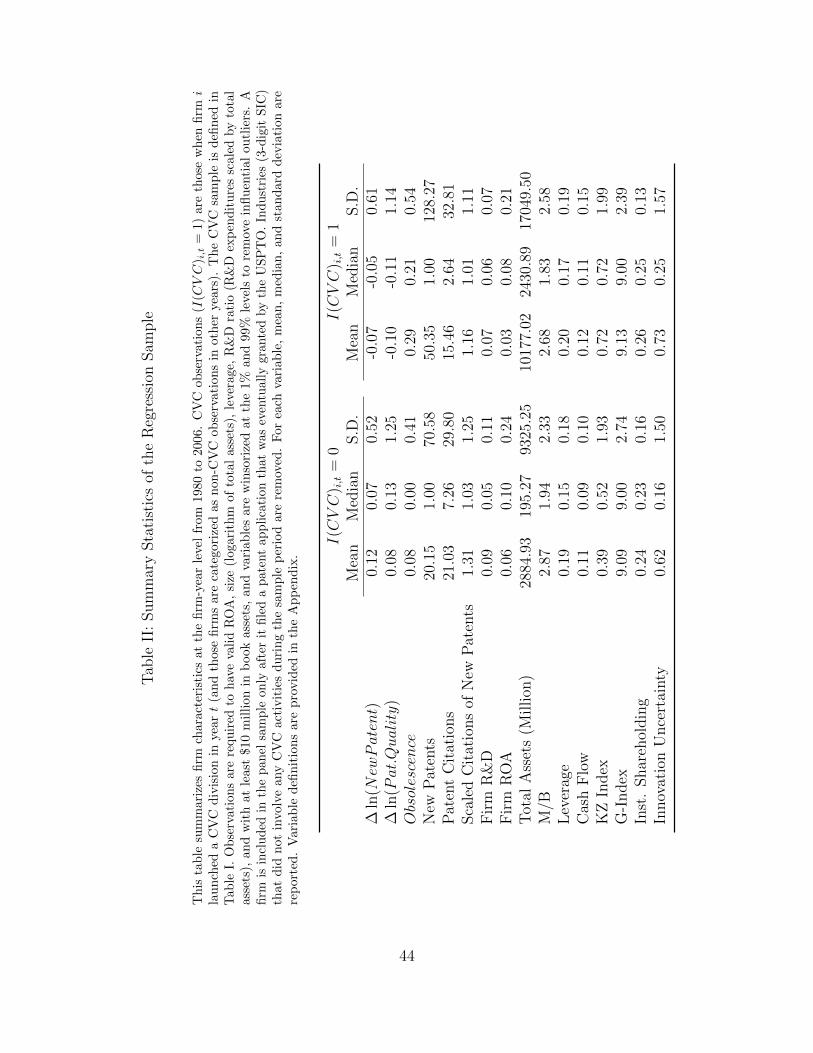
Tab
leII
:Sum
mar
ySta
tist
ics
ofth
eR
egre
ssio
nSam
ple
This
table
sum
mar
izes
firm
char
acte
rist
ics
atth
efirm
-yea
rle
vel
from
1980
to20
06.
CV
Cob
serv
atio
ns
(I(CVC
) i,t
=1)
are
thos
ew
hen
firm
ila
unch
eda
CV
Cdiv
isio
nin
yea
rt
(and
those
firm
sare
cate
gori
zed
as
non-C
VC
obse
rvati
ons
inoth
eryea
rs).
The
CV
Csa
mple
isdefi
ned
inT
able
I.O
bse
rvat
ions
are
requir
edto
hav
eva
lid
RO
A,
size
(log
arit
hm
ofto
tal
asse
ts),
leve
rage
,R
&D
rati
o(R
&D
exp
endit
ure
ssc
aled
by
tota
lass
ets)
,and
wit
hat
least
$10
million
inb
ook
ass
ets,
and
vari
able
sare
win
sori
zed
at
the
1%
and
99%
level
sto
rem
ove
influen
tial
outl
iers
.A
firm
isin
cluded
inth
epan
elsa
mple
only
afte
rit
file
da
pat
ent
applica
tion
that
was
even
tual
lygr
ante
dby
the
USP
TO
.In
dust
ries
(3-d
igit
SIC
)th
atd
idn
otin
volv
ean
yC
VC
acti
vit
ies
du
rin
gth
esa
mp
lep
erio
dar
ere
mov
ed.
For
each
vari
able
,m
ean
,m
edia
n,
and
stan
dar
dd
evia
tion
are
rep
orte
d.
Var
iab
led
efin
itio
ns
are
pro
vid
edin
the
Ap
pen
dix
.
I(CVC
) i,t
=0
I(CVC
) i,t
=1
Mea
nM
edia
nS.D
.M
ean
Med
ian
S.D
.∆
ln(NewPatent)
0.12
0.07
0.52
-0.0
7-0
.05
0.61
∆ln
(Pat.Quality
)0.
080.
131.
25-0
.10
-0.1
11.
14Obsolescence
0.08
0.00
0.41
0.29
0.21
0.54
New
Pat
ents
20.1
51.
0070
.58
50.3
51.
0012
8.27
Pat
ent
Cit
atio
ns
21.0
37.
2629
.80
15.4
62.
6432
.81
Sca
led
Cit
atio
ns
ofN
ewP
aten
ts1.
311.
031.
251.
161.
011.
11F
irm
R&
D0.
090.
050.
110.
070.
060.
07F
irm
RO
A0.
060.
100.
240.
030.
080.
21T
otal
Ass
ets
(Million
)28
84.9
319
5.27
9325
.25
1017
7.02
2430
.89
1704
9.50
M/B
2.87
1.94
2.33
2.68
1.83
2.58
Lev
erag
e0.
190.
150.
180.
200.
170.
19C
ash
Flo
w0.
110.
090.
100.
120.
110.
15K
ZIn
dex
0.39
0.52
1.93
0.72
0.72
1.99
G-I
ndex
9.09
9.00
2.74
9.13
9.00
2.39
Inst
.Shar
ehol
din
g0.
240.
230.
160.
260.
250.
13In
nov
atio
nU
nce
rtai
nty
0.62
0.16
1.50
0.73
0.25
1.57
44
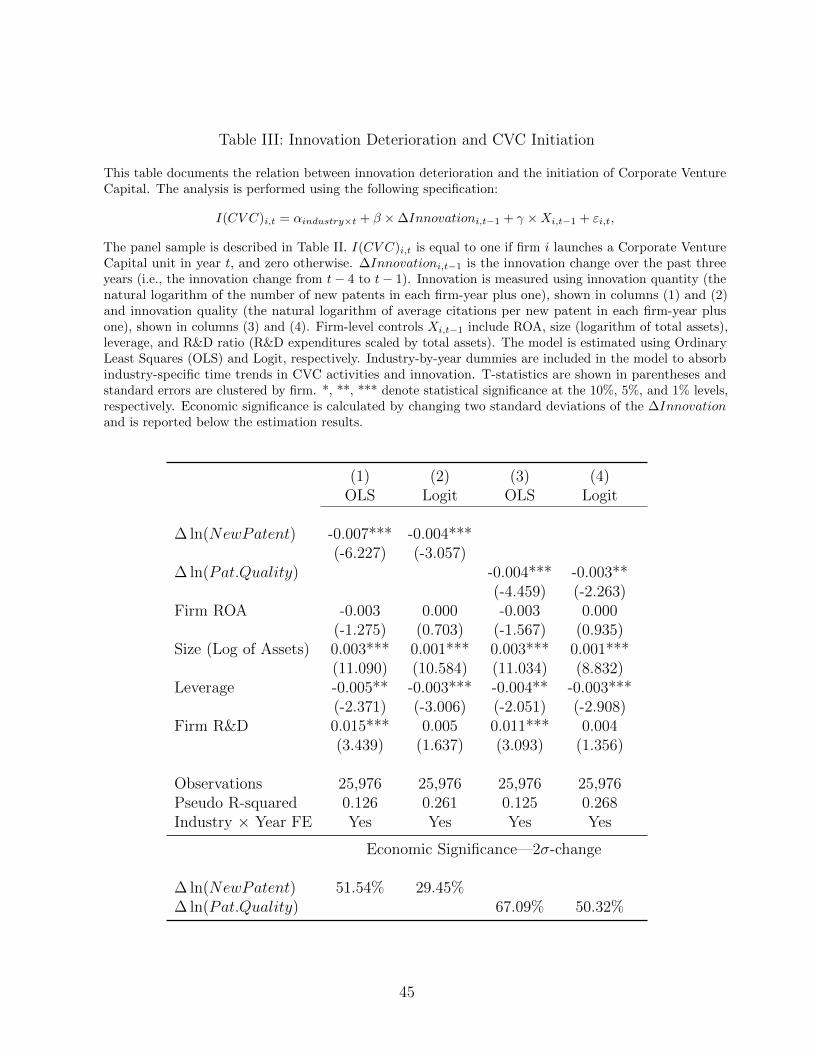
Table III: Innovation Deterioration and CVC Initiation
This table documents the relation between innovation deterioration and the initiation of Corporate VentureCapital. The analysis is performed using the following specification:
I(CV C)i,t = αindustry×t + β ×∆Innovationi,t−1 + γ ×Xi,t−1 + εi,t,
The panel sample is described in Table II. I(CV C)i,t is equal to one if firm i launches a Corporate VentureCapital unit in year t, and zero otherwise. ∆Innovationi,t−1 is the innovation change over the past threeyears (i.e., the innovation change from t− 4 to t− 1). Innovation is measured using innovation quantity (thenatural logarithm of the number of new patents in each firm-year plus one), shown in columns (1) and (2)and innovation quality (the natural logarithm of average citations per new patent in each firm-year plusone), shown in columns (3) and (4). Firm-level controls Xi,t−1 include ROA, size (logarithm of total assets),leverage, and R&D ratio (R&D expenditures scaled by total assets). The model is estimated using OrdinaryLeast Squares (OLS) and Logit, respectively. Industry-by-year dummies are included in the model to absorbindustry-specific time trends in CVC activities and innovation. T-statistics are shown in parentheses andstandard errors are clustered by firm. *, **, *** denote statistical significance at the 10%, 5%, and 1% levels,respectively. Economic significance is calculated by changing two standard deviations of the ∆Innovationand is reported below the estimation results.
(1) (2) (3) (4)OLS Logit OLS Logit
∆ ln(NewPatent) -0.007*** -0.004***(-6.227) (-3.057)
∆ ln(Pat.Quality) -0.004*** -0.003**(-4.459) (-2.263)
Firm ROA -0.003 0.000 -0.003 0.000(-1.275) (0.703) (-1.567) (0.935)
Size (Log of Assets) 0.003*** 0.001*** 0.003*** 0.001***(11.090) (10.584) (11.034) (8.832)
Leverage -0.005** -0.003*** -0.004** -0.003***(-2.371) (-3.006) (-2.051) (-2.908)
Firm R&D 0.015*** 0.005 0.011*** 0.004(3.439) (1.637) (3.093) (1.356)
Observations 25,976 25,976 25,976 25,976Pseudo R-squared 0.126 0.261 0.125 0.268Industry × Year FE Yes Yes Yes Yes
Economic Significance—2σ-change
∆ ln(NewPatent) 51.54% 29.45%∆ ln(Pat.Quality) 67.09% 50.32%
45
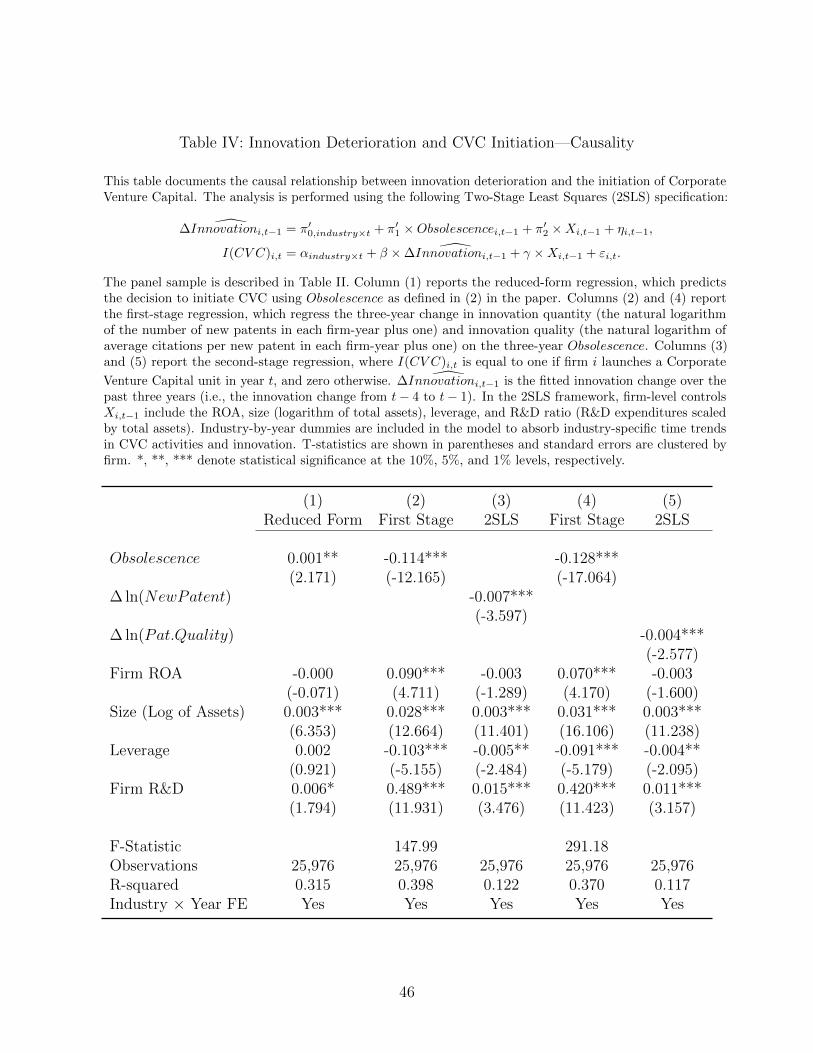
Table IV: Innovation Deterioration and CVC Initiation—Causality
This table documents the causal relationship between innovation deterioration and the initiation of CorporateVenture Capital. The analysis is performed using the following Two-Stage Least Squares (2SLS) specification:
∆Innovationi,t−1 = π′0,industry×t + π′1 ×Obsolescencei,t−1 + π′2 ×Xi,t−1 + ηi,t−1,
I(CV C)i,t = αindustry×t + β × ∆Innovationi,t−1 + γ ×Xi,t−1 + εi,t.
The panel sample is described in Table II. Column (1) reports the reduced-form regression, which predictsthe decision to initiate CVC using Obsolescence as defined in (2) in the paper. Columns (2) and (4) reportthe first-stage regression, which regress the three-year change in innovation quantity (the natural logarithmof the number of new patents in each firm-year plus one) and innovation quality (the natural logarithm ofaverage citations per new patent in each firm-year plus one) on the three-year Obsolescence. Columns (3)and (5) report the second-stage regression, where I(CV C)i,t is equal to one if firm i launches a Corporate
Venture Capital unit in year t, and zero otherwise. ∆Innovationi,t−1 is the fitted innovation change over thepast three years (i.e., the innovation change from t− 4 to t− 1). In the 2SLS framework, firm-level controlsXi,t−1 include the ROA, size (logarithm of total assets), leverage, and R&D ratio (R&D expenditures scaledby total assets). Industry-by-year dummies are included in the model to absorb industry-specific time trendsin CVC activities and innovation. T-statistics are shown in parentheses and standard errors are clustered byfirm. *, **, *** denote statistical significance at the 10%, 5%, and 1% levels, respectively.
(1) (2) (3) (4) (5)Reduced Form First Stage 2SLS First Stage 2SLS
Obsolescence 0.001** -0.114*** -0.128***(2.171) (-12.165) (-17.064)
∆ ln(NewPatent) -0.007***(-3.597)
∆ ln(Pat.Quality) -0.004***(-2.577)
Firm ROA -0.000 0.090*** -0.003 0.070*** -0.003(-0.071) (4.711) (-1.289) (4.170) (-1.600)
Size (Log of Assets) 0.003*** 0.028*** 0.003*** 0.031*** 0.003***(6.353) (12.664) (11.401) (16.106) (11.238)
Leverage 0.002 -0.103*** -0.005** -0.091*** -0.004**(0.921) (-5.155) (-2.484) (-5.179) (-2.095)
Firm R&D 0.006* 0.489*** 0.015*** 0.420*** 0.011***(1.794) (11.931) (3.476) (11.423) (3.157)
F-Statistic 147.99 291.18Observations 25,976 25,976 25,976 25,976 25,976R-squared 0.315 0.398 0.122 0.370 0.117Industry × Year FE Yes Yes Yes Yes Yes
46
Table V: Innovation Deterioration and CVC Initiation—The Role of Uncertainty
This table documents the causal relation between innovation deterioration and CVC initiations across firmswith heterogeneous informational environment. The analysis is performed using extended specifications basedon Table III and Table IV:
I(CV C)i,t = αindustry×t + β ×∆Innovationi,t−1
+ β′ ×∆Innovationi,t−1 × Iuncertainty,it+ γ′ × Iuncertainty,it + γ ×Xi,t−1 + εi,t.
The panel sample is described in Table II. Observations are categorized into two subgroups by the median ofuncertainty level of the firm’s informational environment, indicated by Iuncertainty, which is measured usingthe average dispersion of patent quality in a technology class weighted by the technological distribution of thefirm’s portfolio over technology classes. When estimating using 2SLS, I instrument ∆Innovationi,t−1 withObsolescence, and the interaction term is instrumented by the interaction of Obsolescence with Iuncertainty,it.Columns (1) and (4) report the first-stage regression, which regresses the three-year change in innovationquantity (the natural logarithm of the number of new patents in each firm-year plus one) and innovationquality (the natural logarithm of average citations per new patent in each firm-year plus one) on the three-yearknowledge obsolescence as defined in (2) in the paper. Columns (2) and (5) report the OLS regression results,where I(CV C)i,t is equal to one if firm i launches a Corporate Venture Capital unit in year t, and zerootherwise. Columns (3) and (6) report the second-stage regression. Firm-level controls Xi,t−1 include theROA, size (logarithm of total assets), leverage, and R&D ratio (R&D expenditures scaled by total assets).Industry-by-year dummies are included in the specification to absorb industry-specific time trends in CVCactivities and innovation. T-statistics are shown in parentheses and standard errors are clustered by firm. *,**, *** denote statistical significance at the 10%, 5%, and 1% levels, respectively.
47
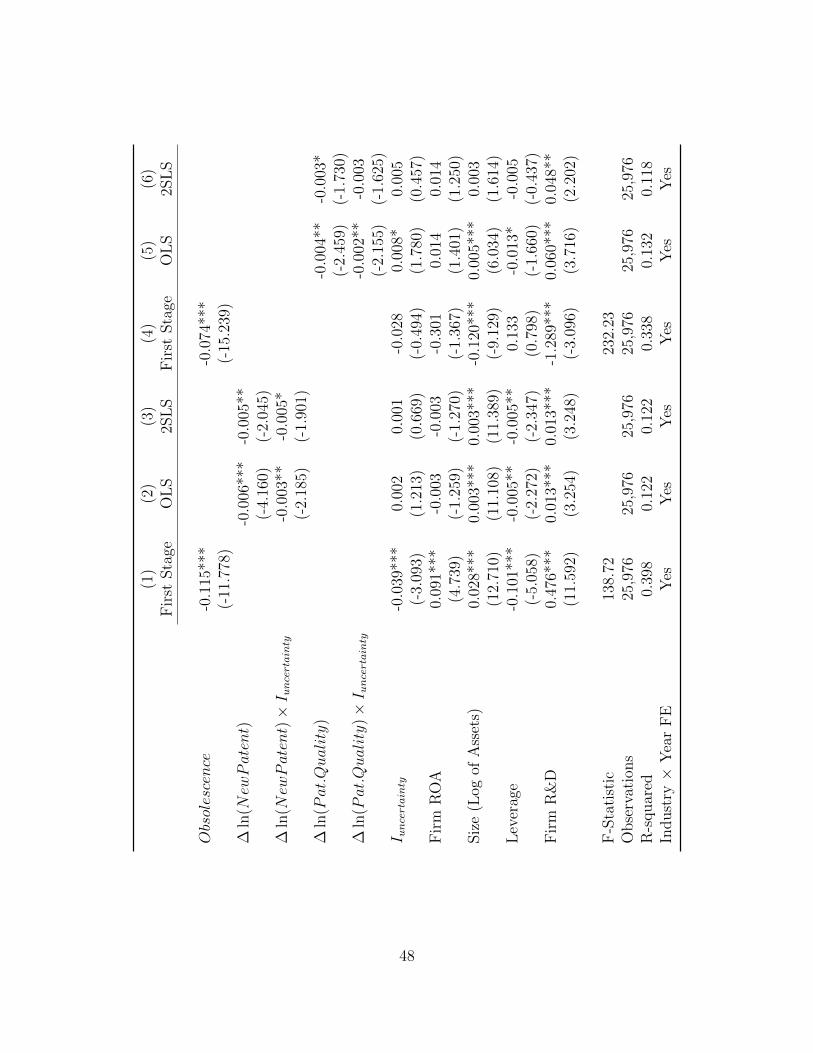
(1)
(2)
(3)
(4)
(5)
(6)
Fir
stSta
geO
LS
2SL
SF
irst
Sta
geO
LS
2SL
S
Obsolescence
-0.1
15**
*-0
.074
***
(-11
.778
)(-
15.2
39)
∆ln
(NewPatent)
-0.0
06**
*-0
.005
**(-
4.16
0)(-
2.04
5)∆
ln(NewPatent)×I uncertainty
-0.0
03**
-0.0
05*
(-2.
185)
(-1.
901)
∆ln
(Pat.Quality
)-0
.004
**-0
.003
*(-
2.45
9)(-
1.73
0)∆
ln(Pat.Quality
)×I uncertainty
-0.0
02**
-0.0
03(-
2.15
5)(-
1.62
5)I uncertainty
-0.0
39**
*0.
002
0.00
1-0
.028
0.00
8*0.
005
(-3.
093)
(1.2
13)
(0.6
69)
(-0.
494)
(1.7
80)
(0.4
57)
Fir
mR
OA
0.09
1***
-0.0
03-0
.003
-0.3
010.
014
0.01
4(4
.739
)(-
1.25
9)(-
1.27
0)(-
1.36
7)(1
.401
)(1
.250
)Siz
e(L
ogof
Ass
ets)
0.02
8***
0.00
3***
0.00
3***
-0.1
20**
*0.
005*
**0.
003
(12.
710)
(11.
108)
(11.
389)
(-9.
129)
(6.0
34)
(1.6
14)
Lev
erag
e-0
.101
***
-0.0
05**
-0.0
05**
0.13
3-0
.013
*-0
.005
(-5.
058)
(-2.
272)
(-2.
347)
(0.7
98)
(-1.
660)
(-0.
437)
Fir
mR
&D
0.47
6***
0.01
3***
0.01
3***
-1.2
89**
*0.
060*
**0.
048*
*(1
1.59
2)(3
.254
)(3
.248
)(-
3.09
6)(3
.716
)(2
.202
)
F-S
tati
stic
138.
7223
2.23
Obse
rvat
ions
25,9
7625
,976
25,9
7625
,976
25,9
7625
,976
R-s
quar
ed0.
398
0.12
20.
122
0.33
80.
132
0.11
8In
dust
ry×
Yea
rF
EY
esY
esY
esY
esY
esY
es
48
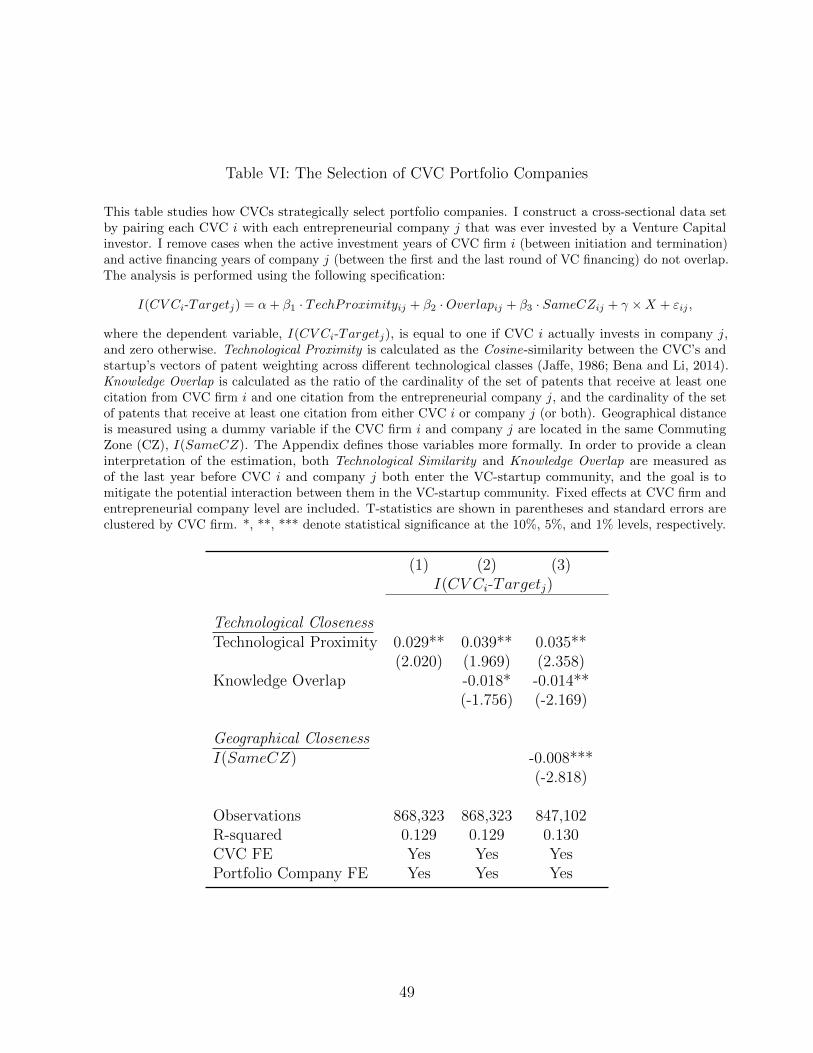
Table VI: The Selection of CVC Portfolio Companies
This table studies how CVCs strategically select portfolio companies. I construct a cross-sectional data setby pairing each CVC i with each entrepreneurial company j that was ever invested by a Venture Capitalinvestor. I remove cases when the active investment years of CVC firm i (between initiation and termination)and active financing years of company j (between the first and the last round of VC financing) do not overlap.The analysis is performed using the following specification:
I(CV Ci-Targetj) = α+ β1 · TechProximityij + β2 ·Overlapij + β3 · SameCZij + γ ×X + εij ,
where the dependent variable, I(CV Ci-Targetj), is equal to one if CVC i actually invests in company j,and zero otherwise. Technological Proximity is calculated as the Cosine-similarity between the CVC’s andstartup’s vectors of patent weighting across different technological classes (Jaffe, 1986; Bena and Li, 2014).Knowledge Overlap is calculated as the ratio of the cardinality of the set of patents that receive at least onecitation from CVC firm i and one citation from the entrepreneurial company j, and the cardinality of the setof patents that receive at least one citation from either CVC i or company j (or both). Geographical distanceis measured using a dummy variable if the CVC firm i and company j are located in the same CommutingZone (CZ), I(SameCZ). The Appendix defines those variables more formally. In order to provide a cleaninterpretation of the estimation, both Technological Similarity and Knowledge Overlap are measured asof the last year before CVC i and company j both enter the VC-startup community, and the goal is tomitigate the potential interaction between them in the VC-startup community. Fixed effects at CVC firm andentrepreneurial company level are included. T-statistics are shown in parentheses and standard errors areclustered by CVC firm. *, **, *** denote statistical significance at the 10%, 5%, and 1% levels, respectively.
(1) (2) (3)I(CV Ci-Targetj)
Technological ClosenessTechnological Proximity 0.029** 0.039** 0.035**
(2.020) (1.969) (2.358)Knowledge Overlap -0.018* -0.014**
(-1.756) (-2.169)
Geographical ClosenessI(SameCZ) -0.008***
(-2.818)
Observations 868,323 868,323 847,102R-squared 0.129 0.129 0.130CVC FE Yes Yes YesPortfolio Company FE Yes Yes Yes
49
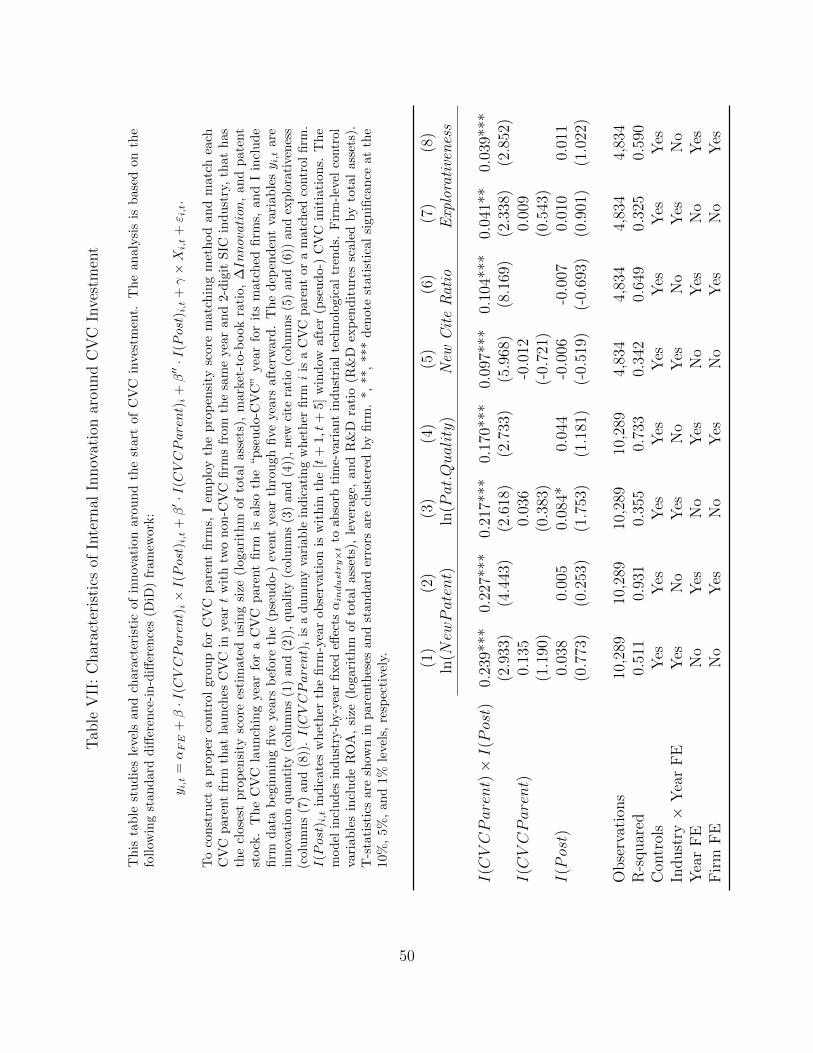
Tab
leV
II:
Char
acte
rist
ics
ofIn
tern
alIn
nov
atio
nar
ound
CV
CIn
vest
men
t
This
table
studie
sle
vel
sand
chara
cter
isti
cof
innov
ati
on
aro
und
the
start
of
CV
Cin
ves
tmen
t.T
he
analy
sis
isbase
don
the
foll
owin
gst
and
ard
diff
eren
ce-i
n-d
iffer
ence
s(D
iD)
fram
ework
:
y i,t
=αFE
+β·I
(CVCParent)
i×I(Post)
i,t
+β′·I
(CVCParent)
i+β′′·I
(Post)
i,t
+γ×X
i,t
+ε i
,t.
To
const
ruct
apro
per
contr
ol
gro
up
for
CV
Cpare
nt
firm
s,I
emplo
yth
epro
pen
sity
score
matc
hin
gm
ethod
and
matc
hea
chC
VC
pare
nt
firm
that
launch
esC
VC
inyea
rt
wit
htw
onon-C
VC
firm
sfr
om
the
sam
eyea
rand
2-d
igit
SIC
indust
ry,
that
has
the
close
stpro
pen
sity
score
esti
mate
dusi
ng
size
(logari
thm
of
tota
lass
ets)
,m
ark
et-t
o-b
ook
rati
o,
∆Innovation
,and
pate
nt
stock
.T
he
CV
Cla
unch
ing
yea
rfo
ra
CV
Cpare
nt
firm
isals
oth
e“pse
udo-C
VC
”yea
rfo
rit
sm
atc
hed
firm
s,and
Iin
clude
firm
data
beg
innin
gfive
yea
rsb
efore
the
(pse
udo-)
even
tyea
rth
rough
five
yea
rsaft
erw
ard
.T
he
dep
enden
tva
riable
sy i
,tare
innov
atio
nquan
tity
(col
um
ns
(1)
and
(2))
,qual
ity
(col
um
ns
(3)
and
(4))
,new
cite
rati
o(c
olum
ns
(5)
and
(6))
and
explo
rati
venes
s(c
olum
ns
(7)
and
(8))
.I(CVCParent)
iis
adum
my
vari
able
indic
atin
gw
het
her
firm
iis
aC
VC
par
ent
ora
mat
ched
contr
olfirm
.I(Post)
i,t
ind
icate
sw
het
her
the
firm
-yea
rob
serv
ati
on
isw
ith
inth
e[t
+1,t
+5]
win
dow
aft
er(p
seu
do-)
CV
Cin
itia
tion
s.T
he
model
incl
udes
indust
ry-b
y-y
ear
fixed
effec
tsαin
dustry×t
toab
sorb
tim
e-va
rian
tin
dust
rial
tech
nol
ogic
altr
ends.
Fir
m-l
evel
contr
olva
riable
sin
clude
RO
A,
size
(logari
thm
of
tota
lass
ets)
,le
ver
age,
and
R&
Dra
tio
(R&
Dex
pen
dit
ure
ssc
ale
dby
tota
lass
ets)
.T
-sta
tist
ics
are
show
nin
pare
nth
eses
an
dst
an
dard
erro
rsare
clu
ster
edby
firm
.*,
**,
***
den
ote
stati
stic
al
sign
ifica
nce
at
the
10%
,5%
,an
d1%
level
s,re
spec
tive
ly.
(1)
(2)
(3)
(4)
(5)
(6)
(7)
(8)
ln(NewPatent)
ln(Pat.Quality
)N
ewC
ite
Rat
ioE
xplo
rati
ven
ess
I(CVCParent)×I(Post)
0.23
9***
0.22
7***
0.21
7***
0.17
0***
0.09
7***
0.10
4***
0.04
1**
0.03
9***
(2.9
33)
(4.4
43)
(2.6
18)
(2.7
33)
(5.9
68)
(8.1
69)
(2.3
38)
(2.8
52)
I(CVCParent)
0.13
50.
036
-0.0
120.
009
(1.1
90)
(0.3
83)
(-0.
721)
(0.5
43)
I(Post)
0.03
80.
005
0.08
4*0.
044
-0.0
06-0
.007
0.01
00.
011
(0.7
73)
(0.2
53)
(1.7
53)
(1.1
81)
(-0.
519)
(-0.
693)
(0.9
01)
(1.0
22)
Obse
rvat
ions
10,2
8910
,289
10,2
8910
,289
4,83
44,
834
4,83
44,
834
R-s
quar
ed0.
511
0.93
10.
355
0.73
30.
342
0.64
90.
325
0.59
0C
ontr
ols
Yes
Yes
Yes
Yes
Yes
Yes
Yes
Yes
Indust
ry×
Yea
rF
EY
esN
oY
esN
oY
esN
oY
esN
oY
ear
FE
No
Yes
No
Yes
No
Yes
No
Yes
Fir
mF
EN
oY
esN
oY
esN
oY
esN
oY
es
50
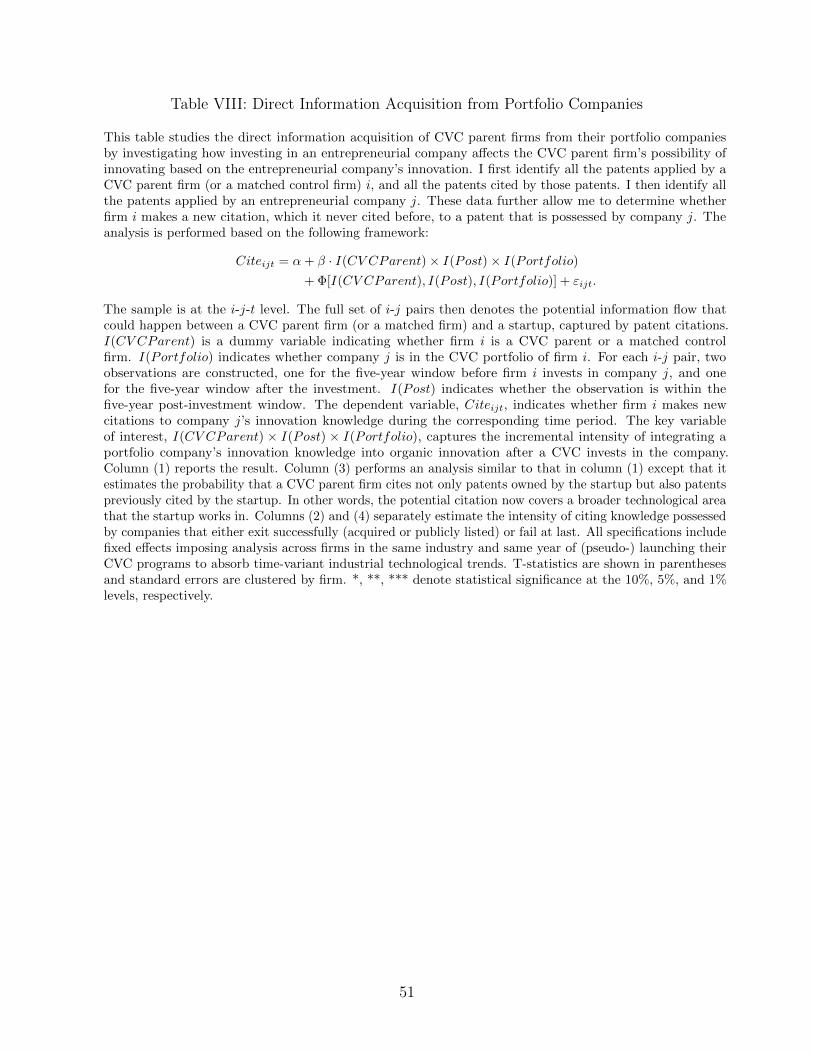
Table VIII: Direct Information Acquisition from Portfolio Companies
This table studies the direct information acquisition of CVC parent firms from their portfolio companiesby investigating how investing in an entrepreneurial company affects the CVC parent firm’s possibility ofinnovating based on the entrepreneurial company’s innovation. I first identify all the patents applied by aCVC parent firm (or a matched control firm) i, and all the patents cited by those patents. I then identify allthe patents applied by an entrepreneurial company j. These data further allow me to determine whetherfirm i makes a new citation, which it never cited before, to a patent that is possessed by company j. Theanalysis is performed based on the following framework:
Citeijt = α+ β · I(CV CParent)× I(Post)× I(Portfolio)
+ Φ[I(CV CParent), I(Post), I(Portfolio)] + εijt.
The sample is at the i-j-t level. The full set of i-j pairs then denotes the potential information flow thatcould happen between a CVC parent firm (or a matched firm) and a startup, captured by patent citations.I(CV CParent) is a dummy variable indicating whether firm i is a CVC parent or a matched controlfirm. I(Portfolio) indicates whether company j is in the CVC portfolio of firm i. For each i-j pair, twoobservations are constructed, one for the five-year window before firm i invests in company j, and onefor the five-year window after the investment. I(Post) indicates whether the observation is within thefive-year post-investment window. The dependent variable, Citeijt, indicates whether firm i makes newcitations to company j’s innovation knowledge during the corresponding time period. The key variableof interest, I(CV CParent) × I(Post) × I(Portfolio), captures the incremental intensity of integrating aportfolio company’s innovation knowledge into organic innovation after a CVC invests in the company.Column (1) reports the result. Column (3) performs an analysis similar to that in column (1) except that itestimates the probability that a CVC parent firm cites not only patents owned by the startup but also patentspreviously cited by the startup. In other words, the potential citation now covers a broader technological areathat the startup works in. Columns (2) and (4) separately estimate the intensity of citing knowledge possessedby companies that either exit successfully (acquired or publicly listed) or fail at last. All specifications includefixed effects imposing analysis across firms in the same industry and same year of (pseudo-) launching theirCVC programs to absorb time-variant industrial technological trends. T-statistics are shown in parenthesesand standard errors are clustered by firm. *, **, *** denote statistical significance at the 10%, 5%, and 1%levels, respectively.
51
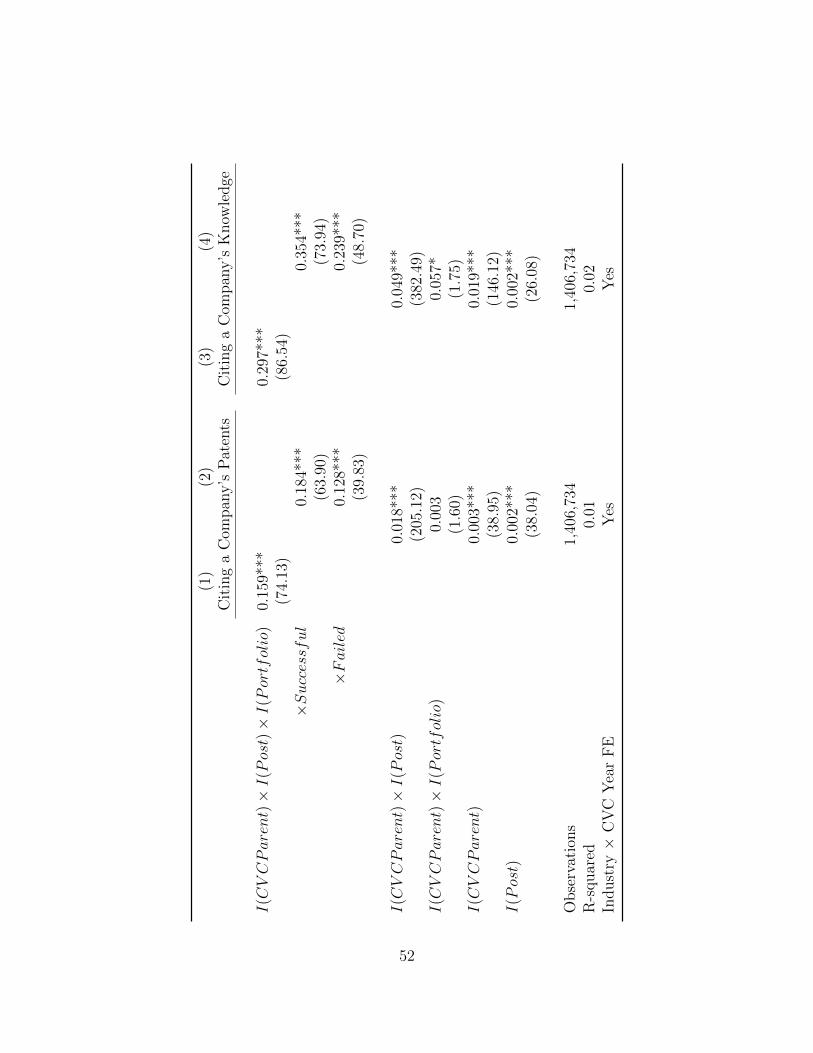
(1)
(2)
(3)
(4)
Cit
ing
aC
ompan
y’s
Pat
ents
Cit
ing
aC
ompan
y’s
Know
ledge
I(CVCParent)×I(Post)×I(Portfolio
)0.
159*
**0.
297*
**(7
4.13
)(8
6.54
)×Successful
0.18
4***
0.35
4***
(63.
90)
(73.
94)
×Failed
0.12
8***
0.23
9***
(39.
83)
(48.
70)
I(CVCParent)×I(Post)
0.01
8***
0.04
9***
(205
.12)
(382
.49)
I(CVCParent)×I(Portfolio
)0.
003
0.05
7*(1
.60)
(1.7
5)I(CVCParent)
0.00
3***
0.01
9***
(38.
95)
(146
.12)
I(Post)
0.00
2***
0.00
2***
(38.
04)
(26.
08)
Obse
rvat
ions
1,40
6,73
41,
406,
734
R-s
quar
ed0.
010.
02In
dust
ry×
CV
CY
ear
FE
Yes
Yes
52
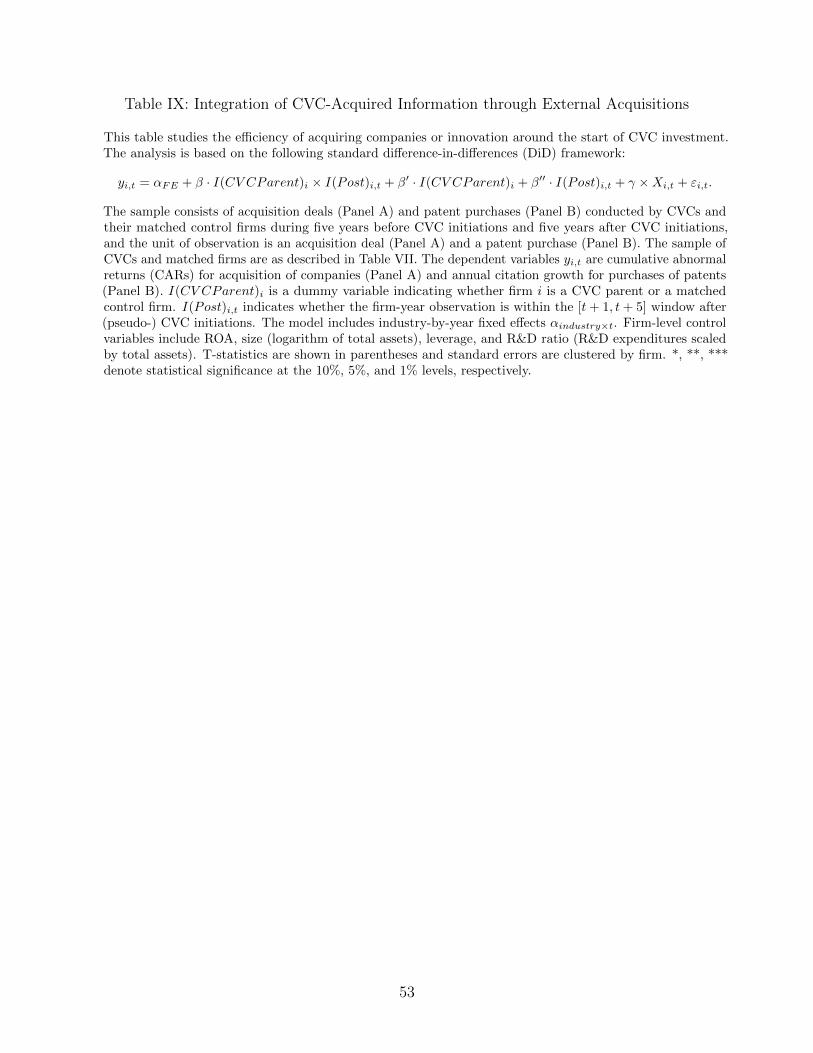
Table IX: Integration of CVC-Acquired Information through External Acquisitions
This table studies the efficiency of acquiring companies or innovation around the start of CVC investment.The analysis is based on the following standard difference-in-differences (DiD) framework:
yi,t = αFE + β · I(CV CParent)i × I(Post)i,t + β′ · I(CV CParent)i + β′′ · I(Post)i,t + γ ×Xi,t + εi,t.
The sample consists of acquisition deals (Panel A) and patent purchases (Panel B) conducted by CVCs andtheir matched control firms during five years before CVC initiations and five years after CVC initiations,and the unit of observation is an acquisition deal (Panel A) and a patent purchase (Panel B). The sample ofCVCs and matched firms are as described in Table VII. The dependent variables yi,t are cumulative abnormalreturns (CARs) for acquisition of companies (Panel A) and annual citation growth for purchases of patents(Panel B). I(CV CParent)i is a dummy variable indicating whether firm i is a CVC parent or a matchedcontrol firm. I(Post)i,t indicates whether the firm-year observation is within the [t+ 1, t+ 5] window after(pseudo-) CVC initiations. The model includes industry-by-year fixed effects αindustry×t. Firm-level controlvariables include ROA, size (logarithm of total assets), leverage, and R&D ratio (R&D expenditures scaledby total assets). T-statistics are shown in parentheses and standard errors are clustered by firm. *, **, ***denote statistical significance at the 10%, 5%, and 1% levels, respectively.
53
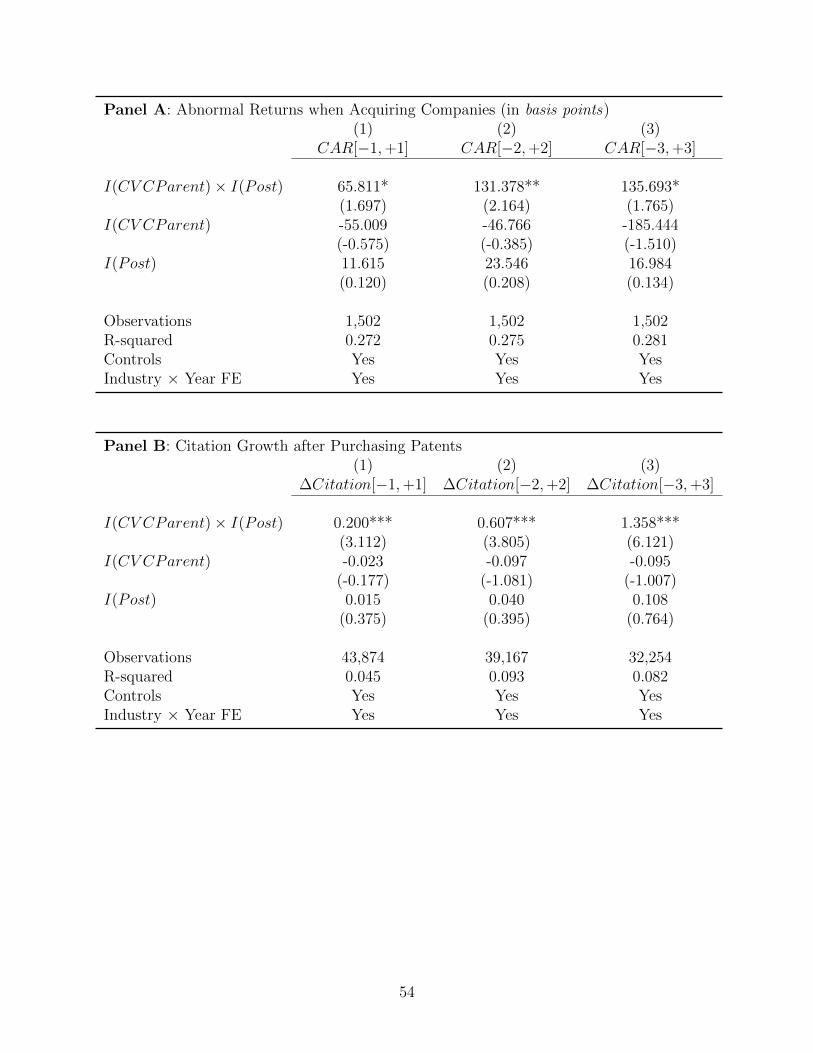
Panel A: Abnormal Returns when Acquiring Companies (in basis points)(1) (2) (3)
CAR[−1,+1] CAR[−2,+2] CAR[−3,+3]
I(CV CParent)× I(Post) 65.811* 131.378** 135.693*(1.697) (2.164) (1.765)
I(CV CParent) -55.009 -46.766 -185.444(-0.575) (-0.385) (-1.510)
I(Post) 11.615 23.546 16.984(0.120) (0.208) (0.134)
Observations 1,502 1,502 1,502R-squared 0.272 0.275 0.281Controls Yes Yes YesIndustry × Year FE Yes Yes Yes
Panel B: Citation Growth after Purchasing Patents(1) (2) (3)
∆Citation[−1,+1] ∆Citation[−2,+2] ∆Citation[−3,+3]
I(CV CParent)× I(Post) 0.200*** 0.607*** 1.358***(3.112) (3.805) (6.121)
I(CV CParent) -0.023 -0.097 -0.095(-0.177) (-1.081) (-1.007)
I(Post) 0.015 0.040 0.108(0.375) (0.395) (0.764)
Observations 43,874 39,167 32,254R-squared 0.045 0.093 0.082Controls Yes Yes YesIndustry × Year FE Yes Yes Yes
54
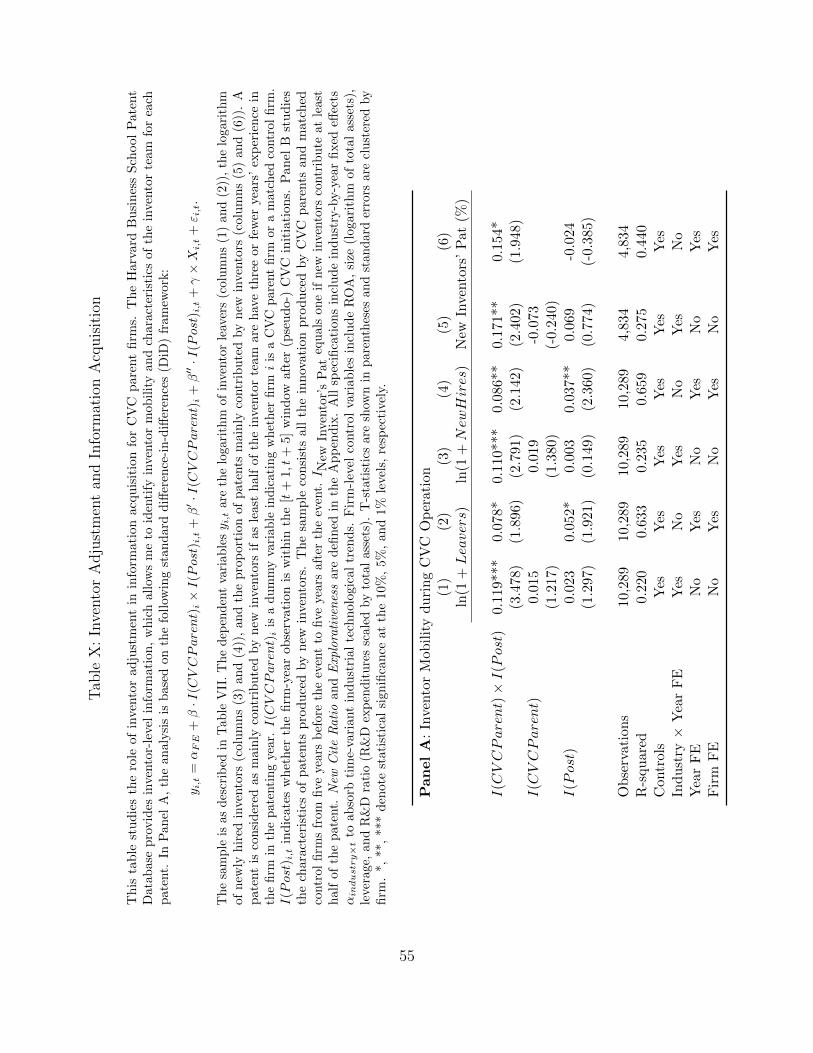
Tab
leX
:In
vento
rA
dju
stm
ent
and
Info
rmat
ion
Acq
uis
itio
n
This
table
studie
sth
ero
leof
inven
tor
adju
stm
ent
inin
form
ati
on
acq
uis
itio
nfo
rC
VC
pare
nt
firm
s.T
he
Harv
ard
Busi
nes
sSch
ool
Pate
nt
Dat
abas
ep
rovid
esin
vento
r-le
vel
info
rmat
ion
,w
hic
hal
low
sm
eto
iden
tify
inve
nto
rm
obil
ity
and
char
acte
rist
ics
ofth
ein
vento
rte
amfo
rea
chp
aten
t.In
Pan
elA
,th
ean
alysi
sis
bas
edon
the
foll
owin
gst
an
dard
diff
eren
ce-i
n-d
iffer
ence
s(D
iD)
fram
ework
:
y i,t
=αFE
+β·I
(CVCParent)
i×I(Post)
i,t
+β′·I
(CVCParent)
i+β′′·I
(Post)
i,t
+γ×X
i,t
+ε i
,t.
The
sam
ple
isas
des
crib
edin
Tab
leV
II.
The
dep
enden
tva
riab
lesy i
,tar
eth
elo
gari
thm
ofin
vento
rle
aver
s(c
olum
ns
(1)
and
(2))
,th
elo
gari
thm
ofnew
lyhir
edin
vento
rs(c
olum
ns
(3)
and
(4))
,an
dth
epro
por
tion
ofpat
ents
mai
nly
contr
ibute
dby
new
inve
nto
rs(c
olum
ns
(5)
and
(6))
.A
pate
nt
isco
nsi
der
edas
main
lyco
ntr
ibu
ted
by
new
inven
tors
ifas
least
half
of
the
inven
tor
team
are
hav
eth
ree
or
few
eryea
rs’
exp
erie
nce
inth
efirm
inth
epat
enti
ng
year
.I(CVCParent)
iis
adum
my
vari
able
indic
atin
gw
het
her
firm
iis
aC
VC
par
ent
firm
ora
mat
ched
contr
olfirm
.I(Post)
i,t
indic
ate
sw
het
her
the
firm
-yea
robse
rvati
on
isw
ithin
the
[t+
1,t
+5]
win
dow
aft
er(p
seudo-)
CV
Cin
itia
tions.
Panel
Bst
udie
sth
ech
ara
cter
isti
csof
pate
nts
pro
duce
dby
new
inven
tors
.T
he
sam
ple
consi
sts
all
the
innov
ati
on
pro
duce
dby
CV
Cpare
nts
and
matc
hed
contr
olfi
rms
from
five
year
sb
efor
eth
eev
ent
tofive
year
saf
ter
the
even
t.I N
ewIn
vento
r’s
Pat
equ
als
one
ifn
ewin
vento
rsco
ntr
ibu
teat
leas
thalf
of
the
pate
nt.
New
Cit
eR
ati
oand
Exp
lora
tive
nes
sare
defi
ned
inth
eA
pp
endix
.A
llsp
ecifi
cati
ons
incl
ude
indust
ry-b
y-y
ear
fixed
effec
tsαin
dustry×t
toab
sorb
tim
e-va
riant
ind
ust
rial
tech
nolo
gic
al
tren
ds.
Fir
m-l
evel
contr
ol
vari
ab
les
incl
ud
eR
OA
,si
ze(l
ogari
thm
of
tota
lass
ets)
,le
vera
ge,
and
R&
Dra
tio
(R&
Dex
pen
dit
ure
ssc
aled
by
tota
las
sets
).T
-sta
tist
ics
are
show
nin
par
enth
eses
and
stan
dar
der
rors
are
clust
ered
by
firm
.*,
**,
***
den
ote
stat
isti
cal
sign
ifica
nce
at
the
10%
,5%
,an
d1%
level
s,re
spec
tive
ly.
Pan
el
A:
Inven
tor
Mob
ilit
yd
uri
ng
CV
CO
per
atio
n(1
)(2
)(3
)(4
)(5
)(6
)ln
(1+Leavers)
ln(1
+NewHires
)N
ewIn
vento
rs’
Pat
(%)
I(CVCParent)×I(Post)
0.11
9***
0.07
8*0.
110*
**0.
086*
*0.
171**
0.1
54*
(3.4
78)
(1.8
96)
(2.7
91)
(2.1
42)
(2.4
02)
(1.9
48)
I(CVCParent)
0.01
50.
019
-0.0
73
(1.2
17)
(1.3
80)
(-0.2
40)
I(Post)
0.02
30.
052*
0.00
30.
037*
*0.
069
-0.0
24
(1.2
97)
(1.9
21)
(0.1
49)
(2.3
60)
(0.7
74)
(-0.3
85)
Ob
serv
atio
ns
10,2
8910
,289
10,2
8910
,289
4,834
4,8
34
R-s
qu
ared
0.22
00.
633
0.23
50.
659
0.275
0.4
40
Con
trol
sY
esY
esY
esY
esY
esY
esIn
du
stry×
Yea
rF
EY
esN
oY
esN
oY
esN
oY
ear
FE
No
Yes
No
Yes
No
Yes
Fir
mF
EN
oY
esN
oY
esN
oY
es
55
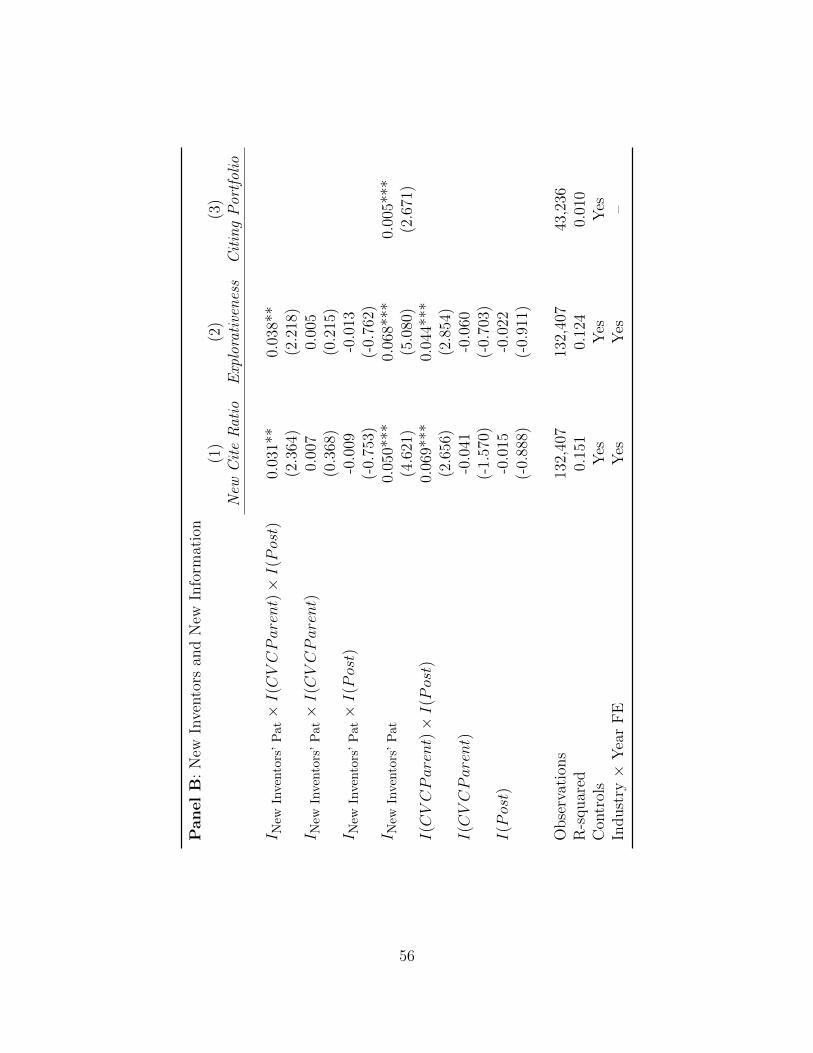
Panel
B:
New
Inve
nto
rsan
dN
ewIn
form
atio
n(1
)(2
)(3
)N
ewC
ite
Rat
ioE
xplo
rati
ven
ess
Cit
ing
Por
tfol
io
I New
Inve
nto
rs’
Pat×I(CVCParent)×I(Post)
0.03
1**
0.03
8**
(2.3
64)
(2.2
18)
I New
Inve
nto
rs’
Pat×I(CVCParent)
0.00
70.
005
(0.3
68)
(0.2
15)
I New
Inve
nto
rs’
Pat×I(Post)
-0.0
09-0
.013
(-0.
753)
(-0.
762)
I New
Inve
nto
rs’
Pat
0.05
0***
0.06
8***
0.00
5***
(4.6
21)
(5.0
80)
(2.6
71)
I(CVCParent)×I(Post)
0.06
9***
0.04
4***
(2.6
56)
(2.8
54)
I(CVCParent)
-0.0
41-0
.060
(-1.
570)
(-0.
703)
I(Post)
-0.0
15-0
.022
(-0.
888)
(-0.
911)
Obse
rvat
ions
132,
407
132,
407
43,2
36R
-squar
ed0.
151
0.12
40.
010
Con
trol
sY
esY
esY
esIn
dust
ry×
Yea
rF
EY
esY
es–
56
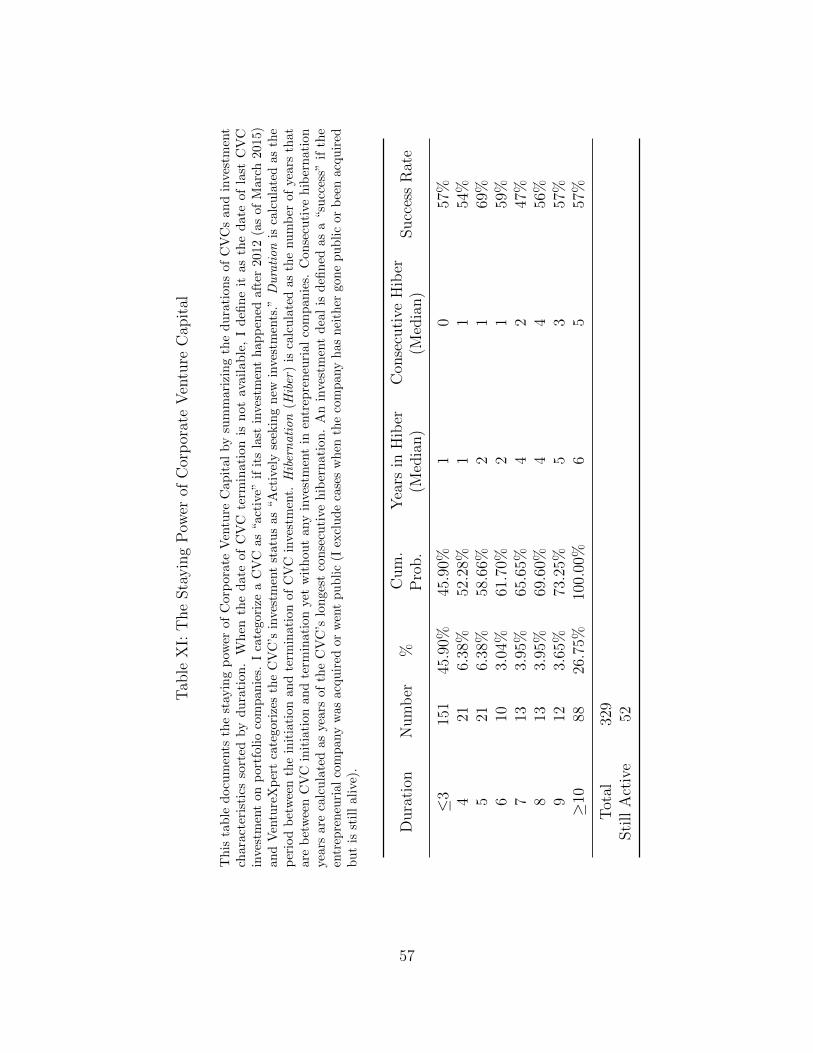
Tab
leX
I:T
he
Sta
yin
gP
ower
ofC
orp
orat
eV
entu
reC
apit
al
This
table
docu
men
tsth
est
ayin
gp
ower
of
Corp
ora
teV
entu
reC
apit
al
by
sum
mari
zing
the
dura
tions
of
CV
Cs
and
inves
tmen
tch
ara
cter
isti
csso
rted
by
dura
tion.
When
the
date
of
CV
Cte
rmin
ati
on
isnot
available
,I
defi
ne
itas
the
date
of
last
CV
Cin
vest
men
ton
por
tfol
ioco
mp
anie
s.I
cate
gori
zea
CV
Cas
“act
ive”
ifit
sla
stin
vest
men
th
app
ened
afte
r20
12(a
sof
Mar
ch20
15)
and
Ven
ture
Xp
ert
cate
gori
zes
the
CV
C’s
inve
stm
ent
stat
us
as“A
ctiv
ely
seek
ing
new
inve
stm
ents
.”D
ura
tion
isca
lcu
late
das
the
per
iod
bet
wee
nth
ein
itia
tion
and
term
inat
ion
ofC
VC
inve
stm
ent.
Hib
ern
ati
on
(Hib
er)
isca
lcula
ted
asth
enum
ber
ofye
ars
that
are
bet
wee
nC
VC
init
iati
onan
dte
rmin
atio
nye
tw
ithou
tan
yin
vest
men
tin
entr
epre
neu
rial
com
pan
ies.
Con
secu
tive
hib
ernat
ion
yea
rsare
calc
ula
ted
as
yea
rsof
the
CV
C’s
lon
ges
tco
nse
cuti
ve
hib
ern
ati
on
.A
nin
ves
tmen
td
eal
isd
efin
edas
a“su
cces
s”if
the
entr
epre
neu
rial
com
pan
yw
asac
quir
edor
wen
tpublic
(Iex
clude
case
sw
hen
the
com
pan
yhas
nei
ther
gone
public
orb
een
acquir
edb
ut
isst
ill
aliv
e).
Dura
tion
Num
ber
%C
um
.P
rob.
Yea
rsin
Hib
er(M
edia
n)
Con
secu
tive
Hib
er(M
edia
n)
Succ
ess
Rat
e
≤3
151
45.9
0%45
.90%
10
57%
421
6.38
%52
.28%
11
54%
521
6.38
%58
.66%
21
69%
610
3.04
%61
.70%
21
59%
713
3.95
%65
.65%
42
47%
813
3.95
%69
.60%
44
56%
912
3.65
%73
.25%
53
57%
≥10
8826
.75%
100.
00%
65
57%
Tot
al32
9Sti
llA
ctiv
e52
57
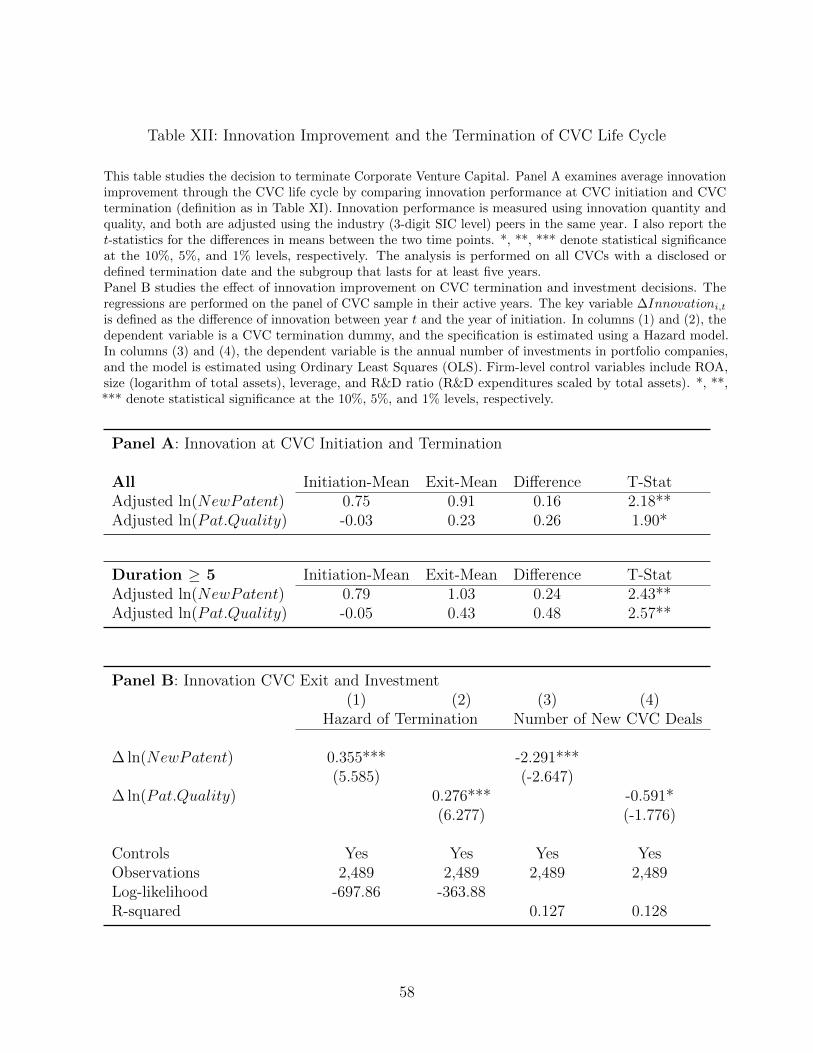
Table XII: Innovation Improvement and the Termination of CVC Life Cycle
This table studies the decision to terminate Corporate Venture Capital. Panel A examines average innovationimprovement through the CVC life cycle by comparing innovation performance at CVC initiation and CVCtermination (definition as in Table XI). Innovation performance is measured using innovation quantity andquality, and both are adjusted using the industry (3-digit SIC level) peers in the same year. I also report thet-statistics for the differences in means between the two time points. *, **, *** denote statistical significanceat the 10%, 5%, and 1% levels, respectively. The analysis is performed on all CVCs with a disclosed ordefined termination date and the subgroup that lasts for at least five years.Panel B studies the effect of innovation improvement on CVC termination and investment decisions. Theregressions are performed on the panel of CVC sample in their active years. The key variable ∆Innovationi,tis defined as the difference of innovation between year t and the year of initiation. In columns (1) and (2), thedependent variable is a CVC termination dummy, and the specification is estimated using a Hazard model.In columns (3) and (4), the dependent variable is the annual number of investments in portfolio companies,and the model is estimated using Ordinary Least Squares (OLS). Firm-level control variables include ROA,size (logarithm of total assets), leverage, and R&D ratio (R&D expenditures scaled by total assets). *, **,*** denote statistical significance at the 10%, 5%, and 1% levels, respectively.
Panel A: Innovation at CVC Initiation and Termination
All Initiation-Mean Exit-Mean Difference T-StatAdjusted ln(NewPatent) 0.75 0.91 0.16 2.18**Adjusted ln(Pat.Quality) -0.03 0.23 0.26 1.90*
Duration ≥ 5 Initiation-Mean Exit-Mean Difference T-StatAdjusted ln(NewPatent) 0.79 1.03 0.24 2.43**Adjusted ln(Pat.Quality) -0.05 0.43 0.48 2.57**
Panel B: Innovation CVC Exit and Investment(1) (2) (3) (4)
Hazard of Termination Number of New CVC Deals
∆ ln(NewPatent) 0.355*** -2.291***(5.585) (-2.647)
∆ ln(Pat.Quality) 0.276*** -0.591*(6.277) (-1.776)
Controls Yes Yes Yes YesObservations 2,489 2,489 2,489 2,489Log-likelihood -697.86 -363.88R-squared 0.127 0.128
58
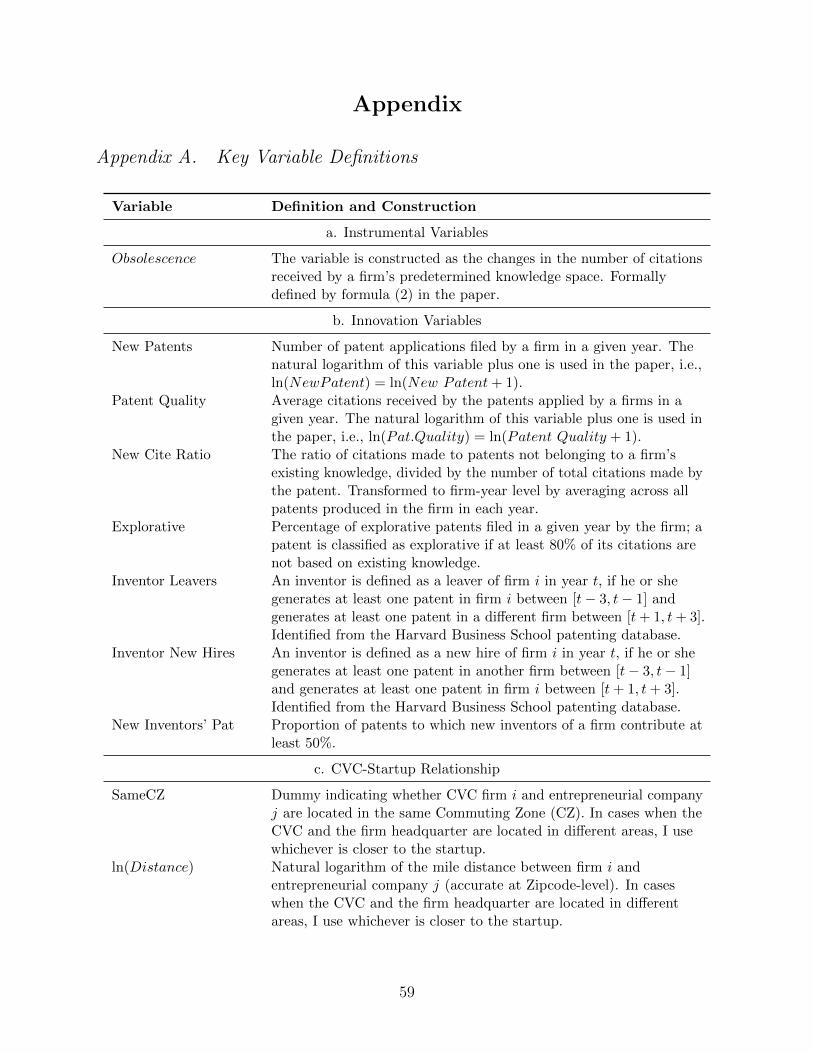
Appendix
Appendix A. Key Variable Definitions
Variable Definition and Construction
a. Instrumental Variables
Obsolescence The variable is constructed as the changes in the number of citationsreceived by a firm’s predetermined knowledge space. Formallydefined by formula (2) in the paper.
b. Innovation Variables
New Patents Number of patent applications filed by a firm in a given year. Thenatural logarithm of this variable plus one is used in the paper, i.e.,ln(NewPatent) = ln(New Patent+ 1).
Patent Quality Average citations received by the patents applied by a firms in agiven year. The natural logarithm of this variable plus one is used inthe paper, i.e., ln(Pat.Quality) = ln(Patent Quality + 1).
New Cite Ratio The ratio of citations made to patents not belonging to a firm’sexisting knowledge, divided by the number of total citations made bythe patent. Transformed to firm-year level by averaging across allpatents produced in the firm in each year.
Explorative Percentage of explorative patents filed in a given year by the firm; apatent is classified as explorative if at least 80% of its citations arenot based on existing knowledge.
Inventor Leavers An inventor is defined as a leaver of firm i in year t, if he or shegenerates at least one patent in firm i between [t− 3, t− 1] andgenerates at least one patent in a different firm between [t+ 1, t+ 3].Identified from the Harvard Business School patenting database.
Inventor New Hires An inventor is defined as a new hire of firm i in year t, if he or shegenerates at least one patent in another firm between [t− 3, t− 1]and generates at least one patent in firm i between [t+ 1, t+ 3].Identified from the Harvard Business School patenting database.
New Inventors’ Pat Proportion of patents to which new inventors of a firm contribute atleast 50%.
c. CVC-Startup Relationship
SameCZ Dummy indicating whether CVC firm i and entrepreneurial companyj are located in the same Commuting Zone (CZ). In cases when theCVC and the firm headquarter are located in different areas, I usewhichever is closer to the startup.
ln(Distance) Natural logarithm of the mile distance between firm i andentrepreneurial company j (accurate at Zipcode-level). In caseswhen the CVC and the firm headquarter are located in differentareas, I use whichever is closer to the startup.
59
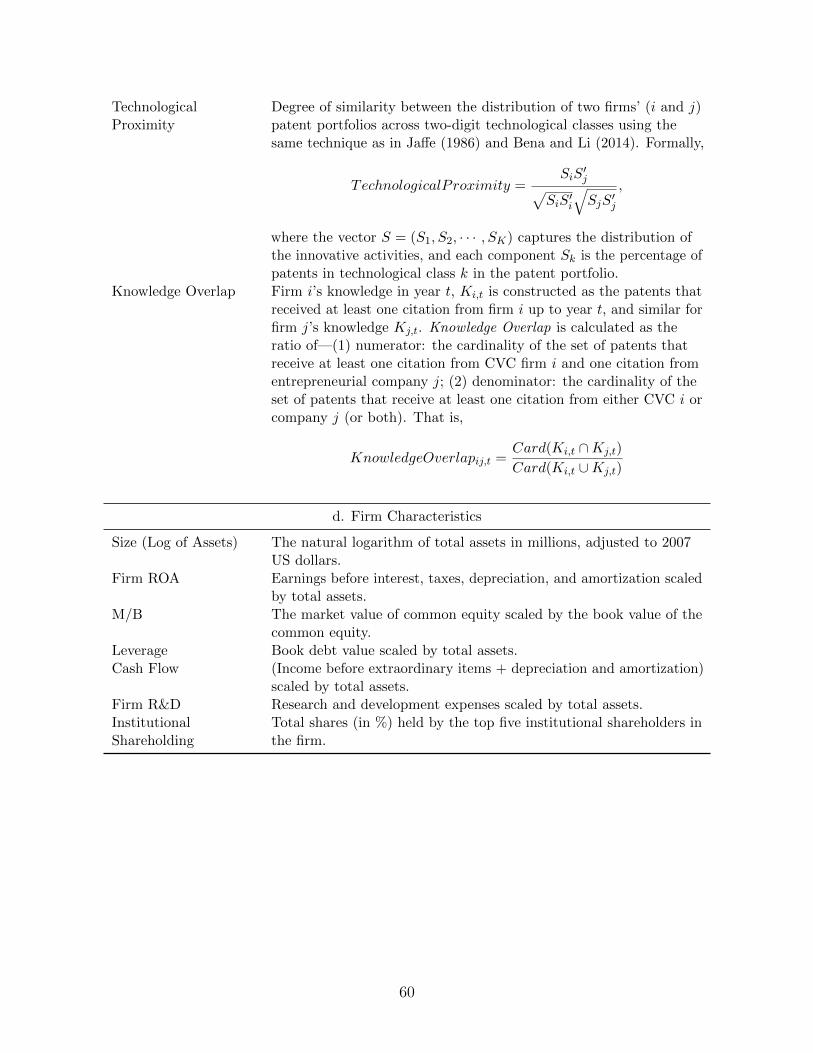
TechnologicalProximity
Degree of similarity between the distribution of two firms’ (i and j)patent portfolios across two-digit technological classes using thesame technique as in Jaffe (1986) and Bena and Li (2014). Formally,
TechnologicalProximity =SiS
′j√
SiS′i
√SjS′j
,
where the vector S = (S1, S2, · · · , SK) captures the distribution ofthe innovative activities, and each component Sk is the percentage ofpatents in technological class k in the patent portfolio.
Knowledge Overlap Firm i’s knowledge in year t, Ki,t is constructed as the patents thatreceived at least one citation from firm i up to year t, and similar forfirm j’s knowledge Kj,t. Knowledge Overlap is calculated as theratio of—(1) numerator: the cardinality of the set of patents thatreceive at least one citation from CVC firm i and one citation fromentrepreneurial company j; (2) denominator: the cardinality of theset of patents that receive at least one citation from either CVC i orcompany j (or both). That is,
KnowledgeOverlapij,t =Card(Ki,t ∩Kj,t)
Card(Ki,t ∪Kj,t)
d. Firm Characteristics
Size (Log of Assets) The natural logarithm of total assets in millions, adjusted to 2007US dollars.
Firm ROA Earnings before interest, taxes, depreciation, and amortization scaledby total assets.
M/B The market value of common equity scaled by the book value of thecommon equity.
Leverage Book debt value scaled by total assets.Cash Flow (Income before extraordinary items + depreciation and amortization)
scaled by total assets.Firm R&D Research and development expenses scaled by total assets.InstitutionalShareholding
Total shares (in %) held by the top five institutional shareholders inthe firm.
60