Embed Size (px)
Citation preview
SC I ENCE ADVANCES | R E S EARCH ART I C L E
CONSERVAT ION B IOLOGY
1University of Maryland, College Park, MD 20740, USA. 2Laestadius Consulting LLC,Silver Spring, MD 20901, USA. 3Greenpeace Russia, Moscow, Russia. 4GreenpeaceGermany, Hamburg, Germany. 5Global Forest Watch Canada, Ottawa, Ontario,Canada. 6World Resources Institute, Washington, DC 20002, USA. 7NGO Transpar-ent World, Moscow, Russia.*Corresponding author. Email: [email protected]
Potapov et al. Sci. Adv. 2017;3 : e1600821 13 January 2017
2017 © The Authors,
some rights reserved;
exclusive licensee
American Association
for the Advancement
of Science. Distributed
under a Creative
Commons Attribution
License 4.0 (CC BY).
http://aD
ownloaded from
The last frontiers of wilderness: Tracking loss of intactforest landscapes from 2000 to 2013Peter Potapov,1* Matthew C. Hansen,1 Lars Laestadius,2 Svetlana Turubanova,1
Alexey Yaroshenko,3 Christoph Thies,4 Wynet Smith,5 Ilona Zhuravleva,3 Anna Komarova,3
Susan Minnemeyer,6 Elena Esipova7
An intact forest landscape (IFL) is a seamless mosaic of forest and naturally treeless ecosystems with no remote-ly detected signs of human activity and a minimum area of 500 km2. IFLs are critical for stabilizing terrestrialcarbon storage, harboring biodiversity, regulating hydrological regimes, and providing other ecosystemfunctions. Although the remaining IFLs comprise only 20% of tropical forest area, they account for 40% ofthe total aboveground tropical forest carbon. We show that global IFL extent has been reduced by 7.2% sincethe year 2000. An increasing rate of global IFL area reduction was found, largely driven by the tripling of IFLtropical forest loss in 2011–2013 compared to that in 2001–2003. Industrial logging, agricultural expansion, fire,and mining/resource extraction were the primary causes of IFL area reduction. Protected areas (InternationalUnion for Conservation of Nature categories I to III) were found to have a positive effect in slowing the reduc-tion of IFL area from timber harvesting but were less effective in limiting agricultural expansion. The certifica-tion of logging concessions under responsible management had a negligible impact on slowing IFLfragmentation in the Congo Basin. Fragmentation of IFLs by logging and establishment of roads and otherinfrastructure initiates a cascade of changes that lead to landscape transformation and loss of conservationvalues. Given that only 12% of the global IFL area is protected, our results illustrate the need for planningand investment in carbon sequestration and biodiversity conservation efforts that target the most valuableremaining forests, as identified using the IFL approach.
dva
on August 6, 2018nces.sciencem
ag.org/
INTRODUCTIONHuman modification of terrestrial ecosystems has a range of impacts,from a complete transformation at a local scale to distant effects suchas the impact of global climate change on ecosystem functions and dy-namics (1, 2).No ecosystemsmaybe considered truly intact because somedegree of human impact is present everywhere (3). Alteration and frag-mentation of forest landscapes compromise their ecosystem functions, in-cluding loss of biological diversity and reduction of carbon storage (4, 5).
Forest wildlands, those forests least affected by human activity,have the highest conservation value in terms of the range of ecosystemservices they provide (6–10). These areas are often irreplaceable inharboring biological diversity, stabilizing terrestrial carbon storage,regulating hydrological regimes, and providing other ecosystemfunctions (11). Their ability to perform ecosystem functions and theirresilience to natural disturbance and climate change are functions oftheir size. Many “umbrella” mammal and bird species, whose conser-vation also may enhance the protection of co-occurring species, re-quire large natural habitats to survive (12). Large forest wildlandsare the greatest terrestrial carbon stores, a function at risk from forestconversion (deforestation) and degradation (10). Small forest areas,even if pristine, have less potential for preserving wide-range speciespopulations and have lower resilience to natural disturbance andeffects of climate change (4). Hence, the size of the wildland matters:the larger the size, the higher the conservation value of the territory.
Preservation of forest wildlands requires a robust mapping andmonitoring system that can be implemented at national to global
scales. A number of global ecosystem wilderness and intactness mapshave been created over the past 30 years (3, 13, 14). Most have reliedon outdated, coarse spatial resolution and static input data, which mayimpede the accurate delineation of wilderness loss over time (15).
Delineating forest wildlands includes two components: assessingdirect forest structural alteration (including forest conversion, tim-ber extraction, and indirect effects, such as human-ignited fires) andthe resulting fragmentation of the remaining forest landscapes dueto such changes. Satellite data provide the most feasible solution forrecurrent global mapping and monitoring of human-caused forestalteration and fragmentation (16).
We define an intact forest landscape (IFL) as a seamless mosaic offorests and associatednatural treeless ecosystems that exhibit no remote-ly detected signs of human activity or habitat fragmentation and arelarge enough to maintain all native biological diversity, including viablepopulations of wide-ranging species (15). The global IFL mapping isbased on a set of clear and straightforward criteria, designed to enablesatellite-based mapping (see Materials and Methods). The term “intactforest landscape” is not congruent with the term “primary forest” asdefined by the Food and Agriculture Organization of the UnitedNations (FAO) (17), and the twomust not be confused. Primary forestsare part of IFLs, which also include nonforest intact ecosystems whereclimatic, soil, or hydrological conditions prevent tree growth, tempo-rally treeless areas after the natural disturbance (for example, wildfires),and water bodies. IFLs may also include areas affected by low-intensityand historic human influence, such as hunting, scattered small-scaleshifting cultivation, and preindustrial selective logging. IFLs includelarge fragments of primary forests with a minimum extent of 500 km2,while smaller fragments of primary forests may be found outside IFLs.Here, we use the archive of Landsat satellite imagery to map the globalextent of IFLs in the years 2000 and 2013, to locate changes due toalteration and fragmentation, and to identify causes of change.
1 of 13

SC I ENCE ADVANCES | R E S EARCH ART I C L E
http://advances.sciencema
Dow
nloaded from
RESULTSWe assessed the distribution and dynamics of IFLs within the ex-tent of present-day forest ecosystems. We defined “forest” as landswith a tree canopy cover greater than 20% in the year 2000, using aglobal tree canopy cover data set (18) as a reference. The present-day extent of forest landscapes (mosaics of forests, naturally treelessecosystems, and deforested areas) is referred to as the “forest zone.”The forest zone extends over 58 million km2, or 44% of Earth’s ice-free land area. The extent of IFLs in the year 2000 totaled 12.8 mil-lion km2, or 22% of the forest zone area.
The IFLs form distinctive regional groupings (Fig. 1 and Table 1),each with a unique history of alteration and fragmentation. In the hu-mid tropics, IFLs are found in the Amazon and Congo River basins,the islands of Borneo and New Guinea, and the Southeast Asian high-lands. Tropical regions comprise 48% of the total global IFL area. Indry tropical and subtropical regions, IFLs are scarce or absent due toextensive conversions to agriculture, some of which happened manycenturies ago. Within the temperate and southern boreal forests ofNorth America and Eurasia, IFLs remain only in small areas sparedfrom commercial logging and agriculture. IFLs are abundant in north-ern boreal forests, interrupted mainly by mining, extraction of fossilfuels, and human-ignited wildfires associated with roads. Northernboreal IFLs comprise 36% of the total global IFL area.
IFLs were found within 65 countries in the year 2000 (Table 2).Three countries (Russia, Brazil, and Canada) account for nearlytwo-thirds of the global IFL area. These countries are followed bythe Democratic Republic of the Congo, Peru, the United States (pri-marily Alaska), Indonesia, Colombia, and Venezuela, each con-tributing more than 2% to the global IFL area. French Guiana hasthe highest proportion of intactness of all countries, with IFLs makingup 79% of the forest zone. This country is followed by Suriname,Guyana, Peru, Canada, Gabon, and the Republic of the Congo, each
Potapov et al. Sci. Adv. 2017;3 : e1600821 13 January 2017
retaining more than 40% of their respective forest zone as IFLs in theyear 2000.
Globally, 30% of the world forest area (land with tree canopy coverof 20% or greater) was within IFLs in the year 2000. Most of the IFLarea (82.3%) is covered with forest. The rest is covered with intacttreeless ecosystems (montane grasslands, treeless wetlands, andburned areas as a consequence of wildfires) and a small fraction ofnonvegetated areas (water, rocks, and ice).
From 2000 to 2013, the global IFL area decreased by 7.2%, a reduc-tion of 919,000 km2 (Table 1). Tropical regions are responsible for 60%of the total reduction of IFL area. In particular, tropical South Americalost 322,000 km2 of IFL area, whereas Africa lost 101,000 km2. Tempe-rate and southern boreal regions contributed 21% to the global IFL arealoss. Northern Eurasia alone lost 112,000 km2 of its IFL area. The re-maining 19% of IFL area reduction occurred within the northern borealforests of Eurasia and North America. Compared to the year 2000 IFLextent, the proportion of the IFL area reductionwas lowest in the north-ern boreal regions and in the temperate forests of South America andhighest in Australia, Southeast Asia, Africa, and the temperate regionsof North America and Eurasia (Fig. 2).
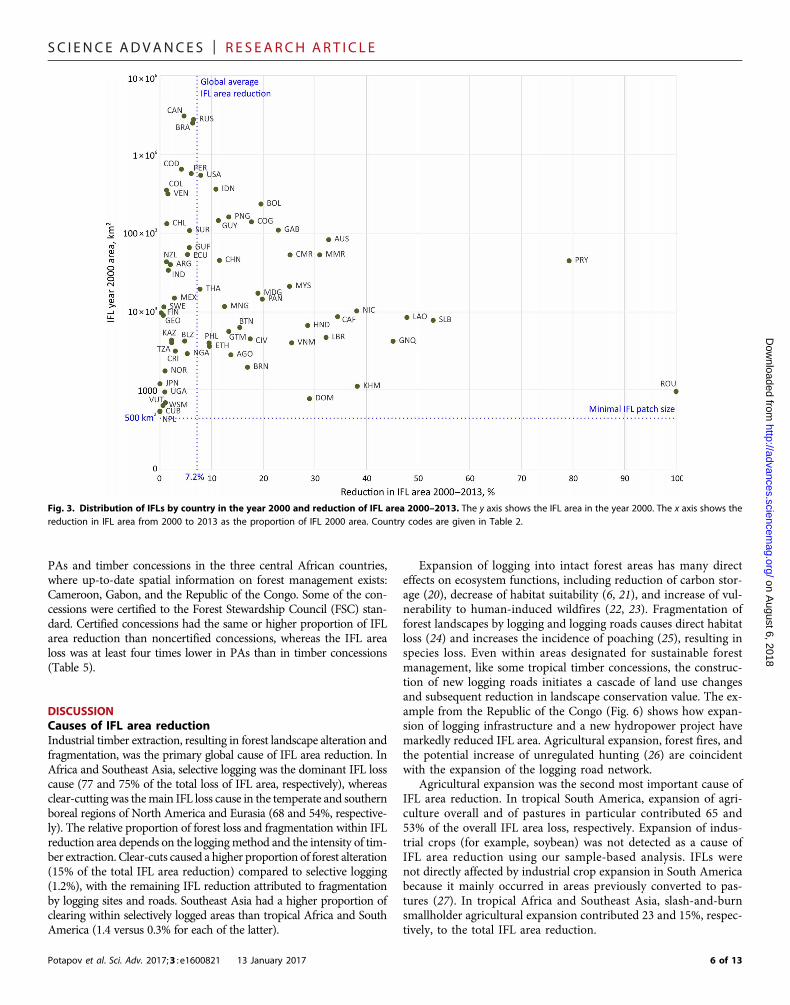
Three countries comprise 52% of the total reduction of IFL area:Russia (179,000 km2 of IFL area lost), Brazil (157,000 km2), and Canada(142,000 km2). Proportional to the year 2000 IFL area, the highest per-centages of IFL area reduction were found in Romania, which lost allIFLs, and Paraguay, where 79% of IFL area was lost; Laos, EquatorialGuinea, Cambodia, and Nicaragua each lost more than 35% of their IFLarea (Fig. 3 and Table 2). Assuming that the loss of IFLs continues atthe average rate between 2000 and 2013, Paraguay, Laos, Cambodia,and Equatorial Guinea will lose their entire IFL area during the next20 years. Another 15 countries will lose all IFLs within a 60-year period,including such IFL-rich nations as the Republic of the Congo, Gabon,Cameroon, Bolivia, and Myanmar.
on August 6, 2018
g.org/
Fig. 1. The world’s IFLs. IFL extent for the year 2013, IFL area reduction from 2000 to 2013, and boundaries of geographic regions used for the analysis.
2 of 13

SC I ENCE ADVANCES | R E S EARCH ART I C L E
on August 6, 2018
http://advances.sciencemag.org/
Dow
nloaded from
We used stratified sampling to identify the primary causes of theIFL area reduction. At the global level, the leading fragmentationand alteration agents were timber harvesting (37.0% of global IFLarea reduction), agricultural expansion (27.7%), and wildfire spread
Potapov et al. Sci. Adv. 2017;3 : e1600821 13 January 2017
from infrastructure and logging sites (21.2%). Other causes includ-ed fragmentation by roads for mining and oil/gas extraction, pipe-lines, and power lines (12.1%) and expansion of the transportationroad network (2.0%). At the regional level, we observed a diversityof leading IFL area reduction causes (Fig. 4 and Table 3), whereasfor each particular region, a single cause accounted for more than50% of the regional IFL area reduction.
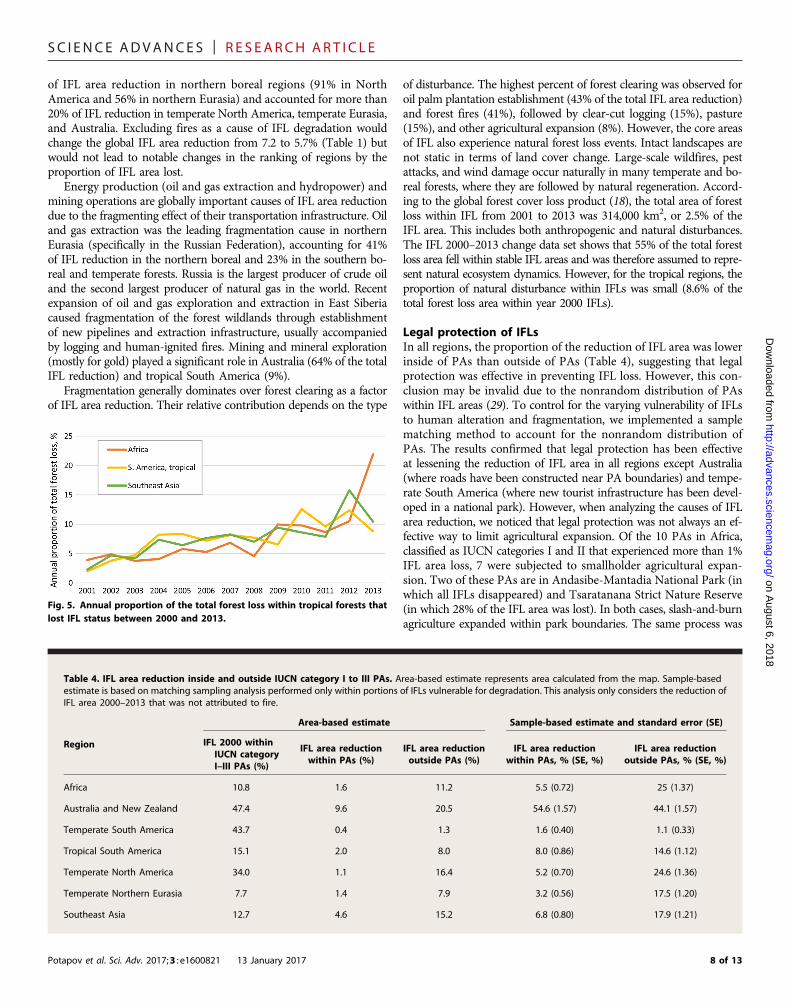
Using sample-based analysis and the annual forest loss data set(18), we found that 14% of the total IFL area reduction was due todirect alteration caused by logging, clearing, and fires. The remaining86% was due to fragmentation by such disturbances and constructionof infrastructure. The annual forest loss within IFLs may be used as aproxy to understand the temporal dynamics of IFL area reduction. Intropical regions, the annual forest loss within IFLs increased duringthe past 13 years (Fig. 5). The average annual forest loss within IFLreduction area for the 2011–2013 period was triple the average for the2001–2003 period for each of the three tropical regions, with the high-est increase observed in central Africa.
Of the total IFL area in the year 2000, 12.4% fell within protectedareas (PAs), with a management regime consistent with the Interna-tional Union for Conservation of Nature (IUCN) categories I to III(19). Australia and temperate South America have the largest propor-tion of IFLs under legal protection (47.4 and 43.7%, respectively),whereas temperate and southern boreal northern Eurasia (7.7%)and northern boreal regions (7.7% in North America and 5.2% in Eur-asia) have the lowest. Forty of the 65 countries, in which IFLs werepresent in the year 2000, had at least 10% of the IFL area under legalprotection. Uganda, the Dominican Republic, Thailand, and Cuba hadprotected more than 90% of their IFL area. Some countries do not in-clude any IFLs within category I to III PAs, including many Southeast
Table 1. IFL extent and area reduction per geographic region.
Geographicregion
Forestzone area(km2 × 106)
IFL 2000 area(km2 × 106)
IFL proportionof the forest
zone in2000 (%)
*Forestproportionwithin IFL2000 (%)
IFL proportionof global IFL
area in2000 (%)
IFL2013 area(km2 × 106)
IFL areareduction
2000–2013 (%)
IFL areareduction2000–2013,
not attributedto fire (%)
Africa
9.08 1.00 11.0 99.8 7.8 0.90 10.1 10.1Australia
1.01 0.13 12.4 55.6 1.0 0.10 21.9 15.3South America, temperate
0.41 0.16 38.2 43.4 1.2 0.15 1.3 0.9South America, tropical
14.70 4.43 30.1 98.9 34.6 4.11 7.3 7.1North America, temperateand southern boreal
5.85 0.54 9.2 66.5 4.2 0.46 15.5 11.2North America,northern boreal
3.89 3.04 78.2 63.8 23.7 2.94 3.3 0.3Northern Eurasia,temperate andsouthern boreal
11.96
1.23 10.3 69.8 9.6 1.12 9.1 7.4Northern Eurasia,northern boreal
3.33 1.57 47.0 75.7 12.2 1.50 4.4 1.8Southeast Asia
7.38 0.72 9.8 93.7 5.6 0.62 13.9 13.9World total
57.60 12.81 22.2 82.3 100.0 11.89 7.2 5.7*Forest is defined here as land with tree canopy cover above 25%, as depicted by the global tree cover product (18).
Fig. 2. Distribution of IFL area in the year 2000 and reduction of IFL area2000–2013 by geographic region. The y axis shows the initial IFL proportionof the forest zone in the year 2000. The x axis shows the reduction in IFL areafrom 2000 to 2013 as the proportion of IFL 2000 area. The area of each bubbleindicates the IFL area in km2 × 106. Values within each bubble represent the re-gional IFL area in the year 2000 as a percent of the global total.
3 of 13

SC I ENCE ADVANCES | R E S EARCH ART I C L E
Table 2. IFL extent and area reduction per country.
Pot
Country name
apov et al. Sci. Adv. 2017;3 : e1
Country code(for Fig. 3)
600821 13 Januar
IFL 2000area (km2 × 103)
y 2017
IFL proportionof the forest
zone in2000 (%)
IFL proportionof global IFL
area in2000 (%)
IFL areareduction
2000–2013 (%)
IFL areareduction2000–2013,
not attributedto fire (%)
Angola
AGO 2.9 0.3 0.02 13.7 13.7Argentina
ARG 39.9 6.5 0.3 2.0 1.8Australia
AUS 82.2 9.8 0.6 32.7 22.8Belize
BLZ 4.3 19.7 0.03 4.8 4.8Bhutan
BTN 6.4 19.3 0.05 15.5 15.5Bolivia
BOL 233.3 28.9 1.8 19.6 18.3Brazil
BRA 2476.1 31.7 19.3 6.3 6.2Do
Brunei BRN 2.0 35.1 0.02 17.0 17.0w
nlo Cambodia KHM 1.1 0.9 0.01 38.2 38.2a
ded Cameroon CMR 52.8 13.4 0.4 25.2 25.2 from Canada CAN 3040.3 51.0 23.7 4.7 2.3htt
Central African Republic
CAF 8.7 1.5 0.1 34.4 34.4p
://a Chile CHL 131.4 36.9 1.0 1.3 0.9d
van China CHN 45.0 1.6 0.4 11.5 11.2c
es. Colombia COL 349.2 31.0 2.7 1.3 1.3s
cien Costa Rica CRI 3.2 6.2 0.02 3.0 3.0c
em Côte d’Ivoire CIV 4.6 1.7 0.04 17.5 17.5a
g.o Cuba CUB 0.5 0.5 0.004 0 0r
ong/
Democratic Republicof the Congo COD 643.9 27.7 5.0 4.2 4.2A
ugu Dominican Republic DOM 0.8 1.7 0.01 29.0 1.6s
t 6 Ecuador ECU 53.3 22.3 0.4 5.3 5.3,
201 Equatorial Guinea GNQ 4.2 15.8 0.03 45.2 45.28
Ethiopia
ETH 3.7 1.4 0.03 9.6 9.6Finland
FIN 9.7 3.1 0.1 0.2 0.2French Guiana
GUF 65.4 79.1 0.5 5.7 5.7Gabon
GAB 108.8 41.2 0.8 22.9 22.9Georgia
GEO 9.0 18.3 0.1 0.7 0.7Guatemala
GTM 5.7 5.2 0.04 13.3 13.3Guyana
GUY 144.1 69.6 1.1 11.3 11.3Honduras
HND 6.7 6.0 0.1 28.6 28.6India
IND 33.7 5.6 0.3 1.6 1.6Indonesia
IDN 359.2 20.1 2.8 10.8 10.8Japan
JPN 1.2 0.4 0.01 0.01 0.01continued on next page
4 of 13

SC I ENCE ADVANCES | R E S EARCH ART I C L E
on August 6, 2018
http://advances.sciencemag.org/
Dow
nloaded from
Asian countries (LaoPeople’sDemocraticRepublic,Vietnam,Cambodia,and Philippines), Papua New Guinea, Ethiopia, Angola, and Nicaragua.
Using matching sampling analysis, we found that the reductionof IFL area for reasons other than fire was 3.4 times higher outsidePAs (6.2%) than within PAs (1.8%). We found a large difference inmost regions between protected and unprotected areas in terms of
Potapov et al. Sci. Adv. 2017;3 : e1600821 13 January 2017
IFL area reduction (Table 4). In Africa, North America, and Eurasia,the reduction of IFL area was more than 4 times higher outside PAsthan inside PAs, whereas it was 2.6 times higher in Southeast Asia andalmost double in tropical South America.
To study the effect of legal protection and voluntary forest man-agement certification on IFL area reduction by logging, we analyzed
Country name
Country code(for Fig. 3)IFL 2000area (km2 × 103)
IFL proportionof the forest
zone in2000 (%)
IFL proportionof global IFL
area in2000 (%)
IFL areareduction
2000–2013 (%)
IFL areareduction2000–2013,
not attributedto fire (%)
Kazakhstan
KAZ 4.4 16.6 0.03 2.3 2.3Laos
LAO 8.5 3.8 0.1 47.9 47.9Liberia
LBR 4.7 5.0 0.04 32.2 32.2Madagascar
MDG 17.2 7.2 0.1 19.0 18.5Malaysia
MYS 21.1 6.5 0.2 25.1 25.1Mexico
MEX 15.0 1.8 0.1 2.8 2.6Mongolia
MNG 11.7 12.6 0.1 12.5 0.4Myanmar
MMR 52.9 10.1 0.4 30.9 30.9Nepal
NPL 0.6 0.6 0.004 0 0New Zealand
NZL 43.1 25.4 0.3 1.3 1.2Nicaragua
NIC 10.3 8.0 0.1 38.1 38.1Nigeria
NGA 3.0 1.3 0.02 5.3 5.3Norway
NOR 1.8 1.4 0.01 1.0 1.0Panama
PAN 14.5 19.6 0.1 19.8 19.8Papua New Guinea
PNG 159.8 35.1 1.2 13.3 13.3Paraguay
PRY 44.5 11.1 0.3 79.3 79.3Peru
PER 567.2 68.5 4.4 6.1 6.1Philippines
PHL 4.0 1.6 0.03 9.5 9.5Republic of the Congo
COG 138.7 40.7 1.1 17.7 17.7Romania
ROU 1.0 0.6 0.01 100.0 100.0Russia
RUS 2744.3 28.3 21.4 6.5 4.3Samoa
WSM 0.7 23.8 0.01 0.6 0.6Solomon Islands
SLB 7.8 32.3 0.1 52.9 52.9Suriname
SUR 107.4 73.8 0.8 5.7 5.7Sweden
SWE 11.6 3.0 0.1 0.8 0.8Tanzania
TZA 4.1 0.8 0.03 2.3 2.3Thailand
THA 19.4 7.0 0.2 7.8 7.8Uganda
UGA 1.0 0.7 0.01 0.9 0.9United States
USA 539.3 14.2 4.2 7.9 0.2Vanuatu
VUT 0.7 7.5 0.01 1.1 1.1Venezuela
VEN 312.8 35.7 2.4 1.5 1.5Vietnam
VNM 4.1 1.7 0.03 25.5 25.55 of 13
SC I ENCE ADVANCES | R E S EARCH ART I C L E
on August 6, 2018
http://advances.sciencemag.org/
Dow
nloaded from
PAs and timber concessions in the three central African countries,where up-to-date spatial information on forest management exists:Cameroon, Gabon, and the Republic of the Congo. Some of the con-cessions were certified to the Forest Stewardship Council (FSC) stan-dard. Certified concessions had the same or higher proportion of IFLarea reduction than noncertified concessions, whereas the IFL arealoss was at least four times lower in PAs than in timber concessions(Table 5).
DISCUSSIONCauses of IFL area reductionIndustrial timber extraction, resulting in forest landscape alteration andfragmentation, was the primary global cause of IFL area reduction. InAfrica and Southeast Asia, selective logging was the dominant IFL losscause (77 and 75% of the total loss of IFL area, respectively), whereasclear-cutting was themain IFL loss cause in the temperate and southernboreal regions of North America and Eurasia (68 and 54%, respective-ly). The relative proportion of forest loss and fragmentation within IFLreduction area depends on the loggingmethod and the intensity of tim-ber extraction. Clear-cuts caused a higher proportion of forest alteration(15% of the total IFL area reduction) compared to selective logging(1.2%), with the remaining IFL reduction attributed to fragmentationby logging sites and roads. Southeast Asia had a higher proportion ofclearing within selectively logged areas than tropical Africa and SouthAmerica (1.4 versus 0.3% for each of the latter).
Potapov et al. Sci. Adv. 2017;3 : e1600821 13 January 2017
Expansion of logging into intact forest areas has many directeffects on ecosystem functions, including reduction of carbon stor-age (20), decrease of habitat suitability (6, 21), and increase of vul-nerability to human-induced wildfires (22, 23). Fragmentation offorest landscapes by logging and logging roads causes direct habitatloss (24) and increases the incidence of poaching (25), resulting inspecies loss. Even within areas designated for sustainable forestmanagement, like some tropical timber concessions, the construc-tion of new logging roads initiates a cascade of land use changesand subsequent reduction in landscape conservation value. The ex-ample from the Republic of the Congo (Fig. 6) shows how expan-sion of logging infrastructure and a new hydropower project havemarkedly reduced IFL area. Agricultural expansion, forest fires, andthe potential increase of unregulated hunting (26) are coincidentwith the expansion of the logging road network.
Agricultural expansion was the second most important cause ofIFL area reduction. In tropical South America, expansion of agri-culture overall and of pastures in particular contributed 65 and53% of the overall IFL area loss, respectively. Expansion of indus-trial crops (for example, soybean) was not detected as a cause ofIFL area reduction using our sample-based analysis. IFLs werenot directly affected by industrial crop expansion in South Americabecause it mainly occurred in areas previously converted to pas-tures (27). In tropical Africa and Southeast Asia, slash-and-burnsmallholder agricultural expansion contributed 23 and 15%, respec-tively, to the total IFL area reduction.
Fig. 3. Distribution of IFLs by country in the year 2000 and reduction of IFL area 2000–2013. The y axis shows the IFL area in the year 2000. The x axis shows thereduction in IFL area from 2000 to 2013 as the proportion of IFL 2000 area. Country codes are given in Table 2.
6 of 13

SC I ENCE ADVANCES | R E S EARCH ART I C L E
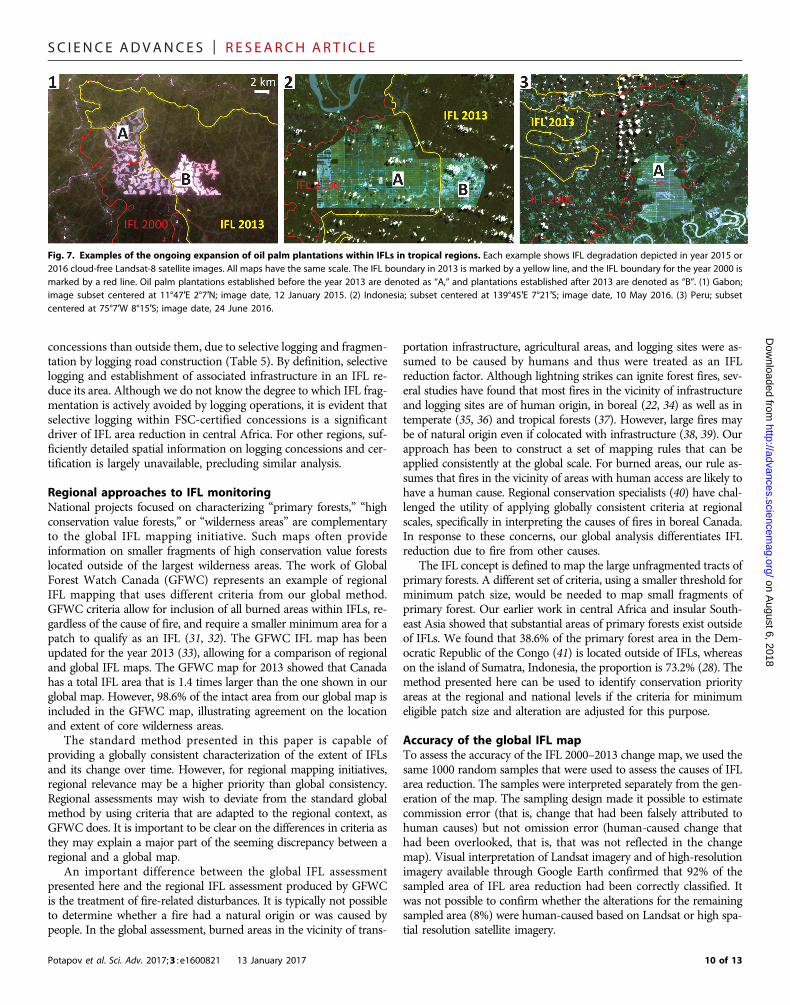
Establishment of oil palm plantations contributed 0.2% of thetotal IFL area reduction. We found new oil palm plantationsaffecting IFLs in all tropical regions (Fig. 7). Plantations usually fol-low selective logging expansion and represent an example of howindustrial logging operations can set off a cascade of interventionsthat eventually result in the final conversion of natural forests toindustrial monoculture plantations (28).
Potapov et al. Sci. Adv. 2017;3 : e1600821 13 January 2017
Forest fires associated with infrastructure and therefore assumed tobe human-induced accounted for 21% of the total IFL area reduction.Fire-related degradation was found within all regions except SoutheastAsia. The absence of fires as an IFL degradation cause in Indonesia isexplained by the fact that the remaining IFLs are located withinremote mountain areas, whereas fires are much more prevalent infragmented and degraded lowland forests. Fire was the main cause
http://advances.scieD
ownloaded from
Fig. 4. Regional reduction of IFL area (km2 × 103) and causes of change.
oncem
ag.org/
Table 3. Sample-based assessment of the causes of IFL area reduction.n A
ugust 6,Total IFLarea reduction(km2 × 103)
Numberof samples(1 km2 each)
The IFL area reduction by proximate cause, km2 × 103 (standard error, km2 × 103)
Wildfire
Timberharvesting
Agriculture andpasture expansion
2
Mining, oiland gas,
hydropower
Other transportation,tourism
018
Africa 101.3 100 0 77.5 (0.4) 22.8 (0.4) 0 1.0 (0.1)Australia
27.4 50 6.6 (0.2) 0 0.5 (0.1) 17.6 (0.2) 2.7 (0.1)South America,temperate
2.1 50 0.5 (0.01) 0.9 (0.01) 0 0 0.7 (0.01)South America,tropical
321.5 300 7.5 (0.3) 68.1 (0.8) 209.0 (0.9) 28.4 (0.5) 8.6 (0.3)North America,temperate andsouthern boreal
83.3
84 24.8 (0.4) 56.6 (0.4) 0 1.0 (0.1) 1.0 (0.1)North America,northern boreal
101.2 116 92.5 (0.3) 0 0 8.7 (0.3) 0Northern Eurasia,temperate andsouthern boreal
112.1
113 23.8 (0.4) 60.0 (0.5) 0 26.3 (0.4) 2.0 (0.1)Northern Eurasia,northern boreal
69.5 87 39.2 (0.4) 1.6 (0.1) 0 28.8 (0.4) 0Southeast Asia
100.2 100 0 75.6 (0.4) 22.6 (0.4) 0 2.0 (0.1)7 of 13
SC I ENCE ADVANCES | R E S EARCH ART I C L E
Dow
nloaded from
of IFL area reduction in northern boreal regions (91% in NorthAmerica and 56% in northern Eurasia) and accounted for more than20% of IFL reduction in temperate North America, temperate Eurasia,and Australia. Excluding fires as a cause of IFL degradation wouldchange the global IFL area reduction from 7.2 to 5.7% (Table 1) butwould not lead to notable changes in the ranking of regions by theproportion of IFL area lost.
Energy production (oil and gas extraction and hydropower) andmining operations are globally important causes of IFL area reductiondue to the fragmenting effect of their transportation infrastructure. Oiland gas extraction was the leading fragmentation cause in northernEurasia (specifically in the Russian Federation), accounting for 41%of IFL reduction in the northern boreal and 23% in the southern bo-real and temperate forests. Russia is the largest producer of crude oiland the second largest producer of natural gas in the world. Recentexpansion of oil and gas exploration and extraction in East Siberiacaused fragmentation of the forest wildlands through establishmentof new pipelines and extraction infrastructure, usually accompaniedby logging and human-ignited fires. Mining and mineral exploration(mostly for gold) played a significant role in Australia (64% of the totalIFL reduction) and tropical South America (9%).
Fragmentation generally dominates over forest clearing as a factorof IFL area reduction. Their relative contribution depends on the type
Potapov et al. Sci. Adv. 2017;3 : e1600821 13 January 2017
on August 6
http://advances.sciencemag.org/
of disturbance. The highest percent of forest clearing was observed foroil palm plantation establishment (43% of the total IFL area reduction)and forest fires (41%), followed by clear-cut logging (15%), pasture(15%), and other agricultural expansion (8%). However, the core areasof IFL also experience natural forest loss events. Intact landscapes arenot static in terms of land cover change. Large-scale wildfires, pestattacks, and wind damage occur naturally in many temperate and bo-real forests, where they are followed by natural regeneration. Accord-ing to the global forest cover loss product (18), the total area of forestloss within IFL from 2001 to 2013 was 314,000 km2, or 2.5% of theIFL area. This includes both anthropogenic and natural disturbances.The IFL 2000–2013 change data set shows that 55% of the total forestloss area fell within stable IFL areas and was therefore assumed to repre-sent natural ecosystem dynamics. However, for the tropical regions, theproportion of natural disturbance within IFLs was small (8.6% of thetotal forest loss area within year 2000 IFLs).
Legal protection of IFLsIn all regions, the proportion of the reduction of IFL area was lowerinside of PAs than outside of PAs (Table 4), suggesting that legalprotection was effective in preventing IFL loss. However, this con-clusion may be invalid due to the nonrandom distribution of PAswithin IFL areas (29). To control for the varying vulnerability of IFLsto human alteration and fragmentation, we implemented a samplematching method to account for the nonrandom distribution ofPAs. The results confirmed that legal protection has been effectiveat lessening the reduction of IFL area in all regions except Australia(where roads have been constructed near PA boundaries) and tempe-rate South America (where new tourist infrastructure has been devel-oped in a national park). However, when analyzing the causes of IFLarea reduction, we noticed that legal protection was not always an ef-fective way to limit agricultural expansion. Of the 10 PAs in Africa,classified as IUCN categories I and II that experienced more than 1%IFL area loss, 7 were subjected to smallholder agricultural expan-sion. Two of these PAs are in Andasibe-Mantadia National Park (inwhich all IFLs disappeared) and Tsaratanana Strict Nature Reserve(in which 28% of the IFL area was lost). In both cases, slash-and-burnagriculture expanded within park boundaries. The same process was
Fig. 5. Annual proportion of the total forest loss within tropical forests thatlost IFL status between 2000 and 2013.
, 2018
Table 4. IFL area reduction inside and outside IUCN category I to III PAs. Area-based estimate represents area calculated from the map. Sample-basedestimate is based on matching sampling analysis performed only within portions of IFLs vulnerable for degradation. This analysis only considers the reduction ofIFL area 2000–2013 that was not attributed to fire.
Region
Area-based estimate
Sample-based estimate and standard error (SE)IFL 2000 withinIUCN categoryI–III PAs (%)
IFL area reductionwithin PAs (%)
IFL area reductionoutside PAs (%)
IFL area reductionwithin PAs, % (SE, %)
IFL area reductionoutside PAs, % (SE, %)
Africa
10.8 1.6 11.2 5.5 (0.72) 25 (1.37)Australia and New Zealand
47.4 9.6 20.5 54.6 (1.57) 44.1 (1.57)Temperate South America
43.7 0.4 1.3 1.6 (0.40) 1.1 (0.33)Tropical South America
15.1 2.0 8.0 8.0 (0.86) 14.6 (1.12)Temperate North America
34.0 1.1 16.4 5.2 (0.70) 24.6 (1.36)Temperate Northern Eurasia
7.7 1.4 7.9 3.2 (0.56) 17.5 (1.20)Southeast Asia
12.7 4.6 15.2 6.8 (0.80) 17.9 (1.21)8 of 13

SC I ENCE ADVANCES | R E S EARCH ART I C L E
observed in Virunga National Park (Democratic Republic of theCongo), which lost 3.3% of its IFL area due to agricultural expansion.
Another cause of IFL area reduction within PAs is the developmentof new infrastructure. In some cases, new transportation infrastructurecauses fragmentation, as in Domogled-Valea Cernei National Park(Romania). In other cases, the development of infrastructure fortourism and recreation caused IFL area reduction, for example, the ex-pansion of the road network in Puyehue National Park (Chile) and theconstruction of a ski resort within Sochinsky National Park (Russia).Although some of these infrastructure projects were developed to in-crease PA income and stimulate public awareness of the importance ofnature conservation, they nevertheless had the effect of reducing theextent of remaining forest wildlands through fragmentation.
Many IFLs contain high-value timber resources, and loggingand associated fragmentation by roads are the leading causes of
Potapov et al. Sci. Adv. 2017;3 : e1600821 13 January 2017
IFL area reduction worldwide. Standards for responsible forestmanagement, including those of the FSC, seek to balance forest-based economic development with conservation. FSC regards IFLsas a type of high conservation value forest, and the FSC standardstates that their degradation should be avoided. In 2014, the GeneralAssembly of FSC adopted a motion (Motion 65) that calls upon FSCto do the following: “within IFL cores ensure that Certificate Holdersimplement protection measures (for example, set-asides, legalprotected areas, conservation reserves, deferrals, community reserves,indigenous protected areas etc.) ensuring management for intactness”(30). If Motion 65 is implemented, we should, at least, in the future,expect IFL fragmentation to proceed more slowly within FSC-certifiedconcessions than in noncertified concessions. Our results from theperiod 2000–2013 suggest that the pace of IFL fragmentation dueto selective logging in central Africa is faster within FSC-certified
Dow
nloade
Table 5. IFL extent and area reduction within logging concessions in three central African countries. The spatial database of logging concessions inCameroon (2013), Republic of the Congo (2013), and Gabon (2012) was obtained from the World Resources Institute (www.wri.org/our-work/project/congo-basin-forest-atlases).
hd from
Countryttp
IFL proportionof total concessionarea in 2000 (%)
:/
IFL proportionof FSC-certifiedconcession areain 2000 (%)
/a
IFL areareduction2000–2013within thecountry (%)
IFL areareduction2000–2013within all
concessions (%)
IFL areareduction2000–2013
within FSC-certifiedconcessions (%)
IFL areareduction2000–2013within PAs
(IUCN category I–III) (%)
dva
Cameroon 40.5 38.4 25.2 41.1 84.5 0.3n
ces Republic of the Congo 42.4 61.6 17.7 37.1 41.9 4.8.s
cie Gabon 48.4 29.7 22.9 37.9 37.0 9.0nc
on August 6, 2018em
ag.org/
Fig. 6. Stages and causes of the IFL area reduction and landscape transformation in the Republic of the Congo (map center at 16°0′E 1°12′N). The infrastructure andIFL extent within the area are shown as of September 2016. The map shows expansion of settlements and regional transportation and logging roads from the year 2000 until2016. Logging road expansion caused the reduction of IFL area. IFL extent was mapped for the years 2000, 2013, and 2016. New settlements and agricultural areas appearedalong existing and established roads. Logging expansion triggered forest fires that initiated from the roads and forest clearings. In September 2016, a water reservoir wasconstructed within the remaining IFL area, which caused continuous fragmentation and transformation of the surrounding landscape.
9 of 13
SC I ENCE ADVANCES | R E S EARCH ART I C L E
on August 6, 2018
http://advances.sciencemag.org/
Dow
nloaded from
concessions than outside them, due to selective logging and fragmen-tation by logging road construction (Table 5). By definition, selectivelogging and establishment of associated infrastructure in an IFL re-duce its area. Although we do not know the degree to which IFL frag-mentation is actively avoided by logging operations, it is evident thatselective logging within FSC-certified concessions is a significantdriver of IFL area reduction in central Africa. For other regions, suf-ficiently detailed spatial information on logging concessions and cer-tification is largely unavailable, precluding similar analysis.
Regional approaches to IFL monitoringNational projects focused on characterizing “primary forests,” “highconservation value forests,” or “wilderness areas” are complementaryto the global IFL mapping initiative. Such maps often provideinformation on smaller fragments of high conservation value forestslocated outside of the largest wilderness areas. The work of GlobalForest Watch Canada (GFWC) represents an example of regionalIFL mapping that uses different criteria from our global method.GFWC criteria allow for inclusion of all burned areas within IFLs, re-gardless of the cause of fire, and require a smaller minimum area for apatch to qualify as an IFL (31, 32). The GFWC IFL map has beenupdated for the year 2013 (33), allowing for a comparison of regionaland global IFL maps. The GFWC map for 2013 showed that Canadahas a total IFL area that is 1.4 times larger than the one shown in ourglobal map. However, 98.6% of the intact area from our global map isincluded in the GFWC map, illustrating agreement on the locationand extent of core wilderness areas.
The standard method presented in this paper is capable ofproviding a globally consistent characterization of the extent of IFLsand its change over time. However, for regional mapping initiatives,regional relevance may be a higher priority than global consistency.Regional assessments may wish to deviate from the standard globalmethod by using criteria that are adapted to the regional context, asGFWC does. It is important to be clear on the differences in criteria asthey may explain a major part of the seeming discrepancy between aregional and a global map.
An important difference between the global IFL assessmentpresented here and the regional IFL assessment produced by GFWCis the treatment of fire-related disturbances. It is typically not possibleto determine whether a fire had a natural origin or was caused bypeople. In the global assessment, burned areas in the vicinity of trans-
Potapov et al. Sci. Adv. 2017;3 : e1600821 13 January 2017
portation infrastructure, agricultural areas, and logging sites were as-sumed to be caused by humans and thus were treated as an IFLreduction factor. Although lightning strikes can ignite forest fires, sev-eral studies have found that most fires in the vicinity of infrastructureand logging sites are of human origin, in boreal (22, 34) as well as intemperate (35, 36) and tropical forests (37). However, large fires maybe of natural origin even if colocated with infrastructure (38, 39). Ourapproach has been to construct a set of mapping rules that can beapplied consistently at the global scale. For burned areas, our rule as-sumes that fires in the vicinity of areas with human access are likely tohave a human cause. Regional conservation specialists (40) have chal-lenged the utility of applying globally consistent criteria at regionalscales, specifically in interpreting the causes of fires in boreal Canada.In response to these concerns, our global analysis differentiates IFLreduction due to fire from other causes.
The IFL concept is defined to map the large unfragmented tracts ofprimary forests. A different set of criteria, using a smaller threshold forminimum patch size, would be needed to map small fragments ofprimary forest. Our earlier work in central Africa and insular South-east Asia showed that substantial areas of primary forests exist outsideof IFLs. We found that 38.6% of the primary forest area in the Dem-ocratic Republic of the Congo (41) is located outside of IFLs, whereason the island of Sumatra, Indonesia, the proportion is 73.2% (28). Themethod presented here can be used to identify conservation priorityareas at the regional and national levels if the criteria for minimumeligible patch size and alteration are adjusted for this purpose.
Accuracy of the global IFL mapTo assess the accuracy of the IFL 2000–2013 change map, we used thesame 1000 random samples that were used to assess the causes of IFLarea reduction. The samples were interpreted separately from the gen-eration of the map. The sampling design made it possible to estimatecommission error (that is, change that had been falsely attributed tohuman causes) but not omission error (human-caused change thathad been overlooked, that is, that was not reflected in the changemap). Visual interpretation of Landsat imagery and of high-resolutionimagery available through Google Earth confirmed that 92% of thesampled area of IFL area reduction had been correctly classified. Itwas not possible to confirm whether the alterations for the remainingsampled area (8%) were human-caused based on Landsat or high spa-tial resolution satellite imagery.
Fig. 7. Examples of the ongoing expansion of oil palm plantations within IFLs in tropical regions. Each example shows IFL degradation depicted in year 2015 or2016 cloud-free Landsat-8 satellite images. All maps have the same scale. The IFL boundary in 2013 is marked by a yellow line, and the IFL boundary for the year 2000 ismarked by a red line. Oil palm plantations established before the year 2013 are denoted as “A,” and plantations established after 2013 are denoted as “B”. (1) Gabon;image subset centered at 11°47′E 2°7′N; image date, 12 January 2015. (2) Indonesia; subset centered at 139°45′E 7°21′S; image date, 10 May 2016. (3) Peru; subsetcentered at 75°7′W 8°15′S; image date, 24 June 2016.
10 of 13

SC I ENCE ADVANCES | R E S EARCH ART I C L E
on August 6, 2018
http://advances.sciencemag.org/
Dow
nloaded from
A partial field validation of the IFL 2000 map by GreenpeaceRussia and GFWC (42, 43) confirmed that intact areas within theboreal and temperate forests of European Russia and Canada hadbeen correctly classified. An alternative approach to validation focusedon forest structure to differentiate intact forests from forests withindegraded or altered landscapes. Studies by Margono et al. (28) andZhuravleva et al. (41) used data from the Geoscience Laser AltimeterSystem to examine the tree canopy structure inside and outside of IFLsin Sumatra (Indonesia) and theDemocraticRepublic of theCongo. Theirresults revealed a statistically significant difference in average forestheight between intact forests and other forests (fragmented and altered).
IFL role in climate change mitigationThe primary forests that remain within IFLs represent the most signif-icant carbon pool within the tropical biome (44). Using a benchmarktropical forest carbon map produced for the early 2000s (45), weestimate that the total biomass carbon pool in the tropical forest zonewas 243 Gt C around year 2000, of which IFLs stored 97 Gt C (40%).The average carbon density was greater in IFLs than in the rest of thetropical forest zone: 3.7 times higher in Africa, 3.4 times higher inSouth America, and 1.7 times higher in Southeast Asia.
IFLs in the boreal and temperate regions differ from those in thetropics by having lower biomass per unit area and lower produc-tivity than managed forests. In the year 2000, the average growingstock in North America and Eurasia was 1.4 times higher in forestsoutside IFLs (145.5 m3/ha) than within IFLs (103.1 m3/ha) (46). Thishas historical reasons. In the past, temperate and southern borealforests have been cleared, converted into managed forests, or fragmen-ted by infrastructure, leaving mostly low productivity forests (specifi-cally, peatlands and mountains) as IFLs (42). Nevertheless, the vastareas of boreal IFLs represent a large and relatively stable above-and belowground carbon storage that plays an important role in theglobal climate system. Although the recent increase in boreal wildfirefrequency and intensity (39) threatens long-term aboveground carbonstorage in northern forests, it has been shown that IFLs have a lowerfire frequency compared to fragmented and developed areas (22). Per-mafrost protection is another important IFL function. Road andpipeline constructions have multiple direct and indirect effects onpermafrost, increasing its vulnerability to thawing (47). Almost 52%(2.6 million km2) of the total continuous and discontinuous perma-frost area within forest zone in North America and Eurasia is locatedwithin the remaining IFLs (48).
CONCLUSIONSIntactness is a good indicator of the comprehensive conservation valueof a forest landscape (7, 8). It is related to specific ecosystem values,such as ecosystem integrity and resilience to natural disturbances andto ongoing climate change. It is also related to other forest ecosystemfunctions, such as biodiversity (49). It can be reduced very rapidly, in amatter of months and years, by increased fragmentation and access,even without changes in tree canopy cover. On the other hand, intact-ness is hard to gain, at least within a short time span. That is whyintact landscapes should be treated as having high (or even the high-est) conservation value. The conservation value of an intact area isdependent on its size because many umbrella mammal and bird spe-cies require large natural habitats to survive (12, 50). That is why thesize of the intact area should always be taken into consideration whenassessing wildland conservation value. The Congress of the IUCN held
Potapov et al. Sci. Adv. 2017;3 : e1600821 13 January 2017
in Hawaii in 2016 adopted a motion (Motion 048) that “encouragesstates, the private sector and international financial institutions to: a.avoid loss and degradation of primary forests, including intact forestlandscapes; b. promote conservation of primary forests, including in-tact forest landscapes” (51). National approaches to protecting IFLsinclude expansion of the PA network and the establishment of a sys-tem for wilderness area management similar to that of the UnitedStates (52). Large forested wildlands often straddle internationalboundaries, highlighting the need for effective international conserva-tion strategies (10). IFLs provide a framework for maintaining large,contiguous, and often transnational blocks of forest wildlands. Thehigh carbon stocks found within IFLs illustrate their potential benefitto climate change mitigation strategies. This study has demonstratedthat legal protection is an effective policy for reducing the degradationof IFLs. We suggest that IFLs should be considered when existing PAnetworks are revised and expanded. We also suggest that monitoringof forest intactness should be treated as an important aspect of nation-al and global forest assessments.
MATERIALS AND METHODSThe extent of the forest zone was mapped using the global year 2000tree canopy cover data set (18) with a 20% tree canopy cover thresh-old. Inland water bodies and naturally treeless ecosystems were includ-ed in the forest zone. Fragments of land in the forest zone with acontiguous area smaller than 500 km2 were excluded from consider-ation. Geographic regions within the forest zone (Fig. 1) were delineatedusing natural boundaries between forested areas. The boundary be-tween northern boreal and southern boreal/temperate regions inNorth America and northern Eurasia was based on Landsat dataanalysis and represents the de facto dividing line between lands thathave, and have not, been subjected to industrial logging as of theyear 2013.
An IFL is defined as a seamless mosaic of forests and asso-ciated natural treeless ecosystems that exhibit no remotely de-tected signs of human activity or habitat fragmentation and islarge enough to maintain all native biodiversity, including viablepopulations of wide-ranging species (15). An IFL includes bothforest and naturally treeless ecosystems. Two main criteria wereused to distinguish an IFL patch from the surrounding landscape:(i) ecosystem alteration and (ii) landscape fragmentation by infra-structure and disturbance. Areas that have been altered or man-aged (through agriculture, logging, and mining) were excluded,along with a buffer zone of 1 km (53) on either side of infra-structure elements (roads, pipelines, power lines, and navigablerivers). Past disturbances that occurred more than 30 to 70 yearsago, scattered small-scale shifting cultivation, nonindustrial timberharvesting by indigenous forest dwellers, and low-intensity distur-bance not directly observable in remotely sensed data (huntingand forest grazing) were not considered IFL alteration or frag-mentation factors. An IFL patch must have (i) a minimum sizeof 500 km2, (ii) a minimum width of 10 km, and (iii) a minimumcorridor/appendage width of 2 km. Any patch that falls below thesethresholds, for example, due to fragmentation, logging, or fire, wasrejected in its entirety.
Source data for IFL mapping and monitoring were taken fromthe global archive of medium spatial resolution Landsat satelliteimagery. We used a collection of single-date Landsat images (15) tomap IFLs for the year 2000. Landsat images circa year 1990 were used
11 of 13

SC I ENCE ADVANCES | R E S EARCH ART I C L E
on August 6, 2018
http://advances.sciencemag.org/
Dow
nloaded from
to map forest disturbances in the tropics that may be invisible in theimages from the year 2000 without previous knowledge. For the year2013 IFL update, we used seamless, cloud-free Landsat data compo-sites and a Landsat-based annual forest loss product (18). IFL map-ping for 2000 and 2013 was performed using visual interpretationof Landsat imagery. A number of ancillary data sources were usedto assist interpretation, including national transportation maps,existing forest cover change products, and high-resolution remotelysensed data from Google Earth. We used an “inverse logic” approachto delineate IFLs. Initially considering the entire forest zone as a can-didate for IFL status, we systematically identified and eliminatedaltered and fragmented areas until all available evidence had been ex-hausted. We then attributed the remaining unfragmented portion ofthe forest zone that fit our size criteria as an IFL. When estimating thereduction in IFL area between 2000 and 2013, we rejected all patchesthat fell below the threshold of intactness during this period, evenwhen only by a small margin. Thus, a patch of 800 km2 that was bi-sected by a road into two patches of 400 km2 each would register as areduction in area of 800 km2.
To identify the causes of IFL area reduction, we used a samplingapproach based on a stratified random design. We allocated a total of1000 IFL area reduction samples, each 1 km2 in size, among the IFLregions (Fig. 1) in proportion to each region’s IFL area reduction inabsolute terms (Table 1). For each sample, we examined the cause ofboth IFL reduction and forest loss using all available remotely senseddata (annual Landsat data composites, data from Google Earth).
To estimate the effectiveness of legal protection as a means for re-ducing the loss of IFL area, we used a matching sampling approach toaccount for the nonrandom distribution of PAs. To account forfactors that influence the probability of IFL area reduction, we usedthe following metrics: (i) elevation (54), (ii) slope, (iii) distance toIFL boundary, (iv) tree canopy cover for the year 2000, and (v) thehuman footprint index (3). In each country and ecozone, we assessedthe distribution of these metrics on areas that had lost IFL status be-tween 2000 and 2013, allowing sampling plots to be selected onlywhere the value of each variable was within ±1 SD of the mean, thatis, in areas with a high probability of change. In each geographicregion, we randomly allocated a set of 1000 samples of 1 ha each with-in the protected portion of the IFLs (IUCN categories I to III) (19).We then selected the closest matching sample from the unprotectedportion of the IFLs in the same country (Global Administrative AreasDatabase, http://gadm.org) and in the same ecozone (55) using theEuclidean distance in metric space. As a result, two matching popula-tions of samples (protected and unprotected) were obtained for eachregion. The differences in the sample-based IFL area change rate fromthese two populations were used as an unbiased measurement of IFLreduction within and outside PAs.
To analyze the effect of FSC certification on IFL area reduction inselected central African countries, we used the logging concessiondatabase collected by the World Resources Institute (www.wri.org/our-work/project/congo-basin-forest-atlases). The logging concessionspatial database for three countries was used: Cameroon (databasefor year 2013), Republic of the Congo (2013), and Gabon (2012).
REFERENCES AND NOTES1. Millennium Ecosystem Assessment, Ecosystems and Human Well-being: Synthesis (Island
Press, 2005).2. P. M. Vitousek, H. A. Mooney, J. Lubchenco, J. M. Melillo, Human domination of Earth’s
ecosystems. Science 277, 494–499 (1997).
Potapov et al. Sci. Adv. 2017;3 : e1600821 13 January 2017
3. E. W. Sanderson, M. Jaiteh, M. A. Levy, K. H. Redford, A. V. Wannebo, G. Woolmer, Thehuman footprint and the last of the wild. Bioscience 52, 891–904 (2002).
4. W. F. Laurance, T. E. Lovejoy, H. L. Vasconcelos, E. M. Bruna, R. K. Didham, P. C. Stouffer,C. Gascon, R. O. Bierregaard, S. G. Laurance, E. Sampaio, Ecosystem decay of Amazonianforest fragments: A 22-year investigation. Conserv. Biol. 16, 605–618 (2002).
5. D. Mollicone, F. Achard, S. Federici, H. D. Eva, G. Grassi, A. Belward, F. Raes, G. Seufert,H.-J. Stibig, G. Matteucci, E.-D. Schulze, An incentive mechanism for reducing emissionsfrom conversion of intact and non-intact forests. Clim. Change 83, 477–493 (2007).
6. L. Gibson, T. M. Lee, L. P. Koh, B. W. Brook, T. A. Gardner, J. Barlow, C. A. Peres,C. J. A. Bradshaw, W. F. Laurance, T. E. Lovejoy, N. S. Sodhi, Primary forests areirreplaceable for sustaining tropical biodiversity. Nature 478, 378–381 (2011).
7. S. Luyssaert, E.-D. Schulze, A. Börner, A. Knohl, D. Hessenmöller, B. E. Law, P. Ciais, J. Grace,Old-growth forests as global carbon sinks. Nature 455, 213–215 (2008).
8. A. Balmford, A. Bruner, P. Cooper, R. Costanza, S. Farber, R. E. Green, M. Jenkins, P. Jefferiss,V. Jessamy, J. Madden, K. Munro, N. Myers, S. Naeem, J. Paavola, M. Rayment, S. Rosendo,J. Roughgarden, K. Trumper, R. Kerry Turner, Economic reasons for conserving wild nature.Science 297, 950–953 (2002).
9. Y. Malhi, J. T. Roberts, R. A. Betts, T. J. Killeen, W. Li, C. A. Nobre, Climate change,deforestation, and the fate of the Amazon. Science 319, 169–172 (2008).
10. B. Mackey, D. A. DellaSala, C. Kormos, D. Lindenmayer, N. Kumpel, B. Zimmerman, S. Hugh,V. Young, S. Foley, K. Arsenis, J. E. M. Watson, Policy options for the world’s primaryforests in multilateral environmental agreements. Conserv. Lett. 8, 139–147 (2014).
11. J. A. Foley, R. Defries, G. P. Asner, C. Barford, G. Bonan, S. R. Carpenter, F. S. Chapin,M. T. Coe, G. C. Daily, H. K. Gibbs, J. H. Helkowski, T. Holloway, E. A. Howard, C. J. Kucharik,C. Monfreda, J. A. Patz, I. C. Prentice, N. Ramankutty, P. K. Snyder, Global consequences ofland use. Science 309, 570–574 (2005).
12. J.-M. Roberge, P. Angelstam, Usefulness of the umbrella species concept. Conserv. Biol.18, 76–85 (2004).
13. D. Bryant, D. Nielsen, L. Tangley, The Last Frontier Forests (World Resources Institute,1997).
14. J. M. McCloskey, H. Spalding, A reconnaissance-level inventory of the amount ofwilderness remaining in the World. Ambio 18, 221–227 (1989).
15. P. Potapov, A. Yaroshenko, S. Turubanova, M. Dubinin, L. Laestadius, C. Thies, D. Aksenov,A. Egorov, Y. Yesipova, I. Glushkov, M. Karpachevskiy, A. Kostikova, A. Manisha,E. Tsybikova, I. Zhuravleva, Mapping the world’s intact forest landscapes by remotesensing. Ecol. Soc. 13, 51 (2008).
16. N. M. Haddad, L. A. Brudvig, J. Clobert, K. F. Davies, A. Gonzalez, R. D. Holt, T. E. Lovejoy,J. O. Sexton, M. P. Austin, C. D. Collins, W. M. Cook, E. I. Damschen, R. M. Ewers, B. L. Foster,C. N. Jenkins, A. J. King, W. F. Laurance, D. J. Levey, C. R. Margules, B. A. Melbourne,A. O. Nicholls, J. L. Orrock, D.-X. Song, J. R. Townshend, Habitat fragmentation and its lastingimpact on Earth’s ecosystems. Sci. Adv. 1, e1500052 (2015).
17. Food and Agriculture Organization of the United Nations, FAO Global Forest ResourcesAssessment 2010 (Food and Agriculture Organization of the United Nations, 2010).
18. M. C. Hansen, P. V. Potapov, R. Moore, M. Hancher, S. A. Turubanova, A. Tyukavina,D. Thau, S. V Stehman, S. J. Goetz, T. R. Loveland, A. Kommareddy, A. Egorov, L. Chini,C. O. Justice, J. R. G. Townshend, High-resolution global maps of 21st-century forest coverchange. Science 342, 850–853 (2013).
19. World Database of Protected Areas, ProtectedPlanet, www.protectedplanet.net [accessed14 October 2013].
20. M. Huang, G. P. Asner, Long-term carbon loss and recovery following selective logging inAmazon forests. Global Biogeochem. Cycles 24, 1–15 (2010).
21. S. M. Jantz, L. Pintea, J. Nackoney, M. C. Hansen, Landsat ETM+ and SRTM data providenear real-time monitoring of chimpanzee (Pan troglodytes) habitats in Africa. RemoteSens. 8, 427 (2016).
22. D. Mollicone, H. D. Eva, F. Achard, Human role in Russian wild fires. Nature 440, 436–437(2006).
23. M. A. Cochrane, Fire science for rainforests. Nature 421, 913–919 (2003).24. S. J. Dyer, J. P. O’Neill, S. M. Wasel, S. Boutin, Avoidance of industrial development by
woodland Caribou. J. Wildl. Manage. 65, 531–542 (2001).25. P. D. Walsh, K. A. Abernethy, M. Bermejo, R. Beyers, P. De Wachter, M. E. Akou,
B. Huijbregts, D. I. Mambounga, A. K. Toham, A. A. Kilbourn, S. A. Lahm, S. Latour,F. Maisels, C. Mbina, Y. Mihindou, S. N. Obiang, E. N. Effa, M. P. Starkey, P. Telfer,M. Thibault, C. E. G. Tutin, L. J. T. White, D. S. Wilkie, Catastrophic ape decline in westernequatorial Africa. Nature 422, 611–614 (2003).
26. K. A. Abernethy, L. Coad, G. Taylor, M. E. Lee, F. Maisels, Extent and ecologicalconsequences of hunting in Central African rainforests in the twenty-first century. Philos.Trans. R. Soc. Lond. B Biol. Sci. 368, 20120303 (2013).
27. V. De Sy, M. Herold, F. Achard, R. Beuchle, J. G. P. W. Clevers, E. Lindquist, L. Verchot, Landuse patterns and related carbon losses following deforestation in South America. Environ.Res. Lett. 10, 124004 (2015).
28. B. A. Margono, S. Turubanova, I. Zhuravleva, P. Potapov, A. Tyukavina, A. Baccini, S. Goetz,M. C. Hansen, Mapping and monitoring deforestation and forest degradation in Sumatra
12 of 13

SC I ENCE ADVANCES | R E S EARCH ART I C L E
on August 6, 2018
http://advances.sciencemag.org/
Dow
nloaded from
(Indonesia) using Landsat time series data sets from 1990 to 2010. Environ. Res. Lett. 7,34010 (2012).
29. K. S. Andam, P. J. Ferraro, A. Pfaff, G. A. Sanchez-Azofeifa, J. A. Robalino, Measuring theeffectiveness of protected area networks in reducing deforestation. Proc. Natl. Acad. Sci. U.S.A.105, 16089–16094 (2008).
30. Forest Stewardship Council, Policy Motion Number 65 “High Conservation Value 2 (HCV2)—Intact Forest Landscapes (IFL) Protection” (Forest Stewardship Council, 2014).
31. P. Lee, J. Gysbers, Z. Stanojevic, Canada’s Forest Landscape Fragments: A FirstApproximation (Global Forest Watch Canada, 2006).
32. P. Lee, M. Hanneman, J. Gysbers, R. Cheng, W. Smith, Atlas of Canada’s Intact ForestLandscapes (Global Forest Watch Canada, 2010).
33. W. Smith, R. Cheng, Canada’s Large Intact Forest Landscapes Updated to 2013 (GlobalForest Watch Canada, 2016).
34. E. A. Kukavskaya, L. V. Buryak, G. A. Ivanova, S. G. Conard, O. P. Kalenskaya, S. V. Zhila,D. J. McRae, Influence of logging on the effects of wildfire in Siberia. Environ. Res. Lett. 8,045034 (2013).
35. T. V. Loboda, I. A. Csiszar, Assessing the risk of ignition in the Russian Far East within amodeling framework of fire threat. Ecol. Appl. 17, 791–805 (2007).
36. A. D. Syphard, V. C. Radeloff, N. S. Keuler, R. S. Taylor, T. J. Hawbaker, S. I. Stewart,M. K. Clayton, Predicting spatial patterns of fire on a southern California landscape. Int. J.Wildl. Fire 17, 602–613 (2008).
37. M. A. Cochrane, A. Alencar, M. D. Schulze, C. M. Souza Jr., D. C. Nepstad, P. Lefebvre,E. A. Davidson, Positive feedbacks in the fire dynamic of closed canopy tropical forests.Science 284, 1832–1835 (1999).
38. M. P. Calef, A. D. McGuire, F. S. Chapin, Human influences on wildfire in Alaska from 1988through 2005: An analysis of the spatial patterns of human impacts. Earth Interact. 12,1–17 (2008).
39. E. S. Kasischke, D. L. Verbyla, T. S. Rupp, A. D. McGuire, K. A. Murphy, R. Jandt, J. L. Barnes,E. E. Hoy, P. A. Duffy, M. Calef, M. R. Turetsky, Alaska’s changing fire regime—Implicationsfor the vulnerability of its boreal forests. Can. J. For. Res. 40, 1313–1324 (2010).
40. P. Lee, Caution against using intact forest-landscapes data at regional scales. Ecol. Soc. 14,r1 (2009).
41. I. Zhuravleva, S. Turubanova, P. Potapov, M. Hansen, A. Tyukavina, S. Minnemeyer,N. Laporte, S. Goetz, F. Verbelen, C. Thies, Satellite-based primary forest degradationassessment in the Democratic Republic of the Congo, 2000–2010. Environ. Res. Lett. 8,024034 (2013).
42. A. Y. Yaroshenko, P. V. Potapov, S. A. Turubanova, The Last Intact Forest Landscapes ofNorthern European Russia (Greenpeace Russia and Global Forest Watch, 2001).
43. P. Lee, D. Aksenov, L. Laestadius, R. Nogueron, W. Smith, Canada’s Large Intact ForestLandscapes (Global Forest Watch Canada, 2003).
44. A. Tyukavina, A. Baccini, M. C. Hansen, P. V. Potapov, S. V. Stehman, R. A. Houghton,A. M. Krylov, S. Turubanova, S. J. Goetz, Aboveground carbon loss in naturaland managed tropical forests from 2000 to 2012. Environ. Res. Lett. 10, 074002(2015).
45. S. S. Saatchi, N. L. Harris, S. Brown, M. Lefsky, E. T. A. Mitchard, W. Salas, B. R. Zutta,W. Buermann, S. L. Lewis, S. Hagen, S. Petrova, L. White, M. Silman, A. Morel, Benchmarkmap of forest carbon stocks in tropical regions across three continents. Proc. Natl. Acad.Sci. U.S.A. 108, 9899–9904 (2011).
46. M. Santoro, C. Beer, O. Cartus, C. Schmullius, A. Shvidenko, I. McCallum, U. Wegmüller,A. Wiesmann, Retrieval of growing stock volume in boreal forest using hyper-temporalseries of Envisat ASAR ScanSAR backscatter measurements. Remote Sens. Environ. 115,490–507 (2011).
Potapov et al. Sci. Adv. 2017;3 : e1600821 13 January 2017
47. Q. Yu, H. E. Epstein, R. Engstrom, N. Shiklomanov, D. Strelestskiy, Land cover and land usechanges in the oil and gas regions of Northwestern Siberia under changing climaticconditions. Environ. Res. Lett. 10, 124020 (2015).
48. R. J. E. Brown, O. J. Ferrians, J. A. Heginbottom, E. S. Melnikov, Circum-Arctic Map ofPermafrost and Ground-Ice Conditions (National Snow and Ice Data Center, 2002).
49. J. F. Franklin, Preserving biodiversity: Species, ecosystems, or landscapes? Ecol. Appl. 3,202–205 (1993).
50. J. M. Thiollay, Area requirements for the conservation of rainforest raptors and gamebirds in French Guiana. Conserv. Biol. 3, 128–137 (1989).
51. International Union for Conservation, IUCN World Conservation Congress: Motion048—Protection of Primary Forests, Including Intact Forest Landscapes (InternationalUnion for Conservation, 2016); https://portals.iucn.org/congress/motion/048.
52. P. Landres, C. Barns, J. G. Dennis, T. Devine, P. Geissler, C. S. McCasland, L. Merigliano,J. Seastrand, R. Swain, Keeping It Wild: An Interagency Strategy to Monitor Trends inWilderness Character Across the National Wilderness Preservation System (U.S. Departmentof Agriculture, 2008).
53. C. P. Barber, M. A. Cochrane, C. M. Souza, W. F. Laurance, Roads, deforestation, and themitigating effect of protected areas in the Amazon. Biol. Conserv. 177, 203–209 (2014).
54. Food and Agriculture Organization of the United Nations, Global Ecological Zoning for theGlobal Forest Resources Assessment 2000 (Food and Agriculture Organization of theUnited Nations, 2001).
55. J. J. Danielson, D. B. Gesch, Global Multi-resolution Terrain Elevation Data 2010(GMTED2010) (U.S. Geological Survey, 2011).
Acknowledgments: We would like to thank all organizations and their representatives whoparticipated in the global Intact Forest Landscapes mapping and monitoring initiative,including Greenpeace, the World Resources Institute, Transparent World, WWF Russia, LuontoLiitto, and other regional nongovernmental organizations. We greatly appreciate help fromremote sensing data interpretation specialists, Geographic Information Systems technicians, andnature conservation experts who provided invaluable knowledge and assistance in thedevelopment and validation of the IFL data set. Funding: The IFL 2000–2013 global update wasfunded by Greenpeace Russia and Global Forest Watch, an initiative of the World ResourcesInstitute. Author contributions: A.Y., L.L., C.T., P.P., and S.T. designed the IFL concept. S.T., I.Z.,A.K., E.E., and P.P. performed global IFL change mapping. S.M. provided data and analysis ofFSC-certified concessions in central Africa. W.S. performed the national IFL mapping in Canada.P.P performed sample-based analysis of IFL change causes and effectiveness of legal protection.The manuscript was prepared by P.P., M.C.H., and L.L. with contributions from S.T., A.Y., C.T., S.M.,and W.S. Competing interests: The authors declare that they have no competing interests.Data and materials availability: The IFL extent and change maps in GIS format are available onthe project website (www.intactforests.org/) and through the Global Forest Watch data portal(www.globalforestwatch.org/). All tabular data needed to evaluate our conclusions are present inthe paper. Additional data related to this paper may be requested from the authors.
Submitted 18 April 2016Accepted 29 November 2016Published 13 January 201710.1126/sciadv.1600821
Citation: P. Potapov, M. C. Hansen, L. Laestadius, S. Turubanova, A. Yaroshenko, C. Thies,W. Smith, I. Zhuravleva, A. Komarova, S. Minnemeyer, E. Esipova, The last frontiers ofwilderness: Tracking loss of intact forest landscapes from 2000 to 2013. Sci. Adv. 3,e1600821 (2017).
13 of 13

The last frontiers of wilderness: Tracking loss of intact forest landscapes from 2000 to 2013
Smith, Ilona Zhuravleva, Anna Komarova, Susan Minnemeyer and Elena EsipovaPeter Potapov, Matthew C. Hansen, Lars Laestadius, Svetlana Turubanova, Alexey Yaroshenko, Christoph Thies, Wynet
DOI: 10.1126/sciadv.1600821 (1), e1600821.3Sci Adv
ARTICLE TOOLS http://advances.sciencemag.org/content/3/1/e1600821
REFERENCES
http://advances.sciencemag.org/content/3/1/e1600821#BIBLThis article cites 40 articles, 10 of which you can access for free
PERMISSIONS http://www.sciencemag.org/help/reprints-and-permissions
Terms of ServiceUse of this article is subject to the
registered trademark of AAAS.is aScience Advances Association for the Advancement of Science. No claim to original U.S. Government Works. The title
York Avenue NW, Washington, DC 20005. 2017 © The Authors, some rights reserved; exclusive licensee American (ISSN 2375-2548) is published by the American Association for the Advancement of Science, 1200 NewScience Advances
on August 6, 2018
http://advances.sciencemag.org/
Dow
nloaded from


