Embed Size (px)
Citation preview

The Lancet Commissions
www.thelancet.com Published online October 19, 2017 http://dx.doi.org/10.1016/S0140-6736(17)32345-0 1
The Lancet Commission on pollution and healthPhilip J Landrigan, Richard Fuller, Nereus J R Acosta, Olusoji Adeyi, Robert Arnold, Niladri (Nil) Basu, Abdoulaye Bibi Baldé, Roberto Bertollini, Stephan Bose-O’Reilly, Jo Ivey Boufford, Patrick N Breysse, Thomas Chiles, Chulabhorn Mahidol, Awa M Coll-Seck, Maureen L Cropper, Julius Fobil, Valentin Fuster, Michael Greenstone, Andy Haines, David Hanrahan, David Hunter, Mukesh Khare, Alan Krupnick, Bruce Lanphear, Bindu Lohani, Keith Martin, Karen V Mathiasen, Maureen A McTeer, Christopher J L Murray, Johanita D Ndahimananjara, Frederica Perera, Janez Potočnik, Alexander S Preker, Jairam Ramesh, Johan Rockström, Carlos Salinas, Leona D Samson, Karti Sandilya, Peter D Sly, Kirk R Smith, Achim Steiner, Richard B Stewart, William A Suk, Onno C P van Schayck, Gautam N Yadama, Kandeh Yumkella, Ma Zhong
Executive summaryPollution is the largest environmental cause of disease and premature death in the world today. Diseases caused by pollution were responsible for an estimated 9 million premature deaths in 2015—16% of all deaths worldwide—three times more deaths than from AIDS, tuberculosis, and malaria combined and 15 times more than from all wars and other forms of violence. In the most severely affected countries, pollution-related disease is responsible for more than one death in four.
Pollution disproportionately kills the poor and the vulnerable. Nearly 92% of pollution-related deaths occur in low-income and middle-income countries and, in countries at every income level, disease caused by pollution is most prevalent among minorities and the marginalised. Children are at high risk of pollution-related disease and even extremely low-dose exposures to pollutants during windows of vulnerability in utero and in early infancy can result in disease, disability, and death in childhood and across their lifespan.
Despite its substantial effects on human health, the economy, and the environment, pollution has been neglected, especially in low-income and middle-income countries, and the health effects of pollution are under-estimated in calculations of the global burden of disease. Pollution in low-income and middle-income countries that is caused by industrial emissions, vehicular exhaust, and toxic chemicals has particularly been overlooked in both the international development and the global health agendas. Although more than 70% of the diseases caused by pollution are non-communicable diseases, inter ventions against pollution are barely mentioned in the Global Action Plan for the Prevention and Control of Non-Communicable Diseases.
Pollution is costly. Pollution-related diseases cause productivity losses that reduce gross domestic product (GDP) in low-income to middle-income countries by up to 2% per year. Pollution-related disease also results in health-care costs that are responsible for 1·7% of annual health spending in high-income countries and for up to 7% of health spending in middle-income countries that are heavily polluted and rapidly developing. Welfare losses due to pollution are estimated to amount to US$4·6 trillion per year: 6·2% of global economic output. The costs attributed to pollution-related disease will probably increase as additional associations between pollution and disease are identified.
Pollution endangers planetary health, destroys eco-systems, and is intimately linked to global climate change. Fuel combustion—fossil fuel combustion in high-income and middle-income countries and burning of biomass in low-income countries—accounts for 85% of airborne particulate pollution and for almost all pollution by oxides of sulphur and nitrogen. Fuel combustion is also a major source of the greenhouse gases and short-lived climate pollutants that drive climate change. Key emitters of carbon dioxide, such as electricity-generating plants, chemical manufacturing facilities, mining operations, deforestation, and petroleum-powered vehicles, are also major sources of pollution. Coal is the world’s most polluting fossil fuel, and coal combustion is an important cause of both pollution and climate change.
In many parts of the world, pollution is getting worse. Household air and water pollution, the forms of pollution associated with profound poverty and traditional lifestyles, are slowly declining. However, ambient air pollution, chemical pollution, and soil pollution—the forms of pollution produced by industry, mining, electricity generation, mechanised agriculture, and petroleum-powered vehicles—are all on the rise, with the most marked increases in rapidly developing and industrialising low-income and middle-income countries.
Chemical pollution is a great and growing global problem. The effects of chemical pollution on human health are poorly defined and its contribution to the global burden of disease is almost certainly underestimated. More than 140 000 new chemicals and pesticides have been synthesised since 1950. Of these materials, the 5000 that are produced in greatest volume have become widely dispersed in the environment and are responsible for nearly universal human exposure. Fewer than half of these high-production volume chemicals have undergone any testing for safety or toxicity, and rigorous pre-market evaluation of new chemicals has become mandatory in only the past decade and in only a few high-income countries. The result is that chemicals and pesticides whose effects on human health and the environment were never examined have repeatedly been responsible for episodes of disease, death, and environmental degradation. Historical examples include lead, asbestos, dichlorodiphenyltrichloroethane (DDT), polychlorinated biphenyls (PCBs), and the ozone-destroying chlorofluorocarbons. Newer synthetic chem-icals that have entered world markets in the past
Published Online October 19, 2017 http://dx.doi.org/10.1016/S0140-6736(17)32345-0
See Online/Comment http://dx.doi.org/10.1016/S0140-6736(17)32588-6 and http://dx.doi.org/10.1016/S0140-6736(17)32545-X
Arnhold Institute for Global Health (Prof P J Landrigan MD), Mount Sinai Heart (V Fuster MD), and Department of Environmental Medicine and Global Health (Prof A S Preker PhD), Icahn School of Medicine at Mount Sinai, New York, NY, USA; Pure Earth, New York, NY, USA (R Fuller BE, D Hanrahan MSc, K Sandilya LLB); Office of the President, Manila, Philippines (N J R Acosta PhD); Department of Health, Nutrition, and Population Global Practice (O Adeyi DrPH), and Office of the US Executive Director (K V Mathiasen MALD), The World Bank, Washington, DC, USA; Department of Chemical and Environmental Engineering, University of Arizona, Tucson, AZ, USA (R Arnold PhD); Faculty of Agricultural and Environmental Sciences, McGill University, Montreal, Canada (Prof N Basu PhD); Ministry of Environment and Sustainable Development, Dakar, Senegal (A B Baldé MS); Scientific Committee on Health, Environmental and Emerging Risks of the European Commission, Luxembourg City, Luxembourg (R Bertollini MD); Office of the Minister of Health, Ministry of Public Health, Doha, Qatar (R Bertollini); Institute and Outpatient Clinic for Occupational, Social and Environmental Medicine, University Hospital of LMU Munich, Munich, Germany (S Bose-O’Reilly MD); Department of Public Health, Health Services Research and Health Technology
The Lancet Commissions
2 www.thelancet.com Published online October 19, 2017 http://dx.doi.org/10.1016/S0140-6736(17)32345-0
2–3 decades and that, like their predecessors, have undergone little pre-market evaluation threaten to repeat this history. They include developmental neurotoxicants, endocrine disruptors, chemical herbicides, novel insect-icides, pharmaceutical wastes, and nanomaterials. Evidence for the capacity of these emerging chemical pollutants to cause harm to human health and the environment is beginning to become evident. These emerging chemicals are of great concern, and this concern is heightened by the increasing movement of chemical production to low-income and middle-income countries where public health and environmental protections are often scant. Most future growth in chemical production will occur in these countries. A further dimension of chemical pollution is the global archipelago of contaminated hot-spots: cities and communities, homes and schoolyards polluted by toxic chemicals, radionuclides, and heavy metals released into air, water, and soil by active and abandoned factories, smelters, mines, and hazardous waste sites.
Cities, especially rapidly growing cities in industrialising countries, are severely affected by pollution. Cities contain 55% of the world’s population; they account for 85% of global economic activity and they concentrate people, energy consumption, construction activity, industry, and traffic on a historically un-precedented scale.
The good news is that much pollution can be eliminated, and pollution prevention can be highly cost-effective. High-income and some middle-income countries have enacted legislation and issued regulations mandating clean air and clean water, established chemical safety policies, and curbed their most flagrant forms of pollution. Their air and water are now cleaner, the blood lead concentrations of their children have decreased by more than 90%, their rivers no longer catch fire, their worst hazardous waste sites have been re-mediated, and many of their cities are less polluted and more liveable. Health has improved and people in these countries are living longer. High-income countries have achieved this progress while increasing gross domestic product (GDP) by nearly 250%. The challenge for high-income nations today is to further reduce pollution, decarbonise their economies, and reduce the resources used in achieving prosperity. The claim that pollution control stifles economic growth and that poor countries must pass through a phase of pollution and disease on the road to prosperity has repeatedly been proven to be untrue.
Pollution mitigation and prevention can yield large net gains both for human health and the economy. Thus, air quality improvements in the high-income countries have not only reduced deaths from cardiovascular and respiratory disease but have also yielded substantial economic gains. In the USA, an estimated US$30 in benefits (range, $4–88) has been returned to the economy for every dollar invested in air pollution control
since 1970, which is an aggregate benefit of $1·5 trillion against an investment of $65 billion. Similarly, the removal of lead from gasoline has returned an estimated $200 billion (range, $110 billion–300 billion) to the US economy each year since 1980, an aggregate benefit to-date of over $6 trillion through the increased cognitive function and enhanced economic productivity of generations of children exposed since birth to only low amounts of lead.
Pollution control will advance attainment of many of the sustainable development goals (SDGs), the 17 goals established by the United Nations to guide global development in the 21st century. In addition to improving health in countries around the world (SDG 3), pollution control will help to alleviate poverty (SDG 1), improve access to clean water and improve sanitation (SDG 6), promote social justice (SDG 10), build sustainable cities and communities (SDG 11), and protect land and water (SDGs 14 and 15). Pollution control, in turn, will benefit from efforts to slow the pace of climate change (SDG 13) by transitioning to a sustainable, circular economy that relies on non-polluting renewable energy, on efficient industrial processes that produce little waste, and on transport systems that restrict use of private vehicles in cities, enhance public transport, and promote active travel.
Many of the pollution control strategies that have proven cost-effective in high-income and middle-income countries can be exported and adapted by cities and countries at every level of income. These strategies are based in law, policy, regulation, and technology, are science-driven, and focus on the protection of public health. The application of these approaches boosts economies and increases GDP. The strategies include targeted reductions in emissions of pollutants, transitions to non-polluting, renewable sources of energy, the adoption of non-polluting technologies for production and transportation, and the development of efficient, accessible, and affordable public transportation systems. Application of the best of these strategies in carefully planned and well resourced campaigns can enable low-income and middle-income countries to avoid many of the harmful consequences of pollution, leapfrog the worst of the human and ecological disasters that have plagued industrial development in the past, and improve the health and wellbeing of their people. Pollution control provides an extraordinary opportunity to improve the health of the planet. It is a winnable battle.
The aim of this Lancet Commission on pollution and health is to raise global awareness of pollution, end neglect of pollution-related disease, and mobilise the resources and the political will needed to effectively confront pollution. To advance this aim, we make six recommendations. Additional recommendations are presented at the end of each Section. The key recommendations are:
(1) Make pollution prevention a high priority nationally and internationally and integrate it into country and city
Assessment, University for Health Sciences, Medical
Informatics and Technology, Hall in Tirol, Austria
(S Bose-O’Reilly); New YorkAcademy of Medicine,
New York, NY, USA (J I Bouffourd MD); Department
of Environmental Health and Engineering, Johns Hopkins Bloomberg School of Public Health, Baltimore, MD, USA (P N Breysse PhD); School of
Social Work (Prof G N Yadama PhD), and
Department of Biology (T Chiles PhD), Boston College,
Chestnut Hill, MA, USA; Chulabhorn Research Institute,
Bangkok, Thailand (HRH Princess C Mahidol PhD);
Ministry of the Health and Social Affairs, Dakar, Senegal
(A M Coll-Seck MD); Department of Economics,
University of Maryland, College Park, MD, USA
(Prof M L Cropper PhD); Resources for the Future,
Washington, DC, USA (Prof M L Cropper,
A Krupnick PhD); Department of Biological, Environmental and Occupational Health Sciences,
School of Public Health, University of Ghana, Accra,
Ghana (J Fobil DrPH); Centro Nacional de Investigaciones
Cardiovasculares Carlos III, Madrid, Spain (V Fuster);
Department of Economics, University of Chicago, Chicago,
IL, USA (M Greenstone PhD); Department of Social and
Environmental Health Research and Department of Population
Health, London School of Hygiene & Tropical Medicine,
London, UK (Prof A Haines FMedSci); Nuffield Department of
Population Health, University of Oxford, Oxford, UK (Prof D Hunter MBBS);
Department of Civil Engineering, Indian Institute of
Technology, Delhi, India (Prof M Khare PhD); Faculty of Health Sciences, Simon Fraser
University, Burnaby, BC, Canada (B Lanphear MD);
Centennial Group, Washington, DC, USA
(B Lohani PhD); The Resources Center, Lalitpur, Nepal
(B Lohani); Consortium of Universities for Global Health,
Washington, DC, USA (K Martin MD); Faculty of
Common Law, University of Ottawa, Ottawa, ON, Canada

The Lancet Commissions
www.thelancet.com Published online October 19, 2017 http://dx.doi.org/10.1016/S0140-6736(17)32345-0 3
planning processes. Pollution can no longer be viewed as an isolated environmental issue, but is a transcendent problem that affects the health and wellbeing of entire societies. Leaders of government at all levels (mayors, governors, and heads of state) need, therefore, to elevate pollution control to a high priority within their agendas; to integrate pollution control into development planning; to actively engage in pollution planning and prioritisation; and to link prevention of pollution with commitments to advance the SDGs, to slow the pace of climate change, and to control non-communicable diseases.
Targets and timetables are essential, and governments at all levels need to establish short-term and long-term targets for pollution control and to support the agencies and regulations needed to attain these goals. Legally mandated regulation is an essential tool, and both the polluter-pays principle and an end to subsidies and tax breaks for polluting industries need to be integral components of pollution control programmes.
(2) Mobilise, increase, and focus the funding and the international technical support dedicated to pollution control. The amount of funding from international agencies, binational donors, and private foundations that is directed to control of pollution, especially pollution from the industrial, transport, chemical, and mining sectors in low-income and middle-income countries is meagre and needs to be substantially increased. The resources directed to pollution management need to be increased within cities and countries as well as internationally. Options for increasing the international development funding directed to pollution include expansion of climate change and non-communicable disease control programmes to include pollution control and development of new funding mechanisms.
In addition to increased funding, international technical support for pollution control is needed in prioritisation and planning of processes to tackle pollution within rapidly industrialising cities and countries; in development of regulatory and enforcement strategies; in building technical capacity; and in direct interventions, in which such actions are urgently needed to save lives or can substantially leverage local action and resources. Financing and technical assistance programmes need to be tracked and measured to assess their cost-effectiveness and to enhance accountability.
(3) Establish systems to monitor pollution and its effects on health. Data collected at the national and local levels are essential for measuring pollution levels, identifying and apportioning appropriate responsibility to each pollution source, evaluating the success of interventions, guiding enforcement, informing civil society and the public, and assessing progress toward goals. The incorporation of new technologies, such as satellite imaging and data mining, into pollution monitoring can increase efficiency, expand geographic range, and lower costs. Open access to these data is essential, and consultation with civil society and the
public will ensure accountability and build public awareness. With even limited monitoring programmes, consisting of only one or a few sampling stations, governments and civil society organisations can document pollution, and track progress toward short-term and long-term control targets. Pollution control metrics should be integrated into SDG dashboards and other monitoring platforms so that successes and experiences can be shared.
(4) Build multi-sectoral partnerships for pollution control. Broad-based partnerships across several govern ment agencies and between governments and the private sector can powerfully advance pollution control and accelerate the development of clean energy sources and clean technologies that will ultimately prevent pollution at source. Cross-ministerial collaborations that involve health and environment ministries, but also ministries of finance, energy, agriculture, development, and trans port are essential. Collaborations between govern ments and industry can catalyse innovation, create incent ives for cleaner production technologies and cleaner energy production, and incentivise transition to a more sustainable, circular economy. The private sector is in a unique position to provide leadership in the design and development of clean, non-polluting, sustainable tech-nologies for pollution control, and to engage construct-ively with governments to reward innovation and create incentives.
(5) Integrate pollution mitigation into planning processes for non-communicable diseases. Interventions against pollution need to be a core component of the Global Action Plan for the Prevention and Control of Non-Communicable Diseases.
(6) Research pollution and pollution control. Research is needed to understand and control pollution and to drive change in pollution policy. Pollution-related research should:• Explore emerging causal links between pollution,
disease, and subclinical impairment, for example between ambient air pollution and dysfunction of the central nervous system in children and the elderly;
• Quantifytheglobalburdenofdiseaseassociatedwithchemical pollutants of known toxicity such as lead, mercury, chromium, arsenic, asbestos, and benzene;
• Identifyandcharacterisetheadversehealthoutcomescaused by new and emerging chemical pollutants, such as developmental neurotoxicants, endocrine disruptors, novel insecticides, chemical herbicides, and pharmaceutical wastes;
• Identifyandmappollutionexposuresparticularly inlow-income and middle-income countries;
• Improveestimatesoftheeconomiccostsofpollutionand pollution-related disease; and
• Quantify the health and economic benefits of interventions against pollution and balance these benefits against the costs of interventions.
(M A McTeer LLM); Institute for Health Metrics, Seattle, WA, USA (C J L Murray MD); Ministry of Environment, Ecology and Forests, Antananarivo, Madagascar (J D Ndahimananjara MD); Columbia Center for Children’s Environmental Health, Department of Environmental Health Sciences (F Perera DrPH), and Department of Health Policy and Management (Prof A S Preker), Mailman School of Public Health, Columbia University, New York, NY, USA; UN International Resource Panel, Paris, France (J Potočnik PhD); SYSTEMIQ, London, UK (J Potočnik); Health Investment & Financing Corporation, New York, NY, USA (Prof A S Preker); Parliament of India, New Delhi, India (J Ramesh MS); Stockholm Resilience Centre, Stockholm University, Stockholm, Sweden (J Rockström PhD); Mexico City, Mexico (C Salinas PhD); Department of Biological Engineering and Department of Biology, Center for Environmental Health Sciences, Koch Institute for Integrative Cancer Research, Massachusetts Institute of Technology, Cambridge, MA, USA (Prof L D Samson PhD); Children’s Health and Environment Program, Child Health Research Centre, University of Queensland, Brisbane, QLD, Australia (Prof P D Sly DSc); Environmental Health Sciences Division, School of Public Health, University of California, Berkeley, CA, USA (K R Smith PhD); Oxford Martin School, University of Oxford, Oxford, UK (A Steiner MA); Guarini Center on Environmental, Energy, and Land Use Law, New York University, New York, NY, USA (Prof R B Stewart LLB); Division of Extramural Research and Training, National Institute of Environmental Health Sciences, National Institutes of Health, Research Triangle Park, NC, USA (W A Suk PhD); Care and Public Health Research Institute, Maastricht University, Maastricht, the Netherlands (Prof C P van Schayck PhD); United Nations Industrial Development Organization, Vienna, Austria

The Lancet Commissions
4 www.thelancet.com Published online October 19, 2017 http://dx.doi.org/10.1016/S0140-6736(17)32345-0
IntroductionPollution is one of the great existential challenges of the Anthropocene epoch. Like climate change, biodiversity loss, ocean acidification, desertification, and depletion of the world’s fresh water supply, pollution endangers the stability of the Earth’s support systems and threatens the continuing survival of human societies.1 Pollution, especially pollution caused by industrial emissions, vehicular exhausts, and toxic chemicals, has increased sharply in the past 500 years, and the largest increases today are seen in low-income and middle-income countries. Yet despite its great and growing magnitude, industrial, vehicular, and chemical pollution in developing countries has been largely overlooked in international development and global health agendas, and programmes for pollution control have received little attention or resources from either international agencies or philanthropic donors. Pollution is now a substantial problem that endangers the health of billions, degrades the Earth’s ecosystems, undermines the economic security of nations, and is responsible for an enormous global burden of disease, disability, and premature death.
Pollution is intimately linked to global climate change.2,3 Fuel combustion—fossil fuel combustion in high-income and middle-income countries, and biomass burning in inefficient cookstoves, open fires, agricultural burns, forest burning,4,5 and obsolete brick kilns in low-income countries—accounts for 85% of airborne particulate pollution and for almost all pollution by oxides of sulphur and nitrogen. Fuel combustion is the major source of greenhouse gases and short-lived climate pollutants that are the main anthropogenic drivers of global climate change (appendix pp 1–11).6
Pollution is very costly; it is responsible for productivity losses, health-care costs, and costs resulting from damages to ecosystems. But despite the great magnitude of these costs, they are largely invisible and often are not recognised as caused by pollution.7 The productivity losses of pollution-related diseases are buried in labour statistics. The health-related costs of pollution are hidden in hospital budgets.8 The result is that the full costs of pollution are not appreciated, are often not counted, and are not available to rebut one-sided, economically based arguments against pollution control.7,9
The nature of pollution is changing and, in many places around the world, it is worsening. These changes reflect increased energy consumption, the increased use of new materials and technologies, the rapid industrial-isation of low-income and middle-income countries, and the global movement of populations from rural areas into cities. Household air and water pollution, the forms of pollution that were historically associated with profound poverty and traditional lifestyles, are slowly declining. However, ambient air pollution, chemical pollution, and soil pollution, are all in creasing.10,11 Key drivers of these types of pollution are: the uncontrolled growth of cities;12 rising demands for energy; increasing
mining, smelting, and deforestation; the global spread of toxic chemicals; progressively heavier applications of insecticides and herbicides; and an increasing use of petroleum-powered cars, trucks, and buses. Increases in ambient air, soil, and chemical pollution over the past 500 years can be directly attributed to the currently prevalent, linear, take-make-use-dispose economic paradigm—termed by Pope Francis “the throwaway culture”13—in which natural resources and human capital are viewed as abundant and expendable, and the consequences of their reckless exploitation are given little heed.14,15 This economic paradigm focuses single-mindedly on GDP14 and is ultimately unsustainable: this model fails to link the economic development of human societies to social justice or to maintenance of the Earth’s resources.1,2,15
Scientific understanding of pollution and its effects on health have greatly advanced.16,17 New technologies, including satellite imaging,18 have enhanced the ability to map pollution, measure pollution levels remotely, identify sources of pollution, and track temporal trends.17 Sophisticated chemical analyses have refined under-standing of the composition of pollution and elucidated links between pollution and disease.19 Large prospective, multi-year epidemiological studies, beginning with the studies by Pope and colleagues20 in Utah and the Harvard Six-Cities study,21 have showed that pollution is associated with a much wider range of diseases, particularly non-communicable diseases, than was previously recognised. Pollution is now understood to be an important causative agent of many non-communicable diseases including asthma, cancer, neurodevelopmental disorders, and birth defects in children (appendix p 11); and heart disease, stroke, chronic obstructive pulmonary disease, and cancer in adults.22–34 In the absence of aggressive intervention, the number of deaths due to ambient air pollution are on track to increase by more than 50% by 2050.35
Despite these advances in knowledge, there are still many gaps in information about pollution and its effects on health. These gaps include an absence of information in many countries on pollution levels and the prevalence of pollution-related disease; poor knowledge of the toxic effects of many chemicals in common use, especially newer classes of chemicals;36,37 incomplete information on the scope of exposures and burden of disease associated with toxic exposures at contaminated sites;38 and inadequate information on the possible delayed effects of toxic exposures sustained in early life.39 Also unknown is the exact shape of the dose-response functions used to estimate the relative risk of disease associated with pollution. In the case of fine-particulate air pollution, for example, the shape of the exposure–response association at both very low and very high exposure levels and the assumptions that underlie the integrated exposure–response function40 used to estimate the relative risks of fine particulate (PM2·5) exposure in
(K Yumkella PhD); and School of Environment and Natural
Resources, Renmin University of China, Beijing, China
(Prof M Zhong PhD)
Correspondence to: Prof Philip J Landrigan, Arnhold
Institute for Global Health, Icahn School of Medicine at Mount
Sinai, New York, NY 10029, USA [email protected]
See Online for appendix
The Lancet Commissions
www.thelancet.com Published online October 19, 2017 http://dx.doi.org/10.1016/S0140-6736(17)32345-0 5
both the Global Burden of Disease (GBD) study41,42 and WHO analyses are not precisely known.23
The good news is that, despite the great magnitude of pollution and current gaps in knowledge about its effects on human health and the environment, pollution can be prevented. Pollution is not the inevitable con-sequence of economic development. High-income and some middle-income countries have enacted legislation and issued regulations that build on new scientific knowledge about pollution and its health effects. These laws and regulations are based on the polluter-pays principle; they mandate clean air and clean water and set standards at levels that prevent disease, have established policies for chemical safety, have banned certain hazardous pollutants such as lead, asbestos, and DDT, and have effected clean-up of the worst of the hazardous waste sites.
Many of these proven, cost-effective control strategies are now ready to be exported and adapted for use by cities and countries at every level of income. Their application in carefully planned and well resourced campaigns can enable developing and industrialising countries to avoid many of the harmful consequences of pollution—to leapfrog over the worst of the human and ecological disasters that have plagued industrial development in the past—and to improve human health and wellbeing.
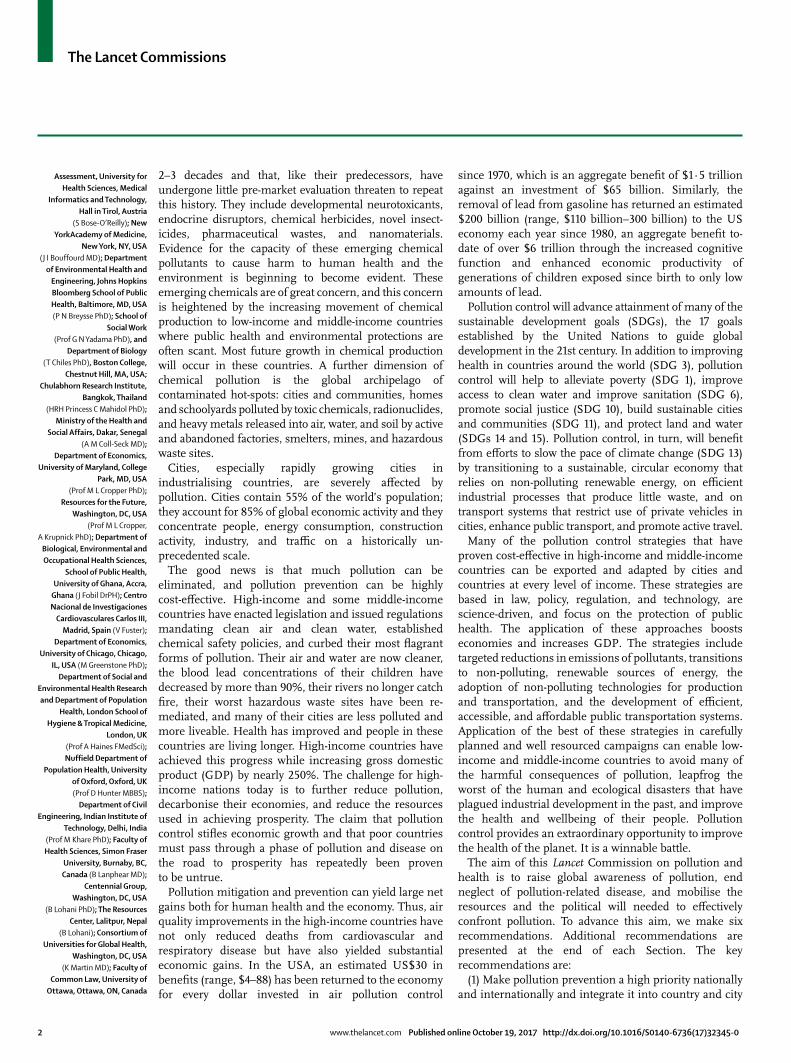
Contrary to the oft-repeated claim that pollution control stifles economic growth, pollution prevention has, in fact, been shown repeatedly to be highly cost-effective. In the USA, for example, concentrations of six common air pollutants have been reduced by about 70% since passage of the Clean Air Act in 1970 and, in the same time period, GDP has increased by nearly 250% (figure 1).43 Every dollar invested in control of ambient air pollution in the USA not only improves health,44 but also is estimated to yield US$30 in economic benefits (95% CI $4–88).45
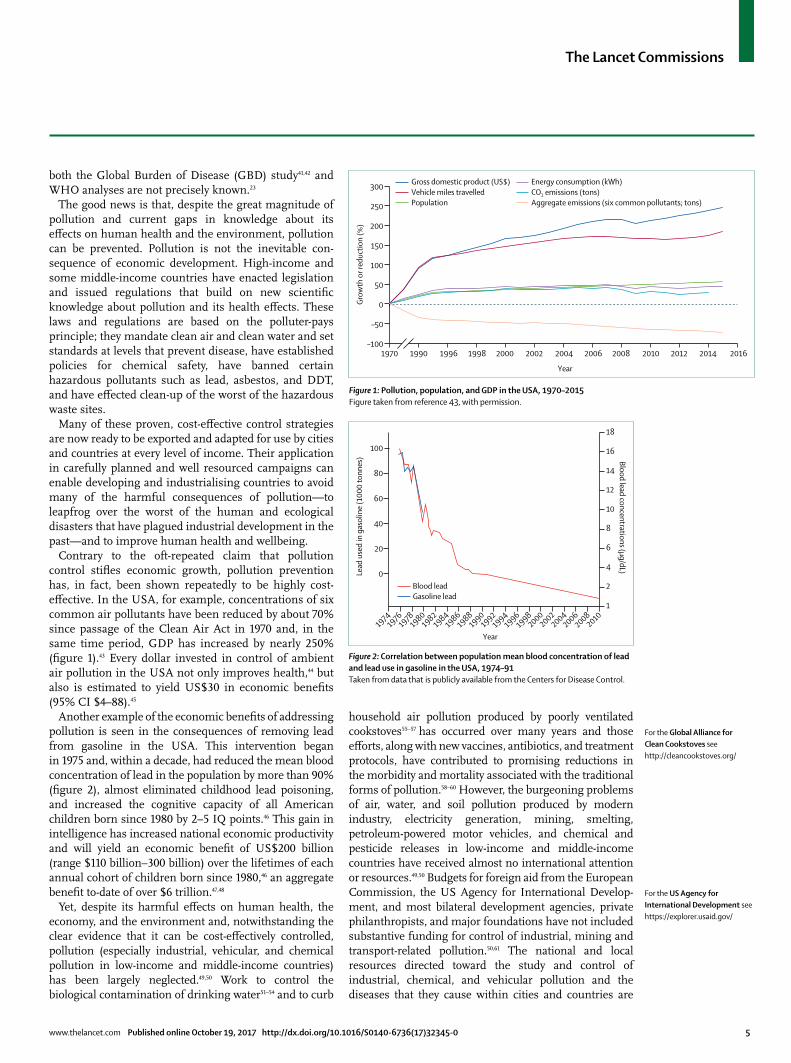
Another example of the economic benefits of addressing pollution is seen in the consequences of removing lead from gasoline in the USA. This intervention began in 1975 and, within a decade, had reduced the mean blood concentration of lead in the population by more than 90% (figure 2), almost eliminated childhood lead poisoning, and increased the cognitive capacity of all American childrenbornsince1980by2–5IQpoints.46 This gain in intelligence has in creased national economic productivity and will yield an economic benefit of US$200 billion (range $110 billion–300 billion) over the lifetimes of each annual cohort of children born since 1980,46 an aggregate benefit to-date of over $6 trillion.47,48
Yet, despite its harmful effects on human health, the economy, and the environment and, notwithstanding the clear evidence that it can be cost-effectively controlled, pollution (especially industrial, vehicular, and chemical pollution in low-income and middle-income countries) has been largely neglected.49,50 Work to control the biological contamination of drinking water51–54 and to curb
household air pollution produced by poorly ventilated cookstoves55–57 has occurred over many years and those efforts, along with new vaccines, antibiotics, and treatment protocols, have contributed to promising reductions in the morbidity and mortality associated with the traditional forms of pollution.58–60 However, the burgeoning problems of air, water, and soil pollution produced by modern industry, electricity generation, mining, smelting, petroleum-powered motor vehicles, and chemical and pesticide releases in low-income and middle-income countries have received almost no international attention or resources.49,50 Budgets for foreign aid from the European Commission, the US Agency for International Develop-ment, and most bilateral development agencies, private philanthropists, and major foundations have not included substantive funding for control of industrial, mining and transport-related pollution.50,61 The national and local resources directed toward the study and control of industrial, chemical, and vehicular pollution and the diseases that they cause within cities and countries are
Figure 1: Pollution, population, and GDP in the USA, 1970–2015Figure taken from reference 43, with permission.
–100
–50
0
50
100
150
200
250
300
Grow
th o
r red
uctio
n (%
)Year
Gross domestic product (US$) Vehicle miles travelled Population
Energy consumption (kWh) CO2 emissions (tons) Aggregate emissions (six common pollutants; tons)
1970 1990 1996 1998 2000 2002 2004 2006 2008 2010 2012 2014 2016
Figure 2: Correlation between population mean blood concentration of lead and lead use in gasoline in the USA, 1974–91Taken from data that is publicly available from the Centers for Disease Control.
19741976
19781980
19821984
19861988
19901992
18
16
14
12
10
8
6
4
2
100
80
60
40
20
0Lead
use
d in
gas
olin
e (1
000
tonn
es) Blood lead concentrations (μg/dL)
Year
1
19941996
19982000
20022004
20062008
2010
Blood leadGasoline lead
For the US Agency for International Development see https://explorer.usaid.gov/
For the Global Alliance for Clean Cookstoves see http://cleancookstoves.org/
The Lancet Commissions
6 www.thelancet.com Published online October 19, 2017 http://dx.doi.org/10.1016/S0140-6736(17)32345-0
often meagre.62 Lastly, interventions against pollution are barely mentioned in the Global Action Plan for the Prevention and Control of Non-Communicable Diseases,63 which is a major missed opportunity.
Several factors have contributed to the neglect of pollution. A persistent impediment has been the flawed conventional wisdom that pollution and disease are the unavoidable consequences of economic development, the so-called “environmental Kuznets hypothesis” (panel 1).64–73 This Commission vigorously challenges that claim as a flawed and obsolete notion formulated decades ago when pop ulations and urban centres were much smaller than they are today, the nature, sources, and health effects of pollution were very different, and cleaner fuels and modern production technologies were not yet available.
Fragmentation of the agendas for environmental health and pollution control is another factor that has contributed to neglect of pollution. In many countries, responsibility for pollution-related disease falls between ministries of health and ministries for the environment, and too often belongs to neither. Air, water, soil, and chemical pollution are each regulated by different agencies and studied by different research groups. The consequence is that the
full scale of pollution and its contribution to the global burden of disease are not recognised. The separation of public health from environmental protection has also slowed the growth of research on pollution-related disease, led to the virtual elimination of coursework in environmental health science from the curricula of most medical and nursing schools, and impeded the develop-ment of environmental health policy.
In the international development agenda, neglect of the modern forms of pollution can be traced to the historical origins of overseas development assistance programmes whose goals, when they were launched at the end of World War 2, were to reduce poverty, improve maternal and child health, and combat infectious diseases in an era when much of the world was devastated and more than 50% of countries were classified as low-income.49,50 At that time, the predominant health problems of the developing world were infectious diseases and maternal and child mortality, and many overseas development programmes have been highly successful and have contributed to the control of these problems.74 However, these programmes were never intended to address the more modern forms of pollution.
Finally, the opposition of powerful vested interests has been a perennial barrier to control of pollution, especially industrial, vehicular, and chemical pollution. These entrenched interests, which often exert disproportionate influence on government policy, impugn the science linking pollution to disease, manufacture doubt about the effectiveness of interventions, and paralyse governmental efforts to establish standards, impose pollution taxes, and enforce laws and regulations.75 These interests act both within countries and internationally.
The aim of this Lancet Commission on pollution and health is to end the neglect of pollution, especially of the modern forms of pollution, in low-income and middle-income countries, to focus the world’s attention onto the silent threat of pollution-related disease, and to mobilise the national and international resources and the political will needed to effectively confront pollution.
To accomplish this aim and to mobilise the resources that will be needed to control pollution around the world, we have reviewed data on the health effects and economic costs of all forms of pollution: pollution of air, water, and soil, pollution in the workplace, and pollution by toxic chemicals (appendix p 15). We have also examined the links between pollution and poverty, injustice, and inequality. Finally, this Commission presents examples of cost-effective, proven strategies that can be adapted by cities and countries at every level of income to control pollution and prevent disease (appendix pp 63–107).
The work of this Commission on pollution and health builds upon work undertaken in the past decade by international organisations and bi-national funders to address the challenges of modern-day pollution, such as the World Bank Water and Sanitation Programme.76,77 WHO has established a Department of Public Health
Panel 1: The environmental Kuznets curve
The Kuznets curve, developed by economist Simon Kuznets (1901–85), describes the association between economic inequality and per capita income over the course of economic development.64 This curve illustrates Kuznets’ hypothesis that, as a society develops from a primarily agrarian to an urban, industrialised economy, market forces first increase and then, at a so-called “turning point” of per-capita income, decreases the overall degree of economic inequality in the society. These trends are shown as an inverted U-shaped curve.65
The Kuznets hypothesis has been extended to environmental economics. Here, it is postulated that pollution and environmental degradation must increase in early stage economic development, that pollution will continue to increase up to a threshold of per-capita income, and that pollution will then decrease as the economy continues to grow. The postulated result is that high income and economic growth eventually lead to environmental improvements. This extension of Kuznets’ hypothesis has become entrenched as conventional wisdom in global environmental policy.66.67
Despite the great certitude with which the environmental Kuznets hypothesis is sometimes promulgated, empirical and theoretical research finds that the historical evidence in support of this hypothesis is uneven, and that the underlying statistical methods are weak.70–72 Additional shortcomings are that the environmental Kuznets hypothesis fails to consider the movement of polluting industries from high-income to low-income and middle-income countries,68 does not consider the health and environmental effects of modern classes of pollutants such as chemical carcinogens, neurotoxicants, and endocrine-disrupting chemicals,69–73 and does not consider the potential benefits to human health and the environment of newer, non-polluting energy sources.
The conclusions from this analysis are that pollution is not the unavoidable consequence of economic development, and that it is much more important to formulate sound laws, policies, and regulations to control pollution than to wait for an economy to reach a magical tipping point that will solve the problems of environmental degradation and pollution-related disease. The goal of this Commission is to catalyse the formulation of such policies.
For the World Bank Water and Sanitation Programme see
http://www.wsp.org/
The Lancet Commissions
www.thelancet.com Published online October 19, 2017 http://dx.doi.org/10.1016/S0140-6736(17)32345-0 7
For the Partnership for clean fuels and vehicles see http://www.unep.org/transport/pcfv/
For the World Bank pollution management and environmental health programme see http://www.worldbank.org/en/programs/pollution-management-and-environmental-health-program
and the Environment, which has become a global leader in documenting the effects of environmental threats to children’s health.78,79 The UN Development Programme has taken on many components of the pollution control agenda. The World Bank financially supports several projects to control pollution. The UN Environment Programme also supports several programmes to control chemical pollution, some in partnership with WHO, and supports and oversees international agreements limiting the manufacture, environmental release, and global transport of persistent pollutants,80 pesticides, hazardous waste, and mercury. The Strategic Approach to International Chemicals Management, housed within the UN Environment Programme, provides a platform for discussion on control of chemical pollution and toxic waste among a broad range of stakeholders (appendix pp 13–14). These global advances in controlling ambient air, chemical, and vehicular pollution are welcome81 and have produced important gains, such as phasing lead out from gasoline, endorsed by the Partnership for clean fuels and vehicles, incorporating air pollution into the health agenda,82 establishing programmes to control the addition of lead to paint,83 and creating a pollution-focused trust fund within the World Bank.
Pollution definedThis Commission defines pollution as unwanted, often dangerous, material that is introduced into the Earth’s environment as the result of human activity, that threatens human health, and that harms ecosystems; this definition is based on a definition of pollution developed by the European Union.84
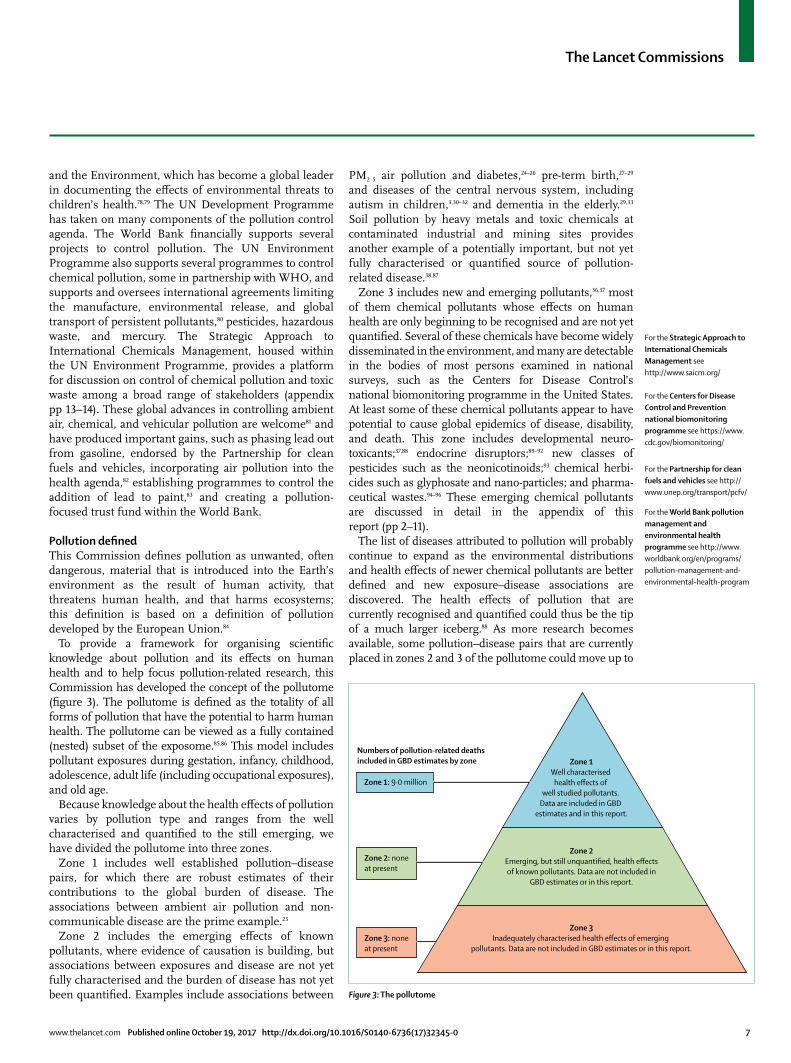
To provide a framework for organising scientific knowledge about pollution and its effects on human health and to help focus pollution-related research, this Commission has developed the concept of the pollutome (figure 3). The pollutome is defined as the totality of all forms of pollution that have the potential to harm human health. The pollutome can be viewed as a fully contained (nested) subset of the exposome.85,86 This model includes pollutant exposures during gestation, infancy, childhood, adol escence, adult life (including occupational exposures), and old age.
Because knowledge about the health effects of pollution varies by pollution type and ranges from the well characterised and quantified to the still emerging, we have divided the pollutome into three zones.
Zone 1 includes well established pollution–disease pairs, for which there are robust estimates of their contributions to the global burden of disease. The associations between ambient air pollution and non-communicable disease are the prime example.23
Zone 2 includes the emerging effects of known pollutants, where evidence of causation is building, but associations between exposures and disease are not yet fully characterised and the burden of disease has not yet been quantified. Examples include associations between
PM2·5 air pollution and diabetes,24–26 pre-term birth,27–29 and diseases of the central nervous system, including autism in children,3,30–32 and dementia in the elderly.29,33 Soil pollution by heavy metals and toxic chemicals at contaminated industrial and mining sites provides another example of a potentially important, but not yet fully characterised or quantified source of pollution-related disease.38,87
Zone 3 includes new and emerging pollutants,36,37 most of them chemical pollutants whose effects on human health are only beginning to be recognised and are not yet quantified. Several of these chemicals have become widely disseminated in the environment, and many are detectable in the bodies of most persons examined in national surveys, such as the Centers for Disease Control’s national biomonitoring programme in the United States. At least some of these chemical pollutants appear to have potential to cause global epidemics of disease, disability, and death. This zone includes developmental neuro-toxicants;37,88 endocrine disruptors;89–92 new classes of pesticides such as the neonicotinoids;93 chemical herbi-cides such as glyphosate and nano-particles; and pharma-ceutical wastes.94–96 These emerging chemical pollu tants are discussed in detail in the appendix of this report (pp 2–11).
The list of diseases attributed to pollution will probably continue to expand as the environmental distributions and health effects of newer chemical pollutants are better defined and new exposure–disease associations are discovered. The health effects of pollution that are currently recognised and quantified could thus be the tip of a much larger iceberg.88 As more research becomes available, some pollution–disease pairs that are currently placed in zones 2 and 3 of the pollutome could move up to
For the Strategic Approach to International Chemicals Management see http://www.saicm.org/
Figure 3: The pollutome
Zone 1Well characterised
health effects of well studied pollutants.
Data are included in GBD estimates and in this report.
Zone 2Emerging, but still unquantified, health effectsof known pollutants. Data are not included in
GBD estimates or in this report.
Zone 3Inadequately characterised health effects of emerging
pollutants. Data are not included in GBD estimates or in this report.
Zone 1: 9·0 million
Zone 2: noneat present
Zone 3: none at present
Numbers of pollution-related deaths included in GBD estimates by zone
For the Centers for Disease Control and Prevention national biomonitoring programme see https://www.cdc.gov/biomonitoring/

The Lancet Commissions
8 www.thelancet.com Published online October 19, 2017 http://dx.doi.org/10.1016/S0140-6736(17)32345-0
zone 1 and be included in future estimates of the global burden of disease. The numbers of deaths attributable to the forms of pollution included in zones 2 and 3 are unknown.
This Commission’s work has been informed by the work of previous Lancet Commissions and Series, notably the Commission on Investing in Health,72 the Commission on the Political Origins of Health Inequity,73 the Commission on Health and Climate Change,97 and the Series on Public Health Benefits of Climate Change Mitigation Policies.98 This Commission’s deliberations were guided particularly closely by the findings of The Rockefeller Foundation-Lancet Commission on Planetary Health15 whose 2015 report described how human activity is changing the global environment, increasing risk of disease, and threatening the conditions that, ultimately, sustain all life on Earth.
This Commission was guided further by influential reports from international agencies, among them the 2016 report from WHO,99 Preventing Disease through Health Environments, the World Bank’s Shock Waves report100 on climate change and global poverty, the World Bank’s report,77 Clean Air and Healthy Lungs, and the United Nations Environment report,101 Costs of Inaction on the Sound Management of Chemicals.
This report is organised into five Sections. Section 1 synthesises information on the burden of disease
attributable to pollution using data from the GBD 2015 Study41,42 coordinated by the Institute for Health Metrics and Evaluation, and supplemented by data from WHO99,102 and from Pure Earth.38 Section 2 examines data on the economic costs of pollution and presents a detailed analysis of the economic losses that result from pollution-related disease. Section 3 examines the links between pollution, disease, and poverty and documents the marked inequities that characterise the global distrib-ution of pollution and pollution-related disease and the disproportionate effects of pollution on children, the poor, the elderly, and other vulnerable populations. Section 4 presents pathways and priorities, case studies, and proven interventions that can be adopted and deployed to control pollution, prevent disease, and advance economic development. Section 5 outlines the Commission’s plans for future initiatives.
Sustainable long-term control of pollution will require that societies at every level of income move away from the prevalent resource-intensive, and inherently wasteful, linear take-make-use-dispose economic paradigm, towards a new paradigm rooted in the concept of the circular economy (panel 2).15,103,104 In a circular economy, pollution is reduced through the creation of durable, long-lasting products, the reduction of waste by large-scale recycling, reuse, and repair, the removal of distorting subsidies, the replacement of hazard ous materials with safer alternatives, and strict enforce ment of pollution taxes.105 A circular economy conserves and increases resources, rather than taking and depleting them. This societal transition is essential for promoting smart, sustainable, and inclusive growth that reduces pollution, promotes health, and prevents disease.104
Limitations of the CommissionThe Commission’s economic analysis does not include information about the costs of environmental damage caused by pollution. The Commission recognises that the ecological damages due to pollution are substantial, but considered analyses of the costs of these damages to fall outside of the scope of our work.
Levels of pollution are changing and pollution caused by industrial, vehicular, and chemical emissions is increasing in many rapidly developing countries, but the Commission’s analysis is based on data from the 2015 Global Burden of Disease study, information that is now 2 years old.
Section 1: The burden of disease attributable to pollutionIn this Section, we review data for the global burden of disease and death attributable to pollution.23,38,42,99,106
MethodsThis review of the burden of disease and premature death due to pollution is based on a method for assessing disease burden that was developed in the 1980s by
Panel 2: Circular economy
A circular economy is an economic model that decouples development from the consumption of non-renewable resources and minimises the generation of pollution and other forms of waste by recycling and reuse.104 In a fully circular economy, the only new inputs are renewable materials, and all non-renewable materials are recycled. The underlying assumption is that waste is an inherent inefficiency, a loss of materials from the system, and thus a cost.104 Transition towards a circular economy will reduce pollution-related disease and improve health.
The three core principles of the circular economy are preservation of natural capital by reducing use of non-renewable resources and ecosystem management; optimisation of resource yields by circulating products and materials so that they are shared and their lifecycles extended; and fostering system effectiveness by designing out pollution, greenhouse gas emissions, and toxic materials that damage health.
The steps needed for transition towards a circular economy include large-scale transition to non-polluting sources of energy (wind, solar, and tidal), the production of durable products that require lower quantities of materials and less energy to manufacture than those being produced at present; incentivisation of recycling, re-use, and repair; and replacement of hazardous materials with safer alternatives.15
The Lancet Commissions
www.thelancet.com Published online October 19, 2017 http://dx.doi.org/10.1016/S0140-6736(17)32345-0 9
WHO.107,108 The core of this approach is the disability-adjusted life-year (DALY) concept, a summary metric of population health that combines information on mortality and disease into a single number to represent the health of a population, thus permitting comparisons of disease burden between countries, between diseases, and over time. The DALY method is at the core of the GBD project, a multinational study initiated by WHO in partnership with the World Bank and the Harvard School of Public Health,108 and sustained today by WHO102 and the Institute for Health Metrics and Evaluation.41,42
To examine the global burden of disease attributable to pollution risk factors, this Commission has relied principally on the 2015 estimates from the GBD study,41,42,106 coordinated by the Institute for Health Metrics and Evaluation. We also examine data from the 2012 WHO analysis99,102,109,110 of the global burden of disease caused by living and working in unhealthy environments.
Following the standard conservative practice of the GBD study42,106 and WHO,99 this Commission has restricted its review to combinations of pollution risk factors and disease for which there is convincing or probable evidence of causal association. For this reason, numbers presented are likely to be underestimates of the full burden of disease attributable to the pollutome (figure 3).
In reviewing data on the burden of disease attributable to soil pollution caused by toxic chemicals and heavy metals at contaminated sites, this Commission has relied on information provided by the Blacksmith Institute/Pure Earth Toxic Sites Identification programme.38 This programme obtains data on pollution caused by chemi-cals and metals at contaminated sites through field studies that use a protocol adapted from a US Environmental Protection Agency assessment tool.111 Two particularly common types of contaminated sites are used lead-acid battery recycling sites, where lead is the principal pollutant, and artisanal and small-scale gold mining sites, where the principal pollutant is elemental mercury (which is used to extract gold from ore). We used the methods of Ericson and colleagues111 to assess the burden of disease associated with lead-acid battery recycling sites, and the methods and data of Steckling and colleagues112,113 to assess the burden of disease associated with gold mining sites114–116 These methods are described in detail in the appendix (pp 16–19).
The pollution risk factors examined by the Commission were: (1) air pollution: household air pollution, ambient fine particulate pollution (PM2·5), and tropospheric ozone pollution; (2) water pollution: unsafe sanitation, and unsafe water sources; (3) soil, chemical, and heavy metal pollution: lead (including contaminated sites polluted by lead from battery recycling operations), and mercury from gold mining; and (4) occupational pollution: occupational carcinogens, and occupational particulates, gases, and fumes.
In reviewing disease burden in relation to national income, we have relied on the 2015 World Bank income classifications (high, upper middle, lower middle, and low). In reviewing disease burden in relation to geo-graphical region, we have grouped countries using the regional groupings defined by WHO (Africa, eastern Mediterranean, Europe, Americas, southeast Asia, and western Pacific).
To examine temporal trends in the global burden of disease that are attributable to different forms of pollution, we have divided pollution into two broad cate-gories: pollution linked to poverty and pollution linked to industrial development. Pollution linked to poverty includes household air pollution, unsafe water sources, and inadequate sanitation, the forms of pollution associated with profound poverty and trad itional lifestyles in low-income and middle-income countries. Pollution linked to industrial development includes pollution produced by industrial emissions, vehicular exhausts, and chemical releases, and includes ambient fine part-iculate (PM2·5) pollution, tropospheric ozone pollution, toxic occupational exposures, and soil pollution caused by heavy metals and toxic chemicals, including lead.
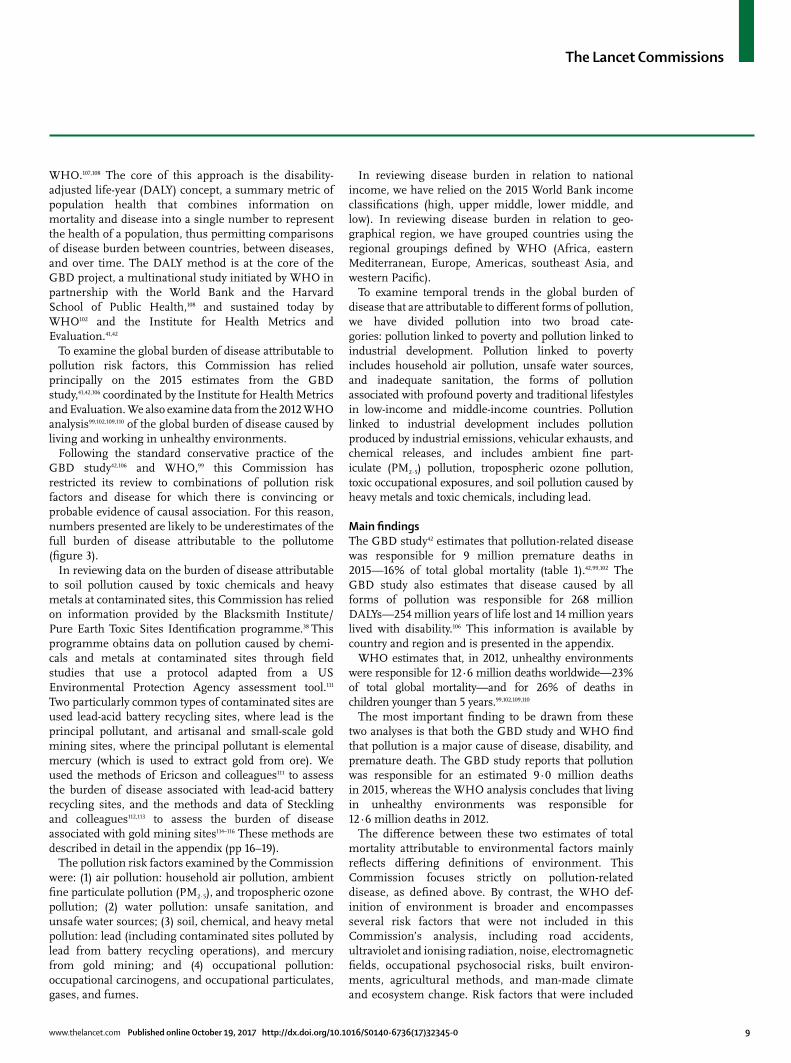
Main findingsThe GBD study42 estimates that pollution-related disease was responsible for 9 million premature deaths in 2015—16% of total global mortality (table 1).42,99,102 The GBD study also estimates that disease caused by all forms of pollution was responsible for 268 million DALYs—254 million years of life lost and 14 million years lived with disability.106 This information is available by country and region and is presented in the appendix.
WHO estimates that, in 2012, unhealthy environments were responsible for 12·6 million deaths worldwide—23% of total global mortality—and for 26% of deaths in children younger than 5 years.99,102,109,110
The most important finding to be drawn from these two analyses is that both the GBD study and WHO find that pollution is a major cause of disease, disability, and premature death. The GBD study reports that pollution was responsible for an estimated 9·0 million deaths in 2015, whereas the WHO analysis concludes that living in unhealthy environments was responsible for 12·6 million deaths in 2012.
The difference between these two estimates of total mortality attributable to environmental factors mainly reflects differing definitions of environment. This Commission focuses strictly on pollution-related disease, as defined above. By contrast, the WHO def-inition of environment is broader and encompasses several risk factors that were not included in this Commission’s analysis, including road accidents, ultraviolet and ionising radi ation, noise, electromagnetic fields, occupational psycho social risks, built environ-ments, agricultural methods, and man-made climate and ecosystem change. Risk factors that were included
The Lancet Commissions
10 www.thelancet.com Published online October 19, 2017 http://dx.doi.org/10.1016/S0140-6736(17)32345-0
in the WHO analysis and not in this Commission account for more than 3 million deaths each year, thus explaining most of the apparent discrepancy between the two estimates (panel 3).117–120
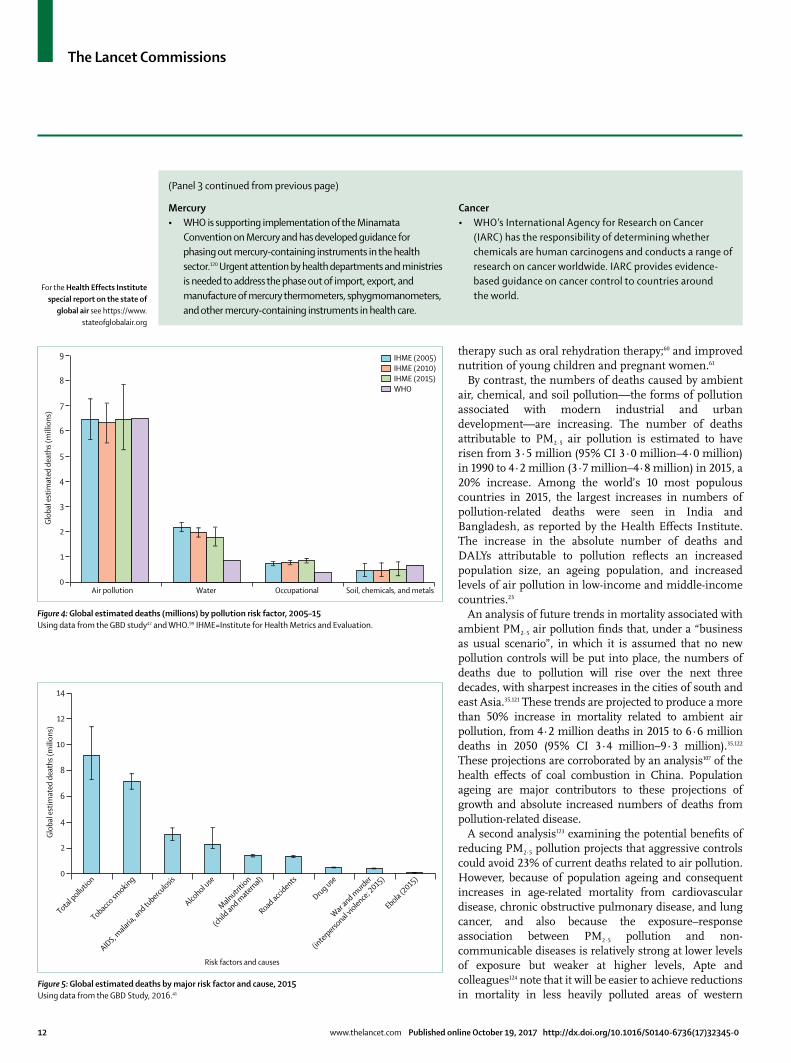
Some specific differences are seen between the two sets of estimates (figure 4).42,99 For example, the GBD study estimates that 4·2 million deaths in 2015 were because of ambient air pollution, whereas WHO attributes 3·7 million deaths in 2012 to this risk factor. The two analyses relied on similar approaches to comparative risk assessment, on the same sources of exposure data, and on the same integrated exposure–response functions40 but, in 2014, the GBD study made changes to their computational methodology,42 which appears to account for most of the divergence.
The GBD study estimated that 2·9 million deaths in 2015 were associated with household air pollution, whereas WHO estimated 4·3 million related deaths in 2012. This difference can partly be explained by different approaches in quantifying exposure–outcome associations. The GBD study relied on the integrated exposure–response curve40 to provide evidence for the effect size of non-communicable diseases, whereas WHO adapted relative risks for certain non-communicable diseases based on epidemiological evidence. Additionally, the GBD study has expanded data sources for personal exposure values for women, men, and children in the past 2 years.
The GBD study estimated that, in 2015, 1·8 million deaths resulted from diseases related to water pollution, whereas WHO estimated 0·84 million related deaths in 2012. This divergence appears largely to reflect
differing definitions of access to safe water. The GBD study considers access to safe water at both the water’s source and at the point of use, whereas WHO only considers access to an improved water source.
Diseases caused by all forms of pollution were responsible for an estimated 9 million deaths in 2015.41 Pollution is thus responsible for more deaths than a high-sodium diet (4·1 million), obesity (4·0 million), alcohol (2·3 million), road accidents (1·4 million), or child and maternal malnutrition (1·4 million). Pollution was also responsible for three times as many deaths as AIDS, tuberculosis, and malaria combined (figure 5)41 and for nearly 15 times as many deaths as war and all forms of violence.41 Only dietary risk factors (all combined) (12·1 million) and hyper-tension (10·7 million) caused more deaths than pollution; however, the Commission notes that approximately 2·5% of deaths due to hypertension are attributable to lead.
Pollution and non-communicable diseasesNon-communicable diseases account for most of the total burden of disease due to pollution—approximately 71%.41 In 2015, all forms of pollution combined were responsible for 21% of all deaths from cardiovascular disease, 26% of deaths due to ischaemic heart disease, 23% of deaths due to stroke, 51% of deaths due to chronic obstructive pulmonary disease, and 43% of deaths due to lung cancer (figure 6).42
The relative risks of all non-communicable diseases associated with pollution increase as exposure to pollution increases. An integrated exposure–response function has been developed to describe these associations, and the health effects of air pollution are quantitatively consistent with those of tobacco smoke when their relative risks are plotted against a common metric of exposure to airborne fine particulates.121
The sources and nature of pollution change as countries develop and industrialise (figure 7).10,42 An unsafe water source, unsafe sanitation, and household air pollution are considered to be forms of pollution linked to poverty and the early stages of industrial development. Airborne fine particulate pollution, tropospheric ozone pollution, occupational chemical pollution, and soil pollution by heavy metals and chemicals (including lead) are considered to be forms of pollution linked to industrial development.
Changes to the distribution of pollution-related diseases occur in response to the changes that accompany development.11 Thus deaths from pneumonia and diarrhoeal diseases—the diseases associated with household air pollution, water pollution, and poor sanitation—are slowly declining worldwide, although they still kill millions of people, particularly children in poor countries. These declines reflect reductions in the forms of pollution associated with traditional lifestyles in low-income and middle-income countries, and the advent of new vaccines such as the pneumococcal vaccine and the rotavirus vaccine;59 new approaches to paediatric
GBD study best estimate (95% CI)
WHO best estimate (95% CI)
Air (total) 6·5 (5·7–7·3) 6·5 (5·4–7·4)
Household air 2·9 (2·2–3·6) 4·3 (3·7–4·8)
Ambient particulate 4·2 (3·7–4·8) 3·0 (3·7–4·8)
Ambient ozone 0·3 (0·1–0·4) ··
Water (total) 1·8 (1·4–2·2) 0·8 (0·7–1·0)
Unsafe sanitation 0·8 (0·7–0·9) 0·3 (0·1–0·4)
Unsafe source 1·3 (1·0–1·4) 0·5 (0·2–0·7)
Occupational 0·8 (0·8–0·9) 0·4 (0·3–0·4)
Carcinogens 0·5 (0·5–0·5) 0·1 (0·1–0·1)
Particulates 0·4 (0·3–0·4) 0·2 (0·2–0·3)
Soil, heavy metals, and chemicals
0·5 (0·2–0·8) 0·7 (0·2–0·8)
Lead 0·5 (0·2–0·8) 0·7 (0·2–0·8)
Total 9·0 8·4
Note that the totals for air pollution, water pollution, and all pollution are less than the arithmetic sum of the individual risk factors within each of these categories because these have overlapping contributions—eg, household air pollution also contributes to ambient air pollution and vice versa.
Table 1: Global estimated deaths (millions) due to pollution risk factors from the Global Burden of Disease study (GBD; 2015)42 versus WHO data (2012)99,101

The Lancet Commissions
www.thelancet.com Published online October 19, 2017 http://dx.doi.org/10.1016/S0140-6736(17)32345-0 11
Panel 3: WHO’s programme on pollution and health
WHO has, for several decades, been a leader in conducting crucial evaluations of the health effects of pollution, and these assessments provide the scientific basis for pollution control policies in many countries. WHO is also a global leader in providing guidelines and in coordinating health-focused partnerships for pollution control.
WHO is now further expanding this work through the framework of the Sustainable Development Goals (SDGs). WHO is the custodian agency that monitors progress towards six SDG targets; this monitoring includes tracking several targets measuring the environmental health-related burden of disease within SDG 3. The following are examples of this work:
Ambient air pollution• WHOhasperiodicallyreviewedtheinternationalliterature
on air pollution and developed Global Air Quality Guidelines.117 These are the primary reference points for air pollution standards worldwide. The latest version was published in 2006,117 and a committee has been formed to create an updated version in 2018.
• WHOhostsoneofthelargestdatabasesofambientairpollution measurements in cities. Currently, the publicly available WHO Global Urban Ambient Air Pollution Database contains air quality measurements from 3000 cities, representing 103 countries. In the past 2 years alone, the database has nearly doubled in size, with more cities now measuring air pollution concentrations and recognising the associated health effects than ever before. This database also provides inputs to the integrated models that use satellite remote-sensing and chemical transport models to estimate ambient air pollution exposure globally, including estimates for regions without any ground-level monitoring (eg, smaller cities and rural areas). The Global Urban Ambient Air Pollution Database also supports monitoring of urban air quality for SDG 11 indicator 11·6: “to reduce the adverse per capita environmental impact of cities, including by paying special attention to air quality and municipal and other waste management”.118
Household air pollution• WHOhasdevelopedguidelines119 for indoor air quality
regarding household fuel combustion, which clarified the enormous health risks of burning kerosene, coal, and wood in the home, and has provided emission standards for home energy equipment used in cooking, heating, and lighting. This work filled a gap in health guidance for household energy interventions and is increasingly being adopted by development partners investing in improving access to energy in the homes of the poor worldwide.
• WHOhasdevelopedseveraltoolsandtrainingprogrammesto build the capacity and understanding of countries and actors working in different sectors to effectively address household energy as a health risk. WHO is currently developing a Clean Household Energy Solution Toolkit (CHEST) to provide the guidance and tools necessary for countries to implement the WHO Guidelines for Indoor Air Quality: Household Fuel Combustion.119
• MonitoringaccesstocleanenergyinthehomeisledbyWHO in close cooperation with partners performing household surveys (UNICEF, USAID, and the World Bank). The associated indicator, 7·1·2—the “proportion of population with primary reliance on clean fuels and technology”—is part of the Global Tracking Framework of Sustainable Energy for All and is used to show progress towards SDG 7, which follows WHO guidelines criteria.
Climate, pollution, and health• WHO,theClimateandCleanAirCoalition,andUN
Environment Programme have joined forces in the BreatheLife campaign to address the associated crises of air pollution and climate change. The campaign was announced in July, 2016, and launched at Habitat III in Quito, Ecuador.
Urban health• WHOhasestablishedtheUrbanHealthInitiativetoreduce
deaths and diseases associated with air and climate pollutants in cities, while enhancing health benefits from the policies and measures used to tackle climate pollution.
Water and sanitation• WHOhasproducedauthoritativeguidelinesandtechnical
assistance on management of water quality, sanitation, and wastewater, and health for decades. Along with UNICEF, WHO is responsible for tracking the extent of human exposure to poor water, inadequate sanitation, and poor hygiene.
Toxic chemicals• WHOistheleadinginternationalagencyforchemicalsafety
through its Intergovernmental Panel on Chemical Safety, which sets guidelines for dozens of commonly used chemicals. The importance of chemicals management is reflected by SDG target 3·9 on reducing deaths and illness from hazardous chemicals, and links to target 12·4 on the sound management of chemicals and wastes. Achievement of sound chemicals management requires a multisector, multistakeholder approach. To advance this work, the 2017 World Health Assembly approved a Chemicals Road Map to enhance the engagement of the health sector in the management of international chemicals.
(Continues on next page)
For the WHO Global Urban Ambient Air Pollution Database see www.who.int/phe/health_topics/outdoorair/databases/cities
For the WHO Chemicals Road Map see www.who.int/ipcs/saicm/roadmap
The Lancet Commissions
12 www.thelancet.com Published online October 19, 2017 http://dx.doi.org/10.1016/S0140-6736(17)32345-0
therapy such as oral rehydration therapy;60 and improved nutrition of young children and pregnant women.61
By contrast, the numbers of deaths caused by ambient air, chemical, and soil pollution—the forms of pollution associated with modern industrial and urban development—are increasing. The number of deaths attributable to PM2·5 air pollution is estimated to have risen from 3·5 million (95% CI 3·0 million–4·0 million) in 1990 to 4·2 million (3·7 million–4·8 million) in 2015, a 20% increase. Among the world’s 10 most populous countries in 2015, the largest increases in numbers of pollution-related deaths were seen in India and Bangladesh, as reported by the Health Effects Institute. The increase in the absolute number of deaths and DALYs attributable to pollution reflects an increased population size, an ageing population, and increased levels of air pollution in low-income and middle-income countries.23
An analysis of future trends in mortality associated with ambient PM2·5 air pollution finds that, under a “business as usual scenario”, in which it is assumed that no new pollution controls will be put into place, the numbers of deaths due to pollution will rise over the next three decades, with sharpest increases in the cities of south and east Asia.35,121 These trends are projected to produce a more than 50% increase in mortality related to ambient air pollution, from 4·2 million deaths in 2015 to 6·6 million deaths in 2050 (95% CI 3·4 million–9·3 million).35,122 These projections are corroborated by an analysis107 of the health effects of coal combustion in China. Population ageing are major contributors to these projections of growth and absolute increased numbers of deaths from pollution-related disease.
A second analysis123 examining the potential benefits of reducing PM2·5 pollution projects that aggressive controls could avoid 23% of current deaths related to air pollution. However, because of population ageing and consequent increases in age-related mortality from cardiovascular disease, chronic obstructive pulmonary disease, and lung cancer, and also because the exposure–response association between PM2·5 pollution and non-communicable diseases is relatively strong at lower levels of exposure but weaker at higher levels, Apte and colleagues124 note that it will be easier to achieve reductions in mortality in less heavily polluted areas of western
(Panel 3 continued from previous page)
Mercury• WHOissupportingimplementationoftheMinamata
Convention on Mercury and has developed guidance for phasing out mercury-containing instruments in the health sector.120 Urgent attention by health departments and ministries is needed to address the phase out of import, export, and manufacture of mercury thermometers, sphygmomanometers, and other mercury-containing instruments in health care.
Cancer• WHO’sInternationalAgencyforResearchonCancer
(IARC) has the responsibility of determining whether chemicals are human carcinogens and conducts a range of research on cancer worldwide. IARC provides evidence-based guidance on cancer control to countries around the world.
Figure 4: Global estimated deaths (millions) by pollution risk factor, 2005–15Using data from the GBD study42 and WHO.99 IHME=Institute for Health Metrics and Evaluation.
Air pollution
Glob
al e
stim
ated
dea
ths (
mill
ions
)
Water Occupational Soil, chemicals, and metals 0
1
2
3
4
5
6
7
8
9 IHME (2005) IHME (2010) IHME (2015) WHO
Figure 5: Global estimated deaths by major risk factor and cause, 2015Using data from the GBD Study, 2016.41
Risk factors and causes
Total pollu
tion
Tobacco sm
oking
AIDS, malaria
, and tubercu
losis
Alcohol u
se
Malnutritio
n
Road accidents
Drug use
War and m
urder
Ebola (2015)0
2
4
6
8
10
12
14
Glob
al e
stim
ated
dea
ths (
mili
ons)
(child
and maternal)
(interperso
nal violence; 2015)
For the Health Effects Institute special report on the state of
global air see https://www.stateofglobalair.org

The Lancet Commissions
www.thelancet.com Published online October 19, 2017 http://dx.doi.org/10.1016/S0140-6736(17)32345-0 13
Europe and North America than in heavily polluted regions in Asia.
Geography of pollutionIn 2015, the greatest numbers of deaths due to pollution occurred in southeast Asia (3·2 million deaths) and the western Pacific (2·2 million deaths; figure 8).42 In this definition, southeast Asia includes India and the western Pacific region includes China. The highest population-based estimates of premature death and disease due to pollution are seen in the low-income countries of sub-Saharan Africa.42
Pollution and poverty92% of all pollution-related mortality is seen in low-income and middle-income countries, with the greatest numbers of deaths from pollution-related disease occurring in rapidly developing and industrialising lower-middle-income countries (figure 9).42 In the most severely affected countries, pollution is responsible for more than one in four deaths.42 In countries at every level of income, the health effects of pollution are most frequent and severe among the poor and the marginalised. Further discussion of the links between pollution, disease, and poverty is presented in section 3 of this report.
Disease and death due to pollution occur most frequently in the very young and the very old. Deaths due to all forms of pollution show a peak among children younger than 5 years of age, but most pollution-related deaths occur among adults older than 60 years of age (figure 10).42 By contrast, DALYs resulting from pollution-related disease are highly concentrated among infants and young children, reflecting the many years of life lost with each death and case of disabling disease of a child (figure 11).42
Air pollutionTwo types of air pollution—household air pollution and ambient air pollution—and two airborne pollutants—fine particulates and ozone—are considered in this Comm-ission.23 Pollution caused by oxides of nitrogen and by some short-lived climate pollutants is not fully accounted for in this Commission because the burden of disease due to these forms of air pollution is not separately quantified in the GBD study.
Although household and ambient air pollution are considered separately in deriving estimates of disease burden,42,99 they are both comprised of many of the same pollutants and often co-exist; for example, in low-income and middle-income countries, household cooking contributes to ambient particulate air pollution.55,56 Accordingly, the total numbers of deaths attributed to air pollution in the GBD study and in the WHO estimates are less than the arithmetic sum of the number of deaths attributed to each form of pollution alone.35,99,125
Air pollution disperses globally. Airborne pollutants travel across national boundaries, continents, and oceans.126–128 An analysis129 of emissions from Chinese export manufacturers found that, on days with strong westerly winds (winds blowing from China across the Pacific), 12–24% of sulphate concentrations, 2–5% of ozone, 4–6% of carbon monoxide, and up to 11% of black carbon pollution detected in the western USA were of Chinese origin.
Figure 6: Estimated contributions of all pollution risk factors to deaths caused by non-communicable diseases, 2015GBD Study, 2016.42
Figure 7: Estimated global deaths (millions) by pollution category, 1990–2015GBD Study, 2016.42 All modern=modern forms of pollution, comprising ambient air, chemical, occupational, and soil pollution. All traditional=traditional forms of pollution, comprising household air and water pollution.
Chronic obstr
uctive
Estim
ated
cont
ribut
ions
of a
ll po
llutio
n ris
k fa
ctor
sto
dea
ths c
ause
d by
non
-com
mun
icabl
e di
seas
e (%
)
Lung cancer
Ischaemic h
eart dise
ase
Ischaemic a
nd
All cardiovascu
lar dise
ase0
10
20
30
40
50
60
pulmomary dise
ase
haemorrhagic s
troke
0
1
2
3
4
5
6
7
1990 1995 2000 2005 2010 2015
Estim
ated
glo
bal d
eath
s att
ribut
ed to
pol
lutio
n (m
illio
ns)
Year
All traditional All modern

The Lancet Commissions
14 www.thelancet.com Published online October 19, 2017 http://dx.doi.org/10.1016/S0140-6736(17)32345-0
Air pollution and diseasePM2·5 is the best studied form of air pollution and is linked to a wide range of diseases in several organ systems.23,130 The strongest causal associations are seen between PM2·5 pollution and cardiovascular and pulmonary disease. Specific causal associations have been established between PM2·5 pollution and myocardial infarction,131–137 hyper-tension,138 congestive heart failure, arrhythmias,139 and cardiovascular mortality.24,140–143 Causal associations have also been established between PM2·5 pollution and chronic obstructive pulmonary disease and lung cancer.42 The International Agency for Research on Cancer has reported that airborne particulate matter and ambient air pollution are proven group 1 human carcinogens.34,40,144
Fine particulate air pollution is associated with several risk factors for cardiovascular disease, including: hypertension,138 increased serum lipid concentrations,145 accelerated progression of atherosclerosis,146–148 increased prevalence of cardiac arrhythmias,139 increased numbers of visits to emergency departments for cardiac conditions,132,133 increased risk of acute myocardial infarction,131 and increased mortality from cardiovascular disease142 and stroke.149
Clinical and experimental studies suggest that fine airborne particles increase risk of cardiovascular dis-ease by inducing atherosclerosis, increasing oxidative stress, increasing insulin resistance, promoting endo-thelial dysfunction, and enhancing propensity to coag-ulation.145,147,148,150
Emerging evidence suggests that additional causal associations may exist between PM2·5 pollution and several highly prevalent non-communicable diseases. These include diabetes,25 decreased cognitive function, attention-deficit or hyperactivity disorder and autism in
children,30,31,151,152 and neurodegenerative disease, including dementia, in adults.28,29,33 PM2·5 pollution may also be linked to increased occurrence of premature birth and low birthweight.27,153–159 Some studies have reported an association between ambient air pollution and increased risk of sudden infant death syndrome.160 These associ-ations are not yet firmly established, and the burden of disease associated with them has not yet been quantified, and they are therefore included in zone 2 of the pollutome (figure 3).
Water pollutionThis Commission considers two types of water pollution: unsafe water source and inadequate sanitation.51 Many areas in low-income and middle-income countries lack
Figure 8: Number of deaths per 100 000 people that are attributable to all forms of pollution, 2015GBD Study, 2016.42
Deaths per 100 000 peopleattributable to pollution
No data<5051–7576–100101–150151–316
1000 2000 4000 6000 8000 10 0000 km
Figure 9: Estimated deaths by pollution risk factor and country income level, 2015GBD Study, 2016.42
0
1
2
3
4
5
6
Low countryincome level
Estim
ated
glo
bal d
eath
s (m
illio
ns)
Lower middlecountry income
level
Upper middlecountry income
level
High countryincome level
Soil, chemicals, and metals Occupation Water Air
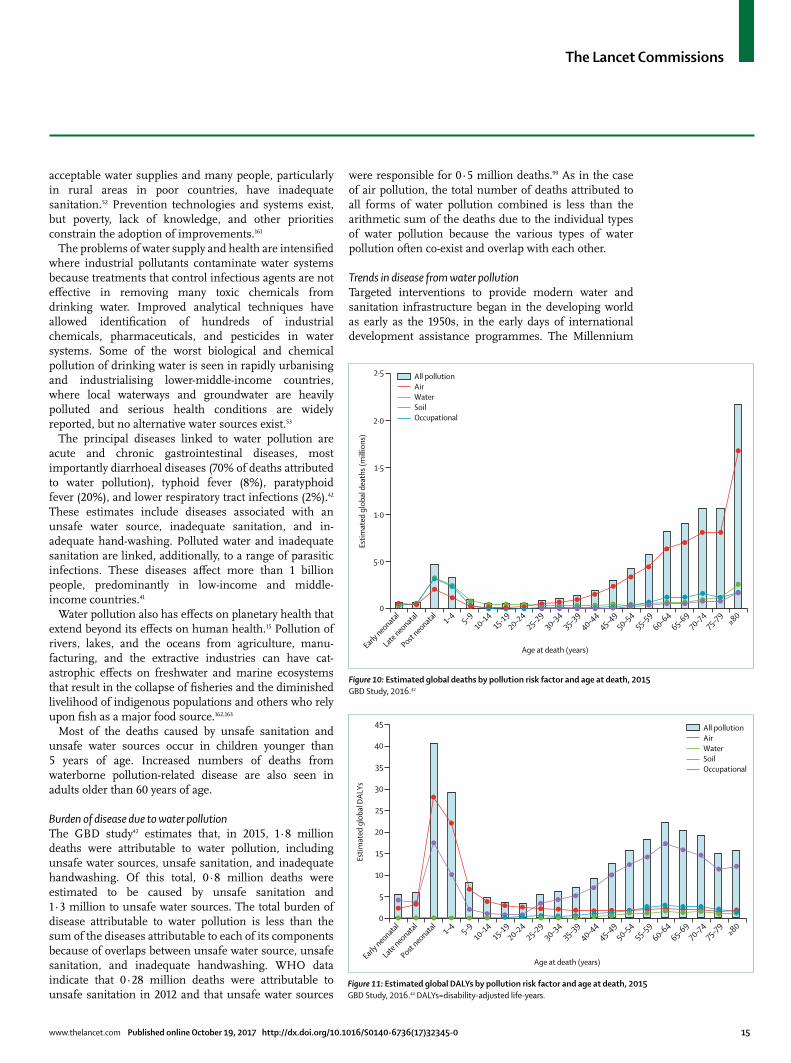
The Lancet Commissions
www.thelancet.com Published online October 19, 2017 http://dx.doi.org/10.1016/S0140-6736(17)32345-0 15
acceptable water supplies and many people, particularly in rural areas in poor countries, have inadequate sanitation.52 Prevention technologies and systems exist, but poverty, lack of knowledge, and other priorities constrain the adoption of improvements.161
The problems of water supply and health are intensified where industrial pollutants contaminate water systems because treatments that control infectious agents are not effective in removing many toxic chemicals from drinking water. Improved analytical techniques have allowed identification of hundreds of industrial chemicals, pharmaceuticals, and pesticides in water systems. Some of the worst biological and chemical pollution of drinking water is seen in rapidly urbanising and industrialising lower-middle-income countries, where local waterways and groundwater are heavily polluted and serious health conditions are widely reported, but no alternative water sources exist.53
The principal diseases linked to water pollution are acute and chronic gastrointestinal diseases, most importantly diarrhoeal diseases (70% of deaths attributed to water pollution), typhoid fever (8%), paratyphoid fever (20%), and lower respiratory tract infections (2%).42 These estimates include diseases associated with an unsafe water source, inadequate sanitation, and in-adequate hand-washing. Polluted water and inadequate sanitation are linked, additionally, to a range of parasitic infections. These diseases affect more than 1 billion people, predominantly in low-income and middle-income countries.41
Water pollution also has effects on planetary health that extend beyond its effects on human health.15 Pollution of rivers, lakes, and the oceans from agriculture, manu-facturing, and the extractive industries can have cat-astrophic effects on freshwater and marine ecosystems that result in the collapse of fisheries and the diminished livelihood of indigenous populations and others who rely upon fish as a major food source.162,163
Most of the deaths caused by unsafe sanitation and unsafe water sources occur in children younger than 5 years of age. Increased numbers of deaths from waterborne pollution-related disease are also seen in adults older than 60 years of age.
Burden of disease due to water pollutionThe GBD study42 estimates that, in 2015, 1·8 million deaths were attributable to water pollution, including unsafe water sources, unsafe sanitation, and inadequate handwashing. Of this total, 0·8 million deaths were estimated to be caused by unsafe sanitation and 1·3 million to unsafe water sources. The total burden of disease attributable to water pollution is less than the sum of the diseases attributable to each of its components because of overlaps between unsafe water source, unsafe sanitation, and inadequate handwashing. WHO data indicate that 0·28 million deaths were attributable to unsafe sanitation in 2012 and that unsafe water sources
were responsible for 0·5 million deaths.99 As in the case of air pollution, the total number of deaths attributed to all forms of water pollution combined is less than the arithmetic sum of the deaths due to the individual types of water pollution because the various types of water pollution often co-exist and overlap with each other.
Trends in disease from water pollutionTargeted interventions to provide modern water and sanitation infrastructure began in the developing world as early as the 1950s, in the early days of international development assistance programmes. The Millennium
Figure 10: Estimated global deaths by pollution risk factor and age at death, 2015GBD Study, 2016.42
Estim
ated
glo
bal d
eath
s (m
illio
ns)
Age at death (years)
All pollution Air Water Soil Occupational
5·0
0
Early neonatal
Late neonatal
Post neonatal
1–4 5–910–14
15-1920–24
25–2930–34
35–3940–4
445–4
950–54
55–5960–6
465–6
970–74
75–79≥80
1·0
1·5
2·0
2·5
Figure 11: Estimated global DALYs by pollution risk factor and age at death, 2015GBD Study, 2016.42 DALYs=disability-adjusted life-years.
Age at death (years)Early neonatal
Late neonatal
Post neonatal
1–4 5–910–14
15-1920–24
25–2930–34
35–3940–4
445–4
950–54
55–5960–6
465–6
970–74
75–79≥80
All pollution Air Water Soil Occupational
Estim
ated
glo
bal D
ALYs
0
5
10
15
20
25
30
35
40
45

The Lancet Commissions
16 www.thelancet.com Published online October 19, 2017 http://dx.doi.org/10.1016/S0140-6736(17)32345-0
Development Goals (MDGs) accelerated this work, and MDG Target 7C called on the global community “by 2015, to halve the proportion of the population without sustainable access to safe drinking water and basic sanitation”. To track interventions against water pollution and waterborne disease, WHO and UNICEF established the Joint Monitoring Programme for Water Supply and Sanitation.54
Substantial progress has been made in reducing water pollution and waterborne disease. Between 1990 and 2015, 2·6 billion people gained access to improved drinking water sources, 2·1 billion people gained access to improved sanitation, and the MDG Target 7C was met 5 years ahead of schedule. In this time, the number of children dying from diarrhoeal diseases decreased by almost 60%, from approximately 1·5 million deaths in 1990 to slightly greater than 0·6 million deaths in 2012. However, despite this progress, 2·4 billion people are still using unimproved sanitation facilities, including 946 million people who still practise open defecation.
Geography of water pollution and diseasePopulation-based estimates of the number of deaths from water pollution are highest in sub-Saharan Africa (figure 12).42 Large numbers of deaths are seen also in some southeast Asian countries. In the past two decades, China has greatly reduced mortality from waterborne infectious disease.42
Importantly, these data do not reflect deaths from chemical pollution of water, because data for levels of chemical contamination of drinking water are not available for most low-income and middle-income
countries. Disease due to chemical contamination of drinking water is included in zone 2 of the pollutome (figure 3).
Soil, heavy metal, and chemical pollutionComprehensive assessments of the health effects of most forms of soil, heavy metal, and chemical pollution have not yet been published. Lead is an exception, and has been studied extensively. Newer research on a few contaminated sites is beginning to report data for disease burden at these sites; at present, these estimates are limited to DALYs and do not include deaths.
LeadPeople have used lead for centuries but, until the modern era, it was largely an occupational poison.164 In the 19th and 20th centuries, lead moved beyond the workplace into air, water, and soil in countries around the world as a consequence of sharp increases in lead production that accompanied the Industrial Revolution. In the early 20th century, lead was incorporated, for the first time, into mass-market consumer products such as lead-based paint and gasoline. Global contamination of air, water, and soil resulted. Global production of lead has more than doubled since the 1970s and continues to rise. Increasing global manufacture of batteries for products ranging from mobile phones to cars, is the main driver of this increase.165 82% of deaths due to lead occur in low-income and middle-income countries.
In adults, chronic exposure to lead is an established risk factor for hypertension, renal failure, cardiovascular
Figure 12: Number of deaths per 100 000 people due to water pollution, 2015GBD Study, 2016.42
Number of deathsper 100000 peopleattributable to waterpollution
1–4 5–2021–5051–100101–204
1000 4000 60002000 km
For WHO data on numbers of water pollution-related
mortalities see http://www.who.int/healthinfo/mortality_
data/en/
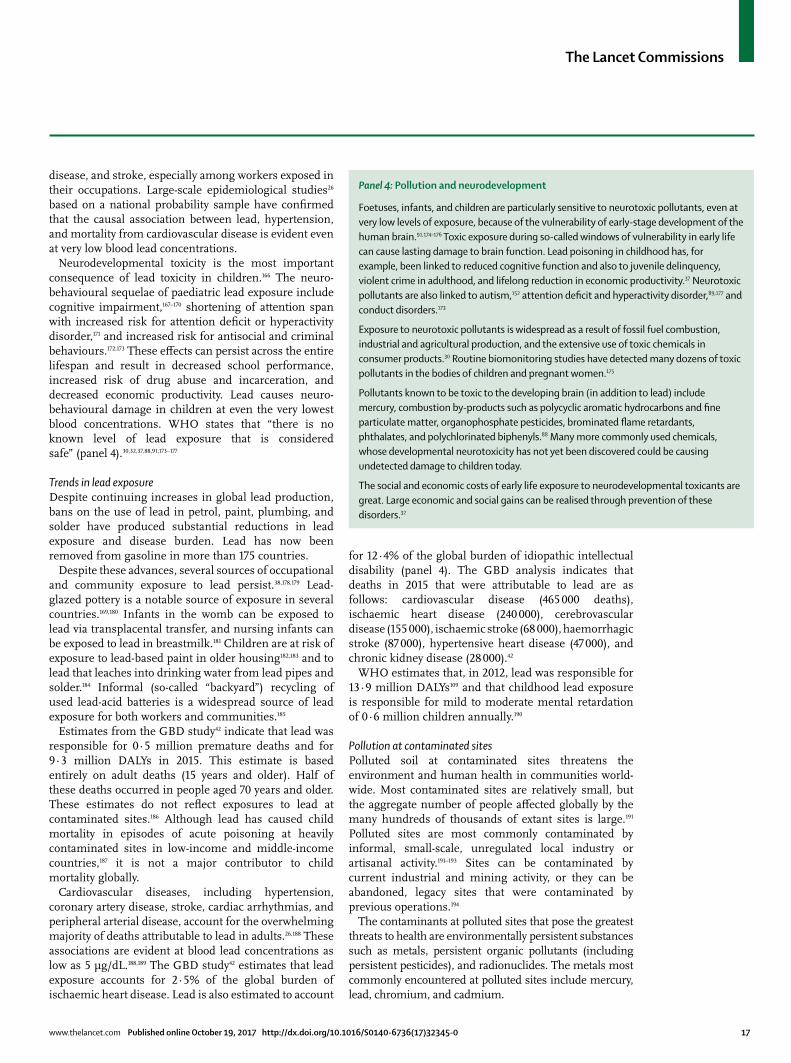
The Lancet Commissions
www.thelancet.com Published online October 19, 2017 http://dx.doi.org/10.1016/S0140-6736(17)32345-0 17
disease, and stroke, especially among workers exposed in their occupations. Large-scale epidem iological studies26 based on a national probability sample have confirmed that the causal association between lead, hypertension, and mortality from cardio vascular disease is evident even at very low blood lead concentrations.
Neurodevelopmental toxicity is the most important consequence of lead toxicity in children.166 The neuro-behavioural sequelae of paediatric lead exposure include cognitive impairment,167–170 shortening of attention span with increased risk for attention deficit or hyperactivity disorder,171 and increased risk for antisocial and criminal behaviours.172,173 These effects can persist across the entire lifespan and result in decreased school performance, increased risk of drug abuse and in carceration, and decreased economic productivity. Lead causes neuro-behavioural damage in children at even the very lowest blood concentrations. WHO states that “there is no known level of lead exposure that is considered safe” (panel 4).30,32,37,88,91,173–177
Trends in lead exposureDespite continuing increases in global lead production, bans on the use of lead in petrol, paint, plumbing, and solder have produced substantial reductions in lead exposure and disease burden. Lead has now been removed from gasoline in more than 175 countries.
Despite these advances, several sources of occupational and community exposure to lead persist.38,178,179 Lead-glazed pottery is a notable source of exposure in several countries.169,180 Infants in the womb can be exposed to lead via transplacental transfer, and nursing infants can be exposed to lead in breastmilk.181 Children are at risk of exposure to lead-based paint in older housing182,183 and to lead that leaches into drinking water from lead pipes and solder.184 Informal (so-called “backyard”) recycling of used lead-acid batteries is a widespread source of lead exposure for both workers and communities.185
Estimates from the GBD study42 indicate that lead was responsible for 0·5 million premature deaths and for 9·3 million DALYs in 2015. This estimate is based entirely on adult deaths (15 years and older). Half of these deaths occurred in people aged 70 years and older. These estimates do not reflect exposures to lead at contaminated sites.186 Although lead has caused child mortality in episodes of acute poisoning at heavily contaminated sites in low-income and middle-income countries,187 it is not a major contributor to child mortality globally.
Cardiovascular diseases, including hypertension, coronary artery disease, stroke, cardiac arrhythmias, and peripheral arterial disease, account for the overwhelming majority of deaths attributable to lead in adults.26,188 These associations are evident at blood lead concentrations as low as 5 μg/dL.188,189 The GBD study42 estimates that lead exposure accounts for 2·5% of the global burden of ischaemic heart disease. Lead is also estimated to account
for 12·4% of the global burden of idiopathic intellectual disability (panel 4). The GBD analysis indicates that deaths in 2015 that were attributable to lead are as follows: cardiovascular disease (465 000 deaths), ischaemic heart disease (240 000), cerebrovascular disease (155 000), ischaemic stroke (68 000), haemorrhagic stroke (87 000), hypertensive heart disease (47 000), and chronic kidney disease (28 000).42
WHO estimates that, in 2012, lead was responsible for 13·9 million DALYs109 and that childhood lead exposure is responsible for mild to moderate mental retardation of 0·6 million children annually.190
Pollution at contaminated sitesPolluted soil at contaminated sites threatens the environment and human health in communities world-wide. Most contaminated sites are relatively small, but the aggregate number of people affected globally by the many hundreds of thousands of extant sites is large.191 Polluted sites are most commonly contaminated by informal, small-scale, unregulated local industry or artisanal activity.191–193 Sites can be contaminated by current industrial and mining activity, or they can be abandoned, legacy sites that were contaminated by previous operations.194
The contaminants at polluted sites that pose the greatest threats to health are environmentally persistent substances such as metals, persistent organic pollutants (including persistent pesticides), and radionuclides. The metals most commonly encountered at polluted sites include mercury, lead, chromium, and cadmium.
Panel 4: Pollution and neurodevelopment
Foetuses, infants, and children are particularly sensitive to neurotoxic pollutants, even at very low levels of exposure, because of the vulnerability of early-stage development of the human brain.91,174–176 Toxic exposure during so-called windows of vulnerability in early life can cause lasting damage to brain function. Lead poisoning in childhood has, for example, been linked to reduced cognitive function and also to juvenile delinquency, violent crime in adulthood, and lifelong reduction in economic productivity.37 Neurotoxic pollutants are also linked to autism,152 attention deficit and hyperactivity disorder,89,177 and conduct disorders.173
Exposure to neurotoxic pollutants is widespread as a result of fossil fuel combustion, industrial and agricultural production, and the extensive use of toxic chemicals in consumer products.30 Routine biomonitoring studies have detected many dozens of toxic pollutants in the bodies of children and pregnant women.175
Pollutants known to be toxic to the developing brain (in addition to lead) include mercury, combustion by-products such as polycyclic aromatic hydrocarbons and fine particulate matter, organophosphate pesticides, brominated flame retardants, phthalates, and polychlorinated biphenyls.88 Many more commonly used chemicals, whose developmental neurotoxicity has not yet been discovered could be causing undetected damage to children today.
The social and economic costs of early life exposure to neurodevelopmental toxicants are great. Large economic and social gains can be realised through prevention of these disorders.32

The Lancet Commissions
18 www.thelancet.com Published online October 19, 2017 http://dx.doi.org/10.1016/S0140-6736(17)32345-0
Human exposure to contaminated soil at toxic sites can result from ingestion, inhalation, or dermal absorption.195 Ingestion is the most common pathway. Children are at greatest risk of exposure because they play close to the ground and because of their common oral exploratory behaviour.196–198
In high-income countries, substantial progress has been made in identifying and remediating contaminated industrial sites and, thus, in reducing exposures and associated disease. In the USA, the Superfund programme (panel 5),199 a national programme for site
remediation, has been funded by the US Federal Government since 1980199,200 and additionally by state governments. In Europe, similar programmes have been created and, since 2004, they have been subsumed under the Environmental Liability Directive of the European Commission, which establishes a framework to prevent damage and remediate hazardous sites based on the polluter-pays principle.201
Burden of disease due to soil pollution by metals and chemicals at toxic sitesBased on data from the Blacksmith Institute/Pure Earth Toxic Sites Identification programme, we estimate that about 61 million people in the 49 countries surveyed to-date are exposed to heavy metals and toxic chemicals at contaminated sites. Because this estimate reflects exposures at only a fraction of the total number of contaminated sites worldwide, further investigation will be required before the full magnitude of exposures at such sites and their contribution to the global burden of disease can be estimated.202
Two types of contaminated sites that have begun to be studied in detail are used lead-acid battery recycling sites and artisanal and small-scale gold mining sites (table 2).112,113,203 Lead poisoning from informal battery recycling is seen in low-income countries in all regions of the world.187,204–206 Artisanal and small-scale gold mining takes place worldwide, but is most highly concentrated in Africa.207 Details on methods for these analyses can be found in the appendix (pp 17–18).
We estimate that between 6 million and 16 million people are exposed to dangerous concentrations of lead each year at used lead-acid battery recycling sites.185,203 These exposures result in the loss of an estimated 0·87 million DALYs annually.203 We also estimate that between 14 million and 19 million artisanal and small-scale gold miners are at risk of occupational exposure to elemental mercury.112 These exposures result in an estimated 2·9 million DALYs lost annually to elemental mercury poisoning.112
Occupational pollutantsRecognition of the health consequences of toxic occupational exposures dates to 200 BC,164 and many of the diseases caused by occupational exposures were well known by the 1700s.208,209 The major epidemics of industrial disease that ravaged workers’ health in the 19th and 20th centuries are, however, of relatively recent origin. Such diseases include coal workers’ pneumoconiosis,210 silicosis,164 bladder cancer in dye workers211 leukaemia and lymphoma in workers exposed to benzene,212 and asbestosis, lung cancer, mesothelioma, and other malignancies in workers exposed to asbestos.213 These conditions can be traced to the rapid, initially largely uncontrolled, industrialisation and reckless exploitation of natural resources that characterised the Industrial Revolution in western Europe, North America, Japan, and Australia.
Panel 5: Superfund legislation
Legislation to control contaminated waste sites was enacted in the USA in the aftermath of a series of environmental and public health disasters.199 The major trigger occurred at the Love Canal (Niagara County, NY, USA), an unused channel between Lake Erie and Lake Ontario into which the Hooker Chemical Company had dumped toxic wastes from the 1940s until the 1960s. When it was full, the canal was covered with a clay seal, and homes and a school were built on top of this clay. However, the waste did not stay underground. The canal filled with water and, by 1976, heavy rain regularly caused toxic sludge to bubble up into the basements of the overlying homes and into nearby streams. By the time this site was recognised as a hazardous waste site, Love Canal contained an estimated 21 000 tonnes of discarded chemicals. Within a few years, a second major waste site was discovered near Louisville, KY. Known as the Valley of the Drums, the site contained thousands of steel drums full of chemical wastes that had accumulated over several decades.
These events made it clear to policy makers and the public that hazardous waste was an environmental and public health emergency. In response, the US Congress passed the Comprehensive Environmental Response Compensation and Liability Act on Dec 11, 1980. The law became known as the Superfund Act because it authorised the creation of a large fund that, from 1980 to 1995 was supported by a tax on the chemical manufacturing and petroleum industries, the two major producers of toxic chemical wastes. Many of the new hazardous waste sites subsequently being discovered were the result of actions by polluters who no longer existed. The tax was based on the polluter-pays principle and was intended to provide resources to remediate abandoned sites. In 1995, the US Congress allowed the tax on the chemical and petroleum industries to expire. Since that time, remediation of hazardous waste sites in the USA has been supported through general tax revenues.
Artisanal small-scale gold mining
Used lead-acid batteries Total median DALYs (range)
Population exposed
Median DALYs
Population exposed
Median DALYs
Africa 10·90 1·91 4·11 0·32 2·23 (0·97–3·49)
Eastern Mediterranean 0·30 0·05 1·54 0·10 0·15 (0·04–0·27)
Europe 2·35 0·43 1·45 0·07 0·19 (0·09–0·28)
Americas 0·37 0·07 5·53 0·22 0·50 (0·24–0·76)
Southeast Asia 0·37 0·07 3·73 0·13 0·29 (0·08–0·50)
Western Pacific 0·19 0·35 3·73 0·13 0·48 (0·20–0·76)
Total 16·70 2·96 16·80 0·87 3·83 (1·61–6·06)
DALYs=disability-adjusted life-years.
Table 2: Estimated exposed populations (millions) and DALYs attributable to artisanal and small-scale gold mining and used lead-acid battery recycling by region, 2016112,113,203

The Lancet Commissions
www.thelancet.com Published online October 19, 2017 http://dx.doi.org/10.1016/S0140-6736(17)32345-0 19
For IARC monographs on the evaluation of cancer risks to humans see http://monographs.iarc.fr/
In high-income countries, the worst occupational exposures have now been controlled by legislation and regulation, backed by strong enforcement, and rates of occupational disease are down.164,214 Substantial progress has been made in controlling exposures to occupational carcinogens. Central to this success has been the work of WHO’s International Agency for Research on Cancer, which has produced independent and objective analyses of the carcinogenicity of hundreds of chemicals. These analyses guide cancer control programmes in countries around the world
By contrast, occupational exposures to toxic pollutants have become highly prevalent in the past 50 years in low-income and middle-income countries.42 The worst of these exposures tend to occur in informal, small-scale, locally owned establishments where child labour is also a frequent problem.176
Burden of disease due to toxic occupational pollutantsOccupational pollutants cause a wide range of diseases.164,215–217 The GBD study42 considers the burden of disease attributable to two types of occupational pollutants. These are occupational carcinogens—asbestos, polycyclic aromatic hydrocarbons, silica, sulphuric acid, trichloroethylene, arsenic, benzene, beryllium, cadmium, chromium, diesel exhaust, second-hand smoke, formaldehyde, and nickel—and occupational particulates, gases, and fumes.
The GBD study42 estimates that, in 2015, toxic occupational risk factors (not including occupational injuries or ergonomic factors) were responsible for 0·88 million deaths globally and for 18·6 million DALYs. Carcinogens were responsible for 0·49 million (55%) of the deaths from occupational exposures to toxicants and for 9·8 million DALYs. Asbestos was responsible for nearly 40% (0·18 million) of all deaths caused by occupational carcinogens. Exposures to particulates, gases, and fumes in the workplace were responsible for an estimated 0·36 million deaths and for 8·8 million DALYs.
WHO data indicate that, in 2012, occupational pollutants were responsible for 0·36 million deaths.110 Occupational respiratory carcinogens (arsenic, asbestos, beryllium, cadmium, chromium, diesel exhaust, nickel, silica) were responsible for 0·1 million of these deaths; occupational leukaemogens (benzene, ethylene oxide, ionising radiation) for 3000 deaths; occupational particulates, dusts, fumes, and gases for 0·23 million deaths; and acute occupational poisonings for 27 000 deaths. WHO estimates that, in 2012, occupational exposures were responsible for 13·6 million DALYs.109
Age distribution of deaths linked to toxic occupational pollutantsMost deaths attributable to occupational pollutants and, especially, to occupational carcinogens occur in people aged 50 years and older (figure 13).42 This pattern reflects the long latency of most occupational cancers.213
Pollution sources not currently quantifiedMany hundreds of new synthetic chemicals have entered world markets in recent decades, come into widespread use, and are now beginning to be recognised as potential threats to health. These chemicals have become extensively disseminated in the environment, are detectable in the bodies of almost all people examined in national surveys, and have the potential to cause global epidemics of disease, disability, and death. Most chemicals have undergone little or no assessment of their safety or potential hazards to human health.
Because the effects of these new chemicals on human health are only beginning to be recognised and their contributions to the global burden of disease are not yet quantified, they are currently placed within zone 3 of the pollutome (figure 3). Such emerging chemical pollutants are described below.
Developmental neurotoxicantsEvidence is strong that widely used chemicals and pesticides have been responsible for injury to the brains of millions of children and have resulted in a global pandemic of neurodevelopmental toxicity.37,88 The manifestations of exposure to these chemicals during early development include loss of cognition, shortening of attention span, impairment of executive function, behavioural disorders, increased prevalence of attention deficit and hyperactivity disorder, learning disabilities, dyslexia, and autism.37
Prospective epidemiological birth cohort studies have been a powerful instrument for detecting associ-ations between prenatal exposures to developmental neurotoxicants and disease.218 Examples of pollution-related diseases in children that have been identified through prospective studies are: cognitive impairment, with decreased IQ in children exposed prenatally to
Figure 13: Global estimated deaths due to occupational carcinogenic and particulate exposures by age at death and gender, 2015GBD Study, 2016.42
0
10
Age at death (years)
20
30
40
50
60
70
80
90
100
1 to 4
5 to 9
10 to 14
15 to 19
20 to 24
25 to 29
30 to 34
35 to 39
40 to 44
45 to 49
50 to 54
55 to 59
60 to 64
65 to 69
70 to 74
75 to 79
80 plus
Glob
al e
stim
ated
dea
ths (
thou
sand
s)
Occupational particulates, gases and fumes (male) Occupational particulates, gases and fumes (female)Occupational carcinogens (male)Occupational carcinogens (female)
The Lancet Commissions
20 www.thelancet.com Published online October 19, 2017 http://dx.doi.org/10.1016/S0140-6736(17)32345-0
PCBs;219reducedIQandshorteningofattentionspaninchildren exposed prenatally to methyl mercury;37 microcephaly at birth, anatomical and functional delays in brain development, and autistic behaviours in child-ren exposed prenatally to the organophosphate pest-icide, chlorpyrifos;220,221 autistic behaviours in children ex posed prenatally to phthalates;89 cognitive impairment, shortened attention span, and disruptive behaviour in children exposed prenatally to brominated flame retardants;177 and neurodevelopmental delays in children exposed prenatally to polycyclic aromatic hydrocarbons.32,175
An important unanswered question is whether there are additional chemicals in use today whose ability to cause silent injury to the developing human brain has not yet been discovered.88,222,223
Endocrine disruptorsEndocrine disruptors are chemical pollutants that mimic, block, or alter the actions of normal hormones.78,90–92 They include phthalates, bisphenol A, perchlorate, several pesticides, such as the orthophosphates, brominated flame retardants, and dioxins. Many endocrine disruptors are also developmental neurotoxicants. These chemicals are manufactured in volumes of millions of kilograms per year and are used widely in consumer products such as soaps, shampoos, perfumes, plastics, and food containers. Exposures in utero to even extremely low doses of endocrine-disrupting chemicals during early development can lead to permanent impairments in organ function and increased risk of disease. Prenatal exposures have been linked to autistic behaviours in children224 and to anomalies of the reproductive organs in baby boys.225
PesticidesMore than 20 000 commercial pesticide products, including insecticides, herbicides, fungicides, and rodenticides are available on world markets. More than 1·1 billion pounds of these products are used in the USA each year and an estimated 5·2 billion pounds globally.226 Some of the heaviest applications occur in low-income and middle-income countries where use and exposure data are scant. Experience with three categories of pesticides—the organophosphate insecticides, the neonicotinoid insecticides, and the synthetic herbicide glyphosate—illustrate the challenges posed by these new and inadequately tested pesticide chemicals.
The organophosphate insecticides are a large and widely used class of pesticides. Members of this class of chemicals are powerful developmental neurotoxicants, and prenatal exposures are associated with persistent deleterious effects on children’s cognitive and be havioural function and with long-term, potentially irreversible, changes to brain structure that are evident on MRI.220 Toxicological studies of rodents exposed perinatally to organophosphates produce parallel findings.227
The neonicotinoids are a novel class of neurotoxic pesticides that were developed in the 1980s and whose use has risen substantially in the past decade. The neonicotinoid imidacloprid is now the most widely used insecticide in the world.228 In the USA, agricultural use of neonicotinoids was nearly 4 million kg in 2014.229
Neonicotinoids target nicotinic acetylcholine receptors in the insect nervous system.230 They are water-soluble and can persist for years in soils, dust, wetlands, and groundwater and are detected in commonly consumed foods. Substantial evidence indicates that neonicotinoids can have negative effects on the behaviour and health of bees and other pollinators at environmentally relevant concen trations.231,232 These chemicals are a suspected cause of bee colony collapse disorder. Despite their extensive use and known neurotoxicity to insects, very little information is available on the possible human health effects of the neonicotinoids.228
Chemical herbicides account for nearly 40% of global pesticide use and applications are increasing.226 A major use is in production of genetically modified food crops engineered to be resistant to glyphosate (Roundup), the world’s most widely used herbicide. Glyphosate-resistant, so-called “Roundup Ready” crops, now account for more than 90% of all corn and soybeans planted in the USA, and their use is growing globally. Glyphosate is widely detected in air and water in agricultural areas, and glyphosate residues are detected in commonly consumed foods.
Epidemiological studies of agricultural workers who were exposed occupationally to glyphosate and other herbicides have found evidence for increased occurrence of non-Hodgkin lymphoma in these people. Toxicological studies of experimental animals exposed to glyphosate show strong evidence of dose-related carcinogenicity at several anatomical sites, including renal tubule carcinoma and haemangiosarcoma. On the basis of these findings, the International Agency for Research on Cancer has determined that glyphosate is a “probable human carcinogen”;233 this finding is contested by glyphosate’s manufacturer.
Thousands of tonnes of pharmaceutical waste are released into the environment each year, especially in high-income and middle-income countries, and measur-able concentrations of several pharmaceuticals are detected in urban wastewater.95,96
The sources of pharmaceutical waste pollution include discharges from pharmaceutical manufacturing plants, hospitals, agriculture, and aquaculture. Anti-inflam matory agents, antibiotics, oestrogens, anti-epileptics, caffeine, and cancer chemotherapy agents are among the compounds most commonly detected. In some locations, concentrations of the anti-inflammatory drug diclofenac have been reported to exceed predicted no-effect levels.234,235 Concern is increasing that these compounds could damage freshwater and salt water marine species through a range of toxicological mechanisms, including endocrine disruption.
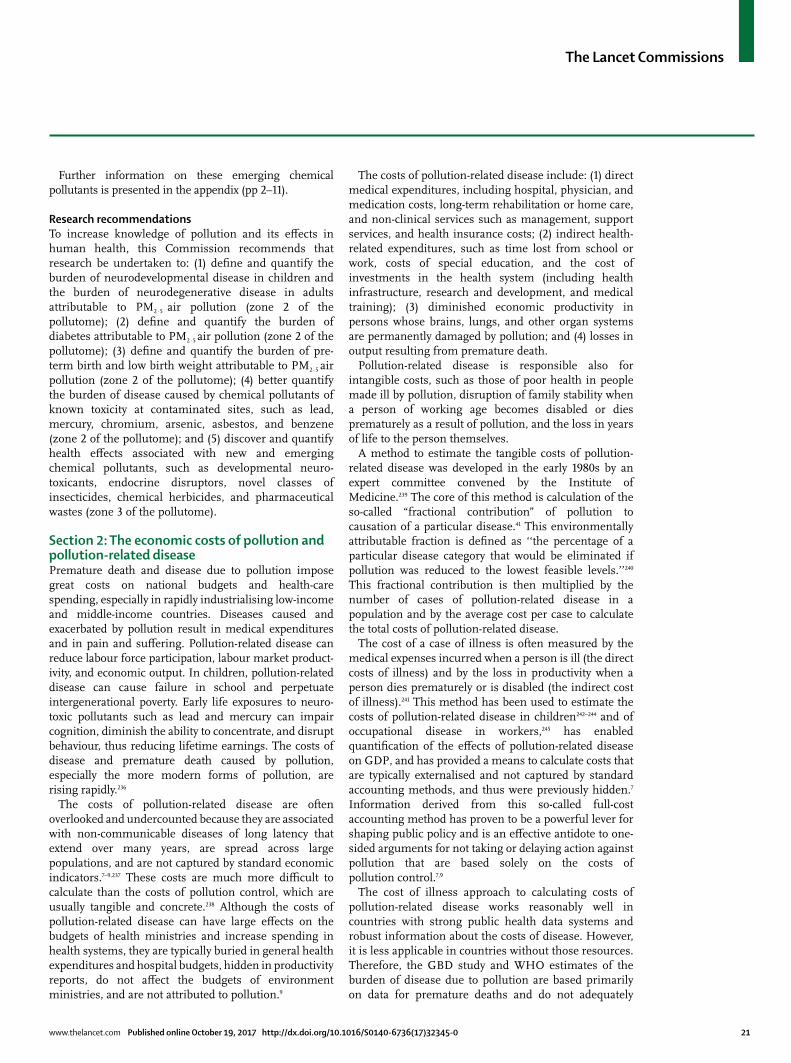
The Lancet Commissions
www.thelancet.com Published online October 19, 2017 http://dx.doi.org/10.1016/S0140-6736(17)32345-0 21
Further information on these emerging chemical pollutants is presented in the appendix (pp 2–11).
Research recommendationsTo increase knowledge of pollution and its effects in human health, this Commission recommends that research be undertaken to: (1) define and quantify the burden of neurodevelopmental disease in children and the burden of neurodegenerative disease in adults attributable to PM2·5 air pollution (zone 2 of the pollutome); (2) define and quantify the burden of diabetes attributable to PM2·5 air pollution (zone 2 of the pollutome); (3) define and quantify the burden of pre-term birth and low birth weight attributable to PM2·5 air pollution (zone 2 of the pollutome); (4) better quantify the burden of disease caused by chemical pollutants of known toxicity at contaminated sites, such as lead, mercury, chromium, arsenic, asbestos, and benzene (zone 2 of the pollutome); and (5) discover and quantify health effects associated with new and emerging chemical pollutants, such as developmental neuro-toxicants, endocrine disruptors, novel classes of insecticides, chemical herbicides, and pharmaceutical wastes (zone 3 of the pollutome).
Section 2: The economic costs of pollution and pollution-related diseasePremature death and disease due to pollution impose great costs on national budgets and health-care spend ing, especially in rapidly industrialising low-income and middle-income countries. Diseases caused and exacerbated by pollution result in medical expenditures and in pain and suffering. Pollution-related disease can reduce labour force participation, labour market product-ivity, and economic output. In children, pollution-related disease can cause failure in school and perpetuate intergenerational poverty. Early life exposures to neuro-toxic pollutants such as lead and mercury can impair cognition, diminish the ability to concentrate, and disrupt behaviour, thus reducing lifetime earnings. The costs of disease and premature death caused by pollution, especially the more modern forms of pollution, are rising rapidly.236
The costs of pollution-related disease are often overlooked and undercounted because they are associated with non-communicable diseases of long latency that extend over many years, are spread across large populations, and are not captured by standard economic indicators.7–9,237 These costs are much more difficult to calculate than the costs of pollution control, which are usually tangible and concrete.238 Although the costs of pollution-related disease can have large effects on the budgets of health ministries and increase spending in health systems, they are typically buried in general health expenditures and hospital budgets, hidden in productivity reports, do not affect the budgets of environment ministries, and are not attributed to pollution.9
The costs of pollution-related disease include: (1) direct medical expenditures, including hospital, physician, and medication costs, long-term rehabilitation or home care, and non-clinical services such as management, support services, and health insurance costs; (2) indirect health-related expenditures, such as time lost from school or work, costs of special education, and the cost of investments in the health system (including health infrastructure, research and development, and medical training); (3) diminished economic productivity in persons whose brains, lungs, and other organ systems are permanently damaged by pollution; and (4) losses in output resulting from premature death.
Pollution-related disease is responsible also for intangible costs, such as those of poor health in people made ill by pollution, disruption of family stability when a person of working age becomes disabled or dies prematurely as a result of pollution, and the loss in years of life to the person themselves.
A method to estimate the tangible costs of pollution-related disease was developed in the early 1980s by an expert committee convened by the Institute of Medicine.239 The core of this method is calculation of the so-called “fractional contribution” of pollution to causation of a particular disease.41 This environmentally attributable fraction is defined as ‘‘the percentage of a particular disease category that would be eliminated if pollution was reduced to the lowest feasible levels.’’240 This fractional contribution is then multiplied by the number of cases of pollution-related disease in a population and by the average cost per case to calculate the total costs of pollution-related disease.
The cost of a case of illness is often measured by the medical expenses incurred when a person is ill (the direct costs of illness) and by the loss in productivity when a person dies prematurely or is disabled (the indirect cost of illness).241 This method has been used to estimate the costs of pollution-related disease in children242–244 and of occupational disease in workers,245 has enabled quantification of the effects of pollution-related disease on GDP, and has provided a means to calculate costs that are typically externalised and not captured by standard accounting methods, and thus were previously hidden.7 Information derived from this so-called full-cost accounting method has proven to be a powerful lever for shaping public policy and is an effective antidote to one-sided arguments for not taking or delaying action against pollution that are based solely on the costs of pollution control.7,9
The cost of illness approach to calculating costs of pollution-related disease works reasonably well in countries with strong public health data systems and robust information about the costs of disease. However, it is less applicable in countries without those resources. Therefore, the GBD study and WHO estimates of the burden of disease due to pollution are based primarily on data for premature deaths and do not adequately

The Lancet Commissions
22 www.thelancet.com Published online October 19, 2017 http://dx.doi.org/10.1016/S0140-6736(17)32345-0
reflect the full burden of pollution-related disease because, in many countries, researchers are not able to capture information about pollution-related morbidity. In countries where data are available relating pollution to morbidity and to the costs of disease, these costs are often substantial. Such studies suggest that the morbidity costs resulting from pollution-related dis-ease might conservatively increase mortality costs by 10–70%,236,246,247 and some individual country studies suggest that the increment might be even greater: 25% for Colombia,247 22–78% for China,248 and 78% for Nicaragua.249
A second shortcoming in using the cost of illness approach to estimate the health costs of pollution is that it can never capture the intangible losses caused by pollution-related disease, even when comprehensive data are available. For example, this method can neither measure the family disruption that follows the premature death of a mother or a father nor can it quantify the grief that follows the death of a child. Those losses are separate and qualitatively different from losses in income generated or in goods produced.14 Similarly, a method that is based solely on the effect of pollution on GDP cannot fully describe the negative effects of pollution on societal health, on diminished visibility in national parks, on ecosystem services, or the benefits of pollution control in enhancing national welfare.72
To overcome these shortcomings in the cost of illness approach, economists have devised a second strategy to assess disease costs: the so-called “willingness-to-pay” method. This metric is a measure of how much people are willing to pay to reduce the risk of premature death.250–252 This approach captures individuals’ pre-ferences for avoiding increases in risk of death by analysing their behaviour in risky situations (the revealed preference approach) or in hypothetical choice situations involving changes in their risk of death (the stated preference approach).
To aggregate data from willingness to pay (WTP) studies, economists have developed the Value of a Statistical Life (VSL) concept. The VSL is defined as the total of what many people would pay for small reductions in the probability of dying over the coming year that, together, add up to saving one life. For example, if each of 10 000 people were willing to pay US$100 over the coming year to reduce their risk of dying by 1 in 10 000, one statistical life would be saved and the VSL would equal $100 × 10 000, or $1 000 000.
Multiplying the number of lives lost to pollution by the VSL provides an estimate of the health costs associated with pollution. Multiplying the number of lives that pollution control would save by the VSL provides an estimate of the benefits of pollution control.
Although the VSL method has the disadvantage of relying on estimates of what people say they will pay to reduce mortality risks, it overcomes many of the limitations that hinder efforts to estimate pollution-related
disease costs; for instance, by expanding estimates from those made solely in terms of productivity losses and effects on GDP. The VSL method has been used by governments in high-income countries and in Colombia, Malaysia, Mexico, and Peru, amongst others, to estimate the benefits of reducing pollution.246
MethodsThis Commission uses both approaches in the current analysis. Economic losses from pollution-related disease are therefore measured in terms of lost productivity and health-care costs, and the costs of pollution-related disease are also presented using estimates derived from WTP studies. Costs associated with air, water, and lead pollution are included in this analysis, but costs associated with soil pollution are not yet available and are not included. To calculate the VSL in countries where no original studies are available, we have extrapolated estimates from other countries, taking differences in income levels into account.246,253 This method is described in the appendix (pp 25–28).
The economic benefits that result from the control of pollution and prevention of pollution-related disease are the same as the costs that result from pollution-related disease. Losses in economic productivity are a key component of the costs of pollution-related disease. When pollution-related disease results in the death of children or adults of working age, the economic output that those people would have produced is lost forever. The productivity losses associated with premature mortality are measured by calculating the output that an individual would have produced over his or her working life, summing these losses to the present.
Pollution-related disease also reduces the productivity of ill people while they are working. Hanna and Oliva254 estimated that the closing of a heavily polluting refinery in Mexico City, Mexico, increased the hours worked by people living near the refinery by 3·5%. Zivin and Neidell255 found that a 10 ppb reduction in ground-level ozone increased the productivity of farm workers in California, USA, by 5·5%. Chang and colleagues256 report that each 10 µg/m³ increase in outdoor PM2·5 concentrations reduced the productivity of factory workers by 6% in northern California, USA. Similarly, water pollution has also been shown to reduce adult productivity. An estimated 35 million people in Bangladesh are exposed to concentrations of arsenic in groundwater that exceed 50 µg/L and 57 million people are exposed to concentrations above the WHO standard of 10 µg/L. Carson and colleagues,257 who performed this study, estimate that reducing arsenic concentrations to the WHO standard would increase annual hours worked by the average household in their sample by 6·5%.
A method to measure lost output is to calculate its effects on a worker’s contribution to GDP. Table 3 shows reductions in GDP that result from pollution-related deaths as a percentage of a country’s GDP. Losses are reported by World Bank income group and pollutant

The Lancet Commissions
www.thelancet.com Published online October 19, 2017 http://dx.doi.org/10.1016/S0140-6736(17)32345-0 23
category (lead exposure, ambient air pollution, household air pollution, unsafe water, and unsafe sanitation. Because the magnitude of productivity losses is sensitive to the interest rate used to discount losses to the present (discount rate), this Commission gives results using two different discount rates (1·5% and 3%). For country-level data see appendix (pp 43–47).
Because pollution-related disease is most common in heavily polluted, low-income countries, productivity losses due to pollution-related disease are dis-proportionately high in these countries. Thus, in low-income countries, product ivity losses due to pollution-related disease represent between 1·3% and 1·9% of GDP. By contrast, in lower middle-income countries, these losses amount to between 0·6% and 0·8% of GDP. In low-income countries, the largest productivity losses due to pollution-related disease result from lack of access to safe water and sanitation, followed by exposures to air pollution. Household air pollution alone causes losses of between 0·49% and 0·68% of GDP in low-income countries.
In upper middle-income and high-income countries, most economic losses attributable to pollution-related disease are due to ambient air pollution. These losses comprise a smaller fraction of GDP than in low-income and lower middle-income countries because there is generally less pollution in these countries and prevalence of pollution-related disease is lower. An additional factor that reduces the estimated costs of pollution-related disease in high-income countries is that more than 82% of deaths due to air pollution in these countries occur in people age 65 years and older. This reduces the calculated costs because the international definition of working age is 15–64 years of age and, hence, the economic contribution of premature death in people older than 65 years is not counted. In upper middle-income and high-income countries, estimated economic losses due to pollution-related disease in 2015 were more than US$53 billion.
Additional economic costs of coal combustion not included in this analysis are costs related to disease and premature death in coal miners due to injuries and coal workers’ pneumoconiosis; costs of lung cancer in coke oven workers; ecological and community costs of mountain top removal and strip mining; losses in property values near mines and along railroad rights-of-way; loss of timber resources; and crop losses due to water contamination.9
Pollution benefit-cost analysesBenefit-cost analyses of water and sanitation improvements and improved cookstoves must account for the health benefits of these interventions, the time savings for households who no longer need to collect water or firewood, and the benefits associated with improved childhood health, such as greater educational achievement.
The health benefits associated with a project to improve water quality (eg, home disinfection of drinking water)
exceed the reduced mortality risk and lost productivity measured in this chapter, and also include reductions in morbidity due to diarrhoea, especially among children, and associated reductions in malnutrition.
Two studies that combine results from the medical literature to estimate the global benefits of various water and sanitation interventions suggest benefit-cost ratios greater than 1 for many interventions on the basis of health benefits and time savings. The average benefit-cost ratio for deep borehole wells with hand pumps is 4·64, whereas household water treatment with bio-sand filters yields an average benefit-cost ratio of 2·48.258,259 A cost–benefit analysis finds that improved water supplies, according to the WHO definition, yield a return of US$2 for every dollar invested.
Despite general acceptance that well targeted water and sanitation interventions have positive benefit-cost ratios,260,261 the scale of these benefits can be questioned, given the number of uncertainties that are usually involved.262,263 Site-specific analysis and examination of the range of probable benefit-cost ratios can provide useful input to the process of making policy and project decisions.264
Neurotoxic pollutants can reduce productivity by impairing children’s cognitive development. It is well documented that exposures to lead and other metals (eg, mercury and arsenic) reduce cognitive function, as measured by loss of IQ.168 Loss of cognitive function directly affects success at school and labour force participation and indirectly affects lifetime earnings. In the USA, millions of children were exposed to excessive concentrations of lead as the result of the widespread use of leaded gasoline from the 1920s until about 1980. At peak use in the 1970s, annual consumption of tetraethyl lead in gasoline was nearly 100 000 tonnes.
It has been estimated that the resulting epidemic of subclinical lead poisoning could have reduced the number of children with truly superior intelligence (IQ scores higher than 130 points) bymore than 50%and, concurrently, caused a more than 50% increase in the number of children with IQ scores less than 70(figure 14).265 Children with reduced cognitive function
Ambient air pollution and household air pollution
Unsafe water and unsafe sanitation*
Lead exposure Total
High income 0·044% (0·048%) 0·0028% (0·0033%) 0·0027% (0·0029%) 0·050% (0·054%)
Upper-middle income 0·13% (0·15%) 0·019% (0·027%) 0·0054% (0·0059%) 0·15% (0·18%)
Lower-middle income 0·32% (0·40%) 0·28% (0·40%) 0·012% (0·013%) 0·61% (0·82%)
Low income 0·62% (0·86%) 0·70% (1·03%) 0·012% (0·013%) 1·33% (1·90%)
World 0·092% (0·11%) 0·033% (0·047%) 0·0042% (0·0046%) 0·13% (0·16%)
Results without parentheses discount future output at the rate of growth in per capita GDP plus 3%. Results in parentheses discount future output at the rate of growth in per capita GDP plus 1·5%. For the calculations see appendix (pp 25–26). *Includes, but is not limited to, no hand washing with soap.
Table 3: Productivity losses as a percentage of gross domestic product (GDP) by pollutant and World Bank income group
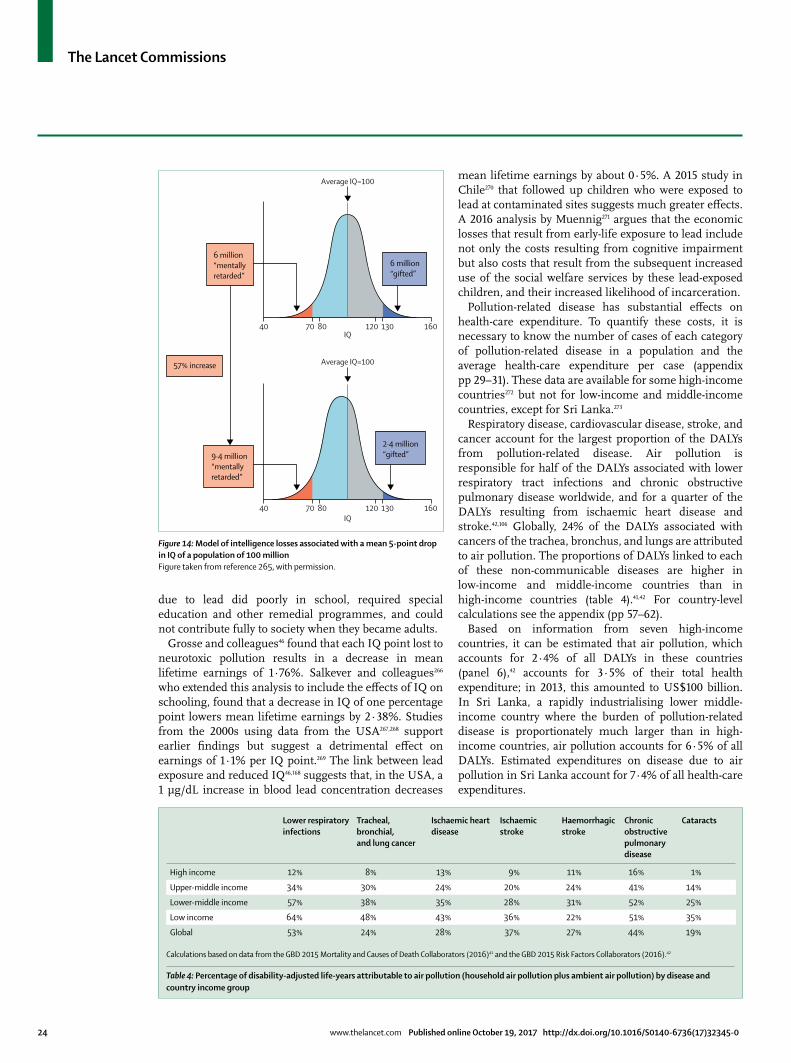
The Lancet Commissions
24 www.thelancet.com Published online October 19, 2017 http://dx.doi.org/10.1016/S0140-6736(17)32345-0
due to lead did poorly in school, required special education and other remedial programmes, and could not contribute fully to society when they became adults.
Grosse and colleagues46foundthateachIQpointlosttoneurotoxic pollution results in a decrease in mean lifetime earnings of 1·76%. Salkever and colleagues266 whoextendedthisanalysistoincludetheeffectsofIQonschooling,foundthatadecreaseinIQofonepercentagepoint lowers mean lifetime earnings by 2·38%. Studies from the 2000s using data from the USA267,268 support earlier findings but suggest a detrimental effect on earningsof1·1%perIQpoint.269 The link between lead exposureandreducedIQ46,168 suggests that, in the USA, a 1 µg/dL increase in blood lead concentration decreases
mean lifetime earnings by about 0·5%. A 2015 study in Chile270 that followed up children who were exposed to lead at contaminated sites suggests much greater effects. A 2016 analysis by Muennig271 argues that the economic losses that result from early-life exposure to lead include not only the costs resulting from cognitive impairment but also costs that result from the subsequent increased use of the social welfare services by these lead-exposed children, and their increased likelihood of incarceration.
Pollution-related disease has substantial effects on health-care expenditure. To quantify these costs, it is necessary to know the number of cases of each category of pollution-related disease in a population and the average health-care expenditure per case (appendix pp 29–31). These data are available for some high-income countries272 but not for low-income and middle-income countries, except for Sri Lanka.273
Respiratory disease, cardiovascular disease, stroke, and cancer account for the largest proportion of the DALYs from pollution-related disease. Air pollution is responsible for half of the DALYs associated with lower respiratory tract infections and chronic obstructive pulmonary disease worldwide, and for a quarter of the DALYs resulting from ischaemic heart disease and stroke.42,106 Globally, 24% of the DALYs associated with cancers of the trachea, bronchus, and lungs are attributed to air pollution. The proportions of DALYs linked to each of these non-communicable diseases are higher in low-income and middle-income countries than in high-income countries (table 4).41,42 For country-level calculations see the appendix (pp 57–62).
Based on information from seven high-income countries, it can be estimated that air pollution, which accounts for 2·4% of all DALYs in these countries (panel 6),42 accounts for 3·5% of their total health expenditure; in 2013, this amounted to US$100 billion. In Sri Lanka, a rapidly industrialising lower middle-income country where the burden of pollution-related disease is proportionately much larger than in high-income countries, air pollution accounts for 6·5% of all DALYs. Estimated expenditures on disease due to air pollution in Sri Lanka account for 7·4% of all health-care expenditures.
Figure 14: Model of intelligence losses associated with a mean 5-point drop in IQ of a population of 100 millionFigure taken from reference 265, with permission.
40 80 120 16013070
Average IQ=100
6 million“mentallyretarded”
57% increase
6 million“gifted”
9·4 million“mentallyretarded”
2·4 million“gifted”
40 80 120 16013070
Average IQ=100
IQ
IQ
Lower respiratory infections
Tracheal, bronchial, and lung cancer
Ischaemic heart disease
Ischaemic stroke
Haemorrhagic stroke
Chronic obstructive pulmonary disease
Cataracts
High income 12% 8% 13% 9% 11% 16% 1%
Upper-middle income 34% 30% 24% 20% 24% 41% 14%
Lower-middle income 57% 38% 35% 28% 31% 52% 25%
Low income 64% 48% 43% 36% 22% 51% 35%
Global 53% 24% 28% 37% 27% 44% 19%
Calculations based on data from the GBD 2015 Mortality and Causes of Death Collaborators (2016)41 and the GBD 2015 Risk Factors Collaborators (2016).42
Table 4: Percentage of disability-adjusted life-years attributable to air pollution (household air pollution plus ambient air pollution) by disease and country income group

The Lancet Commissions
www.thelancet.com Published online October 19, 2017 http://dx.doi.org/10.1016/S0140-6736(17)32345-0 25
Globally, unsafe water and sanitation, including poor hand hygiene, are associated with 96% of DALYs due to diarrhoeal disease and with 95% of the DALYs linked to typhoid fever. In low-income countries, these percentages are even higher (97% for both diseases). Health-care expenditures on pollution-induced diarrhoea and typhoid are difficult to quantify due to inadequate data. However, the costs of treating these diseases, especially for children, represent only a small proportion of the health costs to society from these diseases274,275 and the impoverishing effect of these diseases can be as great, if not greater, than the direct cost of illness. For example, in children who survive diarrhoea, effects on nutritional status and school attendance are likely to far outweigh the costs of treatment. Repeated bouts of diarrhoea interfere with the body’s ability to absorb nutrients and, in countries where many children are malnourished, compound the effects of poor nutrition.276 The negative effects of poor nutrition on labour force productivity277 and the effects of diarrhoea and other childhood diseases on school attendance are well studied.278 All of these effects are magnified in settings where poor households forego medical treatment but still suffer substantial impoverishment from the loss of household income or long-term disability, where the foregone treatment is a low-cost intervention that could have restored full labour market participation.
We define welfare losses from pollution-related disease as equal to household WTP to reduce pollution. When the VSL method is used to estimate the global costs of premature deaths attributable to pollution, the total in 2015 was more than US$4·6 trillion, or 6·2% of world GDP (table 5).42
This estimate of WTP to reduce pollution greatly exceeds the estimated costs of pollution-related disease that are derived from productivity losses alone for two reasons. Firstly, what people will pay to reduce their risk of death is much greater than the present value of lost output. When a person dies at age 35 years, the present value of productivity losses is about 20 times per capita GDP; in low-income countries, the ratio of the VSL to per capita GDP is between 40:1 and 50:1. Secondly, the VSL is applied to all premature deaths, not only those of adults at working age. Because 75% of deaths associated with lead pollution, 64% of deaths associated with ambient air pollution, 33% of deaths associated with unsafe water and sanitation, and 56% of the deaths associated with household air pollution occur at age 65 years or older, these deaths are excluded from economic calculations based on producti-vity losses. The VSL approach values these deaths by what people are willing to pay to avoid them. By contrast, the method based on productivity losses presented in table 3 assigns no value to deaths that occur at age 65 years or older.
Although pollution damages are highest, in absolute terms, in high-income countries, they are highest as a proportion of income in low and middle-income countries. Table 5 shows the damages associated with
each pollutant category, measured in 2015 US dollars at market exchange rates and as a percent of gross national income (which represents the sum of incomes earned by all residents of a country), and summarised by World Bank income category. The method used to calculate these damages is identical to that used in the Institute for Health Metrics and Evaluation-World Bank study;279 however, this Commission presents all figures converted to 2015 US dollars at market exchange rates rather than using purchasing power parity dollars. Because the ability to pay to reduce mortality risks increases with income, it is highest for high-income countries. The value of avoided mortality as a percent of income is, how ever, much higher as a proportion of income for low-income and middle-income countries—between 8·3% and 9·4% of gross national income, reflecting the fact that most pollution deaths occur in these countries.
Ambient and household air pollution together constitute the largest category of welfare damages for all groups of countries. In high-income and upper middle-income countries, the damages associated with ambient air pollution outweigh the damages associated with household air pollution—ie, eliminating all deaths due to ambient air pollution would yield higher benefits than eliminating all deaths due to household air pollution. The reverse is true in lower middle-income and low-income countries. The damages from unsafe water and sanitation remain substantial, constituting 39% of damages in low-income and 27% of damages in lower middle-income countries.
Panel 6: Summary of Commission’s estimates of the health costs of pollution-related disease
• Inhigh-incomecountries,health-carespendingondiseases caused by air pollution alone amounted to 3·5% of total health expenditures in 2013.
• InSriLanka,theonlylow-incomeormiddle-incomecountry for which data are available, health-care spending on diseases due to air pollution accounted for an estimated 7·4% of health-care spending in 2013.
• Thecostsoflostproductivityfrompollution-relateddisease are estimated to be between 1·3% and 1·9% of gross domestic product (GDP) in low-income countries, and between 0·6% and 0·8% of GDP in low-middle income countries.
• Inhigh-incomeandupper-middle-incomecountries,thecost of lost productivity associated with pollution-related disease is estimated to have exceeded US$53 billion in 2015.
• Whenthewillingness-to-paymethodisusedtoestimatethe amount that people would be willing to pay to avoid premature death due to pollution-related disease, the total is estimated to be more than US$4.6 trillion, which is 6·2% of global economic output.
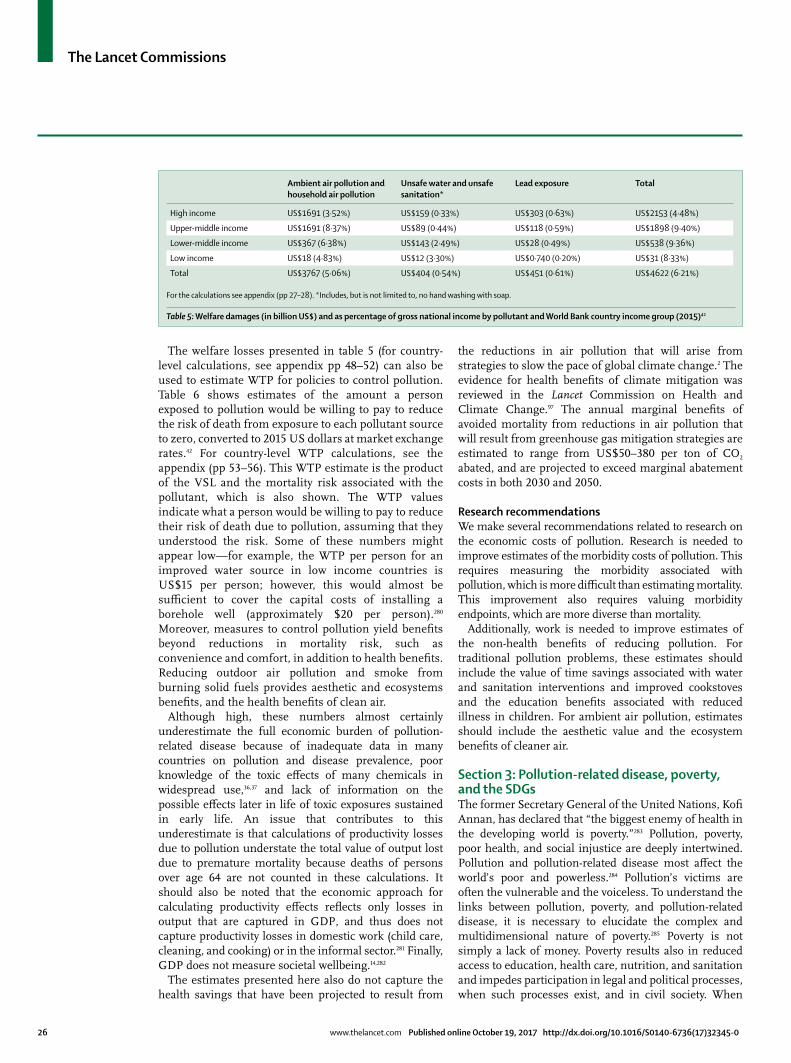
The Lancet Commissions
26 www.thelancet.com Published online October 19, 2017 http://dx.doi.org/10.1016/S0140-6736(17)32345-0
The welfare losses presented in table 5 (for country-level calculations, see appendix pp 48–52) can also be used to estimate WTP for policies to control pollution. Table 6 shows estimates of the amount a person exposed to pollution would be willing to pay to reduce the risk of death from exposure to each pollutant source to zero, converted to 2015 US dollars at market exchange rates.42 For country-level WTP calculations, see the appendix (pp 53–56). This WTP estimate is the product of the VSL and the mortality risk associated with the pollutant, which is also shown. The WTP values indicate what a person would be willing to pay to reduce their risk of death due to pollution, assuming that they understood the risk. Some of these numbers might appear low—for example, the WTP per person for an improved water source in low income countries is US$15 per person; however, this would almost be sufficient to cover the capital costs of installing a borehole well (approximately $20 per person).280 Moreover, measures to control pollution yield benefits beyond reductions in mortality risk, such as convenience and comfort, in addition to health benefits. Reducing outdoor air pollution and smoke from burning solid fuels provides aesthetic and ecosystems benefits, and the health benefits of clean air.
Although high, these numbers almost certainly underestimate the full economic burden of pollution-related disease because of inadequate data in many countries on pollution and disease prevalence, poor knowledge of the toxic effects of many chemicals in widespread use,36,37 and lack of information on the possible effects later in life of toxic exposures sustained in early life. An issue that contributes to this underestimate is that calculations of productivity losses due to pollution understate the total value of output lost due to premature mortality because deaths of persons over age 64 are not counted in these calculations. It should also be noted that the economic approach for calculating productivity effects reflects only losses in output that are captured in GDP, and thus does not capture productivity losses in domestic work (child care, cleaning, and cooking) or in the informal sector.281 Finally, GDP does not measure societal wellbeing.14,282
The estimates presented here also do not capture the health savings that have been projected to result from
the reductions in air pollution that will arise from strategies to slow the pace of global climate change.2 The evidence for health benefits of climate mitigation was reviewed in the Lancet Commission on Health and Climate Change.97 The annual marginal benefits of avoided mortality from reductions in air pollution that will result from greenhouse gas mitigation strategies are estimated to range from US$50–380 per ton of CO2 abated, and are projected to exceed marginal abatement costs in both 2030 and 2050.
Research recommendationsWe make several recommendations related to research on the economic costs of pollution. Research is needed to improve estimates of the morbidity costs of pollution. This requires measuring the morbidity associated with pollution, which is more difficult than estimating mortality. This improvement also requires valuing morbidity endpoints, which are more diverse than mortality.
Additionally, work is needed to improve estimates of the non-health benefits of reducing pollution. For traditional pollution problems, these estimates should include the value of time savings associated with water and sanitation interventions and improved cookstoves and the education benefits associated with reduced illness in children. For ambient air pollution, estimates should include the aesthetic value and the ecosystem benefits of cleaner air.
Section 3: Pollution-related disease, poverty, and the SDGsThe former Secretary General of the United Nations, Kofi Annan, has declared that “the biggest enemy of health in the developing world is poverty.”283 Pollution, poverty, poor health, and social injustice are deeply intertwined. Pollution and pollution-related disease most affect the world’s poor and powerless.284 Pollution’s victims are often the vulnerable and the voiceless. To understand the links between pollution, poverty, and pollution-related disease, it is necessary to elucidate the complex and multidimensional nature of poverty.285 Poverty is not simply a lack of money. Poverty results also in reduced access to education, health care, nutrition, and sanitation and impedes participation in legal and political processes, when such processes exist, and in civil society. When
Ambient air pollution and household air pollution
Unsafe water and unsafe sanitation*
Lead exposure Total
High income US$1691 (3·52%) US$159 (0·33%) US$303 (0·63%) US$2153 (4·48%)
Upper-middle income US$1691 (8·37%) US$89 (0·44%) US$118 (0·59%) US$1898 (9·40%)
Lower-middle income US$367 (6·38%) US$143 (2·49%) US$28 (0·49%) US$538 (9·36%)
Low income US$18 (4·83%) US$12 (3·30%) US$0·740 (0·20%) US$31 (8·33%)
Total US$3767 (5·06%) US$404 (0·54%) US$451 (0·61%) US$4622 (6·21%)
For the calculations see appendix (pp 27–28). *Includes, but is not limited to, no hand washing with soap.
Table 5: Welfare damages (in billion US$) and as percentage of gross national income by pollutant and World Bank country income group (2015)42

The Lancet Commissions
www.thelancet.com Published online October 19, 2017 http://dx.doi.org/10.1016/S0140-6736(17)32345-0 27
families lack access to food, clothing, and shelter, they do not have the resources to support even a minimum level of health.
This Section of the Commission report presents data documenting that pollution and pollution-related disease are concentrated among the poor and contribute to the intergenerational perpetuation of poverty. Pollution-related disease can result in lost income and increased health-care costs, thus imposing disproportionately great economic burdens on poor families and communities.286 In children, early-life exposure to neurotoxic pollutants can impair cognitive function and diminish the ability to concentrate, further contributing to school failure and reducing lifetime earnings. In example, a long-term follow-up study144 of children exposed to lead reported that an elevated blood lead concentration at age 11 years was associated with lower cognitive function and reduced socioeconomic status at age 38 years, with diminished IQ,anddownwardsocialmobility.Moreover,povertycanworsen health, for example, by forcing people to live in environments that make them ill, without decent shelter, clean water, or adequate sanitation.287 When people live near polluting factories or downstream from hazardous waste sites, or when poor women have no alternative but to cook with traditional stoves in close quarters, or when children are forced to pick by hand through electronic waste to recover precious metals to sustain themselves and their families,288 poverty can exacerbate poor health.
Without political influence and with little power in most countries to control or prevent pollution, the poor have limited ability to determine the fate of their communities. Their dependence for survival on tight social networks further restricts their mobility and opportunities. The result of these interconnected forces is that poverty is a trap that often spans generations. The poor have disproportionately heavy exposures to pollution and disproportionately high amounts of disease, disability, and premature death.289,290 A major challenge to enlightened heads of government is to balance economic development that lifts people and communities out of poverty against pollution control and the prevention of pollution-related disease.
Pollution threatens fundamental human rights: the rights to life, to health, and to wellbeing.291 It jeopardises the rights of the child, the right to safe work, and the
protection of the most vulnerable.292 Pollution and pollution-related disease are often reflections of environmental injustice. Many countries recognise the right to a healthy environment as a basic human right linked to the right to life and other fundamental human rights.293,294 The right to a healthy environment also includes the right to safe food and water and adequate housing.293,294
Recognition of the right to a healthy environment requires that all members of a society have unfettered access to information about sources and patterns of pollution; that they have the power to participate in environmental planning and decision making; and that there is an environmental regulatory agency and an independent judiciary that protect the environment from polluters, and the poor against pollution.295
Pollution and pollution-related disease are often reflections of environmental injustice. Robert Bullard, widely regarded as the father of the environmental justice movement,296 defines a core principle of environmental justice as “all people and communities are entitled to equal protection of environmental and public health laws and regulations.”297 Bullard stresses that environmental justice is a far-reaching concept that involves much more than equal enforcement of laws and regulations. In Bullard’s view, environmental justice is a basic human and civil right and requires meaningful and timely involvement of people and communities in decisions that affect their environment and wellbeing. In 1991 Bullard and his colleagues, at the first National People of Color Environmental Leadership Summit adopted 17 Principles of Environmental Justice.298 These principles were developed as a guide for organising, networking, and relating to government and non-government organisations.
Environmental injustice is the inequitable exposure of poor, minority, and disenfranchised populations to toxic chemicals, contaminated air and water, unsafe workplaces and other forms of pollution, and the consequent disproportionate burden among these populations of pollution-related disease, often in violation of their human rights. Environmental injustice has been characterised as a form of structural violence.299 In many instances, environmental injustice is linked to so-called “structural racism”.300
Ambient air pollution Household air pollution Unsafe water sources Unsafe sanitation Lead exposure
High income US$1472 (4·0) US$98 (0·7) US$11 (0·1) US$1 (0·007) US$264 (0·7)
Upper-middle income US$523 (6·8) US$214 (2·9) US$13 (0·2) US$5 (0·1) US$47 (0·6)
Lower-middle income US$85 (6·9) US$66 (5·7) US$39 (3·1) US$23 (1·9) US$10 (0·7)
Low income US$13 (4·1) US$23 (7·4) US$15 (4·8) US$11 (3·6) US$1 (0·4)
Average US$459 (6·2) US$123 (4·6) US$25 (2·0) US$14 (1·3) US$64 (0·7)
Numbers in parentheses are number of deaths associated with the pollutant per 10 000 people associated with the pollutant. For the calculations see appendix (pp 27–28).
Table 6: “Willingness to pay” per person (in US$, 2015) to reduce risk of death associated with pollution, by World Bank country income group and pollution type42

The Lancet Commissions
28 www.thelancet.com Published online October 19, 2017 http://dx.doi.org/10.1016/S0140-6736(17)32345-0
Global spread of extractive industries: oil and gas production, mining, and smeltingSocial and economic factors that have contributed to the global spread of environmental injustice and the in-equitable exposure of poor and marginalised populations to pollution and disease include globalisation, which has caused the movement of hazardous industries such as chemical manufacture, steel making, pesticide production, and shipbreaking from higher income countries to low-income and middle-income countries. This movement has entailed low wages, little or no environmental and occupational regulation, and weak public health infra-structure. The consequences of these occupational and environmental conditions are disease and injury in underprotected workers, diseases caused by toxic chemicals in residents of communities near polluting facilities, and industrial explosions. Examples include the chemical explosion in Bhopal, India where a pesticide production factory that had been trans-shipped from the USA detonated and killed and injured thousands or workers and local residents; the global trade in asbestos that results in shipment of 2 million tons of asbestos annually to the world’s poorest countries, where it will produce epidemics of lung cancer, mesothelioma, and other malignancies;214 and the global trade in banned and restricted pesticides.
Transboundary transfers of hazardous and toxic wastes, such as electronic wastes and chemical wastes, from high-income to low-income and middle-income countries are a further cause of the global spread of environmental injustice. The global spread of artisanal and small-scale gold mining and the concomitant spread of occupational and community-wide exposure to elemental mercury and methylmercury are another example.112,113 The expansion of gold mining is driven by large increases in the global price of gold, which
encourage poor people to leave agriculture and other traditional occupations. Although small-scale mining is relatively profitable for the miners, it is highly exploitative in that the majority of the profits accrue with brokers and retailers, and the burdens of disease and environmental degradation fall almost entirely upon mining communities. Regional conflicts and wars, frequently driven by a desire for natural resources (namely oil, minerals, and timber) further aggravate these problems.
Environmental injustice exists in countries at all levels of income and development and in all regions of the world,284,301–303 as can be seen in the following examples and case studies.
Combating environmental injusticeTo advance environmental justice and reduce the inequitable exposure of the poor and the marginalised, countries must develop legal mechanisms that provide recourse for environmental injustice. India’s green court, for example, provides citizens with access to an independent judiciary that has the power to redress pollution injustices. Such a system, when connected with openly shared data on toxic exposures and health can serve as a powerful mechanism to address environmental injustice (panel 7).
Environmental injustice in North America is well documented. Recurrent racial and ethnic disparities have been documented in North America in exposures to various forms of pollution. A study of the ambient air pollution in New York City have documented that almost all diesel bus depots, places where buses idle their engines for hours while emitting pollutants, are in minority, mostly disadvantaged neighbourhoods. Dis-proportionately increased pre valence of asthma and other respiratory diseases have been documented among children in these com munities.304 In the so-called “Cancer Alley” region of Louisiana, an 85 mile stretch along the Mississippi River where 125 companies manufacture a quarter of all petrochemical products made in North America, the US Commission on Civil Rights determined that the African-American community was economically disadvantaged and disproportionately affected by pollution from hazardous facilities.305 Another case study306 of environmental injustice in the USA relates to the exploitative uranium mining operations on Native American (Navajo) lands. Mining operations there depleted and contaminated the scarce water supply and produced high prevalence of lung cancer in Navajo underground miners, who suffered intense occupational exposures to radon.306 A final example involves the disproportionate exposures of Hispanic farm workers to acutely toxic organophosphate pesticides, such as parathion. Several cases of acute pesticide poisoning have resulted. Many of these workers are undocumented immigrants and, hence, afraid to protest environmental injustice and pollution.307
Panel 7: India’s judicial system for pollution
During the UN Conference on Environment and Development in 1992, India committed to providing judicial and administrative remedies for the victims of environmental damage. To fulfil this commitment, India became the third country in the world to start a National Green Tribunal, a judicial body exclusively established to judge environmental cases. The National Green Tribunal was formed on Oct 18, 2010. The focus of this body is on the effective and expeditious resolution of cases relating to environmental protection and conservation of forests and other natural resources. The National Green Tribunal is mandated to make final judgments on applications and appeals within 6 months of their filing. The National Green Tribunal is comprised of judges, who are supported by environmental experts to provide informed guidance on environmental issues, to validate the Tribunal’s legal judgments.
Cases such as the Vedanta Bauxite Smelter in Orissa, the Thermal Power Plants in Andhra Pradesh, and the Jaitpur Nuclear Power Plant in Maharashtra have seen controversy and protests. The involvement of the National Green Tribunal has resulted in amicable solutions to these cases, ensuring the people of the affected regions a safe and liveable environment. Before establishment of the National Green Tribunal there were numerous cases in which large industries were confronted by local people fighting for the environment.

The Lancet Commissions
www.thelancet.com Published online October 19, 2017 http://dx.doi.org/10.1016/S0140-6736(17)32345-0 29
In Canada, environmental injustice occurs in the traditional lands of First Nations (indigenous peoples). First Nations are battling the Alberta Oil Sands Project in northern Alberta308 and exposure to Canada’s worst air pollution hotspot in Ontario’s so-called “Chemical Valley”, where 40% of the country’s chemical manufacturing is located.309
Environmental injustice issues are also prevalent in Europe.310 In central and eastern Europe, some minority Roma people and refugee and displaced communities from Kosovo have faced environmental injustice. In Kosovo, camps for displaced Roma were located in an area polluted by toxic tailings from a lead mine. In Durres, Albania, refugees from Kosovo were housed in a disused chemical plant that had previously produced sodium dichromate and lindane, compounds classified by the International Agency for Research on Cancer as class 1 (proven) human carcinogens.311
In Asia, the sustained economic growth that has enabled substantial reduction in poverty has simultaneously increased toxic pollution and environmental inequity.312 In China, a highly publicised example involved a paraxylene chemical factory in the city of Dalian, where residents feared that typhoons could breach chemical storage tanks and flood lower socioeconomic areas of the city with toxic material.313
In India, a well studied example of environmental injustice is the disproportionate siting of mineral and metals extraction facilities in the Adivasi belt of central and northeast India where 70 million Adivasis—tribal people—live in extreme poverty and are disproportionately exposed to air, water, and soil pollution produced by these facilities.313 In a landmark case linking the mining industry in the Adivasi belt to environmental injustice,314 the Indian Supreme Court observed that the fundamental rights of citizens, guaranteed by the Constitution, included “the right of enjoyment of pollution-free water and air for full enjoyment of life”.
In Africa, extraction of natural resources is a major driver of environmental injustice and pollution. In Zambia, the lead and zinc mines at Kabwe are among the world’s most polluted places. Although these mines are no longer active, the residue left behind after decades of extraction by overseas-based companies have contaminated soil and the local water supply. Children in Kabwe have blood lead concentrations that are 5–10 times higher than the threshold concentration recommended by the US Centers for Disease Control and Prevention.315 Mineral extraction has also been associated with environmental injustice in post-apartheid South Africa, where large-scale gold mining has resulted in epidemic silicosis among miners, many of them economic migrants from the poor countries of southern Africa surrounding South Africa.313 Gold mining was also the cause of the 2010 tragedy in Zamfara State, Nigeria, in which 163 people in deeply impoverished communities, including 111 children, died of acute lead poisoning.316
Similar events have been recorded in relation to gold mining in Ghana.
In Latin America, environmental inequality is evident in a series of clashes between extractive industries, particularly the mining industry but also oil and gas production, and indigenous communities. Examples include the Tia Maria copper project in Peru, operated by Mexico’s Southern Copper Corporation, the world’s second largest copper mining company, and the USA-based Newmont Mining Company’s US$4·8 billion Conga gold-copper project, Peru’s biggest mining investment. Protests against the inequitable placement of these enormous projects on lands belonging to native peoples and the resulting disproportionate burdens of pollution, environmental degradation, and disease are reshaping basic paradigms of resource-based develop ment. These struggles have forced contemporary legal systems, including legal systems in the high-income home countries of mining conglomerates, to accommodate indigenous world views and to correct, rather than perpetuate the unjust effects of economic growth upon the poor.313,317
With the worldwide spread of toxic chemicals and modern-day pollution, interest has grown in investigating, documenting, and mapping environmental injustice. Information produced through these efforts, especially information documenting patterns of pollution at the local level, can provide powerful leverage to disproportionately exposed communities who are struggling to reduce their exposure and their inequitable burden of pollution-related disease.
In Europe, the Environmental Justice Atlas, a global online database, now lists information on about 2000 sites around the world where pollution and environmental injustice are documented or suspected. Linked to this database is Environmental Justice, Organisations, Liabilities and Trade, a global research project supported by the European Commission that is compiling The Map of Environmental Justice, an atlas of maps documenting the distribution of pollution and environmental injustice around the world.318
Pure Earth, a New York-based environmental non-profit organisation has developed a Toxic Sites Inventory Program that includes information on about 3500 polluted sites—active and abandoned mines, smelters, factories, and hazardous waste dumps—a number that is still growing.38 This database focuses on contaminated sites in low-income and middle-income countries and has served as a resource to the work of this Commission.
In the USA, the Environmental Protection Agency has developed an open-access mapping tool, EJSCREEN, that is available on the EPA website and makes data on environmental injustice publicly available. This tool overlays 12 environmental factors, including information on levels of airborne particulate matter, lead paint, and proximity to water discharges with six demographic factors, including income level and percentage of the population classified as minority. The resulting maps
For the Environmental Justice Atlas see https://ejatlas.org/
For EJSCREEN see https://www.epa.gov/ejscreen
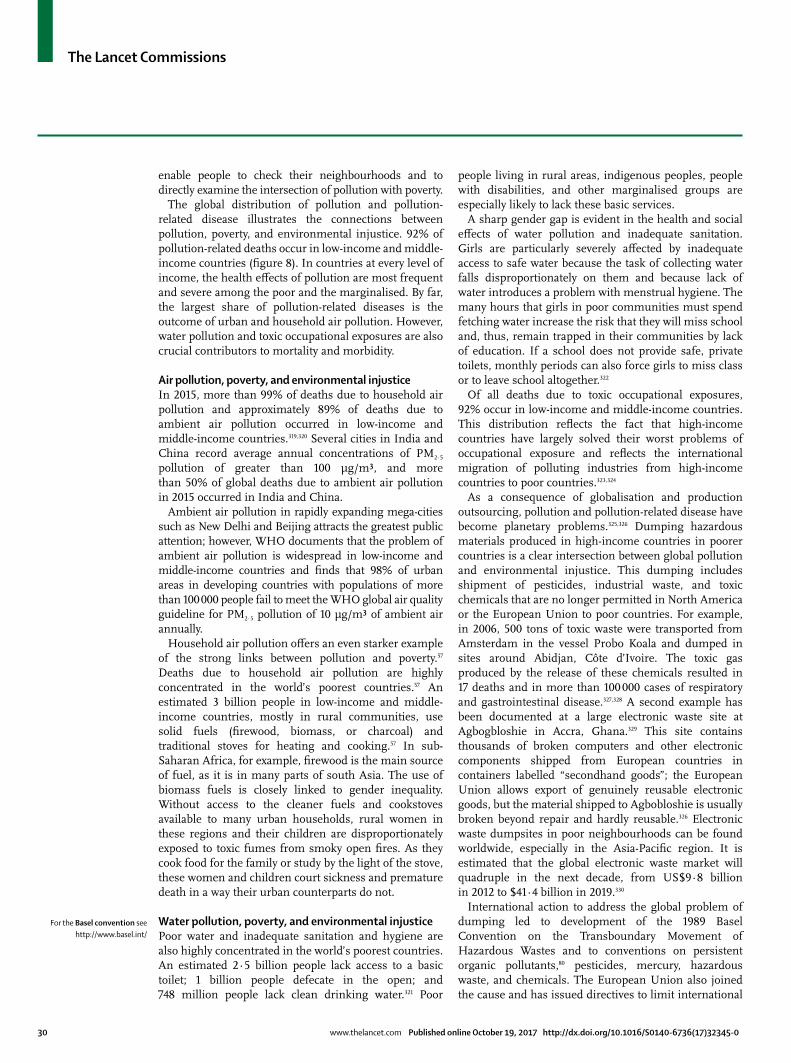
The Lancet Commissions
30 www.thelancet.com Published online October 19, 2017 http://dx.doi.org/10.1016/S0140-6736(17)32345-0
enable people to check their neighbourhoods and to directly examine the intersection of pollution with poverty.
The global distribution of pollution and pollution-related disease illustrates the connections between pollution, poverty, and environmental injustice. 92% of pollution-related deaths occur in low-income and middle-income countries (figure 8). In countries at every level of income, the health effects of pollution are most frequent and severe among the poor and the marginalised. By far, the largest share of pollution-related diseases is the outcome of urban and household air pollution. However, water pollution and toxic occupational exposures are also crucial contributors to mortality and morbidity.
Air pollution, poverty, and environmental injusticeIn 2015, more than 99% of deaths due to household air pollution and approximately 89% of deaths due to ambient air pollution occurred in low-income and middle-income countries.319,320 Several cities in India and China record average annual concentrations of PM2·5 pollution of greater than 100 μg/m³, and more than 50% of global deaths due to ambient air pollution in 2015 occurred in India and China.
Ambient air pollution in rapidly expanding mega-cities such as New Delhi and Beijing attracts the greatest public attention; however, WHO documents that the problem of ambient air pollution is widespread in low-income and middle-income countries and finds that 98% of urban areas in developing countries with populations of more than 100 000 people fail to meet the WHO global air quality guideline for PM2·5 pollution of 10 μg/m³ of ambient air annually.
Household air pollution offers an even starker example of the strong links between pollution and poverty.57 Deaths due to household air pollution are highly concentrated in the world’s poorest countries.57 An estimated 3 billion people in low-income and middle-income countries, mostly in rural communities, use solid fuels (firewood, biomass, or charcoal) and traditional stoves for heating and cooking.57 In sub-Saharan Africa, for example, firewood is the main source of fuel, as it is in many parts of south Asia. The use of biomass fuels is closely linked to gender inequality. Without access to the cleaner fuels and cookstoves available to many urban households, rural women in these regions and their children are disproportionately exposed to toxic fumes from smoky open fires. As they cook food for the family or study by the light of the stove, these women and children court sickness and premature death in a way their urban counterparts do not.
Water pollution, poverty, and environmental injusticePoor water and inadequate sanitation and hygiene are also highly concentrated in the world’s poorest countries. An estimated 2·5 billion people lack access to a basic toilet; 1 billion people defecate in the open; and 748 million people lack clean drinking water.321 Poor
people living in rural areas, indigenous peoples, people with disabilities, and other marginalised groups are especially likely to lack these basic services.
A sharp gender gap is evident in the health and social effects of water pollution and inadequate sanitation. Girls are particularly severely affected by inadequate access to safe water because the task of collecting water falls disproportionately on them and because lack of water introduces a problem with menstrual hygiene. The many hours that girls in poor communities must spend fetching water increase the risk that they will miss school and, thus, remain trapped in their communities by lack of education. If a school does not provide safe, private toilets, monthly periods can also force girls to miss class or to leave school altogether.322
Of all deaths due to toxic occupational exposures, 92% occur in low-income and middle-income countries. This distribution reflects the fact that high-income countries have largely solved their worst problems of occupational exposure and reflects the international migration of polluting industries from high-income countries to poor countries.323,324
As a consequence of globalisation and production outsourcing, pollution and pollution-related disease have become planetary problems.325,326 Dumping hazardous materials produced in high-income countries in poorer countries is a clear intersection between global pollution and environmental injustice. This dumping includes shipment of pesticides, industrial waste, and toxic chemicals that are no longer permitted in North America or the European Union to poor countries. For example, in 2006, 500 tons of toxic waste were transported from Amsterdam in the vessel Probo Koala and dumped in sites around Abidjan, Côte d’Ivoire. The toxic gas produced by the release of these chemicals resulted in 17 deaths and in more than 100 000 cases of respiratory and gastrointestinal disease.327,328 A second example has been documented at a large electronic waste site at Agbogbloshie in Accra, Ghana.329 This site contains thousands of broken computers and other electronic components shipped from European countries in containers labelled “secondhand goods”; the European Union allows export of genuinely reusable electronic goods, but the material shipped to Agbobloshie is usually broken beyond repair and hardly reusable.326 Electronic waste dumpsites in poor neighbourhoods can be found worldwide, especially in the Asia-Pacific region. It is estimated that the global electronic waste market will quadruple in the next decade, from US$9·8 billion in 2012 to $41·4 billion in 2019.330
International action to address the global problem of dumping led to development of the 1989 Basel Convention on the Transboundary Movement of Hazardous Wastes and to conventions on persistent organic pollutants,80 pesticides, mercury, hazardous waste, and chemicals. The European Union also joined the cause and has issued directives to limit international
For the Basel convention see http://www.basel.int/

The Lancet Commissions
www.thelancet.com Published online October 19, 2017 http://dx.doi.org/10.1016/S0140-6736(17)32345-0 31
dumping that include restrictions on hazardous substances and on waste electrical and electronic equipment, both promulgated in 2002. Although these conventions and directives are limited by weak enforcement and by structural impediments, such as the requirement in the Rotterdam Convention for complete unanimity amongst all participating countries before a pollutant can be proscribed, they have, nonetheless, helped to slow the global movement of toxic substances and reduce toxic pollution.
Pollution, poverty, and the UN’s SDGsThe SDGs were adopted by the United Nations in September 2015 to guide the international development agenda until 2030. The SDGs are intended to advance human dignity in countries around the world.331 It is of note that the predecessor to the SDGs, the Millennium Development Goals that guided global action until 2015, made no mention of pollution at all. By contrast, SDGs focus on the issue to an extraordinary extent, as noted in the introduction, and as befits an issue so integral to the fight against poverty. The main provision is, appropriately, in SDG 3 on good health and wellbeing, where SDG 3·9 commits the world community, by 2030, to “substantially reduce the number of deaths and illnesses from hazardous chemicals and air, water, and soil pollution and contamination”.332 The other pollution-specific goal is SDG 6 on water and sanitation, in which SDG 6·3 calls, by 2030, to “improve water quality by reducing pollution, eliminating dumping and minimizing release of hazardous chemicals and materials, halving the proportion of untreated wastewater and substantially increasing recycling and safe reuse globally”.
However, the SDGs do not leave the issue there. Given the close linkages between poverty and exposure to toxic pollution and the need to reduce, if not eliminate, both, the SDGs seem to recognise that some actions to achieve the broader goals, such as SDG 1 (end poverty) and SDG 2 (end hunger), could, if unchecked, result in exacerbation of pollution exposures. Hence, pollution control must be central to agricultural and industrial development, if development of these is to be truly sustainable. To this end, the SDGs make repeated references to preventing and reducing pollution. These include SDG 2·4 (improving soil quality), SDG 7 (clean energy), SDG 9·4 (clean technologies and industrial processes), SDG 11 (sustainable cities and communities), SDG 12 (responsible consumption and production), and SDGs 14–15 (water and land conservation). Achievement of these SDGs will also positively affect environmental justice and fulfil SDG 10 (reduced inequalities). Importantly, measures to reduce greenhouse gas emissions and short-lived climate pollutants, such as black carbon, will help achieve SDG 13 (climate action).
The SDGs are explicitly about sustainable development but, for development to be sustainable, it must both combat poverty and ensure equity. In 1987, the Report
of the World Commission on Environment and Development on “our common future” stated that sustainable development must assure the poor that they receive a fair share of the resources required to sustain their economic growth.333 With the growing recognition that pollution not only exacerbates poverty but leads to environmental injustice, sustainability of development is now also increasingly linked to equity. As observed in the Human development report 2011 by the United Nations Development Programme,334 sustainability and equity might not always be mutually reinforcing (although they can sometimes be), and the most feasible alternative solutions might require explicit and careful consideration of the trade-offs involved. Such an approach to pollution control will not only yield positive synergies between sustainability and equity but also ensure that the SDGs regarding poverty, pollution, and environmental justice are comprehensively met.
The Regional Action Plan for Intergovernmental Cooperation on Air Pollution for Latin America and the Caribbean, prepared by UN Environment Programme in the context of the Latin America and the Caribbean Forum of Ministers of Environment is an example of a high-level plan that sets out common directions for national governments to work together on broad issues.335 This Action Plan promotes collaboration towards the creation and adoption of national and local policies and programmes to reduce emissions of key pollutants and to achieve improvements in urban air quality in the region. The Action Plan covers broad supportive activities such as technical assistance, policy cooperation, methods, research, and awareness raising and monitoring. The Regional Action Plan will support and encourage the national and local administrations to develop and implement practical local plans to reduce the effects of air pollution.
Research recommendationsTo reduce the inequitable exposure of the poor and the marginalised to pollution, this Commission recommends two key strategies. First, we recommend funding of research to document and map the disproportionate effects of pollution upon the poor, women, and girls be adopted as a priority by international health agencies. Additionally, a special focus should be placed on overseas development assistance to protect indigenous peoples and their communities from pollution and its harmful effects.
Section 4: Effective interventions against pollution: priorities, solutions, and benefitsA key message of this Commission report is that, with leadership, resources, and a clearly articulated, data-driven strategy, much of the world’s pollution can be controlled and pollution-related disease prevented. Strategies to curb pollution have been developed, field-tested, and proven cost-effective. These strategies were developed initially in high-income countries and are now moving into
For the Rotterdam convention see http://www.pic.int/

The Lancet Commissions
32 www.thelancet.com Published online October 19, 2017 http://dx.doi.org/10.1016/S0140-6736(17)32345-0
middle-income countries. They are based on law and regulation, rely heavily upon technology, are subjected to continuous evaluation, are backed by strong enforcement, and incorporate the polluter-pays principle. These programmes are held accountable to targets and timetables. These successful, effective strategies for pollution control can be used as models and adapted to local circumstances in cities and countries at every level of income. Their application can enable developing cities and countries to leapfrog over the worst of the human and ecological disasters that have plagued economic development in the past.
A second key message is that control and prevention of pollution provide several benefits, both short-term and long-term, for societies at every level of income. The direct benefits of pollution mitigation include improvements in
air and water quality and improvements in health. The health benefits include reductions in disease incidence and prevalence, improvements in children’s health, reductions in the numbers of premature deaths, increasing longevity, and substantial enhancements in quality of life. Indirect benefits include enhancing gender equity, alleviating poverty, increasing tourism, improving education, and enhancing political stability. Pollution control makes cities more liveable and attractive, benefits ecosystems, improves the economy and, when coupled with efforts to transition to clean fuels and to control emissions of greenhouse gases, pollution control can help to slow the pace of global climate change and accelerate the transition to a cleaner, more sustainable, circular economy.81,336,337
These many benefits of pollution control underscore the reality that pollution is much more than merely an environmental challenge; pollution is a profound and pervasive threat that affects many aspects of human health and wellbeing.
Pollution control today builds on the successes of the past. The industrially developed countries were the first to control pollution, and many of their control strategies were adopted in the aftermath of environmental and public health disasters caused by pollution. Thus, in mid-19th century London, UK, putrid contamination of the River Thames and recurrent epidemics of cholera led to regulation of public drinking water sources338 and to the construction of large conduits for the removal of human waste and industrial pollution that now form the Thames Embankment.339 Episodes of severe air pollution with substantial loss of life, such as the Great Fog of London in 1952,340 and the Donora, Pennsylvania episode in the USA led to the passage of clean air legislation. Occupational and mining disasters catalysed the development of worker health and safety legislation. The discovery of contaminated toxic sites in the USA at Love Canal in New York and the Valley of the Drums in Kentucky led to legislation mandating clean-up of hazardous waste sites—the Superfund legislation.175 An epidemic of congenital methylmercury poisoning in Minamata, Japan341 led to global action to protect human health and the environment against mercury and culminated in adoption of the Minamata Convention.198
In response to the rapid, poorly controlled growth of cities and the global spread of industrial production and chemically intensive agriculture, low-income and middle-income countries have become increasingly engaged in pollution control. Targeted interventions to control water pollution, improve sanitation, and reduce waterborne diseases were among the earliest efforts to control pollution in low-income and middle-income countries, and began as early as the 1950s. Bangladesh has long been in the forefront of this work,342,343 China has made extraordinary progress in control of water pollution and prevention of waterborne infectious disease (panel 8),344–354
Panel 8: China’s recent experience
In its 13th Five-Year Plan, for 2016, the Government of China acknowledged the dangers posed by pollution344 and set specific targets for environmental improvement and restriction of resource use.
Air pollution• ChinaadoptedTheAirPollutionPreventionandControlLawin1987.Thislawandits
subsequent revisions have resulted in an 10% national decline in particulate matter less than 2·5 µm (PM2·5) between 2014 and 2016, despite extremely high particulate concentrations in certain cities such as Beijing.345 A 2016 amendment to the law explicitly mentioned, for the first time, the connection between environmental protection and public health.346
• Chinahasincreaseditsrelianceonnon-fossilenergysources(predominantlyrenewables and nuclear) from 9·4% of total energy use in 2010 to 12·0% in 2015, surpassing the 12th Five-Year Plan target of 11·4% by 2015. The most recent Five-Year Plan347 aims to increase non-fossil energy use to at least 15% by 2020, and to at least 20% by 2030.
• Chinahasimplementedavastnetworkofstationstomonitorairqualityinmorethan400 cities. The capacity to track emissions has been central to developing policy and implementing data-driven regulatory frameworks.348
Water pollution• China’smostrecentwaterpollutionlegislation,theWaterTenPlan,wasadoptedin
April, 2015.349 This plan sets metrics and targets for ten major polluting industries. Among key targets to be met by 2020 are: more than 70% of water in seven key rivers shall reach Grade III or above; more than 93% of urban drinking water sources shall reach Grade III or above; reduce groundwater extraction and control groundwater pollution; and use of groundwater falling under the “very bad” category shall decrease to around 15%.
• TheMinistryofEnvironmentalProtectionestimatesthattheWaterTenPlanwillboostGDP by ¥5·7 trillion (US$91 billion), with a ¥1·9 trillion benefit to the affected industries.350
Soil pollution• The13thFive-YearPlancallsfortheestablishmentoflawstomonitor,prevent,and
remediate soil pollution. The goal is to make 90% of polluted arable land safe for agricultural use by 2020, increasing to 95% by 2030.351 The Ministry of Environmental Protection estimates that the actions of the 13th Five-Year Plan could add ¥2·7 trillion ($411 billion) to the nation’s GDP and create around 2 million jobs.352
• TheFive-YearPlanalsodetailsanationwidesoilqualitymonitoringprogramme.353,354
For the Minamata convention see http://www.
mercuryconvention.org/

The Lancet Commissions
www.thelancet.com Published online October 19, 2017 http://dx.doi.org/10.1016/S0140-6736(17)32345-0 33
and Peru has embarked on a programme to improve mine drainage.355
Air pollution control programmes are developing in cities in several low-income and middle-income countries, including Mexico City,356 Ulaanbaatar,357 and New Delhi.358 China is embarking on a national effort to reduce air pollution that includes a plan to dramatically increase reliance on non-polluting, renewable energy sources, and is on track to nearly triple its solar capacity between 2015 and 2020, adding 15 to 20 GW of solar capacity per year.123,359–361
Most countries now have programmes in place to address some aspects of pollution, and almost all have established frameworks for regulatory control of industry, although staffing, resources, and enforcement capacity are variable.362 This Section of the Commission report enumerates the benefits of pollution control, describes key elements of successful pollution control strategies and the responsibilities of stakeholders, and it concludes with recommendations.
The benefits of pollution controlExamples of pollution control and its benefits are presented in this section, panels 9 and 10,119,131,363–367 and in the appendix (pp 63–107).
One benefit afforded by pollution control is reduction of household air pollution by providing liquefied petroleum gas and bio-gas and by providing affordable electricity that is produced by non-polluting, renewable energy sources to replace wood chips, coal, charcoal, and cow dung as cooking fuels. These interventions not only reduce exposures to airborne particulates, thereby improving health, but they also produce short-term and long-term economic returns to local communities because households (especially women) are able to spend less time collecting wood, or processing dung for cooking, and thus have more time to devote to economically productive activities (for women) or education (for girls).368
A second benefit is improvements in sanitation that are achieved by providing clean water and toilets. These interventions not only reduce prevalence of waterborne disease but they also allow more children, especially girls, to attend school.369 These improvements benefit tourism and help lift the economy in developing countries, since a reputation for clean beaches, an unpolluted environment, biodiversity, and safe food and water can help to lure discerning tourists and increase their spending.370
Another benefit is seen in shifting the energy sector from coal-fired power plants to cleaner gas-fired plants, and, better yet, to low-polluting renewable energy sources such as wind, tidal, geothermal, and solar. These interventions not only reduce pollution and improve the cardiorespiratory health of entire popu lations, but they will also sharply reduce greenhouse gas emissions, and increase the efficiency of electricity generation. 371
Additional benefits are produced by controlling urban air pollution by upgrading public transportation, encouraging active transport (walking and cycling), reducing sulphur content of motor fuels, promoting use of low-emission and zero-emission vehicles (while concurrently cleaning the energy supply), and restricting car and trucks from city centres. These interventions not only improve air quality, but will also reduce childhood asthma, reduce incidence of cardiovascular disease, stroke, and diabetes in adults, and enhance the quality of urban life.372,373
Another benefit in controlling pollution is that remediation of highly contaminated sites in densely
Panel 9: Partial successes in reducing air pollution from cookstoves
China’s National Improved Stove Programme• China’sNationalImprovedStoveProgramme(1982–92) has distributed 180 million
improved cookstoves to people in rural areas of China, in conjunction with provincial programmes. This programme is among the world’s largest and most successful national programmes for improved stoves.363 The initiative aimed primarily to increase efficiency and thus reduce the use of biomass fuel. Middle-income households were targeted in this programme, and households were expected to purchase the stoves themselves.364 All improved cookstoves had chimneys, and some had blowers for more efficient combustion.
• Withregardtotheprimaryobjectiveofachievingbetterfuelefficiency,China’sprogramme lowered household air pollution levels, but, unfortunately, this reduction was not sufficient to meet China’s indoor air quality standards and substantial exposures remained. A fundamental problem was that the stove designs did not reduce emissions, but focused on fuel efficiency and, at best, moved the smoke outside, where it still caused exposures. Nevertheless, the programme showed that large-scale effects could be achieved by a well organised and well supported effort that was coordinated nationally, but with substantial local participation. Additionally, an epidemiological study of household stove improvement that was undertaken in a cohort of 21 232 Chinese farmers followed from 1976 to–1992 showed that stove improvement was associated with a greater than 30% reduction in incidence of lung cancer.365
Indian National Programme on Improved Chulha• AsecondnationalprogrammeatasimilarscaletotheChineseprogramme,theIndian
National Programme on Improved Chulha stoves, which operated from about 1984 to2001, was reported to have had little effect on fuel efficiency nationally, and even less in reducing long-term exposure to smoke.366
Gyapa Stoves Project, Accra, Ghana• AnAfricanexampleofasuccessfulcookstoveinterventionwastheGyapaStoves
Project in Accra, Ghana. In 2000, 95% of Ghanaian households used solid fuels to power stoves.367 This was a much higher percentage than the estimated 73·4% for the rest of northwest Africa. Many homes in Ghana were poorly ventilated and the burning of solid fuels, such as savannah wood, was inefficient and contributed to deforestation and ecosystem imbalance. To address this problem, EnterpriseWorks/VITA, Shell Foundation, and USAID partnered in 2002 to implement a programme to replace traditional coal-pots with improved stoves called the Gyapa Stove. The Gyapa stove requires 50–60% less fuel than traditional stoves and produces less smoke. This project was unusual in that it aimed to create a sustainable business model that helped the local economy by creating jobs to manufacture the stoves. In 2008, 68 000 stoves were sold in Accra and Kumasi. Air quality was found to have improved by 40–45%.

The Lancet Commissions
34 www.thelancet.com Published online October 19, 2017 http://dx.doi.org/10.1016/S0140-6736(17)32345-0
populated areas will reduce the prevalence of poisoning by toxic chemicals and heavy metals, will enhance land values, and encourage urban redevelopment. Brownfield remediation projects have been successful in covering the expense of clean-up by the private sector.200
Reductions of exposures to lead from pottery (panel 11)374–376 and paint will reduce childhood lead poisoning and thus enhance the intelligence, creativity,169 and economic productivity of entire societies.46
A final benefit of pollution control results from bans on the production and use of asbestos, which will reduce asbestosis, lung cancer, and malignant mesothelioma and will therefore produce substantial gains in economic productivity by preventing serious illness and premature death and will also result in reductions to health-care costs. In conclusion, well designed and executed pollution control strategies will advance attainment of many of the UN’s SDGs.16
Essential components of pollution control programmesPlanning processes that prioritise interventions against pollution, link pollution control to protection of public
health, and integrate pollution control into development strategies are the first step to dealing with pollution. Defining and prioritising interventions enables a focus on cost-effectiveness and creates roadmaps for comprehensive solutions.
The key societal underpinnings for successful pollution control at any level of development include courageous and visionary leadership by heads of government—mayors, governors, and heads of state—along with an engaged, informed, and empowered civil society. It is also important that there be a shared societal commitment to protecting human health and advancing social justice and a carefully designed, evidence-driven package of pollution control policies.
Effective plans to control pollution require support from many sectors of society and, therefore, must involve collaborations among many agencies and organisations within and outside governments, and nationally and internationally. These stakeholders must be fully inte grated into a city’s or a country’s development agenda. If they are to be successful, these efforts must include not only ministries of health and environment, but also ministries of finance, energy, industry, agriculture, and transport. Pollution control policy cannot exist in isolation.
Successful strategies rely on a mix of primary prevention approaches that eliminate pollution at source, coupled with downstream pollution control technologies, such as filters and stack scrubbers, that remove pollutants from the waste stream after they have already been formed. Examples of highly transformative strategies for pollution control that are based on primary prevention include shifting the mix of energy sources in a city or country away from polluting fuels toward non-polluting, renewable fuels;377 use of safer feedstocks in industrial production, such as feedstocks produced by the burgeoning technologies of green chemistry, which eliminate use of hazardous feedstuffs and production of materials that can cause injury to human health and the environment;378 incentivising the adoption of clean production technologies; and enhancing access to efficient, affordable public transportation.379 Primary prevention can also be achieved by banning highly hazardous and carcinogenic materials such as asbestos, benzene, PCBs, and DDT, as has been successfully achieved in many countries. Primary prevention of pollution based on the elimination of pollution at source is inherently more effective than downstream control technologies, such as stack scrubbers or water filters that reduce the amount and toxicity of pollutant emissions after they have already been formed. Primary prevention of pollution at source is also essential for accelerating transition to a more sustainable, circular economy.
Further elaboration of these themes and case studies on pollution control are presented in the appendix (pp 63–82). The key elements of all successful pollution control plans are discussed in the following sections.
Panel 10: Cleaner fuels and indoor air
In the past 2 years, major advances have made clean fuels more available in several countries. Examples of programmes to introduce cleaner fuels are the following:
The Indian liquefied petroleum gas programme• In2016,Indiasetagoalofprovidingaccesstoliquefiedpetroleumgasto50million
additional poor families in 3 years through a large programme that was operated through the national oil companies. In 2016, more than 10 million households have already been targeted through the national Give it Up campaign, in which middle class families voluntarily give up their liquefied petroleum gas subsidy to a family who are below the poverty line, and corporate responsibility funds are earmarked for the upfront costs.
Ecuador’s electric induction stove programme• InEcuador,thenationalgovernmenthasdevelopedamajorprogrammetochange
every traditional cookstove in the country to an electric induction stove. Electric induction stoves are 50% more efficient and faster than gas or normal electric cooking, and have other advantages, including improved safety. This transition is possible because Ecuador has nearly universal electrification, much of it derived from hydroelectric projects. Other countries, including Paraguay and Bhutan, also have hydropower potential, and both are currently undertaking preparatory studies.
• Ultimately,itisclearthatanyhouseholduseofsolidfuelhasnegativeeffectsonhealth and that the eventual goal should be the elimination of solid fuel and its replacement with cleaner sources of energy. In the interim, in areas and countries where elimination of solid fuel is not immediately possible, transition to the cleanest biomass stoves should be strongly encouraged.119 Millions of lives can be extended every year among the poorest populations in the world by such a transition, but the challenges are still great.
• ProgressinimplementingcleanenergyistrackedbytheInternationalEnergyAgencyat both the national and sectoral levels, which has shown some advances in the generation of cleaner energy nationally, but inadequate progress in meeting transportation goals. The International Energy Agency concludes that “strong actions linked to stated targets need to be pushed forward to achieve the clean energy potential”.

The Lancet Commissions
www.thelancet.com Published online October 19, 2017 http://dx.doi.org/10.1016/S0140-6736(17)32345-0 35
Establish ambitious but attainable targets and timetables for pollution controlTargets and timetables are essential for programmes to control pollution; these provide benchmarks and metrics for assessing progress towards pollution control. This Commission recommends establishing specific numerical targets and deadlines for pollution control and prevention of pollution-related disease in every city and country, along with incentives for meeting deadlines and penalties for failing to meet them.
Pollution control targets must be appropriate for each country’s level of income and development and guided by the WHO pollution control targets. These targets will be most effective when they are focused on pollution sources that are established to be priorities and must be integrated into commitments to meet the SDGs and to reduce greenhouse gas emissions.
Prioritise interventionsIt is crucial that pollution control programmes establish and adhere to a robust, systematic, and transparent system for prioritising pollution control that is based on assessment of health effects, environmental damages, and cost-effectiveness of control of various pollution sources. A robust system for assigning priority will avoid the pitfall of prioritising interventions on the basis of political expediency380,381 or because they happen to be an item in the evening news.Quick,highlyvisiblesuccessesareextremelyimportant
in gaining public support for a pollution control programme. It is therefore essential that intervention plans identify pollution sources whose early control will result in quick wins. Rapid, measurable improvements in public health, especially in the health of children, are powerful levers for building public and political support.
Key steps in ranking pollution sources in terms of their health effects, a key process of an effective health and pollution action plan, are as follows: (1) examine the frequency and severity of disease attributed to various types of pollution using data from national sources and data from the GBD study, and use this information to prioritise interventions against pollution; (2) for each type of pollution apportion the relative contributions of different exposure sources; (3) evaluate the efficacy of new programmes that have potential to reduce health effects from each pollution source, review existing programmes for efficacy and reach, and identify performance gaps and legal, regulatory, and enforcement gaps; (4) identify potential interventions (new and expanded) for those exposures for which there are dramatic effects on health outcomes and measurable indirect benefits, and evaluate these interventions for cost-effectiveness; (5) focus not only on high-visibility sources of pollution, but also on pollution sources that historically have received less attention, such as household air pollution, contaminated sites, lead (including lead in pottery glazes, lead in paint, and lead from other sources
that might be specific to a specific culture), and occupational risks, including asbestos; (6) review the benefits of interventions against pollution and health improvement, considering the roles of gender equity, alleviation of poverty, slowing of the pace of climate change, increased tourism, economic growth, improved education, and political factors (panel 12);382–387 (7) bring all relevant agencies into the prioritisation process, including senior representatives of ministries of health, environment, industry, development, finance, transport-ation, energy, planning, and legislative branches, and civil society, if possible; and (8) begin implementation with those programme areas where past experience will be a strong return on investment, as measured by benefit to public health and the possibility for early victories: examples include removing lead from paint or pottery, cleaning up highly visible toxic hotspots, banning asbestos, or publishing a ranked list of the most important pollution sources in a city or country, involving the media in advertising early successes.
Establish robust systems for environmental monitoring and public health trackingHigh quality metrics that monitor pollution and track progress towards national and local pollution prevention and disease control goals are essential to the success of any health and pollution action plan. Early establishment of public health and environment monitoring systems should therefore be a priority. Evidence-driven updates at
Panel 11: Mexico’s challenge: combating lead pollution
Pottery is produced in more than 10 000 artisanal, mostly small scale, workshops across Mexico. Most workshops use inexpensive, low temperature kilns that are not capable of firmly binding lead glaze to the clay. Lead is therefore released from the glaze into food. Lead has been used for centuries to glaze pottery in Mexico, and pottery is a pervasive source of population exposure to lead.374–376 Beginning in the 1990s, the Mexican Government determined that prevention of lead poisoning must be a national public health priority and launched a multipronged approach strategy that included interventions against the use of lead in pottery.
The following are key elements of the control strategy:• Undertakeacomprehensivesurveyofartisanalworkshops,toidentifythoseusing
lead-based glazes• Trackproducersanddistributorsoflead-basedglazeanddistributorsandproducersof
lead-free glaze to understand the routes to market• NotifyproducersandintermediariesthatMexicanfederalstandardsimposean
absolute prohibition on the use of lead-based glazes in ceramics used for preparing or serving food
• Engagewithproducersoflead-freeglazetoassisttheminimprovingtheirproducttobetter match the appearance of lead-glazed ceramics and to facilitate distribution
• Createmarketincentivesforuseoflead-freeceramics• Strengthenenforcementofthefederalleadglazestandardthroughimproved
monitoring and targeted inspections• Launchabroadcommunicationscampaigntoeducatepotterymakersandthepublic
about the dangers of lead-glazed pottery and to advertise the high quality and enhanced safety of lead-free glazes
The Lancet Commissions
36 www.thelancet.com Published online October 19, 2017 http://dx.doi.org/10.1016/S0140-6736(17)32345-0
regular intervals are crucial. We encourage governments to consider creation of a central data coordination system that acts as a focus and point of reference for all data on pollution—household, ambient, and occupational. This system should provide validated information and synthesised reports to the public and could be a basic source of raw data for regulators, researchers, and policy makers.
The economic costs of pollution include not only productivity and health costs, but also costs resulting from destruction of ecosystems and loss of key species such as pollinators and fish stocks that convey great benefits to human beings and are crucial to sustaining life on earth. Like the economic losses that result from pollution-related disease, the costs of environmental degradation are mostly invisible. These costs are not captured by standard economic indicators and are buried within the uncounted, unpaid costs of modern industrial and agricultural production.
The Economics of Ecosystems and Biodiversity is a global initiative sponsored by the UN Environment Programme that addresses the challenge of quantifying the economic losses that result from environmental degradation. This initiative applies a structured approach to valuation of ecological losses, explores the visible and invisible costs and benefits that flow from ecosystems into the economy, and evaluates how these flows might change under different policy interventions. The initiative examines the potential consequences of policy reforms that realign incentives and fiscal policy in both
negative (ie, polluter-pays) and positive (ie, beneficiary-pays) ways. These scenarios can be analysed and juxtaposed against a scenario in which no changes are made, to identify more sustainable pathways.388–390
Monitoring air pollution typically involves a combination of ground-level monitoring and atmospheric dispersion modelling to determine air pollution concentrations and their distribution.391,392 Low-cost air pollution monitors to measure levels of pollutants on the ground represent an important advance.393 The use of satellite-based remote sensing to estimate levels of air pollution is gaining increased attention, although the coverage and interpretation of satellite data is still being refined.394
The importance of accurate epidemiological data for the prevention and control of disease has been recognised since the work of pioneers such as William Farr,338 who documented patterns of disease and death during the great cholera epidemic in Britain of 1848–49. National and international programmes for the systematic collection, consolidation, evaluation, and rapid dis semination of data on morbidity and mortality have become a core component of the global public health infrastructure.395,396
There are still many gaps in knowledge, especially in poor countries with insufficient resources for systematic data collection.397 Therefore, only a third of the world’s population and only 5% of Africa has usable information on causes of death. China and India have both been redeveloping their verbal autopsy registration systems, in which cause of death is based on data provided by field-trained personnel, and these data systems are im-proving.398 Limitations in the quality of public health data reduce the accuracy of global estimates of the burden of disease related to pollution.
AccountabilityAccountability is of paramount importance, and programmes for pollution control and prevention must be continuously assessed and held accountable to targets and deadlines using both process metrics (the number of regulations established, monitors installed, or tests performed) and outcome measures (reductions in levels of pollution in air and water, or improvements in health status). Monitoring data and data on progress toward achieving targets and timetables must be made publicly accessible to citizens and civil society.399–401
Carefully selected metrics provide an essential foundation to monitoring and accountability. The Health Effects Institute has developed a taxonomy of metrics that can be used to track the progress of pollution control programmes. Regarding air pollution programmes, a summary of metrics suggested by The Health Effects Institute include regulatory metrics, emissions metrics, and pollutant metrics.399
Establish a sound chemicals management programmeA high proportion of the 140 000 chemicals and pesticides in commerce have never been adequately tested for safety
Panel 12: Cost-effective policies to improve access to safe water and sanitation
Disinfection kits for home drinking water and ceramic filters are low-cost technologies for purifying drinking water in rural households without access to safe water. Latrines are a cost-effective solution to open defecation. Chlorination of home drinking water costs between US$50 and $125 per lifeyear saved; ceramic filters cost between $125 and $325.382
A seemingly attractive solution to improving access to safe drinking water and improving sanitation would be for donors to distribute chlorination kits, filters, and latrines free of charge. Empirical studies have shown, however, that this approach is ineffective and wastes resources because not all households will use disinfection kits for home drinking water, even when they are provided free of charge. A better solution would be to charge for the technology and subsidise the purchase. Studies suggest that people who pay something for a product are more likely to use it.383 Another effective approach is to distribute vouchers to households that can be redeemed when a kit is purchased.384 Requiring households to redeem the voucher separates the households that are likely to use the kit from those that are not.
Lowering the price of ceramic drinking water filters and latrines, which have a large upfront cost, can substantially increase their uptake.385,386 However, subsidies can be expensive. Microfinancing schemes that spread the cost of water filters or latrines over time have been effective in increasing uptake at a lower cost to funders than total subsidies.387 This approach allows a larger number of households to be covered for a given expenditure of funds and has the added benefit of gaining household and community ownership of the improvement. Composting toilets might have some advantages in some circumstances, for example where there is no sewage system.
For the Health Effects Institute http://www.wsp.org/

The Lancet Commissions
www.thelancet.com Published online October 19, 2017 http://dx.doi.org/10.1016/S0140-6736(17)32345-0 37
or toxicity.36 Information on potential toxicity is publicly available for only about half of the commercial chemicals with high production volume that are in widest use, and information on developmental or reproductive toxicity is available for fewer than 20% of these widely used chemicals.402 Because of the failure to test chemicals for toxicity, populations around the world today are exposed to hundreds of untested chemicals and recurrent episodes of disease and environmental degradation have resulted.36
To address the problem of population exposure to untested chemicals of unknown hazard, high-income countries are beginning to develop chemicals manage-ment programmes.403,404 Mandatory testing of chemicals for safety and potential toxicity, coupled with the imposition of controls or bans on the manufacture and use of toxic chemicals are the two linchpins of these policies.36 High-income countries have the resources to establish their own chemical testing programmes such as those supported by the European Chemical Agency and the US National Toxicology programme. Low-income and middle-income countries must rely on results from those testing agencies and on findings on chemical safety and toxicity promulgated by international bodies of high repute that are independent of the chemical manufacturing industry such as WHO’s Inter national Programme on Chemical Safety,109 the International Agency for Research on Cancer, UN Environment Programme,101 and the Ramazzini Institute.
Establish and enforce environmental laws and regulations and base regulation on the polluter-pays principleA strong body of law405 and clear, transparent, impartially enforced regulations are crucial components of policy packages for pollution control in all countries.
Experience in the USA documents the importance of law and regulation in reducing pollution. Through national regulations established under the US Clean Air Act, the USA has reduced concentrations of six common air pollutants by 75% since 1970 while increasing GDP by nearly 250% (figure 1).43 Every dollar invested in control of ambient air pollution in the USA is estimated to yield US$30 in benefits (95% CI $4–88).45
The State of California has also deployed a suite of laws and policies to control air pollution that, in some instances, are even stronger than US federal regulations.406 California’s policies to reduce traffic-related air pollution include low-emission vehicle standards, a low-sulphur gasoline standard, diesel emissions standards, and financial incentives for replacement and retrofit of high-polluting vehicles. Additional policies that have been very successful include requirements for cleaner diesel fuels in marine vessels and railroad locomotives, and requirements for cleaner diesel fuels for stationary diesel engines and agricultural equipment. Policies to reduce emissions
from stationary pollution sources include legally mandated reductions in emissions of oxides of nitrogen and sulphur, mandatory reviews of emissions from new sources, and source-specific emissions standards. Application of these standards has resulted in reductions in levels of major air pollutants by more than 70% in California, produced measurable improvements in children’s respiratory health,44 and has accomplished these goals in a time when the GDP has risen sharply, thus documenting, yet again, that control of pollution does not stifle economic development or societal advancement.43
Application of the polluter-pays principle is an important component of environmental regulation. The imposition of legally mandated requirements that polluters pay for their pollution and its clean-up create a powerful incentive to adopt new, more efficient production technologies that will reduce pollution. Application of the polluter-pays principle forces polluting industries to acknowledge and account for the previously externalised costs of pollution. Lastly, application of the polluter-pays principle can generate revenues that help to support the costs of pollution control programmes.
As a corollary to imposing the polluter-pays principle, it is important that governments also end subsidies to polluting industries such as coal, oil, gas, and chemical production. When polluting industries are granted subsidies by governments, these governments and the taxpayers who support them are indirectly paying to be polluted.
A competent, independent, non-corrupt judiciary provides an essential back-up to environmental laws and regulation.407 An independent judiciary is needed to ensure the fair and impartial application of regulatory standards and to protect people, especially indigenous people and their lands, from the damaging effects of polluting industrial activities. For further discussion on existing national and international chemical control legislation and agreements, see the appendix (pp 13–14).
Engage with the private sectorThis Commission emphasises that multiple stakeholders should be involved in controlling pollution and preventing pollution-related disease, including top government leaders, but also key civil servants, business, academia, and civil society. Carefully listening to the views of the most important and influential stakeholders (both formal and informal) can help to ensure that all the parties who can advance (or derail) programmes are taken into account.77
Enlightened business leaders can be powerful advocates for pollution control and disease prevention. The creation of incentives by governments for non-polluting industries can be powerful catalysts for innovative action, as seen by the rapid development of solar power systems and the organic food industry.
For the European Chemical Agency see https://echa.europa.eu/information-on-chemicals
For the Ramazzini Institute see http://www.ramazzini.org/en/

The Lancet Commissions
38 www.thelancet.com Published online October 19, 2017 http://dx.doi.org/10.1016/S0140-6736(17)32345-0
Support city-level initiatives to encourage active transport: reward walking and cycling, increase access to and affordability of public transport, and minimise use of motorised transportCities now house more than half of the world’s population, a fraction that is growing rapidly, are responsible for 75% of greenhouse gas emissions, and account for 85% of global economic activity.408,409 Cities, especially rapidly growing cities in low-income and middle-income countries, have some of the world’s highest concentrations of ambient air and chemical pollution and the highest prevalence of disease caused by these forms of pollution.
Important initiatives are now underway in cities around the world to reduce emissions of both pollutants and greenhouse gases, and to make cities more resilient and sustainable. Several organisations at the local, national, and global levels have contributed to this progress and they include the Regional Plan Association in New York, the World Bank’s Eco2Cities initiative, and the UN Department of Economic and Social Affairs urbanisation planning programmes.
Mayors have been powerful actors in efforts to control pollution and pollution-related disease, and visionary mayors have resurrected formerly blighted cities and turned them into places of extraordinary beauty and high livability.410 This Commission commends initiatives to launch urban design and planning initiatives that reimagine cities through building green spaces, parks, and walkways, encouraging active transport (such as walking and cycling), and increasing access to and affordability of public transport. Such programmes are discussed in detail in the 2016 Lancet Series on City Planning and Population Health.411.412
Willingness to confront vested interestsPlanning and prioritisation processes regarding health and pollution do not always proceed smoothly. The analyses regarding trade-offs between economic development and pollution are nuanced and vary substantially from industry to industry and country to country. In general, when public health externalities are included in the assessment, even primary industries like heavy manufacturing and mining achieve better long-term macroeconomic performance when strong controls for pollution management are in place.413,414 However, these analyses can be complex and often contentious. Projections of growth rates and of the burden of pollution-related disease should look at sliding ranges of benefit, since low-polluting industries might provide substantial net benefits to a community. Heads of government who successfully confront vested interests, bring agencies together, reduce environmental injustice, control pollution, and prevent pollution-related disease can reap great praise, build a legacy, help the world achieve the SDGs, and earn an honoured place in history.
The next section of this Commission report outlines the contributions that various stakeholders— government,
civil society, and health professionals—can make to pollution control.
Responsibilities of governments and major foundationsNational, state or provincial, and city governments are powerful actors in efforts to control pollution and prevent pollution-related disease. Governments in countries at all levels of income have made remarkable victories against pollution.
Leadership by the head of government—the President, Prime Minister, Governor or Mayor—is of the utmost importance. Heads of government are uniquely well positioned to educate the public and the media about the importance of preventing pollution-related disease and can create a vision for a country or a city without pollution. These heads of government also have the power to bring together several agencies within their governments—health, environment, finance, transport, industry, energy, and development—to make pollution control a priority.
Heads of government also have great power to address the so-called “political economy” of pollution.415 Much pollution, especially industrial pollution, is produced by vested interests that profit by externalising the costs of production and discharging unwanted wastes into the environment. These individuals and organisations will typically resist efforts to control pollution. Heads of government have unique power to overcome this resistance and to negotiate just settlements that reduce pollution and achieve social justice. Experience in countries at all levels of income shows that pollution control can be accomplished in the face of powerful opposition, but that the task is seldom easy and requires committed leadership and broad partnerships across civil society.
Responsibilities of international agenciesInternational development organisations, including UN agencies, multilateral development banks, bilateral funding agencies, private foundations, and non-governmental organisations, have important respon-sibilities in pollution control and prevention of pollution-related disease that complement and extend the role of governments. These agencies should elevate pollution prevention within the agendas of international development and global health and substantially increase the resources they devote to pollution, establishing it as a priority in funding mechanisms.
These agencies should build on existing global data platforms to develop a central platform to monitor and coordinate information on all forms of pollution globally, and should consider convening a bi-annual conference on pollution.
International agencies should also provide resources to reduce pollution-related disease in low-income and middle-income countries by:
(1) encouraging the development of action plans regarding health and pollution, both nationally and

The Lancet Commissions
www.thelancet.com Published online October 19, 2017 http://dx.doi.org/10.1016/S0140-6736(17)32345-0 39
regionally, and of specific pollution control projects that set time targets; (2) building data tracking systems to collect information on pollution and disease; (3) supporting direct interventions against pollution where such actions are urgently needed to save lives; (4) supporting interventions against pollution when international action can leverage local action and resources; (5) building professional and technical capacity within governments; (6) strengthening the capacity of universities in low-income and middle-income countries to research environmental health science and to train future health and environmental professionals; and (7) supporting research programmes in environmental health science in partnership with international academic institutions, including clinical and epidemiological studies to learn more about the undiscovered links between pollution and non-communicable disease.
This Commission also calls on international foundations and private donors to come together with governments around the world to establish dedicated international development funding specifically dedicated to the control of industrial, vehicular, mining, and chemical pollution. Such funding will be most effective in curbing pollution when its award is contingent upon host countries’ implementation of the polluter-pays principle and ending financial subsidies and tax breaks for polluting industries.
Several design options for dedicated pollution control funding could be considered. The first is a new standalone fund analogous to GAVI (the Vaccine Alliance) or the Global Fund to Fight AIDS, Tuberculosis and Malaria, in which private philanthropists and foundations provide start-up monies that are then periodically replenished by governments. Another option is a large trust fund that is hosted and managed by an existing global institution, such as a multilateral development bank or a foundation. Alternatively, a virtual fund with contributions based on explicit agreements could be used. Finally, expansion of existing funding instruments for international development assistance could be used, including funds specifically designated for pollution control.
Responsibilities of citizens and civil societyCitizens and civil society organisations in countries and cities around the world have important responsibilities in the prevention of pollution, and non-governmental organisations have an important role in many countries in holding governments and companies accountable for pollution control and prevention of pollution-related disease. Civil society organisations can contribute to pollution control by acting as watchdogs, by serving as representatives of the public interest, and by advocating for specific policies, regulations, and practices (panel 13).350 Civil society groups, especially those that are well funded and science-based, are a powerful force to
represent poisoned populations. These organisations can highlight omissions in policy and advocate for change.416 The best of these organisations provide solid policy support to government action and take a long-term, broad view of issues in their actions and recom-mendations.417
Responsibilities of health professionalsPhysicians, nurses, and other health professionals have important responsibilities in helping societies to confront the challenges of pollution and pollution-related disease as they have educated societies around the world about the dangers of nuclear war and global climate change.
Health professionals can begin by controlling pollution and reducing carbon emissions from hospitals and health-care facilities and by reducing pollution and carbon-intensive energy sources in their own lives. Health professionals can support local, regional, and national planning efforts and emphasise the links between pollution and health, develop new transdisciplinary educational curricula that build knowledge of environmental health science and about
Panel 13: Case study: the power of civil society in controlling urban air pollution
National and city governments have key roles in solving pollution problems. But governments cannot act alone. The political will to create, implement, and sustain successful pollution control policies over the long term requires the involvement of citizens and civil society from many sectors. For example, in the winter of 2010–11, hourly air quality data from Beijing began, for the first time, to be publicly released by both the Chinese Government and the United States Embassy. Soon thereafter, so-called “airpocalypses” during winter were documented, and Beijing’s air quality data began to be discussed extensively in local and international media. This unprecedented access to real-time air quality data spurred software developers to build apps, pushing the data out to millions. Through apps, social media, and general media outlets, the citizens of Beijing began, for the first time, to feel the air pollution problem in new, immediately accessible, and data-driven ways.
Since that time, China has invested in several programmes to mitigate air pollution. An expanded network of air quality monitors has been installed in Beijing and across the country. Stricter regulatory policies have been implemented. New emergency action plans for high-pollution days have been developed and promulgated. Simultaneously, public interest in pollution has not waned. In 2015, a popular television journalist, Chai Jing, made an independent documentary “Under the Dome” that discussed the effects of air pollution on health, which went viral across the country and then the world. The number of research publications on air pollution in Beijing have exponentially increased.
It is difficult to pinpoint the exact contributions of the policy, activism, technology, research, and media communities to the successful pollution control effort in Beijing and their effects on each other, but clearly their combined efforts are beginning to make a positive difference. Since 2014, government sources in Beijing have reported year-to-year decreases in annual average PM2·5 concentrations, and these findings are consistent with data for decreasing concentrations of PM2·5, as calculated from the monitor on the United States Embassy.350
Although Beijing and China still have a long way to go to clean their air, this case study documents the power of community involvement in pollution control and the crucial importance of data.
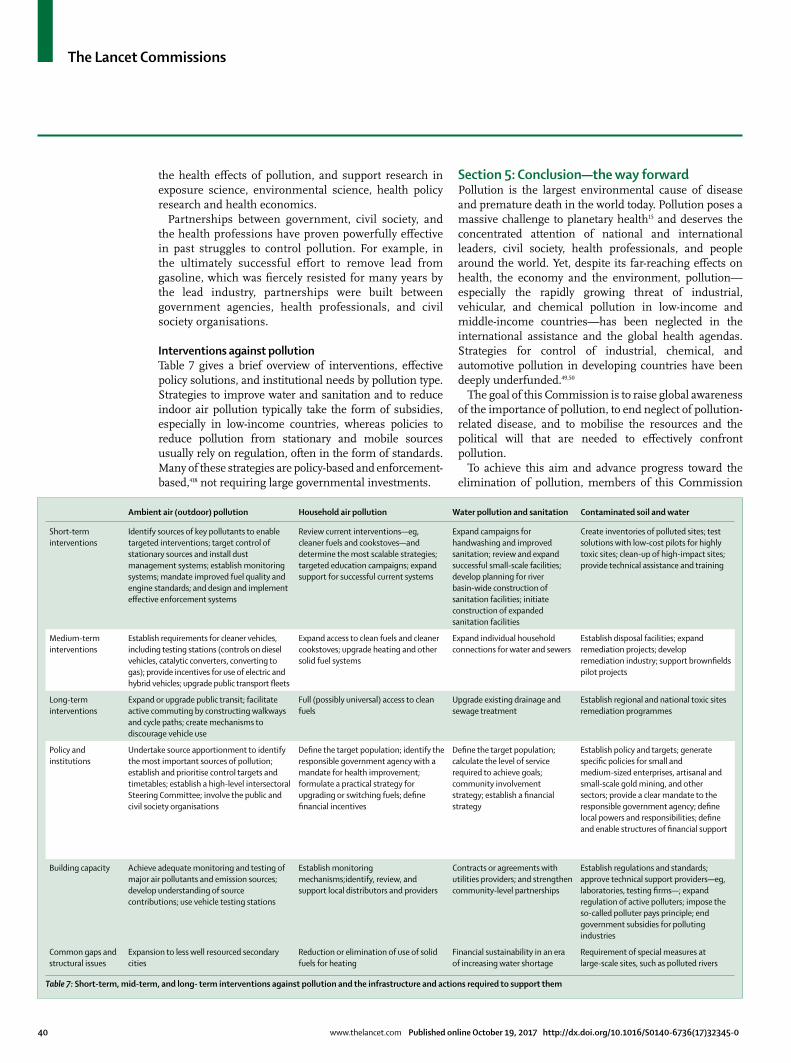
The Lancet Commissions
40 www.thelancet.com Published online October 19, 2017 http://dx.doi.org/10.1016/S0140-6736(17)32345-0
the health effects of pollution, and support research in exposure science, environmental science, health policy research and health economics.
Partnerships between government, civil society, and the health professions have proven powerfully effective in past struggles to control pollution. For example, in the ultimately successful effort to remove lead from gasoline, which was fiercely resisted for many years by the lead industry, partnerships were built between govern ment agencies, health professionals, and civil society organisations.
Interventions against pollutionTable 7 gives a brief overview of interventions, effective policy solutions, and institutional needs by pollution type. Strategies to improve water and sanitation and to reduce indoor air pollution typically take the form of subsidies, especially in low-income countries, whereas policies to reduce pollution from stationary and mobile sources usually rely on regulation, often in the form of standards. Many of these strategies are policy-based and enforcement-based,418 not requiring large governmental investments.
Section 5: Conclusion—the way forwardPollution is the largest environmental cause of disease and premature death in the world today. Pollution poses a massive challenge to planetary health15 and deserves the concentrated attention of national and international leaders, civil society, health professionals, and people around the world. Yet, despite its far-reaching effects on health, the economy and the environment, pollution—especially the rapidly growing threat of industrial, vehicular, and chemical pollution in low-income and middle-income countries—has been neglected in the international assistance and the global health agendas. Strategies for control of industrial, chemical, and automotive pollution in developing countries have been deeply underfunded.49,50
The goal of this Commission is to raise global awareness of the importance of pollution, to end neglect of pollution-related disease, and to mobilise the resources and the political will that are needed to effectively confront pollution.
To achieve this aim and advance progress toward the elimination of pollution, members of this Commission
Ambient air (outdoor) pollution Household air pollution Water pollution and sanitation Contaminated soil and water
Short-term interventions
Identify sources of key pollutants to enable targeted interventions; target control of stationary sources and install dust management systems; establish monitoring systems; mandate improved fuel quality and engine standards; and design and implement effective enforcement systems
Review current interventions—eg, cleaner fuels and cookstoves—and determine the most scalable strategies; targeted education campaigns; expand support for successful current systems
Expand campaigns for handwashing and improved sanitation; review and expand successful small-scale facilities; develop planning for river basin-wide construction of sanitation facilities; initiate construction of expanded sanitation facilities
Create inventories of polluted sites; test solutions with low-cost pilots for highly toxic sites; clean-up of high-impact sites; provide technical assistance and training
Medium-term interventions
Establish requirements for cleaner vehicles, including testing stations (controls on diesel vehicles, catalytic converters, converting to gas); provide incentives for use of electric and hybrid vehicles; upgrade public transport fleets
Expand access to clean fuels and cleaner cookstoves; upgrade heating and other solid fuel systems
Expand individual household connections for water and sewers
Establish disposal facilities; expand remediation projects; develop remediation industry; support brownfields pilot projects
Long-term interventions
Expand or upgrade public transit; facilitate active commuting by constructing walkways and cycle paths; create mechanisms to discourage vehicle use
Full (possibly universal) access to clean fuels
Upgrade existing drainage and sewage treatment
Establish regional and national toxic sites remediation programmes
Policy and institutions
Undertake source apportionment to identify the most important sources of pollution; establish and prioritise control targets and timetables; establish a high-level intersectoral Steering Committee; involve the public and civil society organisations
Define the target population; identify the responsible government agency with a mandate for health improvement; formulate a practical strategy for upgrading or switching fuels; define financial incentives
Define the target population; calculate the level of service required to achieve goals; community involvement strategy; establish a financial strategy
Establish policy and targets; generate specific policies for small and medium-sized enterprises, artisanal and small-scale gold mining, and other sectors; provide a clear mandate to the responsible government agency; define local powers and responsibilities; define and enable structures of financial support
Building capacity Achieve adequate monitoring and testing of major air pollutants and emission sources; develop understanding of source contributions; use vehicle testing stations
Establish monitoring mechanisms;identify, review, and support local distributors and providers
Contracts or agreements with utilities providers; and strengthen community-level partnerships
Establish regulations and standards; approve technical support providers—eg, laboratories, testing firms—; expand regulation of active polluters; impose the so-called polluter pays principle; end government subsidies for polluting industries
Common gaps and structural issues
Expansion to less well resourced secondary cities
Reduction or elimination of use of solid fuels for heating
Financial sustainability in an era of increasing water shortage
Requirement of special measures at large-scale sites, such as polluted rivers
Table 7: Short-term, mid-term, and long- term interventions against pollution and the infrastructure and actions required to support them
The Lancet Commissions
www.thelancet.com Published online October 19, 2017 http://dx.doi.org/10.1016/S0140-6736(17)32345-0 41
and contributors to this report have initiated a series of activities within different sectors and countries that will extend beyond the life of this Commission and are intended to prevent pollution and save lives. At a global level, several authors of this Commission are in early stages of designing a Global Pollution Observatory, to be housed within the Global Alliance for Health and Pollution. This new observatory will be an international, multidisciplinary collaboration that is focused on coordinating information regarding all forms of pollution in countries around the world and developing solutions based on successes already achieved in other countries. We intend that this observatory will operate in close partnership with the Institute for Health Metrics and Evaluation, UN agencies, Future Earth, the Planetary Health Alliance, and major non-governmental organ-isations concerned with the wellbeing of the Earth’s environment. A major function will be to provide data that assist countries in prioritising pollution initiatives, tracking pollution, and using pollution control metrics, including investments against pollution in countries around the world and to make these data publicly and easily available. The precise metrics to be followed are under consideration, but possibilities include monitor ing country-by-country data on the status of regulations against each type of pollution; measuring exposures to key pollutants, country-by-country and regionally; reporting detailed country-by-country statistics on disease and premature death by pollution risk factor, to track performance towards the goals suggested in this report; tracking national and international investment into expanded research on disease and death due to pollution (especially soil pollution caused by heavy metals and toxic chemicals), including studies to discover new and previously unrecognised health effects of pollutants; tracking investments related to interventions against pollution, country-by-country (which can be broken down by source of investment and whether the investment is national or international and public or private); and developing a database to report the cost-efficacy of interventions against pollution, measured in terms of health outcomes.
In partnership with The Lancet, the Global Alliance on Health and Pollution plans to revisit the data on health and pollution periodically, and to publish updated information on global trends in pollution, pollution-related disease, and pollution control on a regular basis. The Global Alliance on Health and Pollution will also explore hosting a biennial conference on pollution that will include UN agencies, governments, and representatives of civil society and will review pollution control strategies, share project successes, and explore opportunities and the most cost-effective strategies for pollution control.
At the country level, work is underway to expand health and pollution planning in partnership with governments in low-income and middle-income countries. This work involves multiple organisations and agencies, including
the Global Alliance on Health and Pollution, the World Bank, WHO, the UN Environment Programme, and the UN Development Programme. New programmes to educate global leaders and government agencies about proven solutions to pollution are also in development.
Activities to strengthen the involvement of the public and civil society in pollution control are essential because public concern provides a major impetus for governments to act against pollution. A new website is being developed by the Global Alliance on Health and Pollution to show current and, in some cases, real-time data related to pollution in countries across the world. This geocoded website links databases showing air pollution, water pollution, and soil contamination. Users can zoom down to the communities where they live, see the available information, and post their own stories and pictures about pollution. The website will incorporate a link for people to connect with local government organisations for solutions.
These efforts are only the beginning, and there is much more to be done. This Commission encourages all efforts to bring the issue of pollution to public attention and supports all solutions to reduce the enormous health burden of this major, yet often hidden, global threat.ContributorsPJL and RF developed the concept and objectives for the Commission. The full Commission met on two occasions (Nov 9–11, 2015, and June 16–17, 2016) in New York, NY, USA, with an additional meeting in January, 2016 (limited to the Health and Pollution working group, also in New York). The Commission formed four working groups to examine the burden of disease associated with environmental pollution, to calculate the economic costs of documented pollution-attributable global deaths and DALYs, to explore the intersection between pollution and inequality, and to evaluate and develop strategies and roadmaps for successful pollution control. Each working group was responsible for the design, drafting, and review of their individual sections. Working Group 1 (Health) was led by PJL. Working Group 2 (Economics) was led by MLC and AK. Working Group 3 (Environmental Justice) was led by KS. Working Group 4 (Interventions) was led by DHa and RF. Working Group leaders, along with Yewande Awe of the World Bank and Tim Kasten of UN Environment comprised the Report Steering Committee. All authors contributed to the identification of key issues and the selection of four main report sections. As co-chairs of the Commission, PJL and RF planned and coordinated all activities of the Commission, the development and review of the report drafts, and the preparation for external peer review. PJL and RF reviewed and edited all sections of this report. All authors reviewed each stage of the report and approved the final version. PJL wrote the first and subsequent drafts of the Introduction, with input from OA, MLC, RF, AH, AK, KVM, JP, and KRS. For Section 1, PJL wrote the first and subsequent drafts, with input from NB, RB, SB-O’R, JIB, PNB, TC, CM, JF, VF, DHu, BLa, KM, CJLM, FP, LDS, PDS, KRS, WAS, OCPvS, and GNY. For Section 2, MLC and AK wrote the first and subsequent drafts, with input from MG, PJL, KVM, and ASP. For Section 3, KS wrote the first and subsequent drafts, with input from OA, AH, PJL, KVM, MAM, JRo, KRS, AS, and GNY. For Section 4, DHa wrote the first draft, with subsequent drafts written and edited by RF and PJL, with input from NJRA, OA, RA, ABB, NB, AMCS, JF, AH, DHu, MK, BLo, KM, MAM, JDN, JP, JRa, JRo, CS, KRS, AS, RBS, KY, and MZ.
Declaration of interestsBLa served as an expert witness in California for the plaintiffs in a public nuisance case of childhood lead poisoning, in a Proposition 65 case on behalf of the California Attorney General’s Office, in a case involving lead-contaminated water in a new housing development in Maryland, in a Canadian tribunal on a trade dispute about using lead-free galvanised
For this pollution website see http://www.pollution.org
The Lancet Commissions
42 www.thelancet.com Published online October 19, 2017 http://dx.doi.org/10.1016/S0140-6736(17)32345-0
wire in stucco lathing, and as a plaintiff on a case involving lead-poisoned children in Milwaukee, Wisconsin, but he received no personal compensation for these services. His expert witness fees are deposited in a research and training fund at Simon Fraser University (Burnaby, BC, Canada). MG reports grants from the US Agency for International Development, the National Science Foundation, the International Growth Centre, and the Laura and John Arnold Foundation outside the submitted work; MG also reports more than US$10 000 in stocks and bonds, including in firms that pollute and firms that are affected by pollution, as part of a diversified portfolio. All other authors declare no competing interests.
AcknowledgmentsOverall coordination of the report was led by Elena Rahona, whose team included Amy Chart, Samantha Fisher, Rachael Kupka, Yaqi Li, Karen McGill, Myla Ramirez, Anthony Rivera, Petr Sharov, Angela Bernhardt, Russell Dowling, Eric Fecci, and Carol Sumkin at Pure Earth; Alvara McBean at Icahn School of Medicine at Mount Sinai; and Kelsey Pierce at Institute for Health Metrics and Evaluation. Several people lent their expertise to contribute to certain sections of the report: Bret Ericson, Christa Hasenkopf, Greg McGruder, and Nadine Steckling. The Commission received invaluable technical advice and input from many individuals, including Gilles Concordel and Marie Concordel, Elena Craft, James Godbold, Nathalie Gysi, Andrew McCartor, Sumi Mehta, Conrad Meyer, Radha Muthiah, Dietrich Plass, Ananya Roy, Baskut Tuncak, and Birgit Wolz. In particular, the authors would like to thank the following people for coordinating input from different teams: Yewande Awe, Jostein Nygard, Ernesto Sanchez-Triana, and Momoe Kanada (World Bank); Annette Prüss-Üstün (WHO); Jill Hanna and Maria Pachta (European Commission); Loïc Viatte (Swedish Ministry of Environment and Energy); Katherine Swanson and Andrea Pavlick (US Agency for International Development), Mathy Stanislaus (while serving for the US Environmental Protection Agency during the Obama Administration), Kara Estep, Mohammad (Mehrdad) Forouzanfar, and Jeff Stanaway (Institute for Health Metrics and Evaluation); TimKasten,FannyDemassieux,AchimHalpaap,andPierreQuiblier(UN Environment), Natalia Linou, and Douglas Webb (UN Development Programme); and Nilgün Tas (United Nations Industrial Development Organization). This Publication is made possible by financial assistance from the European Union, UN Industrial Development Organization, the Swedish Ministry of Environment and Energy, the German Federal Ministry for the Environment, Nature Conservation, Building and Nuclear Safety, Royal Norwegian Ministry of Health and Care Services, the US Agency for International Development, the US National Institute of Environmental Health Sciences, the Icahn School of Medicine at Mount Sinai, and Pure Earth. The Global Alliance on Health and Pollution (GAHP) served through Pure Earth as secretariat for the Commission. GAHP is a collaborative body that coordinates and advocates for solutions on pollution and health in low-income and middle-income countries. Members include international agencies such as World Bank, UN Environment, United Nations Development Programme, and United Nations Industrial Development Organization, and government agencies globally. The Commission sought input and consultation from the members of GAHP, experts at the World Bank, World Health Organization and the World Health Organization network of Collaborating Centers in Children’s Health and the Environment, the Consortium of Universities in Global Health, the Pacific Basin Consortium for Environment and Health, the Superfund Research Program of the US National Institute of Environmental Health Sciences, and a number of Non-Governmental Organizations including the Global Alliance for Clean Cookstoves, Clean Air Asia, Human Rights Watch, the Environmental Defense Fund, Global Poverty Project, and World Resources Institute. The contents of this publication are the sole responsibility of Pure Earth/GAHP Secretariat, the Icahn School of Medicine at Mount Sinai, and The Lancet, and can in no way be taken to reflect the views of the European Union or other donors or individual GAHP member agencies. The authors note that they are serving in their personal capacity. The opinions expressed in this article are the authors’ own and do not reflect the views of their respective employers.
References1 Rockström J, Steffen W, Noone K, et al. A safe operating space for
humanity. Nature 2009; 461: 472–75.2 McMichael AJ, Woodward A, Muir C. Climate change and the health
of nations: famines, fevers, and the fate of populations. Oxford: Oxford University Press, 2017.
3 Perera FP. Multiple threats to child health from fossil fuel combustion: impacts of air pollution and climate change. Environ Health Perspect 2017; 125: 141–48.
4 Gaveau DLA, Salim MA, Hergoualc’h K, et al. Major atmospheric emissions from peat fires in Southeast Asia during non-drought years: evidence from the 2013 Sumatran fires. Sci Rep 2015; 4: 6112.
5 Johnston FH, Henderson SB, Chen Y, et al. Estimated global mortality attributable to smoke from landscape fires. Environ Health Perspect 2012; 120: 695–701.
6 Scovronick N, Dora C, Fletcher E, Haines A, Shindell D. Reduce short-lived climate pollutants for multiple benefits. Lancet 2015; 386: e28–31.
7 National Academy of Sciences. Hidden costs of energy: unpriced consequences of energy production. Washington, DC: National Academies Press, 2010.
8 Landrigan PJ, Fuller R. Environmental pollution: an enormous and invisible burden on health systems in low-and middle income countries. World Hosp Health Serv 2015; 50: 35–41.
9 Epstein PR, Buonocore JJ, Eckerle K, et al. Full cost accounting for the life cycle of coal. Ann N Y Acad Sci 2011; 1219: 73–98.
10 Smith KR, Ezzati M. How environmental health risks change with development: the epidemiologic and environmental risk transitions revisited. Annu Rev Environ Resour 2005; 30: 291–333.
11 Omran AR. The epidemiologic transition: a theory of the epidemiology of population change. Milbank Q 2005; 83: 731–57.
12 Wilkinson P, Smith KR, Beevers S, Tonne C, Oreszczyn T. Energy, energy efficiency, and the built environment. Lancet 2007; 370: 1175–87.
13 Pope Francis. Laudato si’. Encyclical letter on care for our common home. Vatican City: The Vatican, 2015.
14 Raworth K. Doughnut economics: seven ways to think like a 21st-century economist. White River Junction, VT: Chelsea Green Publishing, 2017.
15 Whitmee S, Haines A, Beyrer C, et al. Safeguarding human health in the Anthropocene epoch: report of The Rockefeller Foundation–Lancet Commission on planetary health. Lancet 2015; 386: 1973–2028.
16 National Academy of Sciences. Exposure science in the 21st century. Washington, DC: National Academies Press, 2012.
17 Brauer M, Amann M, Burnett RT, et al. Exposure assessment for estimation of the global burden of disease attributable to outdoor air pollution. Environ Sci Technol 2012; 46: 652–60.
18 Sorek-Hamer M, Just AC, Kloog I. Satellite remote sensing in epidemiological studies. Curr Opin Pediatr 2016; 28: 228–34.
19 Valavanidis A, Fiotakis K, Vlachogianni T. Airborne particulate matter and human health: toxicological assessment and importance of size and composition of particles for oxidative damage and carcinogenic mechanisms. J Environ Sci Health C Environ Carcinog Ecotoxicol Rev 2008; 26: 339–62.
20 Pope CA 3rd. Respiratory disease associated with community air pollution and a steel mill, Utah Valley. Am J Public Health 1989; 79: 623–28.
21 Dockery DW, Pope CA, Xu X, et al. An association between air pollution and mortality in six U.S. cities. N Engl J Med 1993; 329: 1753–59.
22 Thurston G, Lippmann M. Ambient particulate matter air pollution and cardiopulmonary diseases. Semin Respir Crit Care Med 2015; 36: 422–32.
23 Cohen AJ, Brauer M, Burnett R, et al. Estimates and 25-year trends of the global burden of disease attributable to ambient air pollution: an analysis of data from the Global Burden of Diseases Study 2015. Lancet 2017; 389: 1907–18.
24 Krewski D, Jerrett M, Burnett RT, et al. Extended follow-up and spatial analysis of the American Cancer Society study linking particulate air pollution and mortality. Res Rep Health Eff Inst 2009; 140: 5–136.
The Lancet Commissions
www.thelancet.com Published online October 19, 2017 http://dx.doi.org/10.1016/S0140-6736(17)32345-0 43
25 Meo SA, Memon AN, Sheikh SA, et al. Effect of environmental air pollution on type 2 diabetes mellitus. Eur Rev Med Pharmacol Sci 2015; 19: 123–28.
26 Cosselman KE, Navas-Acien A, Kaufman JD. Environmental factors in cardiovascular disease. Nat Rev Cardiol 2015; 12: 627–42.
27 Malley CS, Kuylenstierna JCI, Vallack HW, Henze DK, Blencowe H, Ashmore MR. Preterm birth associated with maternal fine particulate matter exposure: a global, regional and national assessment. Environ Int 2017; 101: 173–82.
28 Chen H, Kwong JC, Copes R, et al. Living near major roads and the incidence of dementia, Parkinson’s disease, and multiple sclerosis: a population-based cohort study. Lancet 2017; 389: 718–26.
29 Cacciottolo M, Wang X, Driscoll I, et al. Particulate air pollutants, APOE alleles and their contributions to cognitive impairment in older women and to amyloidogenesis in experimental models. Transl Psychiatry 2017; 7: e1022.
30 Heusinkveld HJ, Wahle T, Campbell A, et al. Neurodegenerative and neurological disorders by small inhaled particles. Neurotoxicology 2016; 56: 94–106.
31 Casanova R, Wang X, Reyes J, et al. A voxel-based morphometry study reveals local brain structural alterations associated with ambient fine particles in older women. Front Hum Neurosci 2016; 10: 495.
32 Perera FP, Chang H, Tang D, et al. Early-life exposure to polycyclic aromatic hydrocarbons and ADHD behavior problems. PLoS One 2014; 9: e111670.
33 Kioumourtzoglou MA, Schwartz JD, Weisskopf MG, et al. Long-term PM2.5 exposure and neurological hospital admissions in the northeastern United States. Environ Health Perspect 2016; 124: 23–29.
34 Loomis D, Grosse Y, Lauby-Secretan B, et al, for the International Agency for Research on Cancer Monograph Working Group. The carcinogenicity of outdoor air pollution. Lancet Oncol 2013; 14: 1262–63.
35 Lelieveld J, Evans JS, Fnais M, Giannadaki D, Pozzer A. The contribution of outdoor air pollution sources to premature mortality on a global scale. Nature 2015; 525: 367–71.
36 Landrigan PJ, Goldman LR. Children’s vulnerability to toxic chemicals: a challenge and opportunity to strengthen health and environmental policy. Health Aff 2011; 30: 842–50.
37 Grandjean P, Landrigan PJ. Neurobehavioural effects of developmental toxicity. Lancet Neurol 2014; 13: 330–38.
38 Pure Earth: Blacksmith Institute. Toxic Sites Identification Program (TSIP). http://www.pureearth.org/projects/toxic-sites-identification-program-tsip/ (accessed June 6, 2016).
39 Heindel JJ, Balbus J, Birnbaum L, et al. Developmental origins of health and disease: integrating environmental influences. Endocrinology 2015; 156: 3416–21.
40 Burnett RT, Pope CA 3rd, Ezzati M, et al. An integrated risk function for estimating the global burden of disease attributable to ambient fine particulate matter exposure. Environ Health Perspect 2014; 122: 397–403.
41 GBD 2015 Mortality and Causes of Death Collaborators. Global, regional, and national life expectancy, all-cause mortality, and cause-specific mortality for 249 causes of death, 1980–2015: a systematic analysis for the Global Burden of Disease Study 2015. Lancet 2016; 388: 1459–544.
42 GBD 2015 Risk Factors Collaborators. Global, regional, and national comparative risk assessment of 79 behavioural, environmental and occupational, and metabolic risks or clusters of risks, 1990–2015: a systematic analysis for the Global Burden of Disease. Lancet 2016; 388: 1659–724.
43 Samet JM, Burke TA, Goldstein BD. The Trump administration and the environment — heed the science. N Engl J Med 2017; 376: 1182–88.
44 Gauderman WJ, Urman R, Avol E, et al. Association of improved air quality with lung development in children. N Engl J Med 2015; 372: 905–13.
45 US Environmental Protection Agency: Office of Air and Radiation. The benefits and costs of the Clean Air Act from 1990 to 2020. April 2011. https://www.epa.gov/sites/production/files/2015-07/documents/fullreport_rev_a.pdf (accessed March 30, 2017).
46 Grosse SD, Matte TD, Schwartz J, Jackson RJ. Economic gains resulting from the reduction in children’s exposure to lead in the United States. Environ Health Perspect 2002; 110: 563–69.
47 Pirkle JL, Kaufmann RB, Brody DJ, Hickman T, Gunter EW, Paschal DC. Exposure of the U.S. population to lead, 1991–1994. Environ Health Perspect 1998; 106: 745–50.
48 Annest JL, Pirkle JL, Makuc D, Neese JW, Bayse DD, Kovar MG. Chronological trend in blood lead levels between 1976 and 1980. N Engl J Med 1983; 308: 1373–77.
49 Greenberg H, Leeder SR, Raymond SU. And why so great a ‘no?’ The donor and academic communities’ failure to confront global chronic disease. Glob Heart 2016; 11: 381–85.
50 Nugent R. A chronology of global assistance funding for NCD. Glob Heart 2016; 11: 371–74.
51 Van Lare P, for the US Environment Protection Agency. Growing toward more efficient water use: linking development, infrastructure, and drinking water policies. 2006. https://www.epa.gov/smartgrowth/growing-toward-more-efficient-water-use (accessed March 30, 2017).
52 Bartram J, Brocklehurst C, Fisher MB, et al. Global monitoring of water supply and sanitation: history, methods and future challenges. Int J Environ Res Public Health 2014; 11: 8137–65.
53 Schwarzenbach RP, Egli T, Hofstetter TB, von Guten U, Wehrli B. Global water pollution and human health. Ann Rev Environ Resourc 2010; 35: 109–36
54 World Health Organization, United Nations Children’s Fund, Water Supply and Sanitation Collaborative Council. Global water supply and sanitation assessment. 2000. http://www.who.int/water_sanitation_health/monitoring/jmp2000.pdf (accessed Sept 17, 2017).
55 Chafe ZA, Brauer M, Klimont Z, et al. Household cooking with solid fuels contributes to ambient PM2.5 air pollution and the burden of disease. Environ Health Perspect 2014; 122: 1314–20.
56 Balakrishnan K, Cohen A, Smith KR. Addressing the burden of disease attributable to air pollution in India: the need to integrate across household and ambient air pollution exposures. Environ Health Perspect 2014; 122: A6–7.
57 Yadama GN. Fires, fuel, and the fate of 3 billion: the state of the energy impoverished. Oxford: Oxford University Press, 2013.
58 Yen C, Tate JE, Hyde TB, et al. Rotavirus vaccines. Hum Vaccin Immunother 2014; 10: 1436–48.
59 Florez ID, Al-Khalifah R, Sierra JM, et al. The effectiveness and safety of treatments used for acute diarrhea and acute gastroenteritis in children: protocol for a systematic review and network meta-analysis. Syst Rev 2016; 5: 14.
60 Branca F, Piwoz E, Schultink W, Sullivan LM. Nutrition and health in women, children, and adolescent girls. BMJ 2015; 351: h4173.
61 USAID. Budget spending. https://www.usaid.gov/results-and-data/budget-spending (accessed July 12, 2016).
62 European Commission: International Cooperation and Development. Commission implementing decision adopting a multiannual indicative programme for the thematic programme ‘Global Public Goods and Challenges’ for the period 2014-2020. July 23, 2014. https://ec.europa.eu/europeaid/commision-implementing-decision-adopting-multiannual-indicative-programme-thematic-programme-global_en (accessed June 6, 2016).
63 WHO. Global action plan for the prevention and control of non-communicable diseases 2013–2020. Geneva: World Health Organisation, 2013. http://apps.who.int/iris/bitstream/10665/ 94384/1/9789241506236_eng.pdf?ua=1 (accessed March 30, 2017).
64 Kuznets S. Economic growth and income inequality. Am Econ Rev 1955; 45: 1–28.
65 Van Alstine J, Neumayer E. The environmental Kuznets curve. In: Gallagher K, ed. Handbook on trade and the environment. Cheltenham, UK: Edward Elgar Publishing, 2010.
66 Stern DI. The rise and fall of the environmental Kuznets curve. World Dev 2004; 32: 1419–39.
67 Carson RT. The environmental Kuznets curve: seeking empirical regularity and theoretical structure. Rev Environ Econ Policy 2010; 4: 3–23.
68 Andreoni J, Levinson A. The simple analytics of the environmental Kuznets curve. J Public Econ 2001; 80: 269–86.
69 Stern DI. Environmental Kuznets curve. Encycl Energy 2004; 517–25.70 Cavlovic TA, Baker KH, Berrens RP, Gawande K. A meta-analysis of
environmental Kuznets curve studies. Agric Resour Econ Rev 2000; 29: 32–42.

The Lancet Commissions
44 www.thelancet.com Published online October 19, 2017 http://dx.doi.org/10.1016/S0140-6736(17)32345-0
71 Lee CC, Chiu YB, Sun CH. Does one size fit all? A reexamination of the environmental Kuznets curve using the dynamic panel data approach. Appl Econ Perspect Policy 2009; 31: 751–78.
72 Jamison DT, Summers LH, Alleyne G, et al. Global health 2035: a world converging within a generation. Lancet 2013; 382: 1898–955.
73 Ottersen OP, Dasgupta J, Blouin C, et al. The political origins of health inequity: prospects for change. Lancet 2014; 383: 630–67.
74 Hill K, You D, Inoue M, Oestergaard MZ, for the Technical Advisory Group of United Nations Inter-agency Group for Child Mortality Estimation. Child mortality estimation: accelerated progress in reducing global child mortality, 1990–2010. PLoS Med 2012; 9: e1001303.
75 Michaels D. Doubt is their product: how industry’s assault on science threatens your health. Oxford: Oxford University Press, 2008.
76 Ahmed K, for the World Bank. Getting to green: a sourcebook of pollution management policy tools for growth and competitiveness. 2012. http://siteresources.worldbank.org/ENVIRONMENT/Resources/Getting_to_Green_web.pdf (accessed April 17, 2017).
77 Awe Y, Nygard J, Larssen S, Lee H, Dulal H, Kanakia R. Clean air and healthy lungs: enhancing the World Bank’s approach to air quality management. Washington, DC: World Bank, 2016.
78 WHO. Inheriting a sustainable world? Atlas on children’s health and the environment. Geneva: World Health Organization, 2017. http://apps.who.int/iris/bitstream/10665/254677/1/9789241511773-eng.pdf?ua=1 (accessed March 7, 2017).
79 WHO. Don’t pollute my future! The impact of the environment on children’s health. Geneva: World Health Organization, 2017. http://apps.who.int/iris/bitstream/10665/254678/1/WHO-FWC-IHE-17.01-eng.pdf?ua=1 (accessed March 7, 2017).
80 UN Environment. The Stockholm Convention on Persistent Organic Pollutants. May 22, 2001. http://chm.pops.int/TheConvention/Overview/TextoftheConvention/tabid/2232/Default.aspx (accessed July 11, 2016).
81 WHO. Ministerial declaration for health, environment and climate change. Conference of the Parties to the UN Framework Convention on Climate Change; Marrakech, Morocco; Nov 15, 2016. http://www.who.int/globalchange/mediacentre/events/Ministerial-declaration-EN.pdf (accessed Jan 3, 2017).
82 WHO. Sixty-eighth World Health Assembly agenda item 14.6. Health and environment: addressing the health impact of air pollution. May 26, 2015. http://apps.who.int/gb/ebwha/pdf_files/WHA68/A68_ACONF2Rev1-en.pdf (accessed July 12, 2016).
83 UN Environment. Global Alliance to Eliminate Lead Paint. March 2011. http://www.who.int/ipcs/assessment/public_health/framework.pdf?ua=1 (accessed July 12, 2016).
84 European Union. Directive 2010/75/EU of the European Parliament and of the Council of 24 November 2010 on industrial emissions (integrated pollution prevention and control). Nov 24, 2010. http://eur-lex.europa.eu/eli/dir/2010/75/oj (accessed March 30, 2017).
85 Wild CP. Complementing the genome with an ‘exposome’: the outstanding challenge of environmental exposure measurement in molecular epidemiology. Cancer Epidemiol Biomarkers Prev 2005; 14: 1847–50.
86 Wild CP. The exposome: from concept to utility. Int J Epidemiol 2012; 41: 24–32.
87 Prüss-Ustün A, Vickers C, Haefliger P, Bertollini R. Knowns and unknowns on burden of disease due to chemicals: a systematic review. Environ Health 2011; 10: 9.
88 Grandjean P, Landrigan PJ. Developmental neurotoxicity of industrial chemicals. Lancet 2006; 368: 2167–78.
89 Engel SM, Miodovnik A, Canfield RL, et al. Prenatal phthalate exposure is associated with childhood behavior and executive functioning. Environ Health Perspect 2010; 118: 565–71.
90 Bergman Å, Heindel JJ, Kasten T, et al. The impact of endocrine disruption: a consensus statement on the state of the science. Environ Health Perspect 2013; 121: a104–06.
91 Roen EL, Wang Y, Calafat AM, et al. Bisphenol A exposure and behavioral problems among inner city children at 7–9 years of age. Environ Res 2015; 142: 739–45.
92 Gore AC, Chappell VA, Fenton SE, et al. EDC-2: The Endocrine Society’s second scientific statement on endocrine-disrupting chemicals. Endocr Rev 2015; 36: E1–150.
93 Cimino AM, Boyles AL, Thayer KA, Perry MJ. Effects of neonicotinoid pesticide exposure on human health: a systematic review. Environ Health Perspect 2016; 125: 155–62.
94 O’Neill J, for the review on antimicrobial resistance. Tackling drug-resistant infections globally: final report and recommendations. May, 2016. https://amr-review.org/sites/ default/files/160525_Final paper_with cover.pdf (accessed Oct 4, 2016).
95 Kümmerer K. Antibiotics in the aquatic environment – a review—part II. Chemosphere 2009; 75: 435–41.
96 Petrie B, Barden R, Kasprzyk-Hordern B. A review on emerging contaminants in wastewaters and the environment: current knowledge, understudied areas and recommendations for future monitoring. Water Res 2015; 72: 3–27.
97 Watts N, Adger WN, Agnolucci P, et al. Health and climate change: policy responses to protect public health. Lancet 2015; 386: 1861–914.
98 Haines A, McMichael AJ, Smith KR, et al. Public health benefits of strategies to reduce greenhouse-gas emissions: overview and implications for policy makers. Lancet 2009; 374: 2104–14.
99 Prüss-Üstün A, Wolf J, Corvalan C, Bos R, Neira M. Preventing disease through healthy environments. Geneva: World Health Organization, 2016.
100 Hallegatte S, Bangalore M, Fay M, et al. Shock waves: managing the impacts of climate change on poverty. Washington, DC: World Bank, 2016.
101 United Nations Environment Programme. Costs of inaction on the sound management of chemicals. 2013. http://wedocs.unep.org/bitstream/handle/20.500.11822/8412/-Costs%20of %20inaction%20on%20the%20sound%20management%20of %20chemicals-2013Report_Cost_of_Inaction_Feb2013.pdf?sequence=3&isAllowed=y (accessed March 30, 2017).
102 WHO. Ambient air pollution: a global assessment of exposure and burden of disease. 2016. http://apps.who.int/iris/bitstream/10665/ 250141/1/9789241511353-eng.pdf?ua=1 (accessed April 17, 2017).
103 Communication from the Commission to the European Parliament, the Council, the European Economic and Social Committee and the Committee of the Regions: closing the loop – an EU action plan for the circular economy. Brussels: European Commission, 2015.
104 Health and Environment Alliance (HEAL). Walking the Circle – the 4 guiding pillars for a Circular Economy. http://env-health.org/IMG/pdf/walking_the_circle.pdf (accessed March 30, 2017).
105 World Economic Forum. Towards the Circular Economy: accelerating the scale-up across global supply chains. January, 2014. http://www3.weforum.org/docs/WEF_ENV_TowardsCircularEconomy_Report_2014.pdf (accessed March 13, 2017).
106 GBD 2015 DALYs and HALE Collaborators. Global, regional, and national disability-adjusted life-years (DALYs) for 315 diseases and injuries and healthy life expectancy (HALE), 1990–2015: a systematic analysis for the Global Burden of Disease Study 2015. Lancet 2016; 388: 1603–58.
107 Murray CJL, Lopez AD, for the World Health Organization, the World Bank. The global burden of disease: a comprehensive assessment of mortality and disability from diseases, injuries, and risk factors in 1990 and projected to 2020. Cambridge, MA: Harvard University Press, 1996.
108 Mathers CD, Vos T, Lopez AD, Salomon J, Ezzati M, for the World Health Organization Global Program on Evidence for Health Policy. National burden of disease studies: a practical guide, 2nd edn. October, 2001. http://www.who.int/healthinfo/nationalburdenofdiseasemanual.pdf (accessed March 30, 2017).
109 WHO International Programme on Chemical Safety. The public health impact of chemicals: knowns and unknowns, 2016. http://apps.who.int/iris/bitstream/10665/206553/1/WHO_FWC_PHE_EPE_16.01_eng.pdf (accessed Sept 13, 2017).
110 Prüss-Ustün A, Bartram J, Clasen T, et al. Burden of disease from inadequate water, sanitation and hygiene in low- and middle-income settings: a retrospective analysis of data from 145 countries. Trop Med Int Health 2014; 19: 894–905.
111 Ericson B, Caravanos J, Chatham-Stephens K, Landrigan P, Fuller R. Approaches to systematic assessment of environmental exposures posed at hazardous waste sites in the developing world: the Toxic Sites Identification Program. Environ Monit Assess 2013; 185: 1755–66.

The Lancet Commissions
www.thelancet.com Published online October 19, 2017 http://dx.doi.org/10.1016/S0140-6736(17)32345-0 45
112 Steckling N, Tobollik M, Plass D, et al. Global burden of disease of mercury used in artisanal small-scale gold mining. Ann Glob Health 2017; 83: 234–47.
113 Steckling N, Devleesschauwer B, Winkelnkemper J, et al. Disability weights for chronic mercury intoxication resulting from gold mining activities: results from an online pairwise comparisons survey. Int J Environ Res Public Health 2017; 14: 57.
114 Government of Peru Ministerio del Ambiente. Gestion de sitios contaminados. http://www.minam.gob.pe/calidadambiental/gestion-de-sitios-contaminados/ (in Spanish; accessed May 5, 2016).
115 Government of Mexico Secretaria de Medio Ambiente y Recursos Naturales. Sitios contaminados. http://www.semarnat.gob.mx/temas/gestion-ambiental/materiales-y-actividades-riesgosas/sitios-contaminados (in Spanish; accessed May 30, 2016).
116 Brandon E. The nature and extent of site contamination. In: Global approaches to site contamination law. Dordrecht: Springer Netherlands, 2013: 11–39.
117 WHO. Air quality guidelines: global update 2005, 2006. http://www.euro.who.int/__data/assets/pdf_file/0005/78638/E90038.pdf (accessed May 15, 2017).
118 WHO. WHO global urban ambient air pollution database. June 2017. http://www.who.int/phe/health_topics/outdoorair/databases/cities/en/ (accessed July 18, 2016).
119 WHO. Indoor air quality guidelines: household fuel combustion. Nov 12, 2014. http://www.who.int/indoorair/guidelines/hhfc/en/ (accessed May 15, 2017).
120 WHO. Developing national strategies for phasing out mercury-containing thermometers and sphygmomanometers in health care, including in the context of the Minamata Convention on Mercury: key considerations and step-by-step guidance. 2015. http://www.who.int/ipcs/assessment/public_health/WHOGuidanceReportonMercury2015.pdf (accessed Sept 13, 2017).
121 Pope CA 3rd, Burnett RT, Turner MC, et al. Lung cancer and cardiovascular disease mortality associated with ambient air pollution and cigarette smoke: shape of the exposure-response relationships. Environ Health Perspect 2011; 119: 1616–21.
122 The Lancet. Air pollution—crossing borders. Lancet 2016; 388: 103.
123 Health Effects Institute, GBD MAPS Working Group. Burden of disease attributable to coal-burning and other air pollution sources in China. August 2016. https://www.healtheffects.org/system/files/GBDMAPS-ReportEnglishFinal1.pdf (accessed Sept 13, 2017).
124 Apte JS, Marshall JD, Cohen AJ, Brauer M. Addressing global mortality from ambient PM2.5. Environ Sci Technol 2015; 49: 8057–66.
125 Forouzanfar MH, Alexander L, Anderson HR, et al. Global, regional, and national comparative risk assessment of 79 behavioural, environmental and occupational, and metabolic risks or clusters of risks in 188 countries, 1990–2013: a systematic analysis for the Global Burden of Disease Study 2013. Lancet 2015; 386: 2287–323.
126 National Research Council Division on Earth and Life Studies, Board on Atmospheric Sciences and Climate, Committee on the Significance of International Transport of Air Pollutants. Global sources of local pollution: an assessment of long-range transport of key air pollutants to and from the United States. Washington, DC: National Academies Press, 2009.
127 JiangX,ZhangQ,ZhaoH,etal.Revealingthehiddenhealthcostsembodied in Chinese exports. Environ Sci Technol 2015; 49: 4381–88.
128 ZhangQ,JiangX,TongD,etal.Transboundaryhealthimpactsoftransported global air pollution and international trade. Nature 2017; 543: 705–09.
129 Lin J, Pan D, Davis SJ, et al. China’s international trade and air pollution in the United States. Proc Natl Acad Sci 2014; 111: 1736–41.
130 Thurston GD, Kipen H, Annesi-Maesano I, et al. A joint ERS/ATS policy statement: what constitutes an adverse health effect of air pollution? An analytical framework. Eur Respir J 2017; 49: 1600419.
131 Wang X, Kindzierski W, Kaul P. Air pollution and acute myocardial infarction hospital admission in Alberta, Canada: a three-step procedure case-crossover study. PLoS One 2015; 10: e0132769.
132 Su C, Breitner S, Schneider A, et al. Short-term effects of fine particulate air pollution on cardiovascular hospital emergency room visits: a time-series study in Beijing, China. Int Arch Occup Environ Health 2016; 89: 641–57.
133 Weichenthal S, Lavigne E, Evans G, Pollitt K, Burnett RT. Ambient PM2.5 and risk of emergency room visits for myocardial infarction: impact of regional PM2.5 oxidative potential: a case-crossover study. Environ Health 2016; 15: 46.
134 Milojevic A, Wilkinson P, Armstrong B, Bhaskaran K, Smeeth L, Hajat S. Short-term effects of air pollution on a range of cardiovascular events in England and Wales: case-crossover analysis of the MINAP database, hospital admissions and mortality. Heart 2014; 100: 1093–98.
135 Brook RD, Franklin B, Cascio W, et al, for the Expert Panel on Population and Prevention Science of the American Heart Association. Air pollution and cardiovascular disease: a statement for healthcare professionals from the expert panel on population and prevention science of the American Heart Association. Circulation 2004; 109: 2655–71.
136 Mustafić H, Jabre P, Caussin C, et al. Main air pollutants and myocardial infarction: a systematic review and meta-analysis. JAMA 2012; 307: 713–21.
137 Gardner B, Ling F, Hopke PK, et al. Ambient fine particulate air pollution triggers ST-elevation myocardial infarction, but not non-ST elevation myocardial infarction: a case-crossover study. Part Fibre Toxicol 2014; 11: 1.
138 Chan SH, Van Hee VC, Bergen S, et al. Long-term air pollution exposure and blood pressure in the sister study. Environ Health Perspect 2015; 123: 951–58.
139 Link MS, Dockery DW. Air pollution and the triggering of cardiac arrhythmias. Curr Opin Cardiol 2010; 25: 16–22.
140 Gold DR, Samet JM. Air pollution, climate, and heart disease. Circulation 2013; 128: e411–14.
141 Newby DE, Mannucci PM, Tell GS, et al, for the ESC Working Group on Thrombosis, European Association for Cardiovascular Prevention and Rehabilitation, ESC Heart Failure Association. Expert position paper on air pollution and cardiovascular disease. Eur Heart J 2015; 36: 83–93b.
142 Beelen R, Stafoggia M, Raaschou-Nielsen O, et al. Long-term exposure to air pollution and cardiovascular mortality: an analysis of 22 European cohorts. Epidemiology 2014; 25: 368–78.
143 Kaufman JD, Adar SD, Barr RG, et al. Association between air pollution and coronary artery calcification within six metropolitan areas in the USA (the Multi-Ethnic Study of Atherosclerosis and Air Pollution): a longitudinal cohort study. Lancet 2016; 388: 696–704.
144 Hamra GB, Guha N, Cohen A, et al. Outdoor particulate matter exposure and lung cancer: a systematic review and meta-analysis. Environ Health Perspect 2014; 122: 906–11.
145 Franklin BA, Brook R, Arden Pope C 3rd. Air pollution and cardiovascular disease. Curr Probl Cardiol 2015; 40: 207–38.
146 Kaufman JD, Adar SD, Allen RW, et al. Prospective study of particulate air pollution exposures, subclinical atherosclerosis, and clinical cardiovascular disease: the Multi-Ethnic Study of Atherosclerosis and Air Pollution (MESA Air). Am J Epidemiol 2012; 176: 825–37.
147 Benziger CP, Roth GA, Moran AE. The Global Burden of Disease Study and the preventable burden of NCD. Glob Heart 2016; 11: 393–97.
148 Claeys MJ, Rajagopalan S, Nawrot TS, Brook RD. Climate and environmental triggers of acute myocardial infarction. Eur Heart J 2017; 38: 955–60.
149 Stafoggia M, Cesaroni G, Peters A, et al. Long-term exposure to ambient air pollution and incidence of cerebrovascular events: results from 11 European cohorts within the ESCAPE project. Environ Health Perspect 2014; 122: 919–25.
150 Forastiere F, Agabiti N. Assessing the link between air pollution and heart failure. Lancet; 382: 1008–10.
151 Block ML, Elder A, Auten RL, et al. The outdoor air pollution and brain health workshop. Neurotoxicology 2012; 33: 972–84.
152 Volk HE, Lurmann F, Penfold B, Hertz-Picciotto I, McConnell R. Traffic-related air pollution, particulate matter, and autism. JAMA Psychiatry 2013; 70: 71–77.

The Lancet Commissions
46 www.thelancet.com Published online October 19, 2017 http://dx.doi.org/10.1016/S0140-6736(17)32345-0
153 AmegahAK,QuansahR,JaakkolaJJK.Householdairpollutionfromsolid fuel use and risk of adverse pregnancy outcomes: a systematic review and meta-analysis of the empirical evidence. PLoS One 2014; 9: e113920.
154 Smith KR, Bruce N, Balakrishnan K, et al, for the HAP CRA Risk Expert Group. Millions dead: how do we know and what does it mean? Methods used in the comparative risk assessment of household air pollution. Annu Rev Public Health 2014; 35: 185–206.
155 Van Vliet EDS, Asante K, Jack DW, et al. Personal exposures to fine particulate matter and black carbon in households cooking with biomass fuels in rural Ghana. Environ Res 2013; 127: 40–48.
156 GaoY,ZhangY,KamijimaM,etal.Quantitativeassessmentsofindoor air pollution and the risk of childhood acute leukemia in Shanghai. Environ Pollut 2014; 187: 81–89.
157 Ha S, Hu H, Roussos-Ross D, Haidong K, Roth J, Xu X. The effects of air pollution on adverse birth outcomes. Environ Res 2014; 134: 198–204.
158 Shah PS, Balkhair T, for the Knowledge Synthesis Group on Determinants of Preterm/LBW births. Air pollution and birth outcomes: a systematic review. Environ Int 2011; 37: 498–516.
159 Glinianaia SV, Rankin J, Bell R, Pless-Mulloli T, Howel D. Particulate air pollution and fetal health. Epidemiology 2004; 15: 36–45.
160 Woodruff TJ, Darrow LA, Parker JD. Air pollution and postneonatal infant mortality in the United States, 1999–2002. Environ Health Perspect 2007; 116: 110–15.
161 Lee EJ, Schwab KJ. Deficiencies in drinking water distribution systems in developing countries. J Water Health 2005; 3: 109–27.
162 World Health Organization, UN Environment Programme, Convention on Biological Diversity. Connecting global priorities: biodiversity and human health: a state of knowledge review. 2015. https://www.cbd.int/health/SOK-biodiversity-en.pdf (accessed Feb 11, 2017).
163 European Bioplastics. Position of European Bioplastics on marine litter. August 2016. http://docs.european-bioplastics.org/publications/pp/EUBP_PP_Marine_litter.pdf (accessed March 6, 2017).
164 Hunter D. Diseases of occupations, sixth. London: Hodder Arnold H&S, 1978.
165 International Lead Association. Lead uses—statistics. http://www.ila-lead.org/lead-facts/lead-uses--statistics (accessed Oct 5, 2016).
166 Gibson JL. A plea for painted railings and painted walls of rooms as thesourceofleadpoisoningamongstQueenslandchildren.1904.Public Health Rep 2005; 120: 301–04.
167 Needleman HL, Gunnoe C, Leviton A, et al. Deficits in psychologic and classroom performance of children with elevated dentine lead levels. N Engl J Med 1979; 300: 689–95.
168 Lanphear BP, Hornung R, Khoury J, et al. Low-level environmental lead exposure and children’s intellectual function: an international pooled analysis. Environ Health Perspect 2005; 113: 894–99.
169 Caravanos J, Dowling R, Téllez-Rojo MM, et al. Blood lead levels in Mexico and pediatric burden of disease implications. Ann Glob Health 2014; 80: 269–77.
170 Reuben A, Caspi A, Belsky DW, et al. Association of childhood blood lead levels with cognitive function and socioeconomic status atage38yearsandwithIQchangeandsocioeconomicmobilitybetween childhood and adulthood. JAMA 2017; 317: 1244–51.
171 Froehlich TE, Lanphear BP, Auinger P, et al. Association of tobacco and lead exposures with attention-deficit/hyperactivity disorder. Pediatrics 2009; 124: e1054–63.
172 Needleman HL, Riess JA, Tobin MJ, Biesecker GE, Greenhouse JB. Bone lead levels and delinquent behavior. JAMA 1996; 275: 363–69.
173 Nevin R. Understanding international crime trends: the legacy of preschool lead exposure. Environ Res 2007; 104: 315–36.
174 World Health Organization. Lead poisoning and health. September 2016. http://www.who.int/mediacentre/factsheets/fs379/en/ (accessed May 15, 2016).
175 Jedrychowski WA, Perera FP, Camann D, et al. Prenatal exposure to polycyclic aromatic hydrocarbons and cognitive dysfunction in children. Environ Sci Pollut Res 2015; 22: 3631–39.
176 Bellinger DC. Prenatal exposures to environmental chemicals and children’s neurodevelopment: an update. Saf Health Work 2013; 4: 1–11.
177 Herbstman JB, Sjödin A, Kurzon M, et al. Prenatal exposure to PBDEs and neurodevelopment. Environ Health Perspect 2010; 118: 712–19.
178 Nussbaumer-Streit B, Yeoh B, Griebler U, et al. Household interventions for preventing domestic lead exposure in children. Cochrane Database Syst Rev 2016; 10: CD006047.
179 Frank AL, Joshi TK. The global spread of asbestos. Ann Glob Health 2014; 80: 257–62.
180 Téllez-Rojo MM, Hernández-Avila M, Lamadrid-Figueroa H. Impact of bone lead and bone resorption on plasma and whole blood lead levels during pregnancy. Am J Epidemiol 2004; 160: 668–78.
181 Mandour RA, Ghanem AA, El-Azab SM. Correlation between lead levels in drinking water and mothers’ breast milk: Dakahlia, Egypt. Environ Geochem Health 2013; 35: 251–56.
182 Clark CS, Rampal KG, Thuppil V, et al. Lead levels in new enamel household paints from Asia, Africa and South America. Environ Res 2009; 109: 930–36.
183 Jacobs DE. Environmental health disparities in housing. Am J Public Health 2011; 101 (suppl 1): S115–22.
184 Hanna-Attisha M, LaChance J, Sadler RC, Champney Schnepp A. Elevated blood lead levels in children associated with the flint drinking water crisis: a spatial analysis of risk and public health response. Am J Public Health 2016; 106: 283–90.
185 Pure Earth. World’s worst pollution problems. The new top six toxic threats: a priority list for remediation. Fact sheet - lead. http://www.worstpolluted.org/projects_reports/display/127 (accessed July 18, 2016).
186 Global Burden of Disease Study 2013 Collaborators. Global, regional, and national incidence, prevalence, and years lived with disability for 301 acute and chronic diseases and injuries in 188 countries, 1990–2013: a systematic analysis for the Global Burden of Disease Study 2013. Lancet 2015; 386: 743–800.
187 Haefliger P, Mathieu-Nolf M, Lociciro S, et al. Mass lead intoxication from informal used lead-acid battery recycling in Dakar, Senegal. Environ Health Perspect 2009; 117: 1535–40.
188 Schober SE, Mirel LB, Graubard BI, Brody DJ, Flegal KM. Blood lead levels and death from all causes, cardiovascular disease, and cancer: results from the NHANES III mortality study. Environ Health Perspect 2006; 114: 1538–41.
189 Aoki Y, Brody DJ, Flegal KM, Fakhouri THI, Axelrad DA, Parker JD. Blood lead and other metal biomarkers as risk factors for cardiovascular disease mortality. Medicine (Baltimore) 2016; 95: e2223.
190 Fewtrell LJ, Prüss-Üstün A, Landrigan P, Ayuso-Mateos JL. Estimating the global burden of disease of mild mental retardation and cardiovascular diseases from environmental lead exposure. Environ Res 2004; 94: 120–33.
191 Fuller R. Hazardous waste and toxic hotspots. In: Landrigan P, Etzel RA, eds. Textbook of children’s environmental health. London: Oxford University Press, 2013: 254–61.
192 Ha E, Basu N, Bose-O’Reilly S, et al. Current progress on understanding the impact of mercury on human health. Environ Res 2017; 152: 419–33.
193 Sharov P, Dowling R, Gogishvili M, et al. The prevalence of toxic hotspots in former Soviet countries. Environ Pollut 2016; 211: 346–53.
194 Caravanos J, Gutierrez LH, Ericson B, Fuller R. A comparison of burden of disease from toxic waste sites with other recognized public health threats in India, Indonesia and the Philippines. J Health Pollut 2014; 4: 2–13.
195 Brevik EC, Burgess LC. The influence of soils on human health. Nat Educ Knowl 2014; 5: 1.
196 Chatham-Stephens K, Caravanos J, Ericson B, Landrigan P, Fuller R. The pediatric burden of disease from lead exposure at toxic waste sites in low and middle income countries. Environ Res 2014; 132: 379–83.
197 Moya J, Phillips L. A review of soil and dust ingestion studies for children. J Expo Sci Environ Epidemiol 2014; 24: 545–54.
198 van Wijnen JH, Clausing P, Brunekreef B. Estimated soil ingestion by children. Environ Res 1990; 51: 147–62.
199 Landrigan PJ, Wright RO, Cordero JF, et al. The NIEHS Superfund Research Program: 25 years of translational research for public health. Environ Health Perspect 2015; 123: 909–18.

The Lancet Commissions
www.thelancet.com Published online October 19, 2017 http://dx.doi.org/10.1016/S0140-6736(17)32345-0 47
200 US Environmental Protection Agency. Summary of the Comprehensive Environmental Response, Compensation, and Liability Act (Superfund). 1980. https://www.epa.gov/laws-regulations/summary-comprehensive-environmental-response-compensation-and-liability-act (accessed June 8, 2016).
201 European Union. Directive 2004/35/CE of the European Parliament and of the Council of 21 April 2004 on environmental liability with regard to the prevention and remedying of environmental damage. http://eur-lex.europa.eu/legal-content/EN/TXT/?uri=celex%3A32004L0035 (accessed Sept 13, 2017).
202 Caravanos J, Carrelli J, Dowling R, Pavilonis B, Ericson B, Fuller R. Burden of disease resulting from lead exposure at toxic waste sites in Argentina, Mexico and Uruguay. Environ Health 2016; 15: 72.
203 Ericson B, Landrigan P, Taylor MP, et al. The global burden of lead toxicity attributable to informal used lead-acid battery sites. Ann Glob Health 2016; 82: 686–99.
204 Pebe G, Hugo V, Escate L, Cervantes G. Niveles de plomo sanguíneo en recién nacidos de la Oroya, 2004–2005. Rev Peru Med Exp Salud Publica 2008; 25: 355–60 (in Spanish).
205 Carrizales L, Razo I, Téllez-Hernández JI, et al. Exposure to arsenic and lead of children living near a copper-smelter in San Luis Potosi, Mexico: importance of soil contamination for exposure of children. Environ Res 2006; 101: 1–10.
206 van der Kuijp TJ, Huang L, Cherry CR. Health hazards of China’s lead-acid battery industry: a review of its market drivers, production processes, and health impacts. Environ Health 2013; 12: 61.
207 UN Environment Programme. Global mercury assessment 2013: sources, emissions, releases and environmental transport. http://wedocs.unep.org/handle/20.500.11822/7984?show=full (accessed Sept 13, 2017).
208 Agricola G, Hoover HC, Hoover LH, York NY. De re metallica. Mineola, NY: Dover Books, 1950.
209 Ramazzini B, Wright WC. De morbis artificum diatribe: diseases of workers. The Latin text of 1713 revised, with translation and notes. Chicago: Chicago University Press, 1940.
210 Derickson A. Black lung: anatomy of a public health disaster. New York: Cornell University Press, 1998.
211 Rehn L. Blasengeschwülste bei Fuchsin-Arbeitern. Archiv für Klininische Chirurgie 1895; 50: 240–52 (in German).
212 Rinsky RA. Benzene and leukemia: an epidemiologic risk assessment. Environ Health Perspect 1989; 82: 189–91.
213 Selikoff IJ, Churg J, Hammond EC. Asbestos exposure and neoplasia. JAMA 1964; 188: 22–26.
214 Takahashi K, Landrigan PJ. The global health dimensions of asbestos and asbestos-related diseases. Ann Glob Health 2016; 82: 209–13.
215 Lucchini RG, Guazzetti S, Zoni S, et al. Neurofunctional dopaminergic impairment in elderly after lifetime exposure to manganese. Neurotoxicology 2014; 45: 309–17.
216 Brautbar N, Williams J 2nd. Industrial solvents and liver toxicity: risk assessment, risk factors and mechanisms. Int J Hyg Environ Health 2002; 205: 479–91.
217 Chisolm JJ Jr. Fouling one’s own nest. Pediatrics 1978; 62: 614–17.218 Trasande L, Landrigan PJ. The National Children’s Study: a critical
national investment. Environ Health Perspect 2004; 112: A789–90.219 Jacobson JL, Jacobson SW. Intellectual impairment in children
exposed to polychlorinated biphenyls in utero. N Engl J Med 1996; 335: 783–89.
220 Rauh VA, Perera FP, Horton MK, et al. Brain anomalies in children exposed prenatally to a common organophosphate pesticide. Proc Natl Acad Sci 2012; 109: 7871–76.
221 Bouchard MF, Chevrier J, Harley KG, et al. Prenatal exposure to organophosphatepesticidesandIQin7yearoldchildren.Environ Health Perspect 2011; 119: 1189–95.
222 Suk WA, Ahanchian H, Asante KA, et al. Environmental pollution: an under-recognized threat to children’s health, especially in low- and middle-income countries. Environ Health Perspect 2016; 124: A41–45.
223 UN Environment Programme. Global chemicals outlook—towards sound management of chemicals. 2013. http://web.unep.org/chemicalsandwaste/sites/unep.org.chemicalsandwaste/files/publications/GCO_web.pdf (accessed March 30, 2017).
224 Engel SM, Wetmur J, Chen J, et al. Prenatal exposure to organophosphates, paraoxonase 1, and cognitive development in childhood. Environ Health Perspect 2011; 119: 1182–88.
225 Jensen TK, Frederiksen H, Kyhl HB, et al. Prenatal exposure to phthalates and anogenital distance in male infants from a low-exposed Danish cohort (2010–2012). Environ Health Perspect 2016; 124: 1107–13.
226 Grube A, Donaldson D, Kiely T, Wu L, for the US Environmental Protection Agency. Pesticides industry sales and usage. 2006 and 2007 market estimates. February 2011. https://www.epa.gov/sites/production/files/2015-10/documents/market_estimates2007.pdf (accessed April 17, 2017).
227 Slotkin TA. Cholinergic systems in brain development and disruption by neurotoxicants: nicotine, environmental tobacco smoke, organophosphates. Toxicol Appl Pharmacol 2004; 198: 132–51.
228 Jeschke P, Nauen R, Schindler M, Elbert A. Overview of the status and global strategy for neonicotinoids. J Agric Food Chem 2011; 59: 2897–908.
229 Hopwood J, Code A, Vaughan M, et al. How neonicotinoids can kill bees: the science behind the role these insecticides play in harming bees, 2nd edn. Portland: The Xerces Society for Invertebrate Conservation, 2016.
230 Breer H, Sattelle DB. Molecular properties and functions of insect acetylcholine receptors. J Insect Physiol 1987; 33: 771–90.
231 Rundlöf M, Andersson GK, Bommarco R, et al. Seed coating with a neonicotinoid insecticide negatively affects wild bees. Nature 2015; 521: 77–80.
232 Woodcock BA, Isaac NJB, Bullock JM, et al. Impacts of neonicotinoid use on long-term population changes in wild bees in England. Nat Commun 2016; 7: 12459.
233 Guyton KZ, Loomis D, Grosse Y, et al, for the International Agency for Research on Cancer Monograph Working Group. Carcinogenicity of tetrachlorvinphos, parathion, malathion, diazinon, and glyphosate. Lancet Oncol 2015; 16: 490–91.
234 World Health Organization. Pharmaceuticals in drinking-water. 2011. http://www.who.int/water_sanitation_health/publications/ 2011/pharmaceuticals_20110601.pdf (accessed May 31, 2017).
235 Kot-Wasik A, Jakimska A, Śliwka-Kaszyńska M. Occurrence and seasonal variations of 25 pharmaceutical residues in wastewater and drinking water treatment plants. Environ Monit Assess 2016; 188: 661.
236 Hunt A, Ferguson J, Hurley F, Searl A. Social costs of morbidity impacts of air pollution. OECD environment working papers, no. 99. Paris: OECD Publishing, 2016.
237 Andersen MS, Clubb DO. Understanding and accounting for the costs of inaction. In: European Environment Agency. Late lessons from early warnings. Luxembourg: Publications Office of the European Union, 2013.
238 Preker AS, Adeyi OO, Lapetra MG, Simon DC, Keuffel E. Health care expenditures associated with pollution: exploratory methods and findings. Ann Glob Health 2016; 82: 711–21.
239 Institute of Medicine. Cost of environmental-related health effects: a plan for continuing study. Washington, DC: National Academies Press, 1981.
240 Smith KR, Corvalán CF, Kjellström T. How much global ill health is attributable to environmental factors? Epidemiology 1999; 10: 573–84.
241 Jo C. Cost-of-illness studies: concepts, scopes, and methods. Clin Mol Hepatol 2014; 20: 327–37.
242 Landrigan PJ, Schechter CB, Lipton JM, Fahs MC, Schwartz J. Environmental pollutants and disease in American children: estimates of morbidity, mortality, and costs for lead poisoning, asthma, cancer, and developmental disabilities. Environ Health Perspect 2002; 110: 721–28.
243 Trasande L. Economics of children’s environmental health. Mt Sinai J Med 2011; 78: 98–106.
244 Brandt SJ, Perez L, Künzli N, Lurmann F, McConnell R. Costs of childhood asthma due to traffic-related pollution in two California communities. Eur Respir J 2012; 40: 363–70.
245 Leigh JP. Economic burden of occupational injury and illness in the United States. Milbank Q 2011; 89: 728–72.
246 Narain U, Sall C. Methodology for valuing the health impacts of air pollution: discussion of challenges and proposed solutions. Washington, DC: World Bank, 2016 https://openknowledge.worldbank.org/handle/10986/24440 (accessed Sept 13, 2017).
247 Golub E, Klytchnikova I, Sanchez-Martinez G, Belausteguigoitia JC, Monina CM. Environmental health costs in Colombia: the changes from 2002 to 2010. Washington, DC: World Bank, 2014.
The Lancet Commissions
48 www.thelancet.com Published online October 19, 2017 http://dx.doi.org/10.1016/S0140-6736(17)32345-0
248 World Bank. Cost of pollution in China: economic estimates of physical damages. Washington, DC: World Bank, 2007. http://documents.worldbank.org/curated/en/2007/02/7503894/cost-pollution-china-economic-estimates-physical-damages (accessed July 14, 2016).
249 Kemper K. Environmental health in Nicaragua: addressing key environmental challenges. Washington, DC: World Bank, 2013 http://documents.worldbank.org/curated/en/2013/01/17617086/environmental-health-nicaragua-addressing-key-environmental-challenges.
250 Viscusi WK, Aldy JE. The value of a statistical life: a critical review of market estimates throughout the world. J Risk Uncertain 2003; 27: 5–76.
251 Alberini A, Cropper M, Krupnick A, Simon NB. Does the value of a statistical life vary with age and health status? Evidence from the US and Canada. J Environ Econ Manage 2004; 48: 769–92.
252 Krupnick A, Alberini A, Cropper M, et al. Age, health and the willingness to pay for mortality risk reductions: a contingent valuation survey of Ontario residents. J Risk Uncertain 2002; 24: 161–86.
253 Hammitt JK, Robinson LA. The income elasticity of the value per statistical life: transferring estimates between high and low income populations. J Benefit-Cost Anal 2011; 2: 1–29.
254 Hanna R, Oliva P. The effect of pollution on labor supply: evidence from a natural experiment in Mexico City. J Public Econ 2015; 122: 68–79.
255 Zivin JG, Neidell M. The impact of pollution on worker productivity. Am Econ Rev 2012; 102: 3652–73.
256 Chang T, Zivin JG, Gross T, Neidell M. Particulate pollution and the productivity of pear packers. Am Econ J Econ Policy 2014; 8: 141–69.
257 Carson RT, Koundouri P, Nauges C. Arsenic mitigation in Bangladesh: a household labor market approach. Am J Agric Econ 2010; 93: 407–14.
258 Whittington D, Hanemann WM, Sadoff C, Jeuland M. The challenge of improving water and sanitation services in less developed countries. Found Trends Microeconomics 2009; 4: 469–609.
259 Hutton G. Global costs and benefits of reaching universal coverage of sanitation and drinking-water supply. J Water Health 2013; 11: 1–12.
260 Hutton G. Water and sanitation assessment paper: benefits and costs of the water sanitation and hygiene targets from the post-2015 development agenda. Copenhagen: Copenhagen Consensus Center, 2015.
261 World Bank. Environmental sustainability: a key to poverty reduction in Peru. Washington DC: World Bank, 2007.
262 Whittington D. Water and sanitation perspective paper: benefits and costs of the water, sanitation and hygiene targets for the post-2015 agenda. Copenhagen: Copenhagen Consensus Center, 2015.
263 Whittington D, Jeuland M, Barker K, Yuen Y. Setting priorities, targeting subsidies among water, sanitation, and preventive health interventions in developing countries. World Dev 2012; 40: 1546–68.
264 Jeuland M, Whittington D. Cost–benefit comparisons of investments in improved water supply and cholera vaccination programs. Vaccine 2009; 27: 3109–20.
265 Colborn T, Dumanoski D, Myers JP. Our stolen future: are we threatening our fertility, intelligence, and survival? New York: Penguin Books, 1997.
266 Salkever DS. Updated estimates of earnings benefits from reduced exposure of children to environmental lead. Environ Res 1995; 70: 1–6.
267 Heckman JJ, Stixrud J, Urzua S. The effects of cognitive and noncognitive abilities on labor market outcomes and social behavior. J Labor Econ 2006; 24: 411–82.
268 ZaxJS,ReesDI.IQ,academicperformance,environment,andearnings. Rev Econ Stat 2002; 84: 600–16.
269 GrosseS.HowmuchdoesIQraiseearnings?Implicationsforregulatory impact analyses. Assoc Environ Resour Econ Newsl 2007; 27: 17–21.
270 Rau T, Urzúa S, Reyes L. Early exposure to hazardous waste and academic achievement: evidence from a case of environmental negligence. J Assoc Environ Resour Econ 2015; 2: 527–63.
271 Muennig P. The social costs of lead poisonings. Health Aff 2016; 35: 1545.
272 Organization for Economic Co-operation and Development (OECD). Extension of work on expenditure by disease, age and gender. December 2013. https://www.oecd.org/els/health-systems/Extension-of-work-on-expenditure-by-disease-age-and-gender_Final-Report.pdf (accessed April 17, 2017).
273 Rannan-Eliya R. Health expenditures by disease and age, Sri Lanka 2005: preliminary findings. 3rd RCHSP-APNHAN Experts Meeting; Seoul, Korea; June 20, 2007.
274 Aikins M, Armah G, Akazili J, Hodgson A. Hospital health care cost of diarrheal disease in northern Ghana. J Infect Dis 2010; 202: S126–30.
275 Alvis-Guzman N, Orozco-Africano J, Paternina-Caicedo A, et al. Treatment costs of diarrheal disease and all-cause pneumonia among children under-5 years of age in Colombia. Vaccine 2013; 31 (suppl 3): C58–62.
276 National Research Council Subcommittee on Nutrition and Diarrheal Diseases Control. Nutritional management of acute diarrhea in infants and children. Washington, DC: National Academies Press, 1985.
277 Bhargava A. Protein and micronutrient intakes are associated with child growth and morbidity from infancy to adulthood in the Philippines. J Nutr 2016; 146: 133–41.
278 Glewwe P, Miguel EA. The impact of child health and nutrition on education in less developed countries. In: Chenery HB. Handbook of Development Economics, Volume 4. Amsterdam: Elsevier, 2008: 3561–606.
279 World Bank. The cost of air pollution: strengthening the economic case for action. Sept 8, 2016. http://documents.worldbank.org/curated/en/781521473177013155/The-cost-of-air-pollution-strengthening-the-economic-case-for-action (accessed Jan 17, 2017).
280 Burr P, Fonseca C. Applying a life-cycle costs approach to water. Costs and service levels in rural and small town areas in Andhra Pradesh (India), Burkina Faso, Ghana and Mozambique. January 2013. http://www.ircwash.org/sites/default/files/20130208_8_wp_water_web_2.pdf (accessed March 30, 2017).
281 Jerven M. Poor numbers: how we are misled by African development statistics and what to do about it. New York: Cornell University Press, 2013.
282 Nordhaus W, Tobin J. Is growth obsolete? In: Economic Research: Retrospect and prospect, Volume 5, Economic growth. Washington, DC: National Bureau of Economic Research, Inc, 1972: 1–80.
283 United Nations. Poverty biggest enemy of health in developing world, Secretary-General tells World Health Assembly. May 17, 2001. http://www.un.org/press/en/2001/sgsm7808.doc.htm (accessed Sept 9, 2016).
284 Hajat A, Hsia C, O’Neill MS. Socioeconomic disparities and air pollution exposure: a global review. Curr Environ Health Reports 2015; 2: 440–50.
285 UN Development Programme. Multidimensional Poverty Index (MPI). http://hdr.undp.org/en/content/multidimensional-poverty-index-mpi (accessed July 18, 2016).
286 Furie GL, Balbus J. Global environmental health and sustainable development: the role at Rio+20. Cien Saude Colet 2012; 17: 1427–32.
287 Torpy JM, Lynm C, Glass RM. Poverty and health. JAMA 2007; 298: 1968.
288 Grant K, Goldizen FC, Sly PD, et al. Health consequences of exposure to e-waste: a systematic review. Lancet Glob Health 2013; 1: e350–61.
289 Muennig P, Fiscella K, Tancredi D, Franks P. The relative health burden of selected social and behavioral risk factors in the United States: implications for policy. Am J Public Health 2010; 100: 1758–64.
290 Briggs D. Environmental pollution and the global burden of disease. Br Med Bull 2003; 68: 1–24.
291 United Nations. Universal declaration of human rights. Dec 10, 1948. http://www.un.org/en/universal-declaration-human-rights/ (accessed Jan 18, 2017).
292 United Nations Human Rights: Office of the High Commissioner. The rights of the child and hazardous substances and wastes. http://www.ohchr.org/EN/Issues/Environment/ToxicWastes/Pages/RightsoftheChildHazardousSubstancesWastes.aspx (accessed March 13, 2017).

The Lancet Commissions
www.thelancet.com Published online October 19, 2017 http://dx.doi.org/10.1016/S0140-6736(17)32345-0 49
293 African Commission on Human and Peoples’ Rights. African Charter on Human and Peoples’ Rights, Article 24. http://www.achpr.org/instruments/achpr/#a24 (accessed July 18, 2016).
294 Organization of American States. Additional protocol to the American Convention on Human Rights in the area of economic, social and cultural rights ‘Protocol of San Salvador’. http://www.oas.org/juridico/english/treaties/a-52.html (accessed July 18, 2016).
295 United Nations Environment Programme Law Division. Human rights and the environment. http://www.unep.org/divisions/delc/human-rights-and-environment (accessed Sept 13, 2017).
296 Institute on the Environment (ENSIA). Robert Bullard: the father of environmental justice. June 12, 2014. https://ensia.com/interviews/robert-bullard-the-father-of-environmental-justice/ (accessed Jan 9, 2017).
297 Bullard RD, Boulder CO. Dumping in Dixie: race, class, and environmental quality. Boulder, CO: Westview Press, 1990.
298 EJnet (Web Resources for Environmental Justice Activists). Environmental justice in the 21st century. 2001. http://www.ejnet.org/ej/principles.pdf (accessed Feb 11, 2017).
299 Nixon R. Slow violence and the environmentalism of the poor. Cambridge, MA: Harvard University Press, 2013.
300 Bailey ZD, Krieger N, Agénor M, Graves J, Linos N, Bassett MT. Structural racism and health inequities in the USA: evidence and interventions. Lancet 2017; 389: 1453–63.
301 Corburn J. Concepts for studying urban environmental justice. Curr Environ Health Rep 2017; 14: 61–67.
302 Solomon GM, Morello-Frosch R, Zeise L, Faust JB. Cumulative environmental impacts: science and policy to protect communities. Annu Rev Public Health 2016; 37: 83–96.
303 Chakraborty J, Collins T, Grineski S. Environmental justice research: contemporary issues and emerging topics. Int J Environ Res Public Health 2016; 13: E1072.
304 Watkins BX, Shepard PM, Corbin-Mark CD. Completing the circle: a model for effective community review of environmental health research. Am J Public Health 2009; 99 (suppl 3): S567–77.
305 Pezzullo PC. Touring ‘Cancer Alley,’ Louisiana: performances of community and memory for environmental justice. Text Perform Q 2003; 23: 226–52.
306 Brugge D, Goble R. The history of uranium mining and the Navajo people. Am J Public Health 2002; 92: 1410–19.
307 Cushing L, Faust J, August LM, Cendak R, Wieland W, Alexeeff G. Racial/ethnic disparities in cumulative environmental health impacts in California: evidence from a statewide environmental justice screening tool (CalEnviroScreen 1.1). Am J Public Health 2015; 105: 2341–48.
308 Thomas-Müller C. Tar sands: environmental justice, treaty rights and Indigenous Peoples. Can Dimens 2008; 42.
309 Wiebe SM. Everyday exposure: indigenous mobilization and environmental justice in Canada’s Chemical Valley. Vancouver: University of British Columbia Press, 2016.
310 Deguen S, Zmirou-Navier D. Social inequalities resulting from health risks related to ambient air quality—a European review. Eur J Public Health 2010; 20: 27–35.
311 Steger T, for the CEU Center for Environmental Policy and Law, the Health and Environment Alliance, the Coalition for Environmental Justice. Making the case for environmental justice in central & eastern Europe. Budapest: CEU Center for Environmental Policy and Law, 2007.
312 Hedley AJ, McGhee SM, Barron B, et al. Air pollution: costs and paths to a solution in Hong Kong—understanding the connections among visibility, air pollution, and health costs in pursuit of accountability, environmental justice, and health protection. J Toxicol Environ Health A 2008; 71: 544–54.
313 United Nations Development Programme. Environmental justice—comparative experiences in legal empowerment. June 12, 2014. http://www.undp.org/content/undp/en/home/librarypage/democratic-governance/access_to_justiceandruleoflaw/environmental-justice---comparative-experiences.html (accessed July 18, 2016).
314 Saha S, Pattanayak SK, Sills EO, Singha AK. Under-mining health: environmental justice and mining in India. Health Place 2011; 17: 140–48.
315 Yabe J, Nakayama SMM, Ikenaka Y, et al. Lead poisoning in children from townships in the vicinity of a lead–zinc mine in Kabwe, Zambia. Chemosphere 2015; 119: 941–47.
316 Bashir M, Umar-Tsafe N, Getso K, et al. Assessment of blood lead levels among children aged ≤5 years—Zamfara State, Nigeria, June–July 2012. MMWR 2014; 63: 325–27.
317 Alam S, Bhuiyan JH, Chowdhury T, Techera E. Routledge handbook of international environmental law. Abingdon-on-Thames, UK; Routledge, 2013.
318 Temper L, Del Bene D, Martinez-Alier J. Mapping the frontiers and front lines of global environmental justice: the EJAtlas. J Polit Ecol 2015; 22: 256.
319 The World Bank. DataBank world development indicators. PM2.5 air pollution, mean annual exposure (micrograms per cubic meter). http://databank.worldbank.org/data/reports.aspx?source=2 &series=EN.ATM.PM25.MC.M3&country= (accessed Jan 4, 2017).
320 The World Bank. DataBank world development indicators. GDP per capita (current US$). http://databank.worldbank.org/data/reports.aspx?source=2&series=NY.GDP.PCAP.CD&country= (accessed Jan 4, 2017).
321 Water Supply & Sanitation Collaborative Council. Post-2015 WAST targets and indicators. http://wsscc.org/2015/02/20/post-2015-wash-targets-indicators-questions-answers/ (accessed July 18, 2016).
322 Sommer M, Caruso BA, Sahin M, et al. A time for global action: addressing girls’ menstrual hygiene management needs in schools. PLoS Med 2016; 13: e1001962.
323 Spitz PH. The chemical industry at the millennium: maturity, restructuring, and globalization. Philadelphia, PA: Chemical Heritage Foundation, 2003.
324 Heacock M, Kelly CB, Asante KA, et al. E-waste and harm to vulnerable populations: a growing global problem. Environ Health Perspect 2016; 124: 550–55.
325 Iskander M, Meyerman G, Gray DF, Hagan S, for the International Monetary Fund. Corporate restructuring and governance in east Asia. Finance Dev 1999; 36: 42–45.
326 Carmin J, Agyeman J. Environmental inequalities beyond borders: local perspectives on global injustices. Cambridge, MA: MIT Press, 2011.
327 Margai FM, Barry FB. Global geographies of environmental injustice and health: a case study of illegal hazardous waste dumping in Côte d’Ivoire. Geospatial Anal Environ Health 2011; 4: 257–81.
328 Business & Human Rights Resource Centre. Trafigura lawsuits (re Côte d’Ivoire). https://business-humanrights.org/en/trafigura-lawsuits-re-cote-d’ivoire (accessed Jan 18, 2017).
329 Caravanos J, Clark E, Fuller R, Lambertson C. Assessing worker and environmental chemical exposure risks at an e-waste recycling and disposal site in Accra, Ghana. J Health Pollut 2011; 1: 16–25.
330 Robinson BH. E-waste: An assessment of global production and environmental impacts. Sci Total Environ 2009; 408: 183–91.
331 United Nations Sustainable Development Knowledge Platform. Transforming our world: the 2030 agenda for sustainable development. https://sustainabledevelopment.un.org/post2015/transformingourworld (accessed Jan 18, 2017).
332 GBD 2015 SDG Collaborators. Measuring the health-related Sustainable Development Goals in 188 countries: a baseline analysis from the Global Burden of Disease Study 2015. Lancet 2016; 388: 1813–50.
333 World Commission on Environment and Development. Report of the World Commission on Environment and Development: our common future (Brundtland report). Oxford: Oxford University Press, 1987. http://www.un-documents.net/our-common-future.pdf (accessed March 13, 2017).
334 United Nations Development Programme. Human development report 2011. Sustainability and equity: a better future for all. 2011. http://hdr.undp.org/sites/default/files/reports/271/hdr_2011_en_complete.pdf (accessed March 13, 2017).
335 United Nations Environment Programme. Proposal regional action plan for intergovernmental cooperation on air pollution for Latin America and the Caribbean. Oct 20, 2013. http://www.pnuma.org/forodeministros/19-mexico/documentos/Proposed Regional Action Plan Atmospherc Pollution FINAL 301013.pdf (accessed Sept 27, 2016).
The Lancet Commissions
50 www.thelancet.com Published online October 19, 2017 http://dx.doi.org/10.1016/S0140-6736(17)32345-0
336 Patz JA, Frumkin H, Holloway T, Vimont DJ, Haines A. Climate change. JAMA 2014; 312: 1565–80.
337 Bransford KJ, Lai JA. MSJAMA: Global climate change and air pollution: common origins with common solutions. JAMA 2002; 287: 2285.
338 HarrisJB,LaRocqueRC,QadriF,RyanET,CalderwoodSB.Cholera. Lancet 2012; 379: 2466–76.
339 Brewer T, Pringle Y. Beyond Bazalgette: 150 years of sanitation. Lancet 2015; 386: 128–29.
340 Lawther PJ, Waller RE, Henderson M. Air pollution and exacerbations of bronchitis. Thorax 1970; 25: 525–39.
341 Harada M. Minamata disease: methylmercury poisoning in Japan caused by environmental pollution. Crit Rev Toxicol 1995; 25: 1–24.
342 Arnold BF, Null C, Luby SP, et al. Cluster-randomised controlled trials of individual and combined water, sanitation, hygiene and nutritional interventions in rural Bangladesh and Kenya: the WASH Benefits study design and rationale. BMJ Open 2013; 3: e003476.
343 Huda TM, Unicomb L, Johnston RB, Halder AK, Yushuf Sharker MA, Luby SP. Interim evaluation of a large scale sanitation, hygiene and water improvement programme on childhood diarrhea and respiratory disease in rural Bangladesh. Soc Sci Med 2012; 75: 604–11.
344 State Council of China. Law of the People’s Republic of China on prevention and control of water pollution. http://www.npc.gov.cn/englishnpc/Law/2007-12/13/content_1383966.htm (accessed Sept 13, 2017).
345 Rohde RA, Muller RA. Air pollution in China: mapping of concentrations and sources. PLoS One 2015; 10: e0135749.
346 Haacke O, for the US-China business council. NDRC prepares for next five-year plan, focuses on quality over quantity. https://www.uschina.org/ndrc-prepares-next-five-year-plan-focuses-quality-over-quantity (accessed Sept 12, 2016).
347 Seligsohn D, Hsu A, for ChinaFile. How China’s 13th five-year plan addresses energy and the environment. March 10, 2016. http://www.chinafile.com/reporting-opinion/environment/how-chinas-13th-five-year-plan-addresses-energy-and-environment (accessed Sept 13, 2017).
348 Greenpeace. Clean Air Action Plan: the way forward. February 2016. http://www.greenpeace.org/eastasia/Global/eastasia/publications/reports/climate-energy/2016/Clean%20Air%20Action%20Plan,%20The%20way%20forward.pdf (accessed Sept 13, 2017).
349 Jingjing C, Tang J, for New Security Beat. Will China’s new air law solve its pollution crisis? Nov 25, 2015. https://www.newsecuritybeat.org/2015/11/chinas-air-law-solve-pollution-crisis/ (accessed Sept 12, 2016).
350 Lin A, for NRDC Expert Blog. How China’s 13th five year plan climate and energy targets accelerate its transition to clean energy. March 13, 2016. https://www.nrdc.org/experts/alvin-lin/how-chinas-13th-five-year-plan-climate-and-energy-targets-accelerate-its (accessed Sept 13, 2017).
351 China Water Risk. New ‘Water Ten Plan’ to safeguard China’s water. 2016. http://chinawaterrisk.org/notices/new-water-ten-plan-to-safeguard-chinas-waters/ (accessed Sept 12, 2016).
352 Wang X, Lou X, Zhang N, et al. Phthalate esters in main source water and drinking water of Zhejiang Province (China): distribution and health risks. Environ Toxicol Chem 2015; 34: 2205–12.
353 Jinran Z, for China Daily USA. Action plan targets soil pollution. June 1, 2016. http://usa.chinadaily.com.cn/china/2016-06/01/content_25563338.htm (accessed Sept 13, 2017).
354 China.org.cn. China announces soil pollution controls. June 1, 2016. http://www.china.org.cn/china/2016-06/01/content_38576923.htm (accessed Sept 12, 2016).
355 Dold B, Wade C, Fontboté L. Water management for acid mine drainage control at the polymetallic Zn–Pb–(Ag–Bi–Cu) deposit Cerro de Pasco, Peru. J Geochemical Explor 2009; 100: 133–41.
356 McKinleyG,ZukM,HöjerM,etal.Quantificationoflocalandglobal benefits from air pollution control in Mexico City. Environ Sci Technol 2005; 39: 1954–61.
357 Amarsaikhan D, Battsengel V, Nergui B, Ganzorig M, Bolor G. A study on air pollution in Ulaanbaatar City, Mongolia. J Geosci Environ Prot 2014; 2: 123–28.
358 The Lancet. India’s air pollution: a new government and global plan. Lancet 2016; 387: 96.
359 Hernandez RA. Prevention and control of air pollution in China: a research agenda for science and technology studies. Sapiens 2015; 8.
360 Clean Air Asia. China Air 2016. Air pollution prevention and control progress in Chinese cities. 2016. http://cleanairasia.org/wp-content/uploads/2016/08/China-Air-2016-Report-Full.pdf (accessed June 5, 2017).
361 Martin RT, for MIT Technology Review. Substainable energy: China is on an epic solar power binge. March 22, 2016. https://www.technologyreview.com/s/601093/china-is-on-an-epic-solar-power-binge/ (accessed June 5, 2017).
362 Gunningham N. Enforcing environmental regulation. J Environ Law 2011; 23: 169–201.
363 Zhang JJ, Smith KR. Household air pollution from coal and biomass fuels in China: measurements, health impacts, and interventions. Environ Health Perspect 2007; 115: 848–55.
364 Vahlne N, Ahlgren EO. Policy implications for improved cook stove programs—a case study of the importance of village fuel use variations. Energy Policy 2014; 66: 484–95.
365 LanQ,ChapmanRS,SchreinemachersDM,TianL,HeX.Household stove improvement and risk of lung cancer in Xuanwei, China. J Natl Cancer Inst 2002; 94: 826–35.
366 Sinha B. The Indian stove programme: an insider’s view - the role of society, politics, economics and education. Boil Point 2002; 48.
367 Block M, Hanrahan D, for Blacksmith Institute, Green Cross Switzerland. World’s most polluted places report 2009: 12 cases of cleanup and success. 2009. http://www.worstpolluted.org/files/FileUpload/files/2009-report/Blacksmith-Institute-Green-Cross-Switzerland-WWPP-Report-2009.pdf (accessed Sept 13, 2017).
368 Amegah AK, Jaakkola JJK. Household air pollution and the sustainable development goals. Bull World Health Organ 2016; 94: 215–21.
369 Jasper C, Le TT, Bartram J. Water and sanitation in schools: a systematic review of the health and educational outcomes. Int J Environ Res Public Health 2012; 9: 2772–87.
370 Van Minh H, Nguyen-Viet H. Economic aspects of sanitation in developing countries. Environ Health Insights 2011; 5: 63–70.
371 Dincer I. Renewable energy and sustainable development: a crucial review. Renew Sustain Energy Rev 2000; 4: 157–75.
372 Krewski D, Rainham D. Ambient air pollution and population health: overview. J Toxicol Environ Health A 2007; 70: 275–83.
373 Aziz A, Bajwa IU. Erroneous mass transit system and its tended relationship with motor vehicular air pollution (An integrated approach for reduction of urban air pollution in Lahore). Environ Monit Assess 2008; 137: 25–33.
374 Welton M, Rodriguez-Lainz A, Loza O, Brodine S, Fraga M. Use of lead-glazed ceramic ware and lead-based folk remedies in a rural community of Baja California, Mexico. Glob Health Promot 2016; published online June 14. DOI:10.1177/1757975916639861.
375 Romieu I, Palazuelos E, Hernandez Avila M, et al. Sources of lead exposure in Mexico City. Environ Health Perspect 1994; 102: 384–89.
376 TéllezRojoMM,BellingerDC,ArroyoQuirozC,etal.Longitudinalassociations between blood lead concentrations lower than 10 microg/dL and neurobehavioral development in environmentally exposed children in Mexico City. Pediatrics 2006; 118: e323–30.
377 International Energy Agency. World Energy Outlook special report 2016: energy and air pollution. 2016. https://www.iea.org/publications/freepublications/publication/weo-2016-special-report-energy-and-air-pollution.html (accessed Oct 20, 2016).
378 Schug TT, Abagyan R, Blumberg B, et al. Designing endocrine disruption out of the next generation of chemicals. Green Chem 2013; 15: 181–98.
379 US Environmental Protection Agency. Overview of the Clean Air Act and air pollution. 2016. https://www.epa.gov/clean-air-act-overview (accessed June 7, 2016).
380 IndiaSpend. 15 Days After Odd-Even, Delhi’s PM 2.5 Levels Rise 15%. Jan 16, 2016. http://www.indiaspend.com/cover-story/ 15-days-after-odd-even-delhis-pm-2-5-levels-rise-15-67571 (accessed Sept 13, 2017).
381 Sharma M, Dikshit O. Comprehensive study on air pollution and green house gases (GHGs) in Delhi. Final report: air pollution component. January 2016. http://delhi.gov.in/DoIT/Environment/PDFs/Final_Report.pdf (accessed April 1, 2017).

The Lancet Commissions
www.thelancet.com Published online October 19, 2017 http://dx.doi.org/10.1016/S0140-6736(17)32345-0 51
382 Hutton G, Chase C. Water supply, sanitation and hygiene. In: Mock C, Kobusingye O, Nugent R, Smith K, eds. Disease control priorities volume 7: injury prevention and environmental health, 3rd edn. Washington, DC: World Bank, 2017.
383 Ashraf N, Berry J, Shapiro JM. Can higher prices stimulate product use? Evidence from a field experiment in Zambia. Am Econ Rev 2010; 100: 2383–413.
384 Dupas P, Hoffmann V, Kremer M, Zwane AP. Targeting health subsidies through a nonprice mechanism: a randomized controlled trial in Kenya. Science 2016; 353: 889–95.
385 Dupas P, Miguel E. Impacts and determinants of health levels in low-income countries. Handbook of Field Experiments 2016; 2: 3–654.
386 Guiteras R, Levinsohn J, Mobarak AM. Sanitation subsidies. Encouraging sanitation investment in the developing world: a cluster-randomized trial. Science 2015; 348: 903–06.
387 IDinsight. Microfinance loans to increase sanitary latrine sales: evidence from a randomized trial in rural Cambodia. June 2013. http://idinsight.org/insights/wtp/IDinsight policy brief - microfinance loans for latrines in Cambodia.pdf (accessed Jan 26, 2017).
388 Pimentel D. Amounts of pesticides reaching target pests: environmental impacts and ethics. J Agric Environ Ethics 1995; 8: 17–29.
389 WHO. The world health report 2003 - shaping the future. 2003. http://www.who.int/whr/2003/en/whr03_en.pdf (accessed Sept 13, 2017).
390 The economics of ecosystems & biodiversity. Agriculture and food. www.teebweb.org/agriculture-and-food (accessed July 14, 2016).
391 International Institute for Sustainable Development. Water quality monitoring system design. September 2015. http://www.iisd.org/library/water-quality-monitoring-system-design (accessed Sept 13, 2017).
392 Marć M, Tobiszewski M, Zabiegała B, Guardia M de la, Namieśnik J. Current air quality analytics and monitoring: a review. Anal Chim Acta 2015; 853: 116–26.
393 Ikram J, Tahir A, Kazmi H, Khan Z, Javed R, Masood U. View: implementing low cost air quality monitoring solution for urban areas. Environ Syst Res 2012; 1: 10.
394 Hidy GM, Brook JR, Demerjian KL, Molina LT, Pennell WT, Scheffe RD. Technical challenges of multipollutant air quality management. Dordrecht: Springer Netherlands, 2011.
395 Choi BC. The past, present, and future of public health surveillance. Scientifica (Cairo) 2012; 875253.
396 Caravanos J, Ericson B, Ponce-Canchihuamán J, et al. Rapid assessment of environmental health risks posed by mining operations in low- and middle-income countries: selected case studies. Environ Sci Pollut Res Int 2013; 20: 7711–18.
397 Beaglehole R, Bonita R. Global public health: a new era, 2nd edn. London: Oxford University Press, 2009.
398 Leitao J, Chandramohan D, Byass P, et al. Revising the WHO verbal autopsy instrument to facilitate routine cause-of-death monitoring. Glob Health Action 2013; 6: 21518.
399 Health Effects Institute. Assessing the health impact of air quality regulations: concepts and methods for accountability research. September 2003. https://www.healtheffects.org/publication/assessing-health-impact-air-quality-regulations-concepts-and-methods-accountability (accessed June 5, 2017).
400 National Research Council. Estimating the public health benefits of proposed air pollution regulations. Washington, DC: National Academies Press, 2002.
401 Samet JM, Zeger SL, Dominici F, et al. The National Morbidity, Mortality, and Air Pollution Study. Part II: Morbidity and mortality from air pollution in the United States. Res Rep Health Eff Inst 2000; 94: 5–70.
402 Braun JM, Yolton K, Dietrich KN, et al. Prenatal bisphenol A exposure and early childhood behavior. Environ Health Perspect 2009; 117: 1945–52.
403 European Commission on the Environment. REACH. Aug 24, 2016. http://ec.europa.eu/environment/chemicals/reach/reach_intro.htm (accessed Jan 31, 2017).
404 Schmidt CW. TSCA 2.0: A new era in chemical risk management. Environ Health Perspect 2016; 124: A182–86.
405 The Lancet. Law: an underused tool to improve health and wellbeing for all. Lancet 2017; 389: 331.
406 Gilliland F, Avol E, McConnell R, et al. The effects of policy-driven air quality improvements on children’s respiratory health. Boston, MA: Health Effects Institute, 2017.
407 Kotzé LJ, Paterson A. The role of judiciary in environmental governance: comparative perspectives. Amsterdam: Wolters Kluwer, 2009.
408 Gao J, Xu G, Ma W, et al. Perceptions of health co-benefits in relation to greenhouse gas emission reductions: a survey among urban residents in three Chinese cities. Int J Environ Res Public Health 2017; 14: E298.
409 World Health Organization Regional Office for Europe. 2017 Healthy Cities Pécs Declaration. WHO European Healthy Cities Network Annual Business and Technical Conference; Pécs, Hungary; March 1–3, 2017. http://www.euro.who.int/__data/assets/pdf_file/0005/334643/Pecs-Declaration.pdf (accessed May 2, 2017).
410 Organisation for Economic Cooperation and Development (OECD). OECD environmental outlook to 2050: the consequences of inaction. Paris: OECD Publishing, 2012.
411 Giles-Corti B, Vernez-Moudon A, Reis R, et al. City planning and population health: a global challenge. Lancet 2016; 388: 2912–24.
412 United Nations Department of Economic and Social Affairs, Population. World urbanization prospects: the 2014 revision: highlights. 2014. https://esa.un.org/unpd/wup/publications/files/wup2014-highlights.pdf (accessed Sept 13, 2017).
413 Sundseth K, Pacyna JM, Pacyna EG, Munthe J, Belhaj M, Astrom S. Economic benefits from decreased mercury emissions: projections for 2020. J Clean Prod 2010; 18: 386–94.
414 Hall J V, Brajer V, Lurmann FW. Air pollution, health and economic benefits—lessons from 20 years of analysis. Ecol Econ 2010; 69: 2590–97.
415 Spangenberg JH. The environmental Kuznets curve: a methodological artefact? Popul Environ 2001; 23: 175–91.
416 Reinalda B. The Ashgate research companion to non-state actors. Abingdon-on-Thames, UK: Routledge, 2016.
417 Court J, Mendizabal E, Osborne D, Young J, for Overseas Development Institute. Policy engagement: how civil society can be more effective. 2006. https://www.odi.org/sites/odi.org.uk/files/odi-assets/publications-opinion-files/200.pdf (accessed Sept 13, 2017).
418 Duflo E, Greenstone M, Pande R, Ryan N. Truth-telling by third-party auditors and the response of polluting firms: experimental evidence from India. Q J Econ 2013; 128: 1499–545.