Embed Size (px)
Citation preview
The Laffer Curve The Laffer Curve & Supply-side economics& Supply-side economics

• When engaged in a lesson on the Laffer curve, the learner will evaluate the pros and cons of supply-side economics. The Laffer Curve will be presented in an active board lesson and student participation, with 100 percent mastery.

Compare supply-side views with a story of Robin Hood, who stole from the rich to give to the poor. The people traveling through Sherwood Forest are the U.S. taxpayers, whereas Robin Hood and his band of merry men represent the U.S. government.
As taxpayers passed through the forest, Robin Hood and his men intercepted them and forced them to hand over their money. “Do you think that travelers continued to go through Sherwood Forest?”
Of course not, they would simply find a way around the forest in order to keep their money.
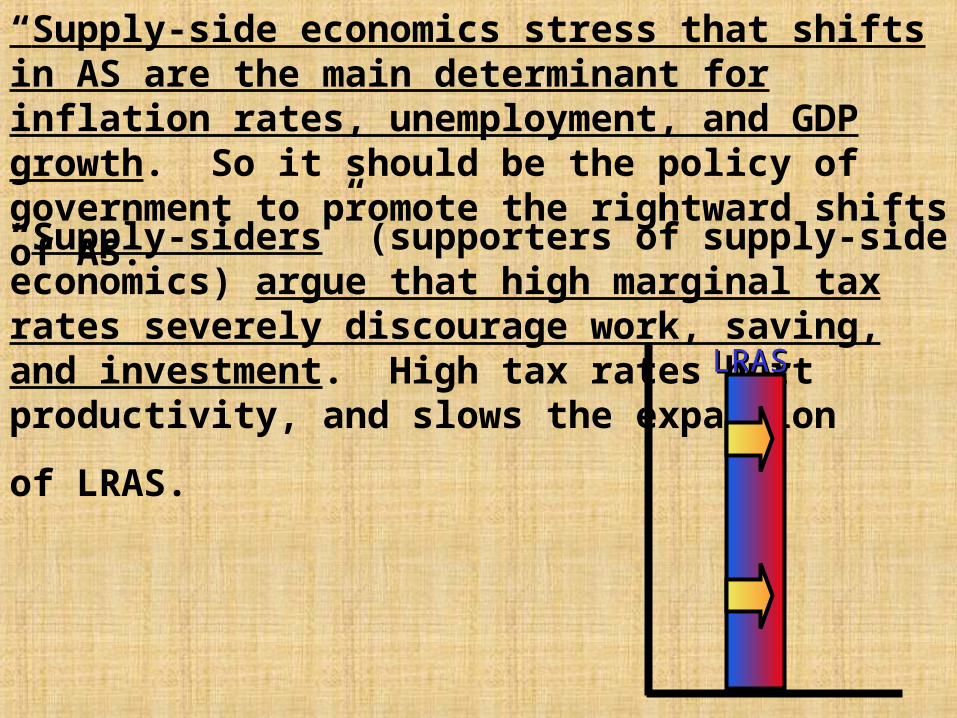
“Supply-side economics stress that shifts in AS are the main determinant for inflation rates, unemployment, and GDP growth. So it should be the policy of government to promote the rightward shifts of AS.
“Supply-siders” (supporters of supply-side economics) argue that high marginal tax rates severely discourage work, saving, and investment. High tax rates hurt productivity, and slows the expansion
of LRAS.
LRASLRAS
ReaganomicsReaganomics
“I was on the Laffer curve.”
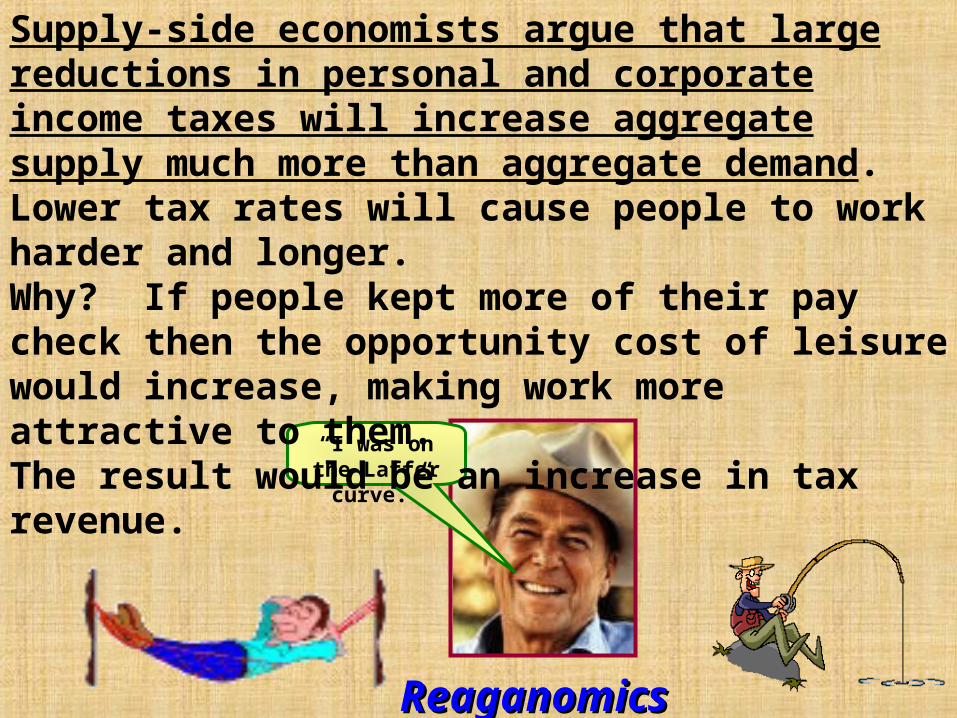
Supply-side economists argue that large reductions in personal and corporate income taxes will increase aggregate supply much more than aggregate demand. Lower tax rates will cause people to work harder and longer. Why? If people kept more of their pay check then the opportunity cost of leisure would increase, making work more attractive to them.The result would be an increase in tax revenue.
0
100
l
Tax revenue (dollars)
Tax
rat
e (p
erce
nt)
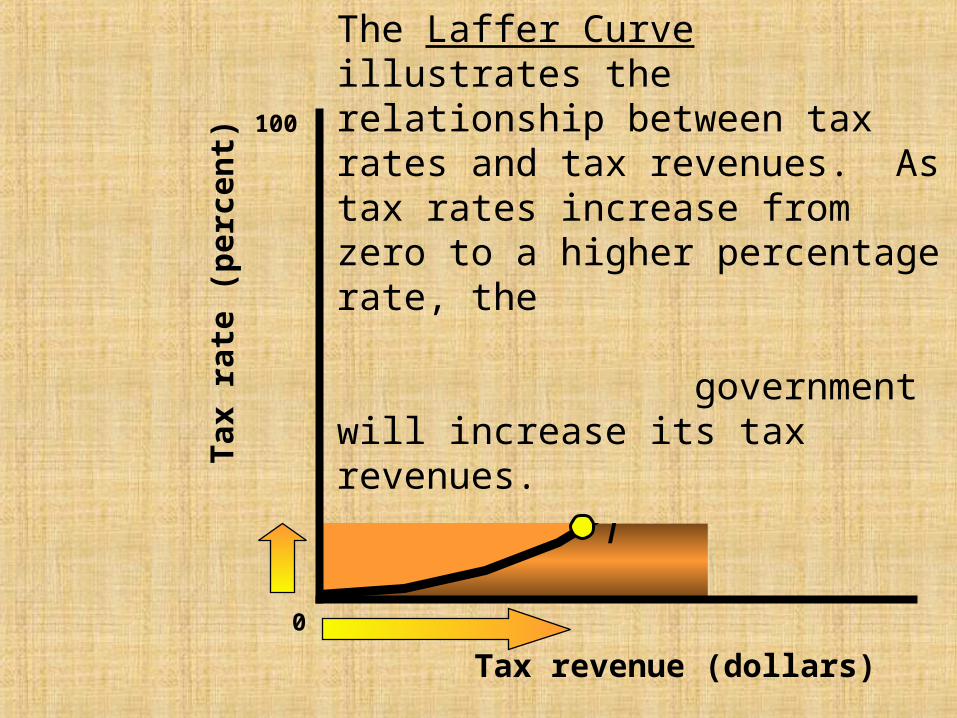
The Laffer Curve illustrates the relationship between tax rates and tax revenues. As tax rates increase from zero to a higher percentage rate, the government will increase its tax revenues.
0
100
m
l
Tax revenue (dollars)
Tax
rat
e (p
erce
nt)
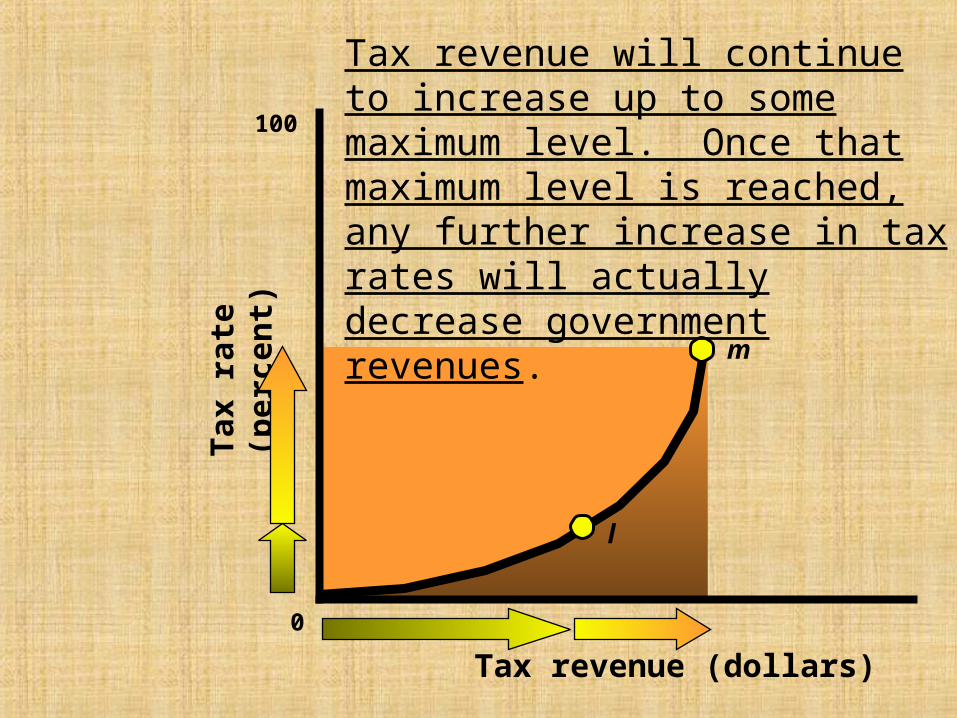
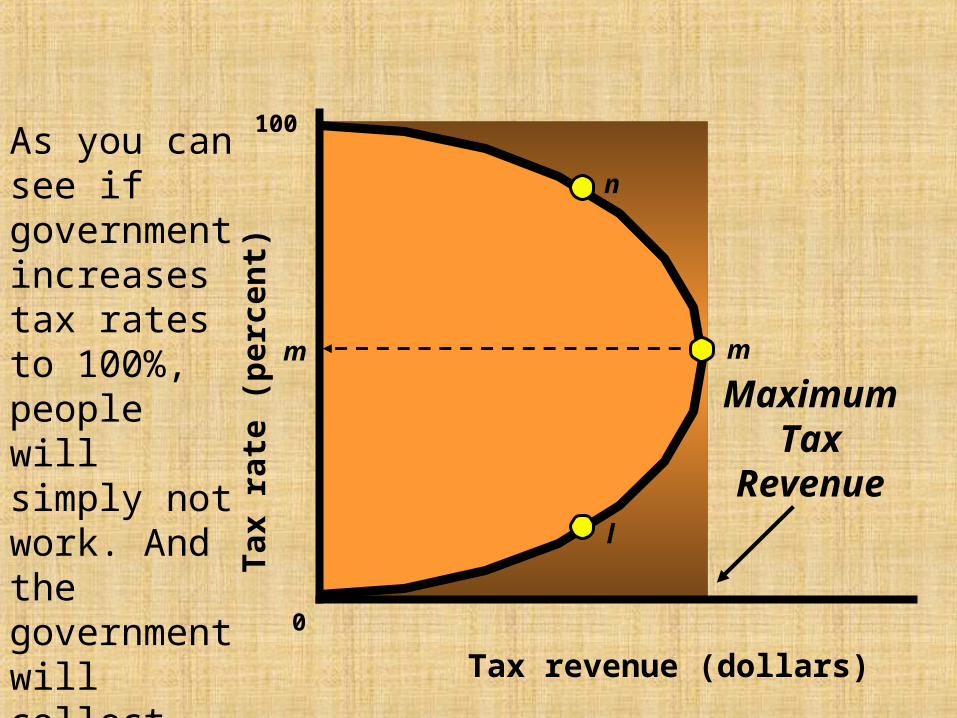
Tax revenue will continue to increase up to some maximum level. Once that maximum level is reached, any further increase in tax rates will actually decrease government revenues.
0
100
m
n
l
Tax revenue (dollars)
Tax
rat
e (p
erce
nt)
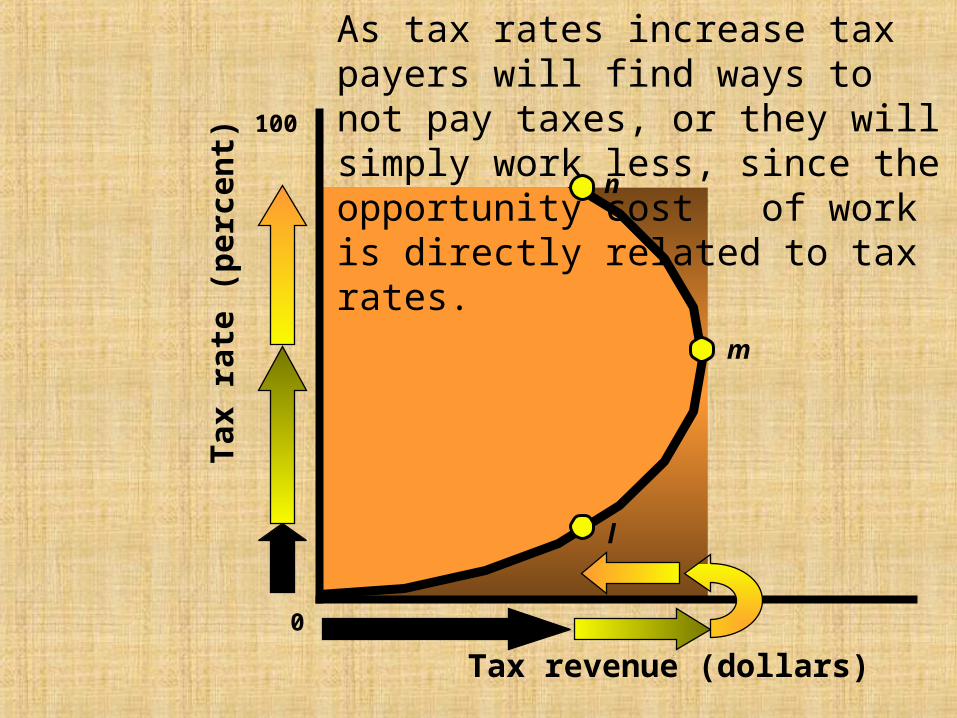
As tax rates increase tax payers will find ways to not pay taxes, or they will simply work less, since the opportunity cost of work is directly related to tax rates.
0
100
m m
n
l
Tax revenue (dollars)
Tax
rat
e (p
erce
nt)
MaximumTax
Revenue
As you can see if government increases tax rates to 100%, people will simply not work. And the government will collect zero in tax revenue.
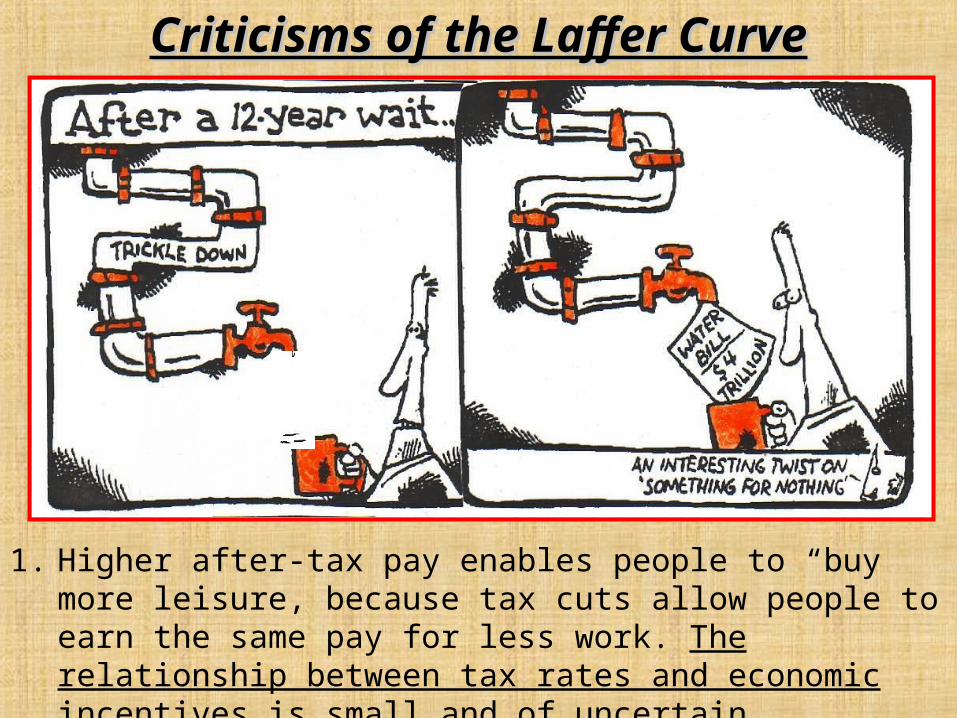
Criticisms of the Laffer CurveCriticisms of the Laffer Curve
1. Higher after-tax pay enables people to “buy more leisure, because tax cuts allow people to earn the same pay for less work. The relationship between tax rates and economic incentives is small and of uncertain direction.
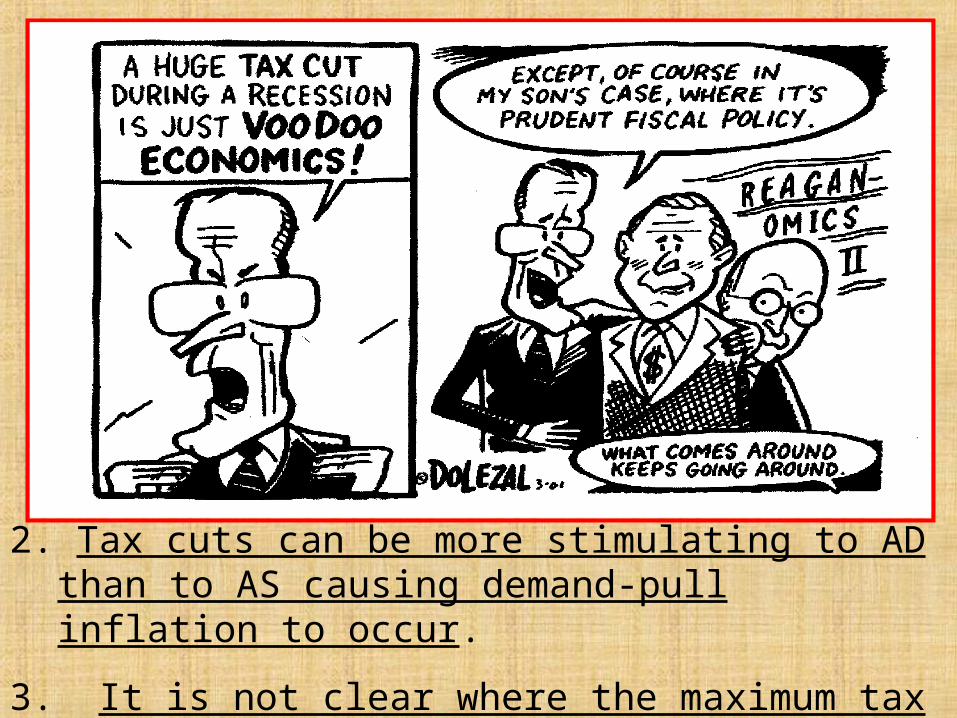
2. Tax cuts can be more stimulating to AD than to AS causing demand-pull inflation to occur.
3. It is not clear where the maximum tax rate level is located between zero and 100.

Mr. Stones Rocks!
Don’t be “economicgirlie men.”
A Word From Arnold


![Copy of Main point of Laffer curve paper.docx.docx Web view[Forthcoming in Qualitative Sociology, March 2013] The Politicization of Knowledge Claims: The “Laffer Curve” in the](https://img.dokumen.tips/doc/110x75/5a716b537f8b9aa2538cdd6f/copy-of-main-point-of-laffer-curve-paperdocxdocx-doc-fileweb.jpg)