Embed Size (px)
Citation preview

http://journals.cambridge.org Downloaded: 27 Mar 2009 IP address: 193.60.94.67
Public Health Nutrition: page 1 of 29 doi:10.1017/S1368980009005035
The Italian National Food Consumption Survey INRAN-SCAI2005–06: main results in terms of food consumption
Catherine Leclercq*, Davide Arcella, Raffaela Piccinelli, Stefania Sette, Cinzia Le Donneand Aida Turrini on behalf of the INRAN-SCAI 2005–06 Study Group-INRAN, National Research Institute for Food and Nutrition, Via Ardeatina 546, I-00178 Rome, Italy
Submitted 25 January 2008: Accepted 18 December 2008
Abstract
Objective: The current paper aims to present the main results of the ItalianNational Food Consumption Survey INRAN-SCAI 2005–06.Design: A cross-sectional study was performed. Households were randomlyselected after geographical stratification of the national territory. Food con-sumption was assessed on three consecutive days through individual estimateddietary records.Setting: Italy.Subjects: The final study sample comprised 3323 subjects (1501 males and 1822females) aged 0?1 to 97?7 years belonging to 1329 households: fifty-two infants(0–2?9 years), 193 children (3–9?9 years), 247 teenagers (10–17?9 years), 2313adults (18–64?9 years) and 518 elderly (65 years and above).Results: Participation rate was 33 %. The mean ratio of estimated energy intake toestimated BMR was 1?41 in adults. Indicators of mean and high individual con-sumption are presented for fifteen large categories and fifty-one subcategories offoods and beverages, in the total population and in consumers, by age and sexcategories. The overall consumption of fruit and vegetables was 418 g/d. Theconsumption of red meat was approximately 700 g/week, expressed as rawweight. Some specific aspects of the Italian food consumption pattern wereconfirmed: a large contribution from bread, pasta and pizza to cereals, from oliveoil to fats and from wine to alcoholic beverages.Conclusions: The database obtained from the survey will be the key reference forItalian food consumption during the coming years and will be utilized for avariety of purposes including the assessment of nutrient intakes and risk analysis.
KeywordsFood consumption
ItalyDietary records
Food consumption patterns are changing rapidly in the
Italian population. Important factors of change are the
evolution of lifestyle, the availability of a large variety of
new intensively advertised food products and the pro-
gressive ageing of the population. A steady increase of
meals consumed away from home and of convenience
foods has been observed(1). The traditional Mediterra-
nean diet, rich in plant foods, is being modified(2).
The availability of data collected at individual level in
various sections of the population is crucial to characterize
food consumption patterns. These data are needed to
perform a number of research and surveillance activities
in the area of consumer science, nutrition and food
safety. Nationwide Italian food consumption surveys had
been performed in 1980–84(3) and 1994–96(4). The Italian
Ministry of Agriculture funded the third national food
consumption survey, named INRAN-SCAI 2005–06, to
update current dietary information.
The current paper aims to present the main results of
the Italian National Food Consumption Survey INRAN-
SCAI 2005–06.
Methods
A cross-sectional survey was conducted on a random
sample of the Italian population.
Sample
A target sample of 1300 households was considered with
the aim of characterizing average food consumption in
the four main geographical areas of Italy (North-West,
North-East, Centre and South and Islands). The Census
SPublic
Hea
lth
Nutr
itio
n
y INRAN-SCAI 2005–06 Study Group: Davide Arcella, Noemi Bevilacqua,Marisa Capriotti, Giovina Catasta, Laura D’Addezio, Guglielmo Di Lena,Marika Ferrari, Catherine Leclercq, Cinzia Le Donne, Simona Martines,Lorenza Mistura, Antonella Pettinelli, Raffaela Piccinelli, Romana Roc-caldo, Stefania Sette, Fulvia Spadoni, Elisabetta Toti and Aida Turrini.
*Corresponding author: Email [email protected] r The Authors 2009

http://journals.cambridge.org Downloaded: 27 Mar 2009 IP address: 193.60.94.67
performed in 2001 by the Italian National Institute of
Statistics (ISTAT)(5) was used for the multistage stratifica-
tion of the sample into: (i) four geographical area strata;
(ii) three provinces population size strata (low, medium
and large); (iii) two municipalities population size strata
(large–medium and small); and (iv) four household
composition strata (one member less than 65 years of age,
one member aged 65 years and above, two or three
members, four or more members). A total of forty
municipalities belonging to twenty-three provinces were
involved in the survey (Fig. 1).
In each municipality, households were randomly selec-
ted from the telephone guide TELECOM (2005 edition) and
were phoned up several times during the daytime and in
the evening until contact was established. Each contacted
household was invited to participate until the munici-
pality’s target number of households was reached for
the category in terms of household composition. Each
individual who had his/her main meals in the household
on a regular basis during the period of the survey
was considered as a member of the household, even if
he/she was not a relative of other members. Criteria for
inclusion of the household were that all members would
participate in the case of households with up to three
members and that no more than one member would
refuse to participate in the case of households with more
members. Information on the motivation for refusal was
collected. The sampled households were distributed in
SPublic
Hea
lth
Nutr
itio
n
Cadoneghe
Padova
MonseliceLozzo
Campagnola E.Cavriago
Bologna
QuattrocastellaCENTRE
Città di castello
UmbertideCarsoli
Pratola PelignaIsernia
SannicandroBari
Avetrana
Manduria
AlcamoCastellamare del Golfo
SOUTH & ISLANDS
NORTH-EASTNORTH-WEST
BellunoBrescia
Morbegno
Cinisello Balsamo Erba
Novate Milanese
Casalmaggiore
Valenza Po
Vado Ligure Ne Chiavari
Genova
Massa
S. Marcello
Pistoia
S. Marinella
Roma
S. Maria Capua VetereMacerata Campania
Napoli
Torre del Greco
Fig. 1 Location of the forty municipalities and the twenty-three provinces randomly selected to represent the four maingeographical areas of Italy: Italian National Food Consumption Survey INRAN-SCAI 2005–06
2 C Leclercq et al.

http://journals.cambridge.org Downloaded: 27 Mar 2009 IP address: 193.60.94.67
the four seasons (excluding Christmas and Easter peri-
ods). The survey calendar was organized to capture an
adequate proportion of weekdays and weekend days at
group level.
Food survey
The food survey was conducted from October 2005 to
December 2006 by a team of thirty trained field workers.
Food consumption was self-recorded by subjects for three
consecutive days on hard-copy diaries structured by meal.
All foods, beverages, food supplements and medicines
ingested were to be registered. The survey protocol is
described in detail in publications related to previous food
surveys performed by the National Research Institute for
Food and Nutrition (INRAN) with the same methodol-
ogy(6,7). For children below 8 years of age and for any
subject who was not able to do so, the diaries were filled in
by the person who took care of him/her. Each field worker
individually met each participant three times during the
survey period. For every eating occasion, subjects were
asked to carefully record: time, place of consumption,
detailed description of foods (or beverages), quantity
consumed and brand (for manufactured foods). Portion
sizes were reported by subjects with the help of a picture
booklet. The booklet was based on a selection of photo
series from the original EPIC-SOFT picture book(8), with
foods and dishes of different standard portion sizes (small,
average or large) relevant for the Italian diet. The booklet
included photos of household measures (glasses, spoons,
cans, etc.) and instructions to quantify the portions used
by children.
For each of the three days, subjects were asked if they
were following a particular diet and if the consumption
they had reported differed from their usual consumption.
Field workers subsequently registered their judgement on
the reliability of the information recorded in each single day.
Height and body weight were self-reported.
Ancillary databases
Four databases were used to transform the data reported by
subjects into the weight of single raw ingredients and into
the amounts of nutrients consumed: (i) the ‘Food descrip-
tors database’: (ii) the ‘Household unit of measurements
database’; (iii) the ‘Standard recipes database’; and (iv) the
‘Food composition database’. In the ‘Household unit of
measurement database’, the portions estimated by subjects
with the help of the picture booklet are linked to the
specific weight of each food item. This database contains a
total of 9450 entries (weight of standard portions of specific
dishes or units of measurement) for 2460 foods, i.e. on
average approximately four entries per food.
Data coding, data entry and data processing
The data management system INRAN-DIARIO3.1 devel-
oped by INRAN(9) and used in previous surveys(6,7) was
used for data coding, data entry and data processing. The
food description reported on the diary was entered as
such by the field worker in an open format text field. The
quantity consumed was entered together with the unit
of measurement (e.g. grams, glasses, spoons) and a food
descriptor was selected from the relevant database.
The data entry procedure included a consistency check
between units of measurements and food descriptors.
A central procedure (MASTER) applied quality control
routines.
The predicted energy expenditure (EE) was calculated
for each subject based on the reported body weight and
the equations reported by the Scientific Committee for
Food(10). For infants and children below 10 years of age,
equations are available to assess directly predicted EE.
For subjects above 10 years of age, the estimated BMR
(BMRest) is first calculated and then multiplied by the
estimated physical activity level (PAL). In adults and the
elderly, the values considered were those of sedentary
subjects with ‘desirable physical activities’.
Thus, the hard copies of the diaries were checked to
identify possible data entry errors when no eating occa-
sion had been entered for one of the meals or when the
total energy from food and beverages reported in a diary
was more than 120 % or less than 70 % of the predicted EE
of the subject.
Once the digit errors and codification errors were
corrected, the average food consumption and the average
energy intake (EI) during the survey period were calcu-
lated for each individual.
During the data processing, mixed dishes were dis-
aggregated into their ingredients. Exceptions were some
industrial processed products which contain a major
ingredient from one category. Thus, fish fingers are
reported in the category ‘Fish, seafood and their products’
even though they contain breading.
The classification of food items at ingredient level into
fifteen large food categories and fifty-one subcategories
was based largely on the classification developed by the
European Food Safety Authority(11). Any subject who
consumed at least one item within the food category on at
least one eating occasion during the survey was classified
as a consumer of the category.
The water used in the reconstitution of dehydrated
products was included in the subcategories ‘Tap water’ or
‘Bottled water’ together with water consumed as such.
The Appendix provides a list of the major food items
classified in each subcategory together with a list of the
most frequent minor ingredients of composite foods
belonging to other categories.
Subjects were classified according to age category:
infants (0–2?9 years), children (3–9?9 years), teenagers
(10–17?9 years), adults (18–64?9 years) and elderly (65
years and above).
Statistical analyses were carried out using the SAS for
Windows statistical software package release 8?01 (SAS
Institute Inc., Cary, NC, USA).
SPublic
Hea
lth
Nutr
itio
nItalian National Food Consumption Survey 3

http://journals.cambridge.org Downloaded: 27 Mar 2009 IP address: 193.60.94.67
Results
Among all households that had been randomly extracted,
14 % could not be contacted (they had moved or were
absent) whereas 2 % were contacted but not invited to
participate because the target number of households for
their category had been reached in the municipality.
Among households invited to participate, the participa-
tion rate was 33 %. The most frequently reported moti-
vation for refusal was lack of time (49 %).
A total of 3328 individuals belonging to 1329 house-
holds participated in the food survey. Among these, five
subjects were excluded because their food diaries were
considered unreliable by the field worker due to a low
level of collaboration and repeated omissions in the
recording of eating occasions. The final study sample
therefore comprised 3323 subjects. Males were aged 0?1
to 92?9 years and females were aged 0?1 to 97?7 years.
Physical characteristics of the study sample by age and
sex are described in Table 1.
Overall, the analysed records represent 9969 days.
Weekdays (Monday to Friday) represented 78% of all
survey days, i.e. slightly more than 5/7. Survey days were
proportionally distributed among seasons: 25% in autumn,
25% in winter, 26% in spring and 24% in summer.
Overall 199 subjects (141 females and fifty-eight males)
declared to be on a specific diet during the survey, most
often a slimming diet (fifty-nine females and seventeen
males). Other diets were related to health conditions or
other reasons (e.g. vegetarian diet). Moreover, 208 sub-
jects declared that their food consumption on at least one
of the survey days had differed from usual, leading to
either increased (e.g. feast) or reduced (e.g. subjects
feeling unwell) food consumption.
Mean EI in the study sample (3323 subjects) is reported
in Table 2 by age and sex. In the same table, EI and the
ratio of EI to predicted EE are reported in a selected
sample of 2890 subjects, after exclusion of females who
were either pregnant (n 19) or lactating (n 10) and of all
subjects who had reported a food consumption pattern
different from usual or who were on any kind of diet.
The mean EI:BMRest ratio in adults of the selected
sample was 1?41 (1?36 in males and 1?46 in females; data
not in table).
Results in terms of food consumption are presented in
Table 3 for the total sample and in Tables 4–11 by age and
sex categories.
The percentage contribution in weight to the total
amount of foods and beverages was calculated for each
large food category by age and sex and the significance of
differences was tested (P , 0?05; Kruskal–Wallis test).
Data are illustrated in Fig. 2. For most food categories, the
percentage contribution varied significantly among age
classes. Statistically significant differences between males
and females were observed only in adults and the elderly
and only for some food categories. For example, the
contribution in weight of ‘Alcoholic beverages and sub-
stitutes’ was higher in males than in females (7?4 % v.
2?9 % in adults and 8?2 % v. 3?0 % in the elderly).
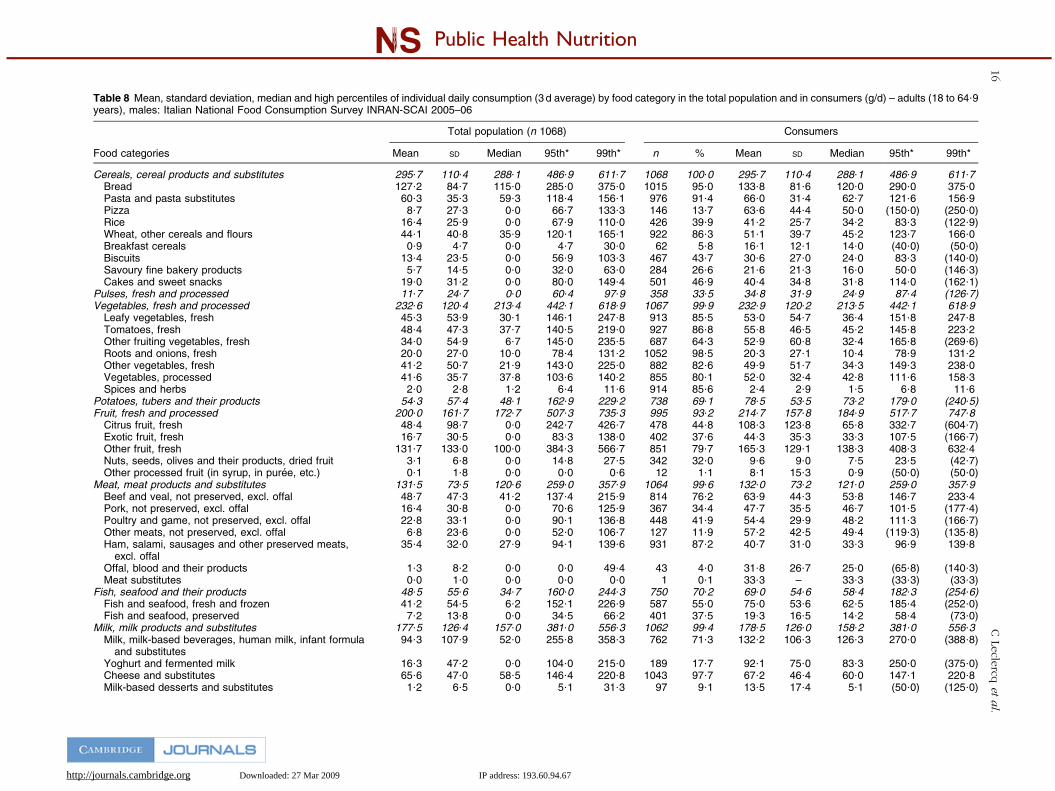
Among ‘Cereals, cereal products and substitutes’, the
highest consumption was from ‘Bread’ followed by ‘Pasta
and pasta substitutes’. The consumption reported for
‘Pizza’ referred only to plain white pizza and plain tomato
pizza. The total pizza consumption (including all types of
SPublic
Hea
lth
Nutr
itio
n
Table 1 Physical characteristics of the study sample by age and sex: Italian National Food Consumption SurveyINRAN-SCAI 2005–06
Weight* (kg) Height* (cm) BMI (kg/m2)
Age (years) n Mean SD Mean SD Mean SD
Males 0–2?9 29 11?5 3?6 81?7 15?3 17?1 3?33–9?9 94 26?2 8?3 122?3 13?8 17?2 3?510–17?9 108 57?1 13?5 165?4 13?3 20?6 3?318–64?9 1068 78?4 10?9 175?8 7?2 25?4 3?4$65 202 78?1 12?8 171?5 6?6 26?5 3?9Total 1501
Females 0–2?9 23 11?0 2?9 80?6 14?8 17?6 7?13–9?9 99 26?1 8?4 119?1 18?4 18?6 6?510–17?9 139 49?1 10?5 157?3 10?0 19?7 2?918–64?9 1244 62?2 10?7 163?7 6?2 23?2 3?8$65 316 65?0 11?2 160?5 5?4 25?2 4?1Total 1821
Total 0–2?9 52 11?3 3?3 81?2 15?0 17?3 5?33–9?9 193 26?1 8?3 120?7 16?3 17?9 5?310–17?9 247 52?6 12?5 160?9 12?2 20?1 3?118–64?9 2312 69?7 13?5 169?2 9?0 24?2 3?8$65 518 70?1 13?5 164?8 8?0 25?7 4?1Total 3322
*Weight and height were self-reported. Data are missing for one female in the age class 18–64?9 years.
4 C Leclercq et al.

http://journals.cambridge.org Downloaded: 27 Mar 2009 IP address: 193.60.94.67
pizzas with their ingredients) was 55?7 g/d in the total
population (data not in table).
Among ‘Meat, meat products and substitutes’, the highest
proportion of consumers was found for the subcategory
‘Ham, salami, sausages and other preserved meats, excl.
offal’ (81 % of the total sample) but the highest daily
consumption was reported for the subcategory ‘Beef and
veal, not preserved, excl. offal’ (more than 40 g/d in the
total population). Only three subjects declared to follow
a vegetarian diet during the survey. Overall thirty-two
subjects did not consume ‘Meat, meat products and sub-
stitutes’ during the survey and four subjects consumed
only meat substitutes (e.g. seitan and soya hamburger)
among this category.
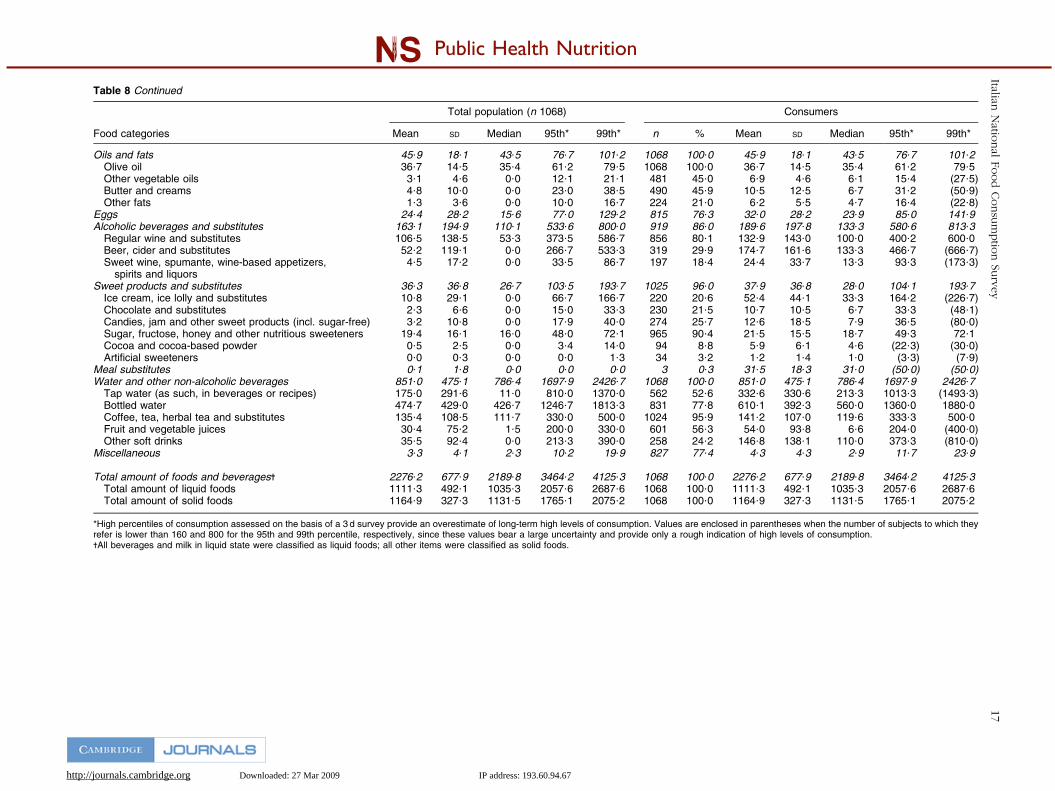
Among ‘Oils and fats’, olive oil represented 81 % of
total consumption (and 93 % of vegetable oils) in the
whole sample.
Among ‘Alcoholic beverages and substitutes’, ‘Regular
wine and substitutes’ represented 70 % of total con-
sumption in the whole sample, reaching 92 % and 94 %
respectively in elderly males and elderly females.
A high percentage of infants, children and teenagers
appeared to be consumers of ‘Alcoholic beverages and
substitutes’ due to the consumption of dishes which
are traditionally prepared with a few drops of alcoholic
beverage added during the cooking process. After exclu-
sion of this source, alcoholic beverages were found to
be consumed by no infant, by four children (24 g/d on
average in consumers) and by fifteen teenagers (44 g/d).
The overall percentage of consumers of alcoholic
beverages – consumed as such – in the study sample was
46?8 % and their mean daily consumption was 194?3 g/d
(data not in table).
Discussion
Sampling and participation rate
As expected from the sampling procedure, the distribu-
tion of households among geographical areas (257 in the
North-West, 376 in the North-East, 257 in the Centre and
439 in the South and Islands) and according to their
composition category (329 singles – including 54 % aged
65 years or more, 665 households with two or three
members and 665 households with four or more mem-
bers) was in line with the last population Census(5).
Institutionalized subjects, such as the elderly in rest
homes, were not covered.
Use of the TELECOM telephone guide as a sampling
basis and of telephone calls as the first contact with
households necessarily led to the exclusion of certain
typologies of households: (i) households without a fixed
telephone (11 % of Italian households according to
ISTAT(12)); (ii) households whose telephone number is
not reported in the TELECOM guide; and (iii) households
whose members are very frequently out of home and
who could not be contacted.
A high percentage of households refused to participate,
leading to a low participation rate (33 %). In the previous
Italian national food consumption survey(4) the partici-
pation rate of households was higher (47 %), but one-
third of the subjects were then discarded due to clear
SPublic
Hea
lth
Nutr
itio
n
Table 2 Estimated energy intake (EI) and ratio of EI to predicted energy expenditure (EE) by age and sex: Italian NationalFood Consumption Survey INRAN-SCAI 2005–06
Total study sample Selected sample*
EI (MJ) EI (MJ) EI:EE
Age (years) n Mean SD n Mean SD Mean SD
Males 0–2?9 29 4?69 1?70 28 4?65 1?72 1?04 0?383–9?9 94 8?17 2?15 86 8?16 2?12 0?98 0?2910–17?9 108 10?78 3?11 101 10?68 2?63 1?01 0?2718–64?9 1068 10?01 2?72 953 10?03 2?62 0?88 0?24$65 202 9?61 2?33 182 9?70 2?28 0?98 0?24Total 1501 1350
Females 0–2?9 23 4?63 1?85 21 4?45 1?64 1?03 0?373–9?9 99 7?85 1?93 94 7?77 1?91 1?03 0?3510–17?9 139 8?75 2?22 120 8?74 2?15 1?00 0?2618–64?9 1245 8?12 2?20 1027 8?23 2?11 0?94 0?25$65 316 7?68 2?03 278 7?80 1?99 0?95 0?24Total 1822 1540
Total 0–2?9 52 4?66 1?75 49 4?56 1?67 1?04 0?373–9?9 193 8?01 2?04 180 7?96 2?02 1?00 0?3210–17?9 247 9?64 2?83 221 9?63 2?56 1?01 0?2718–64?9 2313 8?99 2?63 1980 9?09 2?54 0?91 0?25$65 518 8?43 2?35 460 8?56 2?30 0?96 0?24Total 3323 2890
*The selected sample was obtained after exclusion of all female subjects who were either pregnant or lactating and of subjects who haddeclared to be on any kind of diet or who had reported that their food consumption pattern was different from usual during the survey days.
Italian National Food Consumption Survey 5

http://journals.cambridge.org Downloaded: 27 Mar 2009 IP address: 193.60.94.67
S Public Health Nutrition
Table 3 Mean, standard deviation, median and high percentiles of individual daily consumption (3 d average) by food category in the total population and in consumers (g/d) – all ages, malesand females: Italian National Food Consumption Survey INRAN-SCAI 2005–06
Total population (n 3323) Consumers
Food categories Mean SD Median 95th* 99th* n % Mean SD Median 95th* 99th*
Cereals, cereal products and substitutes 258?4 106?0 248?8 443?5 590?1 3315 99?8 259?0 105?3 249?3 443?5 590?1Bread 103?3 77?4 90?0 245?0 340?0 3061 92?1 112?1 74?2 100?0 250?0 340?2Pasta and pasta substitutes 54?2 33?1 53?0 108?7 140?1 3027 91?1 59?5 29?8 56?9 110?7 141?9Pizza 7?8 24?5 0?0 62?5 116?7 463 13?9 55?7 40?4 40?0 125?0 (250?0)Rice 15?8 24?6 0?0 62?8 104?2 1370 41?2 38?2 24?7 32?5 83?3 126?1Wheat, other cereals and flours 36?5 36?8 26?8 105?8 147?1 2796 84?1 43?4 36?2 35?7 111?1 155?0Breakfast cereals 1?5 5?5 0?0 10?0 30?0 334 10?1 14?8 10?4 10?0 31?3 (49?0)Biscuits 13?8 21?8 2?7 53?3 93?9 1680 50?6 27?3 23?9 21?3 71?4 114?7Savoury fine bakery products 8?1 16?1 0?0 36?7 66?7 1263 38?0 21?2 20?1 16?0 53?3 100?0Cakes and sweet snacks 17?5 28?7 0?0 73?3 129?5 1475 44?4 39?5 31?5 31?3 102?0 156?3
Pulses, fresh and processed 11?3 22?9 0?0 58?7 97?2 1149 34?6 32?6 28?7 24?4 80?7 126?7Vegetables, fresh and processed 211?2 112?5 194?5 409?2 561?9 3310 99?6 212?0 111?9 194?9 409?6 561?9
Leafy vegetables, fresh 43?1 52?6 27?0 143?0 243?3 2792 84?0 51?3 53?6 34?2 150?9 247?8Tomatoes, fresh 41?9 42?6 31?1 125?9 196?4 2779 83?6 50?1 41?9 39?8 133?0 204?8Other fruiting vegetables, fresh 30?9 50?5 6?1 134?2 210?0 2137 64?3 48?1 56?0 26?5 156?0 238?4Roots and onions, fresh 19?4 25?2 10?2 71?7 116?9 3249 97?8 19?8 25?3 10?6 72?7 117?0Other vegetables, fresh 37?3 47?0 18?2 131?4 208?3 2754 82?9 45?0 48?1 28?6 142?0 219?0Vegetables, processed 36?7 33?4 31?5 96?4 135?4 2592 78?0 47?1 30?7 39?4 101?4 145?5Spices and herbs 1?9 2?9 1?0 6?1 12?0 2761 83?1 2?3 3?0 1?4 6?5 14?5
Potatoes, tubers and their products 50?9 55?2 41?7 156?1 219?9 2300 69?2 73?6 52?3 65?4 168?3 231?5Fruit, fresh and processed 208?5 156?7 186?4 499?3 706?0 3115 93?7 222?4 152?0 198?4 506?0 712?1
Citrus fruit, fresh 45?9 88?3 0?0 208?7 395?3 1559 46?9 97?9 107?4 60?7 303?3 485?6Exotic fruit, fresh 17?0 28?9 0?0 66?7 130?8 1293 38?9 43?7 31?4 33?3 100?0 166?7Other fruit, fresh 142?5 135?4 114?5 396?7 586?7 2760 83?1 171?6 130?7 145?7 416?7 646?0Nuts, seeds, olives and their products, dried fruit 2?6 6?5 0?0 13?3 27?3 899 27?1 9?4 9?6 7?4 25?9 51?7Other processed fruit (in syrup, in puree, etc.) 0?5 6?0 0?0 0?0 1?3 55 1?7 28?9 36?7 13?3 (106?7) (150?0)
Meat, meat products and substitutes 110?1 62?9 101?8 221?4 306?0 3290 99?0 111?2 62?3 102?8 221?7 307?6Beef and veal, not preserved, excl. offal 42?7 41?4 35?2 118?0 184?8 2500 75?2 56?8 38?4 45?8 129?2 204?5Pork, not preserved, excl. offal 12?7 25?9 0?0 58?6 105?5 1042 31?4 40?6 31?9 41?3 93?8 153?3Poultry and game, not preserved, excl. offal 20?8 29?7 0?0 79?8 117?9 1409 42?4 49?0 26?5 41?7 100?3 143?6Other meats, not preserved, excl. offal 5?5 19?5 0?0 44?1 96?4 340 10?2 53?4 33?9 41?8 111?0 (134?3)Ham, salami, sausages and other preserved meats,
excl. offal27?3 27?4 20?0 80?2 122?1 2701 81?3 33?6 26?7 26?7 84?9 127?1
Offal, blood and their products 1?1 7?4 0?0 0?0 37?3 108 3?3 32?7 25?2 33?3 (70?6) (128?7)Meat substitutes 0?1 1?6 0?0 0?0 0?0 7 0?2 33?3 8?3 33?3 (50?0) (50?0)
Fish, seafood and their products 44?7 51?0 32?2 147?2 214?1 2260 68?0 65?8 49?4 57?2 165?1 230?8Fish and seafood, fresh and frozen 38?8 49?8 12?8 140?9 206?0 1816 54?6 71?0 47?4 57?5 166?4 223?9Fish and seafood, preserved 5?9 12?2 0?0 30?2 58?4 1088 32?7 18?1 15?3 13?5 50?0 73?0
Milk, milk products and substitutes 198?0 129?3 185?2 416?8 570?4 3298 99?2 199?5 128?7 187?1 419?9 574?7Milk, milk-based beverages, human milk, infant formula
and substitutes119?3 114?3 112?5 288?2 436?7 2613 78?6 151?8 108?1 150?0 308?3 467?3
Yoghurt and fermented milk 20?6 48?1 0?0 125?0 208?3 793 23?9 86?3 63?4 83?3 200?0 (346?7)Cheese and substitutes 57?0 42?3 50?8 133?3 190?8 3215 96?7 58?9 41?6 52?5 134?8 190?8Milk-based desserts and substitutes 1?1 7?2 0?0 5?1 31?3 212 6?4 16?5 23?5 6?7 57?3 (125?0)
6C
Lecle
rcqet
al.

http://journals.cambridge.org Downloaded: 27 Mar 2009 IP address: 193.60.94.67
S Public Health Nutrition
Table 3 Continued
Total population (n 3323) Consumers
Food categories Mean SD Median 95th* 99th* n % Mean SD Median 95th* 99th*
Oils and fats 40?4 16?7 38?7 68?5 91?0 3312 99?7 40?5 16?5 38?8 68?6 91?0Olive oil 32?7 13?8 31?5 56?8 71?3 3312 99?7 32?9 13?6 31?5 56?8 71?3Other vegetable oils 2?6 4?2 0?0 9?8 17?0 1388 41?8 6?2 4?5 6?1 12?9 24?0Butter and creams 4?1 8?0 0?0 18?4 34?7 1520 45?7 9?0 9?8 6?1 25?1 42?2Other fats 0?9 2?9 0?0 6?0 15?2 595 17?9 5?3 4?8 3?9 15?2 (21?3)
Eggs 20?9 24?5 12?9 67?0 103?4 2469 74?3 28?1 24?5 20?4 73?1 115?2Alcoholic beverages and substitutes 91?0 148?8 0?2 373?5 640?1 2477 74?5 122?1 160?9 66?7 428?0 666?8
Regular wine and substitutes 64?1 111?2 0?1 293?3 480?0 2315 69?7 92?0 123?2 40?0 320?1 533?3Beer, cider and substitutes 24?6 79?2 0?0 133?3 400?0 550 16?6 148?7 139?6 110?0 400?0 (600?0)Sweet wine, spumante, wine-based appetizers,
spirits and liquors2?3 11?4 0?0 13?3 53?3 437 13?2 17?4 27?0 6?7 66?8 (133?3)
Sweet products and substitutes 33?1 33?3 24?0 94?6 161?8 3096 93?2 35?5 33?3 26?5 97?7 166?9Ice cream, ice lolly and substitutes 10?0 26?2 0?0 66?7 133?3 674 20?3 49?1 38?3 33?3 133?3 (200?0)Chocolate and substitutes 2?6 7?1 0?0 15?7 34?7 753 22?7 11?4 10?9 7?5 33?3 (48?1)Candies, jam and other sweet products (incl. sugar-free) 3?2 8?8 0?0 20?0 37?3 885 26?6 11?8 13?7 8?4 33?3 52?5Sugar, fructose, honey and other nutritious sweeteners 16?6 15?0 14?2 43?5 62?7 2821 84?9 19?6 14?4 16?0 45?6 64?3Cocoa and cocoa-based powder 0?7 3?7 0?0 4?7 15?8 319 9?6 7?6 9?4 5?2 23?3 (36?1)Artificial sweeteners 0?0 0?3 0?0 0?0 1?7 142 4?3 1?1 1?2 1?0 (3?8) (4?7)
Meal substitutes 0?0 1?1 0?0 0?0 0?0 4 0?1 30?1 15?2 28?5 (50?0) (50?0)Water and other non-alcoholic beverages 836?1 428?8 772?1 1640?0 2183?3 3320 99?9 836?9 428?2 772?5 1640?2 2183?3
Tap water (as such, in beverages or recipes) 196?4 303?2 62?5 853?3 1373?3 1897 57?1 344?1 332?1 241?7 1022?6 1493?3Bottled water 452?2 409?9 413?3 1173?3 1760?0 2541 76?5 591?3 370?8 533?3 1280?0 1853?3Coffee, tea, herbal tea and substitutes 122?8 115?5 100?0 340?0 516?7 2913 87?7 140?1 113?1 115?0 352?8 532?1Fruit and vegetable juices 36?2 80?3 1?5 200?0 336?0 1867 56?2 64?4 98?2 8?4 250?0 416?7Other soft drinks 28?6 77?3 0?0 163?3 333?3 725 21?8 130?9 118?5 106?7 330?0 (586?7)
Miscellaneous 3?1 3?8 2?0 10?0 17?8 2590 77?9 4?0 3?9 2?7 10?8 20?0
Total amount of foods and beverages- 2118?0 629?0 2059?9 3263?3 3900?1 3323 100?0 2118?0 629?0 2059?9 3263?3 3900?1Total amount of liquid foods 1048?8 438?5 979?4 1886?5 2377?5 3323 100?0 1048?8 438?5 979?4 1886?5 2377?5Total amount of solid foods 1069?2 317?2 1050?6 1607?8 1962?2 3319 99?9 1070?5 315?2 1050?9 1608?4 1962?2
*High percentiles of consumption assessed on the basis of a 3 d survey provide an overestimate of long-term high levels of consumption. Values are enclosed in parentheses when the number of subjects to which theyrefer is lower than 160 and 800 for the 95th and 99th percentile, respectively, since these values bear a large uncertainty and provide only a rough indication of high levels of consumption.-All beverages and milk in liquid state were classified as liquid foods; all other items were classified as solid foods.
ItalianN
ational
Food
Consu
mptio
nSu
rvey
7
http://journals.cambridge.org Downloaded: 27 Mar 2009 IP address: 193.60.94.67
S Public Health Nutrition
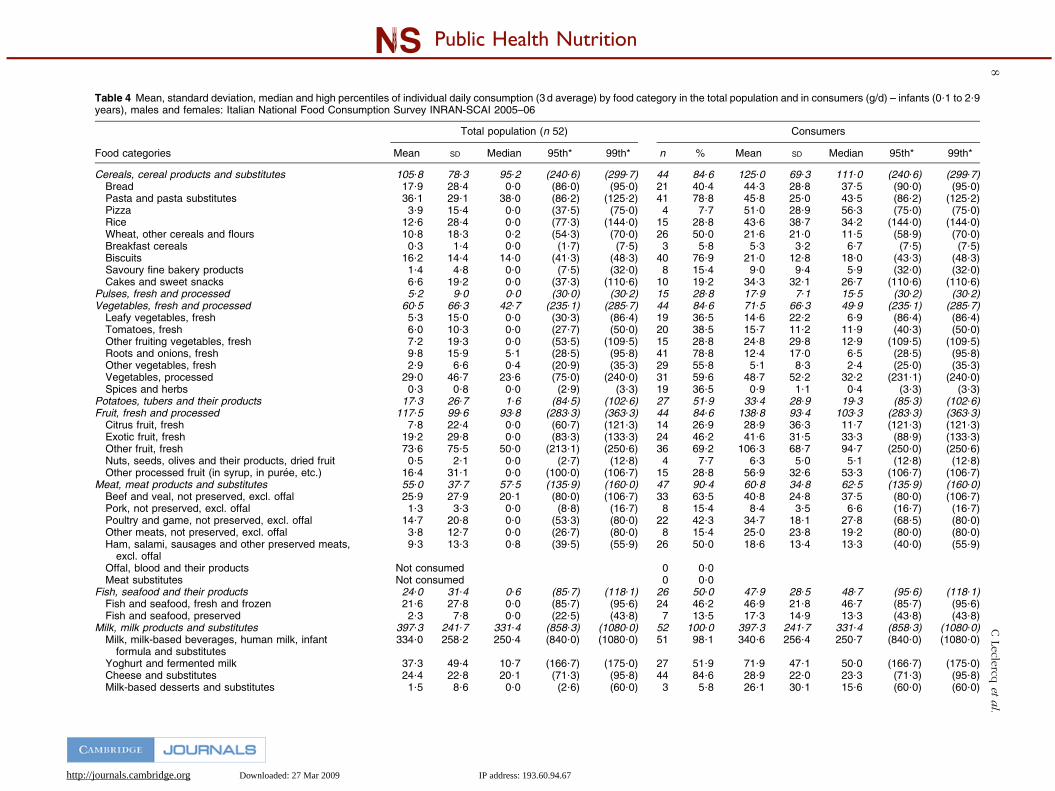
Table 4 Mean, standard deviation, median and high percentiles of individual daily consumption (3 d average) by food category in the total population and in consumers (g/d) – infants (0?1 to 2?9years), males and females: Italian National Food Consumption Survey INRAN-SCAI 2005–06
Total population (n 52) Consumers
Food categories Mean SD Median 95th* 99th* n % Mean SD Median 95th* 99th*
Cereals, cereal products and substitutes 105?8 78?3 95?2 (240?6) (299?7) 44 84?6 125?0 69?3 111?0 (240?6) (299?7)Bread 17?9 28?4 0?0 (86?0) (95?0) 21 40?4 44?3 28?8 37?5 (90?0) (95?0)Pasta and pasta substitutes 36?1 29?1 38?0 (86?2) (125?2) 41 78?8 45?8 25?0 43?5 (86?2) (125?2)Pizza 3?9 15?4 0?0 (37?5) (75?0) 4 7?7 51?0 28?9 56?3 (75?0) (75?0)Rice 12?6 28?4 0?0 (77?3) (144?0) 15 28?8 43?6 38?7 34?2 (144?0) (144?0)Wheat, other cereals and flours 10?8 18?3 0?2 (54?3) (70?0) 26 50?0 21?6 21?0 11?5 (58?9) (70?0)Breakfast cereals 0?3 1?4 0?0 (1?7) (7?5) 3 5?8 5?3 3?2 6?7 (7?5) (7?5)Biscuits 16?2 14?4 14?0 (41?3) (48?3) 40 76?9 21?0 12?8 18?0 (43?3) (48?3)Savoury fine bakery products 1?4 4?8 0?0 (7?5) (32?0) 8 15?4 9?0 9?4 5?9 (32?0) (32?0)Cakes and sweet snacks 6?6 19?2 0?0 (37?3) (110?6) 10 19?2 34?3 32?1 26?7 (110?6) (110?6)
Pulses, fresh and processed 5?2 9?0 0?0 (30?0) (30?2) 15 28?8 17?9 7?1 15?5 (30?2) (30?2)Vegetables, fresh and processed 60?5 66?3 42?7 (235?1) (285?7) 44 84?6 71?5 66?3 49?9 (235?1) (285?7)
Leafy vegetables, fresh 5?3 15?0 0?0 (30?3) (86?4) 19 36?5 14?6 22?2 6?9 (86?4) (86?4)Tomatoes, fresh 6?0 10?3 0?0 (27?7) (50?0) 20 38?5 15?7 11?2 11?9 (40?3) (50?0)Other fruiting vegetables, fresh 7?2 19?3 0?0 (53?5) (109?5) 15 28?8 24?8 29?8 12?9 (109?5) (109?5)Roots and onions, fresh 9?8 15?9 5?1 (28?5) (95?8) 41 78?8 12?4 17?0 6?5 (28?5) (95?8)Other vegetables, fresh 2?9 6?6 0?4 (20?9) (35?3) 29 55?8 5?1 8?3 2?4 (25?0) (35?3)Vegetables, processed 29?0 46?7 23?6 (75?0) (240?0) 31 59?6 48?7 52?2 32?2 (231?1) (240?0)Spices and herbs 0?3 0?8 0?0 (2?9) (3?3) 19 36?5 0?9 1?1 0?4 (3?3) (3?3)
Potatoes, tubers and their products 17?3 26?7 1?6 (84?5) (102?6) 27 51?9 33?4 28?9 19?3 (85?3) (102?6)Fruit, fresh and processed 117?5 99?6 93?8 (283?3) (363?3) 44 84?6 138?8 93?4 103?3 (283?3) (363?3)
Citrus fruit, fresh 7?8 22?4 0?0 (60?7) (121?3) 14 26?9 28?9 36?3 11?7 (121?3) (121?3)Exotic fruit, fresh 19?2 29?8 0?0 (83?3) (133?3) 24 46?2 41?6 31?5 33?3 (88?9) (133?3)Other fruit, fresh 73?6 75?5 50?0 (213?1) (250?6) 36 69?2 106?3 68?7 94?7 (250?0) (250?6)Nuts, seeds, olives and their products, dried fruit 0?5 2?1 0?0 (2?7) (12?8) 4 7?7 6?3 5?0 5?1 (12?8) (12?8)Other processed fruit (in syrup, in puree, etc.) 16?4 31?1 0?0 (100?0) (106?7) 15 28?8 56?9 32?6 53?3 (106?7) (106?7)
Meat, meat products and substitutes 55?0 37?7 57?5 (135?9) (160?0) 47 90?4 60?8 34?8 62?5 (135?9) (160?0)Beef and veal, not preserved, excl. offal 25?9 27?9 20?1 (80?0) (106?7) 33 63?5 40?8 24?8 37?5 (80?0) (106?7)Pork, not preserved, excl. offal 1?3 3?3 0?0 (8?8) (16?7) 8 15?4 8?4 3?5 6?6 (16?7) (16?7)Poultry and game, not preserved, excl. offal 14?7 20?8 0?0 (53?3) (80?0) 22 42?3 34?7 18?1 27?8 (68?5) (80?0)Other meats, not preserved, excl. offal 3?8 12?7 0?0 (26?7) (80?0) 8 15?4 25?0 23?8 19?2 (80?0) (80?0)Ham, salami, sausages and other preserved meats,
excl. offal9?3 13?3 0?8 (39?5) (55?9) 26 50?0 18?6 13?4 13?3 (40?0) (55?9)
Offal, blood and their products Not consumed 0 0?0Meat substitutes Not consumed 0 0?0
Fish, seafood and their products 24?0 31?4 0?6 (85?7) (118?1) 26 50?0 47?9 28?5 48?7 (95?6) (118?1)Fish and seafood, fresh and frozen 21?6 27?8 0?0 (85?7) (95?6) 24 46?2 46?9 21?8 46?7 (85?7) (95?6)Fish and seafood, preserved 2?3 7?8 0?0 (22?5) (43?8) 7 13?5 17?3 14?9 13?3 (43?8) (43?8)
Milk, milk products and substitutes 397?3 241?7 331?4 (858?3) (1080?0) 52 100?0 397?3 241?7 331?4 (858?3) (1080?0)Milk, milk-based beverages, human milk, infant
formula and substitutes334?0 258?2 250?4 (840?0) (1080?0) 51 98?1 340?6 256?4 250?7 (840?0) (1080?0)
Yoghurt and fermented milk 37?3 49?4 10?7 (166?7) (175?0) 27 51?9 71?9 47?1 50?0 (166?7) (175?0)Cheese and substitutes 24?4 22?8 20?1 (71?3) (95?8) 44 84?6 28?9 22?0 23?3 (71?3) (95?8)Milk-based desserts and substitutes 1?5 8?6 0?0 (2?6) (60?0) 3 5?8 26?1 30?1 15?6 (60?0) (60?0)
8C
Lecle
rcqet
al.

http://journals.cambridge.org Downloaded: 27 Mar 2009 IP address: 193.60.94.67
S Public Health Nutrition
Table 4 Continued
Total population (n 52) Consumers
Food categories Mean SD Median 95th* 99th* n % Mean SD Median 95th* 99th*
Oils and fats 12?8 10?0 13?0 (31?9) (41?3) 43 82?7 15?5 8?9 14?4 (31?9) (41?3)Olive oil 11?0 8?7 10?8 (28?7) (37?1) 43 82?7 13?4 7?8 12?0 (28?7) (37?1)Other vegetable oils 0?6 1?5 0?0 (4?6) (6?1) 8 15?4 3?6 2?0 3?7 (6?1) (6?1)Butter and creams 0?8 1?9 0?0 (5?0) (8?6) 12 23?1 3?5 2?4 3?1 (8?6) (8?6)Other fats 0?4 1?6 0?0 (5?6) (8?3) 4 7?7 5?5 2?7 6?0 (8?3) (8?3)
Eggs 5?9 9?6 0?0 (27?6) (44?4) 23 44?2 13?4 10?4 11?3 (27?9) (44?4)Alcoholic beverages and substitutes 0?0 0?0 0?0 (0?0) (0?1) 11 21?2 0?0 0?0 0?0 (0?1) (0?1)
Regular wine and substitutes 0?0 0?0 0?0 (0?0) (0?1) 10 19?2 0?0 0?0 0?0 (0?1) (0?1)Beer, cider and substitutes Not consumed 0 0?0Sweet wine, spumante, wine-based appetizers,
spirits and liquors0?0 0?0 0?0 (0?0) (0?0) 1 1?9 0?0 – 0?0 (0?0) (0?0)
Sweet products and substitutes 10?0 16?3 2?7 (41?0) (86?7) 27 51?9 19?3 18?3 14?0 (51?2) (86?7)Ice cream, ice lolly and substitutes 1?6 6?6 0?0 (25?0) (33?3) 3 5?8 27?8 4?8 25?0 (33?3) (33?3)Chocolate and substitutes 1?8 5?6 0?0 (12?5) (31?3) 8 15?4 11?6 9?9 6?7 (31?3) (31?3)Candies, jam and other sweet products (incl. sugar-free) 0?4 1?7 0?0 (3?7) (10?8) 4 7?7 4?9 4?4 4?3 (10?8) (10?8)Sugar, fructose, honey and other nutritious sweeteners 6?0 9?0 0?8 (26?7) (39?7) 26 50?0 12?0 9?6 8?4 (32?0) (39?7)Cocoa and cocoa-based powder 0?3 1?4 0?0 (0?0) (8?3) 2 3?8 7?1 1?8 7?1 (8?3) (8?3)Artificial sweeteners Not consumed 0 0?0
Meal substitutes Not consumed 0 0?0Water and other non-alcoholic beverages 446?8 258?6 405?8 (886?7) (1006?7) 49 94?2 474?2 240?4 443?7 (886?7) (1006?7)
Tap water (as such, in beverages or recipes) 101?5 139?7 40?0 (427?5) (618?3) 29 55?8 182?0 142?6 142?5 (493?3) (618?3)Bottled water 265?3 215?9 240?0 (746?7) (853?3) 42 80?8 328?5 191?7 285?0 (746?7) (853?3)Coffee, tea, herbal tea and substitutes 11?6 41?6 0?0 (100?0) (250?0) 9 17?3 67?1 82?7 24?5 (250?0) (250?0)Fruit and vegetable juices 66?3 102?8 0?0 (300?0) (333?3) 24 46?2 143?7 108?7 137?5 (331?7) (333?3)Other soft drinks 2?1 10?4 0?0 (0?0) (53?3) 2 3?8 53?3 0?0 53?3 (53?3) (53?3)
Miscellaneous 0?9 1?5 0?3 (3?0) (8?5) 33 63?5 1?4 1?7 0?9 (5?3) (8?5)
Total amount of foods and beverages- 1259?5 366?9 1223?3 (1880?2) (1983?6) 52 100?0 1259?5 366?9 1223?3 (1880?2) (1983?6)Total amount of liquid foods 776?2 311?0 763?8 (1306?0) (1693?3) 52 100?0 776?2 311?0 763?8 (1306?0) (1693?3)Total amount of solid foods 483?3 248?5 484?5 (846?8) (1011?3) 48 92?3 523?6 213?2 516?5 (846?8) (1011?3)
*High percentiles of consumption assessed on the basis of a 3 d survey provide an overestimate of long-term high levels of consumption. Values are enclosed in parentheses when the number of subjects to which theyrefer is lower than 160 and 800 for the 95th and 99th percentile, respectively, since these values bear a large uncertainty and provide only a rough indication of high levels of consumption.-All beverages and milk in liquid state were classified as liquid foods; all other items were classified as solid foods.
ItalianN
ational
Food
Consu
mptio
nSu
rvey
9

http://journals.cambridge.org Downloaded: 27 Mar 2009 IP address: 193.60.94.67
S Public Health Nutrition
Table 5 Mean, standard deviation, median and high percentiles of individual daily consumption (3 d average) by food category in the total population and in consumers (g/d) – children (3 to 9?9years), males and females: Italian National Food Consumption Survey INRAN-SCAI 2005–06
Total population (n 193) Consumers
Food categories Mean SD Median 95th* 99th* n % Mean SD Median 95th* 99th*
Cereals, cereal products and substitutes 238?0 87?6 230?6 394?4 (448?3) 193 100?0 238?0 87?6 230?6 394?4 (448?3)Bread 73?6 60?5 60?0 180?0 (290?0) 172 89?1 82?6 58?0 66?3 180?0 (290?0)Pasta and pasta substitutes 58?2 28?7 56?1 104?9 (161?7) 188 97?4 59?8 27?4 56?8 104?9 (161?7)Pizza 7?2 19?0 0?0 50?0 (100?0) 35 18?1 39?9 26?5 33?3 (100?0) (112?5)Rice 16?2 23?2 0?0 62?5 (104?2) 89 46?1 35?1 22?5 29?7 (83?3) (108?8)Wheat, other cereals and flours 26?5 27?8 15?9 84?1 (101?3) 169 87?6 30?2 27?7 24?4 85?0 (101?3)Breakfast cereals 3?8 7?8 0?0 22?5 (30?0) 50 25?9 14?8 8?4 13?0 (30?0) (31?3)Biscuits 18?5 20?5 13?3 61?3 (89?3) 131 67?9 27?2 19?6 23?3 (69?3) (89?3)Savoury fine bakery products 5?9 11?2 0?0 30?0 (48?0) 67 34?7 17?1 13?0 12?9 (38?0) (71?6)Cakes and sweet snacks 28?1 30?4 20?0 94?5 (119?1) 135 69?9 40?2 28?9 33?0 (101?4) (119?1)
Pulses, fresh and processed 10?1 15?5 0?0 40?0 (62?2) 83 43?0 23?5 15?7 21?9 (44?0) (101?2)Vegetables, fresh and processed 134?3 67?2 119?8 264?9 (306?9) 192 99?5 135?0 66?7 120?4 264?9 (306?9)
Leafy vegetables, fresh 16?3 21?4 6?8 60?7 (98?5) 130 67?4 24?2 22?1 18?6 (79?7) (98?5)Tomatoes, fresh 29?2 26?5 23?1 76?2 (118?3) 160 82?9 35?2 25?2 29?4 (88?3) (118?3)Other fruiting vegetables, fresh 14?9 26?7 0?2 83?7 (107?5) 104 53?9 27?7 31?1 16?5 (93?9) (107?5)Roots and onions, fresh 18?0 20?7 10?3 65?5 (101?5) 192 99?5 18?0 20?8 10?4 65?5 (101?5)Other vegetables, fresh 19?2 29?1 7?0 65?4 (181?5) 150 77?7 24?7 30?9 15?1 (69?7) (181?5)Vegetables, processed 35?2 23?9 31?5 77?8 (94?6) 171 88?6 39?7 21?6 34?7 80?9 (94?6)Spices and herbs 1?5 2?0 0?7 5?4 (7?6) 159 82?4 1?8 2?1 1?1 (5?7) (7?6)
Potatoes, tubers and their products 47?2 46?6 43?3 144?2 (173?4) 140 72?5 65?0 42?9 58?6 (145?0) (173?4)Fruit, fresh and processed 136?0 93?8 122?0 287?7 (337?9) 175 90?7 150?0 87?1 138?2 288?0 (337?9)
Citrus fruit, fresh 21?9 46?8 0?0 114?0 (240?1) 62 32?1 68?2 60?8 60?7 (182?0) (280?0)Exotic fruit, fresh 22?6 27?7 7?5 66?7 (100?0) 102 52?8 42?7 24?3 33?3 (100?0) (100?0)Other fruit, fresh 89?3 82?9 74?0 237?6 (304?0) 149 77?2 115?7 76?4 100?0 (241?3) (304?0)Nuts, seeds, olives and their products, dried fruit 1?2 3?7 0?0 7?4 (17?0) 37 19?2 6?4 6?2 5?3 (17?0) (34?3)Other processed fruit (in syrup, in puree, etc.) 0?9 11?0 0?0 0?0 (33?3) 2 1?0 91?7 82?5 91?7 (150?0) (150?0)
Meat, meat products and substitutes 99?6 45?3 94?6 181?8 (237?5) 191 99?0 100?6 44?4 94?9 181?8 (237?5)Beef and veal, not preserved, excl. offal 38?0 33?1 35?3 94?4 (170?2) 154 79?8 47?6 30?2 41?3 (97?8) (170?2)Pork, not preserved, excl. offal 11?2 19?5 0?0 46?9 (83?0) 71 36?8 30?6 21?1 33?3 (65?0) (96?9)Poultry and game, not preserved, excl. offal 23?3 30?2 15?7 72?8 (143?6) 105 54?4 42?9 29?0 38?4 (88?3) (143?6)Other meats, not preserved, excl. offal 3?0 13?9 0?0 28?8 (60?0) 14 7?3 41?4 33?6 32?3 (148?1) (148?1)Ham, salami, sausages and other preserved meats,
excl. offal23?3 23?2 15?0 72?4 (88?5) 157 81?3 28?6 22?6 20?0 (74?5) (88?5)
Offal, blood and their products 0?7 5?3 0?0 0?0 (33?3) 4 2?1 34?6 14?2 29?2 (55?1) (55?1)Meat substitutes Not consumed 0 0?0
Fish, seafood and their products 40?3 44?9 37?5 132?0 (210?7) 132 68?4 58?9 43?0 50?8 (154?7) (210?7)Fish and seafood, fresh and frozen 37?2 43?6 37?5 125?6 (205?1) 114 59?1 63?0 40?0 51?3 (154?7) (205?1)Fish and seafood, preserved 3?0 6?4 0?0 18?8 (26?5) 52 26?9 11?3 7?6 9?5 (23?5) (30?0)
Milk, milk products and substitutes 259?1 122?5 255?7 487?1 (696?7) 193 100?0 259?1 122?5 255?7 487?1 (696?7)Milk, milk-based beverages, human milk, infant
formula and substitutes197?2 115?5 202?4 400?0 (656?7) 185 95?9 205?7 110?3 210?8 400?0 (656?7)
Yoghurt and fermented milk 16?7 38?1 0?0 100?0 (200?0) 43 22?3 74?9 46?6 66?7 (141?7) (250?0)Cheese and substitutes 44?3 34?6 40?6 110?0 (141?5) 187 96?9 45?7 34?2 41?3 110?0 (141?5)Milk-based desserts and substitutes 0?9 5?7 0?0 0?0 (41?7) 9 4?7 20?0 18?9 15?4 (60?0) (60?0)
10
CLe
clercq
eta
l.

http://journals.cambridge.org Downloaded: 27 Mar 2009 IP address: 193.60.94.67
S Public Health Nutrition
Table 5 Continued
Total population (n 193) Consumers
Food categories Mean SD Median 95th* 99th* n % Mean SD Median 95th* 99th*
Oils and fats 33?2 12?8 30?9 55?0 (80?8) 193 100?0 33?2 12?8 30?9 55?0 (80?8)Olive oil 26?7 10?5 25?4 46?7 (54?5) 193 100?0 26?7 10?5 25?4 46?7 (54?5)Other vegetable oils 2?4 3?0 0?8 8?6 (10?4) 97 50?3 4?8 2?4 4?6 (9?8) (10?5)Butter and creams 3?4 6?5 0?0 17?1 (29?8) 85 44?0 7?8 7?8 5?0 (23?0) (45?0)Other fats 0?7 1?9 0?0 4?7 (9?1) 37 19?2 3?5 3?1 2?8 (9?1) (15?2)
Eggs 20?0 24?7 11?1 65?4 (127?6) 150 77?7 25?7 25?2 18?3 (66?4) (127?6)Alcoholic beverages and substitutes 0?5 5?8 0?0 0?2 (13?3) 113 58?5 0?9 7?6 0?0 (0?2) (13?3)
Regular wine and substitutes 0?5 5?8 0?0 0?1 (13?3) 108 56?0 0?9 7?8 0?0 (0?2) (13?3)Beer, cider and substitutes Not consumed 0 0?0Sweet wine, spumante, wine-based appetizers,
spirits and liquors0?0 0?1 0?0 0?0 (0?3) 7 3?6 0?4 0?7 0?1 (2?0) (2?0)
Sweet products and substitutes 35?8 31?9 25?3 93?6 (140?3) 181 93?8 38?1 31?6 27?3 93?6 (140?3)Ice cream, ice lolly and substitutes 14?1 27?4 0?0 66?7 (116?7) 57 29?5 47?7 30?7 40?0 (110?0) (175?0)Chocolate and substitutes 7?3 11?4 0?0 33?3 (47?2) 95 49?2 14?9 12?2 13?3 (36?7) (80?0)Candies, jam and other sweet products (incl. sugar-free) 2?0 4?7 0?0 13?3 (23?7) 50 25?9 7?6 6?6 5?6 (23?7) (26?7)Sugar, fructose, honey and other nutritious sweeteners 9?7 10?0 8?0 28?9 (53?3) 147 76?2 12?8 9?6 10?7 (31?0) (53?3)Cocoa and cocoa-based powder 2?6 7?7 0?0 16?3 (30?0) 44 22?8 11?6 12?7 8?3 (28?0) (79?3)Artificial sweeteners Not consumed 0 0?0
Meal substitutes Not consumed 0 0?0Water and other non-alcoholic beverages 650?0 280?8 590?0 1238?3 (1562?5) 193 100?0 650?0 280?8 590?0 1238?3 (1562?5)
Tap water (as such, in beverages or recipes) 188?1 228?6 90?0 613?3 (920?8) 127 65?8 285?9 226?9 266?7 (746?7) (920?8)Bottled water 319?5 287?3 280?0 840?0 (1226?7) 150 77?7 411?2 261?7 373?3 (906?7) (1226?7)Coffee, tea, herbal tea and substitutes 34?4 80?9 0?0 173?3 (406?7) 62 32?1 107?0 112?8 77?5 (350?0) (566?7)Fruit and vegetable juices 80?0 96?0 50?0 266?7 (366?7) 127 65?8 121?6 94?6 116?7 (333?3) (366?7)Other soft drinks 27?9 52?5 0?0 120?0 (273?3) 62 32?1 87?0 58?9 66?7 (200?0) (280?0)
Miscellaneous 2?1 2?9 1?0 8?0 (15?5) 141 73?1 2?9 3?0 2?0 (8?8) (15?5)
Total amount of foods and beverages- 1706?3 416?5 1636?9 2574?9 (2813?7) 193 100?0 1706?3 416?5 1636?9 2574?9 (2813?7)Total amount of liquid foods 849?2 277?8 797?4 1427?0 (1705?7) 193 100?0 849?2 277?8 797?4 1427?0 (1705?7)Total amount of solid foods 857?1 229?2 827?1 1232?3 (1465?0) 193 100?0 857?1 229?2 827?1 1232?3 (1465?0)
*High percentiles of consumption assessed on the basis of a 3 d survey provide an overestimate of long-term high levels of consumption. Values are enclosed in parentheses when the number of subjects to which theyrefer is lower than 160 and 800 for the 95th and 99th percentile, respectively, since these values bear a large uncertainty and provide only a rough indication of high levels of consumption.-All beverages and milk in liquid state were classified as liquid foods; all other items were classified as solid foods.
ItalianN
ational
Food
Consu
mptio
nSu
rvey
11

http://journals.cambridge.org Downloaded: 27 Mar 2009 IP address: 193.60.94.67
S Public Health Nutrition
Table 6 Mean, standard deviation, median and high percentiles of individual daily consumption (3 d average) by food category in the total population and in consumers (g/d) – teenagers (10 to17?9 years), males: Italian National Food Consumption Survey INRAN-SCAI 2005–06
Total population (n 108) Consumers
Food categories Mean SD Median 95th* 99th* n % Mean SD Median 95th* 99th*
Cereals, cereal products and substitutes 331?3 123?3 324?0 (550?1) (657?3) 108 100?0 331?3 123?3 324?0 (550?1) (657?3)Bread 121?4 81?4 113?0 (280?0) (370?0) 105 97?2 124?9 79?9 119?9 (280?0) (370?0)Pasta and pasta substitutes 63?6 32?4 61?8 (128?0) (133?3) 103 95?4 66?7 29?9 63?3 (128?0) (133?3)Pizza 10?3 23?5 0?0 (56?7) (100?0) 24 22?2 46?2 29?1 40?0 (100?0) (133?3)Rice 16?7 23?6 0?0 (55?3) (76?0) 49 45?4 36?7 22?1 33?9 (70?0) (146?6)Wheat, other cereals and flours 50?6 49?5 45?7 (149?3) (195?4) 96 88?9 57?0 49?0 54?3 (151?6) (304?8)Breakfast cereals 3?9 8?8 0?0 (27?5) (33?3) 24 22?2 17?5 10?4 15?8 (33?3) (36?7)Biscuits 28?9 43?8 16?0 (104?7) (215?3) 65 60?2 48?0 47?7 37?3 (144?0) (270?0)Savoury fine bakery products 7?4 14?0 0?0 (40?0) (53?7) 41 38?0 19?4 16?9 13?3 (53?3) (85?7)Cakes and sweet snacks 28?6 39?3 16?8 (121?8) (180?0) 70 64?8 44?1 41?2 33?3 (138?4) (218?8)
Pulses, fresh and processed 13?8 26?6 0?0 (76?5) (119?0) 36 33?3 41?4 31?4 30?3 (119?0) (122?6)Vegetables, fresh and processed 186?3 107?9 165?6 (390?4) (493?6) 108 100?0 186?3 107?9 165?6 (390?4) (493?6)
Leafy vegetables, fresh 32?9 50?4 13?5 (131?5) (184?3) 81 75?0 43?9 54?0 24?8 (154?9) (333?3)Tomatoes, fresh 38?6 37?5 30?7 (114?9) (172?6) 90 83?3 46?3 36?5 34?8 (118?7) (204?3)Other fruiting vegetables, fresh 19?1 37?9 0?2 (113?2) (132?2) 59 54?6 35?0 45?7 8?2 (122?6) (182?2)Roots and onions, fresh 16?5 18?6 9?3 (62?9) (81?0) 108 100?0 16?5 18?6 9?3 (62?9) (81?0)Other vegetables, fresh 28?7 34?2 14?2 (87?9) (108?8) 89 82?4 34?9 34?7 21?3 (97?1) (181?5)Vegetables, processed 48?5 39?4 40?2 (120?4) (181?1) 90 83?3 58?2 36?0 50?6 (126?0) (186?0)Spices and herbs 1?9 2?2 1?1 (6?5) (8?1) 91 84?3 2?3 2?2 1?6 (6?7) (9?7)
Potatoes, tubers and their products 68?7 66?2 63?5 (185?7) (232?6) 83 76?9 89?4 62?0 81?7 (210?4) (327?2)Fruit, fresh and processed 139?2 114?6 118?0 (351?1) (435?6) 98 90?7 153?4 110?9 128?9 (352?7) (621?0)
Citrus fruit, fresh 25?8 55?7 0?0 (174?7) (242?7) 47 43?5 59?2 72?0 26?7 (222?7) (274?0)Exotic fruit, fresh 23?2 33?9 0?0 (100?0) (128?3) 46 42?6 54?4 31?6 50?0 (106?3) (133?3)Other fruit, fresh 89?2 101?6 56?0 (273?2) (415?1) 80 74?1 120?4 100?8 90?2 (289?2) (617?0)Nuts, seeds, olives and their products, dried fruit 1?0 3?3 0?0 (7?4) (10?7) 16 14?8 7?0 5?8 6?6 (25?9) (25?9)Other processed fruit (in syrup, in puree, etc.) 0?0 0?1 0?0 (0?0) (0?0) 1 0?9 1?3 – 1?3 (1?3) (1?3)
Meat, meat products and substitutes 145?1 69?3 129?6 (273?7) (393?2) 108 100?0 145?1 69?3 129?6 (273?7) (393?2)Beef and veal, not preserved, excl. offal 60?0 48?1 50?0 (133?6) (187?4) 96 88?9 67?5 45?8 56?3 (136?7) (339?3)Pork, not preserved, excl. offal 15?7 35?4 0?0 (79?4) (153?3) 35 32?4 48?5 48?0 41?7 (153?3) (251?8)Poultry and game, not preserved, excl. offal 24?9 30?2 20?2 (75?0) (106?3) 58 53?7 46?4 26?4 41?6 (85?2) (188?1)Other meats, not preserved, excl. offal 3?4 12?9 0?0 (33?3) (65?8) 8 7?4 46?2 17?2 41?6 (79?4) (79?4)Ham, salami, sausages and other preserved meats,
excl. offal40?5 33?9 35?6 (107?9) (167?3) 98 90?7 44?7 32?8 40?5 (112?4) (180?0)
Offal, blood and their products 0?6 3?8 0?0 (0?0) (10?7) 4 3?7 15?5 14?6 9?1 (37?3) (37?3)Meat substitutes Not consumed 0 0?0
Fish, seafood and their products 48?4 55?5 37?5 (165?2) (197?9) 70 64?8 74?6 52?9 59?7 (173?6) (231?4)Fish and seafood, fresh and frozen 43?9 55?3 11?1 (153?9) (197?9) 57 52?8 83?1 50?2 69?2 (181?8) (230?0)Fish and seafood, preserved 4?5 10?4 0?0 (30?0) (43?8) 29 26?9 16?7 14?2 12?4 (43?8) (61?9)
Milk, milk products and substitutes 246?0 136?6 250?5 (493?1) (607?2) 106 98?1 250?7 133?6 251?9 (493?1) (607?2)Milk, milk-based beverages, human milk, infant formula
and substitutes168?3 117?1 166?7 (333?3) (440?0) 94 87?0 193?3 104?3 181?2 (364?8) (595?8)
Yoghurt and fermented milk 13?5 35?2 0?0 (83?3) (135?3) 21 19?4 69?2 51?0 52?0 (135?3) (250?0)Cheese and substitutes 63?8 44?1 61?4 (136?6) (187?6) 104 96?3 66?2 43?1 62?7 (136?6) (187?6)Milk-based desserts and substitutes 0?5 3?0 0?0 (0?0) (15?4) 5 4?6 10?7 10?4 5?1 (26?7) (26?7)
12
CLe
clercq
eta
l.

http://journals.cambridge.org Downloaded: 27 Mar 2009 IP address: 193.60.94.67
S Public Health Nutrition
Table 6 Continued
Total population (n 108) Consumers
Food categories Mean SD Median 95th* 99th* n % Mean SD Median 95th* 99th*
Oils and fats 44?8 17?3 41?6 (76?2) (97?2) 108 100?0 44?8 17?3 41?6 (76?2) (97?2)Olive oil 35?1 12?9 32?0 (61?1) (69?8) 108 100?0 35?1 12?9 32?0 (61?1) (69?8)Other vegetable oils 4?2 8?8 3?0 (10?5) (24?0) 61 56?5 7?5 10?7 6?1 (12?8) (84?5)Butter and creams 4?2 6?2 1?3 (16?7) (30?2) 57 52?8 7?9 6?7 6?5 (24?4) (30?3)Other fats 1?3 3?1 0?0 (5?3) (15?2) 31 28?7 4?6 4?2 3?3 (15?2) (17?3)
Eggs 21?0 24?7 12?4 (67?2) (119?7) 89 82?4 25?5 25?0 18?7 (70?1) (126?8)Alcoholic beverages and substitutes 4?7 18?5 0?0 (40?0) (66?8) 70 64?8 7?3 22?6 0?1 (53?3) (150?1)
Regular wine and substitutes 2?6 9?7 0?0 (26?8) (53?3) 66 61?1 4?2 12?2 0?1 (40?0) (53?4)Beer, cider and substitutes 1?6 12?3 0?0 (0?0) (66?7) 2 1?9 88?3 30?6 88?3 (110?0) (110?0)Sweet wine, spumante, wine-based appetizers,
spirits and liquors0?5 5?1 0?0 (0?1) (0?9) 10 9?3 5?5 16?8 0?1 (53?3) (53?3)
Sweet products and substitutes 51?3 50?0 34?4 (156?0) (220?0) 104 96?3 53?3 49?9 36?4 (156?0) (220?0)Ice cream, ice lolly and substitutes 24?4 42?4 0?0 (118?0) (166?7) 40 37?0 66?0 46?2 55?8 (158?3) (220?0)Chocolate and substitutes 7?0 10?3 0?0 (29?4) (36?7) 48 44?4 15?7 10?0 13?3 (36?7) (37?6)Candies, jam and other sweet products (incl. sugar-free) 2?1 4?2 0?0 (11?7) (16?0) 31 28?7 7?2 5?0 7?2 (16?0) (19?4)Sugar, fructose, honey and other nutritious sweeteners 15?0 20?9 11?7 (41?8) (72?8) 81 75?0 20?0 22?0 16?0 (42?0) (180?2)Cocoa and cocoa-based powder 2?9 10?7 0?0 (16?3) (30?0) 21 19?4 14?8 20?7 11?7 (30?0) (97?9)Artificial sweeteners 0?0 0?1 0?0 (0?0) (0?0) 1 0?9 1?0 – 1?0 (1?0) (1?0)
Meal substitutes Not consumed 0 0?0Water and other non-alcoholic beverages 969?3 474?4 966?9 (1710?0) (2871?0) 108 100?0 969?3 474?4 966?9 (1710?0) (2871?0)
Tap water (as such, in beverages or recipes) 228?2 289?4 94?2 (906?7) (1150?0) 70 64?8 352?1 292?7 320?0 (960?0) (1165?0)Bottled water 460?6 429?3 426?7 (1133?3) (1466?7) 79 73?1 629?7 380?8 586?7 (1386?7) (2060?0)Coffee, tea, herbal tea and substitutes 85?0 133?1 23?3 (350?0) (559?5) 62 57?4 148?0 146?9 91?3 (493?3) (651?0)Fruit and vegetable juices 97?5 158?1 8?1 (433?3) (673?0) 81 75?0 130?1 170?8 68?7 (489?7) (812?7)Other soft drinks 97?9 159?6 0?0 (413?3) (586?7) 52 48?1 203?4 177?6 160?0 (550?0) (1066?7)
Miscellaneous 3?8 4?3 2?4 (12?1) (19?0) 82 75?9 5?0 4?3 4?1 (12?3) (20?8)
Total amount of foods and beverages- 2273?7 683?6 2221?2 (3550?1) (4771?4) 108 100?0 2273?7 683?6 2221?2 (3550?1) (4771?4)Total amount of liquid foods 1143?8 469?5 1111?1 (1990?0) (3055?8) 108 100?0 1143?8 469?5 1111?1 (1990?0) (3055?8)Total amount of solid foods 1129?9 311?1 1091?5 (1762?8) (2034?8) 108 100?0 1129?9 311?1 1091?5 (1762?8) (2034?8)
*High percentiles of consumption assessed on the basis of a 3 d survey provide an overestimate of long-term high levels of consumption. Values are enclosed in parentheses when the number of subjects to which theyrefer is lower than 160 and 800 for the 95th and 99th percentile, respectively, since these values bear a large uncertainty and provide only a rough indication of high levels of consumption.-All beverages and milk in liquid state were classified as liquid foods; all other items were classified as solid foods.
ItalianN
ational
Food
Consu
mptio
nSu
rvey
13

http://journals.cambridge.org Downloaded: 27 Mar 2009 IP address: 193.60.94.67
S Public Health Nutrition
Table 7 Mean, standard deviation, median and high percentiles of individual daily consumption (3 d average) by food category in the total population and in consumers (g/d) – teenagers (10 to17?9 years), females: Italian National Food Consumption Survey INRAN-SCAI 2005–06
Total population (n 139) Consumers
Food categories Mean SD Median 95th* 99th* n % Mean SD Median 95th* 99th*
Cereals, cereal products and substitutes 265?3 101?2 (260?9) (417?4) 559?6 139 100?0 265?3 101?2 260?9 (417?4) (559?6)Bread 85?1 64?1 (75?0) (206?5) 240?2 126 90?6 93?9 60?9 80?0 (206?5) (240?2)Pasta and pasta substitutes 56?6 30?3 (56?0) (105?3) 133?3 129 92?8 61?0 26?9 59?3 (105?3) (133?3)Pizza 14?0 35?4 (0?0) (87?5) 183?3 34 24?5 57?1 52?0 33?3 (183?3) (250?0)Rice 9?7 17?0 (0?0) (39?5) 67?9 43 30?9 31?4 15?7 30?4 (51?3) (99?4)Wheat, other cereals and flours 43?9 39?5 (33?8) (124?3) 140?1 128 92?1 47?7 38?9 42?1 (124?3) (140?1)Breakfast cereals 1?9 5?6 (0?0) (15?0) 30?0 22 15?8 11?8 9?1 8?8 (30?0) (35?0)Biscuits 18?8 22?8 (12?0) (66?7) 99?3 84 60?4 31?2 21?7 26?7 (76?0) (103?3)Savoury fine bakery products 10?6 17?7 (0?0) (45?7) 89?5 66 47?5 22?4 19?9 16?7 (66?7) (104?7)Cakes and sweet snacks 24?6 31?9 (13?3) (104?0) 125?9 86 61?9 39?7 32?4 28?5 (115?2) (145?8)
Pulses, fresh and processed 9?5 18?4 (0?0) (46?3) 83?6 42 30?2 31?5 20?8 23?9 (76?5) (91?0)Vegetables, fresh and processed 166?4 86?3 (153?8) (331?5) 393?3 139 100?0 166?4 86?3 153?8 (331?5) (393?3)
Leafy vegetables, fresh 23?5 32?6 (13?5) (93?5) 166?7 103 74?1 31?7 34?3 20?0 (105?9) (166?7)Tomatoes, fresh 36?0 36?5 (25?7) (113?2) 142?0 120 86?3 41?7 36?1 31?1 (115?6) (142?0)Other fruiting vegetables, fresh 25?8 42?8 (2?5) (117?4) 193?0 81 58?3 44?3 48?2 25?0 (122?6) (205?6)Roots and onions, fresh 15?0 23?5 (7?7) (55?4) 121?3 137 98?6 15?2 23?6 7?8 (55?4) (121?3)Other vegetables, fresh 25?7 34?1 (11?7) (91?8) 180?0 113 81?3 31?6 35?2 22?5 (92?8) (180?0)Vegetables, processed 38?5 34?5 (33?4) (100?2) 136?8 106 76?3 50?5 30?9 49?7 (107?5) (136?8)Spices and herbs 2?0 4?0 (1?0) (6?5) 27?1 109 78?4 2?5 4?4 1?4 (7?1) (27?1)
Potatoes, tubers and their products 53?7 53?6 (49?0) (161?4) 191?5 96 69?1 77?8 47?8 73?4 (167?3) (193?9)Fruit, fresh and processed 178?5 132?0 (182?0) (428?8) 590?7 122 87?8 203?4 121?6 200?8 (428?8) (590?7)
Citrus fruit, fresh 30?4 66?3 (0?0) (182?0) 298?0 59 42?4 71?7 86?4 60?7 (274?2) (381?0)Exotic fruit, fresh 23?4 36?1 (0?0) (100?0) 171?7 61 43?9 53?3 37?0 33?3 (120?5) (182?8)Other fruit, fresh 122?5 123?0 (82?7) (374?0) 488?3 105 75?5 162?2 116?5 150?0 (389?3) (488?3)Nuts, seeds, olives and their products, dried fruit 1?9 3?7 (0?0) (10?7) 13?3 37 26?6 7?0 4?0 6?3 (13?3) (20?8)Other processed fruit (in syrup, in puree, etc.) 0?2 2?8 (0?0) (0?0) 0?0 1 0?7 33?3 – 33?3 (33?3) (33?3)
Meat, meat products and substitutes 107?4 47?3 (107?4) (193?8) 221?4 139 100?0 107?4 47?3 107?4 (193?8) (221?4)Beef and veal, not preserved, excl. offal 41?8 35?8 (36?0) (114?0) 129?6 110 79?1 52?8 32?2 43?9 (117?6) (129?6)Pork, not preserved, excl. offal 13?3 24?5 (0?0) (73?9) 105?5 46 33?1 40?2 27?2 35?2 (93?8) (105?8)Poultry and game, not preserved, excl. offal 18?5 23?4 (0?0) (55?3) 90?1 60 43?2 42?9 14?5 41?0 (70?3) (90?4)Other meats, not preserved, excl. offal 4?4 14?6 (0?0) (47?5) 66?7 13 9?4 47?2 16?0 47?5 (80?3) (80?3)Ham, salami, sausages and other preserved meats,
excl. offal28?6 25?8 (21?7) (72?1) 109?4 118 84?9 33?7 24?8 25?5 (85?7) (109?4)
Offal, blood and their products 0?7 5?5 (0?0) (0?0) 33?3 4 2?9 25?9 22?9 20?5 (55?1) (55?1)Meat substitutes Not consumed 0 0?0
Fish, seafood and their products 49?4 57?1 (37?5) (173?6) 255?7 101 72?7 68?0 56?8 53?3 (181?8) (255?7)Fish and seafood, fresh and frozen 44?4 57?8 (27?2) (170?2) 255?7 81 58?3 76?2 57?5 57?5 (181?8) (255?7)Fish and seafood, preserved 5?0 11?2 (0?0) (23?5) 58?4 47 33?8 14?8 15?1 9?7 (41?3) (73?0)
Milk, milk products and substitutes 215?7 105?3 (208?5) (416?8) 470?2 137 98?6 218?9 102?7 209?6 (416?8) (470?2)Milk, milk-based beverages, human milk, infant
formula and substitutes139?8 97?5 (150?0) (264?7) 343?8 116 83?5 167?5 82?0 166?7 (264?9) (343?8)
Yoghurt and fermented milk 20?8 46?7 (0?0) (125?0) 208?3 33 23?7 87?7 58?2 52?0 (208?3) (250?0)Cheese and substitutes 54?6 38?1 (46?9) (127?6) 150?3 135 97?1 56?2 37?4 47?5 (127?6) (150?3)Milk-based desserts and substitutes 0?5 3?4 (0?0) (0?0) 16?7 5 3?6 15?1 10?9 10?4 (33?3) (33?3)
14
CLe
clercq
eta
l.

http://journals.cambridge.org Downloaded: 27 Mar 2009 IP address: 193.60.94.67
S Public Health Nutrition
Table 7 Continued
Total population (n 139) Consumers
Food categories Mean SD Median 95th* 99th* n % Mean SD Median 95th* 99th*
Oils and fats 38?8 16?1 (36?2) (61?7) 97?6 138 99?3 39?1 15?8 36?2 (61?7) (97?6)Olive oil 29?5 11?7 (28?8) (53?4) 59?7 138 99?3 29?7 11?5 28?9 (53?4) (59?7)Other vegetable oils 3?3 3?7 (3?0) (10?3) 13?5 81 58?3 5?7 3?1 5?2 (11?9) (19?5)Butter and creams 4?7 10?3 (0?0) (23?0) 62?5 62 44?6 10?5 13?3 4?9 (25?0) (76?8)Other fats 1?3 2?9 (0?0) (8?7) 12?2 35 25?2 5?1 3?7 4?0 (12?2) (13?7)
Eggs 20?8 24?2 (12?1) (72?5) 115?2 111 79?9 26?1 24?4 18?0 (76?3) (115?2)Alcoholic beverages and substitutes 1?3 8?0 0?0 (0?3) (55?1) 82 59?0 2?2 10?4 0?1 (3?5) (66?7)
Regular wine and substitutes 0?0 0?1 0?0 (0?2) (0?2) 78 56?1 0?1 0?1 0?1 (0?2) (0?2)Beer, cider and substitutes 0?9 7?3 0?0 (0?0) (55?0) 3 2?2 40?6 35?6 55?0 (66?7) (66?7)Sweet wine, spumante, wine-based appetizers,
spirits and liquors0?4 3?5 0?0 (0?1) (7?0) 17 12?2 3?1 9?7 0?1 (40?0) (40?0)
Sweet products and substitutes 36?4 35?3 28?4 (100?7) (166?9) 129 92?8 39?3 35?1 30?8 (100?7) (166?9)Ice cream, ice lolly and substitutes 15?8 32?3 0?0 (80?0) (156?7) 42 30?2 52?4 39?3 33?3 (110?7) (216?7)Chocolate and substitutes 6?5 10?7 0?0 (34?3) (40?0) 56 40?3 16?1 11?3 13?3 (40?0) (43?3)Candies, jam and other sweet products (incl. sugar-free) 2?3 5?1 0?0 (13?3) (17?0) 49 35?3 6?5 6?9 4?0 (17?0) (36?4)Sugar, fructose, honey and other nutritious sweeteners 9?9 10?4 8?0 (31?6) (44?3) 101 72?7 13?7 9?9 11?8 (31?8) (44?3)Cocoa and cocoa-based powder 1?9 5?1 0?0 (14?0) (24?7) 30 21?6 8?7 7?7 7?0 (24?7) (36?1)Artificial sweeteners 0?0 0?0 0?0 (0?0) (0?0) 1 0?7 0?0 – 0?0 (0?0) (0?0)
Meal substitutes Not consumed 0 0?0Water and other non-alcoholic beverages 777?8 340?4 737?1 (1466?7) (1905?0) 139 100?0 777?8 340?4 737?1 (1466?7) (1905?0)
Tap water (as such, in beverages or recipes) 208?1 326?6 53?3 (826?7) (1773?3) 84 60?4 344?4 360?4 277?5 (906?7) (1813?3)Bottled water 389?6 332?8 386?7 (906?7) (1506?7) 102 73?4 531?0 274?8 533?3 (913?3) (1506?7)Coffee, tea, herbal tea and substitutes 54?0 88?5 15?0 (250?0) (480?0) 79 56?8 95?1 99?6 66?7 (266?7) (532?1)Fruit and vegetable juices 71?7 103?6 5?3 (316?7) (416?7) 94 67?6 106?0 110?7 68?9 (333?3) (469?4)Other soft drinks 54?3 91?1 0?0 (266?7) (403?3) 57 41?0 132?4 99?8 110?0 (340?0) (533?3)
Miscellaneous 2?7 2?9 1?8 (8?6) (12?3) 107 77?0 3?5 2?8 2?6 (9?5) (12?3)
Total amount of foods and beverages- 1923?9 520?0 1950?4 (2907?7) (3169?5) 139 100?0 1923?9 520?0 1950?4 (2907?7) (3169?5)Total amount of liquid foods 920?4 339?4 895?0 (1552?4) (1983?5) 139 100?0 920?4 339?4 895?0 (1552?4) (1983?5)Total amount of solid foods 1003?4 276?6 978?7 (1536?0) (1716?4) 139 100?0 1003?4 276?6 978?7 (1536?0) (1716?4)
*High percentiles of consumption assessed on the basis of a 3 d survey provide an overestimate of long-term high levels of consumption. Values are enclosed in parentheses when the number of subjects to which theyrefer is lower than 160 and 800 for the 95th and 99th percentile, respectively, since these values bear a large uncertainty and provide only a rough indication of high levels of consumption.-All beverages and milk in liquid state were classified as liquid foods; all other items were classified as solid foods.
ItalianN
ational
Food
Consu
mptio
nSu
rvey
15
http://journals.cambridge.org Downloaded: 27 Mar 2009 IP address: 193.60.94.67
S Public Health Nutrition
Table 8 Mean, standard deviation, median and high percentiles of individual daily consumption (3 d average) by food category in the total population and in consumers (g/d) – adults (18 to 64?9years), males: Italian National Food Consumption Survey INRAN-SCAI 2005–06
Total population (n 1068) Consumers
Food categories Mean SD Median 95th* 99th* n % Mean SD Median 95th* 99th*
Cereals, cereal products and substitutes 295?7 110?4 288?1 486?9 611?7 1068 100?0 295?7 110?4 288?1 486?9 611?7Bread 127?2 84?7 115?0 285?0 375?0 1015 95?0 133?8 81?6 120?0 290?0 375?0Pasta and pasta substitutes 60?3 35?3 59?3 118?4 156?1 976 91?4 66?0 31?4 62?7 121?6 156?9Pizza 8?7 27?3 0?0 66?7 133?3 146 13?7 63?6 44?4 50?0 (150?0) (250?0)Rice 16?4 25?9 0?0 67?9 110?0 426 39?9 41?2 25?7 34?2 83?3 (122?9)Wheat, other cereals and flours 44?1 40?8 35?9 120?1 165?1 922 86?3 51?1 39?7 45?2 123?7 166?0Breakfast cereals 0?9 4?7 0?0 4?7 30?0 62 5?8 16?1 12?1 14?0 (40?0) (50?0)Biscuits 13?4 23?5 0?0 56?9 103?3 467 43?7 30?6 27?0 24?0 83?3 (140?0)Savoury fine bakery products 5?7 14?5 0?0 32?0 63?0 284 26?6 21?6 21?3 16?0 50?0 (146?3)Cakes and sweet snacks 19?0 31?2 0?0 80?0 149?4 501 46?9 40?4 34?8 31?8 114?0 (162?1)
Pulses, fresh and processed 11?7 24?7 0?0 60?4 97?9 358 33?5 34?8 31?9 24?9 87?4 (126?7)Vegetables, fresh and processed 232?6 120?4 213?4 442?1 618?9 1067 99?9 232?9 120?2 213?5 442?1 618?9
Leafy vegetables, fresh 45?3 53?9 30?1 146?1 247?8 913 85?5 53?0 54?7 36?4 151?8 247?8Tomatoes, fresh 48?4 47?3 37?7 140?5 219?0 927 86?8 55?8 46?5 45?2 145?8 223?2Other fruiting vegetables, fresh 34?0 54?9 6?7 145?0 235?5 687 64?3 52?9 60?8 32?4 165?8 (269?6)Roots and onions, fresh 20?0 27?0 10?0 78?4 131?2 1052 98?5 20?3 27?1 10?4 78?9 131?2Other vegetables, fresh 41?2 50?7 21?9 143?0 225?0 882 82?6 49?9 51?7 34?3 149?3 238?0Vegetables, processed 41?6 35?7 37?8 103?6 140?2 855 80?1 52?0 32?4 42?8 111?6 158?3Spices and herbs 2?0 2?8 1?2 6?4 11?6 914 85?6 2?4 2?9 1?5 6?8 11?6
Potatoes, tubers and their products 54?3 57?4 48?1 162?9 229?2 738 69?1 78?5 53?5 73?2 179?0 (240?5)Fruit, fresh and processed 200?0 161?7 172?7 507?3 735?3 995 93?2 214?7 157?8 184?9 517?7 747?8
Citrus fruit, fresh 48?4 98?7 0?0 242?7 426?7 478 44?8 108?3 123?8 65?8 332?7 (604?7)Exotic fruit, fresh 16?7 30?5 0?0 83?3 138?0 402 37?6 44?3 35?3 33?3 107?5 (166?7)Other fruit, fresh 131?7 133?0 100?0 384?3 566?7 851 79?7 165?3 129?1 138?3 408?3 632?4Nuts, seeds, olives and their products, dried fruit 3?1 6?8 0?0 14?8 27?5 342 32?0 9?6 9?0 7?5 23?5 (42?7)Other processed fruit (in syrup, in puree, etc.) 0?1 1?8 0?0 0?0 0?6 12 1?1 8?1 15?3 0?9 (50?0) (50?0)
Meat, meat products and substitutes 131?5 73?5 120?6 259?0 357?9 1064 99?6 132?0 73?2 121?0 259?0 357?9Beef and veal, not preserved, excl. offal 48?7 47?3 41?2 137?4 215?9 814 76?2 63?9 44?3 53?8 146?7 233?4Pork, not preserved, excl. offal 16?4 30?8 0?0 70?6 125?9 367 34?4 47?7 35?5 46?7 101?5 (177?4)Poultry and game, not preserved, excl. offal 22?8 33?1 0?0 90?1 136?8 448 41?9 54?4 29?9 48?2 111?3 (166?7)Other meats, not preserved, excl. offal 6?8 23?6 0?0 52?0 106?7 127 11?9 57?2 42?5 49?4 (119?3) (135?8)Ham, salami, sausages and other preserved meats,
excl. offal35?4 32?0 27?9 94?1 139?6 931 87?2 40?7 31?0 33?3 96?9 139?8
Offal, blood and their products 1?3 8?2 0?0 0?0 49?4 43 4?0 31?8 26?7 25?0 (65?8) (140?3)Meat substitutes 0?0 1?0 0?0 0?0 0?0 1 0?1 33?3 – 33?3 (33?3) (33?3)
Fish, seafood and their products 48?5 55?6 34?7 160?0 244?3 750 70?2 69?0 54?6 58?4 182?3 (254?6)Fish and seafood, fresh and frozen 41?2 54?5 6?2 152?1 226?9 587 55?0 75?0 53?6 62?5 185?4 (252?0)Fish and seafood, preserved 7?2 13?8 0?0 34?5 66?2 401 37?5 19?3 16?5 14?2 58?4 (73?0)
Milk, milk products and substitutes 177?5 126?4 157?0 381?0 556?3 1062 99?4 178?5 126?0 158?2 381?0 556?3Milk, milk-based beverages, human milk, infant formula
and substitutes94?3 107?9 52?0 255?8 358?3 762 71?3 132?2 106?3 126?3 270?0 (388?8)
Yoghurt and fermented milk 16?3 47?2 0?0 104?0 215?0 189 17?7 92?1 75?0 83?3 250?0 (375?0)Cheese and substitutes 65?6 47?0 58?5 146?4 220?8 1043 97?7 67?2 46?4 60?0 147?1 220?8Milk-based desserts and substitutes 1?2 6?5 0?0 5?1 31?3 97 9?1 13?5 17?4 5?1 (50?0) (125?0)
16
CLe
clercq
eta
l.
http://journals.cambridge.org Downloaded: 27 Mar 2009 IP address: 193.60.94.67
S Public Health Nutrition
Table 8 Continued
Total population (n 1068) Consumers
Food categories Mean SD Median 95th* 99th* n % Mean SD Median 95th* 99th*
Oils and fats 45?9 18?1 43?5 76?7 101?2 1068 100?0 45?9 18?1 43?5 76?7 101?2Olive oil 36?7 14?5 35?4 61?2 79?5 1068 100?0 36?7 14?5 35?4 61?2 79?5Other vegetable oils 3?1 4?6 0?0 12?1 21?1 481 45?0 6?9 4?6 6?1 15?4 (27?5)Butter and creams 4?8 10?0 0?0 23?0 38?5 490 45?9 10?5 12?5 6?7 31?2 (50?9)Other fats 1?3 3?6 0?0 10?0 16?7 224 21?0 6?2 5?5 4?7 16?4 (22?8)
Eggs 24?4 28?2 15?6 77?0 129?2 815 76?3 32?0 28?2 23?9 85?0 141?9Alcoholic beverages and substitutes 163?1 194?9 110?1 533?6 800?0 919 86?0 189?6 197?8 133?3 580?6 813?3
Regular wine and substitutes 106?5 138?5 53?3 373?5 586?7 856 80?1 132?9 143?0 100?0 400?2 600?0Beer, cider and substitutes 52?2 119?1 0?0 266?7 533?3 319 29?9 174?7 161?6 133?3 466?7 (666?7)Sweet wine, spumante, wine-based appetizers,
spirits and liquors4?5 17?2 0?0 33?5 86?7 197 18?4 24?4 33?7 13?3 93?3 (173?3)
Sweet products and substitutes 36?3 36?8 26?7 103?5 193?7 1025 96?0 37?9 36?8 28?0 104?1 193?7Ice cream, ice lolly and substitutes 10?8 29?1 0?0 66?7 166?7 220 20?6 52?4 44?1 33?3 164?2 (226?7)Chocolate and substitutes 2?3 6?6 0?0 15?0 33?3 230 21?5 10?7 10?5 6?7 33?3 (48?1)Candies, jam and other sweet products (incl. sugar-free) 3?2 10?8 0?0 17?9 40?0 274 25?7 12?6 18?5 7?9 36?5 (80?0)Sugar, fructose, honey and other nutritious sweeteners 19?4 16?1 16?0 48?0 72?1 965 90?4 21?5 15?5 18?7 49?3 72?1Cocoa and cocoa-based powder 0?5 2?5 0?0 3?4 14?0 94 8?8 5?9 6?1 4?6 (22?3) (30?0)Artificial sweeteners 0?0 0?3 0?0 0?0 1?3 34 3?2 1?2 1?4 1?0 (3?3) (7?9)
Meal substitutes 0?1 1?8 0?0 0?0 0?0 3 0?3 31?5 18?3 31?0 (50?0) (50?0)Water and other non-alcoholic beverages 851?0 475?1 786?4 1697?9 2426?7 1068 100?0 851?0 475?1 786?4 1697?9 2426?7
Tap water (as such, in beverages or recipes) 175?0 291?6 11?0 810?0 1370?0 562 52?6 332?6 330?6 213?3 1013?3 (1493?3)Bottled water 474?7 429?0 426?7 1246?7 1813?3 831 77?8 610?1 392?3 560?0 1360?0 1880?0Coffee, tea, herbal tea and substitutes 135?4 108?5 111?7 330?0 500?0 1024 95?9 141?2 107?0 119?6 333?3 500?0Fruit and vegetable juices 30?4 75?2 1?5 200?0 330?0 601 56?3 54?0 93?8 6?6 204?0 (400?0)Other soft drinks 35?5 92?4 0?0 213?3 390?0 258 24?2 146?8 138?1 110?0 373?3 (810?0)
Miscellaneous 3?3 4?1 2?3 10?2 19?9 827 77?4 4?3 4?3 2?9 11?7 23?9
Total amount of foods and beverages- 2276?2 677?9 2189?8 3464?2 4125?3 1068 100?0 2276?2 677?9 2189?8 3464?2 4125?3Total amount of liquid foods 1111?3 492?1 1035?3 2057?6 2687?6 1068 100?0 1111?3 492?1 1035?3 2057?6 2687?6Total amount of solid foods 1164?9 327?3 1131?5 1765?1 2075?2 1068 100?0 1164?9 327?3 1131?5 1765?1 2075?2
*High percentiles of consumption assessed on the basis of a 3 d survey provide an overestimate of long-term high levels of consumption. Values are enclosed in parentheses when the number of subjects to which theyrefer is lower than 160 and 800 for the 95th and 99th percentile, respectively, since these values bear a large uncertainty and provide only a rough indication of high levels of consumption.-All beverages and milk in liquid state were classified as liquid foods; all other items were classified as solid foods.
ItalianN
ational
Food
Consu
mptio
nSu
rvey
17

http://journals.cambridge.org Downloaded: 27 Mar 2009 IP address: 193.60.94.67
S Public Health Nutrition
Table 9 Mean, standard deviation, median and high percentiles of individual daily consumption (3 d average) by food category in the total population and in consumers (g/d) – adults (18 to 64?9years), females: Italian National Food Consumption Survey INRAN-SCAI 2005–06
Total population (n 1245 ) Consumers
Food categories Mean SD Median 95th* 99th* n % Mean SD Median 95th* 99th*
Cereals, cereal products and substitutes 232?3 90?3 228?2 383?4 481?4 1245 100?0 232?3 90?3 228?2 383?4 481?4Bread 86?1 63?5 75?0 210?0 260?0 1135 91?2 94?4 60?3 85?0 210?0 260?0Pasta and pasta substitutes 47?7 32?1 46?7 100?0 134?8 1104 88?7 53?8 28?8 52?2 102?2 137?8Pizza 7?7 23?8 0?0 66?7 112?5 177 14?2 54?2 38?4 40?0 116?7 (262?5)Rice 15?1 22?6 0?0 60?5 104?2 522 41?9 35?9 21?6 31?6 83?3 (106?9)Wheat, other cereals and flours 36?5 34?4 29?2 97?5 129?1 1065 85?5 42?7 33?5 37?0 102?0 132?7Breakfast cereals 1?7 5?9 0?0 14?0 30?0 153 12?3 14?2 10?5 10?0 30?3 (49?0)Biscuits 12?4 18?6 4?0 47?5 93?0 646 51?9 23?9 19?8 18?7 60?7 (100?0)Savoury fine bakery products 9?2 16?8 0?0 38?3 59?8 569 45?7 20?0 20?1 16?0 48?2 (71?6)Cakes and sweet snacks 15?9 25?9 0?0 72?9 114?6 532 42?7 37?2 27?8 31?3 93?1 (133?8)
Pulses, fresh and processed 11?2 22?8 0?0 58?7 100?1 431 34?6 32?4 28?7 24?9 83?3 (136?2)Vegetables, fresh and processed 213?1 102?7 200?2 388?9 554?4 1244 99?9 213?3 102?6 200?5 388?9 554?4
Leafy vegetables, fresh 45?8 51?3 31?9 143?0 233?3 1081 86?8 52?7 51?7 37?2 148?7 241?5Tomatoes, fresh 42?1 41?5 32?8 126?7 190?0 1054 84?7 49?8 40?6 39?9 132?0 195?5Other fruiting vegetables, fresh 32?7 51?0 8?2 135?4 205?1 846 68?0 48?1 55?5 30?0 154?0 240?0Roots and onions, fresh 19?1 25?4 9?6 71?8 114?4 1210 97?2 19?7 25?6 10?2 74?7 114?4Other vegetables, fresh 39?1 46?7 22?6 135?6 211?6 1052 84?5 46?2 47?4 31?9 142?5 215?8Vegetables, processed 32?4 30?6 31?5 85?8 128?9 933 74?9 43?3 27?9 34?5 94?1 134?0Spices and herbs 1?9 2?9 1?0 5?9 14?0 1050 84?3 2?2 3?1 1?4 6?3 15?4
Potatoes, tubers and their products 46?6 53?2 34?2 145?8 200?0 833 66?9 69?6 51?3 62?5 163?4 219?9Fruit, fresh and processed 216?5 148?8 198?6 493?5 666?0 1181 94?9 228?2 143?8 206?0 499?7 681?6
Citrus fruit, fresh 49?4 86?9 2?0 222?7 381?6 636 51?1 96?8 101?0 60?7 303?3 (440?0)Exotic fruit, fresh 16?8 27?8 0?0 66?7 125?0 493 39?6 42?3 29?5 33?3 100?0 (150?0)Other fruit, fresh 147?6 128?9 126?3 401?7 555?3 1069 85?9 171?9 123?2 150?0 418?0 564?0Nuts, seeds, olives and their products, dried fruit 2?5 6?3 0?0 13?3 30?8 333 26?7 9?4 9?1 7?4 26?0 (51?7)Other processed fruit (in syrup, in puree, etc.) 0?2 2?4 0?0 0?0 0?6 16 1?3 13?1 17?8 1?3 (50?0) (50?0)
Meat, meat products and substitutes 97?3 52?8 91?4 190?1 252?0 1231 98?9 98?4 52?1 92?6 190?8 252?0Beef and veal, not preserved, excl. offal 38?0 37?6 33?3 108?8 156?6 908 72?9 52?1 34?7 41?5 117?7 179?3Pork, not preserved, excl. offal 11?6 23?6 0?0 58?3 96?9 368 29?6 39?1 28?5 37?6 93?6 (140?2)Poultry and game, not preserved, excl. offal 18?5 27?3 0?0 72?6 103?7 492 39?5 46?8 23?6 39?5 98?9 (122?1)Other meats, not preserved, excl. offal 4?8 16?6 0?0 41?7 82?3 119 9?6 50?7 24?1 41?8 (101?4) (127?1)Ham, salami, sausages and other preserved meats,
excl. offal23?3 23?2 20?0 66?3 98?2 991 79?6 29?3 22?4 23?7 72?0 107?8
Offal, blood and their products 1?0 7?5 0?0 0?0 37?3 35 2?8 36?2 27?0 33?3 (82?3) (128?7)Meat substitutes 0?1 2?1 0?0 0?0 0?0 4 0?3 35?4 10?5 33?3 (50?0) (50?0)
Fish, seafood and their products 44?7 49?2 36?5 142?6 199?0 852 68?4 65?4 46?7 57?5 157?4 214?4Fish and seafood, fresh and frozen 38?7 47?8 15?2 137?2 184?6 680 54?6 70?9 43?6 57?5 158?4 (209?0)Fish and seafood, preserved 6?0 12?4 0?0 31?9 58?4 414 33?3 18?2 15?4 13?5 50?0 (67?1)
Milk, milk products and substitutes 192?9 117?8 183?3 405?0 504?5 1235 99?2 194?5 117?0 184?5 407?5 504?5Milk, milk-based beverages, human milk, infant formula
and substitutes110?5 96?4 112?5 260?9 350?0 993 79?8 138?5 88?1 135?0 277?7 357?1
Yoghurt and fermented milk 26?8 52?4 0?0 125?0 211?7 386 31?0 86?6 60?8 83?3 200?0 (346?7)Cheese and substitutes 54?5 39?0 50?0 123?9 167?5 1202 96?5 56?4 38?3 51?7 124?3 167?5Milk-based desserts and substitutes 1?1 8?7 0?0 5?1 33?3 75 6?0 18?5 30?7 5?1 (60?0) (175?0)
18
CLe
clercq
eta
l.

http://journals.cambridge.org Downloaded: 27 Mar 2009 IP address: 193.60.94.67
S Public Health Nutrition
Table 9 Continued
Total population (n 1245 ) Consumers
Food categories Mean SD Median 95th* 99th* n % Mean SD Median 95th* 99th*
Oils and fats 38?8 14?3 37?7 64?0 78?0 1245 100?0 38?8 14?3 37?7 64?0 78?0Olive oil 31?4 12?4 30?2 52?6 63?2 1245 100?0 31?4 12?4 30?2 52?6 63?2Other vegetable oils 2?6 3?7 0?0 9?4 14?5 553 44?4 5?9 3?5 6?1 12?0 (16?8)Butter and creams 3?9 7?0 0?0 16?4 31?5 569 45?7 8?5 8?1 6?1 23?9 (42?2)Other fats 0?8 2?6 0?0 5?3 12?2 219 17?6 4?8 4?3 3?4 14?0 (16?8)
Eggs 18?7 21?5 11?5 61?0 89?9 906 72?8 25?7 21?3 19?9 67?5 94?0Alcoholic beverages and substitutes 58?2 95?0 0?1 253?3 406?7 895 71?9 80?9 103?6 40?1 293?3 480?0
Regular wine and substitutes 38?4 68?7 0?0 200?0 266?7 820 65?9 58?3 77?4 20?1 220?0 293?3Beer, cider and substitutes 17?9 55?2 0?0 133?3 266?7 200 16?1 111?6 92?3 80?0 276?7 (441?7)Sweet wine, spumante, wine-based appetizers,
spirits and liquors1?8 8?5 0?0 13?3 40?1 156 12?5 14?5 20?0 1?5 (53?3) (80?0)
Sweet products and substitutes 31?2 29?9 22?8 87?7 143?8 1166 93?7 33?3 29?7 24?5 89?9 144?4Ice cream, ice lolly and substitutes 8?8 22?8 0?0 58?3 113?3 253 20?3 43?4 32?4 33?3 113?3 (166?7)Chocolate and substitutes 2?0 6?0 0?0 11?7 30?7 253 20?3 9?8 10?1 6?7 30?7 (51?1)Candies, jam and other sweet products (incl. sugar-free) 3?6 8?0 0?0 20?0 37?3 366 29?4 12?1 10?8 9?9 31?6 (47?7)Sugar, fructose, honey and other nutritious sweeteners 16?3 13?9 13?9 42?7 61?2 1074 86?3 18?9 13?2 16?0 45?3 61?3Cocoa and cocoa-based powder 0?5 2?4 0?0 2?6 12?1 101 8?1 5?9 6?2 4?6 (17?0) (21?7)Artificial sweeteners 0?1 0?4 0?0 0?1 2?3 72 5?8 1?2 1?1 0?8 (4?2) (4?7)
Meal substitutes 0?0 0?7 0?0 0?0 0?0 1 0?1 26?0 – 26?0 (26?0) (26?0)Water and other non-alcoholic beverages 882?6 423?9 812?2 1680?0 2195?8 1245 100?0 882?6 423?9 812?2 1680?0 2195?8
Tap water (as such, in beverages or recipes) 192?9 308?3 53?3 893?3 1333?3 678 54?5 354?2 342?6 250?0 1053?3 (1485?4)Bottled water 498?1 429?4 480?0 1246?7 1900?0 984 79?0 630?2 387?3 586?7 1346?7 1946?7Coffee, tea, herbal tea and substitutes 138?3 113?3 115?8 355?0 536?7 1188 95?4 144?9 111?7 120?0 360?8 540?0Fruit and vegetable juices 29?7 68?0 1?5 170?0 309?7 698 56?1 52?9 83?8 6?8 203?5 (334?8)Other soft drinks 23?7 61?6 0?0 141?7 266?7 259 20?8 113?9 89?5 106?7 266?7 (480?0)
Miscellaneous 3?3 3?9 2?4 10?6 17?3 982 78?9 4?2 3?9 2?9 11?2 20?4
Total amount of foods and beverages- 2087?2 587?1 2039?3 3133?8 3607?7 1245 100?0 2087?2 587?1 2039?3 3133?8 3607?7Total amount of liquid foods 1053?8 430?5 990?8 1912?0 2375?3 1245 100?0 1053?8 430?5 990?8 1912?0 2375?3Total amount of solid foods 1033?9 278?7 1029?1 1459?3 1846?2 1245 100?0 1033?9 278?7 1029?1 1459?3 1846?2
*High percentiles of consumption assessed on the basis of a 3 d survey provide an overestimate of long-term high levels of consumption. Values are enclosed in parentheses when the number of subjects to which theyrefer is lower than 160 and 800 for the 95th and 99th percentile, respectively, since these values bear a large uncertainty and provide only a rough indication of high levels of consumption.-All beverages and milk in liquid state were classified as liquid foods; all other items were classified as solid foods.
ItalianN
ational
Food
Consu
mptio
nSu
rvey
19

http://journals.cambridge.org Downloaded: 27 Mar 2009 IP address: 193.60.94.67
S Public Health Nutrition
Table 10 Mean, standard deviation, median and high percentiles of individual daily consumption (3 d average) by food category in the total population and in consumers (g/d) – elderly ($65years), males: Italian National Food Consumption Survey INRAN-SCAI 2005–06
Total population (n 202) Consumers
Food categories Mean SD Median 95th* 99th* n % Mean SD Median 95th* 99th*
Cereals, cereal products and substitutes 283?2 101?7 269?9 466?0 (597?4) 202 100?0 283?2 101?7 269?9 466?0 (597?4)Bread 137?6 90?8 120?0 298?9 (447?6) 195 96?5 142?5 88?5 120?0 300?0 (455?0)Pasta and pasta substitutes 61?1 31?1 61?2 109?6 (129?8) 192 95?0 64?3 28?5 62?7 116?5 (131?2)Pizza 4?6 17?5 0?0 33?3 (112?5) 18 8?9 51?9 31?9 39?6 (116?7) (116?7)Rice 17?2 25?1 0?0 67?8 (97?1) 90 44?6 38?7 24?2 33?9 (86?8) (156?6)Wheat, other cereals and flours 27?2 30?4 16?9 79?3 (109?9) 158 78?2 34?8 30?4 28?0 (87?7) (167?7)Breakfast cereals 0?5 3?3 0?0 0?0 (21?0) 6 3?0 17?6 8?3 17?5 (30?0) (30?0)Biscuits 10?4 18?9 0?0 50?7 (73?7) 84 41?6 24?9 22?3 18?7 (63?3) (133?3)Savoury fine bakery products 10?3 18?7 0?0 40?0 (100?0) 81 40?1 25?6 21?8 16?7 (72?0) (108?3)Cakes and sweet snacks 14?3 28?9 0?0 62?5 (114?6) 56 27?7 51?6 33?0 41?7 (114?6) (208?3)
Pulses, fresh and processed 14?1 27?5 0?0 59?7 (133?7) 80 39?6 35?6 33?9 23?2 (79?7) (205?0)Vegetables, fresh and processed 243?5 120?8 221?9 440?8 (605?2) 202 100?0 243?5 120?8 221?9 440?8 (605?2)
Leafy vegetables, fresh 57?2 68?8 38?7 178?6 (243?3) 184 91?1 62?8 69?6 41?7 181?0 (261?6)Tomatoes, fresh 41?5 44?4 30?3 122?3 (167?6) 164 81?2 51?1 43?9 39?5 133?3 (253?1)Other fruiting vegetables, fresh 32?0 52?0 7?5 153?7 (194?0) 145 71?8 44?6 56?7 20?0 (167?4) (206?0)Roots and onions, fresh 23?9 24?2 15?1 77?6 (99?8) 201 99?5 24?1 24?2 15?3 77?6 (99?8)Other vegetables, fresh 45?0 49?3 28?9 148?8 (185?8) 175 86?6 51?9 49?4 42?6 153?2 (231?1)Vegetables, processed 41?7 36?9 37?8 110?7 (154?6) 166 82?2 50?8 34?6 41?7 118?1 (191?7)Spices and herbs 2?2 3?2 1?2 6?7 (12?8) 171 84?7 2?5 3?4 1?6 7?4 (23?9)
Potatoes, tubers and their products 61?3 57?1 56?6 165?1 (222?3) 155 76?7 79?9 52?5 65?4 (166?1) (232?8)Fruit, fresh and processed 260?3 193?9 241?1 519?3 (996?7) 195 96?5 269?7 190?8 244?7 522?7 (1384?0)
Citrus fruit, fresh 52?0 84?4 2?0 242?7 (368?0) 107 53?0 98?2 94?6 60?7 (303?3) (384?7)Exotic fruit, fresh 14?3 27?0 0?0 66?7 (117?9) 69 34?2 41?9 31?3 33?3 (100?0) (166?7)Other fruit, fresh 189?3 181?0 150?0 460?0 (908?0) 180 89?1 212?4 178?4 168?8 482?2 (996?7)Nuts, seeds, olives and their products, dried fruit 3?7 10?6 0?0 19?7 (42?3) 58 28?7 12?8 16?6 7?4 (42?3) (112?0)Other processed fruit (in syrup, in puree, etc.) 1?0 9?8 0?0 0?0 (25?0) 5 2?5 41?4 52?3 25?0 (126?7) (126?7)
Meat, meat products and substitutes 117?8 62?3 113?9 225?2 (265?8) 202 100?0 117?8 62?3 113?9 225?2 (265?8)Beef and veal, not preserved, excl. offal 51?9 44?5 43?0 136?0 (169?6) 157 77?7 66?8 39?3 62?2 (145?2) (184?8)Pork, not preserved, excl. offal 11?5 24?5 0?0 46?9 (121?7) 71 35?1 32?6 32?0 25?0 (82?1) (195?9)Poultry and game, not preserved, excl. offal 20?5 30?7 0?0 83?3 (114?2) 79 39?1 52?4 27?1 48?8 (111?2) (168?7)Other meats, not preserved, excl. offal 7?2 24?0 0?0 52?0 (131?6) 22 10?9 66?3 37?4 51?3 (131?6) (134?3)Ham, salami, sausages and other preserved meats,
excl. offal24?7 24?3 20?0 71?2 (104?2) 162 80?2 30?7 23?5 26?5 73?7 (107?9)
Offal, blood and their products 1?9 9?9 0?0 0?0 (57?5) 10 5?0 38?6 24?7 35?3 (83?3) (83?3)Meat substitutes 0?1 1?8 0?0 0?0 (0?0) 1 0?5 25?0 – 25?0 (25?0) (25?0)
Fish, seafood and their products 48?0 52?0 37?5 150?0 (201?2) 144 71?3 67?4 49?9 57?2 (165?1) (206?7)Fish and seafood, fresh and frozen 42?2 51?0 30?0 141?9 (200?3) 121 59?9 70?5 48?4 57?5 (150?0) (201?2)Fish and seafood, preserved 5?8 11?5 0?0 31?3 (45?2) 60 29?7 19?5 13?4 17?8 (45?1) (52?1)
Milk, milk products and substitutes 188?0 129?0 176?7 405?7 (568?3) 200 99?0 189?8 128?2 178?0 412?8 (581?7)Milk, milk-based beverages, human milk, infant formula
and substitutes119?7 110?5 112?5 281?9 (407?5) 158 78?2 153?0 102?4 150?0 (323?7) (500?0)
Yoghurt and fermented milk 10?6 31?0 0?0 83?3 (125?0) 26 12?9 82?4 39?9 83?3 (125?0) (150?0)Cheese and substitutes 57?0 39?9 51?7 133?0 (170?7) 195 96?5 59?0 39?1 52?5 134?8 (181?1)Milk-based desserts and substitutes 0?7 4?8 0?0 0?0 (31?3) 8 4?0 17?9 17?3 7?6 (50?0) (50?0)
20
CLe
clercq
eta
l.

http://journals.cambridge.org Downloaded: 27 Mar 2009 IP address: 193.60.94.67
S Public Health Nutrition
Table 10 Continued
Total population (n 202) Consumers
Food categories Mean SD Median 95th* 99th* n % Mean SD Median 95th* 99th*
Oils and fats 43?8 15?6 43?8 67?8 (90?2) 202 100?0 43?8 15?6 43?8 67?8 (90?2)Olive oil 37?9 14?7 36?9 62?2 (72?9) 202 100?0 37?9 14?7 36?9 62?2 (72?9)Other vegetable oils 1?6 3?6 0?0 7?3 (15?0) 52 25?7 6?2 4?6 5?0 (15?0) (30?0)Butter and creams 3?9 5?9 0?0 16?0 (23?7) 99 49?0 7?9 6?3 6?3 (20?5) (34?6)Other fats 0?4 1?6 0?0 3?3 (6?7) 21 10?4 4?2 3?1 3?3 (10?7) (13?1)
Eggs 23?2 26?5 16?6 72?2 (114?6) 151 74?8 31?1 26?4 23?3 (80?1) (133?7)Alcoholic beverages and substitutes 177?7 172?9 160?0 480?0 (666?8) 177 87?6 202?9 170?3 180?0 560?0 (680?1)
Regular wine and substitutes 164?2 158?7 160?0 480?0 (560?0) 174 86?1 190?6 155?6 166?7 480?0 (600?0)Beer, cider and substitutes 12?1 47?0 0?0 110?0 (220?0) 17 8?4 143?8 87?6 133?3 (400?0) (400?0)Sweet wine, spumante, wine-based appetizers,
spirits and liquors1?4 6?3 0?0 13?3 (40?0) 26 12?9 11?1 14?5 3?8 (40?0) (40?0)
Sweet products and substitutes 28?9 29?8 22?8 82?3 (143?3) 183 90?6 31?9 29?7 24?5 82?7 (174?7)Ice cream, ice lolly and substitutes 5?3 21?3 0?0 33?3 (100?0) 20 9?9 53?7 45?5 33?3 (172?9) (179?2)Chocolate and substitutes 1?0 3?4 0?0 6?0 (16?7) 29 14?4 6?9 6?6 4?2 (18?0) (33?3)Candies, jam and other sweet products (incl. sugar-free) 3?6 10?6 0?0 25?7 (46?7) 37 18?3 19?7 17?3 15?0 (63?3) (72?9)Sugar, fructose, honey and other nutritious sweeteners 18?7 16?9 16?0 46?8 (64?7) 170 84?2 22?2 16?1 18?7 49?6 (77?3)Cocoa and cocoa-based powder 0?2 2?1 0?0 0?0 (5?1) 9 4?5 5?2 8?9 1?9 (28?0) (28?0)Artificial sweeteners 0?1 0?5 0?0 0?1 (2?9) 13 6?4 1?6 1?5 1?3 (4?2) (4?2)
Meal substitutes Not consumed 0 0?0 Not consumedWater and other non-alcoholic beverages 762?2 388?3 722?2 1507?9 (2026?7) 202 100?0 762?2 388?3 722?2 1507?9 (2026?7)
Tap water (as such, in beverages or recipes) 226?5 349?8 95?0 872?1 (1677?9) 126 62?4 363?1 383?0 238?7 (1260?0) (1680?0)Bottled water 383?8 375?1 326?7 1013?3 (1333?3) 140 69?3 553?7 329?6 533?3 (1066?7) (1653?3)Coffee, tea, herbal tea and substitutes 130?1 142?4 100?0 333?3 (540?0) 193 95?5 136?2 142?8 100?0 346?7 (560?0)Fruit and vegetable juices 15?7 50?0 0?0 133?3 (202?9) 92 45?5 34?5 69?8 4?5 (200?0) (466?7)Other soft drinks 6?1 25?4 0?0 53?3 (120?0) 15 7?4 82?7 49?7 53?3 (213?3) (213?3)
Miscellaneous 3?2 4?0 2?2 10?0 (16?0) 159 78?7 4?1 4?1 2?9 (12?0) (20?4)
Total amount of foods and beverages- 2255?7 587?6 2165?3 3231?2 (3817?3) 202 100?0 2255?7 587?6 2165?3 3231?2 (3817?3)Total amount of liquid foods 1061?5 394?9 1010?3 1843?8 (2143?3) 202 100?0 1061?5 394?9 1010?3 1843?8 (2143?3)Total amount of solid foods 1194?2 313?1 1176?0 1662?0 (2230?1) 202 100?0 1194?2 313?1 1176?0 1662?0 (2230?1)
*High percentiles of consumption assessed on the basis of a 3 d survey provide an overestimate of long-term high levels of consumption. Values are enclosed in parentheses when the number of subjects to which theyrefer is lower than 160 and 800 for the 95th and 99th percentile, respectively, since these values bear a large uncertainty and provide only a rough indication of high levels of consumption.-All beverages and milk in liquid state were classified as liquid foods; all other items were classified as solid foods.
ItalianN
ational
Food
Consu
mptio
nSu
rvey
21

http://journals.cambridge.org Downloaded: 27 Mar 2009 IP address: 193.60.94.67
S Public Health Nutrition
Table 11 Mean, standard deviation, median and high percentiles of individual daily consumption (3 d average) by food category in the total population and in consumers (g/d) – elderly ($65years), females: Italian National Food Consumption Survey INRAN-SCAI 2005–06
Total population (n 316) Consumers
Food categories Mean SD Median 95th* 99th* n % Mean SD Median 95th* 99th*
Cereals, cereal products and substitutes 228?3 91?6 220?7 386?9 (519?8) 316 100?0 228?3 91?6 220?7 386?9 (519?8)Bread 102?1 73?6 90?0 240?0 (315?0) 292 92?4 110?5 70?2 90?3 240?0 (320?0)Pasta and pasta substitutes 50?7 28?6 49?9 100?6 (117?4) 294 93?0 54?5 25?9 52?5 100?9 (121?5)Pizza 4?1 17?5 0?0 25?0 (116?7) 25 7?9 52?3 37?6 33?3 (125?0) (150?0)Rice 17?9 30?0 0?0 83?3 (166?7) 136 43?0 41?6 33?2 30?4 (104?2) (166?7)Wheat, other cereals and flours 18?9 22?2 9?8 61?6 (90?0) 232 73?4 25?8 22?2 19?3 64?3 (97?7)Breakfast cereals 0?7 3?9 0?0 0?0 (25?0) 14 4?4 16?9 9?1 15?0 (30?0) (30?0)Biscuits 12?3 16?3 5?2 46?3 (66?7) 163 51?6 23?9 15?4 20?0 53?3 (78?8)Savoury fine bakery products 11?7 18?6 0?0 43?3 (83?3) 147 46?5 25?2 20?1 20?9 (66?7) (102?7)Cakes and sweet snacks 9?7 19?8 0?0 52?1 (83?3) 85 26?9 36?1 22?6 34?1 (73?6) (136?1)
Pulses, fresh and processed 9?9 18?9 0?0 52?5 (77?1) 104 32?9 30?2 21?7 23?2 (73?5) (97?2)Vegetables, fresh and processed 210?6 108?9 192?8 413?7 (499?8) 314 99?4 211?9 107?9 193?8 413?7 (499?8)
Leafy vegetables, fresh 50?8 56?1 33?8 153?6 (263?3) 281 88?9 57?1 56?4 40?5 166?7 (272?2)Tomatoes, fresh 36?6 38?3 25?0 116?3 (149?0) 244 77?2 47?4 37?2 39?1 117?7 (150?0)Other fruiting vegetables, fresh 32?4 50?0 8?1 147?0 (231?3) 200 63?3 51?2 54?7 34?3 172?5 (249?7)Roots and onions, fresh 20?8 24?5 11?6 77?6 (108?8) 308 97?5 21?3 24?6 12?4 77?6 (108?8)Other vegetables, fresh 36?9 48?9 15?8 131?4 (229?2) 264 83?5 44?2 50?4 26?2 141?3 (235?3)Vegetables, processed 31?5 29?6 31?5 84?0 (128?9) 240 75?9 41?4 27?2 33?4 92?8 (137?1)Spices and Hherbs 1?6 2?6 0?8 6?1 (8?9) 248 78?5 2?1 2?8 1?2 6?5 (8?9)
Potatoes, tubers and their products 50?8 55?0 41?5 155?8 (238?3) 228 72?2 70?3 53?1 58?6 166?7 (244?7)Fruit, fresh and processed 268?3 165?9 241?6 564?0 (753?3) 305 96?5 278?0 160?7 250?0 564?0 (753?3)
Citrus fruit, fresh 54?5 97?2 0?0 242?7 (421?3) 156 49?4 110?4 113?9 68?7 (366?0) (640?0)Exotic fruit, fresh 11?9 22?2 0?0 66?7 (100?0) 96 30?4 39?0 23?6 33?3 (100?0) (106?7)Other fruit, fresh 199?7 150?5 168?0 476?0 (695?3) 290 91?8 217?7 144?2 178?7 489?3 (723?0)Nuts, seeds, olives and their products, dried fruit 2?2 6?5 0?0 13?3 (21?4) 72 22?8 9?7 10?7 7?4 (21?4) (64?0)Other processed fruit (in syrup, in puree, etc.) 0?0 0?1 0?0 0?0 (0?0) 3 0?9 1?3 0?6 1?3 (1?9) (1?9)
Meat, meat products and substitutes 88?0 46?0 83?2 171?6 (224?9) 308 97?5 90?3 44?3 84?2 171?6 (224?9)Beef and veal, not preserved, excl. offal 35?2 31?6 33?3 96?9 (124?1) 228 72?2 48?8 26?8 41?9 99?0 (133?0)Pork, not preserved, excl. offal 7?2 16?4 0?0 46?9 (58?6) 76 24?1 30?0 21?0 33?5 (58?6) (93?8)Poultry and game, not preserved, excl. offal 22?0 28?8 0?0 83?4 (103?7) 145 45?9 47?9 23?8 38?9 (98?9) (135?4)Other meats, not preserved, excl. offal 5?2 18?5 0?0 49?4 (105?2) 29 9?2 57?0 28?6 49?4 (115?2) (120?8)Ham, salami, sausages and other preserved meats,
excl. offal17?6 20?4 13?3 58?7 (91?7) 218 69?0 25?6 20?0 20?0 71?8 (100?0)
Offal, blood and their products 0?7 4?9 0?0 0?0 (25?0) 8 2?5 25?8 18?0 25?0 (50?0) (50?0)Meat substitutes 0?1 1?9 0?0 0?0 (0?0) 1 0?3 33?3 – 33?3 (33?3) (33?3)
Fish, seafood and their products 32?9 39?6 16?7 110?0 (137?7) 185 58?5 56?2 37?1 50?0 120?9 (200?3)Fish and seafood, fresh and frozen 28?6 37?8 0?0 108?0 (132?0) 152 48?1 59?5 33?6 50?0 (120?9) (196?3)Fish and seafood, preserved 4?3 9?8 0?0 26?5 (47?8) 78 24?7 17?4 12?8 16?7 (47?8) (58?4)
Milk, milk products and substitutes 199?6 125?4 195?0 421?1 (480?1) 313 99?1 201?5 124?4 196?3 421?1 (480?1)Milk, milk-based beverages, human milk, infant formula
and substitutes129?9 106?0 135?0 314?0 (377?6) 254 80?4 161?6 94?0 165?0 330?0 (395?4)
Yoghurt and fermented milk 18?9 48?5 0?0 125?0 (166?7) 68 21?5 87?9 69?9 83?3 (166?7) (531?7)Cheese and substitutes 49?9 40?1 42?6 122?2 (171?2) 305 96?5 51?7 39?7 43?7 122?2 (171?2)Milk-based desserts and substitutes 0?9 6?7 0?0 0?0 (33?3) 10 3?2 27?8 26?9 20?8 (83?3) (83?3)
22
CLe
clercq
eta
l.

http://journals.cambridge.org Downloaded: 27 Mar 2009 IP address: 193.60.94.67
S Public Health Nutrition
Table 11 Continued
Total population (n 316) Consumers
Food categories Mean SD Median 95th* 99th* n % Mean SD Median 95th* 99th*
Oils and fats 34?3 14?1 31?9 59?3 (77?9) 315 99?7 34?4 14?0 32?0 59?3 (77?9)Olive oil 29?3 12??4 28?2 51?9 (62?8) 315 99?7 29?4 12?3 28?2 51?9 (62?8)Other vegetable oils 0?9 2?5 0?0 6?1 (10?0) 55 17?4 5?4 3?5 4?7 (10?0) (25?5)Butter and creams 3?6 5?8 0?0 15?6 (25?6) 146 46?2 7?8 6?4 5?7 (21?3) (30?6)Other fats 0?4 2?1 0?0 2?7 (12?2) 24 7?6 5?7 5?2 2?8 (16?0) (16?4)
Eggs 18?8 19?7 13?1 54?3 (71?6) 224 70?9 26?5 18?5 20?4 58?6 (77?7)Alcoholic beverages and substitutes 60?2 98?1 0?0 240?1 (420?0) 210 66?5 90?6 108?4 60?0 300?0 (453?3)
Regular wine and substitutes 56?6 95?5 0?0 240?1 (420?0) 203 64?2 88?1 106?9 60?0 280?0 (453?3)Beer, cider and substitutes 3?2 20?7 0?0 0?0 (110?0) 9 2?8 110?7 59?1 110?0 (240?0) (240?0)Sweet wine, spumante, wine-based appetizers,
spirits and liquors0?4 2?9 0?0 0?1 (13?3) 23 7?3 5?6 9?4 0?7 (16?7) (40?0)
Sweet products and substitutes 26?8 26?1 21?2 81?8 (121?7) 281 88?9 30?2 25?7 24?0 82?3 (127?7)Ice cream, ice lolly and substitutes 5?8 18?7 0?0 44?0 (83?3) 39 12?3 47?0 30?0 33?3 (123?3) (153?3)Chocolate and substitutes 0?9 5?1 0?0 5?1 (17?4) 34 10?8 8?4 13?6 4?3 (26?5) (78?0)Candies, jam and other sweet products
(incl. sugar-free)2?9 7?5 0?0 20?0 (33?3) 74 23?4 12?4 11?0 9?7 (33?3) (50?0)
Sugar, fructose, honey and other nutritioussweeteners
16?8 14?1 16?0 40?0 (61?3) 257 81?3 20?6 12?8 18?7 44?0 (64?3)
Cocoa and cocoa-based powder 0?4 2?0 0?0 0?8 (11?1) 18 5?7 7?0 5?2 5?8 (19?3) (19?3)Artificial sweeteners 0?0 0?3 0?0 0?1 (1?3) 21 6?6 0?7 0?7 0?4 (2?0) (2?5)
Meal substitutes Not consumed 0 0?0Water and other non-alcoholic beverages 807?9 339?2 771?1 1450?0 (1864?4) 316 100?0 807?9 339?2 771?1 1450?0 (1864?4)
Tap water (as such, in beverages or recipes) 267?9 329?9 142?5 949?3 (1405?0) 221 69?9 383?1 333?9 285?0 1013?3 (1440?0)Bottled water 374?9 353?0 360?0 960?0 (1280?0) 213 67?4 556?2 289?5 533?3 1120?0 (1333?3)Coffee, tea, herbal tea and substitutes 130?3 111?3 102?5 360?0 (500?0) 296 93?7 139?1 109?6 112?5 365?0 (506?7)Fruit and vegetable juices 26?3 67?5 0?0 166?7 (268?8) 150 47?5 55?5 89?5 8?0 (250?0) (473?1)Other soft drinks 8?5 41?3 0?0 53?3 (240?0) 20 6?3 134?2 102?9 106?7 (353?3) (386?7)
Miscellaneous 2?6 3?3 1?3 8?4 (15?3) 259 82?0 3?2 3?4 2?3 8?6 (19?5)
Total amount of foods and beverages- 2039?6 521?9 2011?5 3028?5 (3302?6) 316 100?0 2039?6 521?9 2011?5 3028?5 (3302?6)Total amount of liquid foods 1000?0 354?2 963?6 1683?7 (2058?7) 316 100?0 1000?0 354?2 963?6 1683?7 (2058?7)Total amount of solid foods 1039?2 293?7 1012?2 1551?7 (1895?1) 316 100?0 1039?2 293?7 1012?2 1551?7 (1895?1)
*High percentiles of consumption assessed on the basis of a 3 d survey provide an overestimate of long-term high levels of consumption. Values are enclosed in parentheses when the number of subjects to which theyrefer is lower than 160 and 800 for the 95th and 99th percentile, respectively, since these values bear a large uncertainty and provide only a rough indication of high levels of consumption.-All beverages and milk in liquid state were classified as liquid foods; all other items were classified as solid foods.
ItalianN
ational
Food
Consu
mptio
nSu
rvey
23

http://journals.cambridge.org Downloaded: 27 Mar 2009 IP address: 193.60.94.67
under-reporting. Individual dietary surveys conducted in
European countries from 1980 to 2001 show participation
rates varying from 36 % to 86 %(13). More recent surveys
performed among adults in Ireland(14), The Nether-
lands(15) and the UK(16) showed a participation rate of
respectively 63 %, 42 % and 63 %.
The low participation rate could have affected the
representativity of the study sample. However, the low
percentage of subjects who declared to follow a specific diet
during the food survey (6%) suggests that no important
selection of health-conscious subjects occurred. Moreover,
the distribution in age and sex classes compares well with
the segmentation of the Italian population in 2006 as
described by ISTAT(17). Females are slightly over-repre-
sented (55% v. 51% according to ISTAT), whereas children
aged less than 3 years of age (2% v. 4% according to ISTAT)
and elderly subjects (16% v. 20% according to ISTAT) are
slightly under-represented. The education level of the study
sample is high, with 56% of subjects aged 11 years or more
having a high school or university degree v. 35% the Italian
population as described by ISTAT(18).
Dietary assessment technique
The INRAN-DIARIO3.1(9) management system permitted
a multi-operator data entry and food codification and at
the same time ensured reliable data and a high level of
standardization of the field workers’ procedures.
The fact that the field workers met each subject three
times and carefully checked every single entry helped to
reduce errors such as misreporting and omissions. How-
ever, comparison of mean EI:BMRest with the cut-off
values derived by Goldberg et al.(19) for adults (99?7 %
confidence interval) suggests that a certain level of under-
reporting occurred in this sample and in particular in
males. It is noteworthy that these cut-off values are based
on the assumption of a PAL of 1?55, which includes
desirable physical activity for sedentary adults(10). It may
therefore overestimate effective PAL of the adult Italian
population. Moreover, EI:BMRest was lower in adult
males, where a higher proportion of obese subjects were
found. This may be due to the notorious higher degree of
under-reporting in obese individuals but also to an
overestimate of their BMR, leading to an overestimate of
under-reporting. In fact, BMRest based on current body
weight may overestimate true BMR in obese individuals
since fat body mass is less metabolically active.
No cut-off values for EI:BMRest are available in the lit-
erature for the other age classes of the study sample. The
observed EI:EE in elderly males and in infants, children
and teenagers of both sexes ranged from 0?98 to 1?04
SPublic
Hea
lth
Nutr
itio
n
Males Females
Elderly(65 years and above)
Adults(18–64·9 years)
Teenagers(10–17·9 years)
Children(3–9·9 years)
Infants(0–2·9 years)
0 10 20 30 40 50 60 70 80 90 100%
0 10 20 30 40 50 60 70 80 90 100%
Alcoholic beverages and substitutesEggsPulses, fresh and processedSweet products and substitutesOils and fats
Potatoes, tubers and their productsFish, seafood and their productsVegetables, fresh and processedMeat, meat products and substitutes
Fruit, fresh and processedCereals, cereal products and substitutesWater and other non-alcoholic beveragesMilk, milk products and substitutes
Fig. 2 Consumption pattern by age and sex: percentage contribution (in weight) of each food category* to the total amount of foodand beverages in the Italian National Food Consumption Survey INRAN-SCAI 2005–06.*The contribution of ‘Meal substitutes’ and of ‘Miscellaneous’ is not reported. It was less than 0?2 % in all age and sex classes.Statistically significant differences (P , 0?05; Kruskal–Wallis test) were found among age classes in all reported food categories,except for ‘Fish, seafood and their products’ in males and for ‘Pulses, fresh and processed’ in males and females. Statisticallysignificant differences between sex (P , 0?05; Kruskal–Wallis test) were found only among adults and the elderly: in adults for‘Cereals, cereals products and substitutes’, ‘Fruit, fresh and processed’, ‘Meat, meat products and substitutes’, ‘Milk, milk productsand substitutes’, ‘Oils and fats’, ‘Alcoholic beverages and substitutes’, ‘Eggs’ and ‘Water and other non alcoholic beverages’; in theelderly for ‘Cereals, cereals products and substitutes’, ‘Fruit, fresh and processed’, ‘Meat, meat products and substitutes’, ‘Fish,seafood and their products’, ‘Milk, milk products and substitutes’, ‘Oils and fats’, ‘Alcoholic beverages and substitutes’ and ‘Waterand other non-alcoholic beverages’
24 C Leclercq et al.

http://journals.cambridge.org Downloaded: 27 Mar 2009 IP address: 193.60.94.67
(Table 2), suggesting that no gross under-reporting
occurred in these groups. The highest apparent level of
under-reporting was in adult males and females and in
elderly females.
In the absence of information on the individual activity
level of subjects that would allow us to identify under-
reporters, no subject was excluded from further analysis. The
same decision was taken in the national survey conducted
in Ireland in 1997–99(20), in which a comparable mean
EI:BMRest was observed in adult males and females (1?38).
Food classification
A detailed list of food items included in each category is
provided in the Appendix to ensure a correct interpreta-
tion of data.
A number of cereal products such as plain pizza with
tomato and biscuits were classified as cereal products,
whereas they also contain other ingredients (fats, eggs,
tomatoes, sugar, etc.). Other cereal products (e.g. pizza
with a variety of ingredients, most cakes, some fresh pasta
and gnocchi) were handled as recipes and disaggregated
into flour and other ingredients. Therefore, consumption
values reported in the subcategories ‘Pizza’, ‘Pasta’ and
‘Cakes and sweet snacks’ are underestimates. On the
other hand, when food items are classified in a sub-
category such as ‘Biscuits’, this leads to an underestimate
of the consumption of single ingredients such as flour and
sugar in their respective food categories.
The subcategory ‘Sugar’ is related to discretionary sugar
(e.g. added by the respondents in coffee) plus sugar from
home-made recipes. It does not include sugar present in
composite foods such as soft drinks.
Data reported in the category ‘Oils and fats’ include
discretionary fats added in a large number of recipes but
do not include fats present in a number of composite
foods. In Italy, each recipe is traditionally prepared with
one specific fat: risotto would be prepared with butter,
whereas most sauces used with pasta would be prepared
with olive oil. Subjects were asked to report the main
ingredients of the recipes on the diaries and standard
recipes would generally be used. The proportion of olive
oil among vegetable oils in the present survey (93 %)
has probably been slightly overestimated. According to
data from the Institute for Agricultural Market Studies
(ISMEA)(21), in the year 2004, olive oil represented 84 % of
the total household purchases of vegetable fats in Italy.
Food consumption pattern
Detailed analyses of the present survey in relation to
public health nutrition issues will be performed in the
future. As a first step, some of the results can be com-
pared with those population goals established for the
prevention of chronic diseases which are expressed in
terms of food.
The overall individual consumption of fruit and vege-
tables in the whole study sample was 208g/d and 210g/d,
respectively, meeting the minimum population goal of 400g
of fruit and vegetables daily established by FAO/WHO(22).
A goal was recently set for the population average
consumption of red meat (beef, pork, lamb and goat from
domesticated animals, including that contained in pro-
cessed foods): it should be less than 300 g/week as
cooked meat (approximately 400–450 g as raw weight)
for the prevention of colorectal cancer(23). Overall con-
sumption of red meat in the study sample was obtained
by adding up fresh beef and veal (42?7 g/d), fresh pork
(12?7 g/d), other red meats such as lamb and horse
( ,5 g/d) and preserved pork and beef (28 g/d, corre-
sponding to approximately 40 g of raw weight). Overall,
the estimated consumption of red meat as raw weight
was approximately 700 g/week in the study sample, i.e.
significantly higher than the goal.
Choice of descriptive statistics
Food consumption data are often used to characterize
average and high levels of consumption within the
population. In the case of food categories which are
rarely consumed (either consumed by a limited number
of individuals in the population or consumed infrequently
by all individuals), due to the large number of non-con-
sumers, very low mean values are obtained and the
median can be 0. It is therefore important to complement
the description of food consumption with that of con-
sumption in the selected sample of ‘consumers’ only.
High levels of consumption were described by pro-
viding the 95th and the 99th percentile of the distribution,
both in the total population and in consumers only. High
percentiles are often needed to estimate dietary exposure
to a specific chemical or agent present in food within the
process of risk analysis, but caution is needed in the
interpretation and use of data due to the short duration of
the survey (3 d). In fact, the observed high percentiles of
consumption provide an overestimate of long-term high
levels of consumption for many food categories whereas
the percentage of consumers provides an underestimate
of the long-term percentage of consumers.
The reliability of high percentiles is related to the
number of subjects used to calculate them. According to
Kroes et al.(24), a high percentile P (expressed as fraction)
can be assessed with sufficient precision if the sample size
n satisfies the rule n (12P) $ 8. Thus, in Tables 3–11, high
percentiles are reported in parentheses when the number
of subjects was lower than 160 (for the 95th percentile) or
lower than 800 (for the 99th percentile) to spot the high
percentile values which bear a high uncertainty.
Conclusion
The present paper provides the main results of the Italian
National Food Consumption Survey INRAN-SCAI 2005–06
for use both at national and international level. The data-
base obtained from this survey will be the key reference for
SPublic
Hea
lth
Nutr
itio
nItalian National Food Consumption Survey 25

http://journals.cambridge.org Downloaded: 27 Mar 2009 IP address: 193.60.94.67
Italian food consumption in the coming years and will be
utilized for a variety of purposes including the assessment of
nutrient intake and risk analysis.
Some specific aspects of the Italian food consumption
pattern are confirmed: a very large contribution from
olive oil to fats, a large contribution from wine to alco-
holic beverages and a large contribution from bread,
pasta and pizza to cereals. The observed high level of
consumption of red meat deserves attention.
Acknowledgements
Sources of funding: The INRAN-SCAI 2005–06 survey
was funded by the Italian Ministry of Agriculture, project
‘Qualita alimentare’. Conflict of interest declaration: The
authors declare that they have no conflicts of interest.
Authorship responsibilities: A.T. was the coordinator of
INRAN-SCAI 2005–06; C.L. was responsible for the data
management system of food diaries and wrote the
manuscript; D.A. was responsible for the design of the
dietary survey; R.P. was responsible for the management
of diaries; S.S. carried out the descriptive data analyses;
and C.L.D. developed the dietary assessment tools. All
co-authors were involved in the interpretation of results
and manuscript revision, and all co-authors approved
the final version. The whole INRAN-SCAI 2005–06
Study Group was involved in the preparation of dietary
assessment tools, in the training and day-to-day support
of field workers, in the data checking and in updating the
databases. Acknowledgments: The authors are most
thankful to the Italian households who participated to the
study and to the field workers: C. Aceto, A. Amoroso,
L. Berardini, A. Bertolini, F. Bozzo, M.T. Caprile, E. Cravea,
F. Del Greco, N. Donati, P. Gasperoni, R. Gaviglia, T.
Gaviglia, E. Giorgeri, R. Ienco, E. Innocenti, U. Margiotta,
E. Milesi, S. Mollichelli, E. Moratti, S. Notarnicola, G.
Parrino, M. Pasi, R. Pastorini, E. Perrelli, P. Perrucci,
C. Sedini, S. Silvestri, F. Simonetti, P. Succi, J. Tabacchi
and P. Zaganelli. The authors also express their gratitude
to Ager-Agro Ambiente Italia and in particular to G.
Massimiliani and E. Sauda for the very positive colla-
boration. The great competence and availability of D.
Berardi (DASC sas) who developed the data management
system was highly appreciated. P. Buonocore was helpful
in the preparation of the manuscript.
References
1. Istituto di Servizi per il Mercato Agricolo Alimentare (2007)Consumi Extra Domestici dei prodotti alimentari: Indagine
qualitativa II semestre 2006. Rome: ISMEA; available athttp://www.ismea.it/flex/cm/pages/ServeBLOB.php/L/IT/IDPagina/2064
2. Branca F, Nikogosian H & Lobstein T (editors) (2007) TheChallenge of Obesity in the WHO European Region
and Strategies for Response. Copenhagen: WHO Regional
Office for Europe; available at http://www.euro.who.int/document/E90711.pdf
3. Saba A, Turrini A, Mistura G, Cialfa E & Vichi M (1990)Indagine nazionale sui consumi alimentari delle famiglie1980–84: alcuni principali risultati (Nation-wide survey onItalian households food consumption 1980–84: mainresults). J It Soc Food Sci 19, 53–65.
4. Turrini A, Saba A, Perrone D, Cialfa E & D’Amicis A (2001)Food consumption patterns in Italy: the INN-CA Study1994–96. Eur J Clin Nutr 55, 571–588.
5. Istituto Nazionale di Statistica (2001) 148 CensimentoGenerale della Popolazione e delle Abitazioni del 2001.Rome: ISTAT; available at http://dawinci.istat.it/MD/
6. Leclercq C, Berardi D, Sorbillo MR & Lambe J (1999) Intakeof saccharin, aspartame, acesulfame K and cyclamate inItalian teenagers: present levels and projections. FoodAddit Contam 16, 99–109.
7. Leclercq C, Piccinelli R, Arcella D & Le Donne C (2004)Food consumption and nutrient intake in a sample ofItalian secondary school students. Results from the INRAN-RM-2001 food survey. Int J Food Sci Nutr 55, 265–277.
8. Van Kappel AL, Amoyel J, Slimani N, Vozar B & Riboli E(1994) EPIC-SOFT Picture Book For Estimating PortionSizes. Lyon: IARC Press.
9. Le Donne C, Arcella D, Piccinelli R, Sette S, Berardi D,Leclercq C (2006) Benefits of the use of a multi-operatordata management system for the collection of consumptiondata through food diaries. Sixth International Conferenceon Dietary Assessment Methods, Copenhagen, 27–29 April2006. Book of Abstracts, p. 121, P12-07. http://www.icdam6.dk/filer/Abstracts.pdf (accessed July 2008).
10. Commission of the European Communities (1993) Nutrientand Energy Intakes for the European Community (opinionexpressed on 11 December 1992). Report of the ScientificCommittee for Food Thirty-first series. Luxembourg: Officefor Official Publications of the European Communities;available at http://ec.europa.eu/food/fs/sc/scf/out89.pdf.
11. European Food Safety Authority (2005) Opinion of theScientific Committee on a request from EFSA related toExposure Assessments (adopted on 22 June 2005). TheEFSA Journal 249, 1–26; available at http://www.efsa.europa.eu/EFSA/efsa_locale-1178620753812_1178620763345.htm
12. Istituto Nazionale di Statistica (2007) Le imprese di tele-comunicazioni Anno 2005. Rome: ISTAT; available athttp://www.istat.it/salastampa/comunicati/non_calendario/20070214_00/
13. Verger P, Ireland J, Møller A, Abravicius JA, De Henauw S &Naska A for the EFCOSUM Group (2002) Improvement ofcomparability of dietary intake assessment using currentlyavailable individual food consumption surveys. Eur J ClinNutr 56, Suppl. 2, S18–S24.
14. Kiely M, Flynn A, Harrington KE, Robson PJ & Cran G(2001) Sampling description and procedures used toconduct the North/South Ireland Food ConsumptionSurvey. Public Health Nutr 4, 1029–1035.
15. Ocke MC, Hulshof KFAM & van Rossum CTM (2005) TheDutch national food consumption survey 2003. Methodo-logical issues. Arch Public Health 63, 227–241.
16. Hoare J, Henderson L, Bates CJ, Prentice A, Birch M, SwanG & Farron M (2004) The National Diet and NutritionSurvey: Adults Aged 19 to 64 Years. Summary Report.London: TSO; available at http://www.foodstandards.gov.uk/multimedia/pdfs/ndns5full.pdf
17. Istituto Nazionale di Statistica (2006) Bilancio demo-grafico anno 2006 e popolazione residente al 31 dicembre.Rome: ISTAT; available at http://demo.istat.it/pop2006/index.html
18. Istituto Nazionale di Statistica (2005) L’istruzione della popo-lazione al 2001. Dati definitivi del censimento. Rome: ISTAT;
SPublic
Hea
lth
Nutr
itio
n26 C Leclercq et al.

http://journals.cambridge.org Downloaded: 27 Mar 2009 IP address: 193.60.94.67
available at http://www.istat.it/salastampa/comunicati/non_calendario/20050121_00/testointegrale.pdf
19. Goldberg GR, Black AE, Jebb SA, Cole TJ, Murgatroyd PR,Coward WA & Prentice AM (1991) Critical evaluation ofenergy intake data using fundamental principles of energyphysiology: 1. Derivation of cut-off limits to identify under-recording. Eur J Clin Nutr 45, 569–581.
20. McGowan MJ, Harrington KE, Kiely M, Robson PJ, Living-stone MBE & Gibney MJ (2001) An evaluation of energyintakes and the ratio of energy intake to estimated basalmetabolic rate (EI/BMRest) in the North/South Ireland FoodConsumption Survey. Public Health Nutr 4, 1043–1050.
21. Istituto di Servizi per il Mercato Agricolo Alimentare (2005)Consumi – Indagini speciali. Acquisti domestici: oli e
grassi. La tendenza degli acquisti in volume 2000–2004.http://www.ismea.it/flex/cm/pages/ServeBLOB.php/L/IT/IDPagina/1266 (accessed July 2008).
22. Food and Agriculture Organization of the United Nations/World Health Organization (2002) Diet, Nutrition and thePrevention of Chronic Diseases. Joint WHO/FAO ExpertConsultation. WHO Technical Report Series no. 916.Geneva: WHO.
23. World Cancer Research Fund/American Institute for CancerResearch (2007) Food, Nutrition, Physical Activity, and thePrevention of Cancer: A Global Perspective. Washington,DC: AICR.
24. Kroes R, Muller D, Lambe J et al. (2002) Assessment ofintake from the diet. Food Chem Toxicol 40, 327–385.
SPublic
Hea
lth
Nutr
itio
n
Appendix
Food items included in food categories: Italian National Food Consumption Survey INRAN-SCAI 2005–06
Food categoriesList of single food items and of composite food items
classified in the food categoryMost frequent minor ingredients from other food
categories present in composite foods
Cereals, cereal products andsubstitutes
Bread All types of bread prepared with any type of flour(wheat, whole wheat, soya, maize, etc.), specialitybreads, sponge bread, excl. breadcrumbs andtoasted bread
Milk and fats in speciality breads; soya insoya bread
Pasta and pasta substitutes All types of pasta, incl. rice noodles, fresh pasta witheggs, tortellini (fresh pasta with meat filling) andpasta for infants, puff pastry dough
Meat in tortellini; eggs in fresh pasta; butter inpuff pastry dough
Pizza Plain white pizza, plain tomato pizza, excl. other pizzaswhich were codified through recipes
Tomato in plain tomato pizza; oil in plain whitepizza and plain tomato pizza
Rice All types of rice, white and brown, excl. rice incommercial rice pudding
–
Wheat, other cerealsand flours
All types of flour (wheat, corn, oat, couscous, millet,barley, rice, etc.) used in recipes (polenta, pizza,fresh pasta, cakes), breadcrumbs, baby cereals
Fruit in some baby cereals
Breakfast cereals All types of ready-to-eat cereals (generally used atbreakfast with milk): corn flakes, puffed wheat, driedand toasted rice, muesli, etc.
Dried fruit and nuts in muesli; sugar; cocoa
Biscuits All types of sweet biscuits, incl. sugar-free biscuits,granulated biscuits for infants, gluten-free biscuits
Sugar; eggs; fats; cocoa; dried fruit and nuts
Savoury fine bakeryproducts
All types of crackers, breadsticks, rusk, popcorn,salty appetizers and savoury biscuits
Fats
Cakes and sweet snacks Sweet rolls, all types of cakes (plain, with chocolate,with fruit, with cream, etc.), sweet cereal-basedsnacks (e.g. bars)
Fats; eggs; fruit; milk
Pulses, fresh and processed All types of pulses (fresh and processed): lentils, peas,chickpeas, all types of beans excl. green beans,soyabeans
–
Vegetables, fresh andprocessed
Leafy vegetables, fresh Chicory, lettuce, spinach, etc. –Tomatoes, fresh Fresh tomatoes used in salad and other recipes (e.g.
tomato sauce)–
Other fruiting vegetables,fresh
Aubergine, pepper, cucumber, pumpkin, courgette, etc –
Roots and onions, fresh Onion, garlic, turnip-rooted celery, beetroot, daikon –Other vegetables, fresh All other types of fresh vegetables: broccoli, cabbage,
cauliflower, artichokes, asparagus, fennel,mushroom, green beans and palm heart
–
Vegetables, processed Vegetable preserves (in vinegar, oil or brine), cannedtomatoes, vegetable soup dehydrated, industrialmixed salad with mayonnaise, homogenizedvegetables for infants
Eggs (in mayonnaise); oil (in oil preserves andmayonnaise); cereals and potatoes (indehydrated soup); vinegar (in oil preserves)
Spices and herbs Parsley, basil, rosemary, oregano, sesame seed,curry, ginseng, etc.
–
Italian National Food Consumption Survey 27

http://journals.cambridge.org Downloaded: 27 Mar 2009 IP address: 193.60.94.67
SPublic
Hea
lth
Nutr
itio
n
Appendix Continued
Food categoriesList of single food items and of composite food items
classified in the food categoryMost frequent minor ingredients from other food
categories present in composite foods
Potatoes, tubers and theirproducts
Potatoes raw, sweet potatoes, tapioca, potato chips,potato chips with cheese, potato croquettes, potatoflakes dehydrated
Fats in all potato chips; cheese in somespeciality potato chips; breading in potatocroquettes
Fruit, fresh and processedCitrus fruit, fresh Orange, lemon, grapefruit, tangerine, tangelo –Exotic fruit, fresh Banana, cherimoya, avocado, papaya, mango, lychee –Other fruit, fresh All other types of fruit: apple, pear, peach, apricot,
grape, fig, melon, watermelon, strawberry,raspberry, pomegranate, plum, cherry, etc.
–
Nuts, seeds, olives andtheir products, dried fruit
Nuts roasted, dried, in powder or in puree (almond,chestnut, walnut, coconut, pine nut, peanut,pistachio), seeds (pumpkin seed) and all dried fruit(figs, plum, raisin), olives
–
Other processed fruit(in syrup, in puree, etc.)
All types of fruit in syrup (peach, apricot, pear, fruitcocktail. etc.), in syrup, fruit puree, minced fruit, incl.homogenized fruit for infants
Sugar
Meat, meat products andsubstitutes
Beef and veal, notpreserved, excl. offal
Beef, veal, homogenized meat for infants, industrialmeat sauce
Tomato in industrial meat sauce; fats, cerealsand tubers in homogenized baby food
Pork, not preserved,excl. offal
Pork meat, pork meat roasted (porchetta), footpork raw, excl. offals
–
Poultry and game, notpreserved, excl. offal
Pheasant, chicken, roast chicken, goose, quail, turkey,ostrich, incl. homogenized products for infants
Fats, cereals and tubers in homogenized babyfood
Other meats, not preserved,excl. offal
Lamb, goat, mutton, kid, horse, donkey, lean deer,boar, rabbit, frog, land snail, incl. homogenizedproducts for infants, excl. offals
Fats, cereals and tubers in homogenized babyfood
Ham, salami, sausages andother preserved meats,excl. offal
Preserved meat from pork, chicken and turkey meat(ham, mortadella, sausages, wurstel, salami, etc.),roast beef, canned beef, dried beef or horse meat(bresaola), incl. homogenized products for infants
Fats, cereals and tubers in homogenized babyfood
Offal, blood and theirproducts
Liver, kidney, brain, trotter, heart, tripe, tongue,sweetbreads, blood and liver pate
Fats in liver pate
Meat substitutes Seitan (wheat gluten), soya hamburger Soya, wheat
Fish, seafood and theirproducts
Fish and seafood, freshand frozen
All types of fish, molluscs, crustaceans, raw(fresh or frozen) and fish fingers
Breading on fish fingers
Fish and seafood, preserved All types of preserved fish, molluscs, crustaceans andfish eggs (caviar, anchovies brined or in oil, tunabrined or in oil, smoked salmon, canned crab meat,cod dried and salted, smoked herring, etc.) incl.homogenized products for infants
Oil in oil preserves
Milk, milk products andsubstitutes
Milk, milk-based beverages,human milk, infantformula and substitutes
All types of milk (liquid, condensed and powder form),incl. infant formulae, human milk and milk substitutes(e.g. soya, rice, oat), flavoured milk (e.g. packagedchocolate-flavoured milk)
Sugar in flavoured milk beverages; cocoa inflavoured milk beverages; soya, rice in milksubstitutes
Yoghurt and fermented milk Yoghurt, drinkable yoghurt, yoghurt-based dessert withfruit for infants
Sugar in yoghurt; fruit or cereals in yoghurt
Cheese and substitutes All types of cheese (e.g. mozzarella, parmesan, edam,feta, fontina), flavoured sweet cheesefor children, cheese substitutes (e.g. tofu),homogenized cheese products for infants
Fruit and sugar in flavoured cheese for children
Milk-based dessertsand substitutes
Commercial milk-based desserts (e.g. moussechocolate, custard, chantilly), incl. commercialcreamy rice pudding (risolatte)
Sugar; milk cream; cocoa; rice in rice pudding
Oils and fatsOlive oil Extra-virgin olive oil, olive oil, incl. enriched type –Other vegetable oils All type of vegetable oils, excl. olive oil –Butter and creams Butter, cream, heavy cream –Other fats Margarine all types, mayonnaise, lard, incl.
soyabean butterEggs in mayonnaise
28 C Leclercq et al.
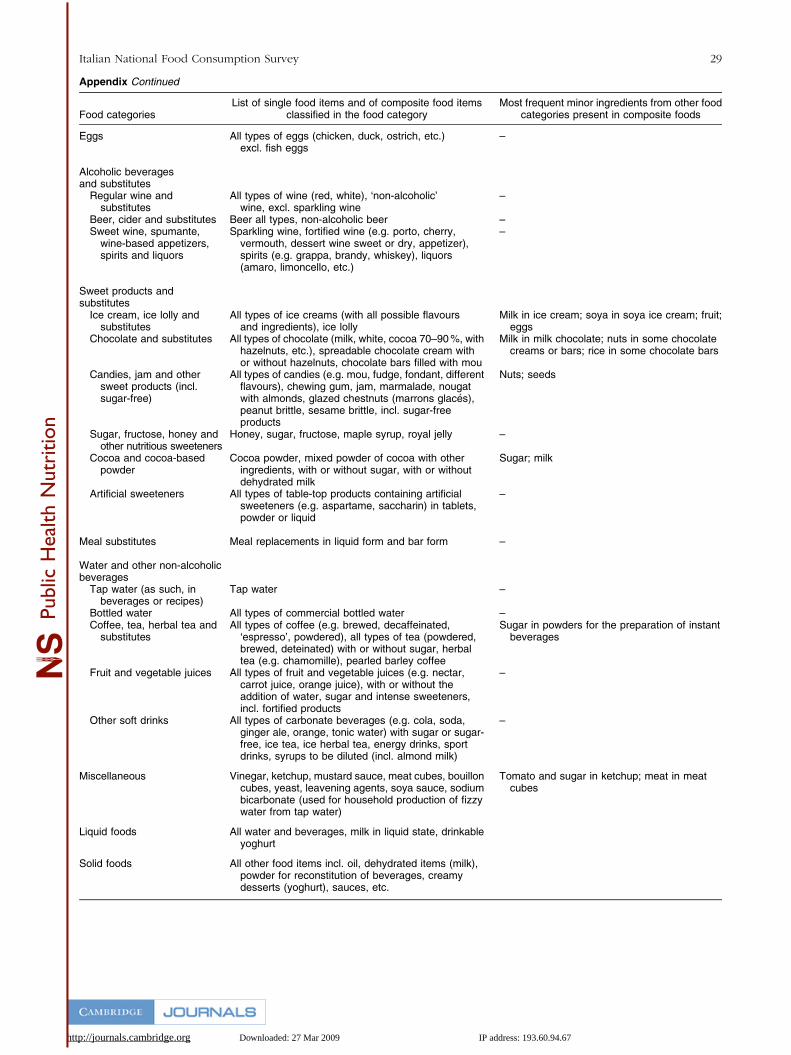
http://journals.cambridge.org Downloaded: 27 Mar 2009 IP address: 193.60.94.67
SPublic
Hea
lth
Nutr
itio
n
Appendix Continued
Food categoriesList of single food items and of composite food items
classified in the food categoryMost frequent minor ingredients from other food
categories present in composite foods
Eggs All types of eggs (chicken, duck, ostrich, etc.)excl. fish eggs
–
Alcoholic beveragesand substitutes
Regular wine andsubstitutes
All types of wine (red, white), ‘non-alcoholic’wine, excl. sparkling wine
–
Beer, cider and substitutes Beer all types, non-alcoholic beer –Sweet wine, spumante,
wine-based appetizers,spirits and liquors
Sparkling wine, fortified wine (e.g. porto, cherry,vermouth, dessert wine sweet or dry, appetizer),spirits (e.g. grappa, brandy, whiskey), liquors(amaro, limoncello, etc.)
–
Sweet products andsubstitutes
Ice cream, ice lolly andsubstitutes
All types of ice creams (with all possible flavoursand ingredients), ice lolly
Milk in ice cream; soya in soya ice cream; fruit;eggs
Chocolate and substitutes All types of chocolate (milk, white, cocoa 70–90 %, withhazelnuts, etc.), spreadable chocolate cream withor without hazelnuts, chocolate bars filled with mou
Milk in milk chocolate; nuts in some chocolatecreams or bars; rice in some chocolate bars
Candies, jam and othersweet products (incl.sugar-free)
All types of candies (e.g. mou, fudge, fondant, differentflavours), chewing gum, jam, marmalade, nougatwith almonds, glazed chestnuts (marrons glaces),peanut brittle, sesame brittle, incl. sugar-freeproducts
Nuts; seeds
Sugar, fructose, honey andother nutritious sweeteners
Honey, sugar, fructose, maple syrup, royal jelly –
Cocoa and cocoa-basedpowder
Cocoa powder, mixed powder of cocoa with otheringredients, with or without sugar, with or withoutdehydrated milk
Sugar; milk
Artificial sweeteners All types of table-top products containing artificialsweeteners (e.g. aspartame, saccharin) in tablets,powder or liquid
–
Meal substitutes Meal replacements in liquid form and bar form –
Water and other non-alcoholicbeverages
Tap water (as such, inbeverages or recipes)
Tap water –
Bottled water All types of commercial bottled water –Coffee, tea, herbal tea and
substitutesAll types of coffee (e.g. brewed, decaffeinated,
‘espresso’, powdered), all types of tea (powdered,brewed, deteinated) with or without sugar, herbaltea (e.g. chamomille), pearled barley coffee
Sugar in powders for the preparation of instantbeverages
Fruit and vegetable juices All types of fruit and vegetable juices (e.g. nectar,carrot juice, orange juice), with or without theaddition of water, sugar and intense sweeteners,incl. fortified products
–
Other soft drinks All types of carbonate beverages (e.g. cola, soda,ginger ale, orange, tonic water) with sugar or sugar-free, ice tea, ice herbal tea, energy drinks, sportdrinks, syrups to be diluted (incl. almond milk)
–
Miscellaneous Vinegar, ketchup, mustard sauce, meat cubes, bouilloncubes, yeast, leavening agents, soya sauce, sodiumbicarbonate (used for household production of fizzywater from tap water)
Tomato and sugar in ketchup; meat in meatcubes
Liquid foods All water and beverages, milk in liquid state, drinkableyoghurt
Solid foods All other food items incl. oil, dehydrated items (milk),powder for reconstitution of beverages, creamydesserts (yoghurt), sauces, etc.
Italian National Food Consumption Survey 29