Embed Size (px)
Citation preview
introductionThe Investment Case EduCaTIon and EquITy summary
Education and Equity
The Investment Case for
unite for children
Cover photograph:students in a classroom in Kursa Primary school in the afar region of Ethiopia. © unICEF/ETHa_201300488/ose
Inside cover photograph:students hold up their hands at a school in uganda. The school has experienced an influx of students who fled south sudan because of violence in the country.
Published by unICEFEducation section, Programme division3 united nations Plazanew york, ny 10017, usa
www.unicef.org/publications
© united nations Children’s Fund (unICEF)January 2015
© u
nIC
EF/u
Gd
a201400437/Vassie
Education and Equity
The Investment Case for
ii
report team
The Investment Case for Education and Equity was produced by unICEF’s Education section. It was prepared by annababette Wils, Phd, an independent consultant, and Gabrielle Bonnet, unICEF Education specialist, under the supervision of mathieu Brossard, senior adviser, Education, unICEF.
Editing and design
This document was edited by Christine dinsmore, copy edited by Catherine rutgers, and proofread by natalie Leston, independent consultants. It was designed by büro svenja.
acknowledgements
The report was revised, enriched and reviewed by external experts including Luis a. Crouch, Chief Technical officer and Vice President of the International development Group at rTI International; Birger Fredriksen, education development expert and former director of Human development for africa region at The World Bank; Keith Lewin, Professor of International Education and development, university of sussex and director of the Consortium for research on Educational access, Transitions and Equity (CrEaTE); and Liesbet steer, Fellow at the Brookings Institution’s Center for universal Education.
It was also enriched thanks to the team in the Global Partnership for Education secretariat.
The report was also reviewed and enriched by comments and suggestions from nICEF’s regional offices and from the social Inclusion and Policy section, the division of data, research and Policy, and the Education section at the new york headquarters. special thanks go to: Francisco Benavides, regional adviser, Education, Latin america and the Caribbean; nicolas reuge, Education specialist, West and Central africa; Jingqing Chai, Chief, Public Finance and Governance, social Inclusion and Policy section; nicholas rees, Policy analysis specialist; Tapas Kulkarni and Binderiya Byambasuren of the social Inclusion and Policy section; anna azaryeva Valente, Education specialist; the unICEF Peacebuilding and Education team; Education Economist Luc Gacougnolle, an independent consultant; Education specialist daniel Kelly, Consultant; and Blandine Ledoux, Education specialist.
acknowledgements
THE InVEsTmEnT CasE For EduCaTIon and EquITy
iii
aCKnoWLEdGEmEnTs
support with messaging and related products was provided by morgan strecker, Education specialist, Education section; samantha mort, senior adviser Communication, office of the Executive director, and the division of Communication. Particular thanks in the division go to Paloma Escudero, director; Edward Carwardine, deputy director; Kai Bucher, Consultant; Tara dooley, Consultant; Elissa Jobson, Consultant; and rudina Vojvoda, Consultant. The division of Communication oversaw the editing, fact checking and publication of the report. Fact checking was provided by Hirut Gebre-Egziabher, Communication specialist; yasmine Hage, Consultant; and ami Pradhan, Consultant.
For their continued support, review and guidance, special thanks also go to unICEF’s Jordan naidoo, senior adviser, scaling up and system reconstruction, Education, and Josephine Bourne, associate director, Education.
Finally, communication and research advice and support were provided by Geeta rao Gupta, unICEF deputy Executive director, and, in unICEF’s Programme division, Ted Chaiban, director, and maniza Zaman, deputy director.
For more information, please contact Gabrielle Bonnet at [email protected].
iv
Contents
acknowledgements iiForeword viabbreviations and definitions viii
Introduction ………………………………………………………….... 1
1. a billion reasons for investing in education …………………… 3
1.1 The case for investment in education 6 1.1.1 Economic returns 6 1.1.2 Human development returns 10 1.1.3 The virtuous cycle of education: Inter-generational effects 13 1.2 an equity perspective: The case for investment per level of education 14 1.2.1 Economic benefits by level of education 14 1.2.2 Human development benefits by level of education 18
2. Crises at the foundation: Poor learning and high inequity …… 21
2.1 Increasing levels of access mask low levels of completion and learning 23 2.1.1 E = IsL: Intake and never entry 23 2.1.2 E = IsL: Completion and early dropout 24 2.1.3 E = IsL: Learning 26 2.1.4 Early foundations: Pre-primary education 27 2.2 Vulnerable and marginalized children suffer from high levels of exclusion 28 2.2.1 Inequality in intake to the first grade of primary school 31 2.2.2 Inequality in dropout and completion 31 2.2.3 Inequality in learning 38
3. Barriers to education progress and learning …………………… 41
3.1 Funding gaps 43 3.2 Challenges with the education funding envelope 49 3.2.1 domestic resources as a percentage of GdP 49 3.2.2 Priority given to education in government budgets 50 3.2.3 External funding to education 50 3.3 Equity in the allocation of education funding to different levels of education 54 3.3.1 distribution of public education spending across levels of education 54 3.3.2 unit cost by level of education 55 3.3.3 Concentration of education resources 57 3.3.4 Household expenditures 60
THE InVEsTmEnT CasE For EduCaTIon and EquITy
v
3.4 Equity in resource distribution to regions, schools and grades 63 3.4.1 Geographical distribution issues 63 3.4.2 distribution across grades within schools 66 3.4.3 distribution inequity in textbook allocation 66 3.5 Challenges with transforming resources into outcomes 68 3.5.1 demand-side challenges 68 3.5.2 Financial inputs and learning outcomes 68 3.5.3 actual instructional time 72 3.5.4 support and supervision 73
4. moving forward …………………………………………………… 75
4.1 Increasing overall funding to the education sector 77 4.1.1 domestic resources and allocation to education 77 4.1.2 External aid to basic education 79 4.1.3 support to education in humanitarian contexts 79 4.2 using resources more equitably 80 4.2.1 Balancing the education budget by level of education with
an equity perspective 80 4.2.2 Targeting resources to reach the most vulnerable:
Equitable allocation to regions and schools 83 4.3 using resources effectively to increase access, retention and learning 85 4.3.1 Interventions to increase access and survival 85 4.3.2 Interventions to improve learning 91
a call for action ………………………………………………………… 95
annex a. Human development benefits of education 99annex B. age and dropout 104annex c. Per pupil expenditures in secondary and tertiary vs. primary education 105annex d. Geographical distribution of funding and teachers per child 107annex E. reasons for not being in school 108annex F. The sEE database 109annex G. Interventions to increase access 111annex H. Interventions to increase learning: Full intervention list and cost estimates 113annex i. unICEF’s strategic Plan 2014–2017 and results framework for education 117
References/bibliography* 121
ConTEnTs
vi
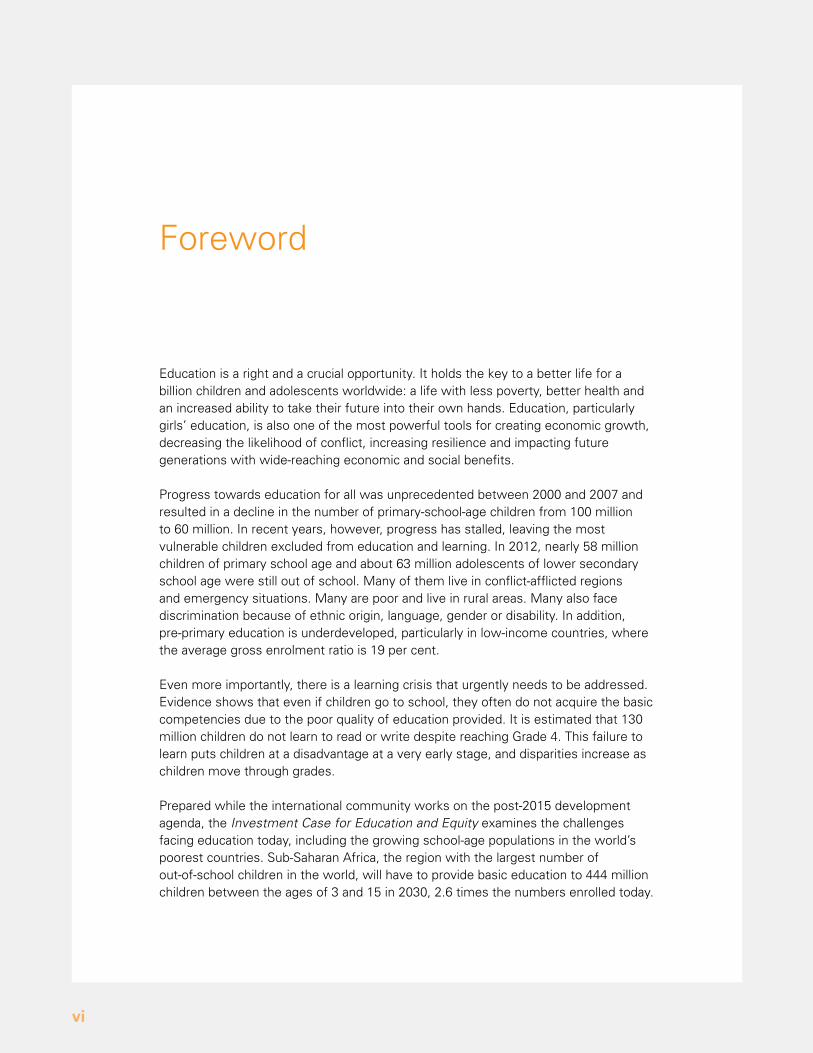
Education is a right and a crucial opportunity. It holds the key to a better life for a billion children and adolescents worldwide: a life with less poverty, better health and an increased ability to take their future into their own hands. Education, particularly girls’ education, is also one of the most powerful tools for creating economic growth, decreasing the likelihood of conflict, increasing resilience and impacting future generations with wide-reaching economic and social benefits.
Progress towards education for all was unprecedented between 2000 and 2007 and resulted in a decline in the number of primary-school-age children from 100 million to 60 million. In recent years, however, progress has stalled, leaving the most vulnerable children excluded from education and learning. In 2012, nearly 58 million children of primary school age and about 63 million adolescents of lower secondary school age were still out of school. many of them live in conflict-afflicted regions and emergency situations. many are poor and live in rural areas. many also face discrimination because of ethnic origin, language, gender or disability. In addition, pre-primary education is underdeveloped, particularly in low-income countries, where the average gross enrolment ratio is 19 per cent.
Even more importantly, there is a learning crisis that urgently needs to be addressed. Evidence shows that even if children go to school, they often do not acquire the basic competencies due to the poor quality of education provided. It is estimated that 130 million children do not learn to read or write despite reaching Grade 4. This failure to learn puts children at a disadvantage at a very early stage, and disparities increase as children move through grades.
Prepared while the international community works on the post-2015 development agenda, the Investment Case for Education and Equity examines the challenges facing education today, including the growing school-age populations in the world’s poorest countries. sub-saharan africa, the region with the largest number of out-of-school children in the world, will have to provide basic education to 444 million children between the ages of 3 and 15 in 2030, 2.6 times the numbers enrolled today.
Foreword
THE InVEsTmEnT CasE For EduCaTIon and EquITy
vii
The report establishes three essential ingredients to revive progress in increasing the number of children who can go to school and learn: more funding for education, an equitable approach to resource allocation and more efficient spending on quality education.
more funding is required from governments and donors, including a greater provision of resources to education during and in the aftermath of conflicts and emergencies. Increased education financing is also more than a humanitarian act: It is an investment in strong economies and in more peaceful, resilient and equitable societies.
Challenges in the education sector will not be addressed solely by increased funding. Policies that allow for the equitable targeting of resources and improve the efficiency of overall education spending are needed. With limited resources and a long way to go before every child has access to education and learning, it is essential to identify and support country-specific, cost-effective policies and interventions. making sound decisions will require strong evidence and better data. Given the magnitude of the learning crisis, we need strengthened learning assessment systems, particularly for the early grades, and strong accountability structures to improve the way in which investments are transformed into actual learning.
Providing these ingredients will be challenging. But it is necessary if we want to provide a billion children with their birthright: learning. Because today’s investment in education is tomorrow’s success.
anthony LakeExecutive director, unICEF
Challenges in the education sector will not be addressed solely by increased funding. Policies that allow for the equitable targeting of resources and improve the efficiency of overall education spending are needed.
ForEWord
viii
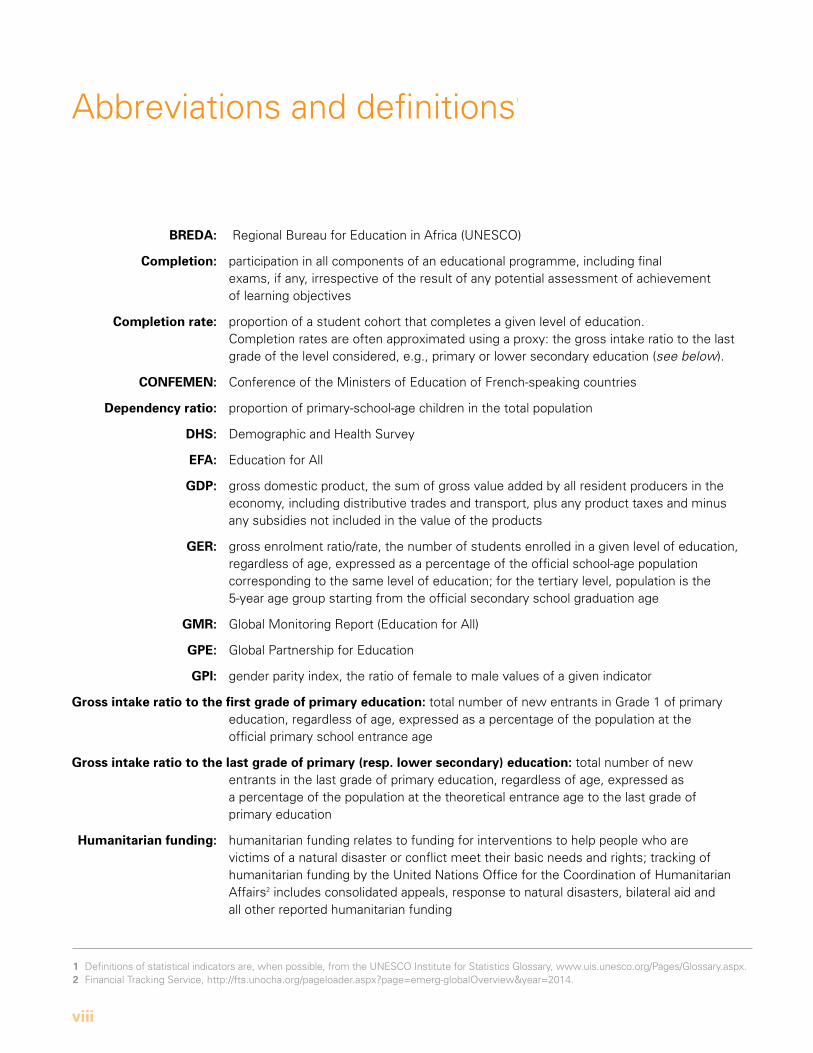
abbreviations and definitions1
BREda: regional Bureau for Education in africa (unEsCo)
completion: participation in all components of an educational programme, including final exams, if any, irrespective of the result of any potential assessment of achievement of learning objectives
completion rate: proportion of a student cohort that completes a given level of education. Completion rates are often approximated using a proxy: the gross intake ratio to the last grade of the level considered, e.g., primary or lower secondary education (see below).
conFEMEn: Conference of the ministers of Education of French-speaking countries
dependency ratio: proportion of primary-school-age children in the total population
dHS: demographic and Health survey
EFa: Education for all
GdP: gross domestic product, the sum of gross value added by all resident producers in the economy, including distributive trades and transport, plus any product taxes and minus any subsidies not included in the value of the products
GER: gross enrolment ratio/rate, the number of students enrolled in a given level of education, regardless of age, expressed as a percentage of the official school-age population corresponding to the same level of education; for the tertiary level, population is the 5-year age group starting from the official secondary school graduation age
GMR: Global monitoring report (Education for all)
GPE: Global Partnership for Education
GPi: gender parity index, the ratio of female to male values of a given indicator
Gross intake ratio to the first grade of primary education: total number of new entrants in Grade 1 of primary education, regardless of age, expressed as a percentage of the population at the
official primary school entrance age
Gross intake ratio to the last grade of primary (resp. lower secondary) education: total number of new entrants in the last grade of primary education, regardless of age, expressed as
a percentage of the population at the theoretical entrance age to the last grade of primary education
Humanitarian funding: humanitarian funding relates to funding for interventions to help people who are victims of a natural disaster or conflict meet their basic needs and rights; tracking of humanitarian funding by the united nations office for the Coordination of Humanitarian affairs2 includes consolidated appeals, response to natural disasters, bilateral aid and all other reported humanitarian funding
1 definitions of statistical indicators are, when possible, from the unEsCo Institute for statistics Glossary, www.uis.unesco.org/Pages/Glossary.aspx.2 Financial Tracking service, http://fts.unocha.org/pageloader.aspx?page=emerg-globaloverview&year=2014.
THE InVEsTmEnT CasE For EduCaTIon and EquITy
ix
aBBrEVIaTIons and dEFInITIons
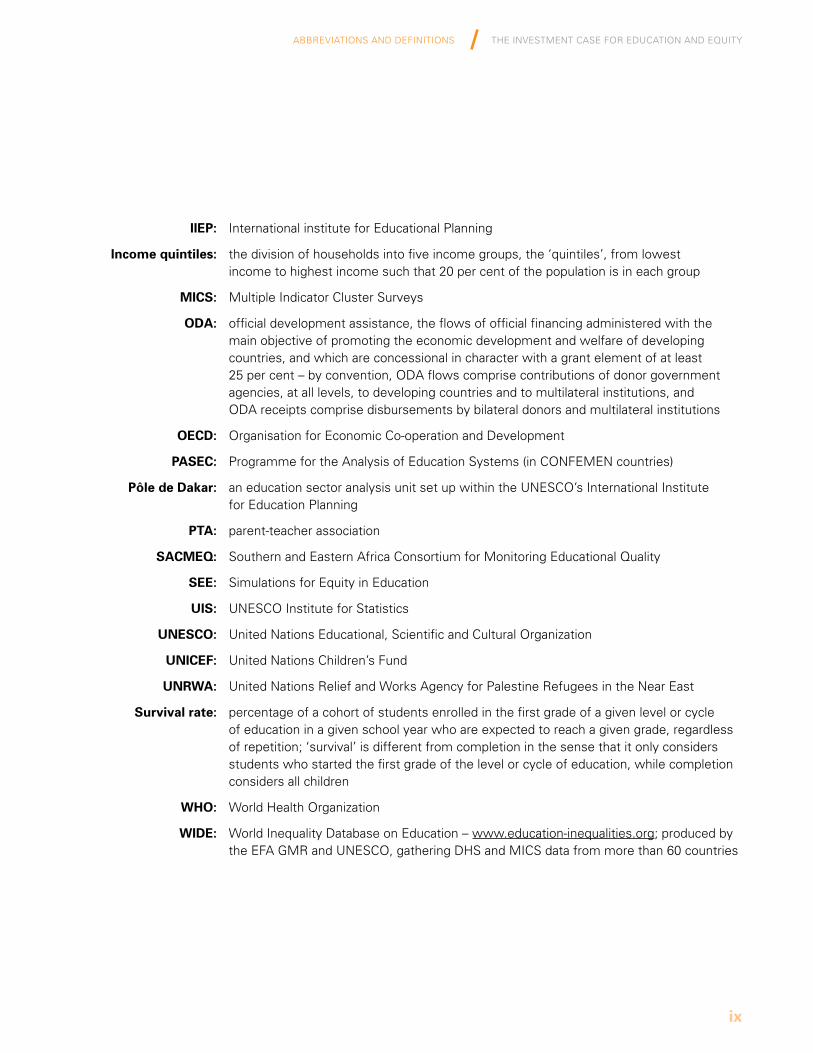
iiEP: International institute for Educational Planning
income quintiles: the division of households into five income groups, the ‘quintiles’, from lowest income to highest income such that 20 per cent of the population is in each group
MicS: multiple Indicator Cluster surveys
oda: official development assistance, the flows of official financing administered with the main objective of promoting the economic development and welfare of developing countries, and which are concessional in character with a grant element of at least 25 per cent – by convention, oda flows comprise contributions of donor government agencies, at all levels, to developing countries and to multilateral institutions, and oda receipts comprise disbursements by bilateral donors and multilateral institutions
oEcd: organisation for Economic Co-operation and development
PaSEc: Programme for the analysis of Education systems (in ConFEmEn countries)
Pôle de dakar: an education sector analysis unit set up within the unEsCo’s International Institute for Education Planning
Pta: parent-teacher association
SacMEq: southern and Eastern africa Consortium for monitoring Educational quality
SEE: simulations for Equity in Education
uiS: unEsCo Institute for statistics
unESco: united nations Educational, scientific and Cultural organization
unicEF: united nations Children’s Fund
unRWa: united nations relief and Works agency for Palestine refugees in the near East
Survival rate: percentage of a cohort of students enrolled in the first grade of a given level or cycle of education in a given school year who are expected to reach a given grade, regardless of repetition; ‘survival’ is different from completion in the sense that it only considers students who started the first grade of the level or cycle of education, while completion considers all children
WHo: World Health organization
WidE: World Inequality database on Education – www.education-inequalities.org; produced by the EFa Gmr and unEsCo, gathering dHs and mICs data from more than 60 countries
10
Introduction
The InvesTmenT Case for eduCaTIon and equITy
1
introduction
The international community is currently working on the post-2015 development agenda. The proposed goals and targets are not yet fully defined, but the general outline is known – including a continuation of the unfinished Education for all (EFa) agenda, an emphasis on equity and a focus on learning. The proposals also encompass an increased emphasis on the provision of secondary education for an increasing number of primary school leavers, and the goal to equip children and youth with skills that are adapted to the needs of the labour market in a fast-changing and increasingly globalized economy. most of these issues are covered in this document.
recent history has shown that considerable progress in achieving education for all can be made with concerted efforts, as enrolment rates have climbed, particularly in countries in sub-saharan africa and south asia, which had very low levels of access in the early 2000s. according to the unEsCo Institute for statistics (uIs data Centre), between 2000 and 2012, the percentage of out-of-school children among primary-school-age children has declined from 40 per cent to 22 per cent in sub-saharan africa and from 20 per cent to 6 per cent in south asia.
still, in 2012, 57.8 million primary-school-age children were out of school (about 121 million if lower secondary is included). access to education remains unequal. In addition, the pace of progress in access to education has slowed down, and the number of out-of-school children of primary school age worldwide has declined, on average, by a mere 1 per cent annually between 2007 and 2012. In contrast, the decline was 7 per cent a year between 2000 and 2007. The percentage of out-of-school children in conflict-affected countries rose from 42 per cent in 2008 to 50 per cent in 2011 (Gmr 2013).
Progress is also affected by the challenges countries face as they increasingly need to enrol harder-to-reach groups of children than those who first benefited from the gains made in access to education. This means that in order to enrol out-of-school children, not only is there a need to invest more, but there is also a need to do things differently. Furthermore, there must be more of a focus on learning, not just access.
chapter 1 examines the wide-reaching impact of education, economically and socially. one key message is that not all education levels are equally important – both from an equity perspective and as a means to maximize the benefits of education in developing countries.
chapter 2 analyses which children remain excluded from education, considering access, completion and learning.
chapter 3 explores the barriers to education, including education funding levels (domestic resources and external aid), how it is distributed and how efficiently it is used. Finally,
chapter 4 recommends ways of addressing the challenges highlighted in Chapter 3, including improved data and increased, more equitable and cost-effective investment.
In order to enrol out-of-school children, not only is there a need to invest more, but there is also a need to do things differently.
2
© u
nIC
EF/B
an
a2014-00606/m
awa
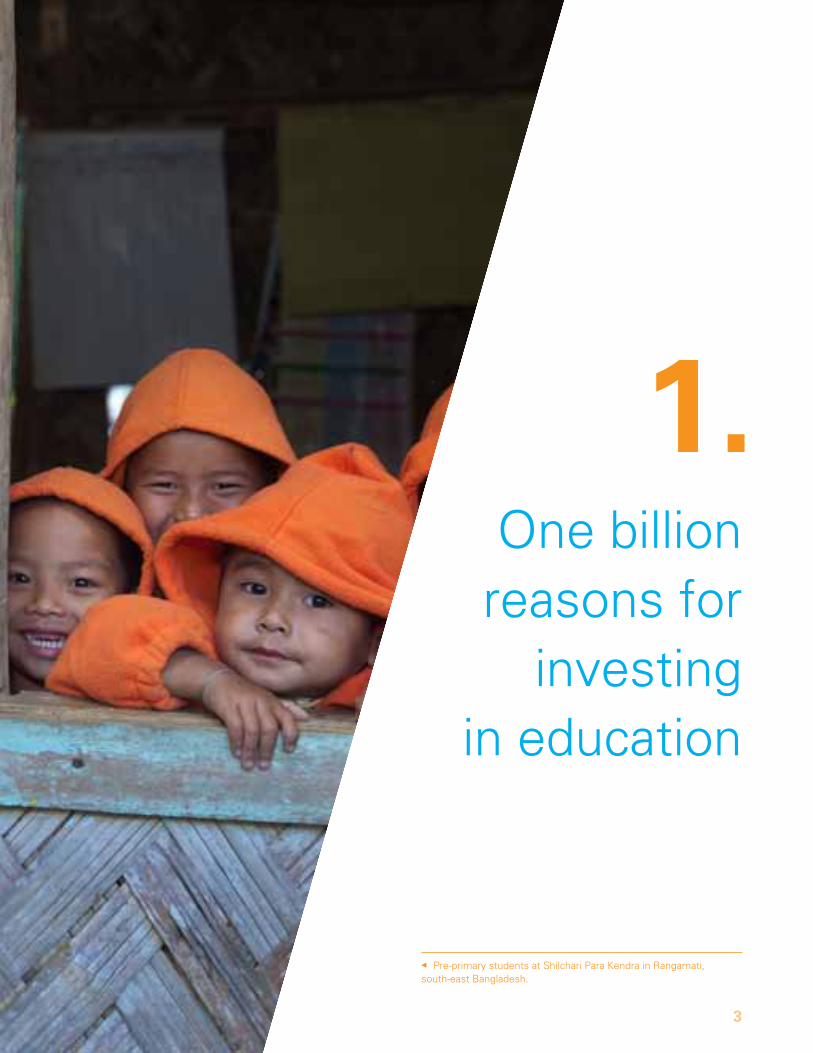
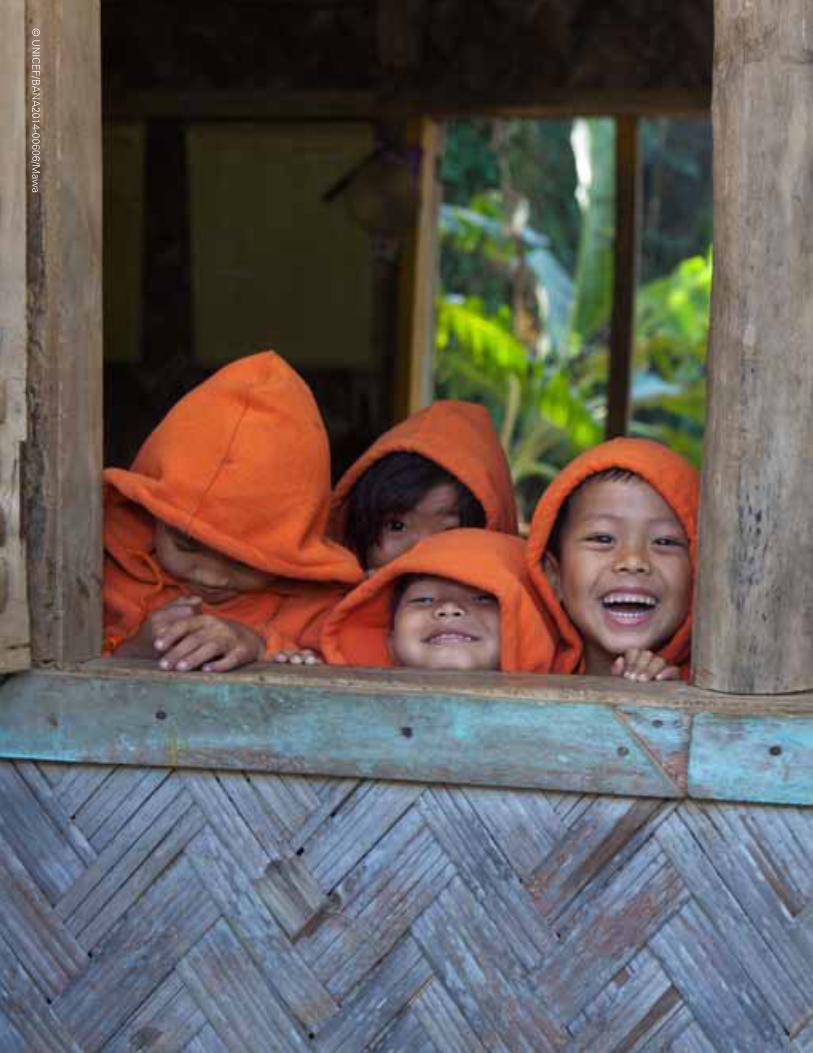
Pre-primary students at shilchari Para Kendra in rangamati, south-east Bangladesh.
3
1. one billion reasons for
investing in education
4
There are approximately 650 million primary-school-age children and 370 million children of lower secondary school age in the world today. If children of pre-primary school age are included, the total rises to 1.4 billion. Improving the futures of these children – whether they are poor, live in conflict situations, or face discrimination because of gender, disability or ethnic origin – is the most important reason to invest in education. The universal declaration of Human rights (article 26) states that education is an inherent right: “Everyone has the right to education. Education shall be free, at least in the elementary and fundamental stages” (united nations 1948).
The Convention on the rights of the Child asserts children’s right to education in article 28, and states in article 29 that “the education of the child shall be directed to … development of the child’s personality, talents and physical abilities to their fullest potential.” In article 23, the Convention asserts the rights of children with disabilities and calls for special care and support.
a rights-based approach to education is also reflected in unICEF’s 2014–2017 strategic Plan:
The fundamental mission of unICEF is to promote the rights of every child … For unICEF, equity means that all children have an opportunity to survive, develop and reach their full potential, without discrimination, bias or favouritism. To the degree that any child has an unequal chance in life – in its social, political, economic, civic and cultural dimensions – her or his rights are violated. There is growing evidence that investing in the health, education and protection of a society’s most disadvantaged citizens – addressing inequity – not only will give all children the opportunity to fulfil their potential but also will lead to sustained growth and stability of countries. This is why the focus on equity is so vital. It accelerates progress towards realizing the human rights of all children (unICEF Executive Board 2013, I.1).
3 Based on organisation for Economic Co-operation and development (oECd) data for education (total amount) and the sum of amounts devoted to health (general) from ‘aid to the Health and Population Policies/Programmes and reproductive Health sectors’ extracted from the oECd database in october 2014, www.oecd.org/dac/stats/aidtohealth.htm.4 World Health organization (2011 data) and authors’ calculation from the unEsCo Institute for statistics (uIs) data Centre, consulted 24 october 2014.
despite common agreement about children’s right to education, millions are still excluded from exercising their right. When the time comes to make choices, education is too often considered less important, or even a luxury. Children living in conflict, for example, are frequently seen as only needing life-saving interventions, education is often perceived in poor or marginalized communities as less important for a girl than for a boy, and children with disabilities are rarely given the same opportunities as children without disabilities.
additionally, international aid does not focus enough on education. While not minimizing the importance of health-related interventions, during 2010–2012, on average, external aid to health amounted to us$20 billion a year compared with only us$13 billion a year for education.3 These trends do not mirror the importance placed on education and health in developing countries’ budgets. on average, in low- income countries, the share in total government expenditures is 9.2 per cent for health and 16.3 per cent for education.4 donors do not attribute the same priority to education as governments do.
This chapter makes the case for investment in education by presenting concrete evidence of the positive impact education has on individuals, families and nations, both in terms of national income, economic growth and poverty reduction and in human development outcomes such as health, fertility, women’s empowerment, risk management, individual and community resilience, civic engagement and increased tolerance (see Sections 1.1.2 and 1.2.2).
Equally important, this chapter shows that equity and education are highly associated in multiple regards, strengthening the rationale for inclusive education in support of inclusive economic and social growth. Chapter 1 also demonstrates that the level of education that should be prioritized in times of budget constraints depends on the overall development of the country (see Section 1.2). In particular, good-quality pre-primary,
The InvesTmenT Case for eduCaTIon and equITy
5
1
primary and lower secondary education – basic education – is the level that most influences equity and economic and human development in low-income countries. Whereas in middle-income countries, on average, the secondary level (general and vocational/technical) has the most effective economic impact, it should not be forgotten that some of these countries must still achieve universal primary completion and most of them still need to improve learning outcomes. In high-income countries, tertiary-level education is the most cost-effective in economic terms.
“Everyone has the right to education. Education shall be free, at least in the elementary and fundamental stages.”
– article 26, universal declaration of Human rights
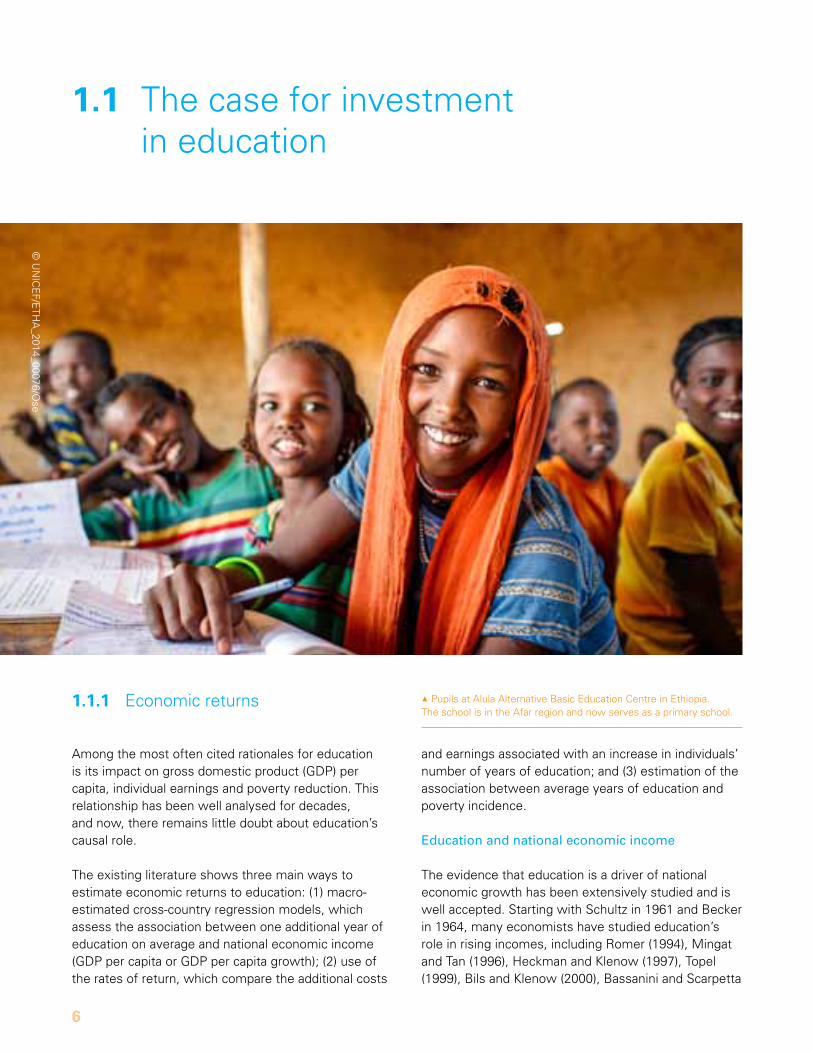
1 Pupils at alula alternative Basic Education Centre in Ethiopia. The school is in the afar region and now serves as a primary school.
6
1.1 The case for investment in education
1.1.1 Economic returns
among the most often cited rationales for education is its impact on gross domestic product (GdP) per capita, individual earnings and poverty reduction. This relationship has been well analysed for decades, and now, there remains little doubt about education’s causal role.
The existing literature shows three main ways to estimate economic returns to education: (1) macro-estimated cross-country regression models, which assess the association between one additional year of education on average and national economic income (GdP per capita or GdP per capita growth); (2) use of the rates of return, which compare the additional costs
and earnings associated with an increase in individuals’ number of years of education; and (3) estimation of the association between average years of education and poverty incidence.
Education and national economic income
The evidence that education is a driver of national economic growth has been extensively studied and is well accepted. starting with schultz in 1961 and Becker in 1964, many economists have studied education’s role in rising incomes, including romer (1994), mingat and Tan (1996), Heckman and Klenow (1997), Topel (1999), Bils and Klenow (2000), Bassanini and scarpetta
© u
nIC
EF/E
THa
_2014_00076/ose
The InvesTmenT Case for eduCaTIon and equITy
7
1
(2001), Krueger and Lindahl (2001), sianesi and Van reenen (2003), Psacharopoulos and Patrinos (2004), Brossard and Foko (2006), de la Fuente and doménech (2006), Cohen and soto (2007), Hanushek and Woessmann (2008), Barro and Lee (2010) and Patrinos and Psacharopoulos (2013).
overall, these studies confirm that additional years of education have a significant influence on GdP per capita or its growth. Providing more education, knowledge and skills to individuals of a country, i.e., accumulating human capital, increases their productivity and employability, which in turn increases the overall income and development of the country. There is a large variability in estimated impacts. How much an additional year of education adds to GdP per capita or to its growth depends on the estimation
method (e.g., some studies control the physical capital investment and others do not) and the period and countries covered by the analysis. It is also noteworthy that, due to the lack of fully comparable learning measurement across all countries, only a few studies (e.g., Hanushek and Woessmann 2008) factor in learning, which could be seen in economic terms as the ‘quality’ of the human capital accumulated, when estimating the impact on national income – in spite of its likely importance.
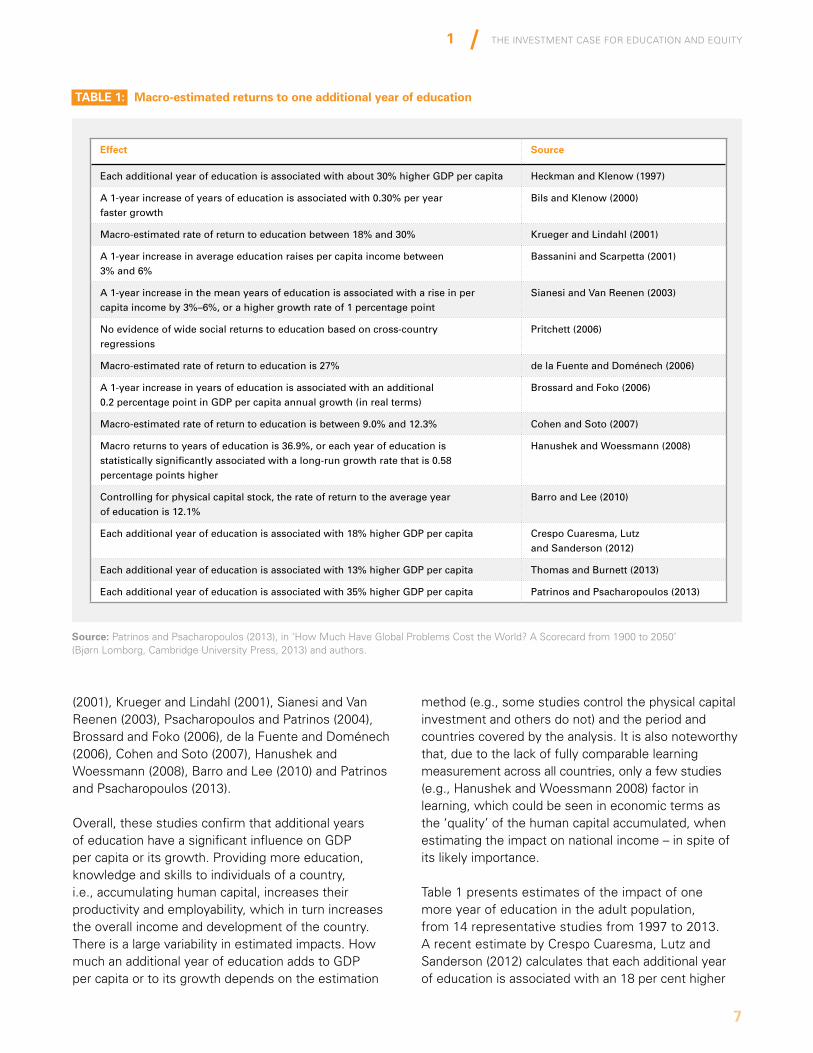
Table 1 presents estimates of the impact of one more year of education in the adult population, from 14 representative studies from 1997 to 2013. a recent estimate by Crespo Cuaresma, Lutz and sanderson (2012) calculates that each additional year of education is associated with an 18 per cent higher
Effect Source
Each additional year of education is associated with about 30% higher GDP per capita Heckman and Klenow (1997)
A 1-year increase of years of education is associated with 0.30% per year faster growth
Bils and Klenow (2000)
Macro-estimated rate of return to education between 18% and 30% Krueger and Lindahl (2001)
A 1-year increase in average education raises per capita income between 3% and 6%
Bassanini and Scarpetta (2001)
A 1-year increase in the mean years of education is associated with a rise in per capita income by 3%–6%, or a higher growth rate of 1 percentage point
Sianesi and Van Reenen (2003)
No evidence of wide social returns to education based on cross-country regressions
Pritchett (2006)
Macro-estimated rate of return to education is 27% de la Fuente and Doménech (2006)
A 1-year increase in years of education is associated with an additional 0.2 percentage point in GDP per capita annual growth (in real terms)
Brossard and Foko (2006)
Macro-estimated rate of return to education is between 9.0% and 12.3% Cohen and Soto (2007)
Macro returns to years of education is 36.9%, or each year of education is statistically significantly associated with a long-run growth rate that is 0.58 percentage points higher
Hanushek and Woessmann (2008)
Controlling for physical capital stock, the rate of return to the average year of education is 12.1%
Barro and Lee (2010)
Each additional year of education is associated with 18% higher GDP per capita Crespo Cuaresma, Lutz and Sanderson (2012)
Each additional year of education is associated with 13% higher GDP per capita Thomas and Burnett (2013)
Each additional year of education is associated with 35% higher GDP per capita Patrinos and Psacharopoulos (2013)
taBlE 1: Macro-estimated returns to one additional year of education
Source: Patrinos and Psacharopoulos (2013), in ‘How much Have Global Problems Cost the World? a scorecard from 1900 to 2050’ (Bjørn Lomborg, Cambridge university Press, 2013) and authors.
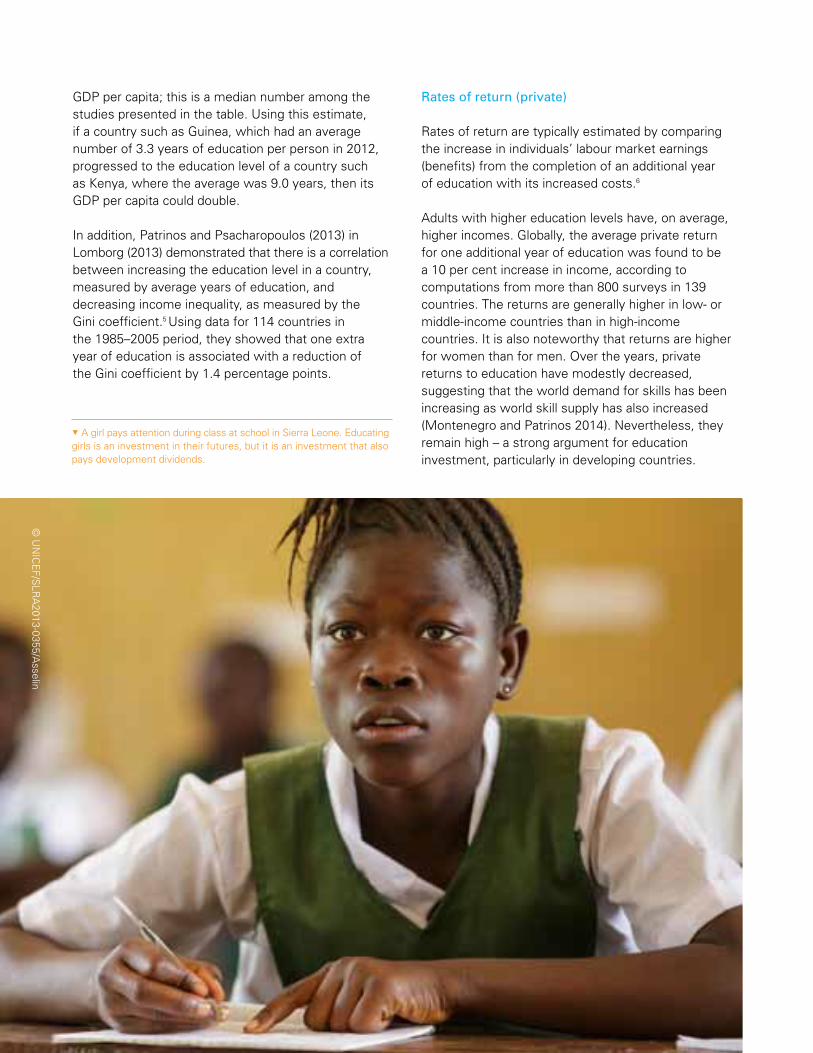
5 a girl pays attention during class at school in sierra Leone. Educating girls is an investment in their futures, but it is an investment that also pays development dividends.
8
GdP per capita; this is a median number among the studies presented in the table. using this estimate, if a country such as Guinea, which had an average number of 3.3 years of education per person in 2012, progressed to the education level of a country such as Kenya, where the average was 9.0 years, then its GdP per capita could double.
In addition, Patrinos and Psacharopoulos (2013) in Lomborg (2013) demonstrated that there is a correlation between increasing the education level in a country, measured by average years of education, and decreasing income inequality, as measured by the Gini coefficient.5 using data for 114 countries in the 1985–2005 period, they showed that one extra year of education is associated with a reduction of the Gini coefficient by 1.4 percentage points.
Rates of return (private)
rates of return are typically estimated by comparing the increase in individuals’ labour market earnings (benefits) from the completion of an additional year of education with its increased costs.6
adults with higher education levels have, on average, higher incomes. Globally, the average private return for one additional year of education was found to be a 10 per cent increase in income, according to computations from more than 800 surveys in 139 countries. The returns are generally higher in low- or middle-income countries than in high-income countries. It is also noteworthy that returns are higher for women than for men. over the years, private returns to education have modestly decreased, suggesting that the world demand for skills has been increasing as world skill supply has also increased (montenegro and Patrinos 2014). nevertheless, they remain high – a strong argument for education investment, particularly in developing countries.
© u
nIC
EF/s
Lra
2013-0355/asselin
The InvesTmenT Case for eduCaTIon and equITy
9
1
more inclusive education – with equitable educational opportunities for all – has the potential to be an important driver of inclusive growth.
Per
cen
t p
op
ula
tio
n li
vin
g o
n le
ss t
han
$2/
day
Average years of education age 25–34
Guatemala
SudanCambodia
BurundiLiberia The Democratic Republic of the Congo
United Republic of TanzaniaZambia
R2 = 0.66248
Rwanda
0 4 8 10 1262 140
20
40
60
80
100
Central African Republic
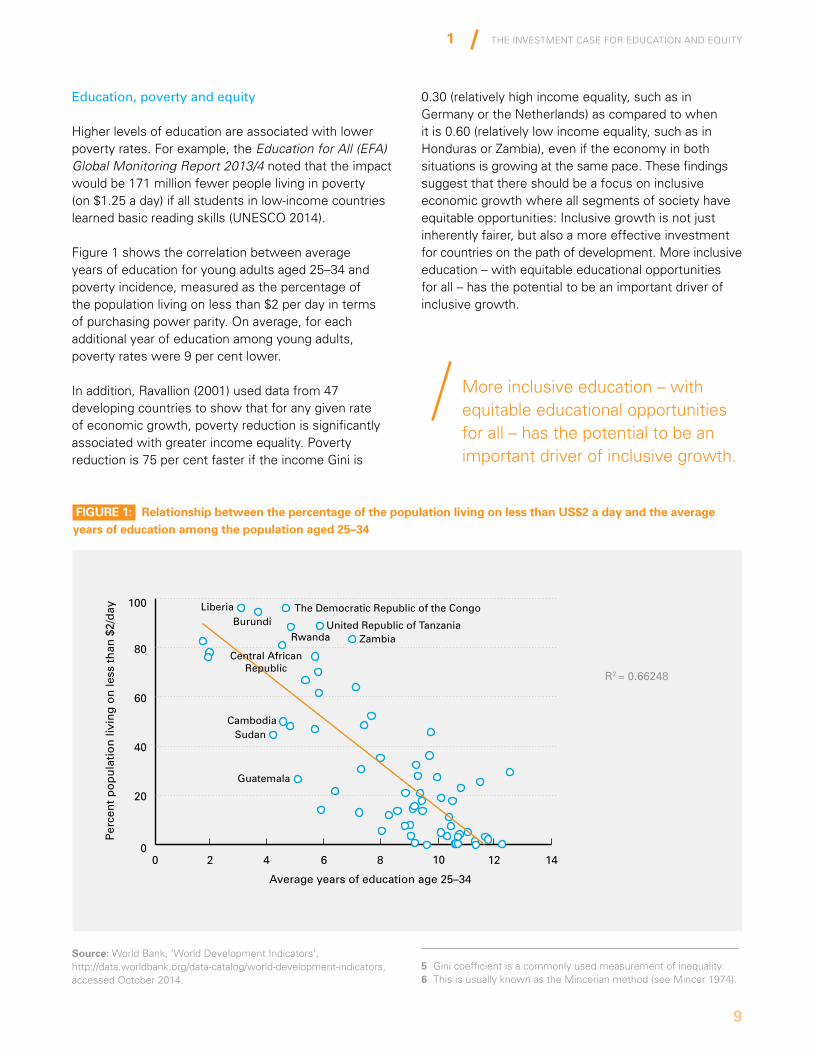
FiGuRE 1: Relationship between the percentage of the population living on less than uS$2 a day and the average years of education among the population aged 25–34
Source: World Bank, ‘World development Indicators’, http://data.worldbank.org/data-catalog/world-development-indicators, accessed october 2014.
0.30 (relatively high income equality, such as in Germany or the netherlands) as compared to when it is 0.60 (relatively low income equality, such as in Honduras or Zambia), even if the economy in both situations is growing at the same pace. These findings suggest that there should be a focus on inclusive economic growth where all segments of society have equitable opportunities: Inclusive growth is not just inherently fairer, but also a more effective investment for countries on the path of development. more inclusive education – with equitable educational opportunities for all – has the potential to be an important driver of inclusive growth.
5 Gini coefficient is a commonly used measurement of inequality.6 This is usually known as the mincerian method (see mincer 1974).
Education, poverty and equity
Higher levels of education are associated with lower poverty rates. For example, the Education for All (EFA) Global Monitoring Report 2013/4 noted that the impact would be 171 million fewer people living in poverty (on $1.25 a day) if all students in low-income countries learned basic reading skills (unEsCo 2014).
Figure 1 shows the correlation between average years of education for young adults aged 25–34 and poverty incidence, measured as the percentage of the population living on less than $2 per day in terms of purchasing power parity. on average, for each additional year of education among young adults, poverty rates were 9 per cent lower.
In addition, ravallion (2001) used data from 47 developing countries to show that for any given rate of economic growth, poverty reduction is significantly associated with greater income equality. Poverty reduction is 75 per cent faster if the income Gini is
10
1.1.2 Human development returns
While education benefits are often measured in economic terms, such as increased income and reduced poverty, even further-reaching effects are found in the health and social areas. Educated people and the children of educated parents tend to be healthier, more empowered regarding their own lives and their society, and socially more tolerant and resolution-seeking. many of the observed social impacts are linked to women’s education, hence, the importance of girls’ education for future social welfare.
Child mortality, prenatal care and family formation
Education’s association with health outcomes is significant. The Lancet recently published the most comprehensive review of child mortality, which was financed by the Bill and melinda Gates Foundation. using more than 900 censuses and surveys, the study (Gakidou et al. 2010) found that around half of the under-five mortality reduction from 1970–2009 can be traced to increases in the average years of education of women of reproductive age. In 2009, there were 8.2 million fewer deaths of children under age 5 than in 1970, even with a much larger population, and 4.2
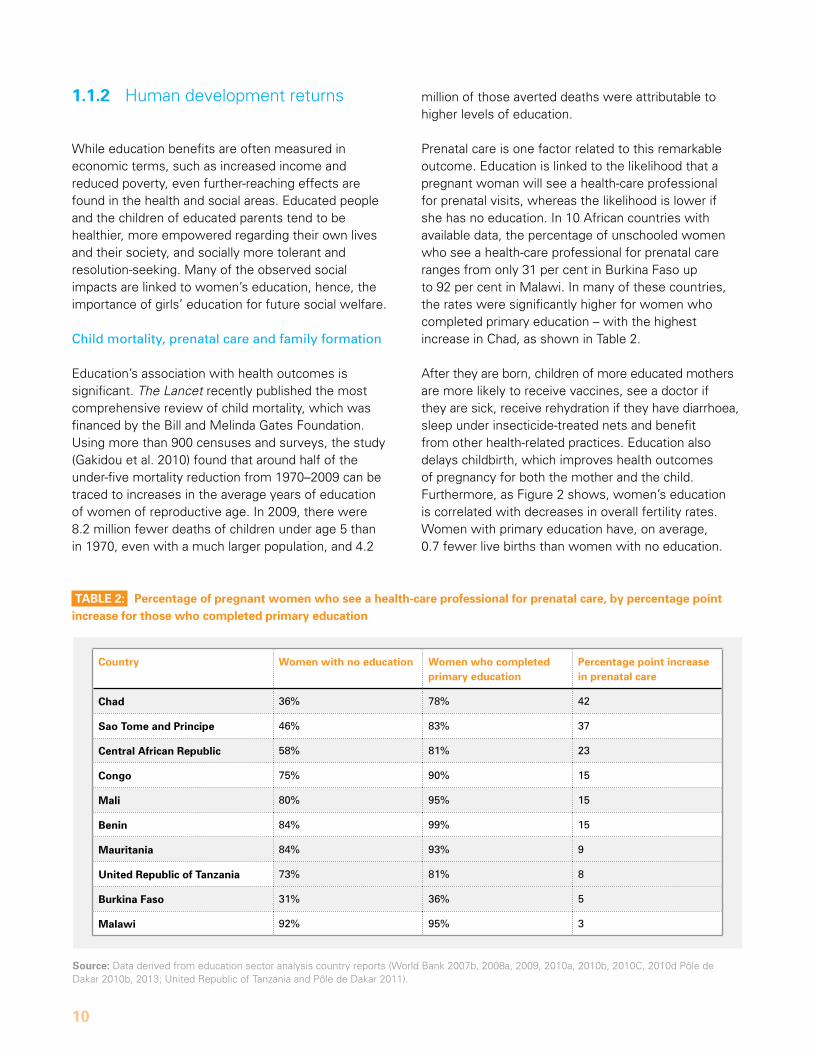
taBlE 2: Percentage of pregnant women who see a health-care professional for prenatal care, by percentage point increase for those who completed primary education
Source: data derived from education sector analysis country reports (World Bank 2007b, 2008a, 2009, 2010a, 2010b, 2010C, 2010d Pôle de dakar 2010b, 2013; united republic of Tanzania and Pôle de dakar 2011).
million of those averted deaths were attributable to higher levels of education.
Prenatal care is one factor related to this remarkable outcome. Education is linked to the likelihood that a pregnant woman will see a health-care professional for prenatal visits, whereas the likelihood is lower if she has no education. In 10 african countries with available data, the percentage of unschooled women who see a health-care professional for prenatal care ranges from only 31 per cent in Burkina Faso up to 92 per cent in malawi. In many of these countries, the rates were significantly higher for women who completed primary education – with the highest increase in Chad, as shown in Table 2.
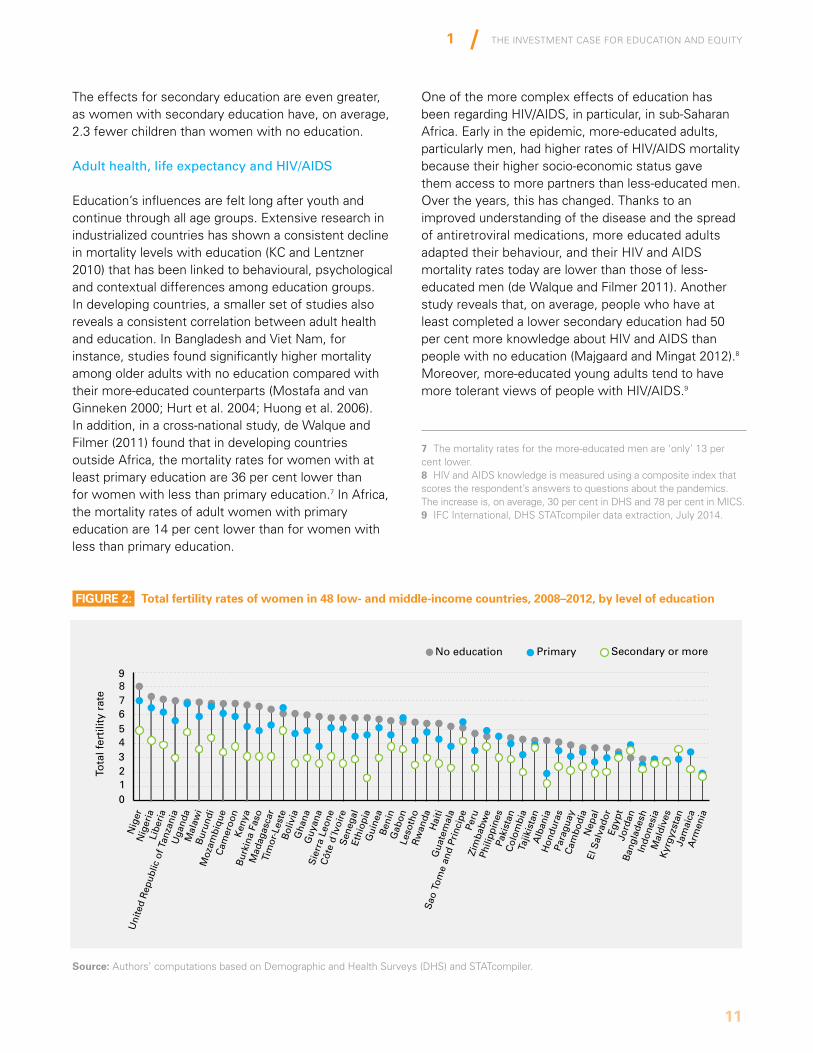
after they are born, children of more educated mothers are more likely to receive vaccines, see a doctor if they are sick, receive rehydration if they have diarrhoea, sleep under insecticide-treated nets and benefit from other health-related practices. Education also delays childbirth, which improves health outcomes of pregnancy for both the mother and the child. Furthermore, as Figure 2 shows, women’s education is correlated with decreases in overall fertility rates. Women with primary education have, on average, 0.7 fewer live births than women with no education.
country Women with no education Women who completed primary education
Percentage point increase in prenatal care
chad 36% 78% 42
Sao tome and Principe 46% 83% 37
central african Republic 58% 81% 23
congo 75% 90% 15
Mali 80% 95% 15
Benin 84% 99% 15
Mauritania 84% 93% 9
united Republic of tanzania 73% 81% 8
Burkina Faso 31% 36% 5
Malawi 92% 95% 3
The InvesTmenT Case for eduCaTIon and equITy
11
1
7 The mortality rates for the more-educated men are ‘only’ 13 per cent lower.8 HIV and aIds knowledge is measured using a composite index that scores the respondent’s answers to questions about the pandemics. The increase is, on average, 30 per cent in dHs and 78 per cent in mICs.9 IFC International, dHs sTaTcompiler data extraction, July 2014.
The effects for secondary education are even greater, as women with secondary education have, on average, 2.3 fewer children than women with no education.
Adult health, life expectancy and HIV/AIDS
Education’s influences are felt long after youth and continue through all age groups. Extensive research in industrialized countries has shown a consistent decline in mortality levels with education (KC and Lentzner 2010) that has been linked to behavioural, psychological and contextual differences among education groups. In developing countries, a smaller set of studies also reveals a consistent correlation between adult health and education. In Bangladesh and Viet nam, for instance, studies found significantly higher mortality among older adults with no education compared with their more-educated counterparts (mostafa and van Ginneken 2000; Hurt et al. 2004; Huong et al. 2006). In addition, in a cross-national study, de Walque and Filmer (2011) found that in developing countries outside africa, the mortality rates for women with at least primary education are 36 per cent lower than for women with less than primary education.7 In africa, the mortality rates of adult women with primary education are 14 per cent lower than for women with less than primary education.
one of the more complex effects of education has been regarding HIV/aIds, in particular, in sub-saharan africa. Early in the epidemic, more-educated adults, particularly men, had higher rates of HIV/aIds mortality because their higher socio-economic status gave them access to more partners than less-educated men. over the years, this has changed. Thanks to an improved understanding of the disease and the spread of antiretroviral medications, more educated adults adapted their behaviour, and their HIV and aIds mortality rates today are lower than those of less- educated men (de Walque and Filmer 2011). another study reveals that, on average, people who have at least completed a lower secondary education had 50 per cent more knowledge about HIV and aIds than people with no education (majgaard and mingat 2012).8 moreover, more-educated young adults tend to have more tolerant views of people with HIV/aIds.9
FiGuRE 2: total fertility rates of women in 48 low- and middle-income countries, 2008–2012, by level of education
Source: authors’ computations based on demographic and Health surveys (dHs) and sTaTcompiler.
Tota
l fer
tilit
y ra
te
Nig
erN
iger
iaLi
beri
a
Uni
ted
Rep
ublic
of T
anza
nia
Uga
nda
Mal
awi
Bur
undi
Moz
ambi
que
Cam
eroo
nK
enya
Bur
kina
Fas
oM
adag
asca
rTi
mor
-Les
teB
oliv
iaG
hana
Guy
ana
Sie
rra
Leon
eC
ôte
d´Iv
oire
Sen
egal
Ethi
opia
Gui
nea
Ben
inG
abon
Leso
tho
Rw
anda
Hai
tiG
uate
mal
a
Sao
Tom
e an
d Pr
inci
pePe
ruZi
mba
bwe
Phili
ppin
esPa
kist
anC
olom
bia
Tajik
ista
nA
lban
iaH
ondu
ras
Para
guay
Cam
bodi
aN
epal
El S
alva
dor
Egyp
tJo
rdan
Ban
glad
esh
Indo
nesi
aM
aldi
ves
Kyr
gyzs
tan
Jam
aica
Arm
enia
9876543
12
0
No education Primary Secondary or more
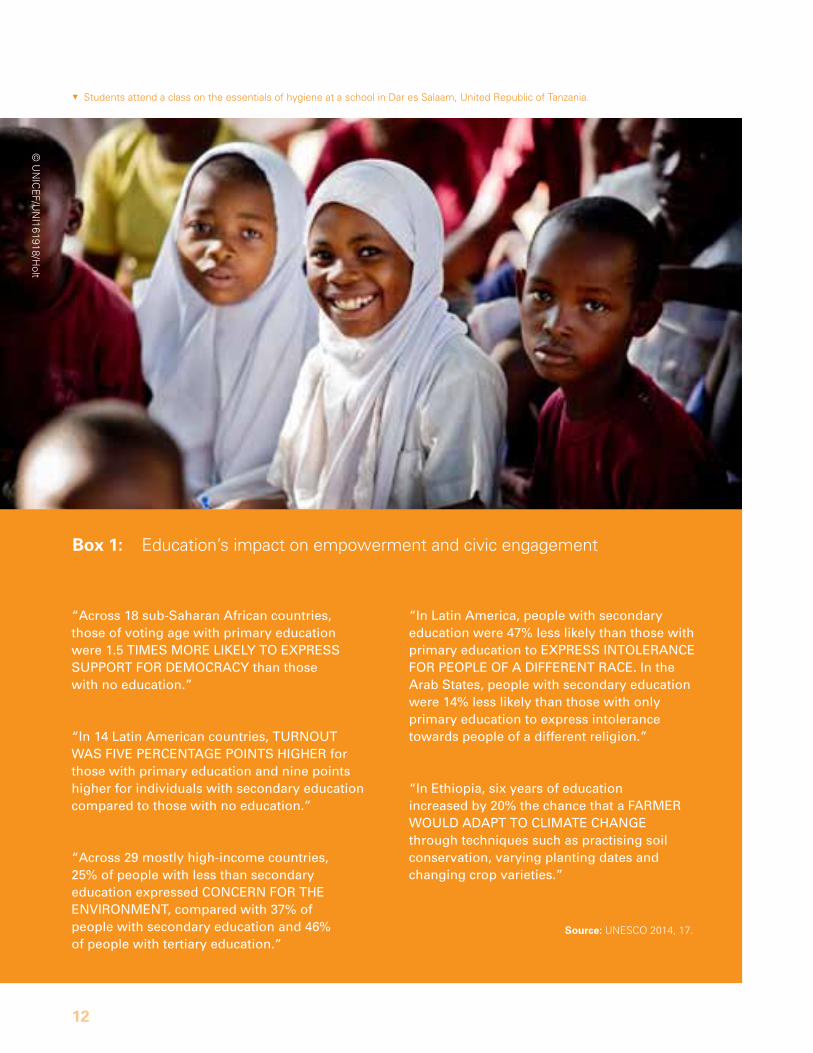
5students attend a class on the essentials of hygiene at a school in dar es salaam, united republic of Tanzania.
12
Source: unEsCo 2014, 17.
Box 1: Education’s impact on empowerment and civic engagement
“Across 18 sub-Saharan African countries, those of voting age with primary education were 1.5 TIMES MoRE LIKELy To ExPRESS SuPPoRT FoR DEMoCRACy than those with no education.”
“In 14 Latin American countries, TuRNouT WAS FIVE PERCENTAGE PoINTS HIGHER for those with primary education and nine points higher for individuals with secondary education compared to those with no education.”
“Across 29 mostly high-income countries, 25% of people with less than secondary education expressed CoNCERN FoR THE ENVIRoNMENT, compared with 37% of people with secondary education and 46% of people with tertiary education.”
“In Latin America, people with secondary education were 47% less likely than those with primary education to ExPRESS INToLERANCE FoR PEoPLE oF A DIFFERENT RACE. In the Arab States, people with secondary education were 14% less likely than those with only primary education to express intolerance towards people of a different religion.”
“In Ethiopia, six years of education increased by 20% the chance that a FARMER WouLD ADAPT To CLIMATE CHANGE through techniques such as practising soil conservation, varying planting dates and changing crop varieties.”
© u
nIC
EF/u
nI161918/H
olt
The InvesTmenT Case for eduCaTIon and equITy
13
1
Disability
not surprisingly, disabled children may have fewer educational opportunities (see Chapter 2 for greater analysis on disability and education). But there is also some evidence that suggests that less education itself leads to higher disability rates, for example, through lower access to health care, higher-risk jobs or unsafe health-related behaviours. In the majority of cases, adults with disabilities were not disabled as children. adult disability prevalence rates in low- and middle- income countries, for instance, are far higher than childhood disability, on average, about 18 per cent compared with about 5 per cent for children (WHo and World Bank 2011). For disabled adults who were not disabled as children, education-level differences suggest that the lack of education somehow has an impact on disability.
In this context, KC and Lentzner (2010) looked into the education disability gradient in low-income countries, using World Health surveys from 70 countries. They found that for adults over age 30 in africa, the odds of being disabled for women and men with no education is 1.9 and 1.8 times higher, respectively, than for women and men with secondary education and higher. In asia, women with no education were 3.8 times more likely to be disabled than women with secondary education and higher, and men were almost twice as likely to be disabled. In the most extreme case, in Latin america, women with no education are 4.7 times more likely to report being disabled than women with secondary education.
Empowerment and civic engagement
Higher education levels lead to higher empowerment and civic engagement. The EFA Global Monitoring Report 2013/4 (unEsCo 2014) presents a number of study results that highlight the importance of education for empowerment and civic engagement, including the understanding of and support for democracy, participation in civic life, tolerance for people of a different race or religion, and concern for the environment and adaptation to climate change (see Box 1).
Resilience and social cohesion
Education is crucial for fostering more cohesive societies and mending the social fabric that may have been damaged by years of conflict and violence.
Education can help children, communities and systems become resilient against conflict and disasters by building capacities and skills that will enable them to manage and resolve tensions and conflict peacefully (unICEF 2014). Education can also help address the inequalities that generate conflict. Education is arguably the single most transformative institution when it is equitable, of good quality, relevant and conflict-sensitive. It is central to identity formation, promotes inclusion and contributes to state building. most importantly, equity in education leads to conflict-risk reduction: In 55 low- and middle-income countries, where the level of educational inequality doubled,10 the probability of conflict more than doubled, from 3.8 per cent to 9.5 per cent (unEsCo 2014).
1.1.3 The virtuous cycle of education: Inter-generational effects
one of the most important effects of education is its impact on future generations.
at the individual level, education provides people with an increased likelihood to break the cycle of poverty. Children of more educated mothers, for instance, are more likely to attend school. research found that around 2003, for 16 sub-saharan african countries, on average, 68.0 per cent of children of uneducated mothers attended school, 87.7 per cent of children of mothers with six years of education attended school, and 95.5 per cent of children of mothers with 12 years of education attended school (majgaard and mingat 2012).
at the national level, education leads to economic growth, which provides countries with more resources to educate children. It also leads to lower birth rates, which makes it easier (by creating a smaller youth cohort) to accommodate all children in schools. In this context, a national increase in education creates better conditions to educate further generations. Progress towards inclusive education also leads to benefits such as faster poverty reduction and declining risks of conflict, which create better conditions for future generations.
10 Looking into years of education by ethnicity, religion and region of residence.
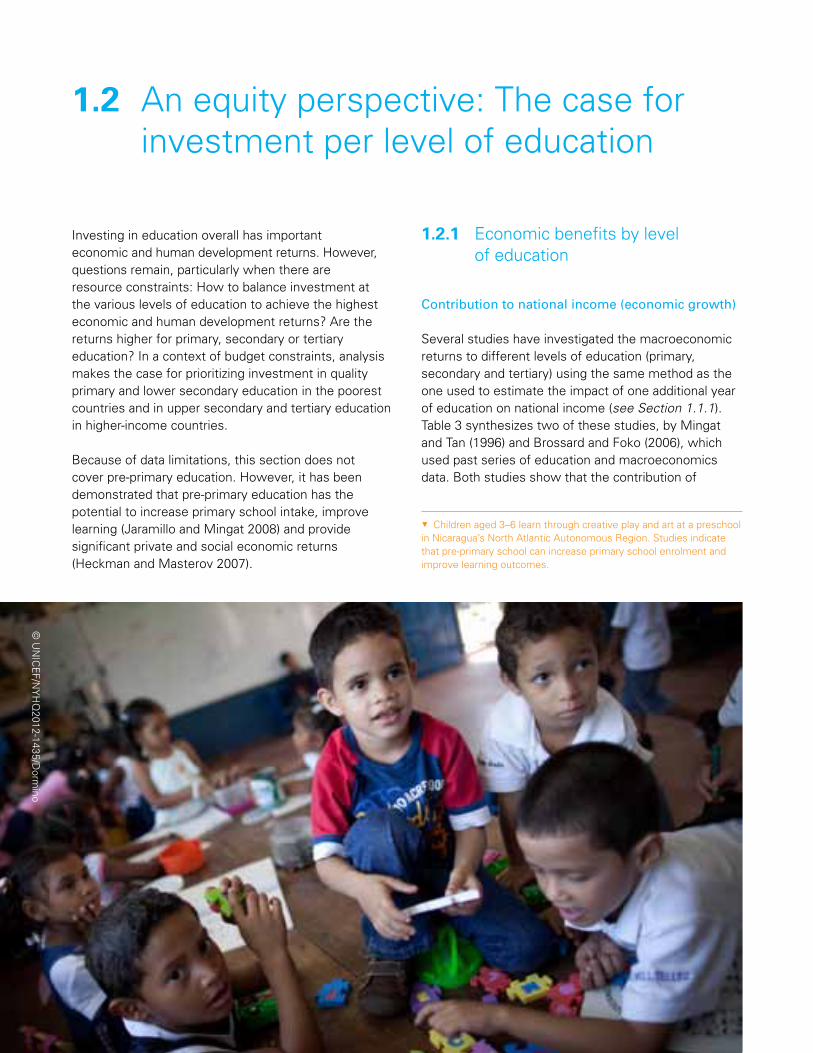
5Children aged 3–6 learn through creative play and art at a preschool in nicaragua’s north atlantic autonomous region. studies indicate that pre-primary school can increase primary school enrolment and improve learning outcomes.
14
Investing in education overall has important economic and human development returns. However, questions remain, particularly when there are resource constraints: How to balance investment at the various levels of education to achieve the highest economic and human development returns? are the returns higher for primary, secondary or tertiary education? In a context of budget constraints, analysis makes the case for prioritizing investment in quality primary and lower secondary education in the poorest countries and in upper secondary and tertiary education in higher-income countries.
Because of data limitations, this section does not cover pre-primary education. However, it has been demonstrated that pre-primary education has the potential to increase primary school intake, improve learning (Jaramillo and mingat 2008) and provide significant private and social economic returns (Heckman and masterov 2007).
1.2 an equity perspective: The case for investment per level of education
1.2.1 Economic benefits by level of education
Contribution to national income (economic growth)
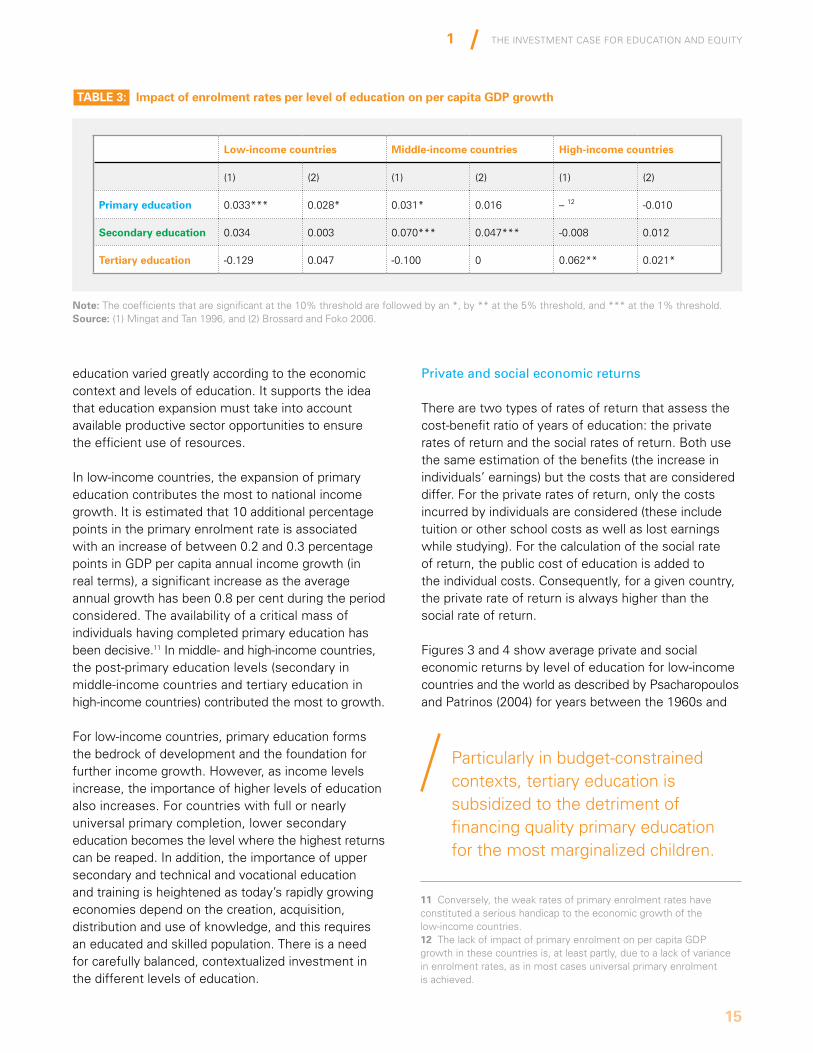
several studies have investigated the macroeconomic returns to different levels of education (primary, secondary and tertiary) using the same method as the one used to estimate the impact of one additional year of education on national income (see Section 1.1.1). Table 3 synthesizes two of these studies, by mingat and Tan (1996) and Brossard and Foko (2006), which used past series of education and macroeconomics data. Both studies show that the contribution of
© u
nIC
EF/n
yH
q2012-1435/d
ormino
The InvesTmenT Case for eduCaTIon and equITy
15
1
taBlE 3: impact of enrolment rates per level of education on per capita GdP growth
note: The coefficients that are significant at the 10% threshold are followed by an *, by ** at the 5% threshold, and *** at the 1% threshold.Source: (1) mingat and Tan 1996, and (2) Brossard and Foko 2006.
low-income countries Middle-income countries High-income countries
(1) (2) (1) (2) (1) (2)
Primary education 0.033*** 0.028* 0.031* 0.016 – 12 -0.010
Secondary education 0.034 0.003 0.070*** 0.047*** -0.008 0.012
tertiary education -0.129 0.047 -0.100 0 0.062** 0.021*
education varied greatly according to the economic context and levels of education. It supports the idea that education expansion must take into account available productive sector opportunities to ensure the efficient use of resources.
In low-income countries, the expansion of primary education contributes the most to national income growth. It is estimated that 10 additional percentage points in the primary enrolment rate is associated with an increase of between 0.2 and 0.3 percentage points in GdP per capita annual income growth (in real terms), a significant increase as the average annual growth has been 0.8 per cent during the period considered. The availability of a critical mass of individuals having completed primary education has been decisive.11 In middle- and high-income countries, the post-primary education levels (secondary in middle-income countries and tertiary education in high-income countries) contributed the most to growth.
For low-income countries, primary education forms the bedrock of development and the foundation for further income growth. However, as income levels increase, the importance of higher levels of education also increases. For countries with full or nearly universal primary completion, lower secondary education becomes the level where the highest returns can be reaped. In addition, the importance of upper secondary and technical and vocational education and training is heightened as today’s rapidly growing economies depend on the creation, acquisition, distribution and use of knowledge, and this requires an educated and skilled population. There is a need for carefully balanced, contextualized investment in the different levels of education.
Private and social economic returns
There are two types of rates of return that assess the cost-benefit ratio of years of education: the private rates of return and the social rates of return. Both use the same estimation of the benefits (the increase in individuals’ earnings) but the costs that are considered differ. For the private rates of return, only the costs incurred by individuals are considered (these include tuition or other school costs as well as lost earnings while studying). For the calculation of the social rate of return, the public cost of education is added to the individual costs. Consequently, for a given country, the private rate of return is always higher than the social rate of return.
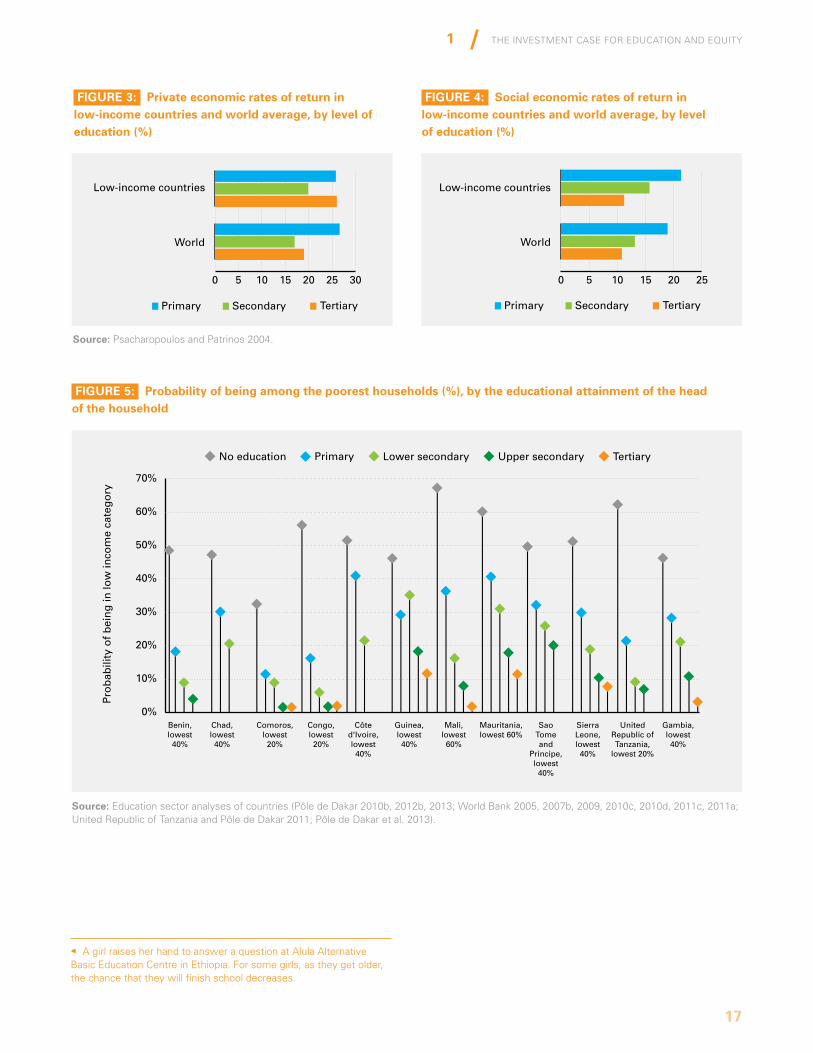
Figures 3 and 4 show average private and social economic returns by level of education for low-income countries and the world as described by Psacharopoulos and Patrinos (2004) for years between the 1960s and
11 Conversely, the weak rates of primary enrolment rates have constituted a serious handicap to the economic growth of the low-income countries.12 The lack of impact of primary enrolment on per capita GdP growth in these countries is, at least partly, due to a lack of variance in enrolment rates, as in most cases universal primary enrolment is achieved.
Particularly in budget-constrained contexts, tertiary education is subsidized to the detriment of financing quality primary education for the most marginalized children.
16
the 1990s. Taken globally, there are different patterns between private and social economic returns. social economic returns decrease with the level of education: Public costs for the education system increase more than earning benefits. Private returns follow a different pattern: They are high for an individual in primary education (as compared to an individual with no education), drop in secondary education and rise again with tertiary education.
The difference between private and social economic returns for tertiary education is particularly striking in low-income countries, at 26 per cent for private returns versus 11 per cent for social returns, taking into account public cost. This should be put in perspective with the discussions regarding household-government cost-sharing (see Section 3.3.4) and socio-economic inequities in terms of access to the highest levels of education (see Section 1.2.2) because it raises an equity issue: Children from the poorest households in low-income countries are often excluded from access to tertiary education – and often even secondary education – which is associated with high private returns and much lower social returns. Thus, for at least some countries, there is a lack of pro-equity public financing across levels of education. Particularly in budget-constrained contexts, tertiary education is subsidized to the detriment of financing quality primary education for the most-marginalized children.
Poverty
as a corollary to the income effects of education, poverty rates decline with each level of education, particularly for primary education. Figure 5 shows the proportions of lower-income households in 12 african countries. on average, approximately half of the households led by an adult with no education are lower-income. The chance of being poor, on average, is 28 per cent for households headed by adults with primary education, 19 per cent for households headed by an adult with lower secondary education and only 6 per cent for households headed by an adult with tertiary education. The greatest reduction in poverty is associ-ated with primary education, followed by secondary.13
Lorem Ipsum is simply dummy text of the printing and typesetting industry. Lorem Ipsum has been the industry’s standard dummy text ever since the 1500s.
13 note that this does not contradict the results regarding private income returns: tertiary education may bring significantly higher personal income than secondary education, but if at both levels there is a low likelihood of being poor, poverty gains from tertiary education will be low, with the highest gains being at the lowest levels of the education ladder.
© u
nIC
EF/E
THa
_2014_00111/ose
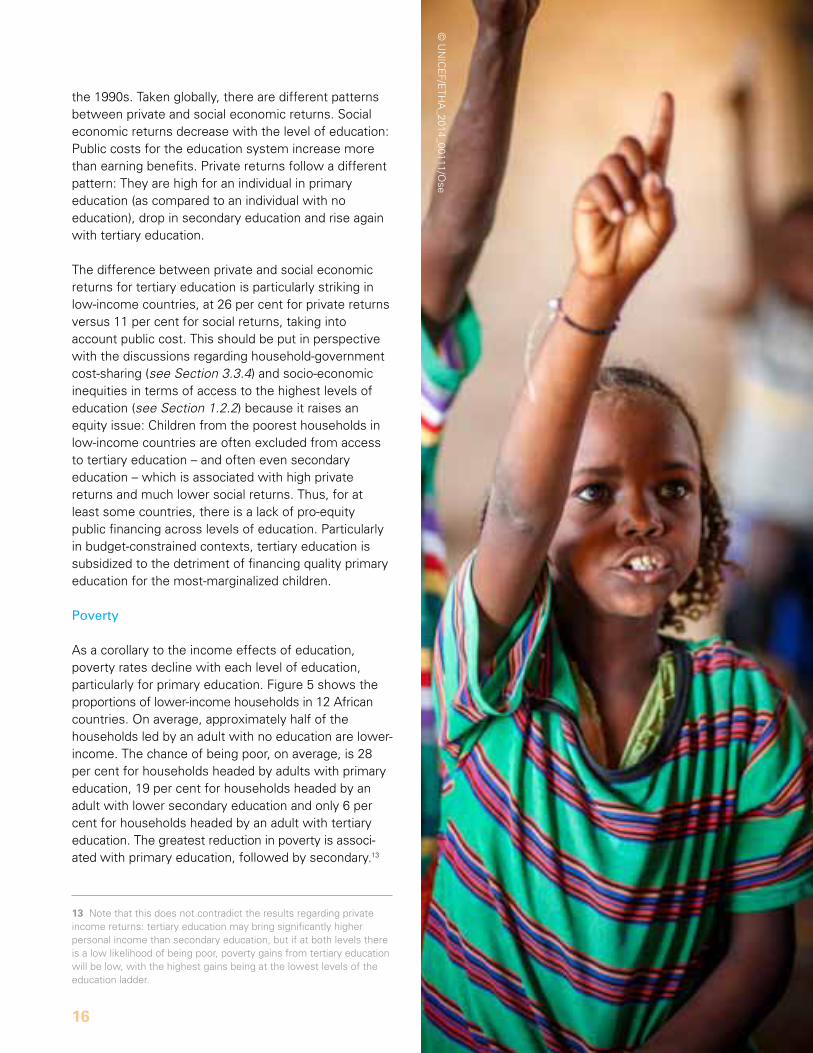
a girl raises her hand to answer a question at alula alternative Basic Education Centre in Ethiopia. For some girls, as they get older, the chance that they will finish school decreases.
The InvesTmenT Case for eduCaTIon and equITy
17
1
FiGuRE 3: Private economic rates of return in low-income countries and world average, by level of education (%)
FiGuRE 5: Probability of being among the poorest households (%), by the educational attainment of the head of the household
FiGuRE 4: Social economic rates of return in low-income countries and world average, by level of education (%)
Low-income countries
World
Low-income countries
World
0 5 10 15 20 25 30 0 5 10 15 20 25
Primary Secondary Tertiary Primary Secondary Tertiary
Low-income countries
World
Low-income countries
World
0 5 10 15 20 25 30 0 5 10 15 20 25
Primary Secondary Tertiary Primary Secondary Tertiary
Source: Psacharopoulos and Patrinos 2004.
Source: Education sector analyses of countries (Pôle de dakar 2010b, 2012b, 2013; World Bank 2005, 2007b, 2009, 2010c, 2010d, 2011c, 2011a; united republic of Tanzania and Pôle de dakar 2011; Pôle de dakar et al. 2013).
0%
10%
20%
30%
40%
50%
60%
70%
No education Primary Lower secondary Upper secondary Tertiary
Pro
bab
ility
of
bei
ng
in lo
w in
com
e ca
teg
ory
Benin, lowest 40%
Chad, lowest 40%
Comoros, lowest 20%
Congo, lowest 20%
Côte d'Ivoire, lowest 40%
Guinea, lowest 40%
Mali, lowest 60%
Mauritania, lowest 60%
Sao Tome and
Principe, lowest 40%
Sierra Leone, lowest 40%
United Republic of Tanzania,
lowest 20%
Gambia, lowest 40%
18
1.2.2 Human development benefits by level of education
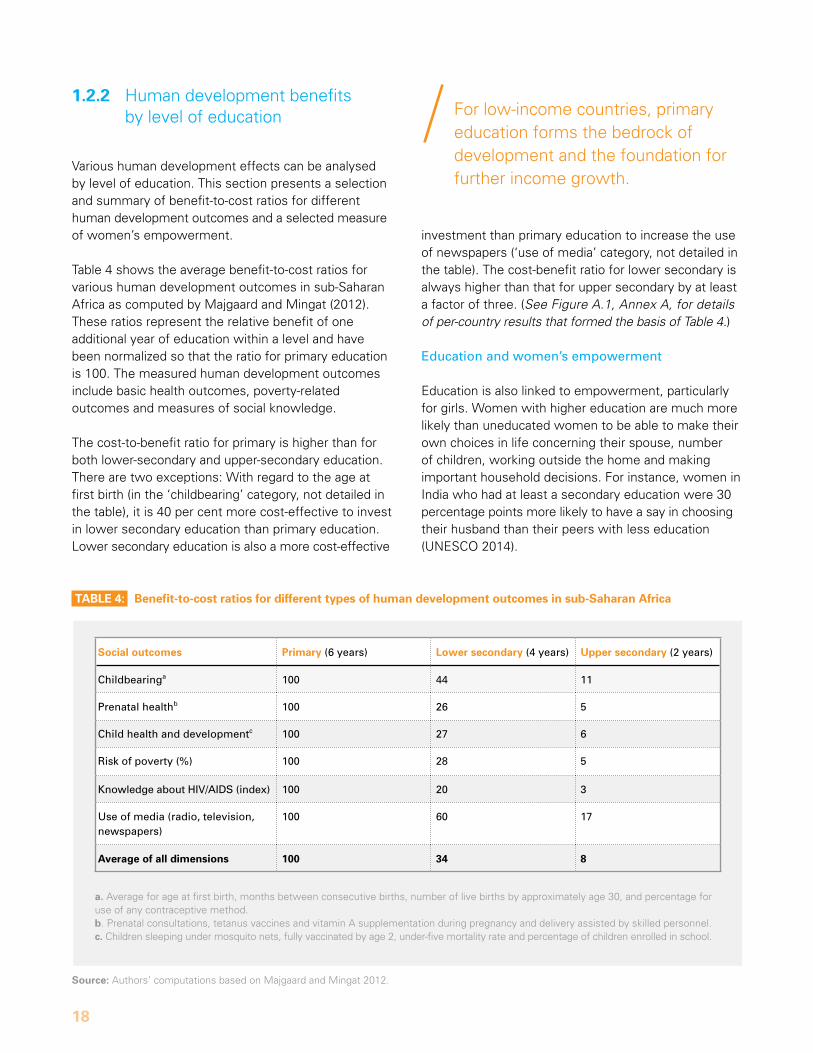
Various human development effects can be analysed by level of education. This section presents a selection and summary of benefit-to-cost ratios for different human development outcomes and a selected measure of women’s empowerment.
Table 4 shows the average benefit-to-cost ratios for various human development outcomes in sub-saharan africa as computed by majgaard and mingat (2012). These ratios represent the relative benefit of one additional year of education within a level and have been normalized so that the ratio for primary education is 100. The measured human development outcomes include basic health outcomes, poverty-related outcomes and measures of social knowledge.
The cost-to-benefit ratio for primary is higher than for both lower-secondary and upper-secondary education. There are two exceptions: With regard to the age at first birth (in the ‘childbearing’ category, not detailed in the table), it is 40 per cent more cost-effective to invest in lower secondary education than primary education. Lower secondary education is also a more cost-effective
taBlE 4: Benefit-to-cost ratios for different types of human development outcomes in sub-Saharan africa
a. average for age at first birth, months between consecutive births, number of live births by approximately age 30, and percentage for use of any contraceptive method. b. Prenatal consultations, tetanus vaccines and vitamin a supplementation during pregnancy and delivery assisted by skilled personnel. c. Children sleeping under mosquito nets, fully vaccinated by age 2, under-five mortality rate and percentage of children enrolled in school.
Source: authors’ computations based on majgaard and mingat 2012.
Social outcomes Primary (6 years) lower secondary (4 years) upper secondary (2 years)
Childbearinga 100 44 11
Prenatal healthb 100 26 5
Child health and developmentc 100 27 6
Risk of poverty (%) 100 28 5
Knowledge about HIV/AIDS (index) 100 20 3
use of media (radio, television, newspapers)
100 60 17
average of all dimensions 100 34 8
investment than primary education to increase the use of newspapers (‘use of media’ category, not detailed in the table). The cost-benefit ratio for lower secondary is always higher than that for upper secondary by at least a factor of three. (See Figure A.1, Annex A, for details of per-country results that formed the basis of Table 4.)
Education and women’s empowerment
Education is also linked to empowerment, particularly for girls. Women with higher education are much more likely than uneducated women to be able to make their own choices in life concerning their spouse, number of children, working outside the home and making important household decisions. For instance, women in India who had at least a secondary education were 30 percentage points more likely to have a say in choosing their husband than their peers with less education (unEsCo 2014).
For low-income countries, primary education forms the bedrock of development and the foundation for further income growth.
3This 13-year-old girl in Bangladesh hopes to become a doctor one day. she has already overcome the threat of a child marriage and has been able to continue her studies. But child marriage is a danger that can impede girls’ efforts to finish school.
19
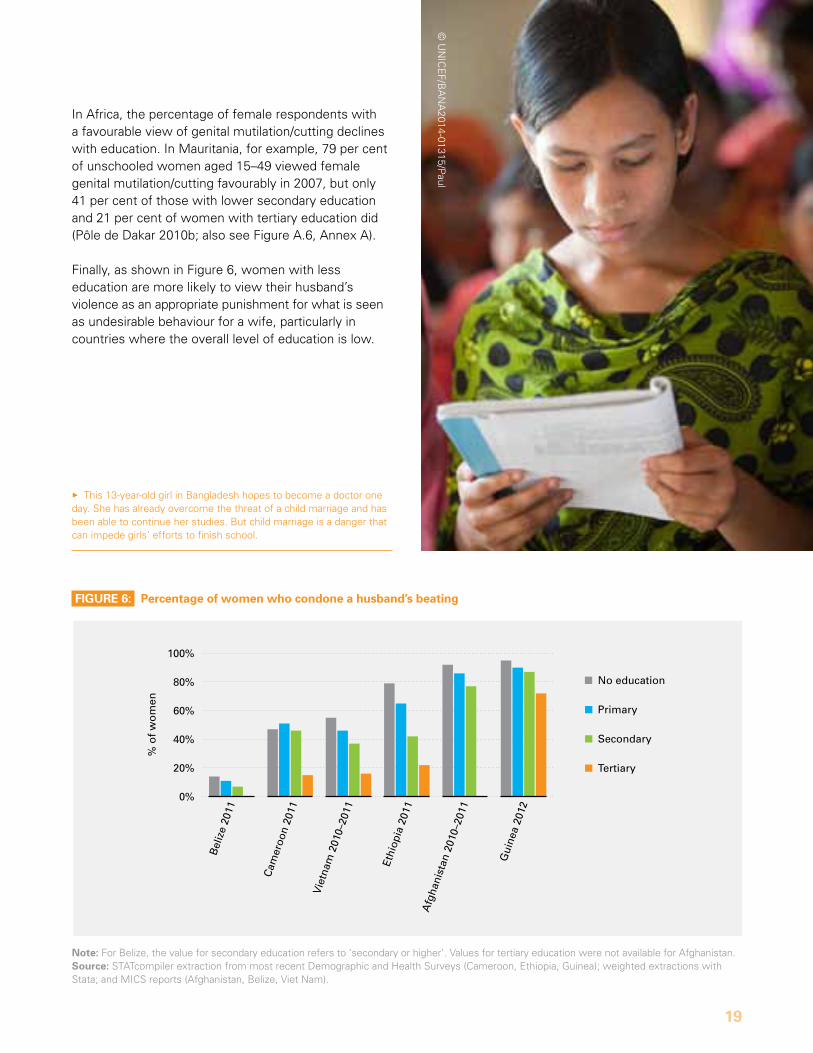
FiGuRE 6: Percentage of women who condone a husband’s beating
note: For Belize, the value for secondary education refers to ‘secondary or higher’. Values for tertiary education were not available for afghanistan.Source: sTaTcompiler extraction from most recent demographic and Health surveys (Cameroon, Ethiopia, Guinea); weighted extractions with stata; and mICs reports (afghanistan, Belize, Viet nam).
In africa, the percentage of female respondents with a favourable view of genital mutilation/cutting declines with education. In mauritania, for example, 79 per cent of unschooled women aged 15–49 viewed female genital mutilation/cutting favourably in 2007, but only 41 per cent of those with lower secondary education and 21 per cent of women with tertiary education did (Pôle de dakar 2010b; also see Figure a.6, annex a).
Finally, as shown in Figure 6, women with less education are more likely to view their husband’s violence as an appropriate punishment for what is seen as undesirable behaviour for a wife, particularly in countries where the overall level of education is low.
% o
f w
om
en
0%
20%
40%
60%
80%
100%
Bel
ize
2011
Cam
eroo
n 20
11
Vie
tnam
201
0–20
11
Ethi
opia
201
1
Afg
hani
stan
201
0–20
11
Gui
nea
2012
No education
Primary
Secondary
Tertiary
© u
nIC
EF/B
an
a2014-01315/P
aul
20
© u
nIC
EF/n
yH
q2014-0167/n
oorani
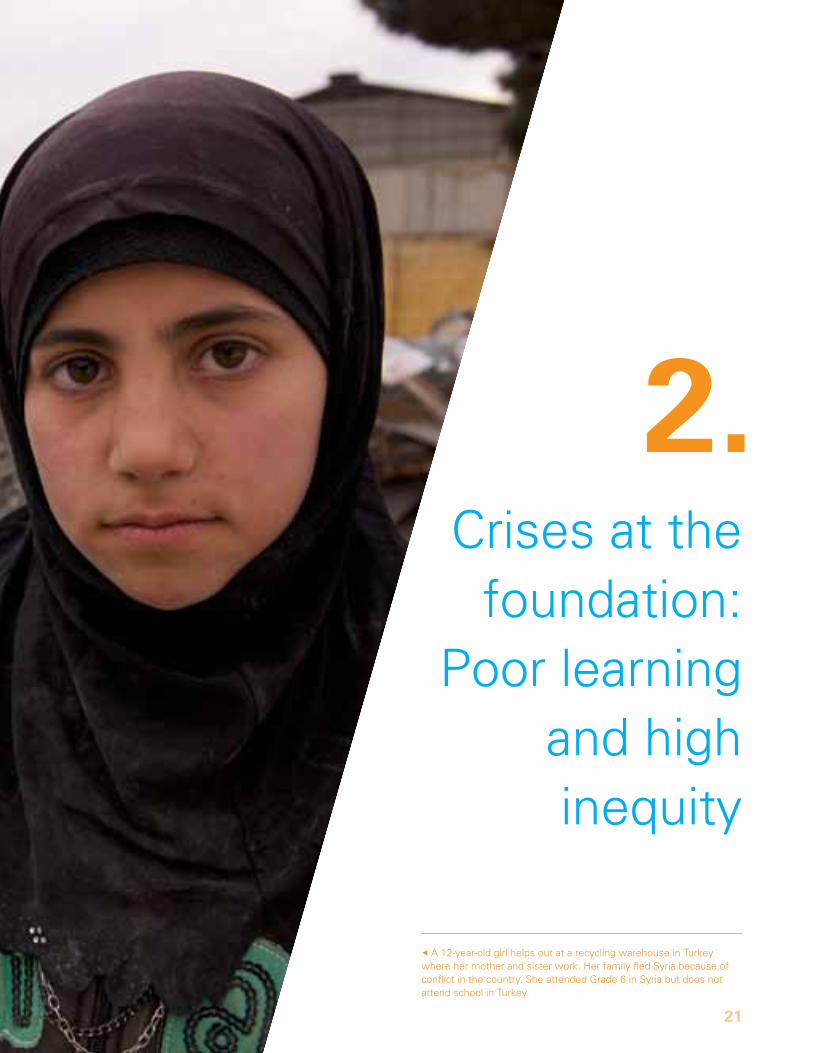
7 a 12-year-old girl helps out at a recycling warehouse in Turkey where her mother and sister work. Her family fled syria because of conflict in the country. she attended Grade 6 in syria but does not attend school in Turkey.
2. Crises at the
foundation: Poor learning
and high inequity
21
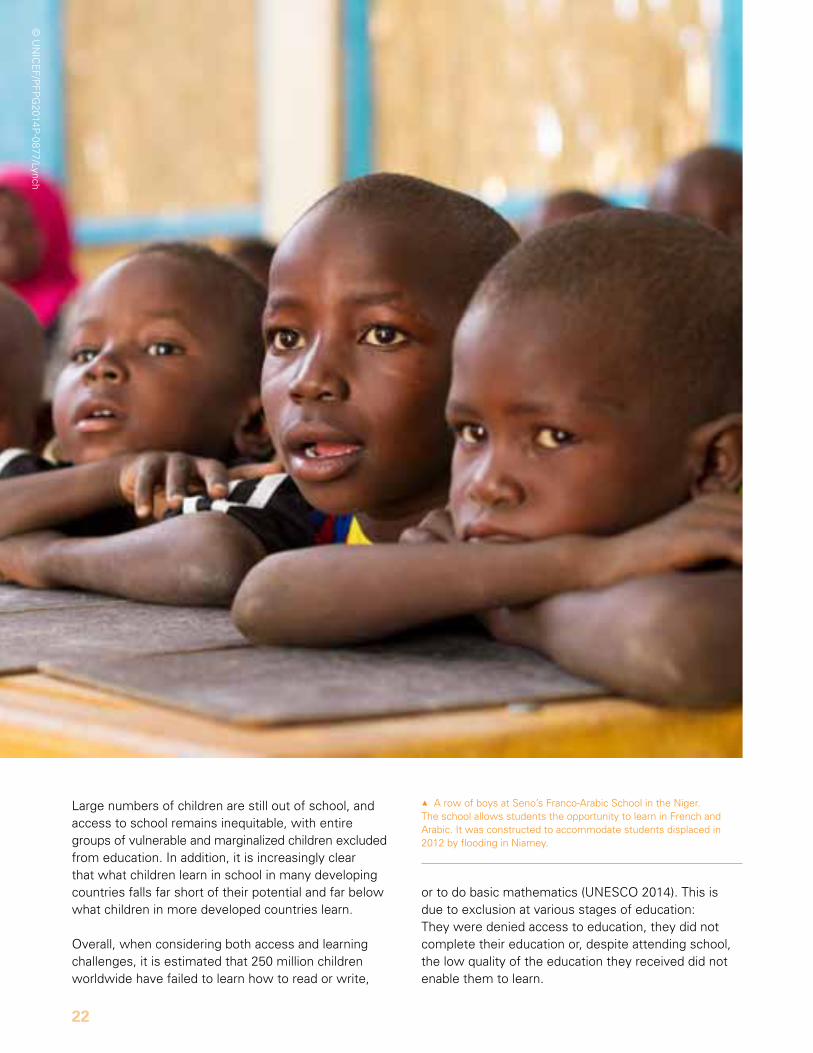
1 a row of boys at seno’s Franco-arabic school in the niger. The school allows students the opportunity to learn in French and arabic. It was constructed to accommodate students displaced in 2012 by flooding in niamey.
22
Large numbers of children are still out of school, and access to school remains inequitable, with entire groups of vulnerable and marginalized children excluded from education. In addition, it is increasingly clear that what children learn in school in many developing countries falls far short of their potential and far below what children in more developed countries learn.
overall, when considering both access and learning challenges, it is estimated that 250 million children worldwide have failed to learn how to read or write,
or to do basic mathematics (unEsCo 2014). This is due to exclusion at various stages of education: They were denied access to education, they did not complete their education or, despite attending school, the low quality of the education they received did not enable them to learn.
© u
nIC
EF/P
FPG
2014P-0877/Lynch
THE InVEsTmEnT CasE For EduCaTIon and EquITy
23
2
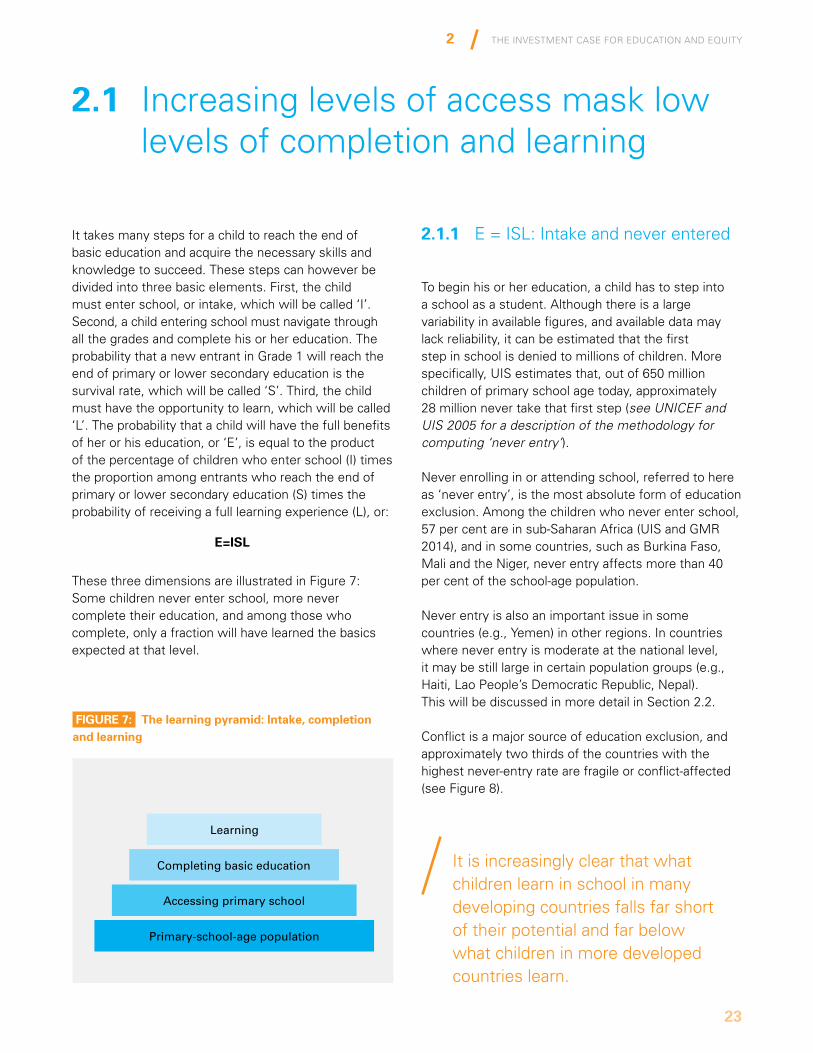
It takes many steps for a child to reach the end of basic education and acquire the necessary skills and knowledge to succeed. These steps can however be divided into three basic elements. First, the child must enter school, or intake, which will be called ‘I’. second, a child entering school must navigate through all the grades and complete his or her education. The probability that a new entrant in Grade 1 will reach the end of primary or lower secondary education is the survival rate, which will be called ‘s’. Third, the child must have the opportunity to learn, which will be called ‘L’. The probability that a child will have the full benefits of her or his education, or ‘E’, is equal to the product of the percentage of children who enter school (I) times the proportion among entrants who reach the end of primary or lower secondary education (s) times the probability of receiving a full learning experience (L), or:
E=iSl
These three dimensions are illustrated in Figure 7: some children never enter school, more never complete their education, and among those who complete, only a fraction will have learned the basics expected at that level.
2.1 Increasing levels of access mask low levels of completion and learning
Primary-school-age population
Accessing primary school
Completing basic education
Learning
FiGuRE 7: the learning pyramid: intake, completion and learning
It is increasingly clear that what children learn in school in many developing countries falls far short of their potential and far below what children in more developed countries learn.
2.1.1 E = IsL: Intake and never entered
To begin his or her education, a child has to step into a school as a student. although there is a large variability in available figures, and available data may lack reliability, it can be estimated that the first step in school is denied to millions of children. more specifically, uIs estimates that, out of 650 million children of primary school age today, approximately 28 million never take that first step (see UNICEF and UIS 2005 for a description of the methodology for computing ‘never entry’).
never enrolling in or attending school, referred to here as ‘never entry’, is the most absolute form of education exclusion. among the children who never enter school, 57 per cent are in sub-saharan africa (uIs and Gmr 2014), and in some countries, such as Burkina Faso, mali and the niger, never entry affects more than 40 per cent of the school-age population.
never entry is also an important issue in some countries (e.g., yemen) in other regions. In countries where never entry is moderate at the national level, it may be still large in certain population groups (e.g., Haiti, Lao People’s democratic republic, nepal). This will be discussed in more detail in section 2.2.
Conflict is a major source of education exclusion, and approximately two thirds of the countries with the highest never-entry rate are fragile or conflict-affected (see Figure 8).
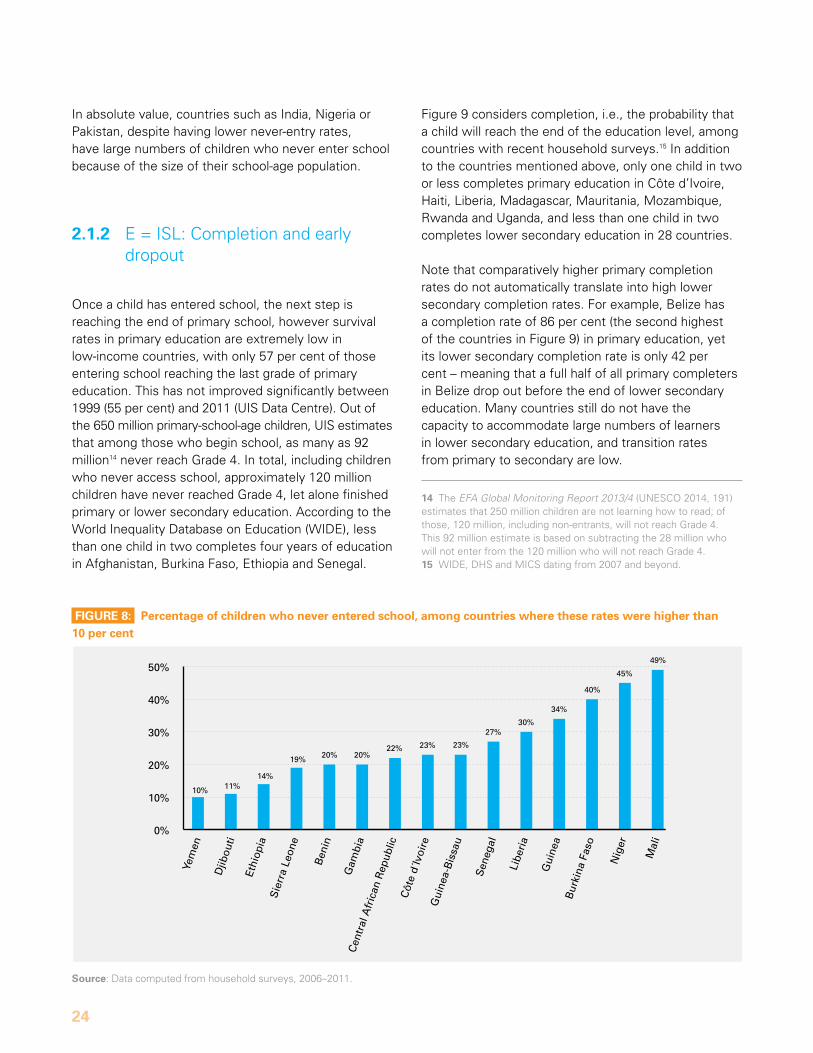
24
FiGuRE 8: Percentage of children who never entered school, among countries where these rates were higher than 10 per cent
Source: data computed from household surveys, 2006–2011.
0%
10%
20%
30%
40%
50%
10% 11%14%
19% 20% 20%22% 23% 23%
27%30%
34%
40%
45%
49%
Yem
en
Djib
outi
Ethi
opia
Sie
rra
Leon
e
Ben
in
Gam
bia
Cen
tral
Afr
ican
Rep
ublic
C
ôte
d´Iv
oire
Gui
nea-
Bis
sau
Sen
egal
Libe
ria
Gui
nea
Bur
kina
Fas
o
Nig
er
Mal
i
In absolute value, countries such as India, nigeria or Pakistan, despite having lower never-entry rates, have large numbers of children who never enter school because of the size of their school-age population.
2.1.2 E = IsL: Completion and early dropout
once a child has entered school, the next step is reaching the end of primary school, however survival rates in primary education are extremely low in low-income countries, with only 57 per cent of those entering school reaching the last grade of primary education. This has not improved significantly between 1999 (55 per cent) and 2011 (uIs data Centre). out of the 650 million primary-school-age children, uIs estimates that among those who begin school, as many as 92 million14 never reach Grade 4. In total, including children who never access school, approximately 120 million children have never reached Grade 4, let alone finished primary or lower secondary education. according to the World Inequality database on Education (WIdE), less than one child in two completes four years of education in afghanistan, Burkina Faso, Ethiopia and senegal.
Figure 9 considers completion, i.e., the probability that a child will reach the end of the education level, among countries with recent household surveys.15 In addition to the countries mentioned above, only one child in two or less completes primary education in Côte d’Ivoire, Haiti, Liberia, madagascar, mauritania, mozambique, rwanda and uganda, and less than one child in two completes lower secondary education in 28 countries.
note that comparatively higher primary completion rates do not automatically translate into high lower secondary completion rates. For example, Belize has a completion rate of 86 per cent (the second highest of the countries in Figure 9) in primary education, yet its lower secondary completion rate is only 42 per cent – meaning that a full half of all primary completers in Belize drop out before the end of lower secondary education. many countries still do not have the capacity to accommodate large numbers of learners in lower secondary education, and transition rates from primary to secondary are low.
14 The EFA Global Monitoring Report 2013/4 (unEsCo 2014, 191) estimates that 250 million children are not learning how to read; of those, 120 million, including non-entrants, will not reach Grade 4. This 92 million estimate is based on subtracting the 28 million who will not enter from the 120 million who will not reach Grade 4.15 WIdE, dHs and mICs dating from 2007 and beyond.
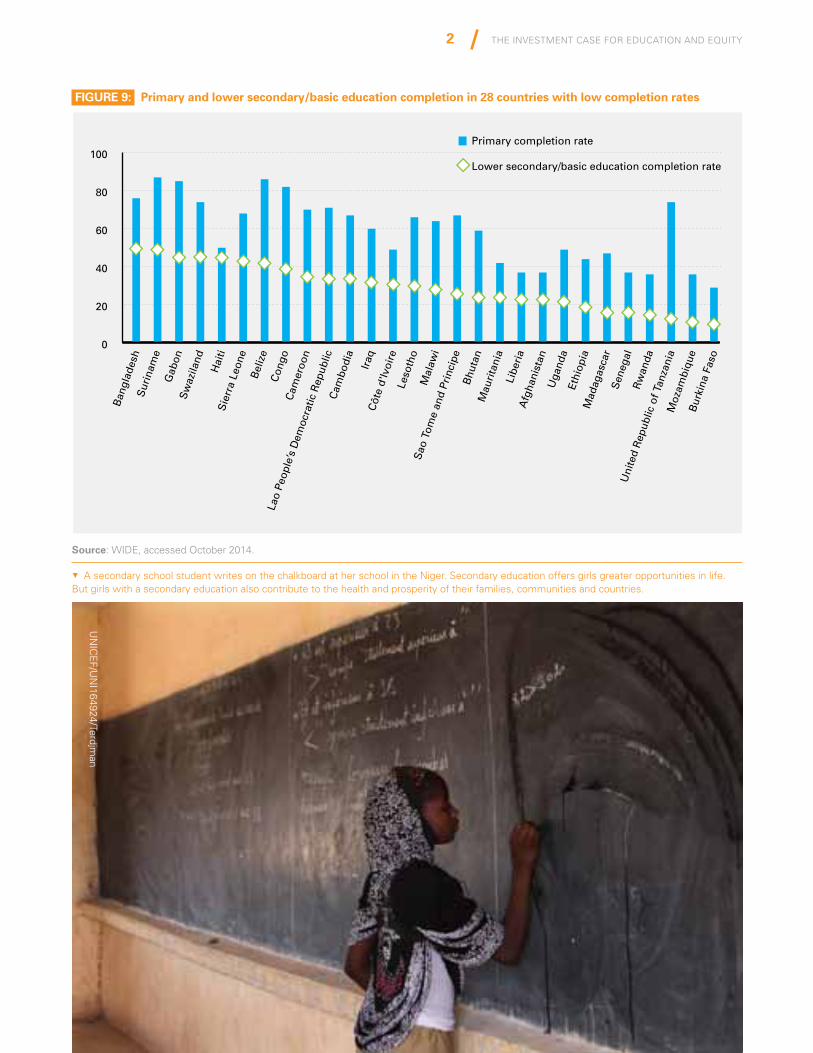
FiGuRE 9: Primary and lower secondary/basic education completion in 28 countries with low completion rates
Source: WIdE, accessed october 2014.
Ban
glad
esh
Sur
inam
eG
abon
Sw
azila
nd
Hai
tiS
ierr
a Le
one
Bel
ize
Con
goC
amer
oon
Lao
Peop
le’s
Dem
ocra
tic R
epub
lic
Cam
bodi
a
Iraq
Côt
e d'
Ivoi
reLe
soth
oM
alaw
i
Sao
Tom
e an
d Pr
inci
pe
Bhu
tan
Mau
rita
nia
Libe
ria
Afg
hani
stan
Uga
nda
Ethi
opia
Mad
agas
car
Sen
egal
Rw
anda
Uni
ted
Rep
ublic
of T
anza
nia
Moz
ambi
que
Bur
kina
Fas
o
0
20
40
60
80
100Primary completion rate
Lower secondary/basic education completion rate
THE InVEsTmEnT CasE For EduCaTIon and EquITy
25
2
5a secondary school student writes on the chalkboard at her school in the niger. secondary education offers girls greater opportunities in life. But girls with a secondary education also contribute to the health and prosperity of their families, communities and countries.
un
ICE
F/un
I164924/Terdjman
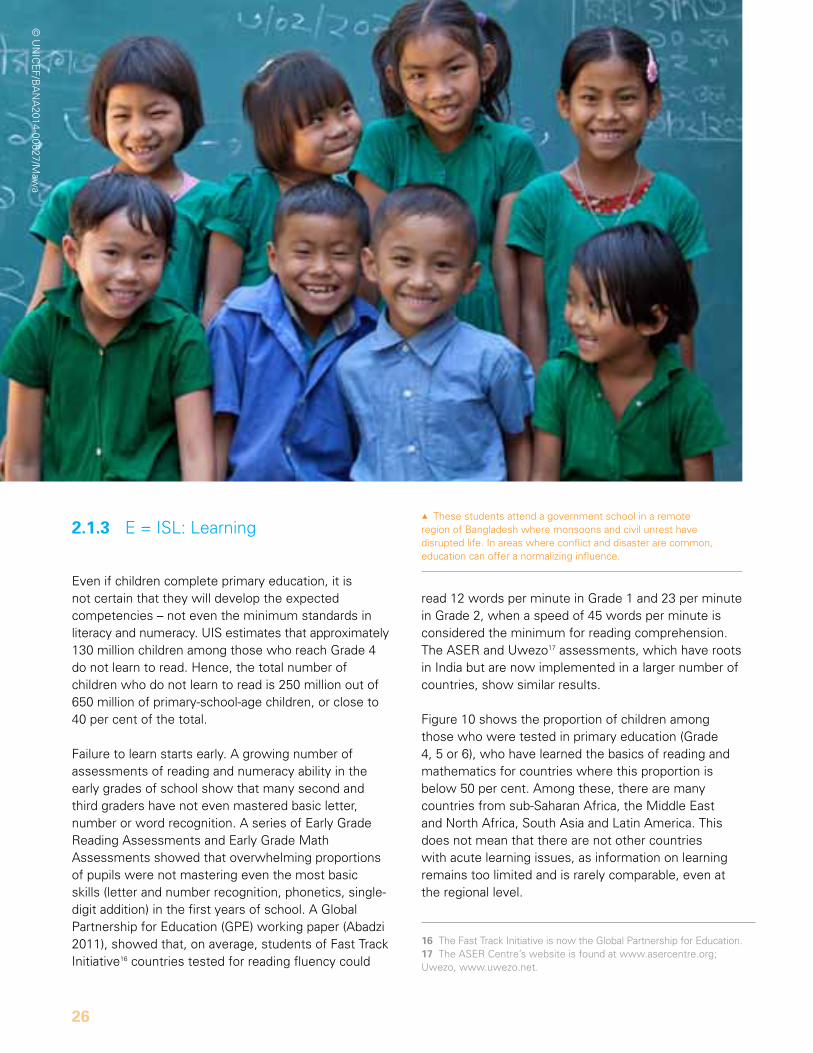
1These students attend a government school in a remote region of Bangladesh where monsoons and civil unrest have disrupted life. In areas where conflict and disaster are common, education can offer a normalizing influence.
26
2.1.3 E = IsL: Learning
Even if children complete primary education, it is not certain that they will develop the expected competencies – not even the minimum standards in literacy and numeracy. uIs estimates that approximately 130 million children among those who reach Grade 4 do not learn to read. Hence, the total number of children who do not learn to read is 250 million out of 650 million of primary-school-age children, or close to 40 per cent of the total.
Failure to learn starts early. a growing number of assessments of reading and numeracy ability in the early grades of school show that many second and third graders have not even mastered basic letter, number or word recognition. a series of Early Grade reading assessments and Early Grade math assessments showed that overwhelming proportions of pupils were not mastering even the most basic skills (letter and number recognition, phonetics, single-digit addition) in the first years of school. a Global Partnership for Education (GPE) working paper (abadzi 2011), showed that, on average, students of Fast Track Initiative16 countries tested for reading fluency could
16 The Fast Track Initiative is now the Global Partnership for Education.17 The asEr Centre’s website is found at www.asercentre.org; uwezo, www.uwezo.net.
read 12 words per minute in Grade 1 and 23 per minute in Grade 2, when a speed of 45 words per minute is considered the minimum for reading comprehension. The asEr and uwezo17 assessments, which have roots in India but are now implemented in a larger number of countries, show similar results.
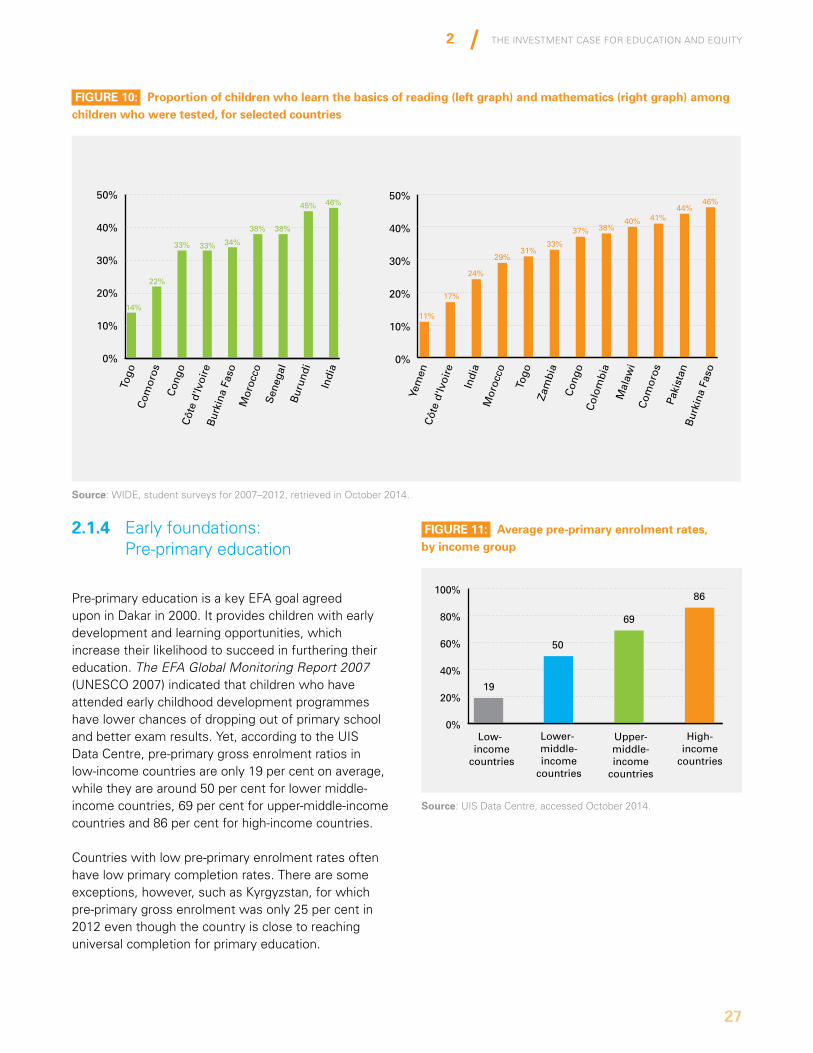
Figure 10 shows the proportion of children among those who were tested in primary education (Grade 4, 5 or 6), who have learned the basics of reading and mathematics for countries where this proportion is below 50 per cent. among these, there are many countries from sub-saharan africa, the middle East and north africa, south asia and Latin america. This does not mean that there are not other countries with acute learning issues, as information on learning remains too limited and is rarely comparable, even at the regional level.
© u
nIC
EF/B
an
a2014-00627/m
awa
THE InVEsTmEnT CasE For EduCaTIon and EquITy
27
2
FiGuRE 10: Proportion of children who learn the basics of reading (left graph) and mathematics (right graph) among children who were tested, for selected countries
FiGuRE 11: average pre-primary enrolment rates, by income group
Source: WIdE, student surveys for 2007–2012, retrieved in october 2014.
Source: uIs data Centre, accessed october 2014.
Togo
Com
oros
Con
goC
ôte
d'Iv
oire
Bur
kina
Fas
oM
oroc
coS
eneg
alB
urun
di
Indi
a
Yem
enC
ôte
d'Iv
oire
Indi
aM
oroc
co
Togo
Zam
bia
Con
goC
olom
bia
Mal
awi
Com
oros
Paki
stan
Bur
kina
Fas
o
14%
22%
33%
11%
17%
24%
29%31%
33%
37% 38%40% 41%
44%46%
33% 34%
38%
45% 46%
0%
10%
20%
30%
40%
50%
0%
10%
20%
30%
40%
50%
38%
2.1.4 Early foundations: Pre-primary education
Pre-primary education is a key EFa goal agreed upon in dakar in 2000. It provides children with early development and learning opportunities, which increase their likelihood to succeed in furthering their education. The EFA Global Monitoring Report 2007 (unEsCo 2007) indicated that children who have attended early childhood development programmes have lower chances of dropping out of primary school and better exam results. yet, according to the uIs data Centre, pre-primary gross enrolment ratios in low-income countries are only 19 per cent on average, while they are around 50 per cent for lower middle-income countries, 69 per cent for upper-middle-income countries and 86 per cent for high-income countries.
Countries with low pre-primary enrolment rates often have low primary completion rates. There are some exceptions, however, such as Kyrgyzstan, for which pre-primary gross enrolment was only 25 per cent in 2012 even though the country is close to reaching universal completion for primary education.
0%
20%
40%
60%
80%
100%
Low-income
countries
19
50
69
86
Lower-middle- income
countries
Upper- middle- income
countries
High- income
countries
Source: UIS database, accessed 10/2014
28
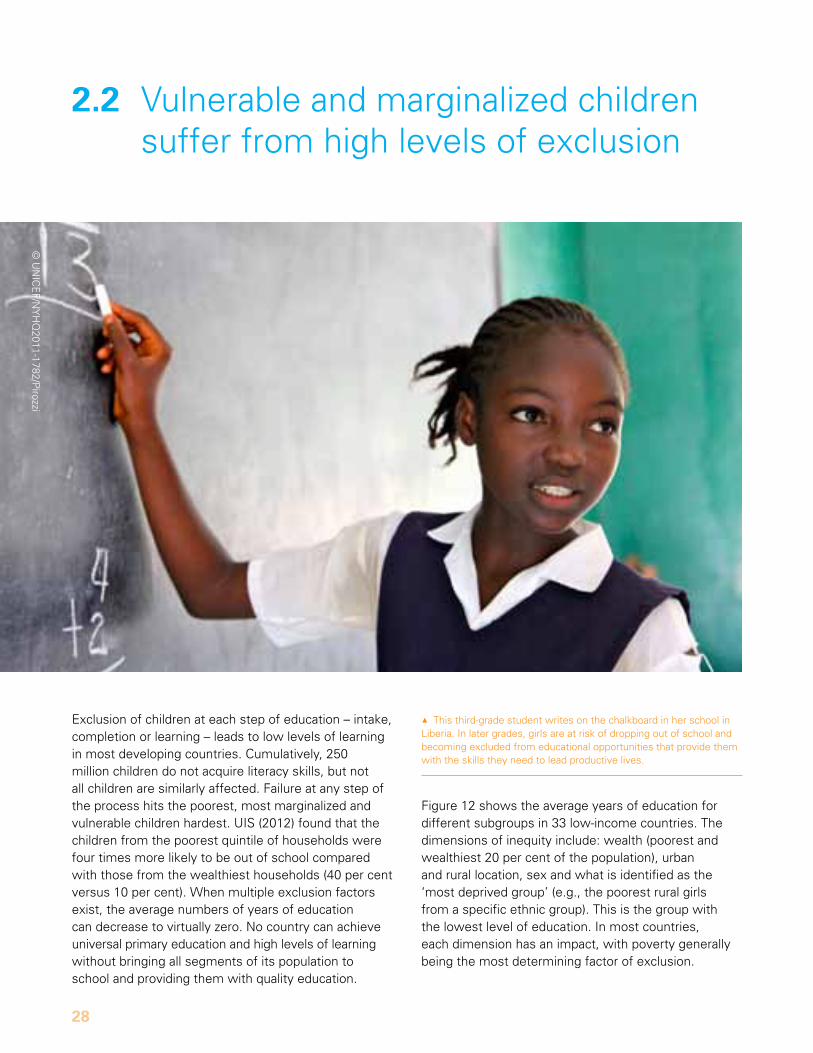
2.2 Vulnerable and marginalized children suffer from high levels of exclusion
Exclusion of children at each step of education – intake, completion or learning – leads to low levels of learning in most developing countries. Cumulatively, 250 million children do not acquire literacy skills, but not all children are similarly affected. Failure at any step of the process hits the poorest, most marginalized and vulnerable children hardest. uIs (2012) found that the children from the poorest quintile of households were four times more likely to be out of school compared with those from the wealthiest households (40 per cent versus 10 per cent). When multiple exclusion factors exist, the average numbers of years of education can decrease to virtually zero. no country can achieve universal primary education and high levels of learning without bringing all segments of its population to school and providing them with quality education.
Figure 12 shows the average years of education for different subgroups in 33 low-income countries. The dimensions of inequity include: wealth (poorest and wealthiest 20 per cent of the population), urban and rural location, sex and what is identified as the ‘most deprived group’ (e.g., the poorest rural girls from a specific ethnic group). This is the group with the lowest level of education. In most countries, each dimension has an impact, with poverty generally being the most determining factor of exclusion.
1This third-grade student writes on the chalkboard in her school in Liberia. In later grades, girls are at risk of dropping out of school and becoming excluded from educational opportunities that provide them with the skills they need to lead productive lives.
© u
nIC
EF/n
yH
q2011-1782/P
irozzi
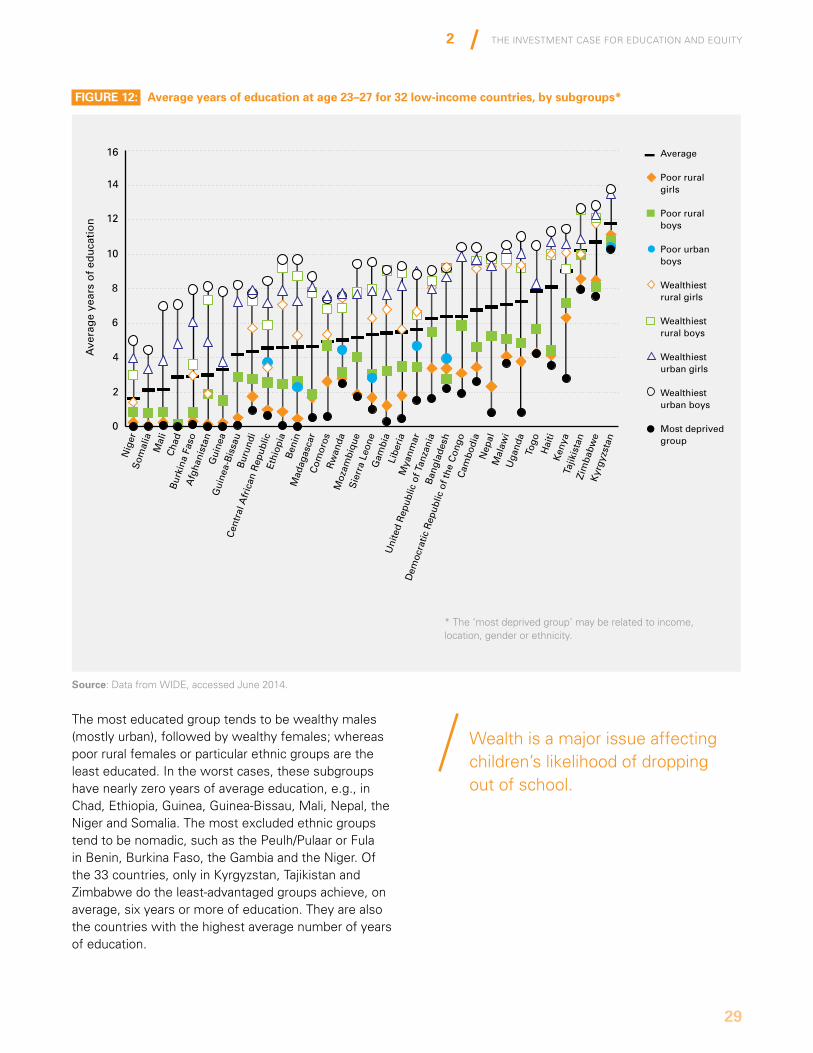
THE InVEsTmEnT CasE For EduCaTIon and EquITy
29
2
FiGuRE 12: average years of education at age 23–27 for 32 low-income countries, by subgroups*
Nig
erS
omal
iaM
ali
Cha
dB
urki
na F
aso
Afg
hani
stan
Gui
nea
Gui
nea-
Bis
sau
Bur
undi
Cen
tral
Afr
ican
Rep
ublic
Ethi
opia
Ben
inM
adag
asca
rC
omor
osR
wan
daM
ozam
biqu
eS
ierr
a Le
one
Gam
bia
Libe
ria
Mya
nmar
Uni
ted
Rep
ublic
of T
anza
nia
Ban
glad
esh
Dem
ocra
tic R
epub
lic o
f the
Con
goC
ambo
dia
Nep
alM
alaw
iU
gand
aTo
goH
aiti
Ken
yaTa
jikis
tan
Zim
babw
eK
yrgy
zsta
n
16
14
12
10
8
6
4
2
0
Average
Poor rural girls
Poor rural boys
Poor urban boys
Wealthiest rural girls
Wealthiest rural boys
Wealthiest urban girls
Wealthiest urban boys
Most deprived group
Ave
rag
e ye
ars
of
edu
cati
on
The most educated group tends to be wealthy males (mostly urban), followed by wealthy females; whereas poor rural females or particular ethnic groups are the least educated. In the worst cases, these subgroups have nearly zero years of average education, e.g., in Chad, Ethiopia, Guinea, Guinea-Bissau, mali, nepal, the niger and somalia. The most excluded ethnic groups tend to be nomadic, such as the Peulh/Pulaar or Fula in Benin, Burkina Faso, the Gambia and the niger. of the 33 countries, only in Kyrgyzstan, Tajikistan and Zimbabwe do the least-advantaged groups achieve, on average, six years or more of education. They are also the countries with the highest average number of years of education.
Source: data from WIdE, accessed June 2014.
* The ‘most deprived group’ may be related to income, location, gender or ethnicity.
Wealth is a major issue affecting children’s likelihood of dropping out of school.
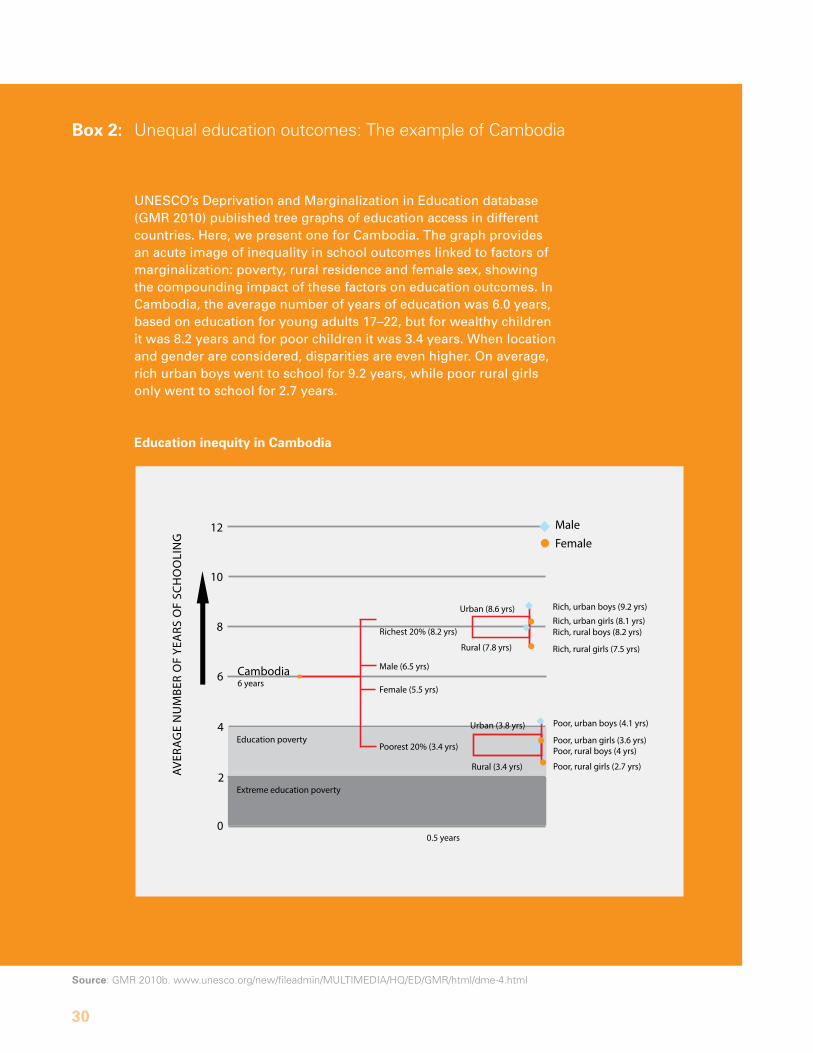
30
Source: Gmr 2010b. www.unesco.org/new/fileadmin/muLTImEdIa/Hq/Ed/Gmr/html/dme-4.html
Box 2: unequal education outcomes: The example of Cambodia
uNESCo’s Deprivation and Marginalization in Education database (GMR 2010) published tree graphs of education access in different countries. Here, we present one for Cambodia. The graph provides an acute image of inequality in school outcomes linked to factors of marginalization: poverty, rural residence and female sex, showing the compounding impact of these factors on education outcomes. In Cambodia, the average number of years of education was 6.0 years, based on education for young adults 17–22, but for wealthy children it was 8.2 years and for poor children it was 3.4 years. When location and gender are considered, disparities are even higher. on average, rich urban boys went to school for 9.2 years, while poor rural girls only went to school for 2.7 years.
Education inequity in cambodia
62.8% of girls in the poorest quintile receive less than 4 years of education
AVER
AG
E N
UM
BER
OF
YEA
RS O
F SC
HO
OLI
NG
Children in the most deprived regions: 70.4%
0.5 years0
2
4
6
8
10
12
Extreme education poverty
Education poverty
Richest 20% (8.2 yrs)
Urban (8.6 yrs)
Rural (7.8 yrs)
Urban (3.8 yrs)
Rural (3.4 yrs)
Female (5.5 yrs)
Poorest 20% (3.4 yrs)
Male (6.5 yrs)
Rich, urban boys (9.2 yrs)
Rich, urban girls (8.1 yrs)Rich, rural boys (8.2 yrs)
Rich, rural girls (7.5 yrs)
Poor, urban boys (4.1 yrs)
Poor, urban girls (3.6 yrs)Poor, rural boys (4 yrs)
Poor, rural girls (2.7 yrs)
MaleFemale
Cambodia6 years
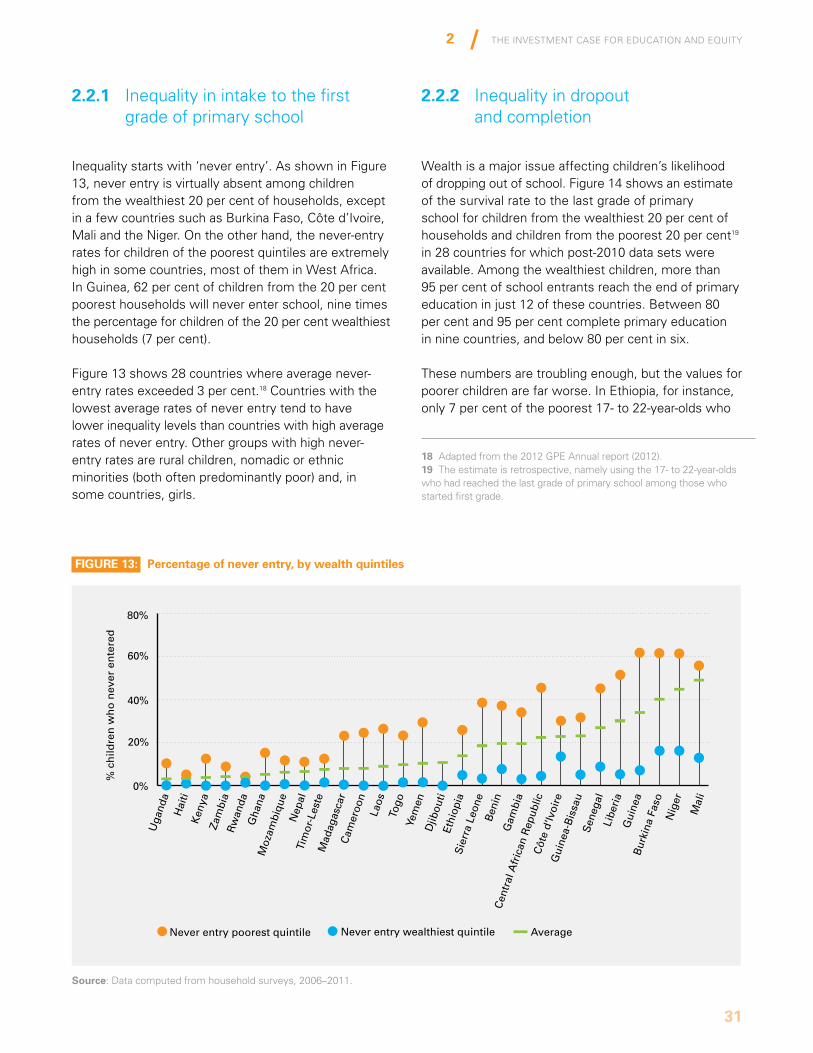
The InvesTmenT Case for eduCaTIon and equITy
31
2
2.2.1 Inequality in intake to the first grade of primary school
Inequality starts with ‘never entry’. as shown in Figure 13, never entry is virtually absent among children from the wealthiest 20 per cent of households, except in a few countries such as Burkina Faso, Côte d’Ivoire, mali and the niger. on the other hand, the never-entry rates for children of the poorest quintiles are extremely high in some countries, most of them in West africa. In Guinea, 62 per cent of children from the 20 per cent poorest households will never enter school, nine times the percentage for children of the 20 per cent wealthiest households (7 per cent).
Figure 13 shows 28 countries where average never-entry rates exceeded 3 per cent.18 Countries with the lowest average rates of never entry tend to have lower inequality levels than countries with high average rates of never entry. other groups with high never- entry rates are rural children, nomadic or ethnic minorities (both often predominantly poor) and, in some countries, girls.
18 adapted from the 2012 GPE annual report (2012).19 The estimate is retrospective, namely using the 17- to 22-year-olds who had reached the last grade of primary school among those who started first grade.
80%
60%
0%
20%
40%
Uga
nda
Hai
tiK
enya
Zam
bia
Rw
anda
Gha
naM
ozam
biqu
eN
epal
Tim
or-L
este
Mad
agas
car
Cam
eroo
nLa
osTo
goYe
men
Djib
outi
Ethi
opia
Sie
rra
Leon
eB
enin
Gam
bia
Cen
tral
Afr
ican
Rep
ublic
C
ôte
d'Iv
oire
Sen
egal
Gui
nea-
Bis
sau
Libe
ria
Gui
nea
Bur
kina
Fas
oN
iger
Mal
i
Never entry poorest quintile Never entry wealthiest quintile Average
% c
hild
ren
wh
o n
ever
en
tere
d
FiGuRE 13: Percentage of never entry, by wealth quintiles
Source: data computed from household surveys, 2006–2011.
2.2.2 Inequality in dropout and completion
Wealth is a major issue affecting children’s likelihood of dropping out of school. Figure 14 shows an estimate of the survival rate to the last grade of primary school for children from the wealthiest 20 per cent of households and children from the poorest 20 per cent19 in 28 countries for which post-2010 data sets were available. among the wealthiest children, more than 95 per cent of school entrants reach the end of primary education in just 12 of these countries. Between 80 per cent and 95 per cent complete primary education in nine countries, and below 80 per cent in six.
These numbers are troubling enough, but the values for poorer children are far worse. In Ethiopia, for instance, only 7 per cent of the poorest 17- to 22-year-olds who
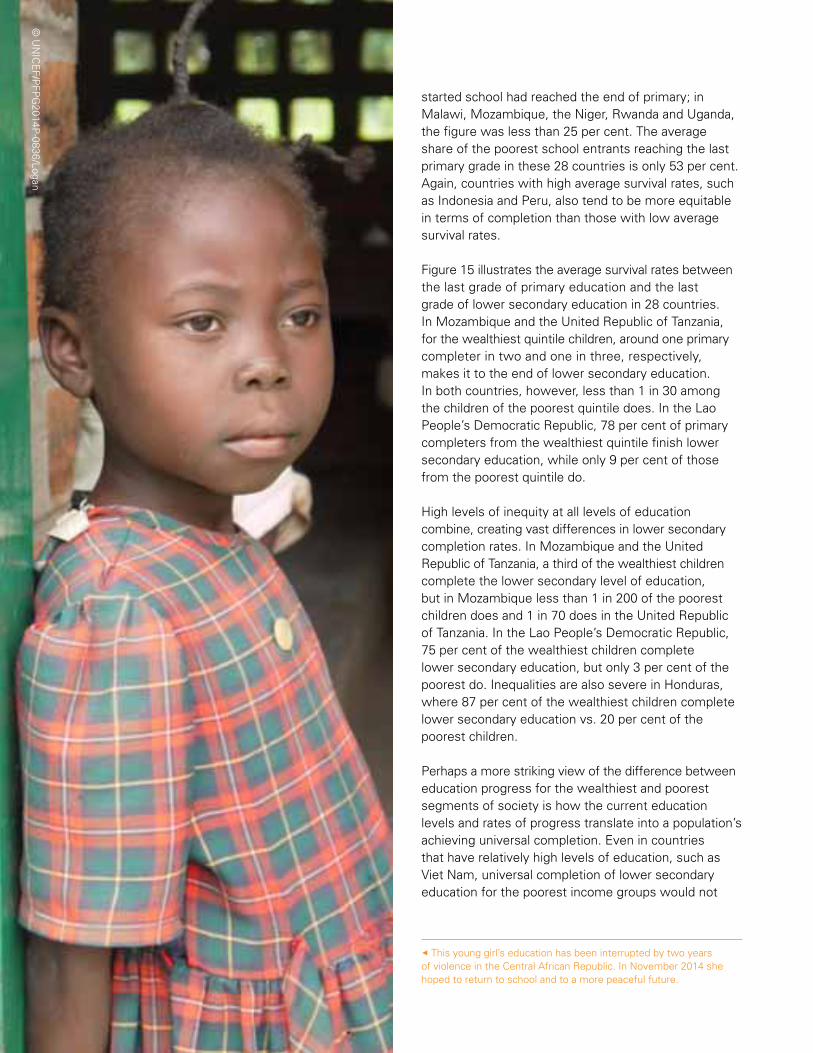
32
started school had reached the end of primary; in malawi, mozambique, the niger, rwanda and uganda, the figure was less than 25 per cent. The average share of the poorest school entrants reaching the last primary grade in these 28 countries is only 53 per cent. again, countries with high average survival rates, such as Indonesia and Peru, also tend to be more equitable in terms of completion than those with low average survival rates.
Figure 15 illustrates the average survival rates between the last grade of primary education and the last grade of lower secondary education in 28 countries. In mozambique and the united republic of Tanzania, for the wealthiest quintile children, around one primary completer in two and one in three, respectively, makes it to the end of lower secondary education. In both countries, however, less than 1 in 30 among the children of the poorest quintile does. In the Lao People’s democratic republic, 78 per cent of primary completers from the wealthiest quintile finish lower secondary education, while only 9 per cent of those from the poorest quintile do.
High levels of inequity at all levels of education combine, creating vast differences in lower secondary completion rates. In mozambique and the united republic of Tanzania, a third of the wealthiest children complete the lower secondary level of education, but in mozambique less than 1 in 200 of the poorest children does and 1 in 70 does in the united republic of Tanzania. In the Lao People’s democratic republic, 75 per cent of the wealthiest children complete lower secondary education, but only 3 per cent of the poorest do. Inequalities are also severe in Honduras, where 87 per cent of the wealthiest children complete lower secondary education vs. 20 per cent of the poorest children.
Perhaps a more striking view of the difference between education progress for the wealthiest and poorest segments of society is how the current education levels and rates of progress translate into a population’s achieving universal completion. Even in countries that have relatively high levels of education, such as Viet nam, universal completion of lower secondary education for the poorest income groups would not
7 This young girl’s education has been interrupted by two years of violence in the Central african republic. In november 2014 she hoped to return to school and to a more peaceful future.
© u
nIC
EF/P
FPG
2014P-0836/Logan
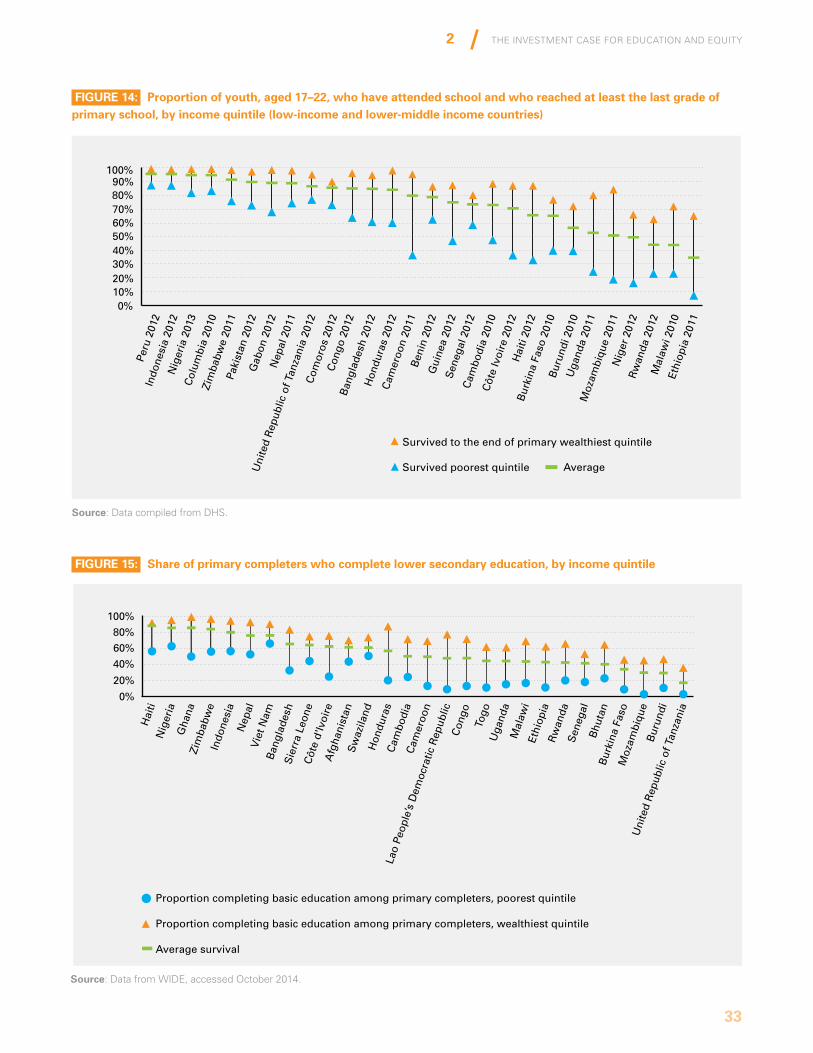
The InvesTmenT Case for eduCaTIon and equITy
33
2
100%90%80%70%60%50%40%30%20%10%0%
Peru
201
2In
done
sia
2012
Nig
eria
201
3C
olum
bia
2010
Zim
babw
e 20
11Pa
kist
an 2
012
Gab
on 2
012
Nep
al 2
011
Uni
ted
Rep
ublic
of T
anza
nia
2012
Com
oros
201
2C
ongo
201
2B
angl
ades
h 20
12H
ondu
ras
2012
Cam
eroo
n 20
11B
enin
201
2G
uine
a 20
12S
eneg
al 2
012
Cam
bodi
a 20
10C
ôte
Ivoi
re 2
012
Hai
ti 20
12B
urki
na F
aso
2010
Bur
undi
201
0U
gand
a 20
11M
ozam
biqu
e 20
11N
iger
201
2R
wan
da 2
012
Mal
awi 2
010
Ethi
opia
201
1
Survived to the end of primary wealthiest quintile
Survived poorest quintile Average
FiGuRE 14: Proportion of youth, aged 17–22, who have attended school and who reached at least the last grade of primary school, by income quintile (low-income and lower-middle income countries)
FiGuRE 15: Share of primary completers who complete lower secondary education, by income quintile
Source: data compiled from dHs.
Source: data from WIdE, accessed october 2014.
100%
80%
60%
40%
20%
0%
Hai
tiN
iger
iaG
hana
Zim
babw
eIn
done
sia
Nep
alV
iet N
amB
angl
ades
hS
ierr
a Le
one
Côt
e d'
Ivoi
reA
fgha
nist
anS
waz
iland
Hon
dura
sC
ambo
dia
Cam
eroo
n
Lao
Peop
le’s
Dem
ocra
tic R
epub
licC
ongo
Togo
Uga
nda
Mal
awi
Ethi
opia
Rw
anda
Sen
egal
Bhu
tan
Bur
kina
Fas
oM
ozam
biqu
eB
urun
di
Uni
ted
Rep
ublic
of T
anza
nia
Proportion completing basic education among primary completers, poorest quintile
Proportion completing basic education among primary completers, wealthiest quintile
Average survival
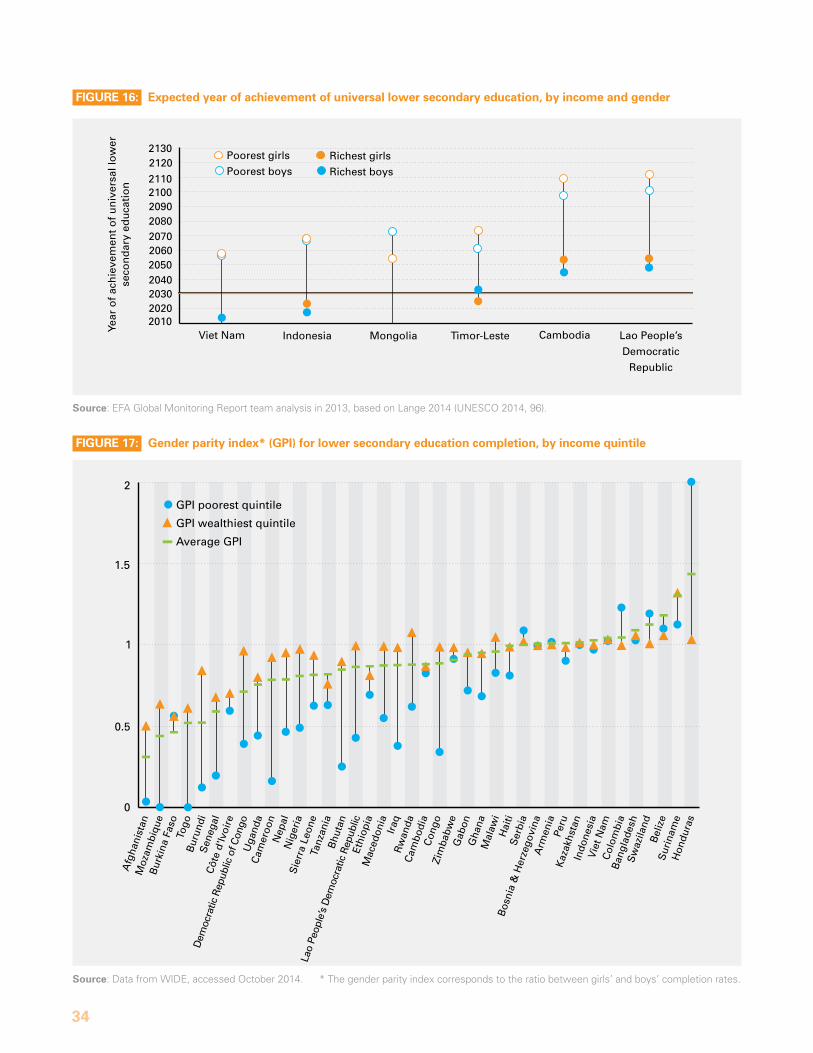
34
20102020203020402050206020702080
21002090
2110
21202130
Poorest girls
Poorest boysRichest girls
Richest boys
Viet Nam Indonesia Mongolia Timor-Leste Cambodia Lao People’s
Democratic
Republic
Year
of
ach
ieve
men
t o
f u
niv
ersa
l lo
wer
se
con
dar
y ed
uca
tio
n
2
1.5
1
0.5
0
GPI poorest quintile
GPI wealthiest quintile
Average GPI
Afg
hani
stan
Moz
ambi
que
Bur
kina
Fas
oTo
goB
urun
diS
eneg
alC
ôte
d'Iv
oire
Dem
ocra
tic R
epub
lic o
f Con
goU
gand
aC
amer
oon
Nep
alN
iger
iaS
ierr
a Le
one
Tanz
ania
Bhu
tan
Lao
Peo
ple’
s D
emoc
ratic
Rep
ublic
Et
hiop
iaM
aced
onia
Iraq
Rw
anda
Cam
bodi
aC
ongo
Zim
babw
eG
abon
Gha
naM
alaw
iH
aiti
Ser
bia
Bos
nia
& H
erze
govi
naA
rmen
iaPe
ruK
azak
hsta
nIn
done
sia
Vie
t Nam
Col
ombi
aB
angl
ades
hS
waz
iland
Bel
ize
Sur
inam
eH
ondu
ras
FiGuRE 16: Expected year of achievement of universal lower secondary education, by income and gender
FiGuRE 17: Gender parity index* (GPi) for lower secondary education completion, by income quintile
Source: EFa Global monitoring report team analysis in 2013, based on Lange 2014 (unEsCo 2014, 96).
Source: data from WIdE, accessed october 2014. * The gender parity index corresponds to the ratio between girls’ and boys’ completion rates.
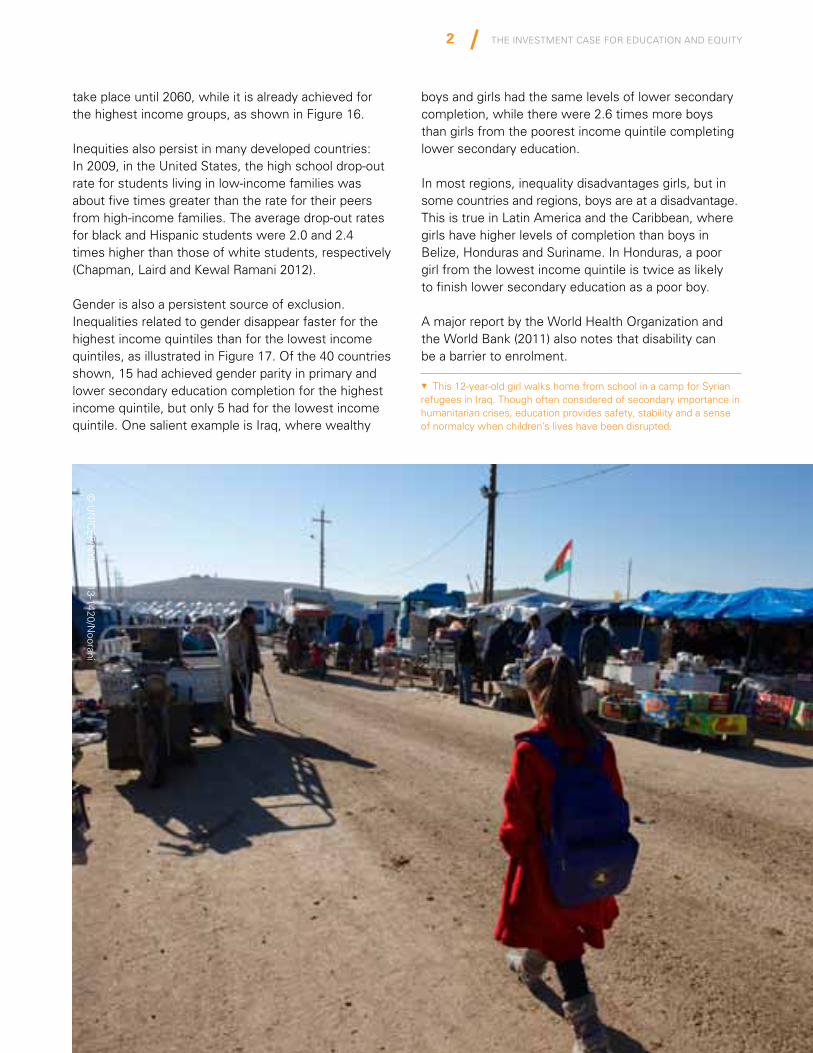
The InvesTmenT Case for eduCaTIon and equITy
35
2
take place until 2060, while it is already achieved for the highest income groups, as shown in Figure 16.
Inequities also persist in many developed countries: In 2009, in the united states, the high school drop-out rate for students living in low-income families was about five times greater than the rate for their peers from high-income families. The average drop-out rates for black and Hispanic students were 2.0 and 2.4 times higher than those of white students, respectively (Chapman, Laird and Kewal ramani 2012).
Gender is also a persistent source of exclusion. Inequalities related to gender disappear faster for the highest income quintiles than for the lowest income quintiles, as illustrated in Figure 17. of the 40 countries shown, 15 had achieved gender parity in primary and lower secondary education completion for the highest income quintile, but only 5 had for the lowest income quintile. one salient example is Iraq, where wealthy
boys and girls had the same levels of lower secondary completion, while there were 2.6 times more boys than girls from the poorest income quintile completing lower secondary education.
In most regions, inequality disadvantages girls, but in some countries and regions, boys are at a disadvantage. This is true in Latin america and the Caribbean, where girls have higher levels of completion than boys in Belize, Honduras and suriname. In Honduras, a poor girl from the lowest income quintile is twice as likely to finish lower secondary education as a poor boy.
a major report by the World Health organization and the World Bank (2011) also notes that disability can be a barrier to enrolment.
5This 12-year-old girl walks home from school in a camp for syrian refugees in Iraq. Though often considered of secondary importance in humanitarian crises, education provides safety, stability and a sense of normalcy when children’s lives have been disrupted.
© u
nIC
EF/n
yH
q2013-1420/n
oorani
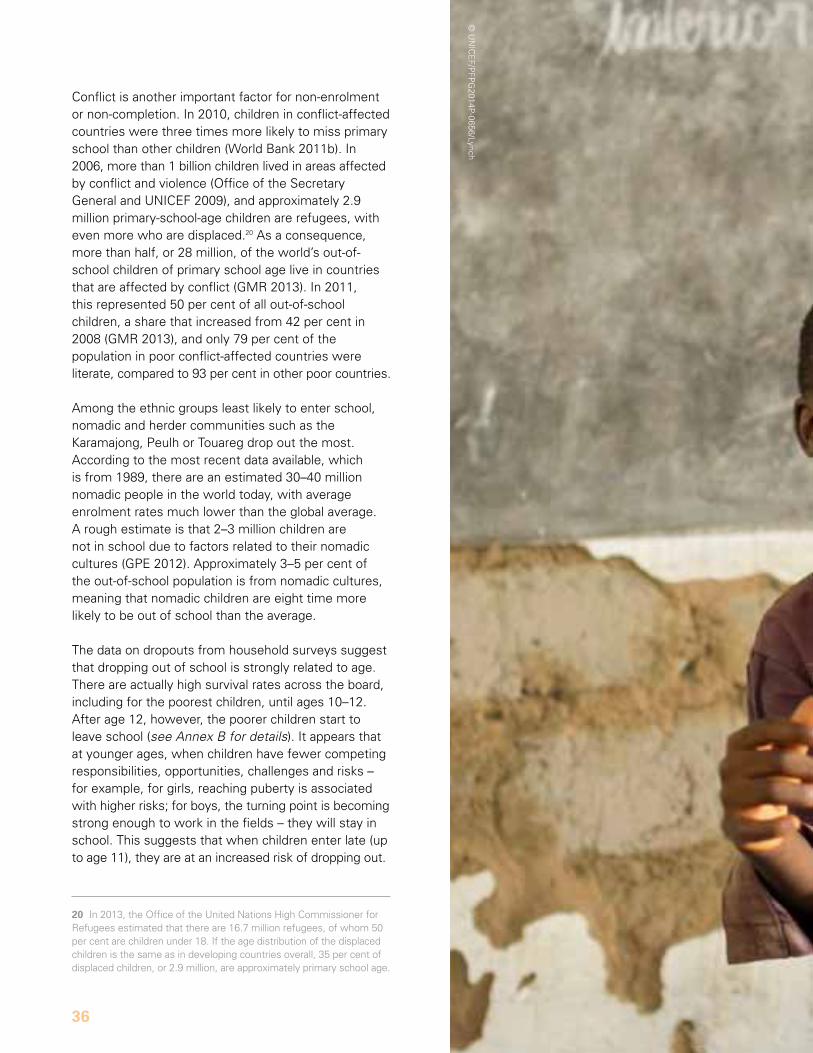
36
20 In 2013, the office of the united nations High Commissioner for refugees estimated that there are 16.7 million refugees, of whom 50 per cent are children under 18. If the age distribution of the displaced children is the same as in developing countries overall, 35 per cent of displaced children, or 2.9 million, are approximately primary school age.
Conflict is another important factor for non-enrolment or non-completion. In 2010, children in conflict-affected countries were three times more likely to miss primary school than other children (World Bank 2011b). In 2006, more than 1 billion children lived in areas affected by conflict and violence (office of the secretary General and unICEF 2009), and approximately 2.9 million primary-school-age children are refugees, with even more who are displaced.20 as a consequence, more than half, or 28 million, of the world’s out-of-school children of primary school age live in countries that are affected by conflict (Gmr 2013). In 2011, this represented 50 per cent of all out-of-school children, a share that increased from 42 per cent in 2008 (Gmr 2013), and only 79 per cent of the population in poor conflict-affected countries were literate, compared to 93 per cent in other poor countries.
among the ethnic groups least likely to enter school, nomadic and herder communities such as the Karamajong, Peulh or Touareg drop out the most. according to the most recent data available, which is from 1989, there are an estimated 30–40 million nomadic people in the world today, with average enrolment rates much lower than the global average. a rough estimate is that 2–3 million children are not in school due to factors related to their nomadic cultures (GPE 2012). approximately 3–5 per cent of the out-of-school population is from nomadic cultures, meaning that nomadic children are eight time more likely to be out of school than the average.
The data on dropouts from household surveys suggest that dropping out of school is strongly related to age. There are actually high survival rates across the board, including for the poorest children, until ages 10–12. after age 12, however, the poorer children start to leave school (see Annex B for details). It appears that at younger ages, when children have fewer competing responsibilities, opportunities, challenges and risks – for example, for girls, reaching puberty is associated with higher risks; for boys, the turning point is becoming strong enough to work in the fields – they will stay in school. This suggests that when children enter late (up to age 11), they are at an increased risk of dropping out.
© u
nIC
EF/P
FPG
2014P-0656/Lynch
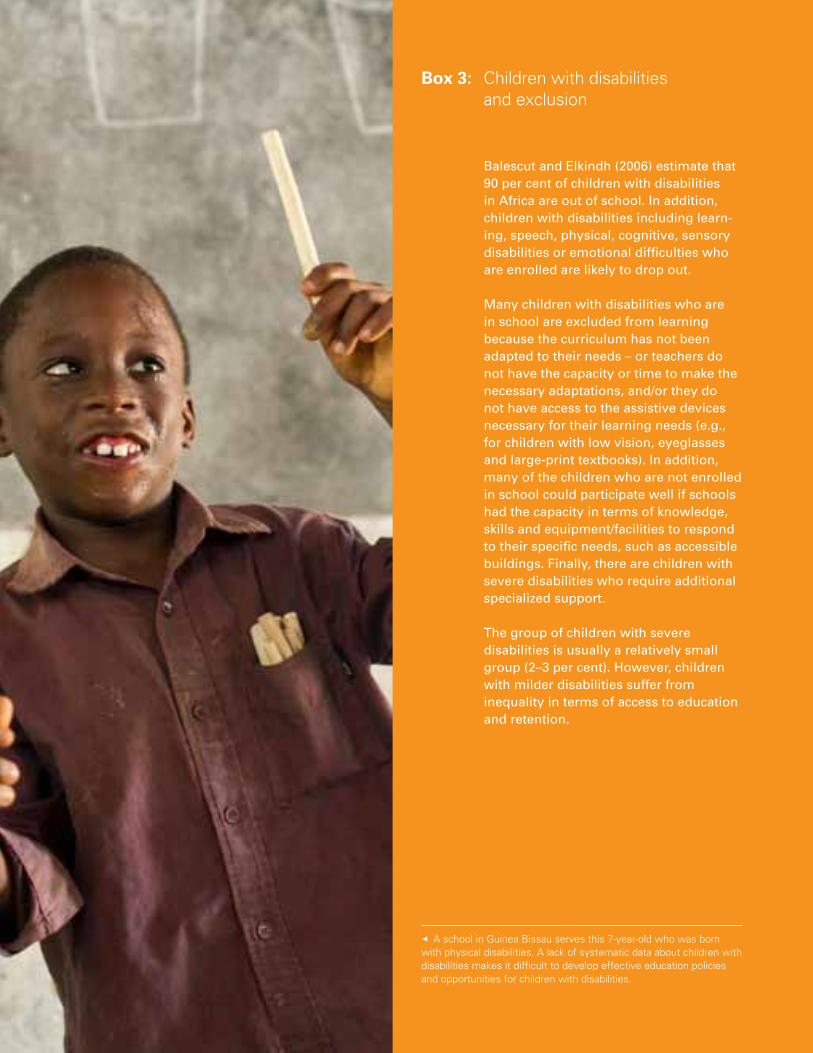
The InvesTmenT Case for eduCaTIon and equITy
37
2
Box 3: Children with disabilities and exclusion
Balescut and Elkindh (2006) estimate that 90 per cent of children with disabilities in Africa are out of school. In addition, children with disabilities including learn-ing, speech, physical, cognitive, sensory disabilities or emotional difficulties who are enrolled are likely to drop out.
Many children with disabilities who are in school are excluded from learning because the curriculum has not been adapted to their needs – or teachers do not have the capacity or time to make the necessary adaptations, and/or they do not have access to the assistive devices necessary for their learning needs (e.g., for children with low vision, eyeglasses and large-print textbooks). In addition, many of the children who are not enrolled in school could participate well if schools had the capacity in terms of knowledge, skills and equipment/facilities to respond to their specific needs, such as accessible buildings. Finally, there are children with severe disabilities who require additional specialized support.
The group of children with severe disabilities is usually a relatively small group (2–3 per cent). However, children with milder disabilities suffer from inequality in terms of access to education and retention.
7a school in Guinea Bissau serves this 7-year-old who was born with physical disabilities. a lack of systematic data about children with disabilities makes it difficult to develop effective education policies and opportunities for children with disabilities.
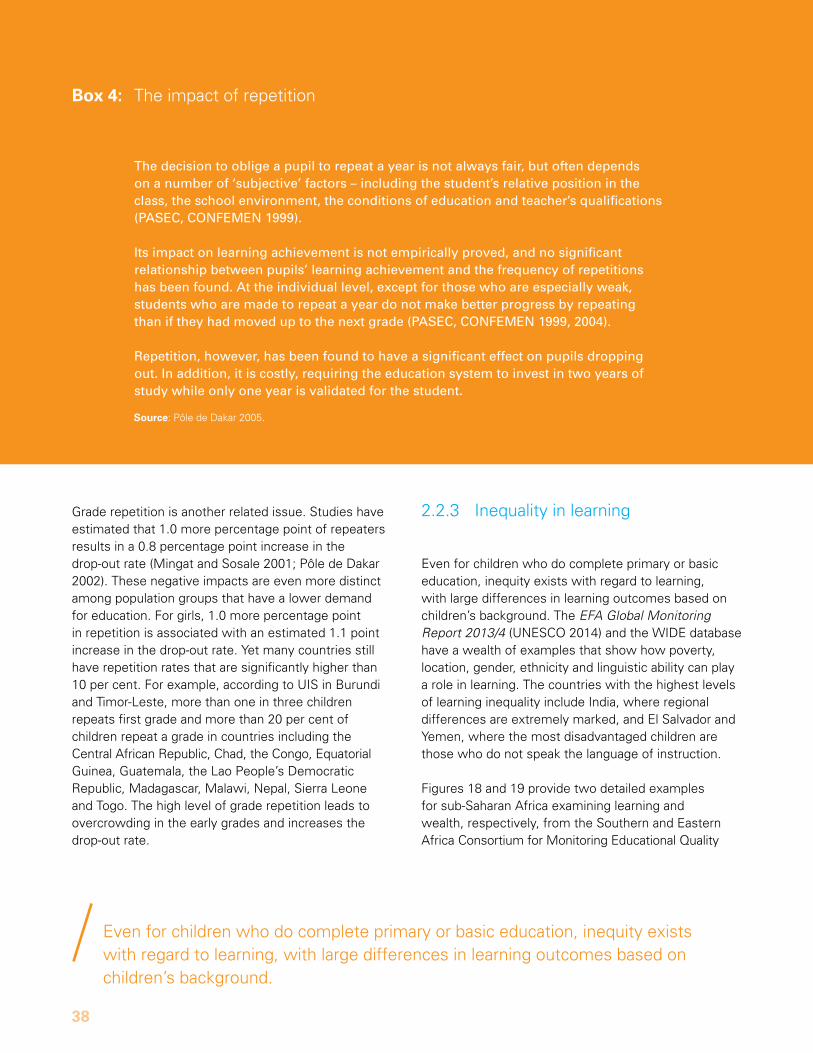
38
2.2.3 Inequality in learning
Even for children who do complete primary or basic education, inequity exists with regard to learning, with large differences in learning outcomes based on children’s background. The EFA Global Monitoring Report 2013/4 (unEsCo 2014) and the WIdE database have a wealth of examples that show how poverty, location, gender, ethnicity and linguistic ability can play a role in learning. The countries with the highest levels of learning inequality include India, where regional differences are extremely marked, and El salvador and yemen, where the most disadvantaged children are those who do not speak the language of instruction.
Figures 18 and 19 provide two detailed examples for sub-saharan africa examining learning and wealth, respectively, from the southern and Eastern africa Consortium for monitoring Educational quality
Grade repetition is another related issue. studies have estimated that 1.0 more percentage point of repeaters results in a 0.8 percentage point increase in the drop-out rate (mingat and sosale 2001; Pôle de dakar 2002). These negative impacts are even more distinct among population groups that have a lower demand for education. For girls, 1.0 more percentage point in repetition is associated with an estimated 1.1 point increase in the drop-out rate. yet many countries still have repetition rates that are significantly higher than 10 per cent. For example, according to uIs in Burundi and Timor-Leste, more than one in three children repeats first grade and more than 20 per cent of children repeat a grade in countries including the Central african republic, Chad, the Congo, Equatorial Guinea, Guatemala, the Lao People’s democratic republic, madagascar, malawi, nepal, sierra Leone and Togo. The high level of grade repetition leads to overcrowding in the early grades and increases the drop-out rate.
Even for children who do complete primary or basic education, inequity exists with regard to learning, with large differences in learning outcomes based on children’s background.
Box 4: The impact of repetition
The decision to oblige a pupil to repeat a year is not always fair, but often depends on a number of ‘subjective’ factors – including the student’s relative position in the class, the school environment, the conditions of education and teacher’s qualifications (PASEC, CoNFEMEN 1999).
Its impact on learning achievement is not empirically proved, and no significant relationship between pupils’ learning achievement and the frequency of repetitions has been found. At the individual level, except for those who are especially weak, students who are made to repeat a year do not make better progress by repeating than if they had moved up to the next grade (PASEC, CoNFEMEN 1999, 2004).
Repetition, however, has been found to have a significant effect on pupils dropping out. In addition, it is costly, requiring the education system to invest in two years of study while only one year is validated for the student.
Source: Pôle de dakar 2005.
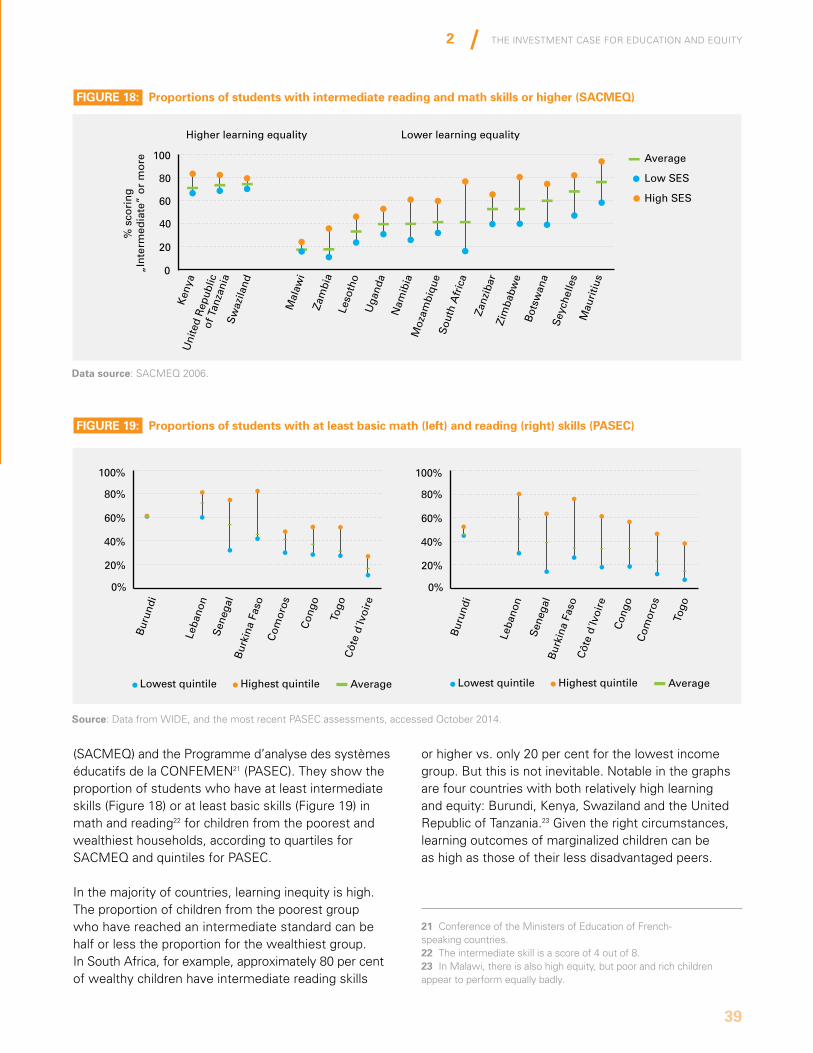
The InvesTmenT Case for eduCaTIon and equITy
39
2
21 Conference of the ministers of Education of French- speaking countries.22 The intermediate skill is a score of 4 out of 8. 23 In malawi, there is also high equity, but poor and rich children appear to perform equally badly.
Higher learning equality%
sco
rin
g
„In
term
edia
te”
or
mo
reLower learning equality
Average
Low SES
High SES
100
80
60
40
20
0
Ken
yaU
nite
d R
epub
lic
of T
anza
nia
Sw
azila
nd
Mal
awi
Zam
bia
Leso
tho
Uga
nda
Nam
ibia
Moz
ambi
que
Sou
th A
fric
a
Zanz
ibar
Zim
babw
eB
otsw
ana
Sey
chel
les
Mau
ritiu
s
100%
80%
60%
40%
20%
0%
Bur
undi
Leba
non
Sen
egal
Bur
kina
Fas
oC
omor
os
Con
go
Togo
Côt
e d´
Ivoi
re
Bur
undi
Leba
non
Sen
egal
Bur
kina
Fas
o
Com
oros
Con
go
Togo
Côt
e d´
Ivoi
re
100%
80%
60%
40%
20%
0%
Lowest quintile Highest quintile Average Lowest quintile Highest quintile Average
Data source: data from WIDE database (10/2014) – most recent PASEC assessments
FiGuRE 18: Proportions of students with intermediate reading and math skills or higher (SacMEq)
FiGuRE 19: Proportions of students with at least basic math (left) and reading (right) skills (PaSEc)
data source: saCmEq 2006.
Source: data from WIdE, and the most recent PasEC assessments, accessed october 2014.
(saCmEq) and the Programme d’analyse des systèmes éducatifs de la ConFEmEn21 (PasEC). They show the proportion of students who have at least intermediate skills (Figure 18) or at least basic skills (Figure 19) in math and reading22 for children from the poorest and wealthiest households, according to quartiles for saCmEq and quintiles for PasEC.
In the majority of countries, learning inequity is high. The proportion of children from the poorest group who have reached an intermediate standard can be half or less the proportion for the wealthiest group. In south africa, for example, approximately 80 per cent of wealthy children have intermediate reading skills
or higher vs. only 20 per cent for the lowest income group. But this is not inevitable. notable in the graphs are four countries with both relatively high learning and equity: Burundi, Kenya, swaziland and the united republic of Tanzania.23 Given the right circumstances, learning outcomes of marginalized children can be as high as those of their less disadvantaged peers.
40
© u
nIC
EF/n
yH
q2014-1236/n
esbitt
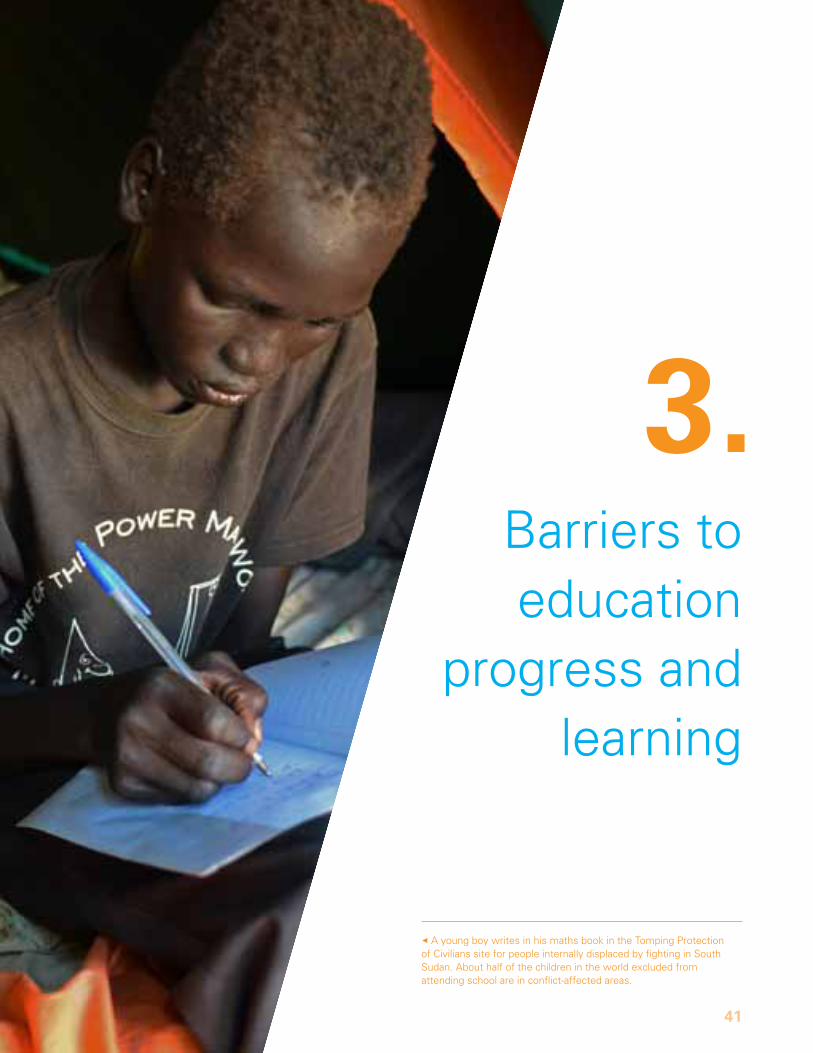
41
3
7 a young boy writes in his maths book in the Tomping Protection of Civilians site for people internally displaced by fighting in south sudan. about half of the children in the world excluded from attending school are in conflict-affected areas.
3.Barriers to education
progress and learning
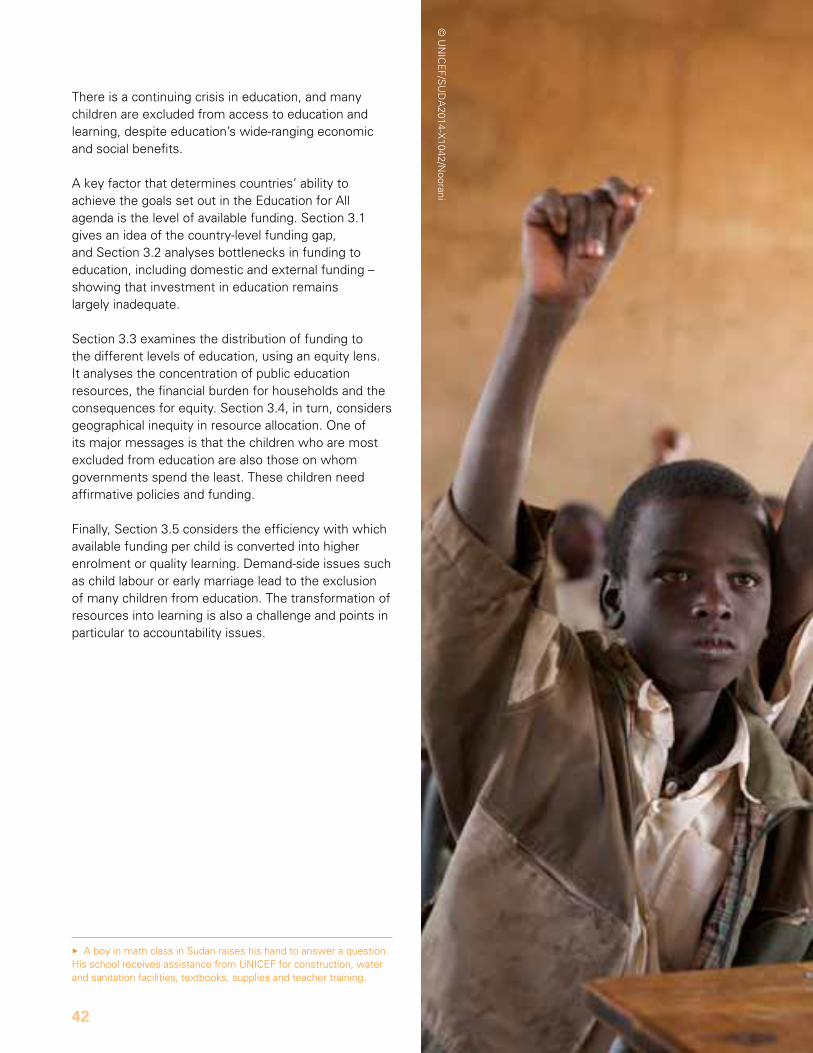
3a boy in math class in sudan raises his hand to answer a question. His school receives assistance from unICEF for construction, water and sanitation facilities, textbooks, supplies and teacher training.
42
There is a continuing crisis in education, and many children are excluded from access to education and learning, despite education’s wide-ranging economic and social benefits.
a key factor that determines countries’ ability to achieve the goals set out in the Education for all agenda is the level of available funding. section 3.1 gives an idea of the country-level funding gap, and section 3.2 analyses bottlenecks in funding to education, including domestic and external funding – showing that investment in education remains largely inadequate.
section 3.3 examines the distribution of funding to the different levels of education, using an equity lens. It analyses the concentration of public education resources, the financial burden for households and the consequences for equity. section 3.4, in turn, considers geographical inequity in resource allocation. one of its major messages is that the children who are most excluded from education are also those on whom governments spend the least. These children need affirmative policies and funding.
Finally, section 3.5 considers the efficiency with which available funding per child is converted into higher enrolment or quality learning. demand-side issues such as child labour or early marriage lead to the exclusion of many children from education. The transformation of resources into learning is also a challenge and points in particular to accountability issues.
© u
nIC
EF/s
ud
a2014-X
1042/noorani
The InvesTmenT Case for eduCaTIon and equITy
43
3
all global education reports stress the continuing finance gaps for education in developing countries. For example, according to a recent policy paper by the EFa Global monitoring report (Gmr 2014), the external funding needed to provide universal basic education to all children in 46 low-income countries was us$26 billion annually for the 2012–2015 period. (See Box 5 below for an explanation of the GMR costing model.24) The GPE came up with similar results (mingat 2013).
The funding gap for a given level or sub-sector of education depends on the level of funding dedicated to the sub-sector vs. the level of needs. The level of funding dedicated to the education sector itself is a function of domestic resources (mainly through taxes) available in the government budget; the percentage of domestic resources directed to education, i.e., the share of education within the total government budget; and external aid allocated to education in the country. national education spending is then distributed to the different levels of education. Hence, when considering recurrent spending to a given education level, and assuming that external aid is primarily allocated to non-recurrent expenditures, the following equation can be written (here the example chosen is primary education, but the same equation can be used for all levels):
PrimGdP = dom GdP * %Ed * %Prim
PrimGDP denotes the level of recurrent primary funding as a share of GdP, DomGDP is the level of domestic resources as a share of GdP, %Ed the share of education in the government budget and %Prim the share of primary within the education budget. a bottleneck at any of these levels will affect funding to primary education (or any other level being considered).
Financial needs, on the other hand, depend on the num-ber of children to be educated and the public unit costs. Box 5 shows an equation relating to gross enrolment ratios, for a given level of education; recurrent funding, e.g., salaries, materials and additional costs of enrolling marginalized children; and capital expenditures, e.g., classroom construction/maintenance.
The model can be used to compute how much funding is needed to reach universal primary education compared to the amount of funding actually available by assuming full enrolment. It does not reflect current unit costs, but assumes a set of minimum or acceptable levels of salaries, pupil-teacher ratios, subsidies and construction costs, as well as acceptable levels of repetition and a reasonable share of private enrolment. The necessary funds can be compared to actual funding to assess the education finance gap.
3.1 Funding gaps
There is a continuing crisis in education, and many children are excluded from access to education and learning, despite education’s wide-ranging economic and social benefits.
24 The Gmr costing model is also explained in the EFA Global Monitoring Report 2010, on page 123 (unEsCo 2010a).
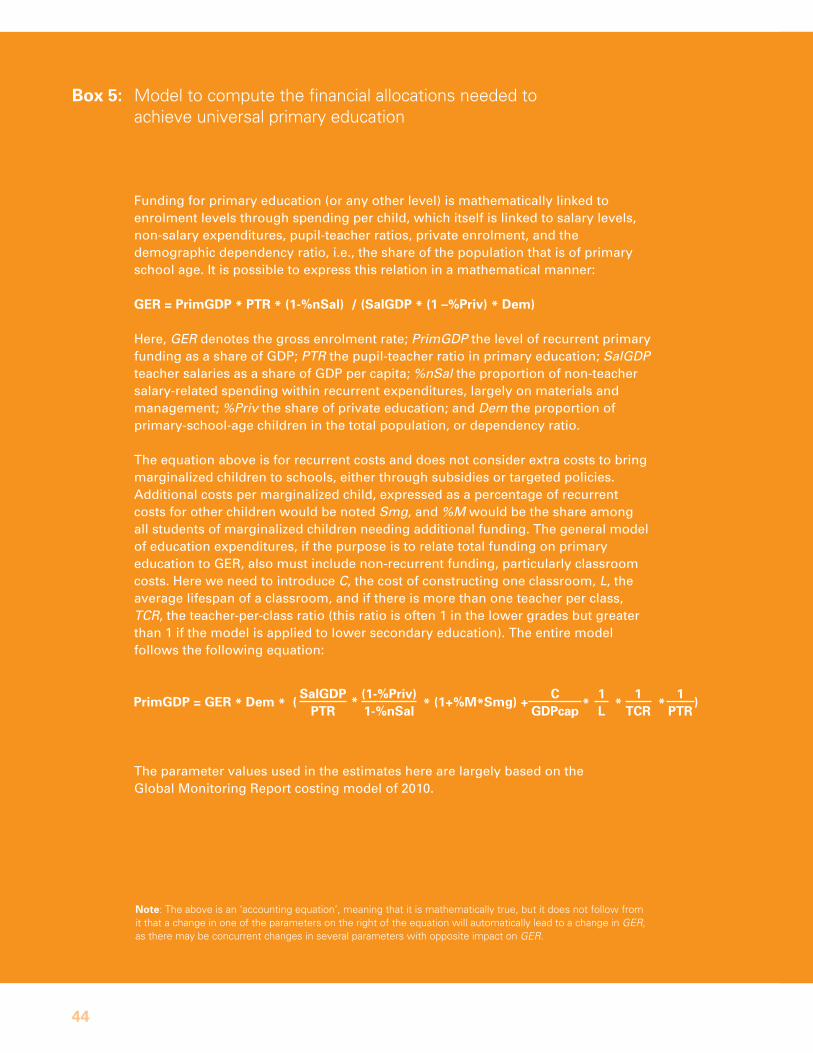
44
Box 5: model to compute the financial allocations needed to achieve universal primary education
Funding for primary education (or any other level) is mathematically linked to enrolment levels through spending per child, which itself is linked to salary levels, non-salary expenditures, pupil-teacher ratios, private enrolment, and the demographic dependency ratio, i.e., the share of the population that is of primary school age. It is possible to express this relation in a mathematical manner:
GER = PrimGdP * PtR * (1-%nSal) / (SalGdP * (1 –%Priv) * dem)
Here, GER denotes the gross enrolment rate; PrimGDP the level of recurrent primary funding as a share of GDP; PTR the pupil-teacher ratio in primary education; SalGDP teacher salaries as a share of GDP per capita; %nSal the proportion of non-teacher salary-related spending within recurrent expenditures, largely on materials and management; %Priv the share of private education; and Dem the proportion of primary-school-age children in the total population, or dependency ratio.
The equation above is for recurrent costs and does not consider extra costs to bring marginalized children to schools, either through subsidies or targeted policies. Additional costs per marginalized child, expressed as a percentage of recurrent costs for other children would be noted Smg, and %M would be the share among all students of marginalized children needing additional funding. The general model of education expenditures, if the purpose is to relate total funding on primary education to GER, also must include non-recurrent funding, particularly classroom costs. Here we need to introduce C, the cost of constructing one classroom, L, the average lifespan of a classroom, and if there is more than one teacher per class, TCR, the teacher-per-class ratio (this ratio is often 1 in the lower grades but greater than 1 if the model is applied to lower secondary education). The entire model follows the following equation:
The parameter values used in the estimates here are largely based on the Global Monitoring Report costing model of 2010.
note: The above is an ‘accounting equation’, meaning that it is mathematically true, but it does not follow from it that a change in one of the parameters on the right of the equation will automatically lead to a change in GER, as there may be concurrent changes in several parameters with opposite impact on GER.
PrimGdP = GER * dem * ( * * (1+%M*Smg) + * * * )(1-%Priv)1-%nSal
SalGdPPtR
1tcR
cGdPcap
1l
1PtR
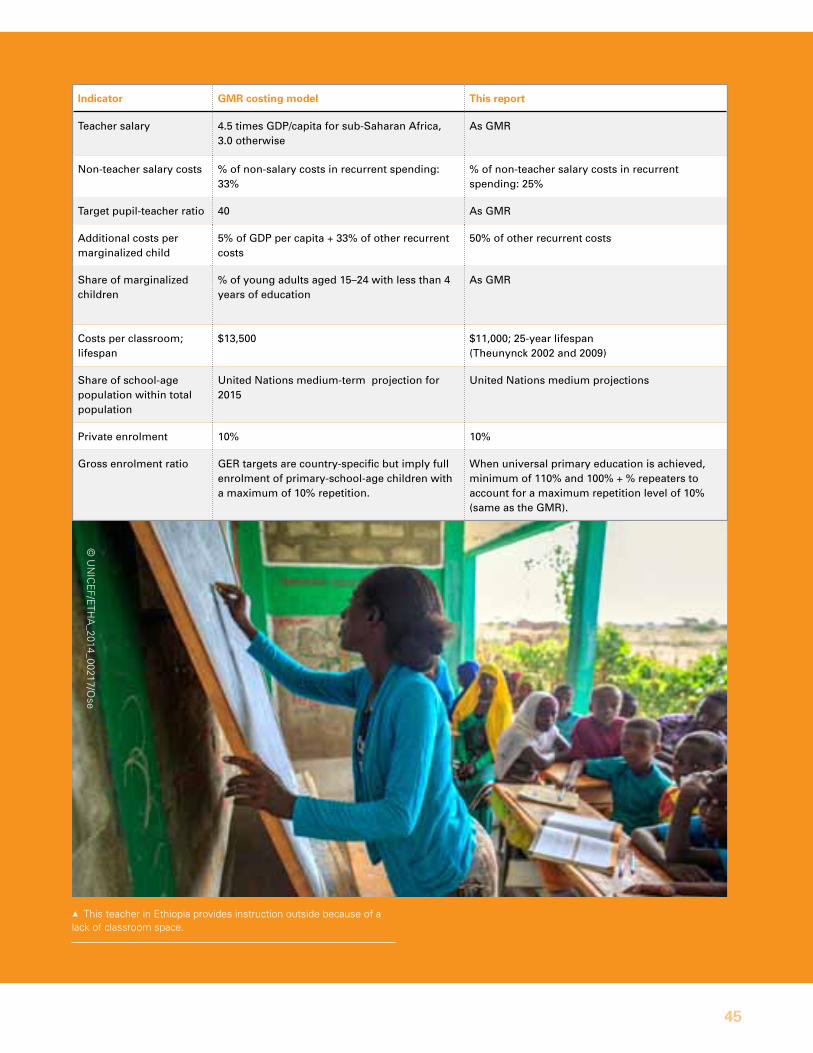
45
indicator GMR costing model this report
Teacher salary 4.5 times GDP/capita for sub-Saharan Africa, 3.0 otherwise
As GMR
Non-teacher salary costs % of non-salary costs in recurrent spending: 33%
% of non-teacher salary costs in recurrent spending: 25%
Target pupil-teacher ratio 40 As GMR
Additional costs per marginalized child
5% of GDP per capita + 33% of other recurrent costs
50% of other recurrent costs
Share of marginalized children
% of young adults aged 15–24 with less than 4 years of education
As GMR
Costs per classroom; lifespan
$13,500 $11,000; 25-year lifespan (Theunynck 2002 and 2009)
Share of school-age population within total population
united Nations medium-term projection for 2015
united Nations medium projections
Private enrolment 10% 10%
Gross enrolment ratio GER targets are country-specific but imply full enrolment of primary-school-age children with a maximum of 10% repetition.
When universal primary education is achieved, minimum of 110% and 100% + % repeaters to account for a maximum repetition level of 10% (same as the GMR).
1This teacher in Ethiopia provides instruction outside because of a lack of classroom space.
© u
nIC
EF/E
THa
_2014_00217/ose
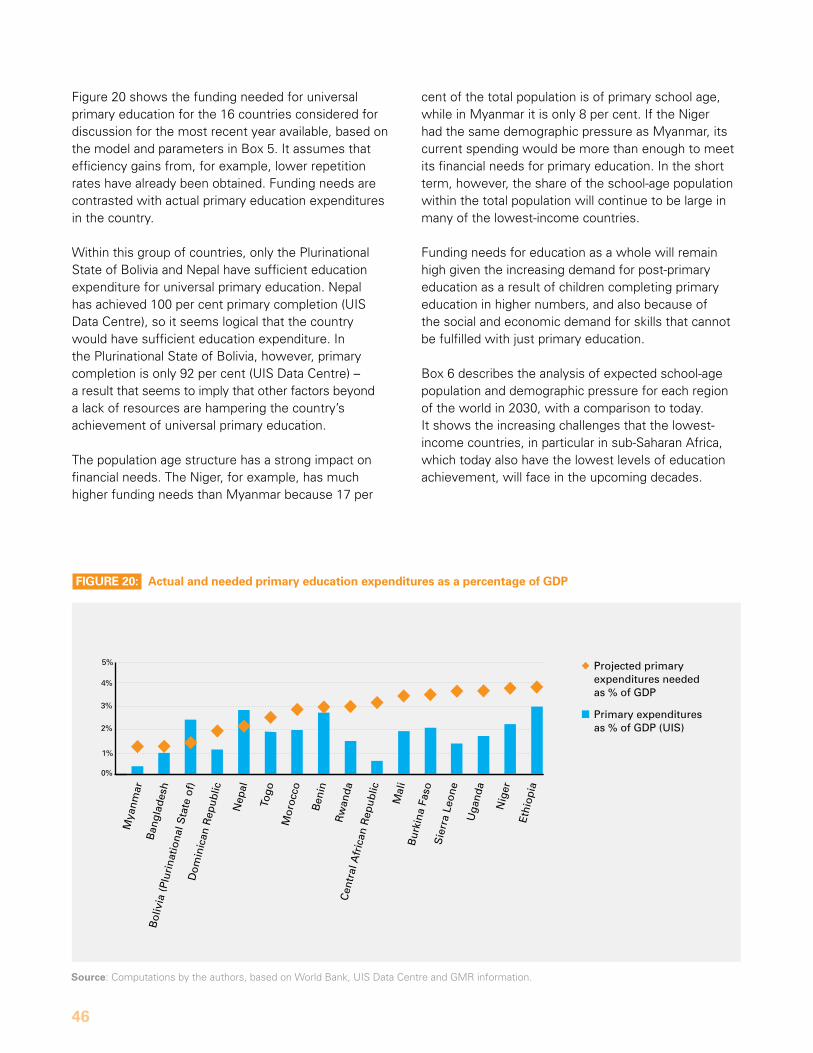
46
Figure 20 shows the funding needed for universal primary education for the 16 countries considered for discussion for the most recent year available, based on the model and parameters in Box 5. It assumes that efficiency gains from, for example, lower repetition rates have already been obtained. Funding needs are contrasted with actual primary education expenditures in the country.
Within this group of countries, only the Plurinational state of Bolivia and nepal have sufficient education expenditure for universal primary education. nepal has achieved 100 per cent primary completion (uIs data Centre), so it seems logical that the country would have sufficient education expenditure. In the Plurinational state of Bolivia, however, primary completion is only 92 per cent (uIs data Centre) – a result that seems to imply that other factors beyond a lack of resources are hampering the country’s achievement of universal primary education.
The population age structure has a strong impact on financial needs. The niger, for example, has much higher funding needs than myanmar because 17 per
FiGuRE 20: actual and needed primary education expenditures as a percentage of GdP
Source: Computations by the authors, based on World Bank, uIs data Centre and Gmr information.
Mya
nmar
Ban
glad
esh
Bol
ivia
(Plu
rina
tiona
l Sta
te o
f)
Dom
inic
an R
epub
lic
Nep
al
Togo
Mor
occo
Ben
in
Rw
anda
Cen
tral
Afr
ican
Rep
ublic
Mal
iB
urki
na F
aso
Sie
rra
Leon
e
Uga
nda
Nig
er
Ethi
opia
Primary expenditures as % of GDP (UIS)
Projected primary expenditures needed as % of GDP
4%
3%
2%
1%
0%
5%
cent of the total population is of primary school age, while in myanmar it is only 8 per cent. If the niger had the same demographic pressure as myanmar, its current spending would be more than enough to meet its financial needs for primary education. In the short term, however, the share of the school-age population within the total population will continue to be large in many of the lowest-income countries.
Funding needs for education as a whole will remain high given the increasing demand for post-primary education as a result of children completing primary education in higher numbers, and also because of the social and economic demand for skills that cannot be fulfilled with just primary education.
Box 6 describes the analysis of expected school-age population and demographic pressure for each region of the world in 2030, with a comparison to today. It shows the increasing challenges that the lowest-income countries, in particular in sub-saharan africa, which today also have the lowest levels of education achievement, will face in the upcoming decades.
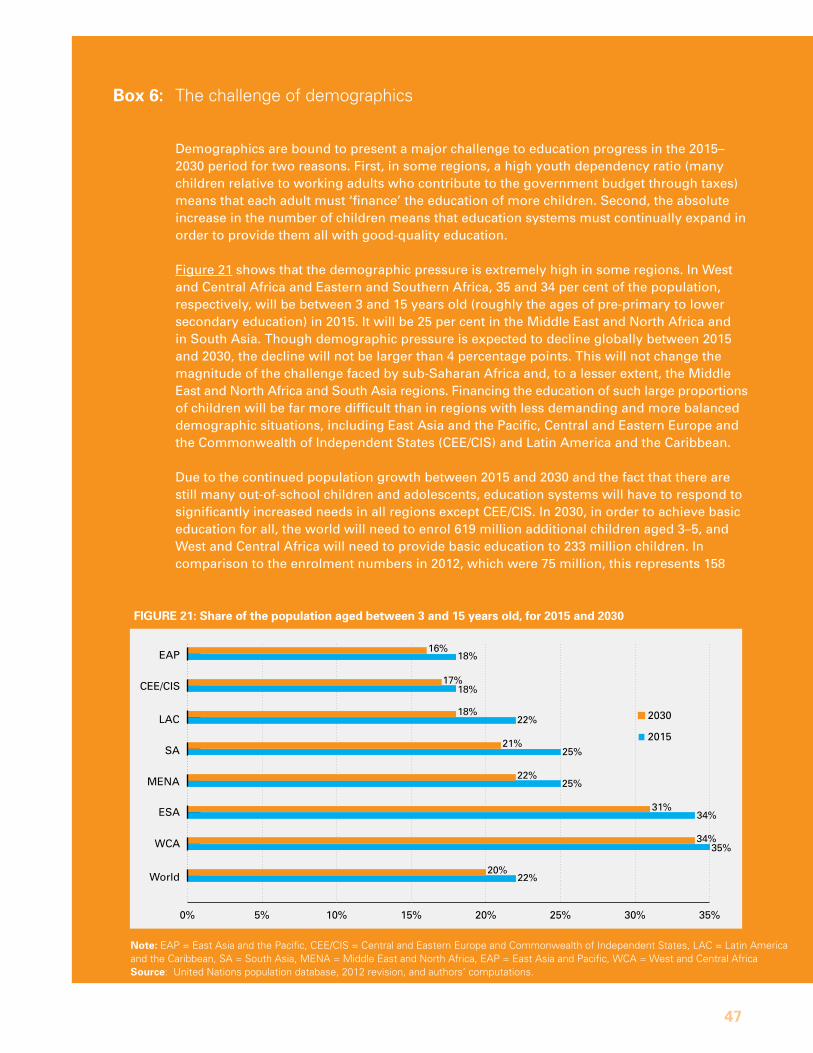
47
FiGuRE 21: Share of the population aged between 3 and 15 years old, for 2015 and 2030
note: EaP = East asia and the Pacific, CEE/CIs = Central and Eastern Europe and Commonwealth of Independent states, LaC = Latin america and the Caribbean, sa = south asia, mEna = middle East and north africa, EaP = East asia and Pacific, WCa = West and Central africaSource: united nations population database, 2012 revision, and authors’ computations.
Box 6: The challenge of demographics
Demographics are bound to present a major challenge to education progress in the 2015–2030 period for two reasons. First, in some regions, a high youth dependency ratio (many children relative to working adults who contribute to the government budget through taxes) means that each adult must ‘finance’ the education of more children. Second, the absolute increase in the number of children means that education systems must continually expand in order to provide them all with good-quality education.
Figure 21 shows that the demographic pressure is extremely high in some regions. In West and Central Africa and Eastern and Southern Africa, 35 and 34 per cent of the population, respectively, will be between 3 and 15 years old (roughly the ages of pre-primary to lower secondary education) in 2015. It will be 25 per cent in the Middle East and North Africa and in South Asia. Though demographic pressure is expected to decline globally between 2015 and 2030, the decline will not be larger than 4 percentage points. This will not change the magnitude of the challenge faced by sub-Saharan Africa and, to a lesser extent, the Middle East and North Africa and South Asia regions. Financing the education of such large proportions of children will be far more difficult than in regions with less demanding and more balanced demographic situations, including East Asia and the Pacific, Central and Eastern Europe and the Commonwealth of Independent States (CEE/CIS) and Latin America and the Caribbean.
Due to the continued population growth between 2015 and 2030 and the fact that there are still many out-of-school children and adolescents, education systems will have to respond to significantly increased needs in all regions except CEE/CIS. In 2030, in order to achieve basic education for all, the world will need to enrol 619 million additional children aged 3–5, and West and Central Africa will need to provide basic education to 233 million children. In comparison to the enrolment numbers in 2012, which were 75 million, this represents 158
0% 5% 10% 15% 20% 25% 30% 35%
2030
2015
Note: EAP = East Asia and the Pacific, CEE/CIS = Central and Eastern Europe and Commonwealth of Independent States, LAC = Latin America and the Caribbean, SA = South Asia, MENA = Middle East and North Africa, EAP = East Asia and Pacific, WCA = West and Central AfricaSource: (United Nations population database, 2012 revision) and authors’ computations
EAP
CEE/CIS
LAC
SA
MENA
ESA
WCA
World
16%18%
17%18%
18%22%
21%25%
22%25%
31%34%
34%35%
20%22%
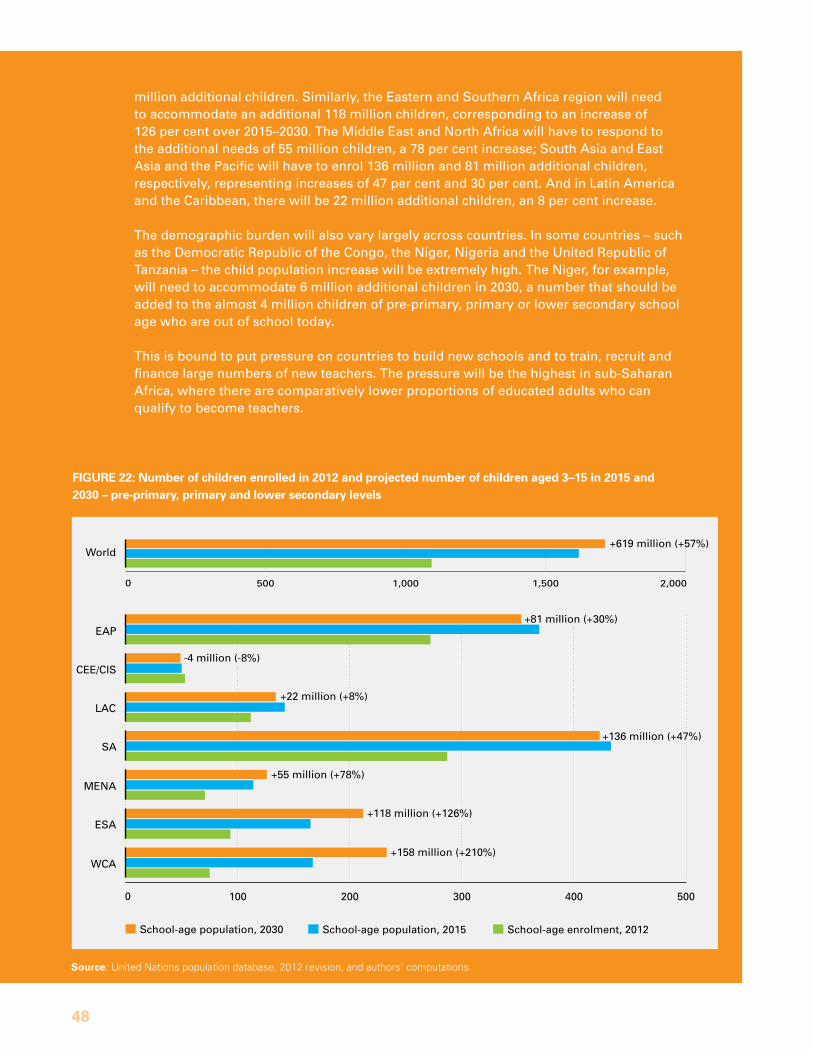
48
million additional children. Similarly, the Eastern and Southern Africa region will need to accommodate an additional 118 million children, corresponding to an increase of 126 per cent over 2015–2030. The Middle East and North Africa will have to respond to the additional needs of 55 million children, a 78 per cent increase; South Asia and East Asia and the Pacific will have to enrol 136 million and 81 million additional children, respectively, representing increases of 47 per cent and 30 per cent. And in Latin America and the Caribbean, there will be 22 million additional children, an 8 per cent increase.
The demographic burden will also vary largely across countries. In some countries – such as the Democratic Republic of the Congo, the Niger, Nigeria and the united Republic of Tanzania – the child population increase will be extremely high. The Niger, for example, will need to accommodate 6 million additional children in 2030, a number that should be added to the almost 4 million children of pre-primary, primary or lower secondary school age who are out of school today.
This is bound to put pressure on countries to build new schools and to train, recruit and finance large numbers of new teachers. The pressure will be the highest in sub-Saharan Africa, where there are comparatively lower proportions of educated adults who can qualify to become teachers.
FiGuRE 22: number of children enrolled in 2012 and projected number of children aged 3–15 in 2015 and 2030 – pre-primary, primary and lower secondary levels
Source: united nations population database, 2012 revision, and authors’ computations.
+81 million (+30%)
-4 million (-8%)
+22 million (+8%)
+136 million (+47%)
+55 million (+78%)
School-age population, 2030
+118 million (+126%)
+158 million (+210%)
CEE/CIS
LAC
SA
MENA
ESA
WCA
EAP
0 100 200 300 400 500
School-age population, 2015 School-age enrolment, 2012
World+619 million (+57%)
0 500 1,000 1,500 2,000
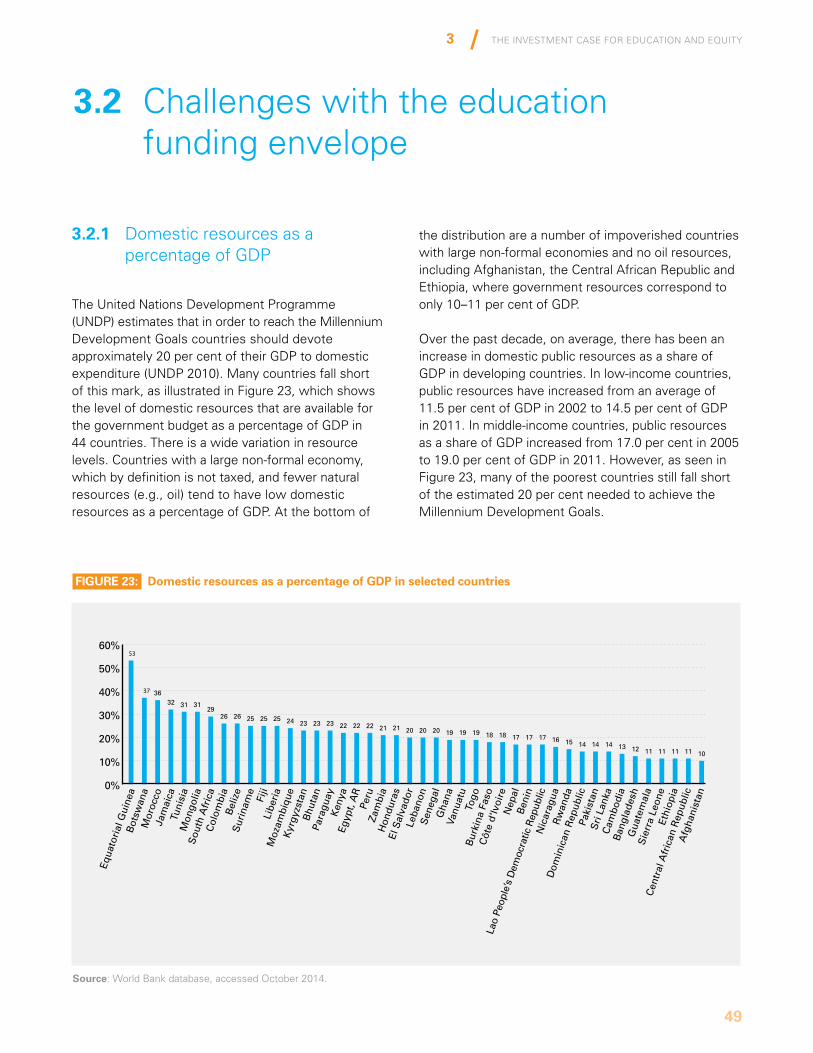
The InvesTmenT Case for eduCaTIon and equITy
49
3
3.2.1 domestic resources as a percentage of GdP
The united nations development Programme (undP) estimates that in order to reach the millennium development Goals countries should devote approximately 20 per cent of their GdP to domestic expenditure (undP 2010). many countries fall short of this mark, as illustrated in Figure 23, which shows the level of domestic resources that are available for the government budget as a percentage of GdP in 44 countries. There is a wide variation in resource levels. Countries with a large non-formal economy, which by definition is not taxed, and fewer natural resources (e.g., oil) tend to have low domestic resources as a percentage of GdP. at the bottom of
3.2 Challenges with the education funding envelope
the distribution are a number of impoverished countries with large non-formal economies and no oil resources, including afghanistan, the Central african republic and Ethiopia, where government resources correspond to only 10–11 per cent of GdP.
over the past decade, on average, there has been an increase in domestic public resources as a share of GdP in developing countries. In low-income countries, public resources have increased from an average of 11.5 per cent of GdP in 2002 to 14.5 per cent of GdP in 2011. In middle-income countries, public resources as a share of GdP increased from 17.0 per cent in 2005 to 19.0 per cent of GdP in 2011. However, as seen in Figure 23, many of the poorest countries still fall short of the estimated 20 per cent needed to achieve the millennium development Goals.
FiGuRE 23: domestic resources as a percentage of GdP in selected countries
0%
10%
20%
30%
40%
50%
60%53
37 3632 31 31
2926 26 25 25 25 24 23 23 23 22 22 22 21 21 20 20 20 19 19 19 18 18 17 17 17 16 15 14 14 14 13 12 11 11 11 11 10
Equa
tori
al G
uine
aB
otsw
ana
Mor
occo
Jam
aica
Tuni
sia
Mon
golia
Sou
th A
fric
aC
olom
bia
Bel
ize
Sur
inam
eFi
jiLi
beri
aM
ozam
biqu
eK
yrgy
zsta
nB
huta
nPa
ragu
ayK
enya
Egyp
t, A
RPe
ruZa
mbi
aH
ondu
ras
El S
alva
dor
Leba
non
Sen
egal
Gha
naVa
nuat
uTo
goB
urki
na F
aso
Côt
e d'
Ivoi
reN
epal
Ben
in
Lao
Peop
le’s
Dem
ocra
tic R
epub
licN
icar
agua
Rw
anda
Dom
inic
an R
epub
licPa
kist
anS
ri L
anka
Cam
bodi
aB
angl
ades
hG
uate
mal
aS
ierr
a Le
one
Ethi
opia
Cen
tral
Afr
ican
Rep
ublic
Afg
hani
stan
Source: World Bank database, accessed october 2014.
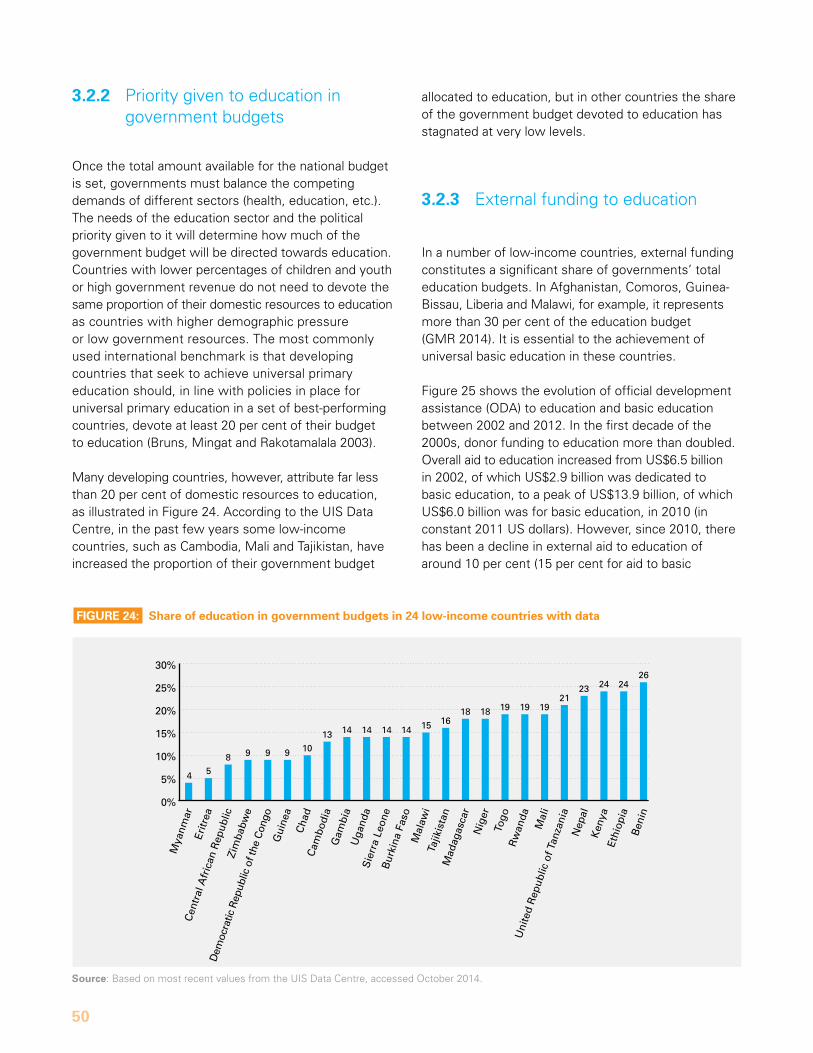
50
FiGuRE 24: Share of education in government budgets in 24 low-income countries with data
Source: Based on most recent values from the uIs data Centre, accessed october 2014.
3.2.2 Priority given to education in government budgets
once the total amount available for the national budget is set, governments must balance the competing demands of different sectors (health, education, etc.). The needs of the education sector and the political priority given to it will determine how much of the government budget will be directed towards education. Countries with lower percentages of children and youth or high government revenue do not need to devote the same proportion of their domestic resources to education as countries with higher demographic pressure or low government resources. The most commonly used international benchmark is that developing countries that seek to achieve universal primary education should, in line with policies in place for universal primary education in a set of best-performing countries, devote at least 20 per cent of their budget to education (Bruns, mingat and rakotamalala 2003).
many developing countries, however, attribute far less than 20 per cent of domestic resources to education, as illustrated in Figure 24. according to the uIs data Centre, in the past few years some low-income countries, such as Cambodia, mali and Tajikistan, have increased the proportion of their government budget
0%
5%
10%
15%
20%
25%
30%
5
8 9 9 9 10
13 14 14 14 14 15 1618 18 19 19 19
2123 24 24
26
4
Mya
nmar
Eritr
ea
Cen
tral
Afr
ican
Rep
ublic
Zim
babw
e
Dem
ocra
tic R
epub
lic o
f the
Con
goG
uine
aC
had
Cam
bodi
aG
ambi
aU
gand
aS
ierr
a Le
one
Bur
kina
Fas
oM
alaw
iTa
jikis
tan
Mad
agas
car
Nig
erTo
goR
wan
daM
ali
Uni
ted
Rep
ublic
of T
anza
nia
Nep
alK
enya
Ethi
opia
Ben
in
allocated to education, but in other countries the share of the government budget devoted to education has stagnated at very low levels.
3.2.3 External funding to education
In a number of low-income countries, external funding constitutes a significant share of governments’ total education budgets. In afghanistan, Comoros, Guinea- Bissau, Liberia and malawi, for example, it represents more than 30 per cent of the education budget (Gmr 2014). It is essential to the achievement of universal basic education in these countries. Figure 25 shows the evolution of official development assistance (oda) to education and basic education between 2002 and 2012. In the first decade of the 2000s, donor funding to education more than doubled. overall aid to education increased from us$6.5 billion in 2002, of which us$2.9 billion was dedicated to basic education, to a peak of us$13.9 billion, of which us$6.0 billion was for basic education, in 2010 (in constant 2011 us dollars). However, since 2010, there has been a decline in external aid to education of around 10 per cent (15 per cent for aid to basic
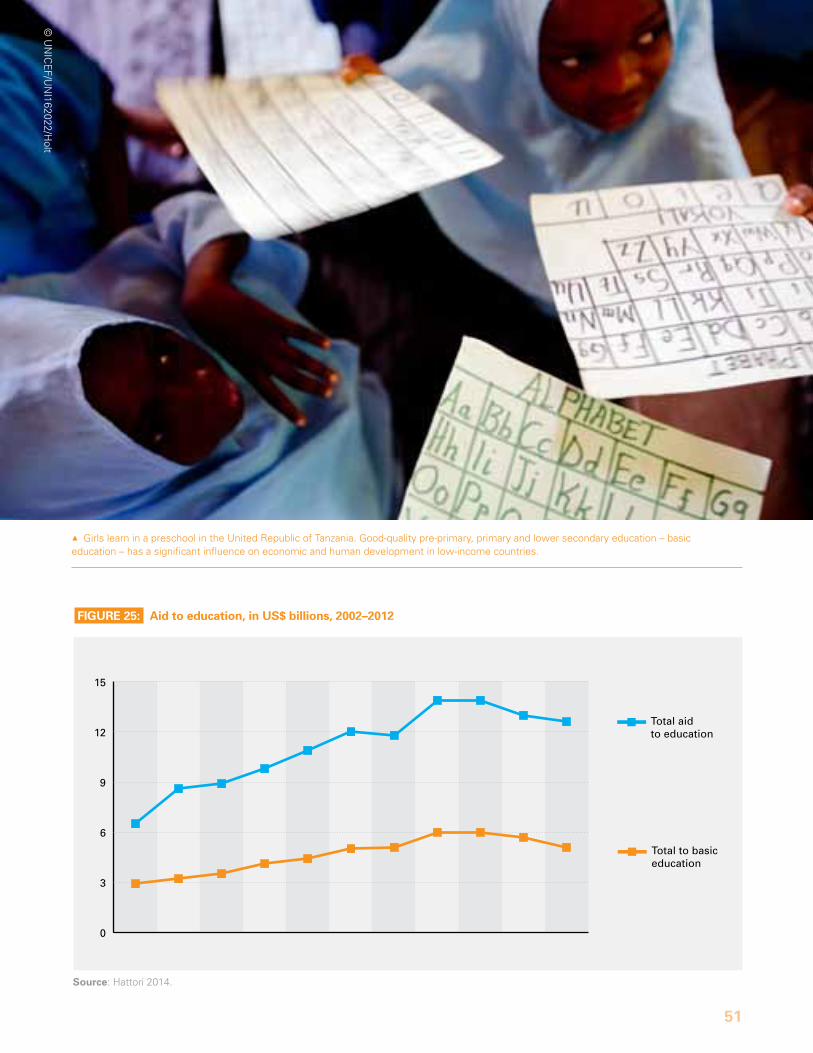
The InvesTmenT Case for eduCaTIon and equITy
51
3
FiGuRE 25: aid to education, in uS$ billions, 2002–2012
Source: Hattori 2014.
0
3
6
9
12
15
2002 2003 2004 2005 2006 2007 2008 2009 2010 2011 2012
Total aid to education
Total to basic education
1Girls learn in a preschool in the united republic of Tanzania. Good-quality pre-primary, primary and lower secondary education – basic education – has a significant influence on economic and human development in low-income countries.
© u
nIC
EF/u
nI162022/H
olt
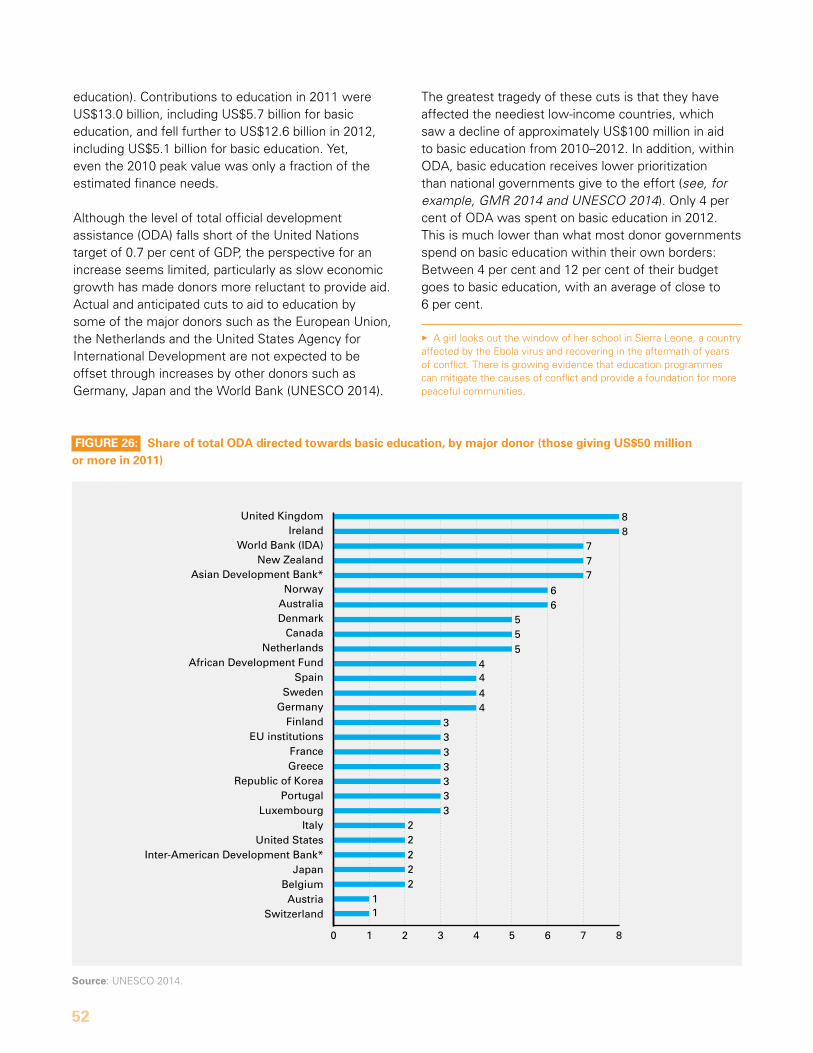
52
education). Contributions to education in 2011 were us$13.0 billion, including us$5.7 billion for basic education, and fell further to us$12.6 billion in 2012, including us$5.1 billion for basic education. yet, even the 2010 peak value was only a fraction of the estimated finance needs.
although the level of total official development assistance (oda) falls short of the united nations target of 0.7 per cent of GdP, the perspective for an increase seems limited, particularly as slow economic growth has made donors more reluctant to provide aid. actual and anticipated cuts to aid to education by some of the major donors such as the European union, the netherlands and the united states agency for International development are not expected to be offset through increases by other donors such as Germany, Japan and the World Bank (unEsCo 2014).
The greatest tragedy of these cuts is that they have affected the neediest low-income countries, which saw a decline of approximately us$100 million in aid to basic education from 2010–2012. In addition, within oda, basic education receives lower prioritization than national governments give to the effort (see, for example, GMR 2014 and UNESCO 2014). only 4 per cent of oda was spent on basic education in 2012. This is much lower than what most donor governments spend on basic education within their own borders: Between 4 per cent and 12 per cent of their budget goes to basic education, with an average of close to 6 per cent.
FiGuRE 26: Share of total oda directed towards basic education, by major donor (those giving uS$50 million or more in 2011)
Source: unEsCo 2014.
0 1 2 3 4 5 6 7 8
United KingdomIreland
World Bank (IDA)New Zealand
Asian Development Bank*Norway
AustraliaDenmark
CanadaNetherlands
African Development FundSpain
SwedenGermany
FinlandEU institutions
FranceGreece
Republic of KoreaPortugal
LuxembourgItaly
United StatesInter-American Development Bank*
JapanBelgiumAustria
Switzerland
Source: AID tables, UNESCO (2014a:395)
88
777
66
555
4444
3333333
22222
11
3a girl looks out the window of her school in sierra Leone, a country affected by the Ebola virus and recovering in the aftermath of years of conflict. There is growing evidence that education programmes can mitigate the causes of conflict and provide a foundation for more peaceful communities.
The InvesTmenT Case for eduCaTIon and equITy
53
3
© u
nIC
EF/s
Lra
2013-0351/asselin
54
1This 6-year-old says he loves “to come to school and learn. I have a lot of friends here and I really like all the games.” Providing a solid foundation before primary school can help children succeed in school. Conversely, studies show that countries with low pre-primary enrolment rates often have low primary completion rates.
once the amount of funding dedicated to education within countries is defined, governments make different choices in the way they distribute this funding across different levels of education. Their challenges and the need for trade-offs will be greater when resource needs are higher (e.g., in countries with high demographic dependency ratios) or resources are lower (e.g., a low tax base or low prioritization of education). In making their distribution decisions, governments often end up providing significantly more education resources to wealthier groups of children than to the poorest and most marginalized.
3.3 Equity in the allocation of education funding to different levels of education
3.3.1 distribution of public education spending across levels of education
as a general pattern, most low-income countries allocate a higher proportion of public education spending to primary education than middle- and high-income countries. This is mostly because the number of students who reach the secondary or tertiary levels is smaller and not because these countries spend much per pupil in primary. spending tends to shift to secondary and tertiary education as countries move towards universal primary education and an increasing number of primary school completers aspire to lower and upper secondary education opportunities.
some countries with low primary completion rates nevertheless dedicate a limited share of their education
© u
nIC
EF/m
Lya20131201/B
alasundaram
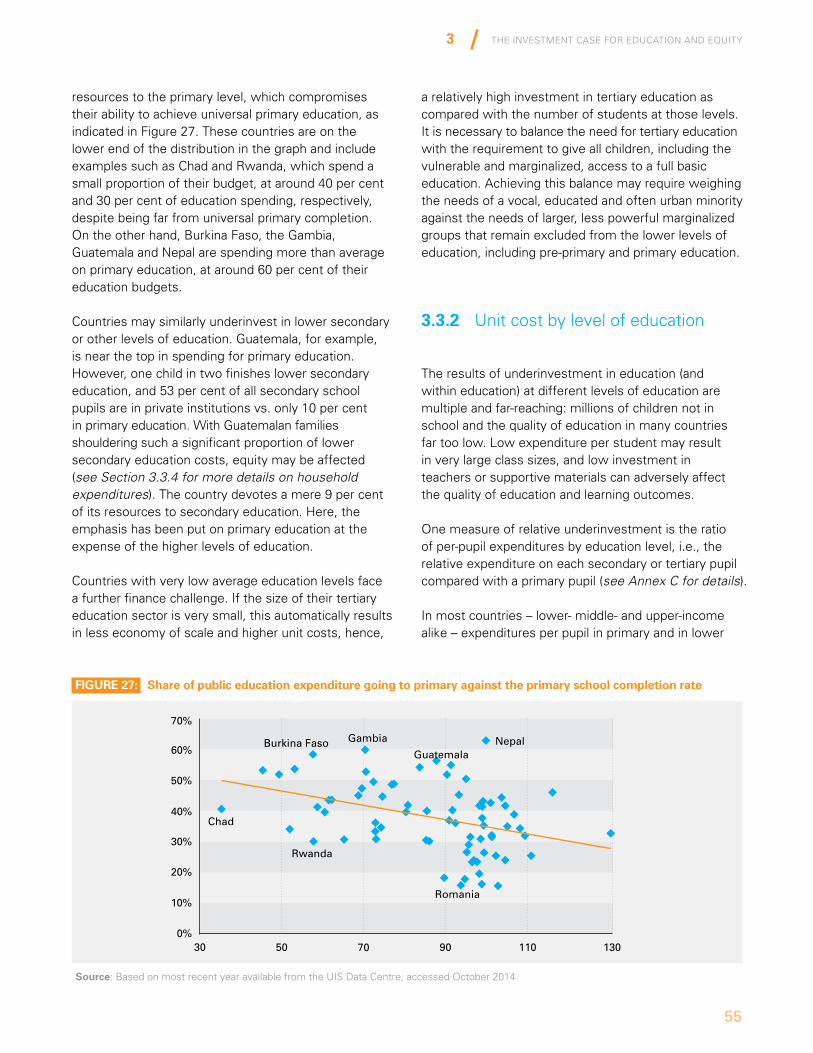
The InvesTmenT Case for eduCaTIon and equITy
55
3
FiGuRE 27: Share of public education expenditure going to primary against the primary school completion rate
Source: Based on most recent year available from the uIs data Centre, accessed october 2014.
resources to the primary level, which compromises their ability to achieve universal primary education, as indicated in Figure 27. These countries are on the lower end of the distribution in the graph and include examples such as Chad and rwanda, which spend a small proportion of their budget, at around 40 per cent and 30 per cent of education spending, respectively, despite being far from universal primary completion. on the other hand, Burkina Faso, the Gambia, Guatemala and nepal are spending more than average on primary education, at around 60 per cent of their education budgets.
Countries may similarly underinvest in lower secondary or other levels of education. Guatemala, for example, is near the top in spending for primary education. However, one child in two finishes lower secondary education, and 53 per cent of all secondary school pupils are in private institutions vs. only 10 per cent in primary education. With Guatemalan families shouldering such a significant proportion of lower secondary education costs, equity may be affected (see Section 3.3.4 for more details on household expenditures). The country devotes a mere 9 per cent of its resources to secondary education. Here, the emphasis has been put on primary education at the expense of the higher levels of education.
Countries with very low average education levels face a further finance challenge. If the size of their tertiary education sector is very small, this automatically results in less economy of scale and higher unit costs, hence,
70%
60%
50%
40%
30%
20%
10%
30
Chad
Rwanda
Burkina Faso Gambia NepalGuatemala
Romania
50 70 90 110 1300%
a relatively high investment in tertiary education as compared with the number of students at those levels. It is necessary to balance the need for tertiary education with the requirement to give all children, including the vulnerable and marginalized, access to a full basic education. achieving this balance may require weighing the needs of a vocal, educated and often urban minority against the needs of larger, less powerful marginalized groups that remain excluded from the lower levels of education, including pre-primary and primary education.
3.3.2 unit cost by level of education
The results of underinvestment in education (and within education) at different levels of education are multiple and far-reaching: millions of children not in school and the quality of education in many countries far too low. Low expenditure per student may result in very large class sizes, and low investment in teachers or supportive materials can adversely affect the quality of education and learning outcomes.
one measure of relative underinvestment is the ratio of per-pupil expenditures by education level, i.e., the relative expenditure on each secondary or tertiary pupil compared with a primary pupil (see Annex C for details).
In most countries – lower- middle- and upper-income alike – expenditures per pupil in primary and in lower
5a young boy at a school in India.
56
secondary education are similar, at least within a factor of two of each other. many countries, particularly upper-income countries, spend even more per primary pupil, mainly as the result of lower pupil-teacher ratios in lower grades. The same is true in some low-income countries, such as Ethiopia and yemen. There, the per-pupil expenditures on primary education are significantly higher than for secondary. In the majority of lower-income countries, though, the opposite is true: spending is significantly higher for secondary pupils. Countries that stand out in this respect are Bhutan, Cameroon, Chad, malawi, the niger and rwanda.
It is notable that for the niger, while unit expenditure in secondary is far higher than for primary, the country dedicates 52 per cent of its education budget to primary education. This apparent contradiction results because so few students make it to the secondary cycle.
unit expenditures in tertiary exceed those for primary in most countries by a larger margin than secondary
expenditures. There is a small group of countries, however, where the expenditures per tertiary student outstrip the expenditures on primary students by very high margins. annual public expenditure per tertiary student is 25–225 times that spent on a child in primary school. Burundi, the niger and seychelles are among the countries in this group. at the outer extreme, malawi spends 225 times as much per pupil in tertiary education (1,754 per cent GdP per capita) compared with each primary pupil (7.8 per cent of GdP per capita expenditure). In this context, subsidizing one more student for a year of tertiary education costs a year of education for more than 200 primary school students.
students at the higher levels of education overwhelm-ingly tend to be from the highest income quintiles (see Section 3.3.3) while the first students to be affected by cuts at the primary education level will be from the lowest income quintiles (see Chapter 1).This has sweeping consequences for equity.
un
ICE
F/Ind
a2014-00297/P
arelkar
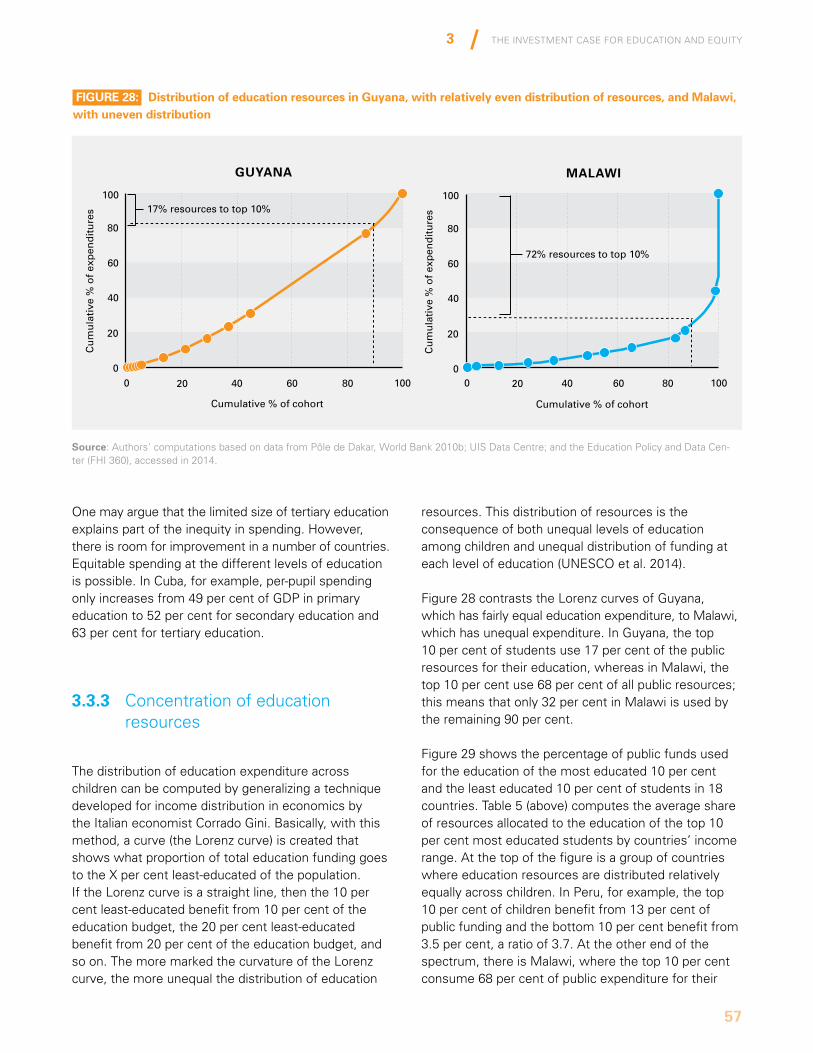
The InvesTmenT Case for eduCaTIon and equITy
57
3
Source: authors' computations based on data from Pôle de dakar, World Bank 2010b; uIs data Centre; and the Education Policy and data Cen-ter (FHI 360), accessed in 2014.
one may argue that the limited size of tertiary education explains part of the inequity in spending. However, there is room for improvement in a number of countries. Equitable spending at the different levels of education is possible. In Cuba, for example, per-pupil spending only increases from 49 per cent of GdP in primary education to 52 per cent for secondary education and 63 per cent for tertiary education.
3.3.3 Concentration of education resources
The distribution of education expenditure across children can be computed by generalizing a technique developed for income distribution in economics by the Italian economist Corrado Gini. Basically, with this method, a curve (the Lorenz curve) is created that shows what proportion of total education funding goes to the X per cent least-educated of the population. If the Lorenz curve is a straight line, then the 10 per cent least-educated benefit from 10 per cent of the education budget, the 20 per cent least-educated benefit from 20 per cent of the education budget, and so on. The more marked the curvature of the Lorenz curve, the more unequal the distribution of education
100
80
60
40
20
00 20 40 60 80 100
GUYANA
17% resources to top 10%
Cumulative % of cohort
Cu
mu
lati
ve %
of
exp
end
itu
res
MALAWI
100
80
60
40
20
00 20 40 60 80 100
72% resources to top 10%
Cumulative % of cohort
Cu
mu
lati
ve %
of
exp
end
itu
res
FiGuRE 28: distribution of education resources in Guyana, with relatively even distribution of resources, and Malawi, with uneven distribution
resources. This distribution of resources is the consequence of both unequal levels of education among children and unequal distribution of funding at each level of education (unEsCo et al. 2014).
Figure 28 contrasts the Lorenz curves of Guyana, which has fairly equal education expenditure, to malawi, which has unequal expenditure. In Guyana, the top 10 per cent of students use 17 per cent of the public resources for their education, whereas in malawi, the top 10 per cent use 68 per cent of all public resources; this means that only 32 per cent in malawi is used by the remaining 90 per cent.
Figure 29 shows the percentage of public funds used for the education of the most educated 10 per cent and the least educated 10 per cent of students in 18 countries. Table 5 (above) computes the average share of resources allocated to the education of the top 10 per cent most educated students by countries’ income range. at the top of the figure is a group of countries where education resources are distributed relatively equally across children. In Peru, for example, the top 10 per cent of children benefit from 13 per cent of public funding and the bottom 10 per cent benefit from 3.5 per cent, a ratio of 3.7. at the other end of the spectrum, there is malawi, where the top 10 per cent consume 68 per cent of public expenditure for their
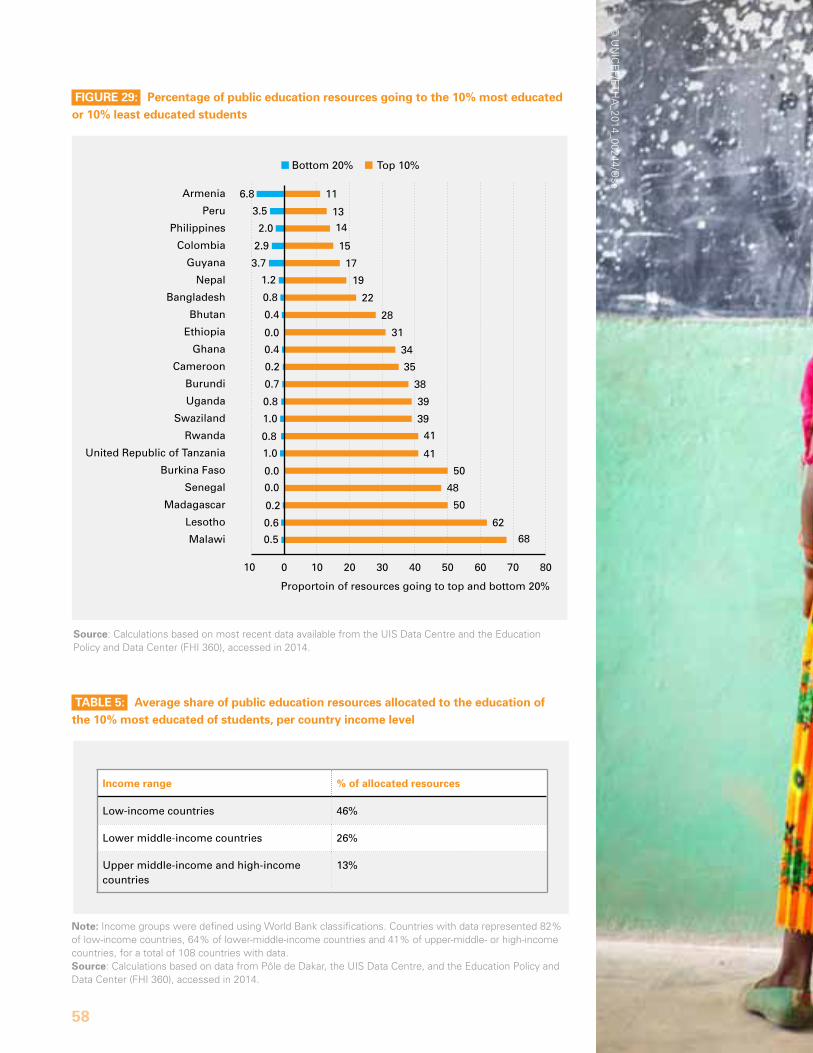
58
0 10 20 30 40 50 60 70 80
116.8
3.5
3.7
2.9
1.2
0.8
0.4
0.0
0.0
0.0
0.4
0.2
0.7
0.8
1.0
0.8
1.0
0.2
0.6
0.5
2.0
13
14
15
17
19
22
28
31
34
35
38
39
39
41
41
50
48
50
62
68
10
Armenia
Peru
Philippines
Colombia
Guyana
Nepal
Bangladesh
Bhutan
Ethiopia
Ghana
Cameroon
Burundi
Uganda
Swaziland
Rwanda
United Republic of Tanzania
Burkina Faso
Senegal
Madagascar
Lesotho
Malawi
Bottom 20% Top 10%
Calculations based on data from: UIS and EPDC databases
Proportoin of resources going to top and bottom 20%
Source: Calculations based on most recent data available from the uIs data Centre and the Education Policy and data Center (FHI 360), accessed in 2014.
FiGuRE 29: Percentage of public education resources going to the 10% most educated or 10% least educated students
note: Income groups were defined using World Bank classifications. Countries with data represented 82% of low-income countries, 64% of lower-middle-income countries and 41% of upper-middle- or high-income countries, for a total of 108 countries with data.Source: Calculations based on data from Pôle de dakar, the uIs data Centre, and the Education Policy and data Center (FHI 360), accessed in 2014.
taBlE 5: average share of public education resources allocated to the education of the 10% most educated of students, per country income level
income range % of allocated resources
Low-income countries 46%
Lower middle-income countries 26%
upper middle-income and high-income countries
13%
© u
nIC
EF/E
THa
_2014_00244/ose
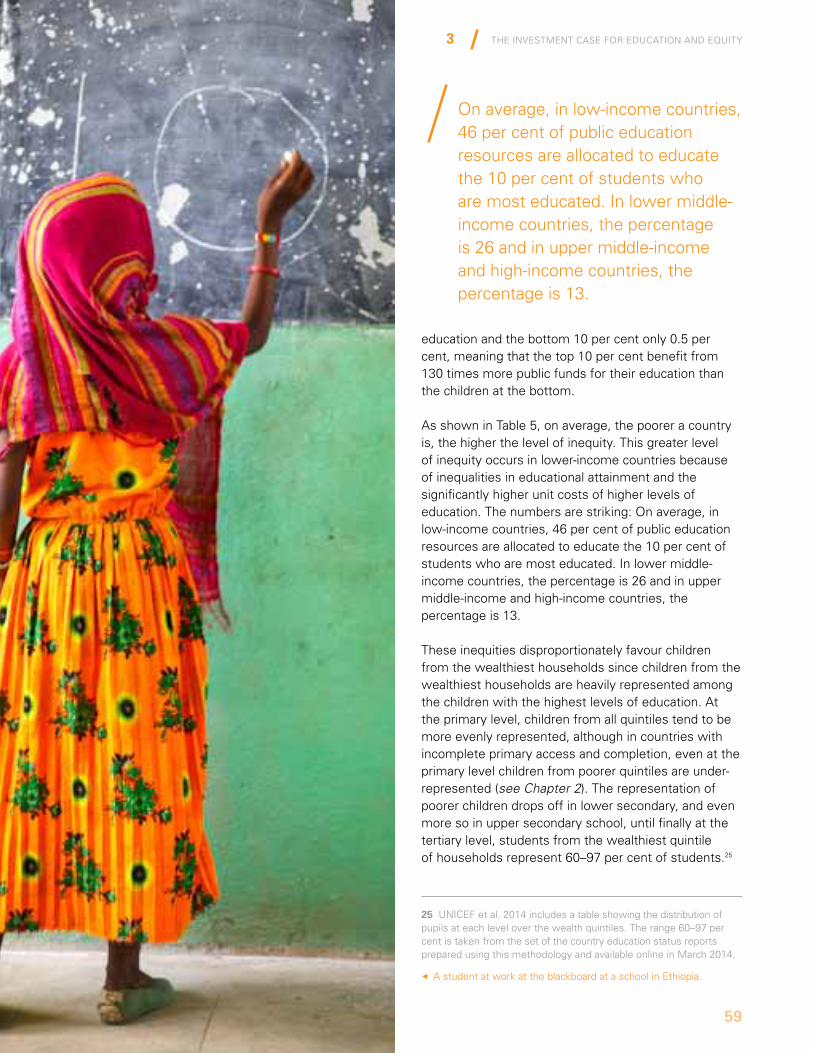
The InvesTmenT Case for eduCaTIon and equITy
59
3
education and the bottom 10 per cent only 0.5 per cent, meaning that the top 10 per cent benefit from 130 times more public funds for their education than the children at the bottom.
as shown in Table 5, on average, the poorer a country is, the higher the level of inequity. This greater level of inequity occurs in lower-income countries because of inequalities in educational attainment and the significantly higher unit costs of higher levels of education. The numbers are striking: on average, in low-income countries, 46 per cent of public education resources are allocated to educate the 10 per cent of students who are most educated. In lower middle- income countries, the percentage is 26 and in upper middle-income and high-income countries, the percentage is 13.
These inequities disproportionately favour children from the wealthiest households since children from the wealthiest households are heavily represented among the children with the highest levels of education. at the primary level, children from all quintiles tend to be more evenly represented, although in countries with incomplete primary access and completion, even at the primary level children from poorer quintiles are under-represented (see Chapter 2). The representation of poorer children drops off in lower secondary, and even more so in upper secondary school, until finally at the tertiary level, students from the wealthiest quintile of households represent 60–97 per cent of students.25
on average, in low-income countries, 46 per cent of public education resources are allocated to educate the 10 per cent of students who are most educated. In lower middle- income countries, the percentage is 26 and in upper middle-income and high-income countries, the percentage is 13.
25 unICEF et al. 2014 includes a table showing the distribution of pupils at each level over the wealth quintiles. The range 60–97 per cent is taken from the set of the country education status reports prepared using this methodology and available online in march 2014.
7a student at work at the blackboard at a school in Ethiopia.
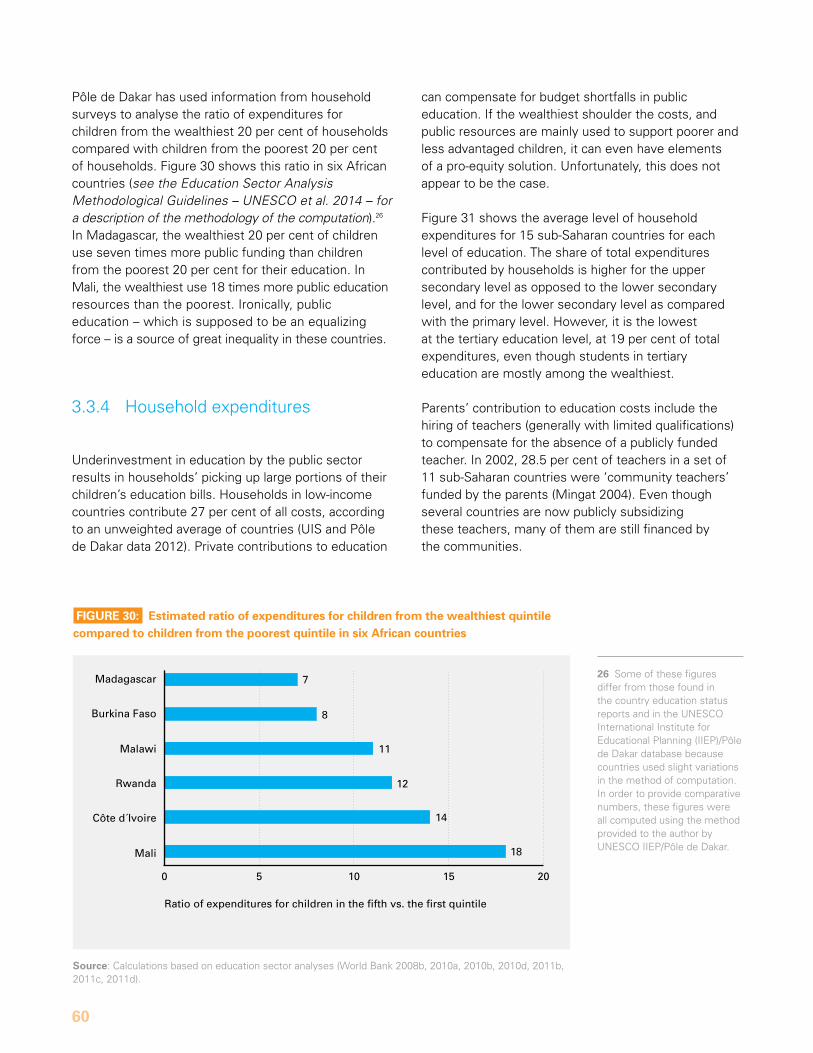
60
Source: Calculations based on education sector analyses (World Bank 2008b, 2010a, 2010b, 2010d, 2011b, 2011c, 2011d).
FiGuRE 30: Estimated ratio of expenditures for children from the wealthiest quintile compared to children from the poorest quintile in six african countries
0 5 10 15 20
Madagascar
Burkina Faso
Malawi
Rwanda
Côte d´Ivoire
Mali
7
8
11
12
14
18
Ratio of expenditures for children in the fifth vs. the first quintile
Pôle de dakar has used information from household surveys to analyse the ratio of expenditures for children from the wealthiest 20 per cent of households compared with children from the poorest 20 per cent of households. Figure 30 shows this ratio in six african countries (see the Education Sector Analysis Methodological Guidelines – UNESCO et al. 2014 – for a description of the methodology of the computation).26 In madagascar, the wealthiest 20 per cent of children use seven times more public funding than children from the poorest 20 per cent for their education. In mali, the wealthiest use 18 times more public education resources than the poorest. Ironically, public education – which is supposed to be an equalizing force – is a source of great inequality in these countries.
3.3.4 Household expenditures
underinvestment in education by the public sector results in households’ picking up large portions of their children’s education bills. Households in low-income countries contribute 27 per cent of all costs, according to an unweighted average of countries (uIs and Pôle de dakar data 2012). Private contributions to education
26 some of these figures differ from those found in the country education status reports and in the unEsCo International Institute for Educational Planning (IIEP)/Pôle de dakar database because countries used slight variations in the method of computation. In order to provide comparative numbers, these figures were all computed using the method provided to the author by unEsCo IIEP/Pôle de dakar.
can compensate for budget shortfalls in public education. If the wealthiest shoulder the costs, and public resources are mainly used to support poorer and less advantaged children, it can even have elements of a pro-equity solution. unfortunately, this does not appear to be the case.
Figure 31 shows the average level of household expenditures for 15 sub-saharan countries for each level of education. The share of total expenditures contributed by households is higher for the upper secondary level as opposed to the lower secondary level, and for the lower secondary level as compared with the primary level. However, it is the lowest at the tertiary education level, at 19 per cent of total expenditures, even though students in tertiary education are mostly among the wealthiest.
Parents’ contribution to education costs include the hiring of teachers (generally with limited qualifications) to compensate for the absence of a publicly funded teacher. In 2002, 28.5 per cent of teachers in a set of 11 sub-saharan countries were ‘community teachers’ funded by the parents (mingat 2004). Even though several countries are now publicly subsidizing these teachers, many of them are still financed by the communities.
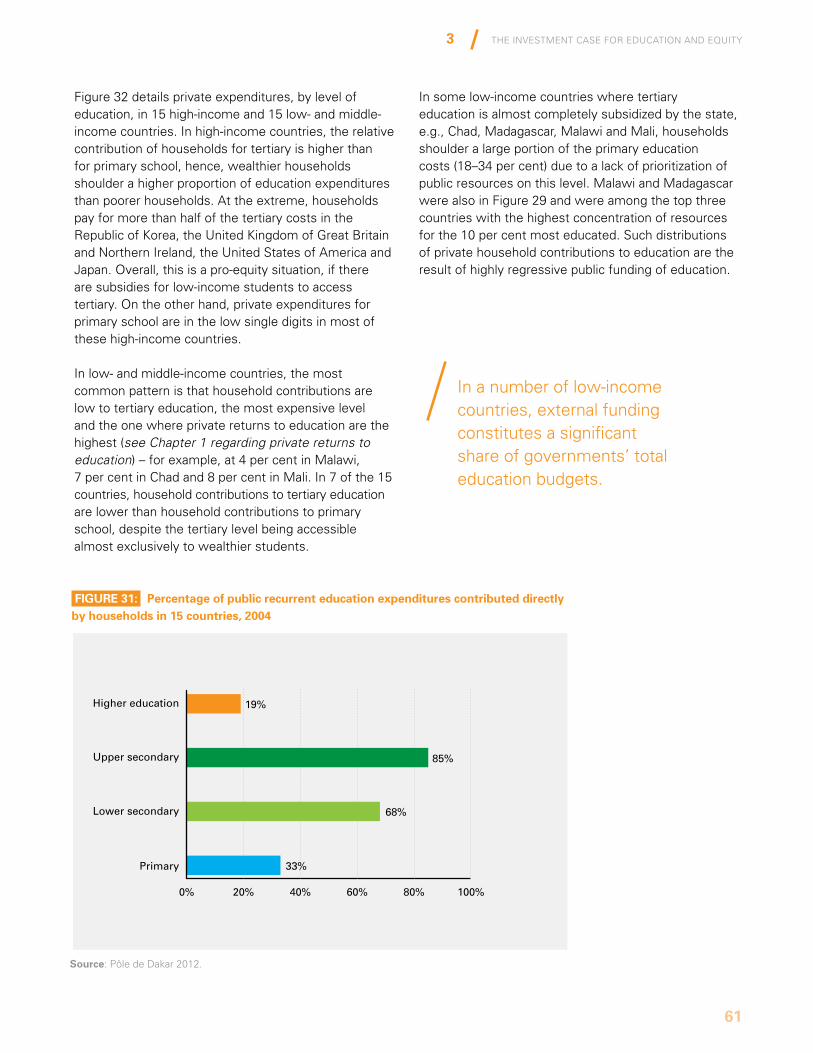
The InvesTmenT Case for eduCaTIon and equITy
61
3
Source: Pôle de dakar 2012.
FiGuRE 31: Percentage of public recurrent education expenditures contributed directly by households in 15 countries, 2004
0% 20% 40% 60% 80% 100%
Higher education 19%
85%
68%
33%
Upper secondary
Lower secondary
Primary
Source: Pole de Dakar, 2012
Figure 32 details private expenditures, by level of education, in 15 high-income and 15 low- and middle-income countries. In high-income countries, the relative contribution of households for tertiary is higher than for primary school, hence, wealthier households shoulder a higher proportion of education expenditures than poorer households. at the extreme, households pay for more than half of the tertiary costs in the republic of Korea, the united Kingdom of Great Britain and northern Ireland, the united states of america and Japan. overall, this is a pro-equity situation, if there are subsidies for low-income students to access tertiary. on the other hand, private expenditures for primary school are in the low single digits in most of these high-income countries.
In low- and middle-income countries, the most common pattern is that household contributions are low to tertiary education, the most expensive level and the one where private returns to education are the highest (see Chapter 1 regarding private returns to education) – for example, at 4 per cent in malawi, 7 per cent in Chad and 8 per cent in mali. In 7 of the 15 countries, household contributions to tertiary education are lower than household contributions to primary school, despite the tertiary level being accessible almost exclusively to wealthier students.
In some low-income countries where tertiary education is almost completely subsidized by the state, e.g., Chad, madagascar, malawi and mali, households shoulder a large portion of the primary education costs (18–34 per cent) due to a lack of prioritization of public resources on this level. malawi and madagascar were also in Figure 29 and were among the top three countries with the highest concentration of resources for the 10 per cent most educated. such distributions of private household contributions to education are the result of highly regressive public funding of education.
In a number of low-income countries, external fundingconstitutes a significant share of governments’ totaleducation budgets.
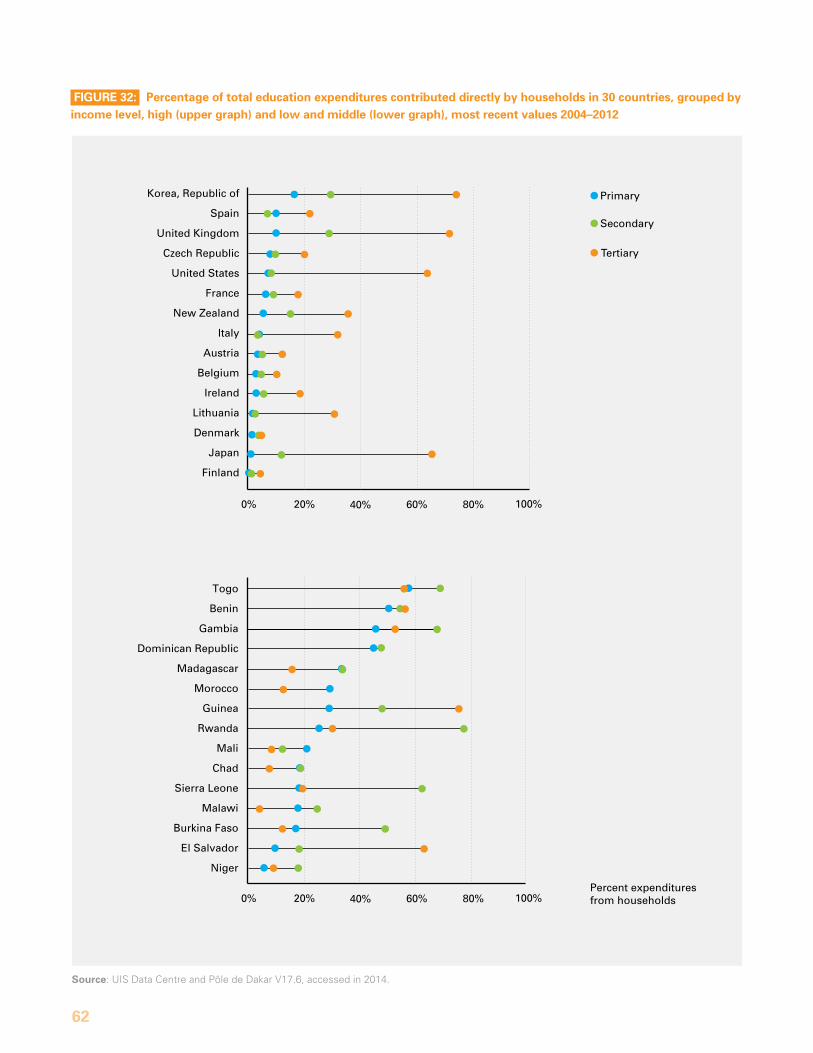
62
Source: uIs data Centre and Pôle de dakar V17.6, accessed in 2014.
FiGuRE 32: Percentage of total education expenditures contributed directly by households in 30 countries, grouped by income level, high (upper graph) and low and middle (lower graph), most recent values 2004–2012
0% 20% 40% 60% 80% 100%
Tertiary
Primary
Secondary
Korea, Republic of
Spain
United Kingdom
Czech Republic
United States
France
New Zealand
Italy
Austria
Belgium
Ireland
Lithuania
Denmark
Japan
Finland
Percent expenditures from households0% 20% 40% 60% 80% 100%
Togo
Benin
Gambia
Dominican Republic
Madagascar
Morocco
Guinea
Rwanda
Mali
Chad
Sierra Leone
Malawi
Burkina Faso
El Salvador
Niger
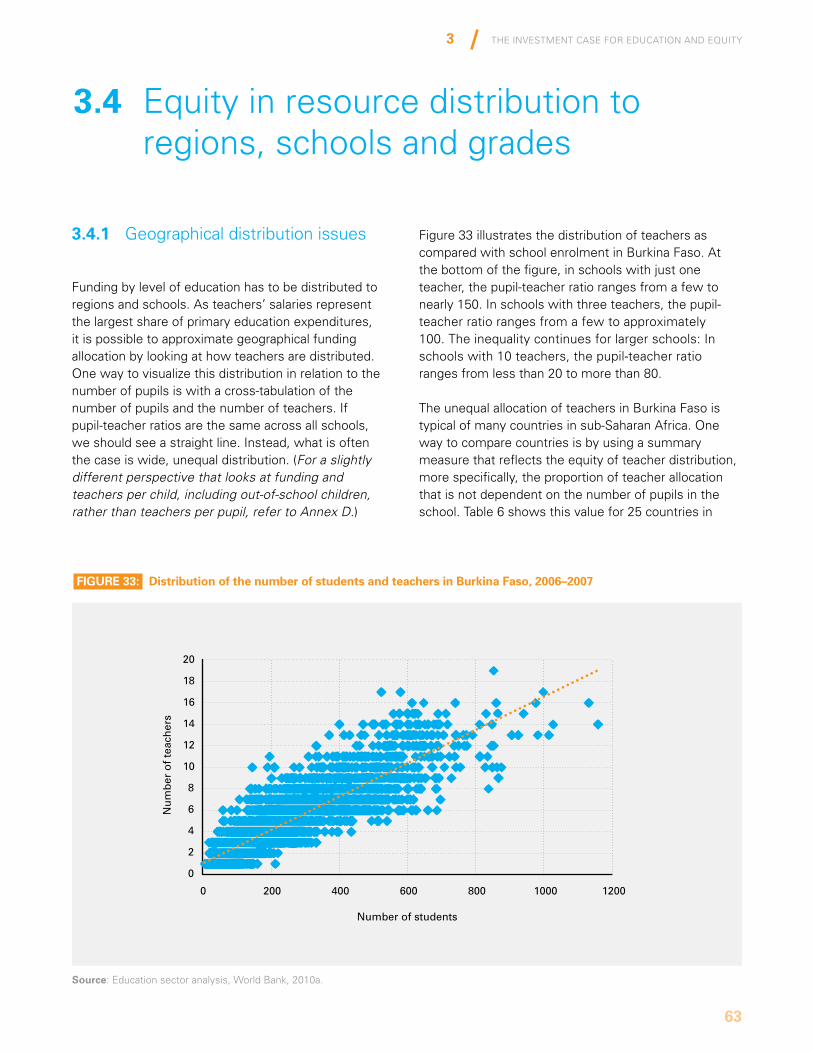
The InvesTmenT Case for eduCaTIon and equITy
63
3
3.4.1 Geographical distribution issues
Funding by level of education has to be distributed to regions and schools. as teachers’ salaries represent the largest share of primary education expenditures, it is possible to approximate geographical funding allocation by looking at how teachers are distributed. one way to visualize this distribution in relation to the number of pupils is with a cross-tabulation of the number of pupils and the number of teachers. If pupil-teacher ratios are the same across all schools, we should see a straight line. Instead, what is often the case is wide, unequal distribution. (For a slightly different perspective that looks at funding and teachers per child, including out-of-school children, rather than teachers per pupil, refer to Annex D.)
3.4 Equity in resource distribution to regions, schools and grades
Figure 33 illustrates the distribution of teachers as compared with school enrolment in Burkina Faso. at the bottom of the figure, in schools with just one teacher, the pupil-teacher ratio ranges from a few to nearly 150. In schools with three teachers, the pupil-teacher ratio ranges from a few to approximately 100. The inequality continues for larger schools: In schools with 10 teachers, the pupil-teacher ratio ranges from less than 20 to more than 80.
The unequal allocation of teachers in Burkina Faso is typical of many countries in sub-saharan africa. one way to compare countries is by using a summary measure that reflects the equity of teacher distribution, more specifically, the proportion of teacher allocation that is not dependent on the number of pupils in the school. Table 6 shows this value for 25 countries in
FiGuRE 33: distribution of the number of students and teachers in Burkina Faso, 2006–2007
20
18
16
14
12
10
8
6
4
2
0
0 200 400 600 800 1000 1200
Nu
mb
er o
f te
ach
ers
Number of students
Source: education sector analysis, World Bank, 2010a
Source: Education sector analysis, World Bank, 2010a.
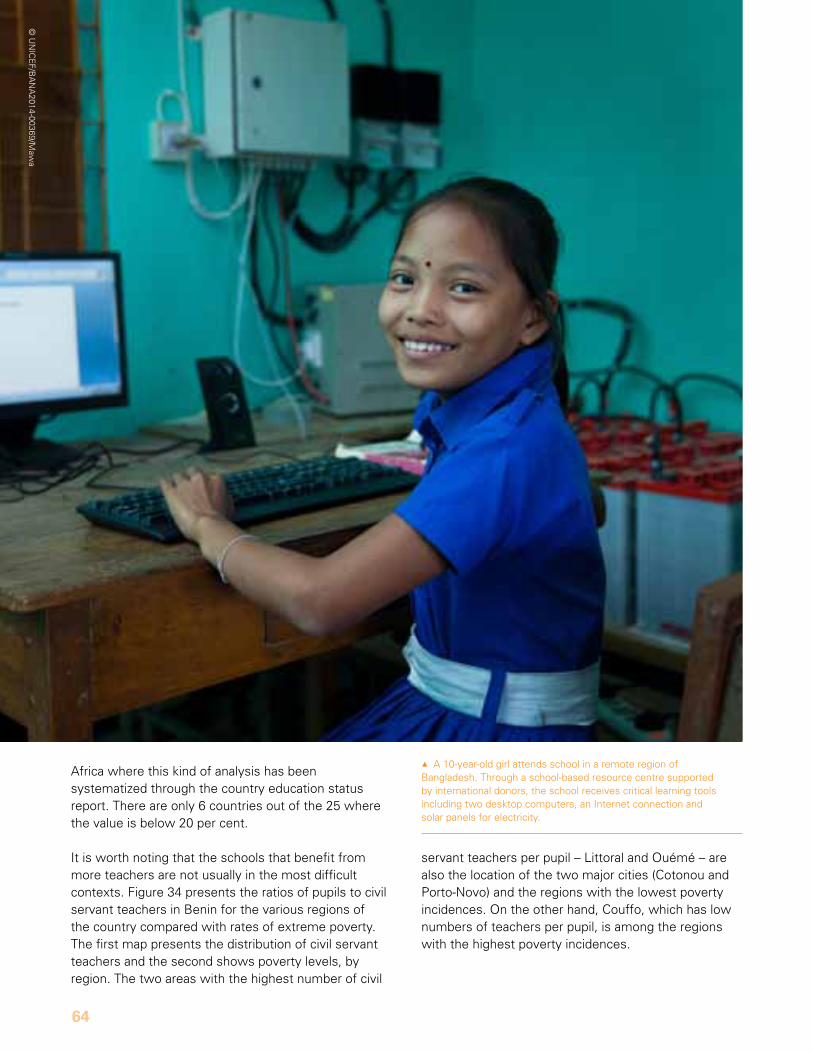
64
africa where this kind of analysis has been systematized through the country education status report. There are only 6 countries out of the 25 where the value is below 20 per cent.
It is worth noting that the schools that benefit from more teachers are not usually in the most difficult contexts. Figure 34 presents the ratios of pupils to civil servant teachers in Benin for the various regions of the country compared with rates of extreme poverty. The first map presents the distribution of civil servant teachers and the second shows poverty levels, by region. The two areas with the highest number of civil
1a 10-year-old girl attends school in a remote region of Bangladesh. Through a school-based resource centre supported by international donors, the school receives critical learning tools including two desktop computers, an Internet connection and solar panels for electricity.
servant teachers per pupil – Littoral and ouémé – are also the location of the two major cities (Cotonou and Porto-novo) and the regions with the lowest poverty incidences. on the other hand, Couffo, which has low numbers of teachers per pupil, is among the regions with the highest poverty incidences.
© u
nIC
EF/B
an
a2014-00369/m
awa
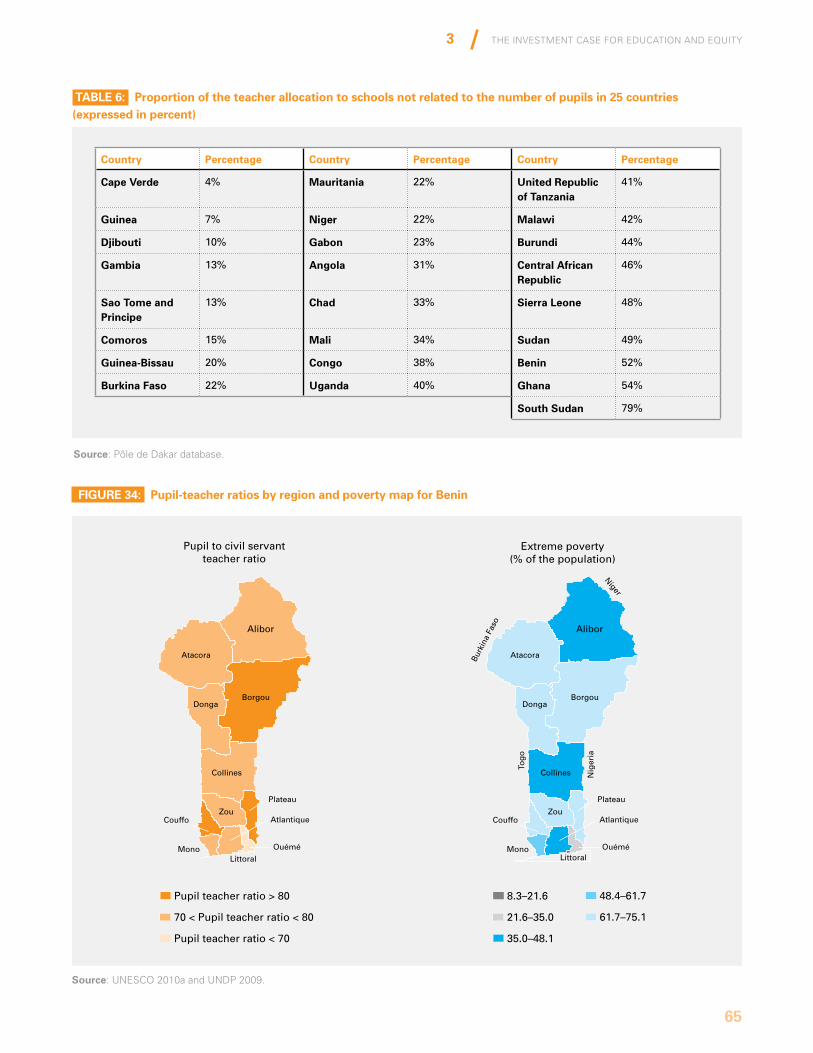
The InvesTmenT Case for eduCaTIon and equITy
65
3
Source: Pôle de dakar database.
Source: unEsCo 2010a and undP 2009.
taBlE 6: Proportion of the teacher allocation to schools not related to the number of pupils in 25 countries (expressed in percent)
FiGuRE 34: Pupil-teacher ratios by region and poverty map for Benin
country Percentage country Percentage country Percentage
cape Verde 4% Mauritania 22% united Republic of tanzania
41%
Guinea 7% niger 22% Malawi 42%
djibouti 10% Gabon 23% Burundi 44%
Gambia 13% angola 31% central african Republic
46%
Sao tome and Principe
13% chad 33% Sierra leone 48%
comoros 15% Mali 34% Sudan 49%
Guinea-Bissau 20% congo 38% Benin 52%
Burkina Faso 22% uganda 40% Ghana 54%
South Sudan 79%
Pupil to civil servant teacher ratio
Extreme poverty(% of the population)
Pupil teacher ratio > 80
70 < Pupil teacher ratio < 80
Pupil teacher ratio < 70
8.3–21.6
21.6–35.0
35.0–48.1
48.4–61.7
61.7–75.1
Alibor
BorgouDonga
Collines
ZouCouffo Atlantique
Ouémé
Plateau
MonoLittoral
Atacora
Alibor
BorgouDonga
Collines
ZouCouffo Atlantique
Ouémé
Plateau
Mono
Atacora
Littoral
Tog
o
Nig
eria
Niger
Burk
ina
Faso
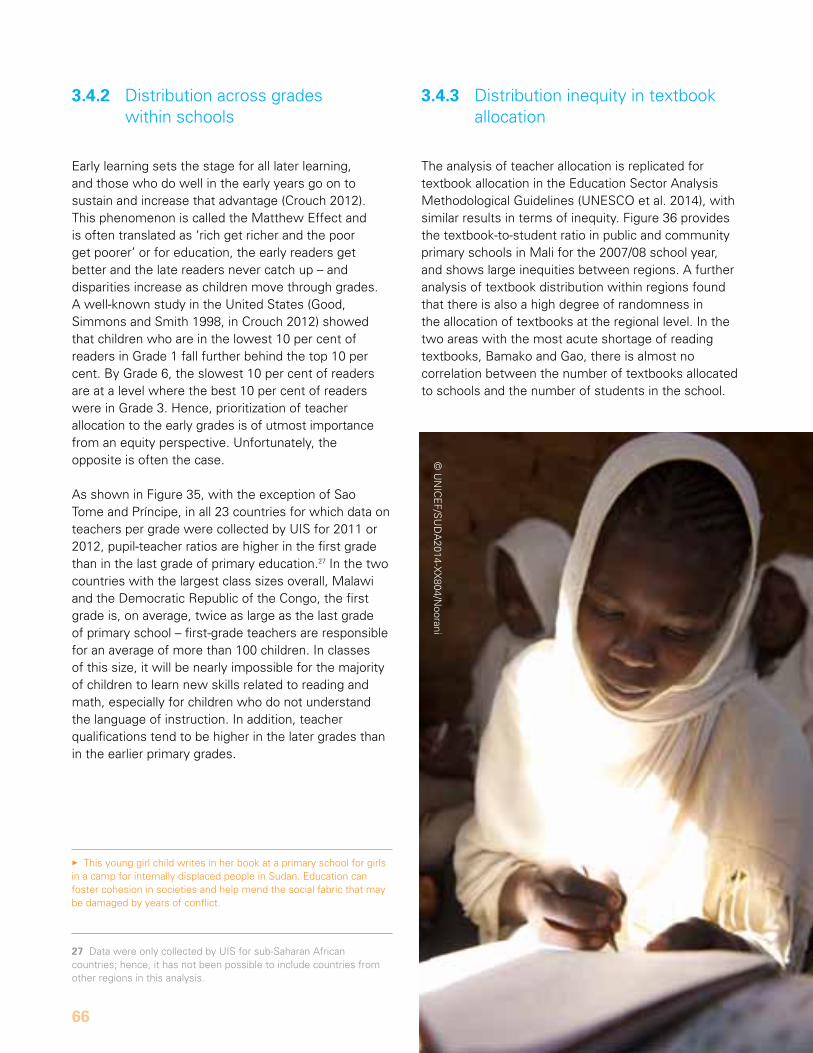
3This young girl child writes in her book at a primary school for girls in a camp for internally displaced people in sudan. Education can foster cohesion in societies and help mend the social fabric that may be damaged by years of conflict.
66
3.4.2 distribution across grades within schools
Early learning sets the stage for all later learning, and those who do well in the early years go on to sustain and increase that advantage (Crouch 2012). This phenomenon is called the matthew Effect and is often translated as ‘rich get richer and the poor get poorer’ or for education, the early readers get better and the late readers never catch up – and disparities increase as children move through grades. a well-known study in the united states (Good, simmons and smith 1998, in Crouch 2012) showed that children who are in the lowest 10 per cent of readers in Grade 1 fall further behind the top 10 per cent. By Grade 6, the slowest 10 per cent of readers are at a level where the best 10 per cent of readers were in Grade 3. Hence, prioritization of teacher allocation to the early grades is of utmost importance from an equity perspective. unfortunately, the opposite is often the case.
as shown in Figure 35, with the exception of sao Tome and Príncipe, in all 23 countries for which data on teachers per grade were collected by uIs for 2011 or 2012, pupil-teacher ratios are higher in the first grade than in the last grade of primary education.27 In the two countries with the largest class sizes overall, malawi and the democratic republic of the Congo, the first grade is, on average, twice as large as the last grade of primary school – first-grade teachers are responsible for an average of more than 100 children. In classes of this size, it will be nearly impossible for the majority of children to learn new skills related to reading and math, especially for children who do not understand the language of instruction. In addition, teacher qualifications tend to be higher in the later grades than in the earlier primary grades.
3.4.3 distribution inequity in textbook allocation
The analysis of teacher allocation is replicated for textbook allocation in the Education sector analysis methodological Guidelines (unEsCo et al. 2014), with similar results in terms of inequity. Figure 36 provides the textbook-to-student ratio in public and community primary schools in mali for the 2007/08 school year, and shows large inequities between regions. a further analysis of textbook distribution within regions found that there is also a high degree of randomness in the allocation of textbooks at the regional level. In the two areas with the most acute shortage of reading textbooks, Bamako and Gao, there is almost no correlation between the number of textbooks allocated to schools and the number of students in the school.
27 data were only collected by uIs for sub-saharan african countries; hence, it has not been possible to include countries from other regions in this analysis.
© u
nIC
EF/s
ud
a2014-X
X804/n
oorani
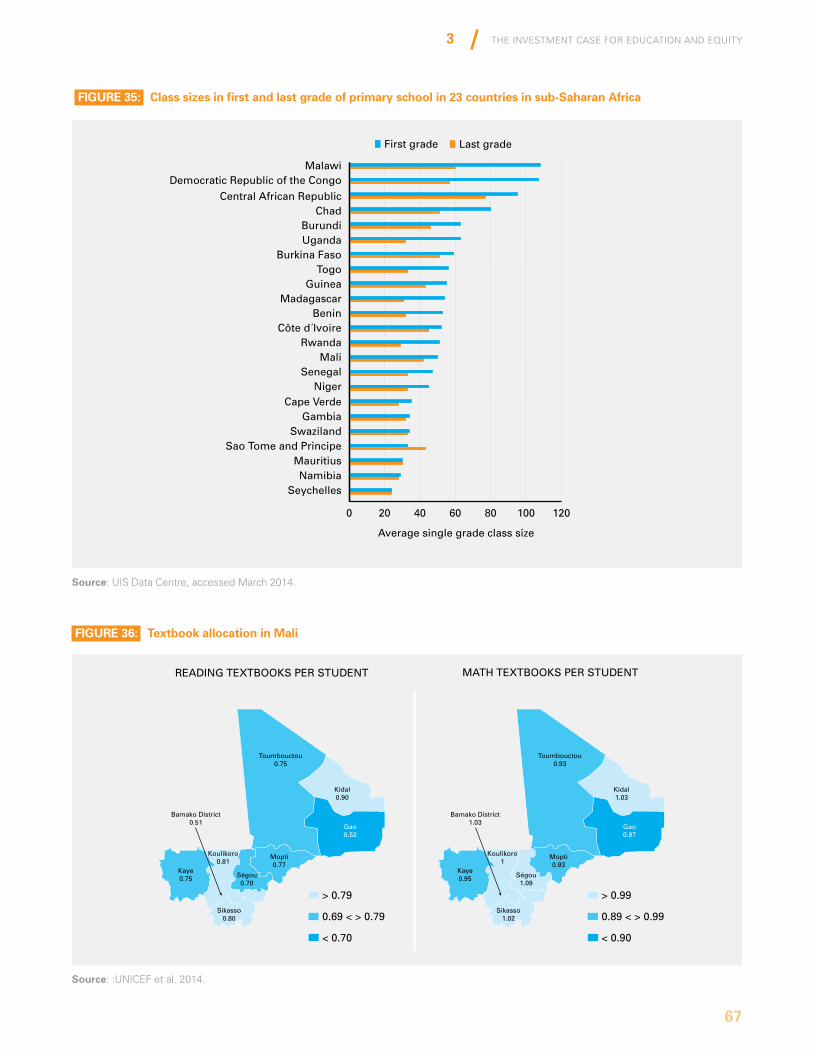
The InvesTmenT Case for eduCaTIon and equITy
67
3
Source: uIs data Centre, accessed march 2014.
FiGuRE 35: class sizes in first and last grade of primary school in 23 countries in sub-Saharan africa
0 20 40 60 80 100 120
First grade Last grade
Average single grade class size
MalawiDemocratic Republic of the Congo
Central African RepublicChad
BurundiUganda
Burkina FasoTogo
GuineaMadagascar
BeninCôte d´Ivoire
RwandaMali
SenegalNiger
Cape VerdeGambia
SwazilandSao Tome and Principe
MauritiusNamibia
Seychelles
Source: :unICEF et al. 2014.
FiGuRE 36: textbook allocation in Mali
READING TEXTBOOKS PER STUDENT
> 0.79
0.69 < > 0.79
< 0.70
Source: education sector analysis guide (Unicef et al., 2014)
Toumbouctou0.75
Kidal0.90
Gao0.52
Mopti0.77
Ségou0.70
Bamako District0.51
Koulikoro0.81
Sikasso0.80
Kaye0.75
MATH TEXTBOOKS PER STUDENT
> 0.99
0.89 < > 0.99
< 0.90
Toumbouctou0.93
Kidal1.03
Gao0.87
Mopti0.93
Ségou1.09
Bamako District1.03
Koulikoro1
Sikasso1.02
Kaye0.95
68
Higher spending may not necessarily translate into education results, whether higher enrolment, completion or improved learning. This section looks into what affects value for money.
3.5.1 demand-side challenges
section 3.1 noted that having what appears to be a sufficient level of funding for education at a given level does not automatically imply that there is universal enrolment at that level. The levels of inequity in access and learning described in Chapter 2 may be due to multiple and often overlapping barriers to education faced by children.
Household surveys find many barriers on the supply side (see Annex E). These include a social or policy environment that keeps some children out of school; lack of schools, teachers and materials; schools, curricula and schedules that are not adapted to particular children’s needs; and high costs of education. The surveys also highlight demand-side challenges: parents’ objections to education for their children, e.g., opposition to girls’ education; parents feeling that their children are too young; or competing needs for children’s time, particularly among adolescents. These barriers are strongly related to income, geographical location, gender and minority status, and contribute to the high inequities in enrolment, completion and learning outcomes noted between different groups of children.
studies also show that disability can be a significant barrier to enrolment, with higher disability levels being found in poorer environments (see, for example, WHO and World Bank 2011). yet many disabilities are easily preventable or correctable with the appropriate interventions. Here, however, lack of systematic quality data on disability is a hindrance to developing a more precise understanding of the situation to support policymaking.
3.5 Challenges with transforming resources into outcomes
as noted in Chapter 2, more than half, or 28 million, of the world’s out-of-school children of primary school age live in countries that are affected by conflict (Gmr 2013). studies show that half of the countries emerging from violent conflict will relapse into conflict within the next five years (united nations 2005). at the same time, children in conflict-affected countries are three times more likely to miss primary school (World Bank 2011b). It is therefore impossible to address the issue of out-of-school children without investing in education that helps mitigate the risk of conflict and aims to meet the specific needs of children in conflict and emergency situations.
3.5.2 Financial inputs and learning outcomes
Figure 37 shows the correlation in Guinea between per-pupil expenditures, by school, and primary exam pass rates. Each school is represented by a dot. on the y axis is the percentage of students who passed the primary school exam, and on the X axis are recurrent unit costs per student, in Guinean francs.
While this graph shows that recurrent unit costs per student vary greatly, hence, there is an issue of allocation equity, it also shows that there is limited correlation between investment and pass rates. many schools with low funding are among the most successful, and many schools with higher than average funding are among the least successful. The graph suggests that there is not only an equity issue but, at least as importantly, an inability to consistently translate funding into learning.
Higher spending may not necessarily translate into education results, whether higher enrolment, completion or improved learning.
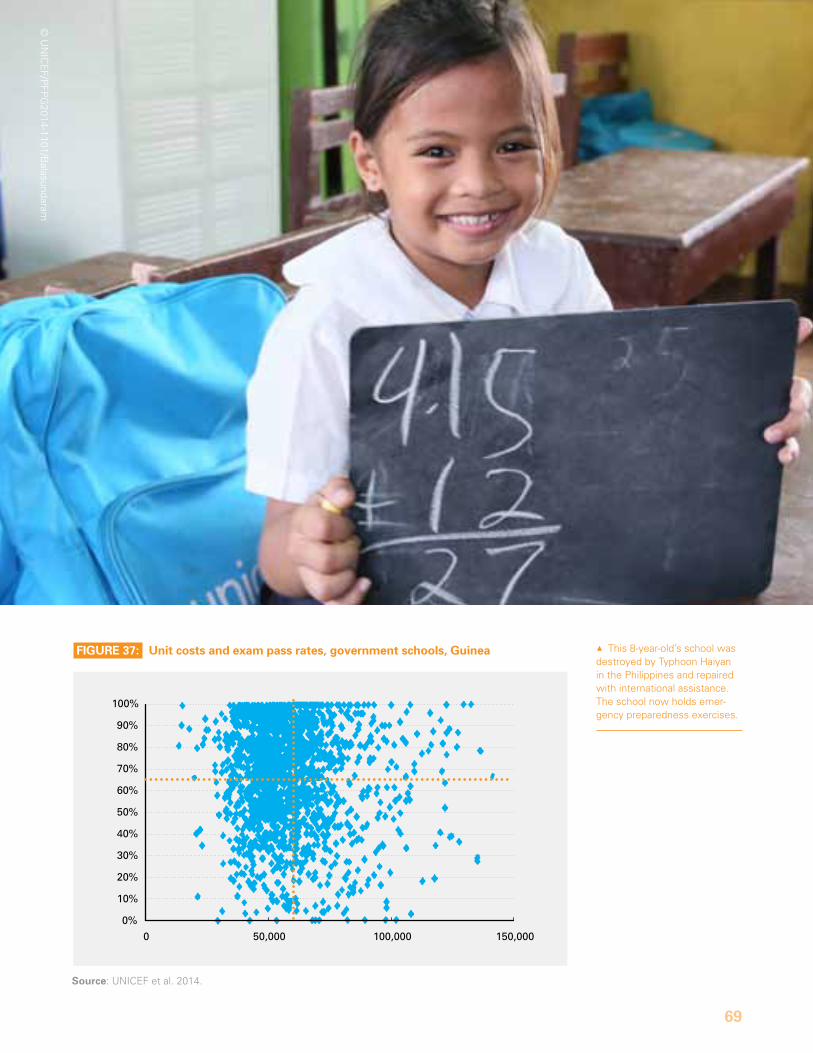
The InvesTmenT Case for eduCaTIon and equITy
69
3
Source: unICEF et al. 2014.
FiGuRE 37: unit costs and exam pass rates, government schools, Guinea
Source: education sector analysis guide (UNICEF et al., 2014)
100%
90%
80%
70%
60%
50%
40%
30%
20%
10%
0%
0 50,000 100,000 150,000
1This 8-year-old’s school was destroyed by Typhoon Haiyan in the Philippines and repaired with international assistance. The school now holds emer-gency preparedness exercises.
© u
nIC
EF/P
FPG
2014-1101/Balasundaram
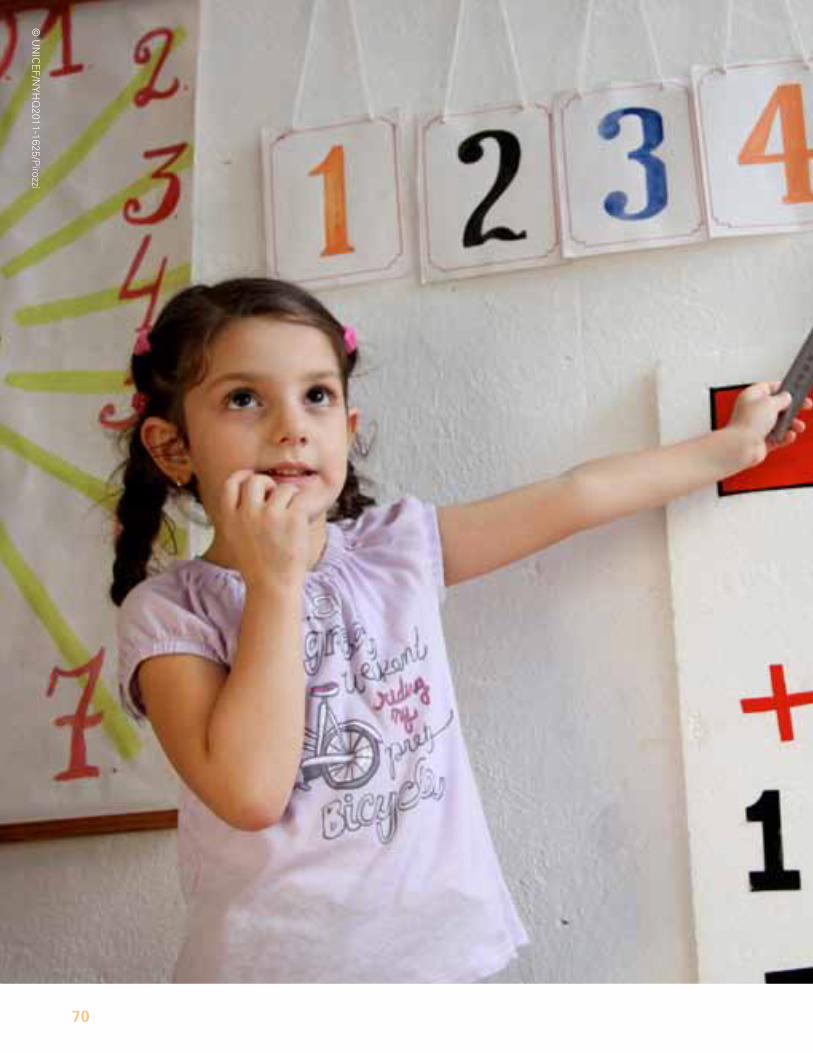
70
© u
nIC
EF/n
yH
q2011-1625/P
irozzi
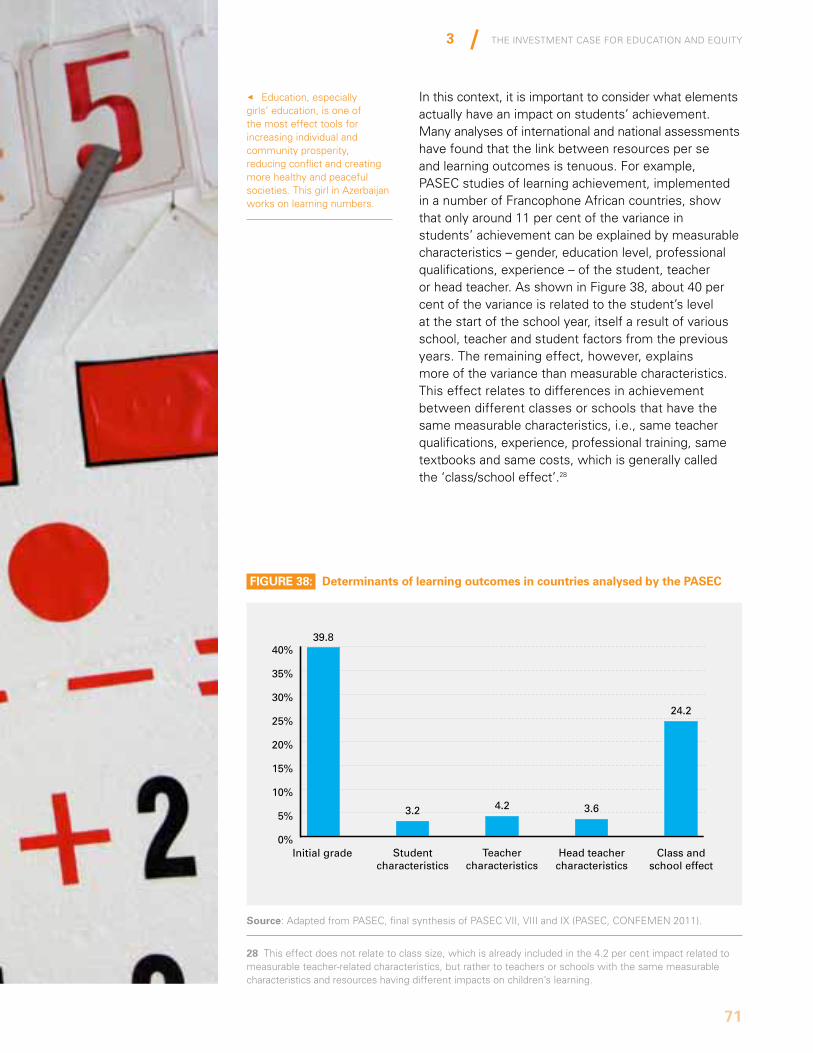
The InvesTmenT Case for eduCaTIon and equITy
71
3
In this context, it is important to consider what elements actually have an impact on students’ achievement. many analyses of international and national assessments have found that the link between resources per se and learning outcomes is tenuous. For example, PasEC studies of learning achievement, implemented in a number of Francophone african countries, show that only around 11 per cent of the variance in students’ achievement can be explained by measurable characteristics – gender, education level, professional qualifications, experience – of the student, teacher or head teacher. as shown in Figure 38, about 40 per cent of the variance is related to the student’s level at the start of the school year, itself a result of various school, teacher and student factors from the previous years. The remaining effect, however, explains more of the variance than measurable characteristics. This effect relates to differences in achievement between different classes or schools that have the same measurable characteristics, i.e., same teacher qualifications, experience, professional training, same textbooks and same costs, which is generally called the ‘class/school effect’.28
Source: adapted from PasEC, final synthesis of PasEC VII, VIII and IX (PasEC, ConFEmEn 2011).
FiGuRE 38: determinants of learning outcomes in countries analysed by the PaSEc
28 This effect does not relate to class size, which is already included in the 4.2 per cent impact related to measurable teacher-related characteristics, but rather to teachers or schools with the same measurable characteristics and resources having different impacts on children’s learning.
0%
5%
10%
15%
20%
25%
30%
35%
40%39.8
Initial grade Student characteristics
Teacher characteristics
Head teacher characteristics
Class and school effect
3.2 4.2 3.6
24.2
Adapted from PASEC, final synthesis of PASEC VII, VIII and IX (PASEC, CONFEMEN, 2011)
7 Education, especially girls’ education, is one of the most effect tools for increasing individual and community prosperity, reducing conflict and creating more healthy and peaceful societies. This girl in azerbaijan works on learning numbers.
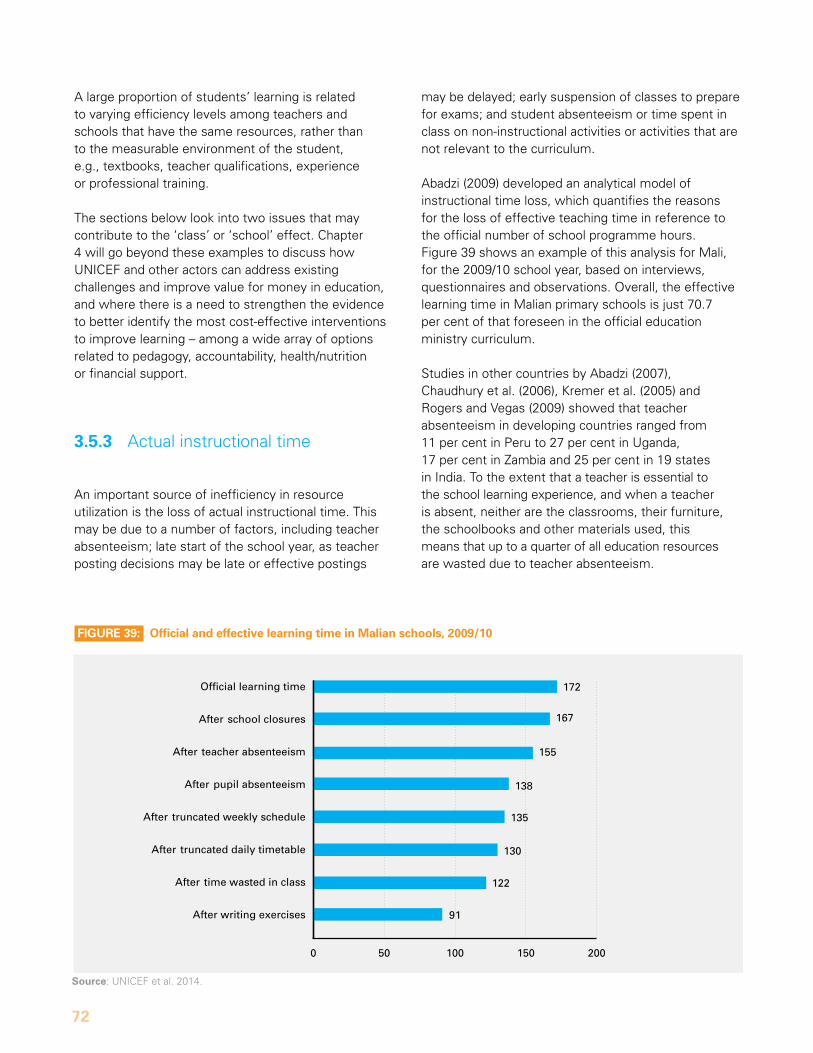
72
a large proportion of students’ learning is related to varying efficiency levels among teachers and schools that have the same resources, rather than to the measurable environment of the student, e.g., textbooks, teacher qualifications, experience or professional training.
The sections below look into two issues that may contribute to the ‘class’ or ‘school’ effect. Chapter 4 will go beyond these examples to discuss how unICEF and other actors can address existing challenges and improve value for money in education, and where there is a need to strengthen the evidence to better identify the most cost-effective interventions to improve learning – among a wide array of options related to pedagogy, accountability, health/nutrition or financial support.
3.5.3 actual instructional time
an important source of inefficiency in resource utilization is the loss of actual instructional time. This may be due to a number of factors, including teacher absenteeism; late start of the school year, as teacher posting decisions may be late or effective postings
may be delayed; early suspension of classes to prepare for exams; and student absenteeism or time spent in class on non-instructional activities or activities that are not relevant to the curriculum.
abadzi (2009) developed an analytical model of instructional time loss, which quantifies the reasons for the loss of effective teaching time in reference to the official number of school programme hours. Figure 39 shows an example of this analysis for mali, for the 2009/10 school year, based on interviews, questionnaires and observations. overall, the effective learning time in malian primary schools is just 70.7 per cent of that foreseen in the official education ministry curriculum.
studies in other countries by abadzi (2007), Chaudhury et al. (2006), Kremer et al. (2005) and rogers and Vegas (2009) showed that teacher absenteeism in developing countries ranged from 11 per cent in Peru to 27 per cent in uganda, 17 per cent in Zambia and 25 per cent in 19 states in India. To the extent that a teacher is essential to the school learning experience, and when a teacher is absent, neither are the classrooms, their furniture, the schoolbooks and other materials used, this means that up to a quarter of all education resources are wasted due to teacher absenteeism.
Source: unICEF et al. 2014.
FiGuRE 39: official and effective learning time in Malian schools, 2009/10
0 50 100 150 200
Source: Education sector analysis guide (UNICEF et al., 2014)
Official learning time
After school closures
After teacher absenteeism
After pupil absenteeism
After truncated weekly schedule
After truncated daily timetable
After time wasted in class
After writing exercises
172
167
155
138
135
130
122
91
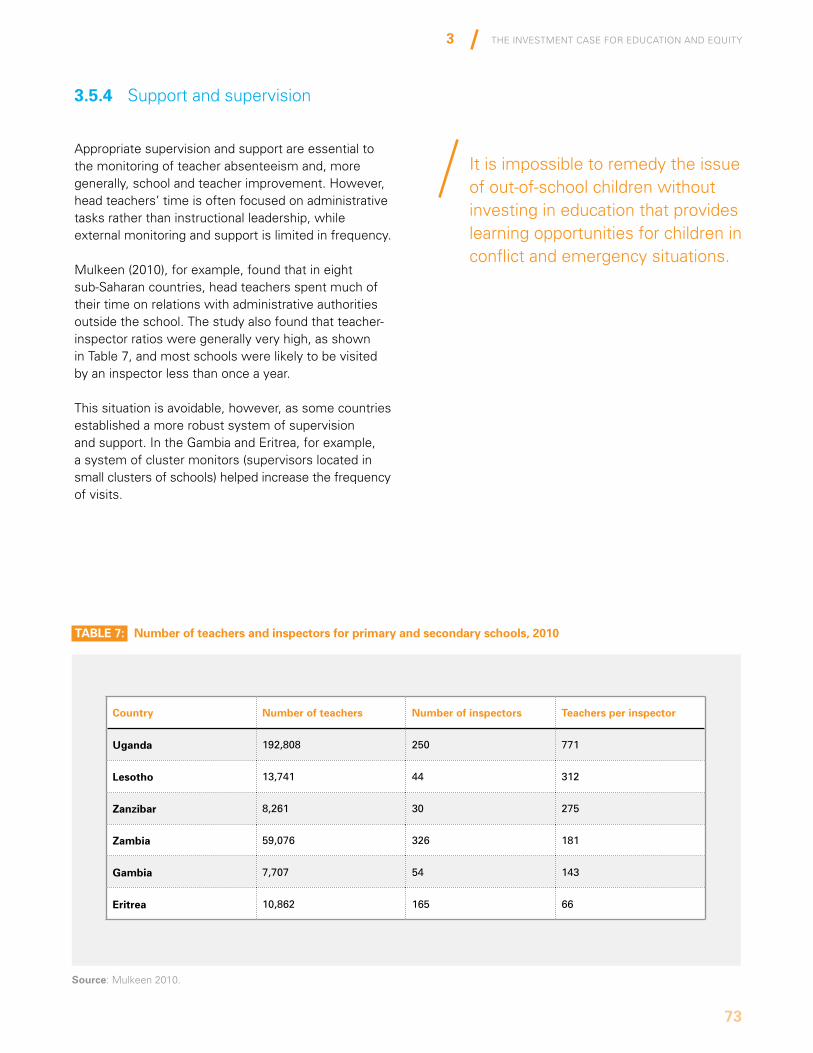
The InvesTmenT Case for eduCaTIon and equITy
73
3
3.5.4 support and supervision
appropriate supervision and support are essential to the monitoring of teacher absenteeism and, more generally, school and teacher improvement. However, head teachers’ time is often focused on administrative tasks rather than instructional leadership, while external monitoring and support is limited in frequency.
mulkeen (2010), for example, found that in eight sub-saharan countries, head teachers spent much of their time on relations with administrative authorities outside the school. The study also found that teacher-inspector ratios were generally very high, as shown in Table 7, and most schools were likely to be visited by an inspector less than once a year.
This situation is avoidable, however, as some countries established a more robust system of supervision and support. In the Gambia and Eritrea, for example, a system of cluster monitors (supervisors located in small clusters of schools) helped increase the frequency of visits.
Source: mulkeen 2010.
taBlE 7: number of teachers and inspectors for primary and secondary schools, 2010
country number of teachers number of inspectors teachers per inspector
uganda 192,808 250 771
lesotho 13,741 44 312
Zanzibar 8,261 30 275
Zambia 59,076 326 181
Gambia 7,707 54 143
Eritrea 10,862 165 66
It is impossible to remedy the issue of out-of-school children without investing in education that provides learning opportunities for children in conflict and emergency situations.
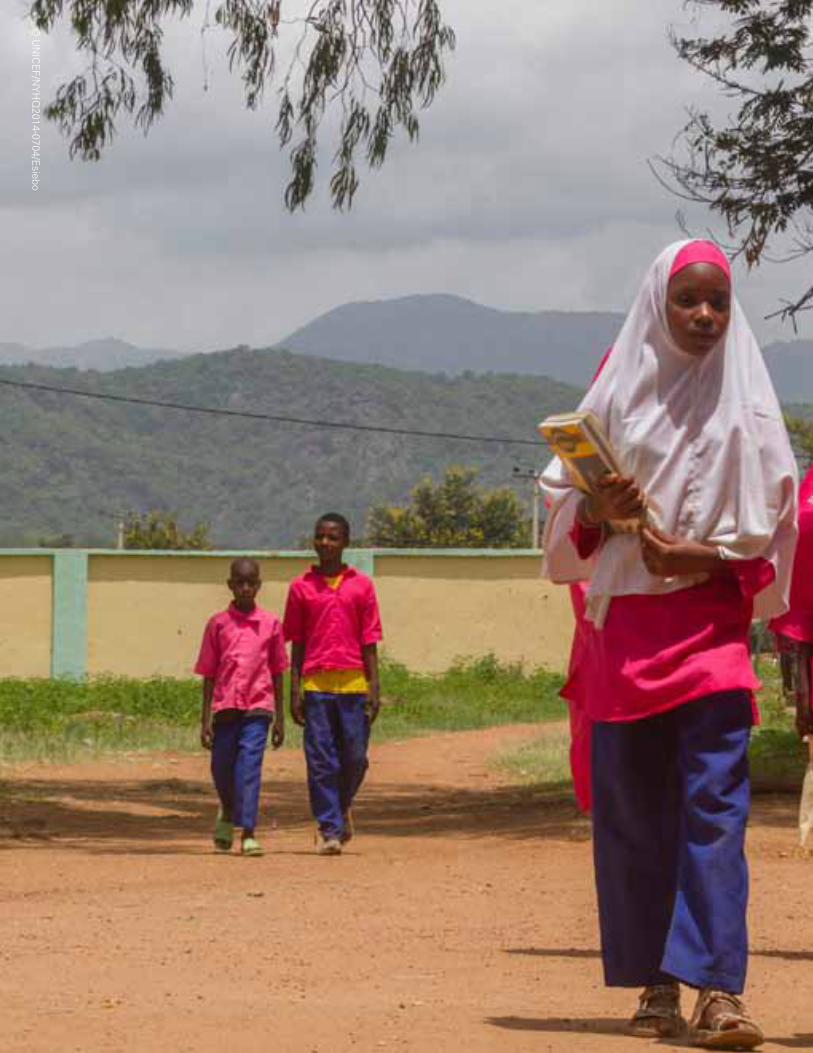
7474
© u
nIC
EF/n
yH
q2014-0704/E
siebo
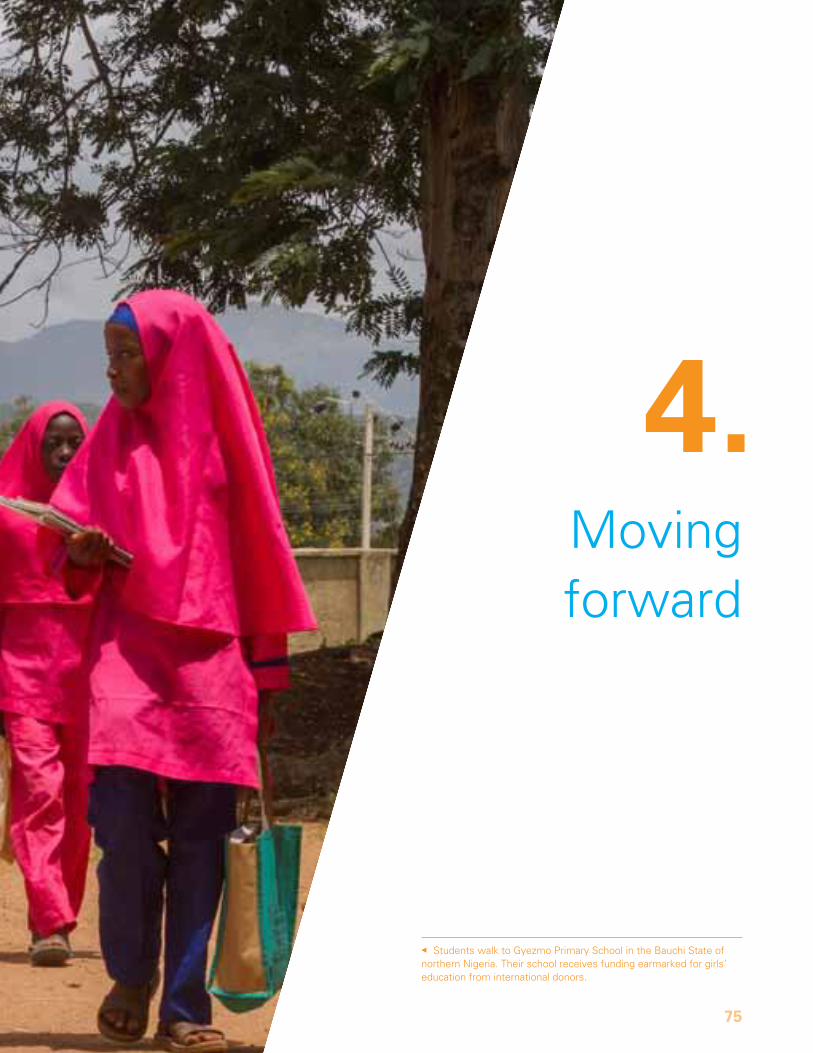
4
75
I4
students walk to Gyezmo Primary school in the Bauchi state of northern nigeria. Their school receives funding earmarked for girls’ education from international donors.
75
4. moving forward
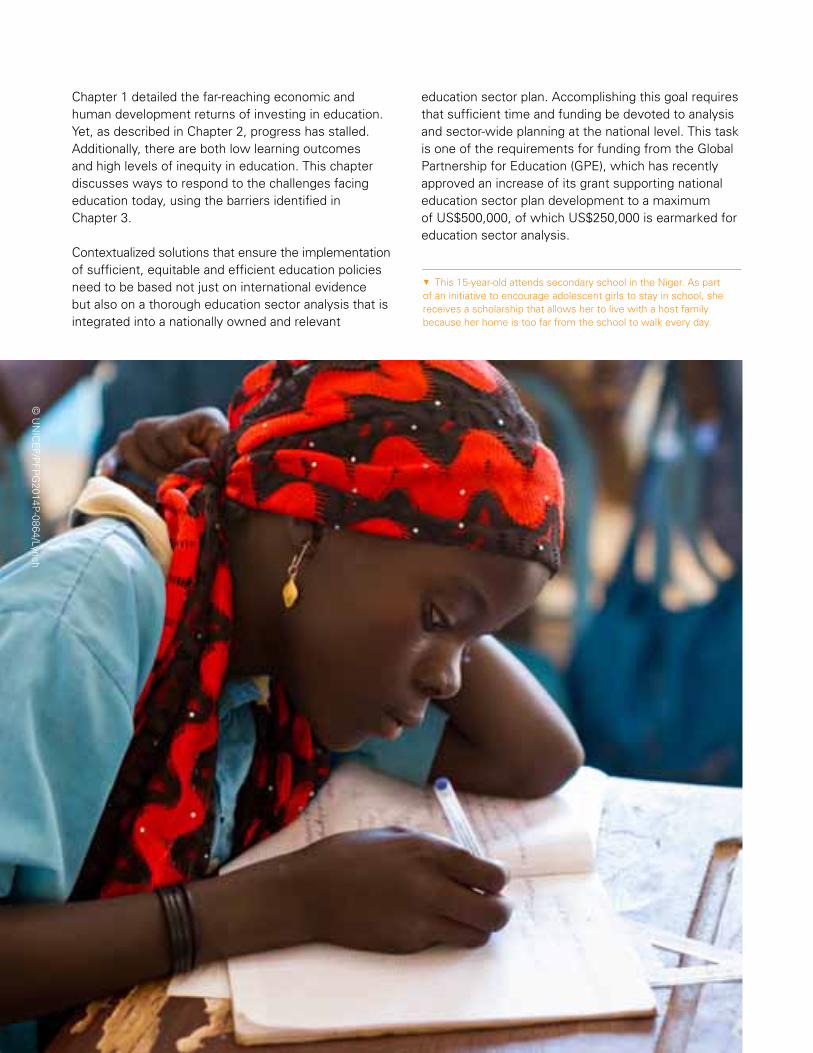
5This 15-year-old attends secondary school in the niger. as part of an initiative to encourage adolescent girls to stay in school, she receives a scholarship that allows her to live with a host family because her home is too far from the school to walk every day.
76
Chapter 1 detailed the far-reaching economic and human development returns of investing in education. yet, as described in Chapter 2, progress has stalled. additionally, there are both low learning outcomes and high levels of inequity in education. This chapter discusses ways to respond to the challenges facing education today, using the barriers identified in Chapter 3.
Contextualized solutions that ensure the implementation of sufficient, equitable and efficient education policies need to be based not just on international evidence but also on a thorough education sector analysis that is integrated into a nationally owned and relevant
education sector plan. accomplishing this goal requires that sufficient time and funding be devoted to analysis and sector-wide planning at the national level. This task is one of the requirements for funding from the Global Partnership for Education (GPE), which has recently approved an increase of its grant supporting national education sector plan development to a maximum of us$500,000, of which us$250,000 is earmarked for education sector analysis.
© u
nIC
EF/P
FPG
2014P-0864/Lynch
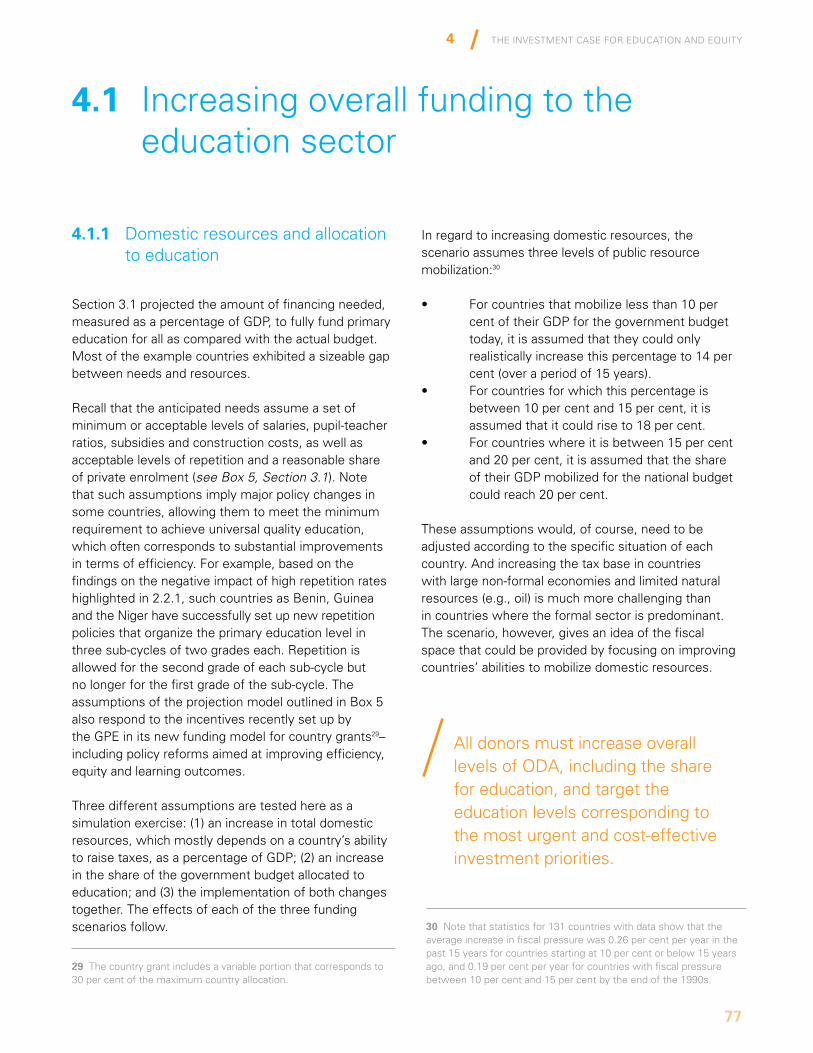
The InvesTmenT Case for eduCaTIon and equITy
77
4
4.1.1 domestic resources and allocation to education
section 3.1 projected the amount of financing needed, measured as a percentage of GdP, to fully fund primary education for all as compared with the actual budget. most of the example countries exhibited a sizeable gap between needs and resources.
recall that the anticipated needs assume a set of minimum or acceptable levels of salaries, pupil-teacher ratios, subsidies and construction costs, as well as acceptable levels of repetition and a reasonable share of private enrolment (see Box 5, Section 3.1). note that such assumptions imply major policy changes in some countries, allowing them to meet the minimum requirement to achieve universal quality education, which often corresponds to substantial improvements in terms of efficiency. For example, based on the findings on the negative impact of high repetition rates highlighted in 2.2.1, such countries as Benin, Guinea and the niger have successfully set up new repetition policies that organize the primary education level in three sub-cycles of two grades each. repetition is allowed for the second grade of each sub-cycle but no longer for the first grade of the sub-cycle. The assumptions of the projection model outlined in Box 5 also respond to the incentives recently set up by the GPE in its new funding model for country grants29– including policy reforms aimed at improving efficiency, equity and learning outcomes.
Three different assumptions are tested here as a simulation exercise: (1) an increase in total domestic resources, which mostly depends on a country’s ability to raise taxes, as a percentage of GdP; (2) an increase in the share of the government budget allocated to education; and (3) the implementation of both changes together. The effects of each of the three funding scenarios follow.
4.1 Increasing overall funding to the education sector
In regard to increasing domestic resources, the scenario assumes three levels of public resource mobilization:30
• Forcountriesthatmobilizelessthan10percent of their GdP for the government budget today, it is assumed that they could only realistically increase this percentage to 14 per cent (over a period of 15 years).
• Forcountriesforwhichthispercentageisbetween 10 per cent and 15 per cent, it is assumed that it could rise to 18 per cent.
• Forcountrieswhereitisbetween15percentand 20 per cent, it is assumed that the share of their GdP mobilized for the national budget could reach 20 per cent.
These assumptions would, of course, need to be adjusted according to the specific situation of each country. and increasing the tax base in countries with large non-formal economies and limited natural resources (e.g., oil) is much more challenging than in countries where the formal sector is predominant. The scenario, however, gives an idea of the fiscal space that could be provided by focusing on improving countries’ abilities to mobilize domestic resources.
30 note that statistics for 131 countries with data show that the average increase in fiscal pressure was 0.26 per cent per year in the past 15 years for countries starting at 10 per cent or below 15 years ago, and 0.19 per cent per year for countries with fiscal pressure between 10 per cent and 15 per cent by the end of the 1990s.
all donors must increase overall levels of oda, including the share for education, and target the education levels corresponding to the most urgent and cost-effective investment priorities.
29 The country grant includes a variable portion that corresponds to 30 per cent of the maximum country allocation.
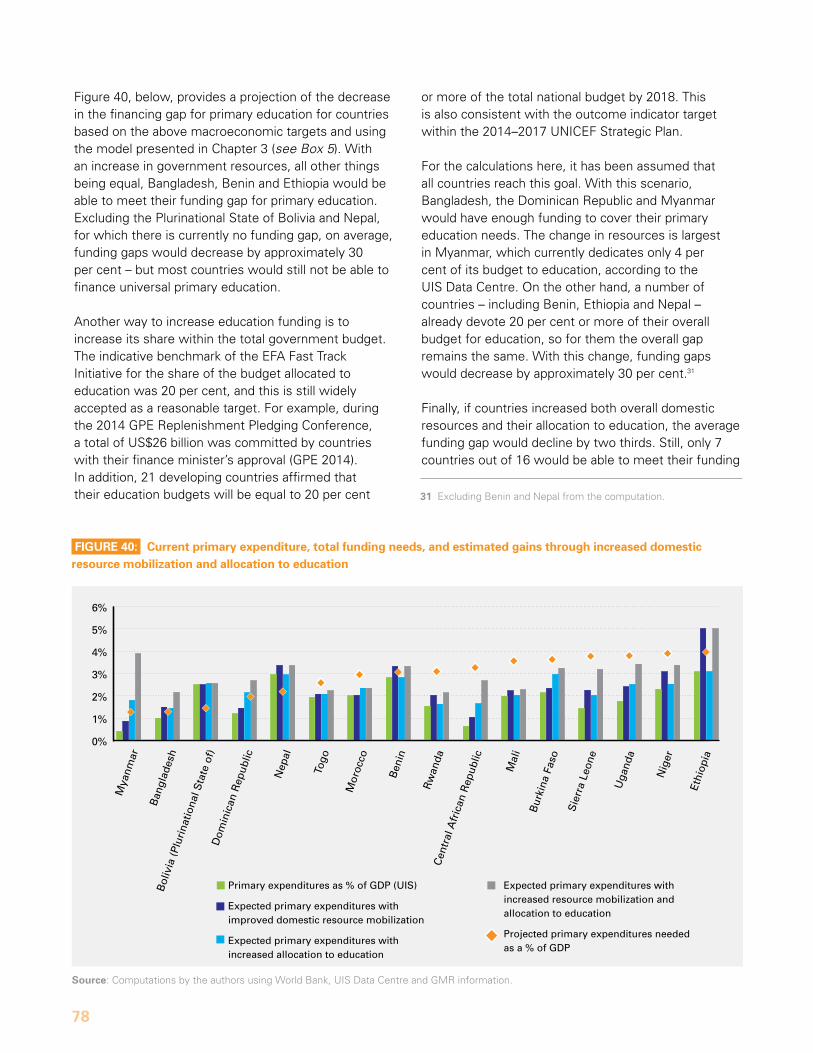
78
Figure 40, below, provides a projection of the decrease in the financing gap for primary education for countries based on the above macroeconomic targets and using the model presented in Chapter 3 (see Box 5). With an increase in government resources, all other things being equal, Bangladesh, Benin and Ethiopia would be able to meet their funding gap for primary education. Excluding the Plurinational state of Bolivia and nepal, for which there is currently no funding gap, on average, funding gaps would decrease by approximately 30 per cent – but most countries would still not be able to finance universal primary education.
another way to increase education funding is to increase its share within the total government budget. The indicative benchmark of the EFa Fast Track Initiative for the share of the budget allocated to education was 20 per cent, and this is still widely accepted as a reasonable target. For example, during the 2014 GPE replenishment Pledging Conference, a total of us$26 billion was committed by countries with their finance minister’s approval (GPE 2014). In addition, 21 developing countries affirmed that their education budgets will be equal to 20 per cent
Source: Computations by the authors using World Bank, uIs data Centre and Gmr information.
FiGuRE 40: current primary expenditure, total funding needs, and estimated gains through increased domestic resource mobilization and allocation to education
0%
1%
2%
3%
4%
5%
6%
Mya
nmar
Ban
glad
esh
Bol
ivia
(Plu
rina
tiona
l Sta
te o
f)D
omin
ican
Rep
ublic
Nep
al
Togo
Mor
occo
Ben
in
Rw
anda
Cen
tral
Afr
ican
Rep
ublic
Mal
i
Bur
kina
Fas
o
Sie
rra
Leon
e
Uga
nda
Nig
er
Ethi
opia
Primary expenditures as % of GDP (UIS)
Expected primary expenditures with improved domestic resource mobilization
Expected primary expenditures with increased allocation to education
Expected primary expenditures with increased resource mobilization and allocation to education
Projected primary expenditures needed as a % of GDP
or more of the total national budget by 2018. This is also consistent with the outcome indicator target within the 2014–2017 unICEF strategic Plan.
For the calculations here, it has been assumed that all countries reach this goal. With this scenario, Bangladesh, the dominican republic and myanmar would have enough funding to cover their primary education needs. The change in resources is largest in myanmar, which currently dedicates only 4 per cent of its budget to education, according to the uIs data Centre. on the other hand, a number of countries – including Benin, Ethiopia and nepal – already devote 20 per cent or more of their overall budget for education, so for them the overall gap remains the same. With this change, funding gaps would decrease by approximately 30 per cent.31
Finally, if countries increased both overall domestic resources and their allocation to education, the average funding gap would decline by two thirds. still, only 7 countries out of 16 would be able to meet their funding
31 Excluding Benin and nepal from the computation.
The InvesTmenT Case for eduCaTIon and equITy
79
4
needs for primary education, which is nonetheless an increase from the current situation in which only the Plurinational state of Bolivia and nepal do not have a funding gap.
4.1.2 External aid to basic education
after increasing from 2002 to 2009–2010, external aid to education, and within that aid to basic education, has declined. If the current trend in foreign aid to education continues, it will be us$3.3 billion lower in 2017, or a cumulative loss of us$9.8 billion in five years. aid to basic education would decline by us$2.8 billion by 2017, half of it related to the current trend of declining prioritization of basic education. The cumulative loss over five years would be us$8.3 billion for basic education. such a drop would have sweeping consequences for countries’ abilities to achieve education for all goals. all donors must increase overall levels of oda, including the share for education, and target the education levels corresponding to the most urgent and cost-effective investment priorities.
Mobilization of non-traditional donors
If external donors maintain their current levels of aid to education or do not place enough of a priority on basic education, donor aid will not be sufficient to bridge the funding gap. neither can increased domestic resources, as proposed in the section above, bridge the funding gaps in many countries.
In this context, mobilizing non-traditional donors, in particular from the private sector (internationally and domestically), may be required for the achievement of the Education for all goals including for the most vulnerable and marginalized. The average profits of the five most profitable firms on the may 2014 Forbes Global 2000 list were equal to us$251 billion. Five per cent of these profits is equal to us$12.6 billion, approximately the amount of annual oda provided for education by traditional donors and more than twice the level of annual oda to basic education.
In comparison, the estimated financing gap for basic education worldwide is us$26 billion annually. Therefore, 5 per cent of the profits from each of the five highest-earning public companies would bridge almost half of the external funding gap, and 5 per cent of the profits of the 15 most profitable firms would close the entire gap.
as a result, in addition to an increase in aid by traditional donors, it is critical to harness the potential ability of non-traditional donors to contribute to progress in education.
4.1.3 support to education in humanitarian contexts
Half of the current out-of-school children live in fragile and conflict-affected countries. Therefore, it is also essential that donors increase the share of education within global humanitarian aid, as it currently stands below 2 per cent.32 Providing education during conflict is not only desirable but also realistic. The united nations relief and Works agency for Palestine refugees in the near East (unrWa), for example, has been providing support to Palestinian refugees for the past 65 years. It has achieved higher academic results in its schools, alongside gender equality, than in host government education institutions – despite protracted displacement and regular conflict outbreaks (World Bank 2015). To accomplish this, unrWa allocates more than half of its budget to education (unrWa 2014).
While lifesaving interventions are crucial, people who make it through the conflict or emergency need what education can give them: the ability to live with dignity. additionally, there is growing evidence that education programmes in conflict-affected areas can mitigate the factors that cause conflict and perhaps prevent future conflicts.
The GPE advocates for humanitarian education funding, and, more broadly, a range of non-governmental organizations, united nations agencies and other key actors have come together under the banner of ‘Education Cannot Wait’ – calling for a 4 per cent increase in overall humanitarian aid for education. unICEF is even more ambitious and has called for a 10 per cent education target in humanitarian responses in its 2014–2017 strategic Plan.33
32 Financial Tracking service, united nations office for the Coor-dination of Humanitarian affairs, http://fts.unocha.org/pageloader.aspx?page=emerg-globaloverview&year=2014, considering only funding for which the sector to which it is allotted has been specified.33 This value was determined based on internal consultations and is now part of unICEF’s strategic Plan results framework approved by the Executive Board.
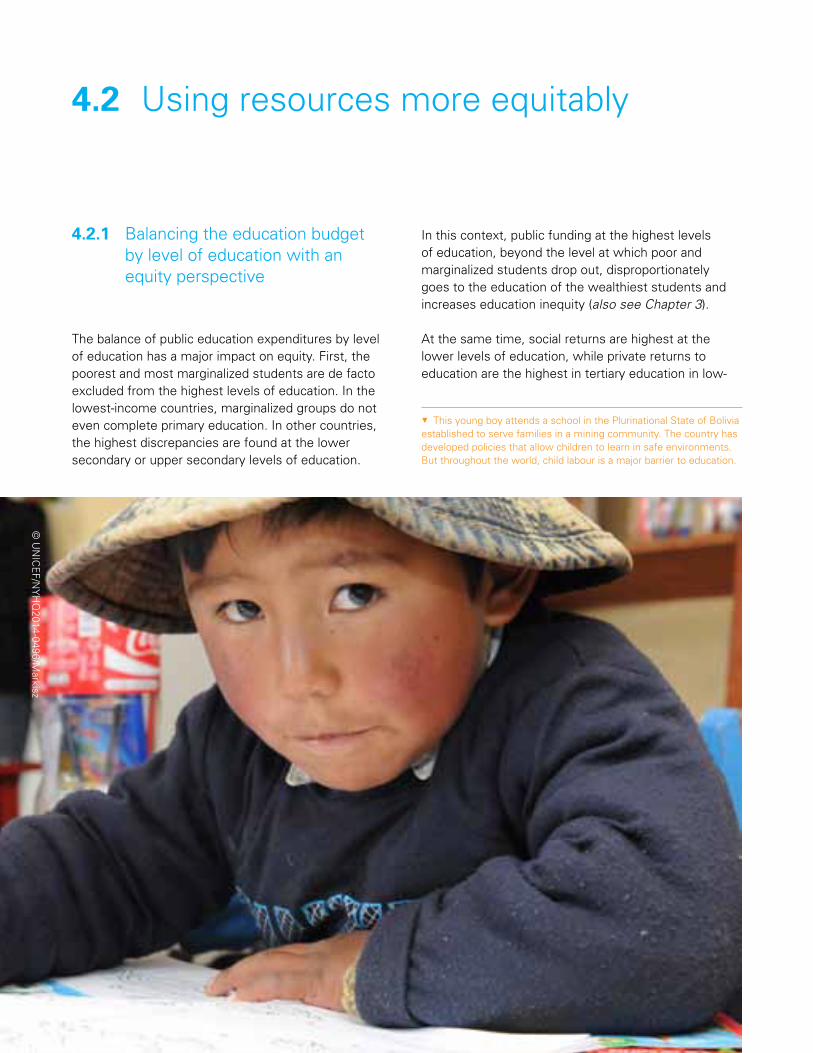
80
4.2.1 Balancing the education budget by level of education with an equity perspective
The balance of public education expenditures by level of education has a major impact on equity. First, the poorest and most marginalized students are de facto excluded from the highest levels of education. In the lowest-income countries, marginalized groups do not even complete primary education. In other countries, the highest discrepancies are found at the lower secondary or upper secondary levels of education.
4.2 using resources more equitably
In this context, public funding at the highest levels of education, beyond the level at which poor and marginalized students drop out, disproportionately goes to the education of the wealthiest students and increases education inequity (also see Chapter 3).
at the same time, social returns are highest at the lower levels of education, while private returns to education are the highest in tertiary education in low-
5This young boy attends a school in the Plurinational state of Bolivia established to serve families in a mining community. The country has developed policies that allow children to learn in safe environments. But throughout the world, child labour is a major barrier to education.
© u
nIC
EF/n
yH
q2014-0496/m
arkisz
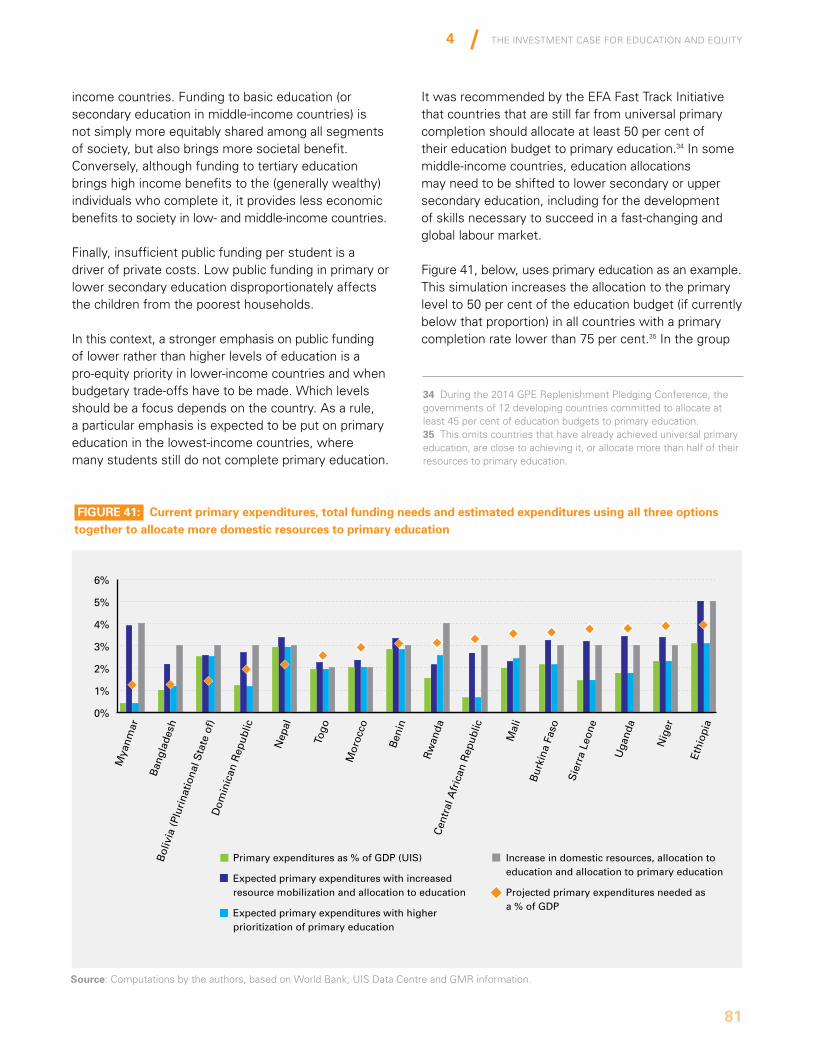
The InvesTmenT Case for eduCaTIon and equITy
81
4
income countries. Funding to basic education (or secondary education in middle-income countries) is not simply more equitably shared among all segments of society, but also brings more societal benefit. Conversely, although funding to tertiary education brings high income benefits to the (generally wealthy) individuals who complete it, it provides less economic benefits to society in low- and middle-income countries.
Finally, insufficient public funding per student is a driver of private costs. Low public funding in primary or lower secondary education disproportionately affects the children from the poorest households.
In this context, a stronger emphasis on public funding of lower rather than higher levels of education is a pro-equity priority in lower-income countries and when budgetary trade-offs have to be made. Which levels should be a focus depends on the country. as a rule, a particular emphasis is expected to be put on primary education in the lowest-income countries, where many students still do not complete primary education.
It was recommended by the EFa Fast Track Initiative that countries that are still far from universal primary completion should allocate at least 50 per cent of their education budget to primary education.34 In some middle-income countries, education allocations may need to be shifted to lower secondary or upper secondary education, including for the development of skills necessary to succeed in a fast-changing and global labour market.
Figure 41, below, uses primary education as an example. This simulation increases the allocation to the primary level to 50 per cent of the education budget (if currently below that proportion) in all countries with a primary completion rate lower than 75 per cent.35 In the group
34 during the 2014 GPE replenishment Pledging Conference, the governments of 12 developing countries committed to allocate at least 45 per cent of education budgets to primary education.35 This omits countries that have already achieved universal primary education, are close to achieving it, or allocate more than half of their resources to primary education.
Source: Computations by the authors, based on World Bank, uIs data Centre and Gmr information.
FiGuRE 41: current primary expenditures, total funding needs and estimated expenditures using all three options together to allocate more domestic resources to primary education
Primary expenditures as % of GDP (UIS)
Expected primary expenditures with increased resource mobilization and allocation to education
Expected primary expenditures with higher prioritization of primary education
Increase in domestic resources, allocation to education and allocation to primary education
Projected primary expenditures needed as a % of GDP
0%
1%
2%
3%
4%
5%
6%
Mya
nmar
Ban
glad
esh
Bol
ivia
(Plu
rina
tiona
l Sta
te o
f)
Dom
inic
an R
epub
lic
Nep
al
Togo
Mor
occo
Ben
in
Rw
anda
Cen
tral
Afr
ican
Rep
ublic
Mal
i
Bur
kina
Fas
o
Sie
rra
Leon
e
Uga
nda
Nig
er
Ethi
opia
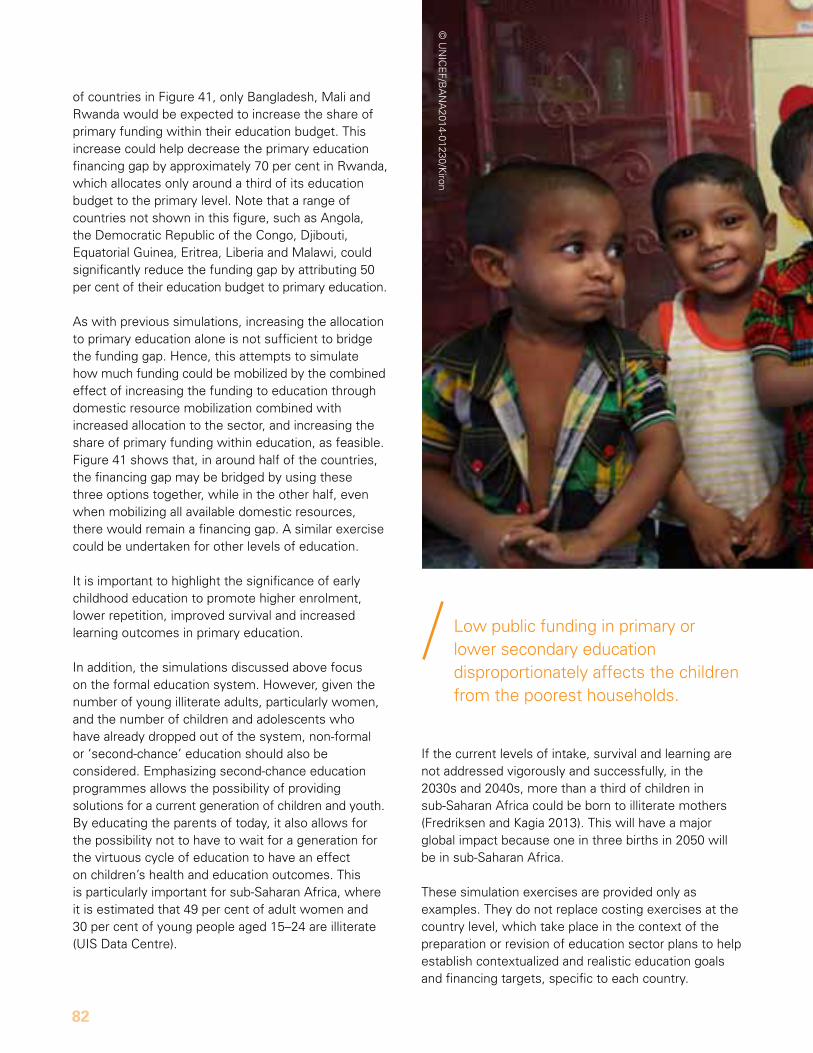
82
Low public funding in primary or lower secondary education disproportionately affects the children from the poorest households.
of countries in Figure 41, only Bangladesh, mali and rwanda would be expected to increase the share of primary funding within their education budget. This increase could help decrease the primary education financing gap by approximately 70 per cent in rwanda, which allocates only around a third of its education budget to the primary level. note that a range of countries not shown in this figure, such as angola, the democratic republic of the Congo, djibouti, Equatorial Guinea, Eritrea, Liberia and malawi, could significantly reduce the funding gap by attributing 50 per cent of their education budget to primary education.
as with previous simulations, increasing the allocation to primary education alone is not sufficient to bridge the funding gap. Hence, this attempts to simulate how much funding could be mobilized by the combined effect of increasing the funding to education through domestic resource mobilization combined with increased allocation to the sector, and increasing the share of primary funding within education, as feasible. Figure 41 shows that, in around half of the countries, the financing gap may be bridged by using these three options together, while in the other half, even when mobilizing all available domestic resources, there would remain a financing gap. a similar exercise could be undertaken for other levels of education.
It is important to highlight the significance of early childhood education to promote higher enrolment, lower repetition, improved survival and increased learning outcomes in primary education.
In addition, the simulations discussed above focus on the formal education system. However, given the number of young illiterate adults, particularly women, and the number of children and adolescents who have already dropped out of the system, non-formal or ‘second-chance’ education should also be considered. Emphasizing second-chance education programmes allows the possibility of providing solutions for a current generation of children and youth. By educating the parents of today, it also allows for the possibility not to have to wait for a generation for the virtuous cycle of education to have an effect on children’s health and education outcomes. This is particularly important for sub-saharan africa, where it is estimated that 49 per cent of adult women and 30 per cent of young people aged 15–24 are illiterate (uIs data Centre).
If the current levels of intake, survival and learning are not addressed vigorously and successfully, in the 2030s and 2040s, more than a third of children in sub-saharan africa could be born to illiterate mothers (Fredriksen and Kagia 2013). This will have a major global impact because one in three births in 2050 will be in sub-saharan africa.
These simulation exercises are provided only as examples. They do not replace costing exercises at the country level, which take place in the context of the preparation or revision of education sector plans to help establish contextualized and realistic education goals and financing targets, specific to each country.
© u
nIC
EF/B
an
a2014-01230/K
iron
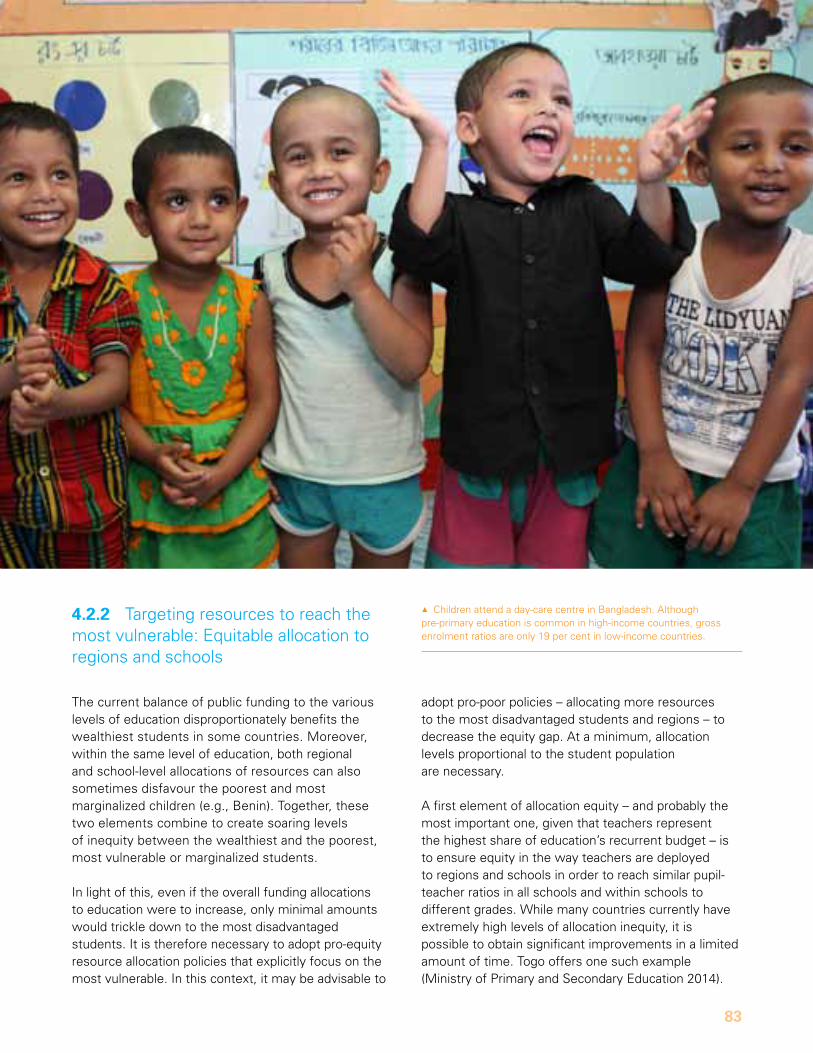
The InvesTmenT Case for eduCaTIon and equITy
83
4
4.2.2 Targeting resources to reach the most vulnerable: Equitable allocation to regions and schools
The current balance of public funding to the various levels of education disproportionately benefits the wealthiest students in some countries. moreover, within the same level of education, both regional and school-level allocations of resources can also sometimes disfavour the poorest and most marginalized children (e.g., Benin). Together, these two elements combine to create soaring levels of inequity between the wealthiest and the poorest, most vulnerable or marginalized students.
In light of this, even if the overall funding allocations to education were to increase, only minimal amounts would trickle down to the most disadvantaged students. It is therefore necessary to adopt pro-equity resource allocation policies that explicitly focus on the most vulnerable. In this context, it may be advisable to
adopt pro-poor policies – allocating more resources to the most disadvantaged students and regions – to decrease the equity gap. at a minimum, allocation levels proportional to the student population are necessary.
a first element of allocation equity – and probably the most important one, given that teachers represent the highest share of education’s recurrent budget – is to ensure equity in the way teachers are deployed to regions and schools in order to reach similar pupil-teacher ratios in all schools and within schools to different grades. While many countries currently have extremely high levels of allocation inequity, it is possible to obtain significant improvements in a limited amount of time. Togo offers one such example (ministry of Primary and secondary Education 2014).
1Children attend a day-care centre in Bangladesh. although pre-primary education is common in high-income countries, gross enrolment ratios are only 19 per cent in low-income countries.
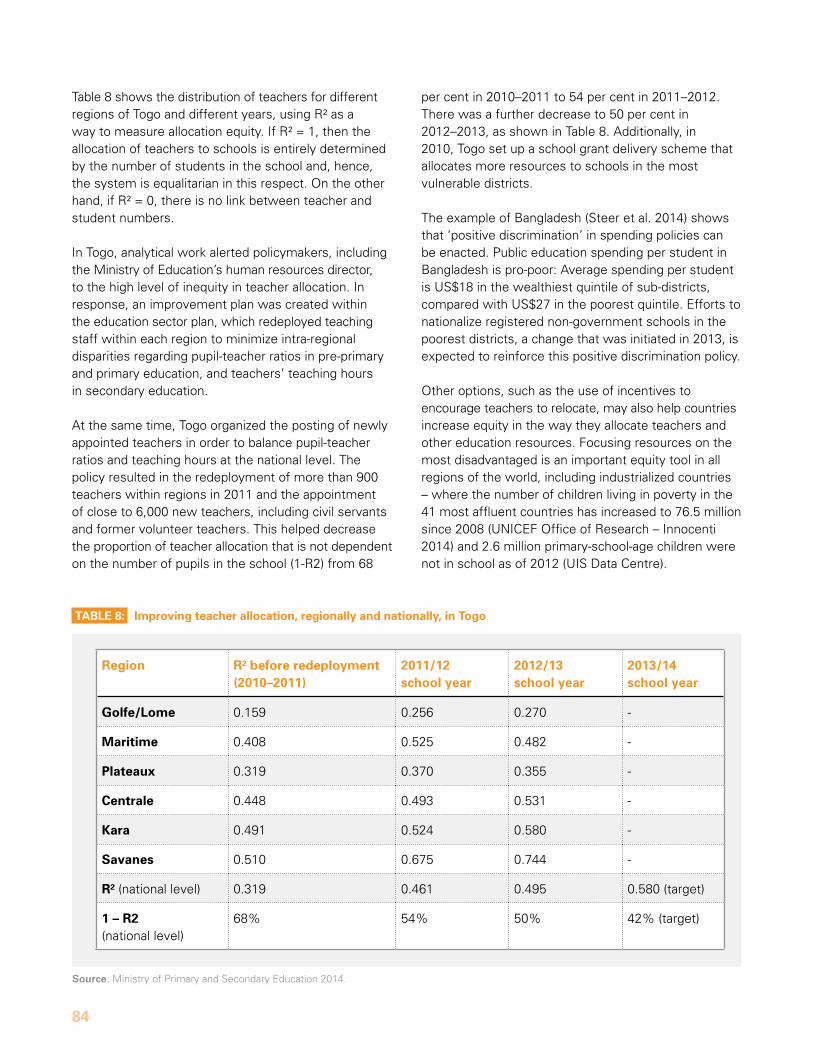
84
Table 8 shows the distribution of teachers for different regions of Togo and different years, using r² as a way to measure allocation equity. If r² = 1, then the allocation of teachers to schools is entirely determined by the number of students in the school and, hence, the system is equalitarian in this respect. on the other hand, if r² = 0, there is no link between teacher and student numbers.
In Togo, analytical work alerted policymakers, including the ministry of Education’s human resources director, to the high level of inequity in teacher allocation. In response, an improvement plan was created within the education sector plan, which redeployed teaching staff within each region to minimize intra-regional disparities regarding pupil-teacher ratios in pre-primary and primary education, and teachers’ teaching hours in secondary education.
at the same time, Togo organized the posting of newly appointed teachers in order to balance pupil-teacher ratios and teaching hours at the national level. The policy resulted in the redeployment of more than 900 teachers within regions in 2011 and the appointment of close to 6,000 new teachers, including civil servants and former volunteer teachers. This helped decrease the proportion of teacher allocation that is not dependent on the number of pupils in the school (1-r2) from 68
Source: ministry of Primary and secondary Education 2014.
taBlE 8: improving teacher allocation, regionally and nationally, in togo
Region R² before redeployment (2010–2011)
2011/12 school year
2012/13 school year
2013/14 school year
Golfe/lome 0.159 0.256 0.270 -
Maritime 0.408 0.525 0.482 -
Plateaux 0.319 0.370 0.355 -
centrale 0.448 0.493 0.531 -
Kara 0.491 0.524 0.580 -
Savanes 0.510 0.675 0.744 -
R² (national level) 0.319 0.461 0.495 0.580 (target)
1 – R2 (national level)
68% 54% 50% 42% (target)
per cent in 2010–2011 to 54 per cent in 2011–2012. There was a further decrease to 50 per cent in 2012–2013, as shown in Table 8. additionally, in 2010, Togo set up a school grant delivery scheme that allocates more resources to schools in the most vulnerable districts.
The example of Bangladesh (steer et al. 2014) shows that ‘positive discrimination’ in spending policies can be enacted. Public education spending per student in Bangladesh is pro-poor: average spending per student is us$18 in the wealthiest quintile of sub-districts, compared with us$27 in the poorest quintile. Efforts to nationalize registered non-government schools in the poorest districts, a change that was initiated in 2013, is expected to reinforce this positive discrimination policy.
other options, such as the use of incentives to encourage teachers to relocate, may also help countries increase equity in the way they allocate teachers and other education resources. Focusing resources on the most disadvantaged is an important equity tool in all regions of the world, including industrialized countries – where the number of children living in poverty in the 41 most affluent countries has increased to 76.5 million since 2008 (unICEF office of research – Innocenti 2014) and 2.6 million primary-school-age children were not in school as of 2012 (uIs data Centre).
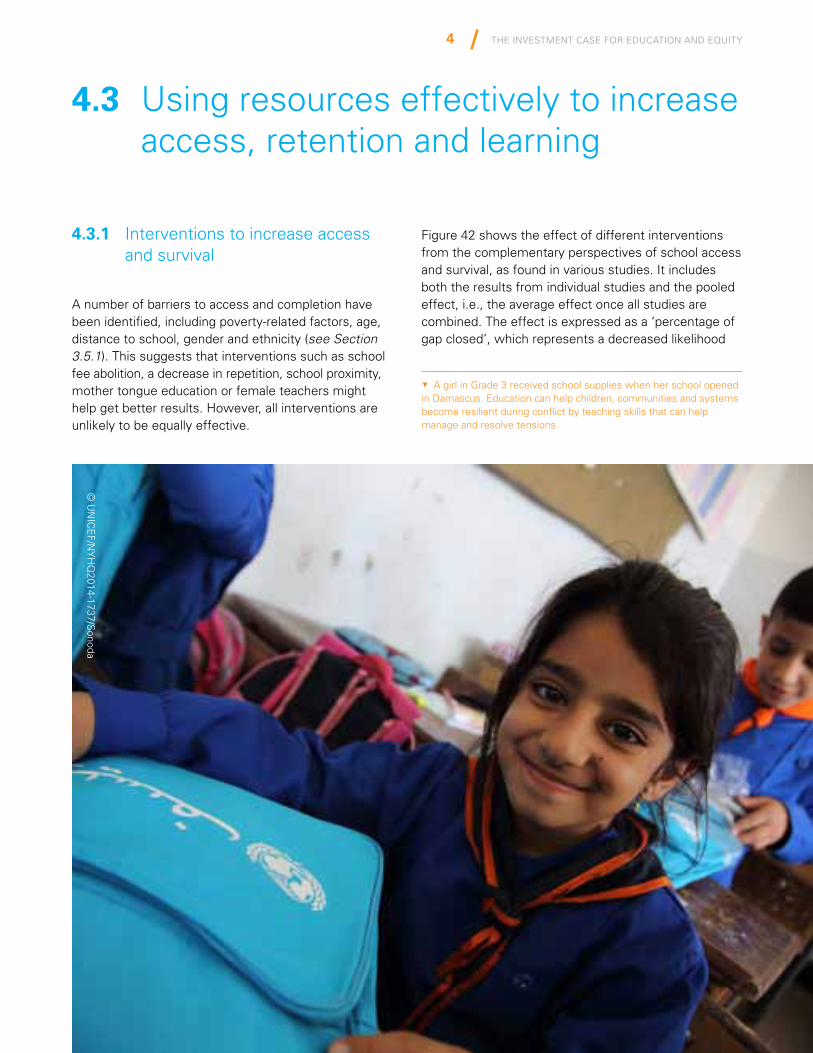
5a girl in Grade 3 received school supplies when her school opened in damascus. Education can help children, communities and systems become resilient during conflict by teaching skills that can help manage and resolve tensions.
The InvesTmenT Case for eduCaTIon and equITy
85
4
4.3.1 Interventions to increase access and survival
a number of barriers to access and completion have been identified, including poverty-related factors, age, distance to school, gender and ethnicity (see Section 3.5.1). This suggests that interventions such as school fee abolition, a decrease in repetition, school proximity, mother tongue education or female teachers might help get better results. However, all interventions are unlikely to be equally effective.
4.3 using resources effectively to increase access, retention and learning
Figure 42 shows the effect of different interventions from the complementary perspectives of school access and survival, as found in various studies. It includes both the results from individual studies and the pooled effect, i.e., the average effect once all studies are combined. The effect is expressed as a ‘percentage of gap closed’, which represents a decreased likelihood
© u
nIC
EF/n
yH
q2014-1737/s
onoda
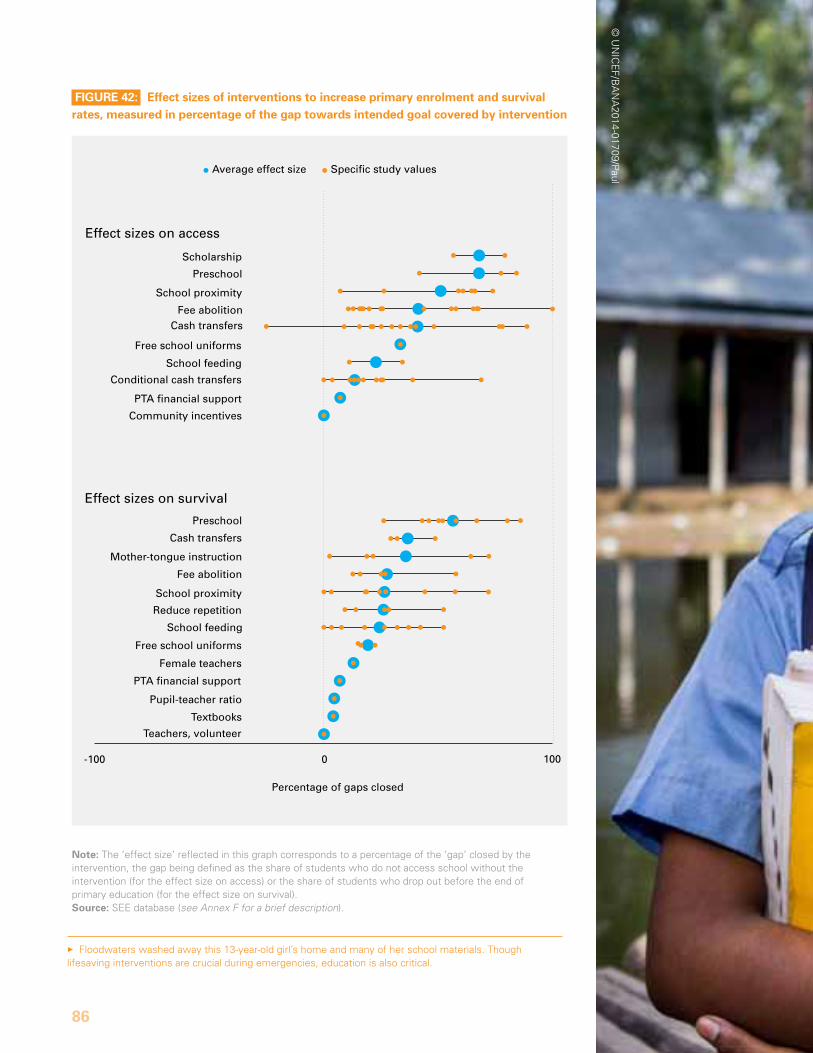
3Floodwaters washed away this 13-year-old girl’s home and many of her school materials. Though lifesaving interventions are crucial during emergencies, education is also critical.
86
note: The ‘effect size’ reflected in this graph corresponds to a percentage of the ‘gap’ closed by the intervention, the gap being defined as the share of students who do not access school without the intervention (for the effect size on access) or the share of students who drop out before the end of primary education (for the effect size on survival).Source: sEE database (see Annex F for a brief description).
FiGuRE 42: Effect sizes of interventions to increase primary enrolment and survival rates, measured in percentage of the gap towards intended goal covered by intervention
Scholarship
Preschool
School proximity
Fee abolition
Preschool
Cash transfers
Mother-tongue instruction
Fee abolition
School proximity
Reduce repetition
School feeding
Free school uniforms
Female teachers
PTA financial support
Pupil-teacher ratio
Textbooks
Teachers, volunteer
Cash transfers
Free school uniforms
School feeding
Conditional cash transfers
PTA financial support
Community incentives
-100 0 100
Average effect size Specific study values
Percentage of gaps closed
Effect sizes on access
Effect sizes on survival
Data from: Simulations for equity in education (SEE) database (see Annex 7.6 for a brief description)
© u
nIC
EF/B
an
a2014-01709/P
aul
The InvesTmenT Case for eduCaTIon and equITy
87
4
of being out of school for the target group of the intervention. For school proximity, for example, the average impact of building a school nearby (for a child for whom school distance is an issue) is a decrease in the gap of 51 per cent. This means that building a school nearby, usually within a 30-minute walk, decreases the likelihood that this child will be out of school by approximately half.
Two points are noteworthy. First, the impact of an intervention is expressed as a percentage of the gap closed for a target population. This means that the same intervention may have different levels of influence in different contexts: If the education gap is large, the impact of the intervention will be greater. This dynamic can even cause the relative effectiveness of interventions to shift from one context to another. For example, there is a large ‘gap’ related to difficulties with paying for school fees in a country, but school distance is not a problem. In this context, fee abolition may be a more effective intervention than building more schools closer to students, even though the Figure 42 shows that, on average, school proximity closes a larger proportion of the gap than fee abolition.
second, the graph shows that, in different contexts or applied in a different manner, the impact of the same intervention may vary widely. For example, cash transfers have had a large variety of consequences in different studies – in all likelihood because this is a broad category, covering qualitatively very different interventions. Both observations call for deliberate consideration of the context of the interventions to determine the effectiveness in a specific country or region or for particular population groups.
The figure suggests that scholarships, preschool, school proximity, fee abolition, cash transfers and mother tongue instruction are among the most effective interventions to increase access and survival. arnold et al. (2006) suggest that preschool changes children’s and parents’ attitudes and motivation, making children more ready to go to school and making parents perceive and support them as learners. Children who have gone to preschool have a 74 per cent lower chance of not being enrolled in school. Fee abolition decreases the likelihood that a child will drop out by 41 per cent. Finally, on average, the drop-out rates of children who receive instruction in their mother tongue are 36 per cent lower than children who do not.
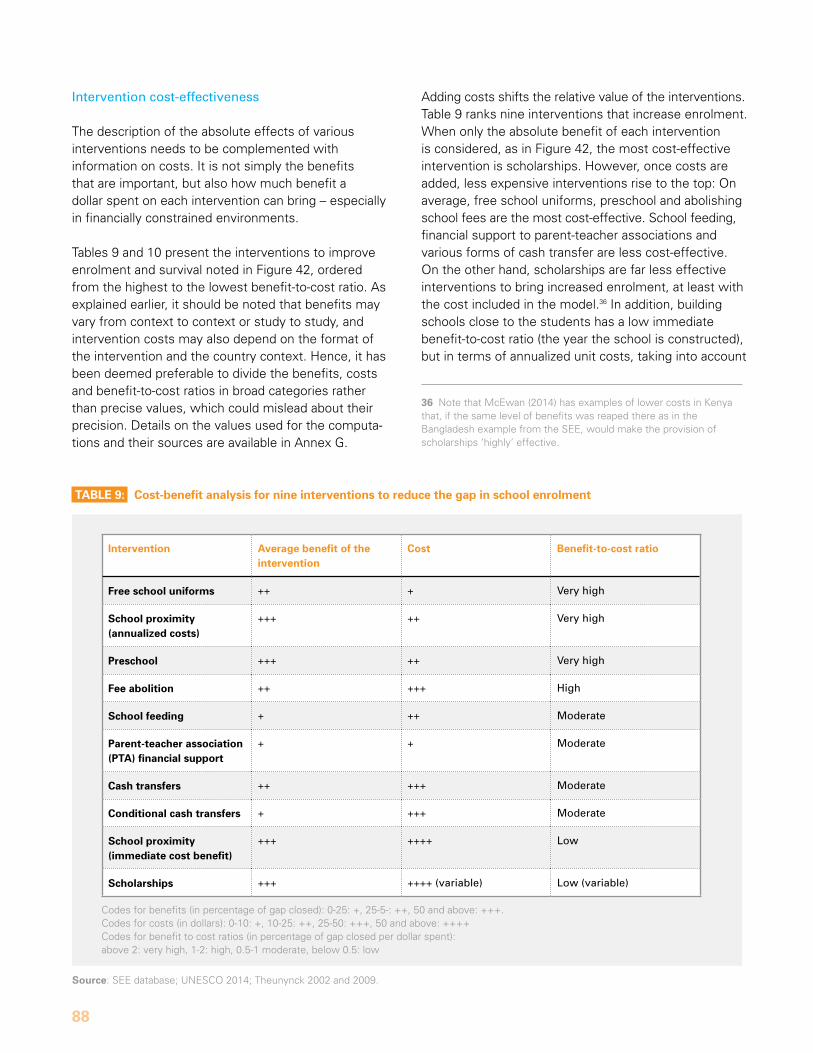
88
Intervention cost-effectiveness
The description of the absolute effects of various interventions needs to be complemented with information on costs. It is not simply the benefits that are important, but also how much benefit a dollar spent on each intervention can bring – especially in financially constrained environments.
Tables 9 and 10 present the interventions to improve enrolment and survival noted in Figure 42, ordered from the highest to the lowest benefit-to-cost ratio. as explained earlier, it should be noted that benefits may vary from context to context or study to study, and intervention costs may also depend on the format of the intervention and the country context. Hence, it has been deemed preferable to divide the benefits, costs and benefit-to-cost ratios in broad categories rather than precise values, which could mislead about their precision. details on the values used for the computa-tions and their sources are available in annex G.
adding costs shifts the relative value of the interventions. Table 9 ranks nine interventions that increase enrolment. When only the absolute benefit of each intervention is considered, as in Figure 42, the most cost-effective intervention is scholarships. However, once costs are added, less expensive interventions rise to the top: on average, free school uniforms, preschool and abolishing school fees are the most cost-effective. school feeding, financial support to parent-teacher associations and various forms of cash transfer are less cost-effective. on the other hand, scholarships are far less effective interventions to bring increased enrolment, at least with the cost included in the model.36 In addition, building schools close to the students has a low immediate benefit-to-cost ratio (the year the school is constructed), but in terms of annualized unit costs, taking into account
Source: sEE database; unEsCo 2014; Theunynck 2002 and 2009.
Codes for benefits (in percentage of gap closed): 0-25: +, 25-5-: ++, 50 and above: +++. Codes for costs (in dollars): 0-10: +, 10-25: ++, 25-50: +++, 50 and above: ++++Codes for benefit to cost ratios (in percentage of gap closed per dollar spent): above 2: very high, 1-2: high, 0.5-1 moderate, below 0.5: low
taBlE 9: cost-benefit analysis for nine interventions to reduce the gap in school enrolment
intervention average benefit of the intervention
cost Benefit-to-cost ratio
Free school uniforms ++ + Very high
School proximity (annualized costs)
+++ ++ Very high
Preschool +++ ++ Very high
Fee abolition ++ +++ High
School feeding + ++ Moderate
Parent-teacher association (Pta) financial support
+ + Moderate
cash transfers ++ +++ Moderate
conditional cash transfers + +++ Moderate
School proximity (immediate cost benefit)
+++ ++++ Low
Scholarships +++ ++++ (variable) Low (variable)
36 note that mcEwan (2014) has examples of lower costs in Kenya that, if the same level of benefits was reaped there as in the Bangladesh example from the sEE, would make the provision of scholarships ‘highly’ effective.
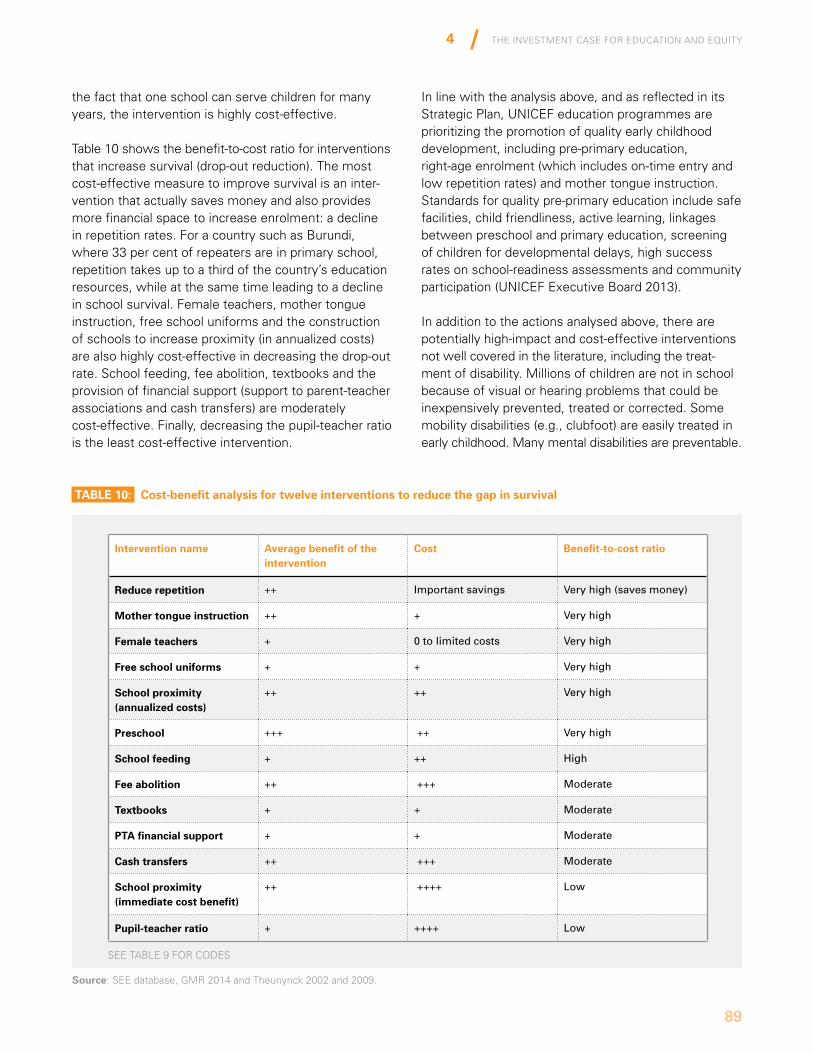
The InvesTmenT Case for eduCaTIon and equITy
89
4
Source: sEE database, Gmr 2014 and Theunynck 2002 and 2009.
sEE TaBLE 9 For CodEs
taBlE 10: cost-benefit analysis for twelve interventions to reduce the gap in survival
intervention name average benefit of the intervention
cost Benefit-to-cost ratio
Reduce repetition ++ Important savings Very high (saves money)
Mother tongue instruction ++ + Very high
Female teachers + 0 to limited costs Very high
Free school uniforms + + Very high
School proximity (annualized costs)
++ ++ Very high
Preschool +++ ++ Very high
School feeding + ++ High
Fee abolition ++ +++ Moderate
textbooks + + Moderate
Pta financial support + + Moderate
cash transfers ++ +++ Moderate
School proximity (immediate cost benefit)
++ ++++ Low
Pupil-teacher ratio + ++++ Low
the fact that one school can serve children for many years, the intervention is highly cost-effective.
Table 10 shows the benefit-to-cost ratio for interventions that increase survival (drop-out reduction). The most cost-effective measure to improve survival is an inter-vention that actually saves money and also provides more financial space to increase enrolment: a decline in repetition rates. For a country such as Burundi, where 33 per cent of repeaters are in primary school, repetition takes up to a third of the country’s education resources, while at the same time leading to a decline in school survival. Female teachers, mother tongue instruction, free school uniforms and the construction of schools to increase proximity (in annualized costs) are also highly cost-effective in decreasing the drop-out rate. school feeding, fee abolition, textbooks and the provision of financial support (support to parent-teacher associations and cash transfers) are moderately cost-effective. Finally, decreasing the pupil-teacher ratio is the least cost-effective intervention.
In line with the analysis above, and as reflected in its strategic Plan, unICEF education programmes are prioritizing the promotion of quality early childhood development, including pre-primary education, right-age enrolment (which includes on-time entry and low repetition rates) and mother tongue instruction. standards for quality pre-primary education include safe facilities, child friendliness, active learning, linkages between preschool and primary education, screening of children for developmental delays, high success rates on school-readiness assessments and community participation (unICEF Executive Board 2013).
In addition to the actions analysed above, there are potentially high-impact and cost-effective interventions not well covered in the literature, including the treat-ment of disability. millions of children are not in school because of visual or hearing problems that could be inexpensively prevented, treated or corrected. some mobility disabilities (e.g., clubfoot) are easily treated in early childhood. many mental disabilities are preventable.
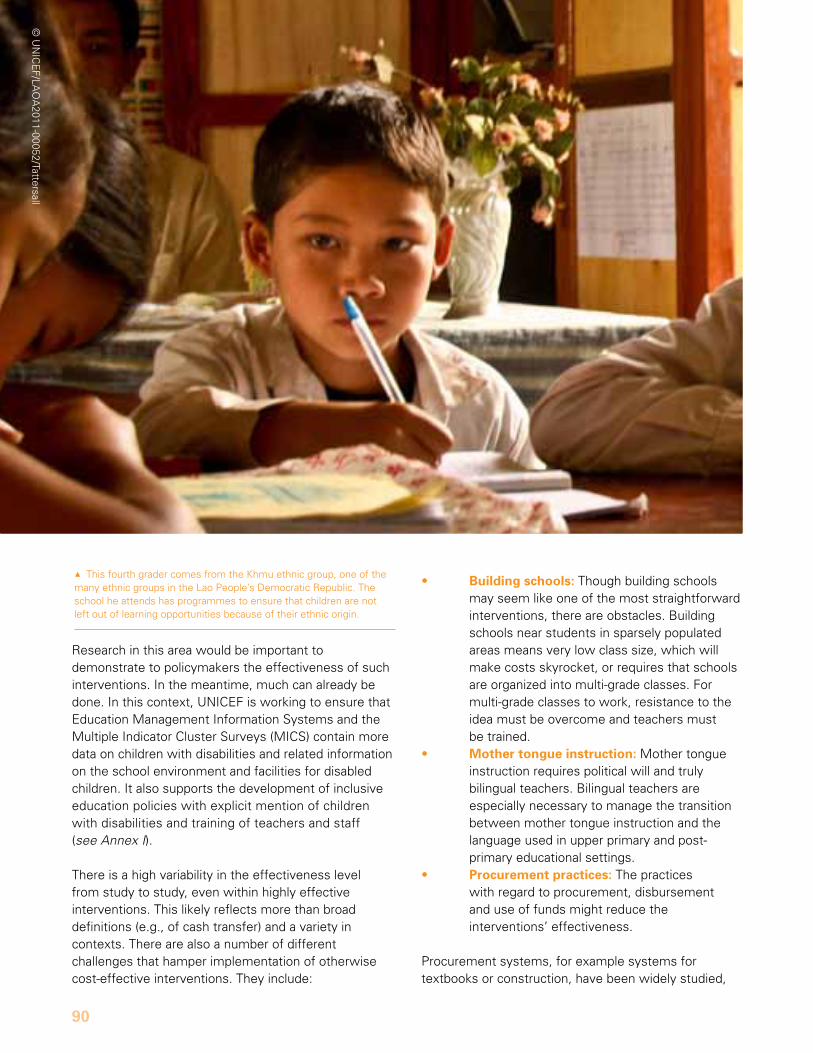
90
research in this area would be important to demonstrate to policymakers the effectiveness of such interventions. In the meantime, much can already be done. In this context, unICEF is working to ensure that Education management Information systems and the multiple Indicator Cluster surveys (mICs) contain more data on children with disabilities and related information on the school environment and facilities for disabled children. It also supports the development of inclusive education policies with explicit mention of children with disabilities and training of teachers and staff (see Annex I).
There is a high variability in the effectiveness level from study to study, even within highly effective interventions. This likely reflects more than broad definitions (e.g., of cash transfer) and a variety in contexts. There are also a number of different challenges that hamper implementation of otherwise cost-effective interventions. They include:
• Building schools: Though building schools may seem like one of the most straightforward interventions, there are obstacles. Building schools near students in sparsely populated areas means very low class size, which will make costs skyrocket, or requires that schools are organized into multi-grade classes. For multi-grade classes to work, resistance to the idea must be overcome and teachers must be trained.
• Mother tongue instruction: mother tongue instruction requires political will and truly bilingual teachers. Bilingual teachers are especially necessary to manage the transition between mother tongue instruction and the language used in upper primary and post- primary educational settings.
• Procurement practices: The practices with regard to procurement, disbursement and use of funds might reduce the interventions’ effectiveness.
Procurement systems, for example systems for textbooks or construction, have been widely studied,
1This fourth grader comes from the Khmu ethnic group, one of the many ethnic groups in the Lao People’s democratic republic. The school he attends has programmes to ensure that children are not left out of learning opportunities because of their ethnic origin.
© u
nIC
EF/La
oa
2011-00052/Tattersall
The InvesTmenT Case for eduCaTIon and equITy
91
4
with findings showing that different types of systems may lead to widely different unit costs. disbursement of planned amounts may not be done in a timely manner, and sometimes only a share of funding planned is effectively disbursed. Even when the planned amounts are disbursed to buy and distribute textbooks, such issues as funding leakage may occur before the resources reach schools, further reducing effective supply at the school level. For example, Leathes et al. (2011) using the results of Theunynck (2009), compared the average costs of school construction by method of procurement in sub-saharan africa and found very different unit costs. The costs were an average of us$17,485 a classroom for a Central ministry International competitive bid, us$12,285 for a Central ministry national competitive bid, and only us$5,200–$6,695 if procurement was delegated to communities. some studies (read 2014) suggest there is leakage of up to 50 per cent in textbooks. In addition, when the first public expenditure tracking survey was implemented, in uganda, in the mid-1990s, the World Bank (2013) found that from 1991 to 1995 an average of only 13 per cent of grants made it to the schools. In Peru, the public expenditure tracking survey (reinikka and smith 2004) found that schools did not receive payments for electricity in 25 per cent of the schools that the entity authorized to execute funds claimed to have paid; for water, 30 per cent of schools did not receive the money.
These situations can be addressed, but they require extensive reform of transparency and accountability systems. In uganda, a wave of reforms – which included publishing, broadcasting and posting of monthly transfers of public funds to the school districts in newspapers, on radio stations and in primary schools – helped increase the percentage of grant money that was received for schools to about 80 per cent in early 2001 (World Bank 2013).
4.3.2 Interventions to improve learning
Intervention effectiveness comparison
There is a wide array of interventions that may also support improved learning. These include support to early childhood development; pedagogic interventions,
such as reading methods; health- and nutrition-related interventions, e.g., school feeding, malaria prevention and eyeglasses; and financial or material input such scholarships, textbooks and school proximity.
Interventions from the unICEF simulations for Equity in Education (sEE) model and from reviews by Glewwe et al. (2011), mcEwan (2014), Conn (2014) and dhaliwal et al. (2012) were collated and grouped by level of effectiveness. Costs were then estimated and compared. However, the large variety of interventions (some possibly covering extremely diverse implementation modalities), contexts and costs make it difficult to compare the interventions’ cost-effectiveness with precision. Therefore, the computations are provided in annex H.
It is crucial to strengthen evidence-based research to determine which interventions best improve learning. Below are some of the main findings regarding impact without consideration of costs.
In a review of 77 randomized experiments that evaluated the effects of school-based interventions in primary schools in developing countries, mcEwan (2014) found that the largest mean effect sizes were associated with computers or instructional technology, teacher training, smaller classes, smaller learning groups or ability grouping, contract or volunteer teachers, performance incentives and instructional materials. despite the variety of interventions considered in the sample, one finding was that nearly all successful instructional interventions incorporated at least a minimal attempt to develop teachers’ capacities for effective instruction in the classroom. Though not surprising, this finding is important because it emphasizes the crucial role that teachers must play in any attempt to improve learning outcomes.
mcEwan’s review also highlighted the importance of the complementarity of interventions, e.g., combining a reduction in class sizes with additional teacher training. This finding is echoed in dhaliwal et al. (2012), which states that providing ‘more of the same’ resources is generally insufficient to improve learning when unaccompanied by other reforms. similar conclusions are drawn from a review of 79 studies that examined the impact of student and teacher characteristics on learning in which local capacities, demands and processes dramatically altered the effectiveness of educational inputs (Glewwe et al. 2011).
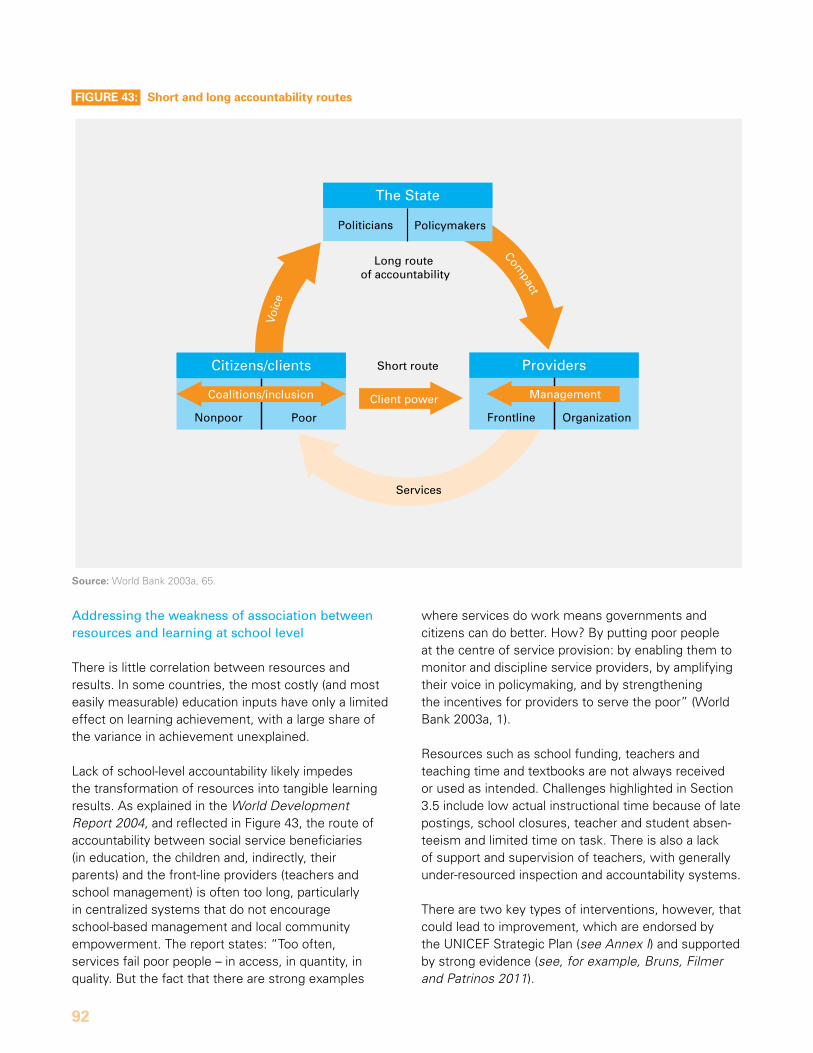
92
Source: World Bank 2003a, 65.
FiGuRE 43: Short and long accountability routes
Client power
The State
Politicians Policymakers
Voic
e
Compact
Providers
Frontline Organization
Management
Citizens/clients
Nonpoor Poor
Coalitions/inclusion
Source: World Bank. 2003. World Development Report 2004: Making Services Work for Poor People. Washington, DC: World Bank.
Short route
Long route of accountability
Services
Addressing the weakness of association between resources and learning at school level
There is little correlation between resources and results. In some countries, the most costly (and most easily measurable) education inputs have only a limited effect on learning achievement, with a large share of the variance in achievement unexplained.
Lack of school-level accountability likely impedes the transformation of resources into tangible learning results. as explained in the World Development Report 2004, and reflected in Figure 43, the route of accountability between social service beneficiaries (in education, the children and, indirectly, their parents) and the front-line providers (teachers and school management) is often too long, particularly in centralized systems that do not encourage school-based management and local community empowerment. The report states: “Too often, services fail poor people – in access, in quantity, in quality. But the fact that there are strong examples
where services do work means governments and citizens can do better. How? By putting poor people at the centre of service provision: by enabling them to monitor and discipline service providers, by amplifying their voice in policymaking, and by strengthening the incentives for providers to serve the poor” (World Bank 2003a, 1).
resources such as school funding, teachers and teaching time and textbooks are not always received or used as intended. Challenges highlighted in section 3.5 include low actual instructional time because of late postings, school closures, teacher and student absen-teeism and limited time on task. There is also a lack of support and supervision of teachers, with generally under-resourced inspection and accountability systems.
There are two key types of interventions, however, that could lead to improvement, which are endorsed by the unICEF strategic Plan (see Annex I) and supported by strong evidence (see, for example, Bruns, Filmer and Patrinos 2011).
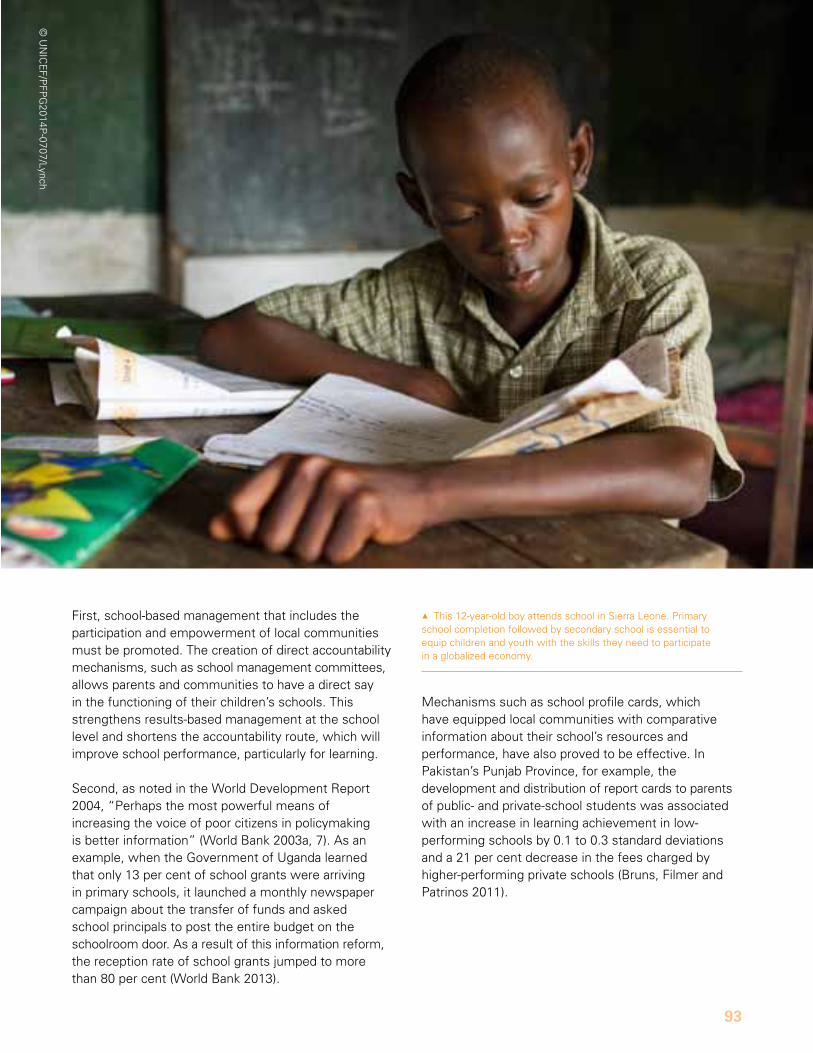
The InvesTmenT Case for eduCaTIon and equITy
93
4
First, school-based management that includes the participation and empowerment of local communities must be promoted. The creation of direct accountability mechanisms, such as school management committees, allows parents and communities to have a direct say in the functioning of their children’s schools. This strengthens results-based management at the school level and shortens the accountability route, which will improve school performance, particularly for learning.
second, as noted in the World development report 2004, “Perhaps the most powerful means of increasing the voice of poor citizens in policymaking is better information” (World Bank 2003a, 7). as an example, when the Government of uganda learned that only 13 per cent of school grants were arriving in primary schools, it launched a monthly newspaper campaign about the transfer of funds and asked school principals to post the entire budget on the schoolroom door. as a result of this information reform, the reception rate of school grants jumped to more than 80 per cent (World Bank 2013).
mechanisms such as school profile cards, which have equipped local communities with comparative information about their school’s resources and performance, have also proved to be effective. In Pakistan’s Punjab Province, for example, the development and distribution of report cards to parents of public- and private-school students was associated with an increase in learning achievement in low- performing schools by 0.1 to 0.3 standard deviations and a 21 per cent decrease in the fees charged by higher-performing private schools (Bruns, Filmer and Patrinos 2011).
1This 12-year-old boy attends school in sierra Leone. Primary school completion followed by secondary school is essential to equip children and youth with the skills they need to participate in a globalized economy.
© u
nIC
EF/P
FPG
2014P-0707/Lynch
94
© u
nIC
EF/E
THa
_2014_00219/ose
95
4I4
a call for action
96
There are about 1 billion children and adolescents of primary and lower secondary school age, and the young population is growing. When including pre-primary age children, the figure is closer to 1.4 billion. Education is a human right for all of them. yet far too many remain out of school. many of the children who are excluded are poor and vulnerable. many face discrimination because of gender, ethnic origin or disability. many live in conflict-afflicted areas. often, the children excluded from school are affected by multiple factors. In addition, an estimated 130 million children do not learn the basics of literacy and numeracy despite reaching Grade 4.
The demand for education will only grow. By 2030, 619 million additional children aged 3–15 will need to be enrolled in school in order to provide education from pre-primary to lower secondary for all children.
Education is a powerful tool to break the cycle of poverty and disadvantage for individuals, families and countries. It has the power to improve incomes, health and behaviour. yet the potential of education is currently unrealized.
How can so many children be denied their right to an education? one reason is a lack of resources allocated to education, hence, a call for increased domestic and external funding to education, including private-sector involvement. Just 5 per cent of the annual profits of the five highest-earning public companies in the world would be sufficient to raise us$12.6 billion annually – almost half of the estimated gap in external funding for basic education. Five per cent of the profits of the 15 highest-earning public companies would suffice to close the entire gap.
another reason children are denied their right to an education is that governments and their development partners sometimes fail to put enough emphasis on disadvantaged children. For example, though many children live in conflict areas, education represents less than 2 per cent of global humanitarian aid. The unICEF target is 10 per cent. In addition, insufficient public funding is allocated to the levels of education that the world’s most vulnerable are most likely to access, and which are also the levels of education that would most benefit society. as a consequence, a disproportionate burden is often placed on the families at the lowest level of education. In many countries, the wealthiest quintile benefits from 5–10 times more public education resources than the poorest quintile. In some countries, even within public resources available for a given level
of education, a more important share is used to educate the wealthier or more advantaged segments of society to the detriment of the poorest. Geographical allocation also tends to exacerbate inequitable spending patterns because higher resources, especially higher numbers of teachers, are generally distributed to the wealthiest areas of countries.
For education to keep its promise, governments and their development partners must increase their financial contributions and promote more pro-equity policies and funding. In some cases, this means turning current habits upside down and allocating more to the lower levels of education – the levels predominantly attended by the poorest children – and to the early grades, which are the most important for future learning. Targeting resources to reach the poorest areas and schools is also essential. Here, unICEF has many programmes targeted specifically to support preschool and early grade education.
But providing educational opportunities alone will not suffice to increase access to education. Getting children into school also requires interventions to actively remove the numerous barriers and risks that disadvantaged children face: child labour, child marriage, violence and discrimination.
some of the most cost-effective interventions include providing school uniforms and preschools and abolishing school fees. But there also needs to be a better understanding of the situations and environments of the most vulnerable children. That requires the integration of more data into household surveys and national data systems, particularly data on children with disabilities. To this end, unICEF is working on a new mICs module on children with disabilities and their school environment, and on supporting governments to include disability-related data in their Education management Information system.
Insufficient public funding is allocated to the levels of education that the world’s most vulnerable are most likely to access, and which are also the levels of education that would most benefit society.
The InvesTmenT Case for eduCaTIon and equITy
97
4
Finally, resources are not always used efficiently and learning is often low in developing countries. solutions for improved, more equitable and efficient policies for education and learning need to be contextualized based on in-depth education sector analyses that identify the specific challenges and constraints that countries face. The analyses should inform comprehensive education sector plans in which evidence is translated into implementable policies that are locally owned and relevant. Learning assessment systems at the country level, particularly in the early grades, will also empower national governments to make informed decisions. For this reason, unICEF is supporting the improvement of learning data and is a co-chair of the Learning metrics Task Force.
strong evidence also shows that increasing transparency, community participation and accountability – as learned from the experience in uganda described in Chapter 4 – has a significant impact on improving learning outcomes and reducing drop-out rates.
multiple and wide-ranging efforts are needed to finally give all children their birthright: quality education. But to achieve this goal, governments and their development partners must affirm their commitment to equitable, inclusive and effective education.
The InvesTmenT Case for eduCaTIon and equITy
98
Annexes
annexes
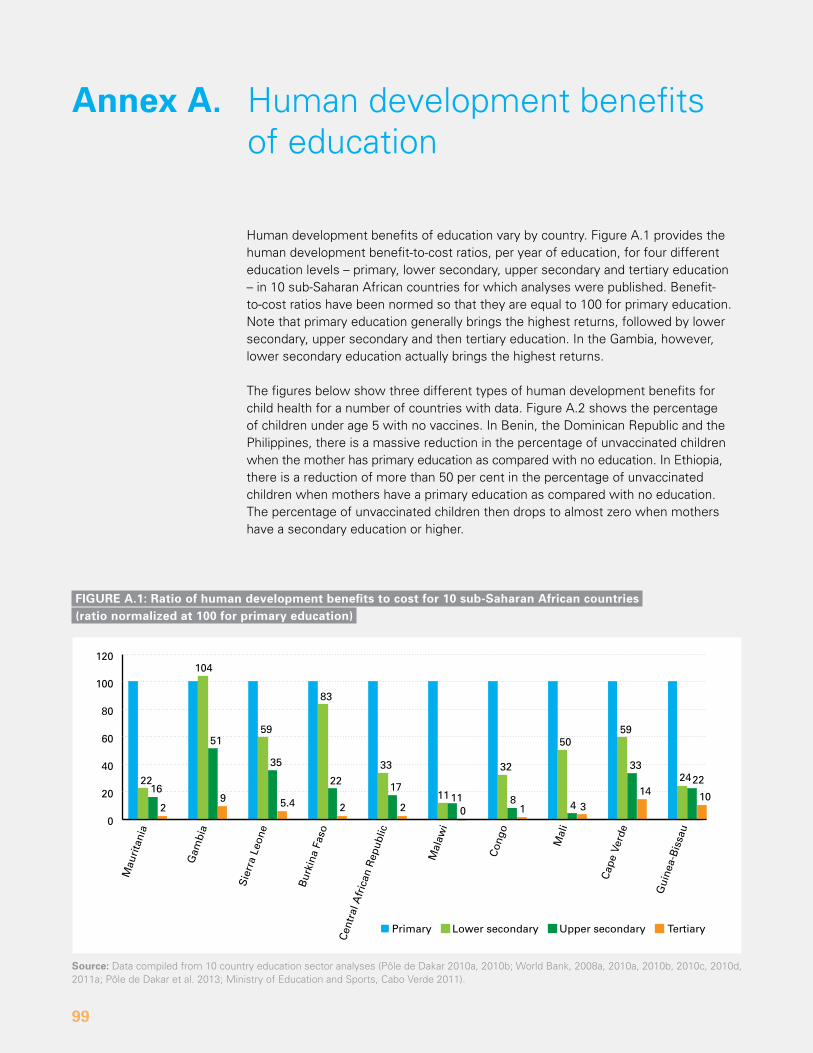
99
Human development benefits of education vary by country. Figure a.1 provides the human development benefit-to-cost ratios, per year of education, for four different education levels – primary, lower secondary, upper secondary and tertiary education – in 10 sub-saharan african countries for which analyses were published. Benefit- to-cost ratios have been normed so that they are equal to 100 for primary education. note that primary education generally brings the highest returns, followed by lower secondary, upper secondary and then tertiary education. In the Gambia, however, lower secondary education actually brings the highest returns.
The figures below show three different types of human development benefits for child health for a number of countries with data. Figure a.2 shows the percentage of children under age 5 with no vaccines. In Benin, the dominican republic and the Philippines, there is a massive reduction in the percentage of unvaccinated children when the mother has primary education as compared with no education. In Ethiopia, there is a reduction of more than 50 per cent in the percentage of unvaccinated children when mothers have a primary education as compared with no education. The percentage of unvaccinated children then drops to almost zero when mothers have a secondary education or higher.
annex a. Human development benefits of education
0
20
40
60
80
100
120
22
104
16
5159
83
33
1711
32
50
4 3
59
33
142422
1081
1102
22
2
35
5.492
Primary Lower secondary Upper secondary Tertiary
Mau
rita
nia
Gam
bia
Sie
rra
Leon
e
Bur
kina
Fas
o
Cen
tral
Afr
ican
Rep
ublic
Mal
awi
Con
go
Mal
i
Cap
e Ve
rde
Gui
nea-
Bis
sau
Source: data compiled from 10 country education sector analyses (Pôle de dakar 2010a, 2010b; World Bank, 2008a, 2010a, 2010b, 2010c, 2010d, 2011a; Pôle de dakar et al. 2013; ministry of Education and sports, Cabo Verde 2011).
FiGuRE a.1: Ratio of human development benefits to cost for 10 sub-Saharan african countries (ratio normalized at 100 for primary education)
99
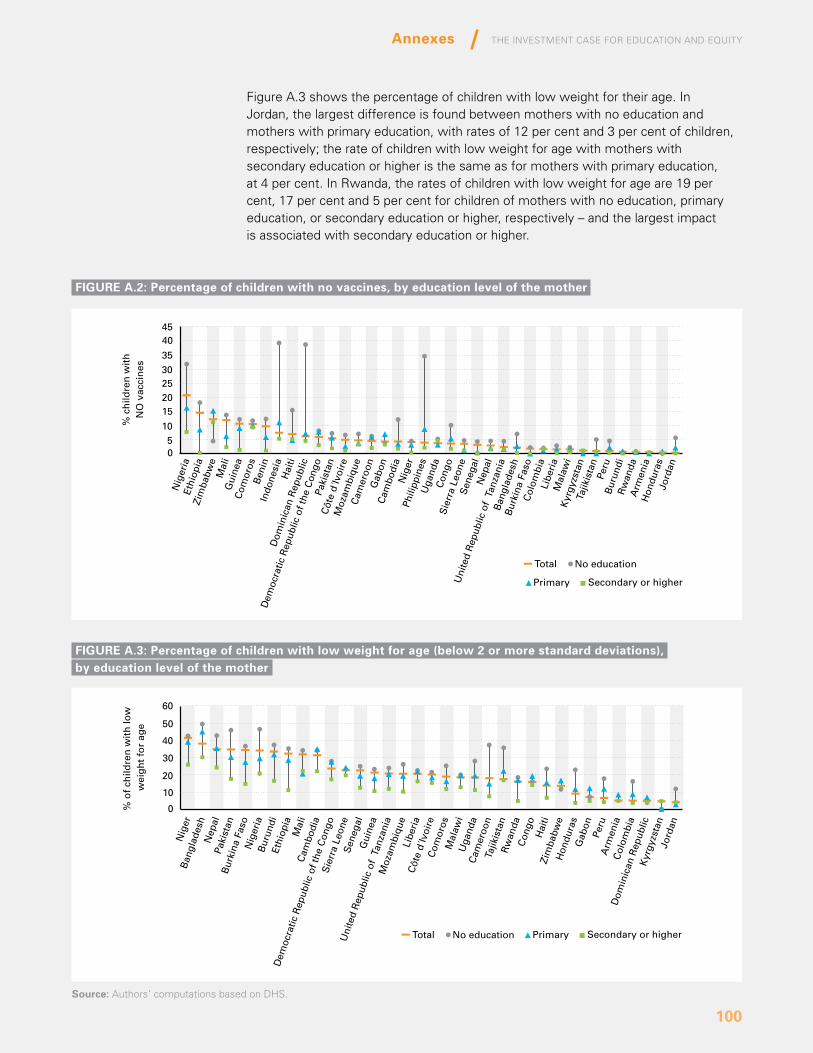
The InvesTmenT Case for eduCaTIon and equITy
100
Annexes
200
180
160
140
120100
80
6040
20
0U
nd
er-f
ive
mo
rtal
ity
rate
Total No education Primary Secondary or higher
Sie
rra
Leon
eN
iger
Bur
kina
Fas
oN
iger
iaG
uine
aC
amer
oon
Bur
undi
Mal
awi
Côt
e d'
Ivoi
reLi
beri
a
Dem
ocra
tic R
epub
lic o
f the
Con
go
Ethi
opia
Moz
ambi
que
Uga
nda
Mal
iR
wan
daPa
kist
anH
aiti
Uni
ted
Rep
ublic
of T
anza
nia
Sen
egal
Con
go
Zim
babw
eB
enin
Cam
bodi
aB
angl
ades
hG
abon
Nep
alC
omor
osTa
jikis
tan
Indo
nesi
a
Dom
inic
an R
epub
licK
yrgy
zsta
nPh
ilipp
ines
Hon
dura
sPe
ruC
olom
bia
Arm
enia
Jord
an
Total No education
Primary Secondary or higher
Nig
eria
Ethi
opia
Zim
babw
eM
ali
Gui
nea
Com
oros
Ben
inIn
done
sia
Hai
ti
Dom
inic
an R
epub
lic
Dem
ocra
tic R
epub
lic o
f the
Con
go
Paki
stan
Côt
e d´
Ivoi
reM
ozam
biqu
eC
amer
oon
Gab
onC
ambo
dia
Nig
erPh
ilipp
ines
Uga
nda
Con
go
Sie
rra
Leon
eS
eneg
alN
epal
Uni
ted
Rep
ublic
of
Tanz
ania
Ban
glad
esh
Bur
kina
Fas
oC
olom
bia
Libe
ria
Mal
awi
Kyr
gyzs
tan
Tajik
ista
nPe
ruB
urun
diR
wan
daA
rmen
iaH
ondu
ras
Jord
an
4540
35
30252015
1050
% c
hild
ren
wit
h
NO
vac
cin
es
Total No education Primary Secondary or higher
Nig
erB
angl
ades
hN
epal
Paki
stan
Bur
kina
Fas
oN
iger
iaB
urun
diEt
hiop
iaM
ali
Cam
bodi
a
Dem
ocra
tic R
epub
lic o
f the
Con
goS
ierr
a Le
one
Sen
egal
Gui
nea
Uni
ted
Rep
ublic
of
Tanz
ania
Moz
ambi
que
Libe
ria
Côt
e d´
Ivoi
reC
omor
osM
alaw
iU
gand
aC
amer
oon
Tajik
ista
nR
wan
daC
ongo
H
aiti
Zim
babw
eH
ondu
ras
Gab
onPe
ruA
rmen
iaC
olom
bia
Dom
inic
an R
epub
licK
yrgy
zsta
nJo
rdan
60
50
40
30
20
10
0% o
f ch
ildre
n w
ith
low
wei
gh
t fo
r ag
e
200
180
160
140
120100
80
6040
20
0
Un
der
-fiv
e m
ort
alit
y ra
te
Total No education Primary Secondary or higher
Sie
rra
Leon
eN
iger
Bur
kina
Fas
oN
iger
iaG
uine
aC
amer
oon
Bur
undi
Mal
awi
Côt
e d'
Ivoi
reLi
beri
a
Dem
ocra
tic R
epub
lic o
f the
Con
go
Ethi
opia
Moz
ambi
que
Uga
nda
Mal
iR
wan
daPa
kist
anH
aiti
Uni
ted
Rep
ublic
of T
anza
nia
Sen
egal
Con
go
Zim
babw
eB
enin
Cam
bodi
aB
angl
ades
hG
abon
Nep
alC
omor
osTa
jikis
tan
Indo
nesi
a
Dom
inic
an R
epub
licK
yrgy
zsta
nPh
ilipp
ines
Hon
dura
sPe
ruC
olom
bia
Arm
enia
Jord
an
Total No education
Primary Secondary or higher
Nig
eria
Ethi
opia
Zim
babw
eM
ali
Gui
nea
Com
oros
Ben
inIn
done
sia
Hai
ti
Dom
inic
an R
epub
lic
Dem
ocra
tic R
epub
lic o
f the
Con
go
Paki
stan
Côt
e d´
Ivoi
reM
ozam
biqu
eC
amer
oon
Gab
onC
ambo
dia
Nig
erPh
ilipp
ines
Uga
nda
Con
go
Sie
rra
Leon
eS
eneg
alN
epal
Uni
ted
Rep
ublic
of
Tanz
ania
Ban
glad
esh
Bur
kina
Fas
oC
olom
bia
Libe
ria
Mal
awi
Kyr
gyzs
tan
Tajik
ista
nPe
ruB
urun
diR
wan
daA
rmen
iaH
ondu
ras
Jord
an
4540
35
30252015
1050
% c
hild
ren
wit
h
NO
vac
cin
es
Total No education Primary Secondary or higher
Nig
erB
angl
ades
hN
epal
Paki
stan
Bur
kina
Fas
oN
iger
iaB
urun
diEt
hiop
iaM
ali
Cam
bodi
a
Dem
ocra
tic R
epub
lic o
f the
Con
goS
ierr
a Le
one
Sen
egal
Gui
nea
Uni
ted
Rep
ublic
of
Tanz
ania
Moz
ambi
que
Libe
ria
Côt
e d´
Ivoi
reC
omor
osM
alaw
iU
gand
aC
amer
oon
Tajik
ista
nR
wan
daC
ongo
H
aiti
Zim
babw
eH
ondu
ras
Gab
onPe
ruA
rmen
iaC
olom
bia
Dom
inic
an R
epub
licK
yrgy
zsta
nJo
rdan
60
50
40
30
20
10
0% o
f ch
ildre
n w
ith
low
wei
gh
t fo
r ag
e
FiGuRE a.2: Percentage of children with no vaccines, by education level of the mother
FiGuRE a.3: Percentage of children with low weight for age (below 2 or more standard deviations), by education level of the mother
Source: authors’ computations based on dHs.
Figure a.3 shows the percentage of children with low weight for their age. In Jordan, the largest difference is found between mothers with no education and mothers with primary education, with rates of 12 per cent and 3 per cent of children, respectively; the rate of children with low weight for age with mothers with secondary education or higher is the same as for mothers with primary education, at 4 per cent. In rwanda, the rates of children with low weight for age are 19 per cent, 17 per cent and 5 per cent for children of mothers with no education, primary education, or secondary education or higher, respectively – and the largest impact is associated with secondary education or higher.
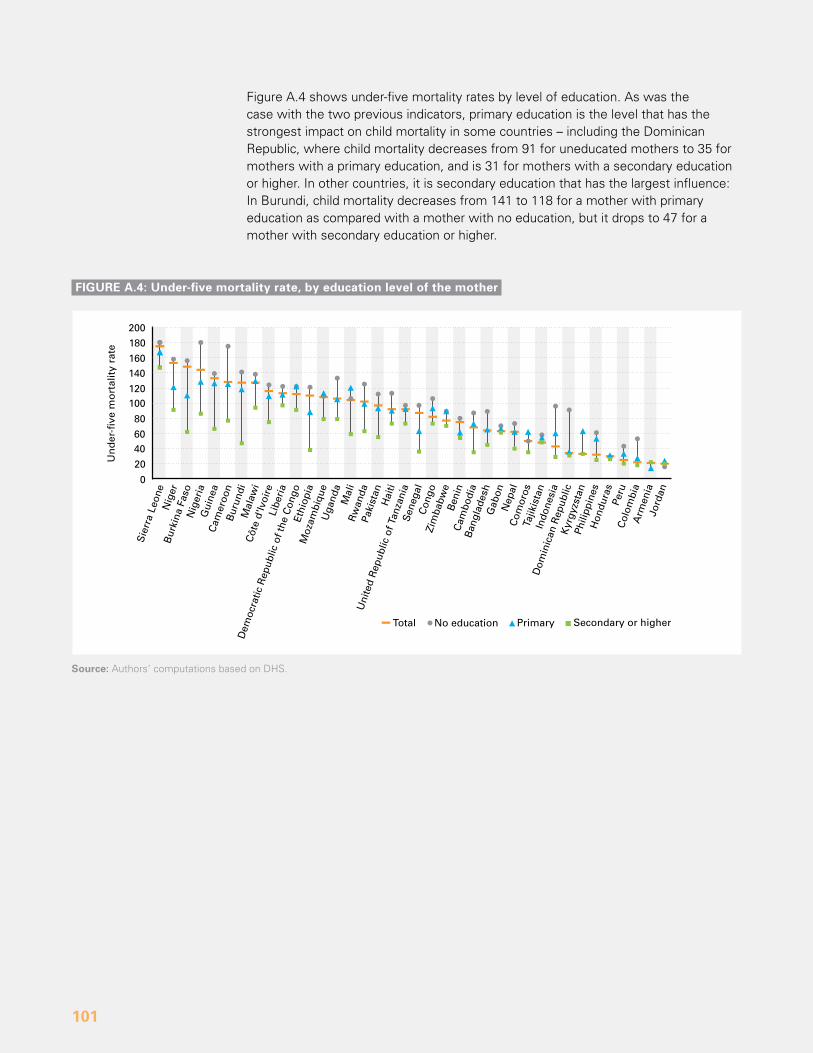
101
Figure a.4 shows under-five mortality rates by level of education. as was the case with the two previous indicators, primary education is the level that has the strongest impact on child mortality in some countries – including the dominican republic, where child mortality decreases from 91 for uneducated mothers to 35 for mothers with a primary education, and is 31 for mothers with a secondary education or higher. In other countries, it is secondary education that has the largest influence: In Burundi, child mortality decreases from 141 to 118 for a mother with primary education as compared with a mother with no education, but it drops to 47 for a mother with secondary education or higher.
200
180
160
140
120100
80
6040
20
0
Un
der
-fiv
e m
ort
alit
y ra
te
Total No education Primary Secondary or higher
Sie
rra
Leon
eN
iger
Bur
kina
Fas
oN
iger
iaG
uine
aC
amer
oon
Bur
undi
Mal
awi
Côt
e d'
Ivoi
reLi
beri
a
Dem
ocra
tic R
epub
lic o
f the
Con
go
Ethi
opia
Moz
ambi
que
Uga
nda
Mal
iR
wan
daPa
kist
anH
aiti
Uni
ted
Rep
ublic
of T
anza
nia
Sen
egal
Con
go
Zim
babw
eB
enin
Cam
bodi
aB
angl
ades
hG
abon
Nep
alC
omor
osTa
jikis
tan
Indo
nesi
a
Dom
inic
an R
epub
licK
yrgy
zsta
nPh
ilipp
ines
Hon
dura
sPe
ruC
olom
bia
Arm
enia
Jord
an
Total No education
Primary Secondary or higher
Nig
eria
Ethi
opia
Zim
babw
eM
ali
Gui
nea
Com
oros
Ben
inIn
done
sia
Hai
ti
Dom
inic
an R
epub
lic
Dem
ocra
tic R
epub
lic o
f the
Con
go
Paki
stan
Côt
e d´
Ivoi
reM
ozam
biqu
eC
amer
oon
Gab
onC
ambo
dia
Nig
erPh
ilipp
ines
Uga
nda
Con
go
Sie
rra
Leon
eS
eneg
alN
epal
Uni
ted
Rep
ublic
of
Tanz
ania
Ban
glad
esh
Bur
kina
Fas
oC
olom
bia
Libe
ria
Mal
awi
Kyr
gyzs
tan
Tajik
ista
nPe
ruB
urun
diR
wan
daA
rmen
iaH
ondu
ras
Jord
an4540
35
30252015
1050
% c
hild
ren
wit
h
NO
vac
cin
es
Total No education Primary Secondary or higher
Nig
erB
angl
ades
hN
epal
Paki
stan
Bur
kina
Fas
oN
iger
iaB
urun
diEt
hiop
iaM
ali
Cam
bodi
a
Dem
ocra
tic R
epub
lic o
f the
Con
goS
ierr
a Le
one
Sen
egal
Gui
nea
Uni
ted
Rep
ublic
of
Tanz
ania
Moz
ambi
que
Libe
ria
Côt
e d´
Ivoi
reC
omor
osM
alaw
iU
gand
aC
amer
oon
Tajik
ista
nR
wan
daC
ongo
H
aiti
Zim
babw
eH
ondu
ras
Gab
onPe
ruA
rmen
iaC
olom
bia
Dom
inic
an R
epub
licK
yrgy
zsta
nJo
rdan
60
50
40
30
20
10
0% o
f ch
ildre
n w
ith
low
wei
gh
t fo
r ag
e
Source: authors’ computations based on dHs.
FiGuRE a.4: under-five mortality rate, by education level of the mother
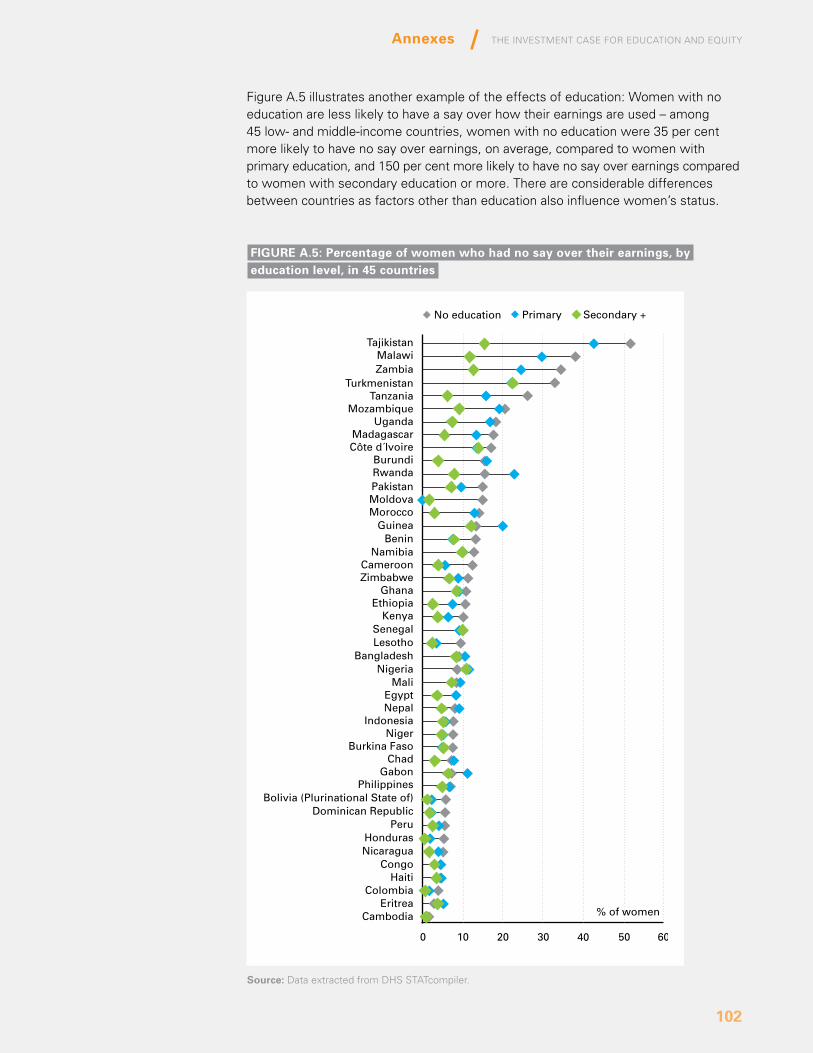
The InvesTmenT Case for eduCaTIon and equITy
102
Annexes
Figure a.5 illustrates another example of the effects of education: Women with no education are less likely to have a say over how their earnings are used – among 45 low- and middle-income countries, women with no education were 35 per cent more likely to have no say over earnings, on average, compared to women with primary education, and 150 per cent more likely to have no say over earnings compared to women with secondary education or more. There are considerable differences between countries as factors other than education also influence women’s status.
0 10 20 30 40 50 60
No education Primary Secondary +
TajikistanMalawiZambia
TurkmenistanTanzania
MozambiqueUganda
MadagascarCôte d´Ivoire
BurundiRwandaPakistanMoldovaMorocco
GuineaBenin
NamibiaCameroonZimbabwe
GhanaEthiopia
KenyaSenegalLesotho
BangladeshNigeria
MaliEgyptNepal
IndonesiaNiger
Burkina FasoChad
GabonPhilippines
Bolivia (Plurinational State of) Dominican Republic
PeruHondurasNicaragua
CongoHaiti
ColombiaEritrea
Cambodia % of women
Source: DHS surveys, data from Statcompiler
FiGuRE a.5: Percentage of women who had no say over their earnings, by education level, in 45 countries
Source: data extracted from dHs sTaTcompiler.
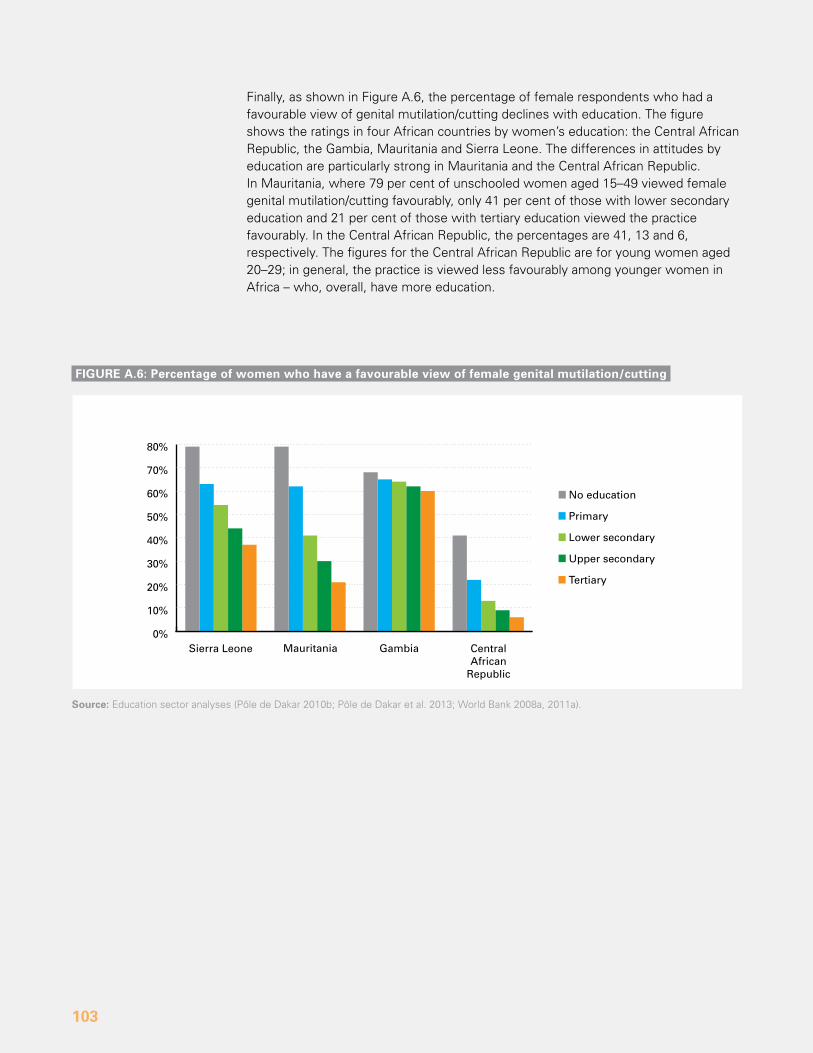
103
Finally, as shown in Figure a.6, the percentage of female respondents who had a favourable view of genital mutilation/cutting declines with education. The figure shows the ratings in four african countries by women’s education: the Central african republic, the Gambia, mauritania and sierra Leone. The differences in attitudes by education are particularly strong in mauritania and the Central african republic. In mauritania, where 79 per cent of unschooled women aged 15–49 viewed female genital mutilation/cutting favourably, only 41 per cent of those with lower secondary education and 21 per cent of those with tertiary education viewed the practice favourably. In the Central african republic, the percentages are 41, 13 and 6, respectively. The figures for the Central african republic are for young women aged 20–29; in general, the practice is viewed less favourably among younger women in africa – who, overall, have more education.
Source: Education sector analyses (Pôle de dakar 2010b; Pôle de dakar et al. 2013; World Bank 2008a, 2011a).
0%
10%
20%
30%
40%
50%
60%
70%
80%
No education
Primary
Lower secondary
Upper secondary
Tertiary
Sierra Leone
Source: education sector analyses (Government of the Gambia, World Bank and Pole de Dakar, 2011, Pole de Dakar, 2010b, 2013, World Bank, 2008a)
Mauritania Gambia Central African
Republic
FiGuRE a.6: Percentage of women who have a favourable view of female genital mutilation/cutting
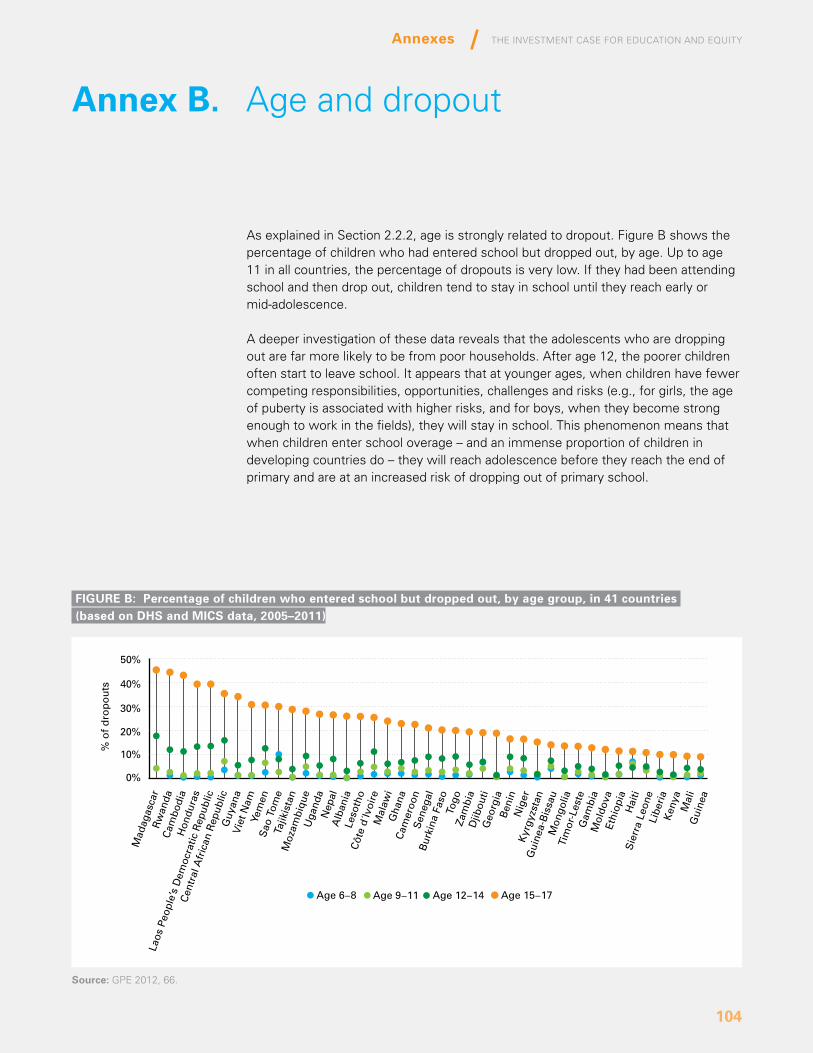
The InvesTmenT Case for eduCaTIon and equITy
104
Annexes
as explained in section 2.2.2, age is strongly related to dropout. Figure B shows the percentage of children who had entered school but dropped out, by age. up to age 11 in all countries, the percentage of dropouts is very low. If they had been attending school and then drop out, children tend to stay in school until they reach early or mid-adolescence.
a deeper investigation of these data reveals that the adolescents who are dropping out are far more likely to be from poor households. after age 12, the poorer children often start to leave school. It appears that at younger ages, when children have fewer competing responsibilities, opportunities, challenges and risks (e.g., for girls, the age of puberty is associated with higher risks, and for boys, when they become strong enough to work in the fields), they will stay in school. This phenomenon means that when children enter school overage – and an immense proportion of children in developing countries do – they will reach adolescence before they reach the end of primary and are at an increased risk of dropping out of primary school.
annex B. age and dropout
50%
40%
30%
20%
10%
0%
Age 6−8 Age 9−11 Age 12−14 Age 15−17
Mad
agas
car
Rw
anda
Cam
bodi
aH
ondu
ras
Laos
Peo
ple’
s D
emoc
ratic
Rep
ublic
Cen
tral
Afr
ican
Rep
ublic
Guy
ana
Vie
t Nam
Yem
enS
ao T
ome
Tajik
ista
nM
ozam
biqu
eU
gand
aN
epal
Alb
ania
Leso
tho
Côt
e d´
Ivoi
reM
alaw
iG
hana
Cam
eroo
nS
eneg
alB
urki
na F
aso
Togo
Zam
bia
Djib
outi
Geo
rgia
Ben
inN
iger
Kyr
gyzs
tan
Gui
nea-
Bis
sau
Mon
golia
Tim
or-L
este
Gam
bia
Mol
dova
Ethi
opia
Hai
tiS
ierr
a Le
one
Libe
ria
Ken
yaM
ali
Gui
nea
% o
f d
rop
ou
ts
FiGuRE B: Percentage of children who entered school but dropped out, by age group, in 41 countries (based on dHS and MicS data, 2005–2011)
Source: GPE 2012, 66.
105
Figures C.1 and C.2 show the ratios of per pupil expenditures in secondary vs. primary education and in tertiary vs. primary education.
annex c. Per pupil expenditures in secondary and tertiary vs. primary education
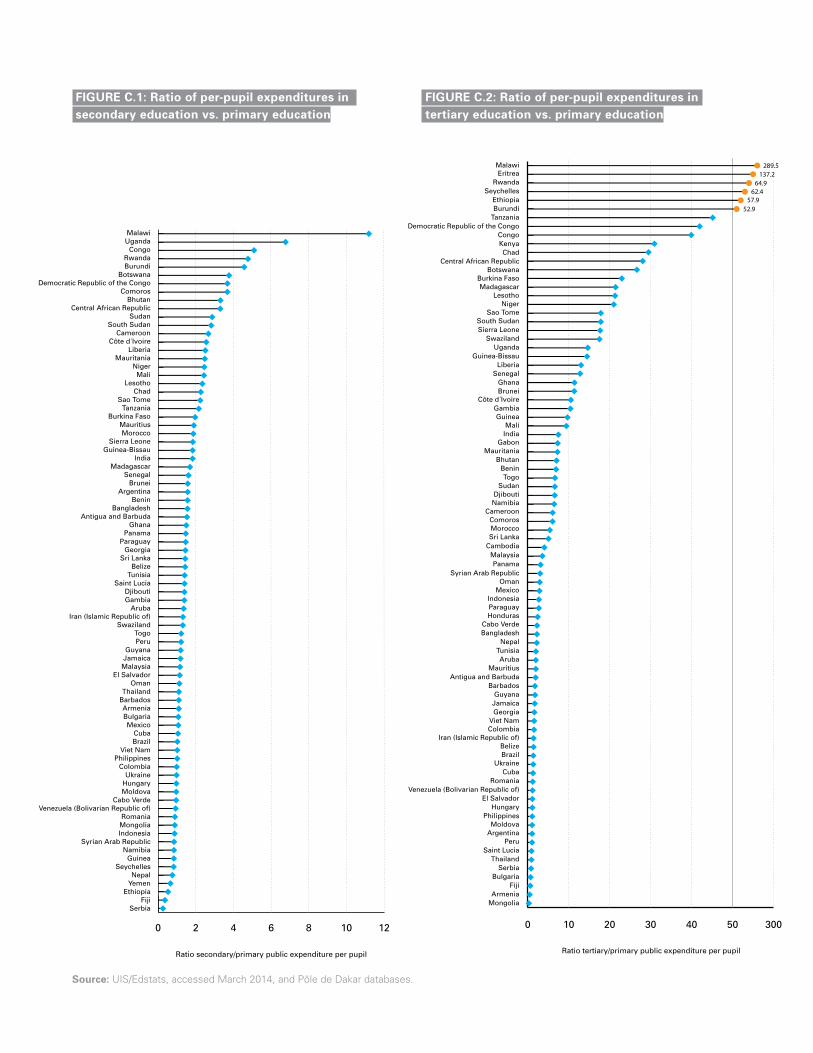
The InvesTmenT Case for eduCaTIon and equITy
106
Annexes
FiGuRE c.1: Ratio of per-pupil expenditures in secondary education vs. primary education
FiGuRE c.2: Ratio of per-pupil expenditures in tertiary education vs. primary education
Source: uIs/Edstats, accessed march 2014, and Pôle de dakar databases.
0 2 4 6 8 10 12
MalawiUganda
CongoRwandaBurundi
BotswanaDemocratic Republic of the Congo
ComorosBhutan
Central African RepublicSudan
South SudanCameroon
Côte d´IvoireLiberia
MauritaniaNiger
MaliLesotho
ChadSao Tome
TanzaniaBurkina Faso
MauritiusMorocco
Sierra LeoneGuinea-Bissau
IndiaMadagascar
SenegalBrunei
ArgentinaBenin
BangladeshAntigua and Barbuda
GhanaPanama
ParaguayGeorgia
Sri LankaBelize
TunisiaSaint Lucia
DjiboutiGambia
ArubaIran (Islamic Republic of)
SwazilandTogoPeru
GuyanaJamaica
MalaysiaEl Salvador
OmanThailand
BarbadosArmeniaBulgariaMexico
CubaBrazil
Viet NamPhilippines
ColombiaUkraine
HungaryMoldova
Cabo VerdeVenezuela (Bolivarian Republic of)
RomaniaMongoliaIndonesia
Syrian Arab RepublicNamibia
GuineaSeychelles
NepalYemen
EthiopiaFiji
Serbia
Ratio secondary/primary public expenditure per pupil
Source: UIS/Edstats (accessed 03/2014) and Pole de Dakar databases
MalawiEritrea
RwandaSeychelles
EthiopiaBurundi
TanzaniaDemocratic Republic of the Congo
CongoKenyaChad
Central African RepublicBotswana
Burkina FasoMadagascar
LesothoNiger
Sao TomeSouth SudanSierra Leone
SwazilandUganda
Guinea-BissauLiberia
SenegalGhanaBrunei
Côte d´IvoireGambiaGuinea
MaliIndia
GabonMauritania
BhutanBeninTogo
SudanDjibouti
NamibiaCameroon
ComorosMoroccoSri Lanka
CambodiaMalaysiaPanama
Syrian Arab RepublicOman
MexicoIndonesiaParaguayHonduras
Cabo VerdeBangladesh
NepalTunisiaAruba
MauritiusAntigua and Barbuda
BarbadosGuyanaJamaicaGeorgia
Viet NamColombia
Iran (Islamic Republic of) BelizeBrazil
UkraineCuba
RomaniaVenezuela (Bolivarian Republic of)
El SalvadorHungary
PhilippinesMoldova
ArgentinaPeru
Saint LuciaThailand
SerbiaBulgaria
FijiArmenia
Mongolia
0 10 20 30 40 50 300
289.5137.2
64.962.4
57.952.9
Source: UIS/Edstats (accessed 03/2014) and Pole de Dakar databases
Ratio tertiary/primary public expenditure per pupil
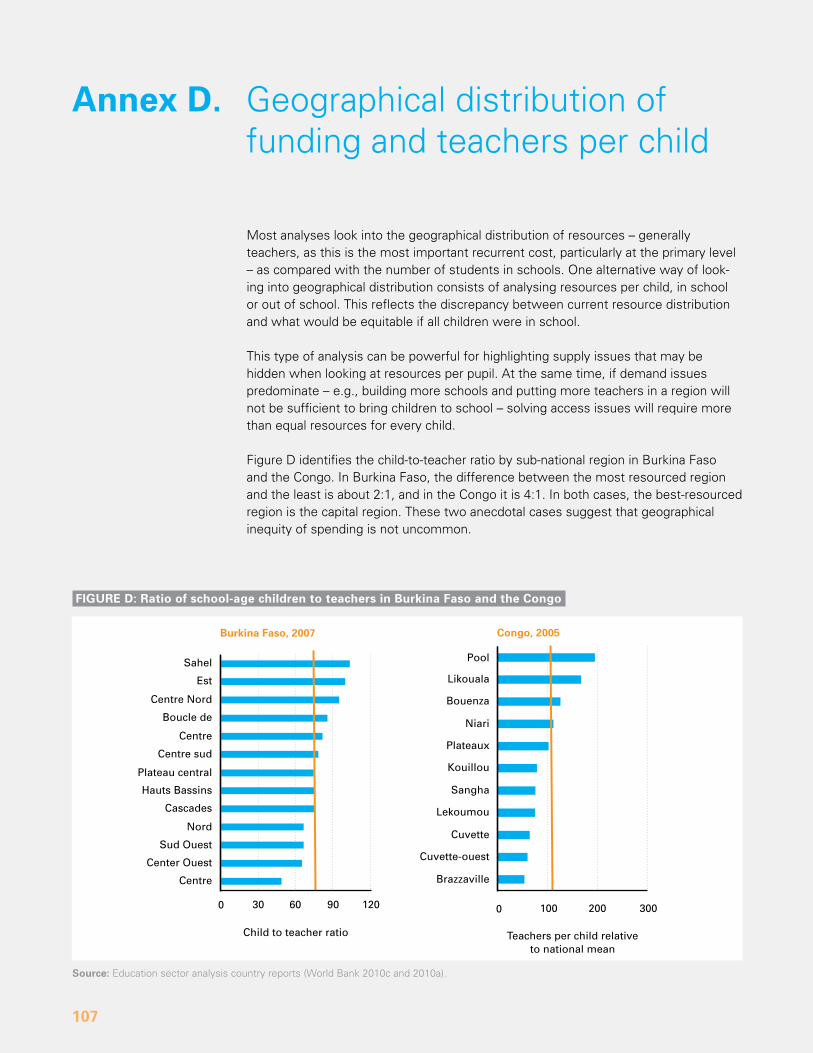
107
most analyses look into the geographical distribution of resources – generally teachers, as this is the most important recurrent cost, particularly at the primary level – as compared with the number of students in schools. one alternative way of look-ing into geographical distribution consists of analysing resources per child, in school or out of school. This reflects the discrepancy between current resource distribution and what would be equitable if all children were in school.
This type of analysis can be powerful for highlighting supply issues that may be hidden when looking at resources per pupil. at the same time, if demand issues predominate – e.g., building more schools and putting more teachers in a region will not be sufficient to bring children to school – solving access issues will require more than equal resources for every child.
Figure d identifies the child-to-teacher ratio by sub-national region in Burkina Faso and the Congo. In Burkina Faso, the difference between the most resourced region and the least is about 2:1, and in the Congo it is 4:1. In both cases, the best-resourced region is the capital region. These two anecdotal cases suggest that geographical inequity of spending is not uncommon.
annex d. Geographical distribution of funding and teachers per child
FiGuRE d: Ratio of school-age children to teachers in Burkina Faso and the congo
Source: Education sector analysis country reports (World Bank 2010c and 2010a).
0 30 60 90 120 100 200 3000
Sahel
Est
Centre Nord
Boucle de
Centre
Centre sud
Plateau central
Hauts Bassins
Cascades
Nord
Sud Ouest
Center Ouest
Centre
Teachers per child relative to national mean
Child to teacher ratio
Burkina Faso, 2007 Congo, 2005
Pool
Likouala
Bouenza
Niari
Plateaux
Kouillou
Sangha
Lekoumou
Cuvette
Cuvette-ouest
Brazzaville
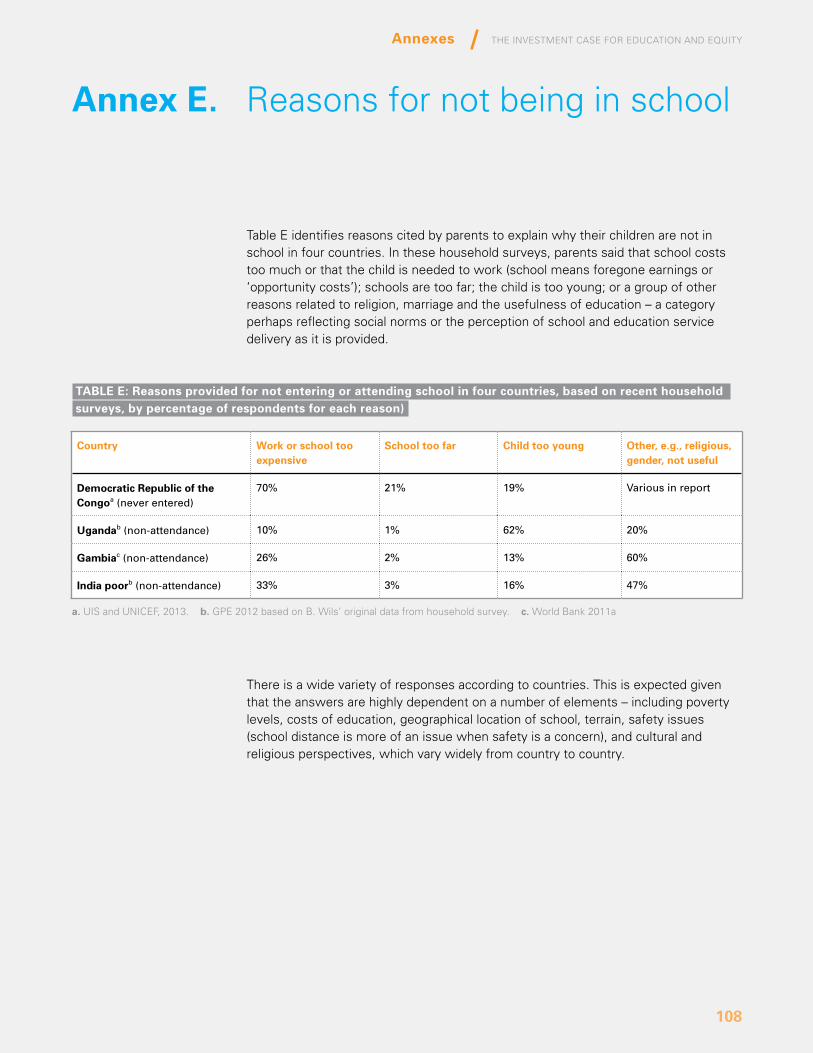
The InvesTmenT Case for eduCaTIon and equITy
108
Annexes
Table E identifies reasons cited by parents to explain why their children are not in school in four countries. In these household surveys, parents said that school costs too much or that the child is needed to work (school means foregone earnings or ‘opportunity costs’); schools are too far; the child is too young; or a group of other reasons related to religion, marriage and the usefulness of education – a category perhaps reflecting social norms or the perception of school and education service delivery as it is provided.
There is a wide variety of responses according to countries. This is expected given that the answers are highly dependent on a number of elements – including poverty levels, costs of education, geographical location of school, terrain, safety issues (school distance is more of an issue when safety is a concern), and cultural and religious perspectives, which vary widely from country to country.
annex E. reasons for not being in school
taBlE E: Reasons provided for not entering or attending school in four countries, based on recent household surveys, by percentage of respondents for each reason)
a. uIs and unICEF, 2013. b. GPE 2012 based on B. Wils’ original data from household survey. c. World Bank 2011a
country Work or school too expensive
School too far child too young other, e.g., religious, gender, not useful
democratic Republic of the congoa (never entered)
70% 21% 19% Various in report
ugandab (non-attendance) 10% 1% 62% 20%
Gambiac (non-attendance) 26% 2% 13% 60%
india poorb (non-attendance) 33% 3% 16% 47%
109
The simulations for Equity in Education (sEE) project is a collaboration between unICEF and the World Bank to identify cost-effective strategies for reaching children who are excluded or underserved by education systems. sEE is intended to help countries identify cost-effective, pro-equity education strategies, and to serve as a global tool for developing evidence-based documentation of and advocacy for such strategies. The sEE Excel-based tool allows users to project the costs of interventions to reach different groups of excluded children and improvements in school outcomes as a result of these interventions.
In line with this, a database on the effectiveness of education interventions around the world has been developed. The sEE database, which has been described elsewhere in greater detail by unICEF and World Bank (2013a, 2013b), includes data from more than 200 studies and reports focused on education interventions in developing countries. most of the studies are randomized trials and econometric research, for example, from education sector analyses by governments, usually supported by IIEP/Pôle de dakar, the World Bank and unICEF. The database also includes some pre-post as well as transversal studies. although these types of studies are generally considered to be less robust, some are included if they were carefully executed and provide information on an intervention and outcome combination that had little coverage through other studies.
all the effect sizes – the ratio of the difference and the original learning gap – were recorded either as standard deviations or percentage point changes, depending on how they were published. The data were then translated into a common measure: the reduction of gaps through the treatment. The concept of ‘gaps’ assumes a target value – i.e., entry, enrolment, or survival rates of 100 – or a particular target learning level that was identified in the study, e.g., score 500 on an analysis, can read a story, read 60 words a minute. The absolute impact is the difference in the percentage of children who do not reach the target with and without the treatment.
The sEE database includes three measures of access: (1) entry, which is counted as the percentage of children who enter school by a particular age, or gross or net intake rates; (2) enrolment, generally gross enrolment, although some studies use net enrolment or attendance or age-specific attendance rates; and (3) survival rate, often measured as the survival to a particular grade, but sometimes measured as the transition from one grade to the next.
Given that interventions to improve entry also appear among the interventions to improve enrolment and survival, Table F focuses on enrolment and survival/retention, and details the number of studies and types of interventions in the sEE database for these measures.
annex F. The sEE database
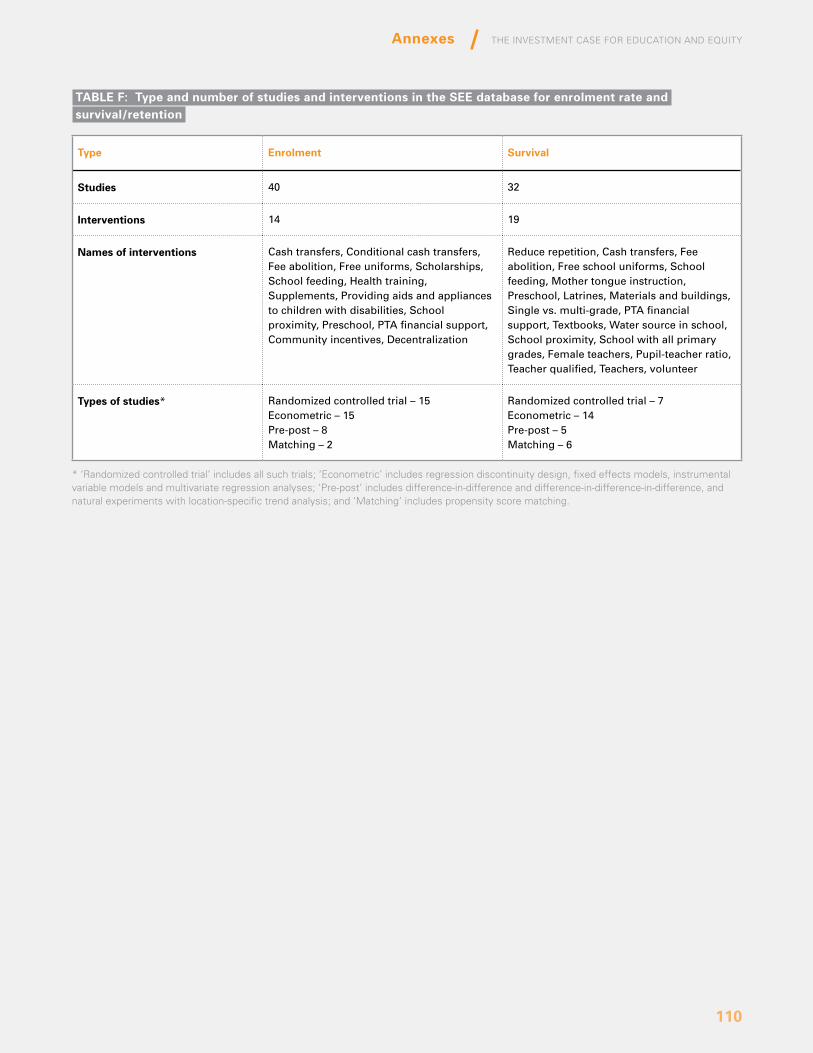
The InvesTmenT Case for eduCaTIon and equITy
110
Annexes
taBlE F: type and number of studies and interventions in the SEE database for enrolment rate and survival/retention
type Enrolment Survival
Studies 40 32
interventions 14 19
names of interventions Cash transfers, Conditional cash transfers, Fee abolition, Free uniforms, Scholarships, School feeding, Health training, Supplements, Providing aids and appliances to children with disabilities, School proximity, Preschool, PTA financial support, Community incentives, Decentralization
Reduce repetition, Cash transfers, Fee abolition, Free school uniforms, School feeding, Mother tongue instruction, Preschool, Latrines, Materials and buildings, Single vs. multi-grade, PTA financial support, Textbooks, Water source in school, School proximity, School with all primary grades, Female teachers, Pupil-teacher ratio, Teacher qualified, Teachers, volunteer
types of studies* Randomized controlled trial – 15Econometric – 15Pre-post – 8Matching – 2
Randomized controlled trial – 7Econometric – 14Pre-post – 5Matching – 6
* ‘randomized controlled trial’ includes all such trials; ‘Econometric’ includes regression discontinuity design, fixed effects models, instrumental variable models and multivariate regression analyses; ‘Pre-post’ includes difference-in-difference and difference-in-difference-in-difference, and natural experiments with location-specific trend analysis; and ‘matching’ includes propensity score matching.
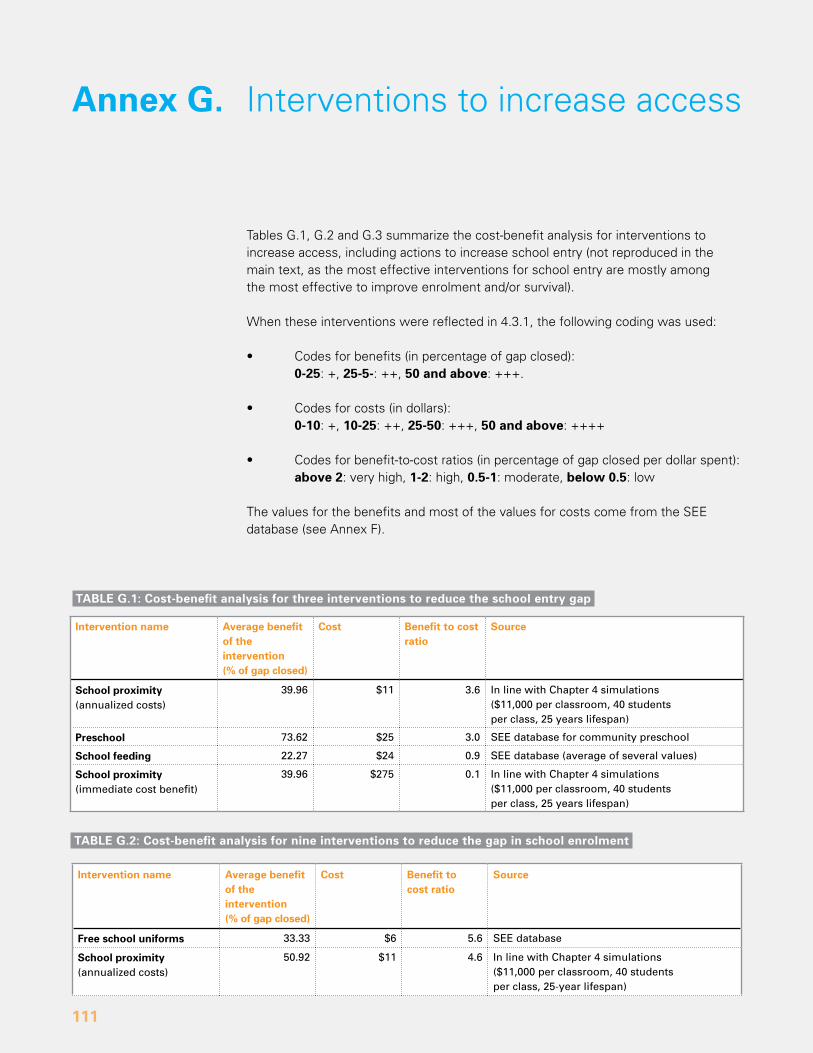
111
Tables G.1, G.2 and G.3 summarize the cost-benefit analysis for interventions to increase access, including actions to increase school entry (not reproduced in the main text, as the most effective interventions for school entry are mostly among the most effective to improve enrolment and/or survival).
When these interventions were reflected in 4.3.1, the following coding was used:
• Codesforbenefits(inpercentageofgapclosed): 0-25: +, 25-5-: ++, 50 and above: +++.
• Codesforcosts(indollars): 0-10: +, 10-25: ++, 25-50: +++, 50 and above: ++++
• Codesforbenefit-to-costratios(inpercentageofgapclosedperdollarspent):above 2: very high, 1-2: high, 0.5-1: moderate, below 0.5: low
The values for the benefits and most of the values for costs come from the sEE database (see annex F).
annex G. Interventions to increase access
intervention name average benefit of the intervention (% of gap closed)
cost Benefit to cost ratio
Source
School proximity (annualized costs)
39.96 $11 3.6 In line with Chapter 4 simulations ($11,000 per classroom, 40 students per class, 25 years lifespan)
Preschool 73.62 $25 3.0 SEE database for community preschool
School feeding 22.27 $24 0.9 SEE database (average of several values)
School proximity (immediate cost benefit)
39.96 $275 0.1 In line with Chapter 4 simulations ($11,000 per classroom, 40 students per class, 25 years lifespan)
intervention name average benefit of the intervention (% of gap closed)
cost Benefit to cost ratio
Source
Free school uniforms 33.33 $6 5.6 SEE database
School proximity (annualized costs)
50.92 $11 4.6 In line with Chapter 4 simulations ($11,000 per classroom, 40 students per class, 25-year lifespan)
taBlE G.1: cost-benefit analysis for three interventions to reduce the school entry gap
taBlE G.2: cost-benefit analysis for nine interventions to reduce the gap in school enrolment
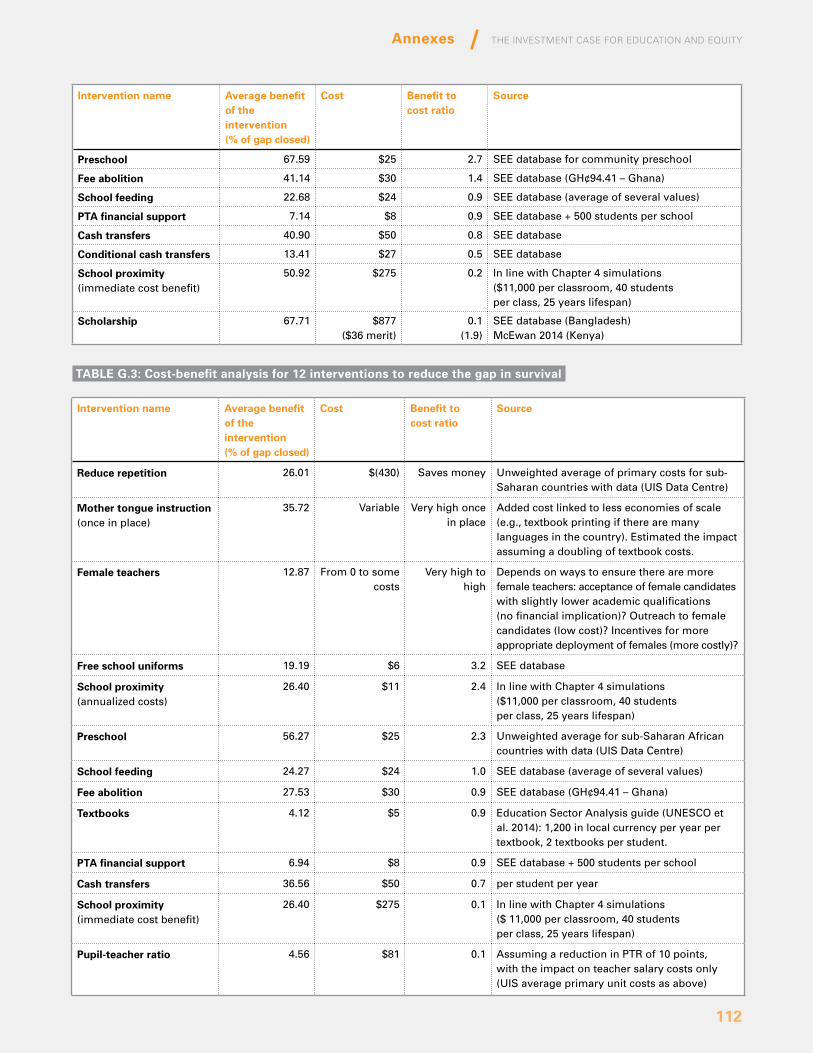
The InvesTmenT Case for eduCaTIon and equITy
112
Annexes
intervention name average benefit of the intervention (% of gap closed)
cost Benefit to cost ratio
Source
Reduce repetition 26.01 $(430) Saves money unweighted average of primary costs for sub-Saharan countries with data (uIS Data Centre)
Mother tongue instruction (once in place)
35.72 Variable Very high once in place
Added cost linked to less economies of scale (e.g., textbook printing if there are many languages in the country). Estimated the impact assuming a doubling of textbook costs.
Female teachers 12.87 From 0 to some costs
Very high to high
Depends on ways to ensure there are more female teachers: acceptance of female candidates with slightly lower academic qualifications (no financial implication)? outreach to female candidates (low cost)? Incentives for more appropriate deployment of females (more costly)?
Free school uniforms 19.19 $6 3.2 SEE database
School proximity (annualized costs)
26.40 $11 2.4 In line with Chapter 4 simulations ($11,000 per classroom, 40 students per class, 25 years lifespan)
Preschool 56.27 $25 2.3 unweighted average for sub-Saharan African countries with data (uIS Data Centre)
School feeding 24.27 $24 1.0 SEE database (average of several values)
Fee abolition 27.53 $30 0.9 SEE database (GH¢94.41 – Ghana)
textbooks 4.12 $5 0.9 Education Sector Analysis guide (uNESCo et al. 2014): 1,200 in local currency per year per textbook, 2 textbooks per student.
Pta financial support 6.94 $8 0.9 SEE database + 500 students per school
cash transfers 36.56 $50 0.7 per student per year
School proximity (immediate cost benefit)
26.40 $275 0.1 In line with Chapter 4 simulations ($ 11,000 per classroom, 40 students per class, 25 years lifespan)
Pupil-teacher ratio 4.56 $81 0.1 Assuming a reduction in PTR of 10 points, with the impact on teacher salary costs only (uIS average primary unit costs as above)
taBlE G.3: cost-benefit analysis for 12 interventions to reduce the gap in survival
intervention name average benefit of the intervention (% of gap closed)
cost Benefit to cost ratio
Source
Preschool 67.59 $25 2.7 SEE database for community preschool
Fee abolition 41.14 $30 1.4 SEE database (GH¢94.41 – Ghana)
School feeding 22.68 $24 0.9 SEE database (average of several values)
Pta financial support 7.14 $8 0.9 SEE database + 500 students per school
cash transfers 40.90 $50 0.8 SEE database
conditional cash transfers 13.41 $27 0.5 SEE database
School proximity (immediate cost benefit)
50.92 $275 0.2 In line with Chapter 4 simulations ($11,000 per classroom, 40 students per class, 25 years lifespan)
Scholarship 67.71 $877 ($36 merit)
0.1(1.9)
SEE database (Bangladesh)McEwan 2014 (Kenya)
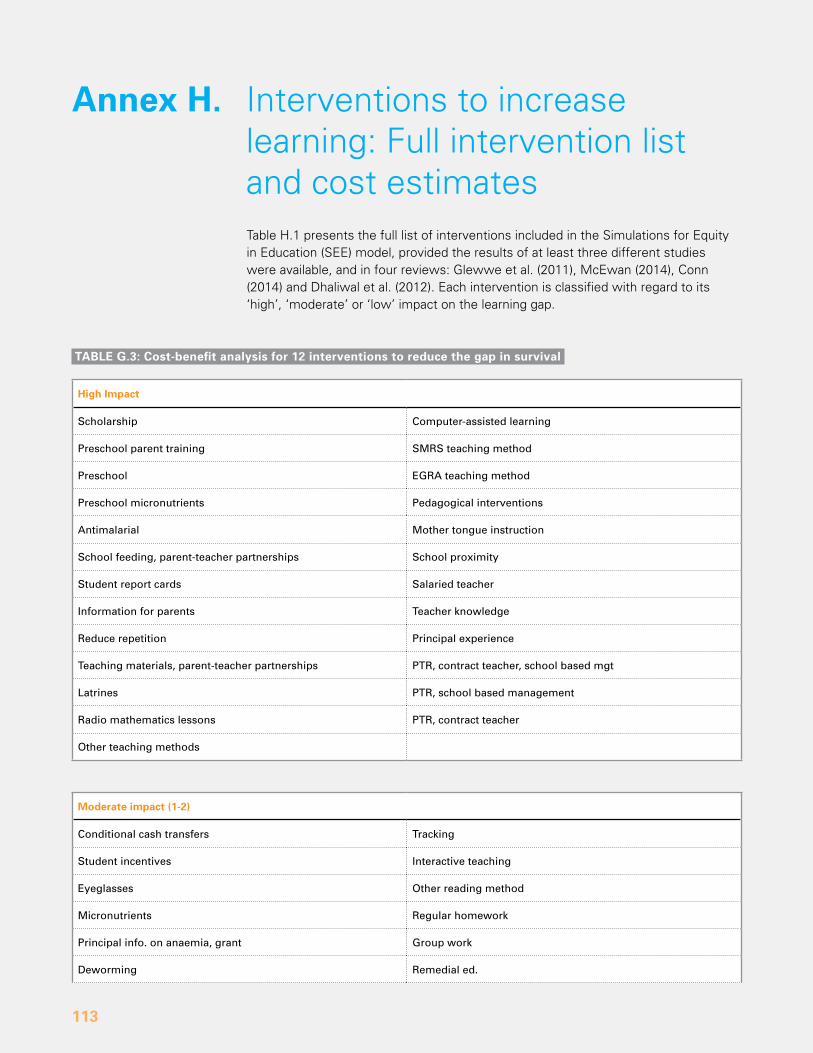
113
Table H.1 presents the full list of interventions included in the simulations for Equity in Education (sEE) model, provided the results of at least three different studies were available, and in four reviews: Glewwe et al. (2011), mcEwan (2014), Conn (2014) and dhaliwal et al. (2012). Each intervention is classified with regard to its ‘high’, ‘moderate’ or ‘low’ impact on the learning gap.
annex H. Interventions to increase learning: Full intervention list and cost estimates
taBlE G.3: cost-benefit analysis for 12 interventions to reduce the gap in survival
High impact
Scholarship Computer-assisted learning
Preschool parent training SMRS teaching method
Preschool EGRA teaching method
Preschool micronutrients Pedagogical interventions
Antimalarial Mother tongue instruction
School feeding, parent-teacher partnerships School proximity
Student report cards Salaried teacher
Information for parents Teacher knowledge
Reduce repetition Principal experience
Teaching materials, parent-teacher partnerships PTR, contract teacher, school based mgt
Latrines PTR, school based management
Radio mathematics lessons PTR, contract teacher
other teaching methods
Moderate impact (1-2)
Conditional cash transfers Tracking
Student incentives Interactive teaching
Eyeglasses other reading method
Micronutrients Regular homework
Principal info. on anaemia, grant Group work
Deworming Remedial ed.
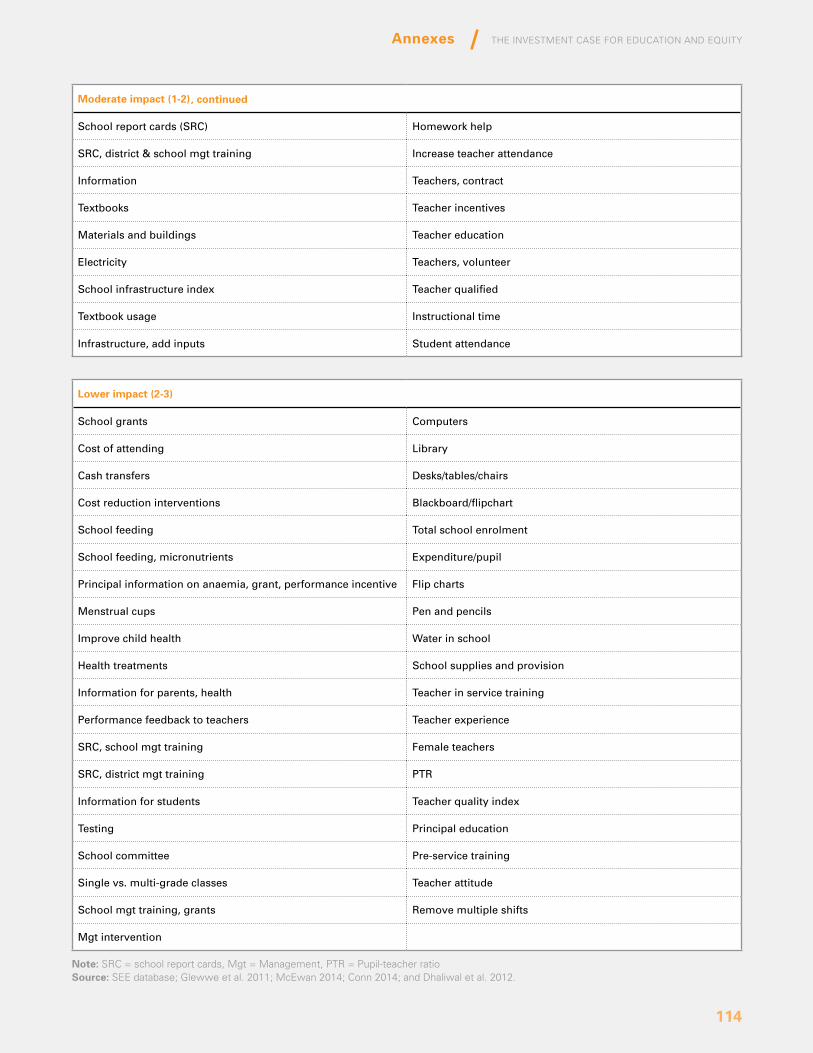
The InvesTmenT Case for eduCaTIon and equITy
114
Annexes
note: srC = school report cards, mgt = management, PTr = Pupil-teacher ratioSource: sEE database; Glewwe et al. 2011; mcEwan 2014; Conn 2014; and dhaliwal et al. 2012.
lower impact (2-3)
School grants Computers
Cost of attending Library
Cash transfers Desks/tables/chairs
Cost reduction interventions Blackboard/flipchart
School feeding Total school enrolment
School feeding, micronutrients Expenditure/pupil
Principal information on anaemia, grant, performance incentive Flip charts
Menstrual cups Pen and pencils
Improve child health Water in school
Health treatments School supplies and provision
Information for parents, health Teacher in service training
Performance feedback to teachers Teacher experience
SRC, school mgt training Female teachers
SRC, district mgt training PTR
Information for students Teacher quality index
Testing Principal education
School committee Pre-service training
Single vs. multi-grade classes Teacher attitude
School mgt training, grants Remove multiple shifts
Mgt intervention
Moderate impact (1-2)
School report cards (SRC) Homework help
SRC, district & school mgt training Increase teacher attendance
Information Teachers, contract
Textbooks Teacher incentives
Materials and buildings Teacher education
Electricity Teachers, volunteer
School infrastructure index Teacher qualified
Textbook usage Instructional time
Infrastructure, add inputs Student attendance
, continued
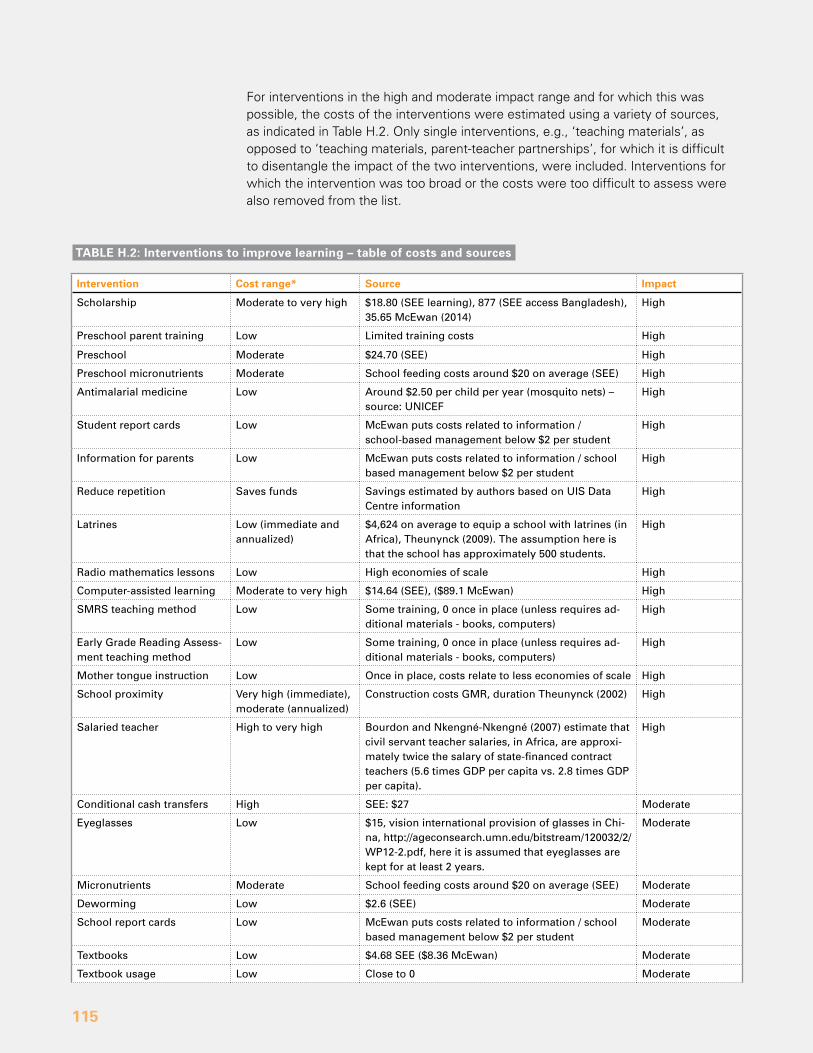
115
For interventions in the high and moderate impact range and for which this was possible, the costs of the interventions were estimated using a variety of sources, as indicated in Table H.2. only single interventions, e.g., ‘teaching materials’, as opposed to ‘teaching materials, parent-teacher partnerships’, for which it is difficult to disentangle the impact of the two interventions, were included. Interventions for which the intervention was too broad or the costs were too difficult to assess were also removed from the list.
intervention cost range* Source impact
Scholarship Moderate to very high $18.80 (SEE learning), 877 (SEE access Bangladesh), 35.65 McEwan (2014)
High
Preschool parent training Low Limited training costs High
Preschool Moderate $24.70 (SEE) High
Preschool micronutrients Moderate School feeding costs around $20 on average (SEE) High
Antimalarial medicine Low Around $2.50 per child per year (mosquito nets) – source: uNICEF
High
Student report cards Low McEwan puts costs related to information / school-based management below $2 per student
High
Information for parents Low McEwan puts costs related to information / school based management below $2 per student
High
Reduce repetition Saves funds Savings estimated by authors based on uIS Data Centre information
High
Latrines Low (immediate and annualized)
$4,624 on average to equip a school with latrines (in Africa), Theunynck (2009). The assumption here is that the school has approximately 500 students.
High
Radio mathematics lessons Low High economies of scale High
Computer-assisted learning Moderate to very high $14.64 (SEE), ($89.1 McEwan) High
SMRS teaching method Low Some training, 0 once in place (unless requires ad-ditional materials - books, computers)
High
Early Grade Reading Assess-ment teaching method
Low Some training, 0 once in place (unless requires ad-ditional materials - books, computers)
High
Mother tongue instruction Low once in place, costs relate to less economies of scale High
School proximity Very high (immediate), moderate (annualized)
Construction costs GMR, duration Theunynck (2002) High
Salaried teacher High to very high Bourdon and Nkengné-Nkengné (2007) estimate that civil servant teacher salaries, in Africa, are approxi-mately twice the salary of state-financed contract teachers (5.6 times GDP per capita vs. 2.8 times GDP per capita).
High
Conditional cash transfers High SEE: $27 Moderate
Eyeglasses Low $15, vision international provision of glasses in Chi-na, http://ageconsearch.umn.edu/bitstream/120032/2/WP12-2.pdf, here it is assumed that eyeglasses are kept for at least 2 years.
Moderate
Micronutrients Moderate School feeding costs around $20 on average (SEE) Moderate
Deworming Low $2.6 (SEE) Moderate
School report cards Low McEwan puts costs related to information / school based management below $2 per student
Moderate
Textbooks Low $4.68 SEE ($8.36 McEwan) Moderate
Textbook usage Low Close to 0 Moderate
taBlE H.2: interventions to improve learning – table of costs and sources
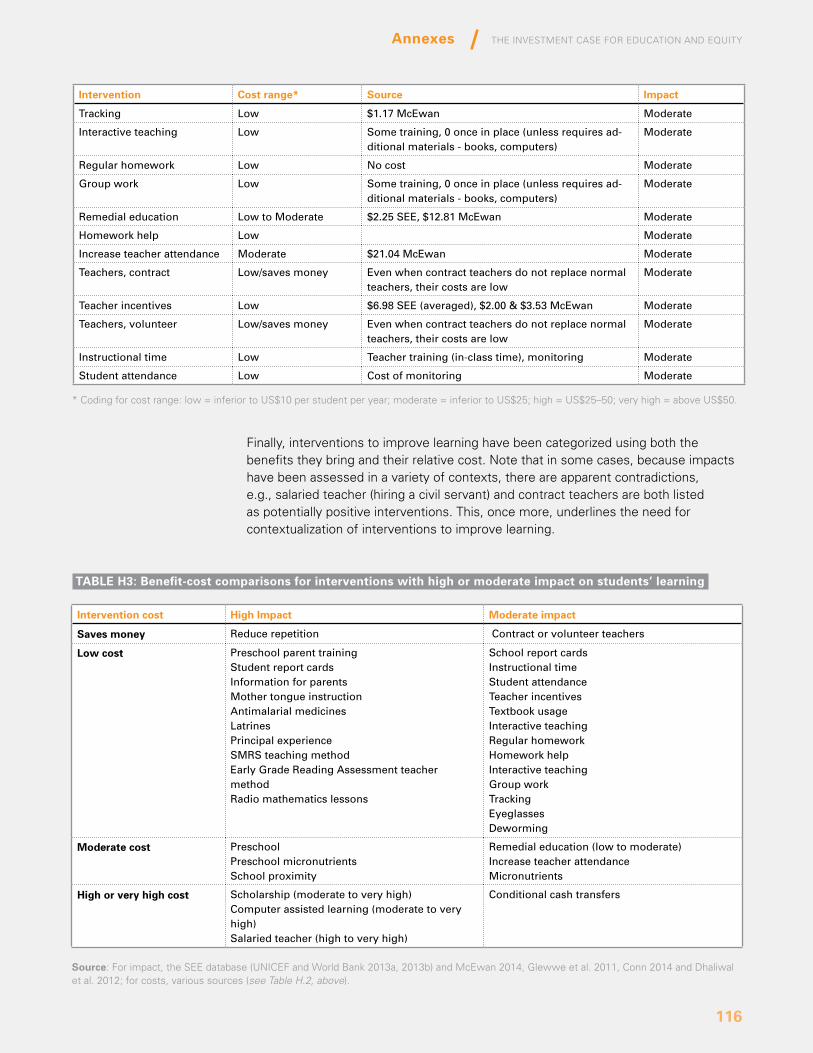
The InvesTmenT Case for eduCaTIon and equITy
116
Annexes
Finally, interventions to improve learning have been categorized using both the benefits they bring and their relative cost. note that in some cases, because impacts have been assessed in a variety of contexts, there are apparent contradictions, e.g., salaried teacher (hiring a civil servant) and contract teachers are both listed as potentially positive interventions. This, once more, underlines the need for contextualization of interventions to improve learning.
intervention cost range* Source impact
Tracking Low $1.17 McEwan Moderate
Interactive teaching Low Some training, 0 once in place (unless requires ad-ditional materials - books, computers)
Moderate
Regular homework Low No cost Moderate
Group work Low Some training, 0 once in place (unless requires ad-ditional materials - books, computers)
Moderate
Remedial education Low to Moderate $2.25 SEE, $12.81 McEwan Moderate
Homework help Low Moderate
Increase teacher attendance Moderate $21.04 McEwan Moderate
Teachers, contract Low/saves money Even when contract teachers do not replace normal teachers, their costs are low
Moderate
Teacher incentives Low $6.98 SEE (averaged), $2.00 & $3.53 McEwan Moderate
Teachers, volunteer Low/saves money Even when contract teachers do not replace normal teachers, their costs are low
Moderate
Instructional time Low Teacher training (in-class time), monitoring Moderate
Student attendance Low Cost of monitoring Moderate
* Coding for cost range: low = inferior to us$10 per student per year; moderate = inferior to us$25; high = us$25–50; very high = above us$50.
Source: For impact, the sEE database (unICEF and World Bank 2013a, 2013b) and mcEwan 2014, Glewwe et al. 2011, Conn 2014 and dhaliwal et al. 2012; for costs, various sources (see Table H.2, above).
taBlE H3: Benefit-cost comparisons for interventions with high or moderate impact on students’ learning
intervention cost High impact Moderate impact
Saves money Reduce repetition Contract or volunteer teachers
low cost Preschool parent trainingStudent report cardsInformation for parentsMother tongue instructionAntimalarial medicinesLatrinesPrincipal experienceSMRS teaching method Early Grade Reading Assessment teacher methodRadio mathematics lessons
School report cardsInstructional timeStudent attendanceTeacher incentivesTextbook usageInteractive teachingRegular homework Homework helpInteractive teachingGroup workTrackingEyeglassesDeworming
Moderate cost PreschoolPreschool micronutrientsSchool proximity
Remedial education (low to moderate)Increase teacher attendanceMicronutrients
High or very high cost Scholarship (moderate to very high)Computer assisted learning (moderate to very high)Salaried teacher (high to very high)
Conditional cash transfers
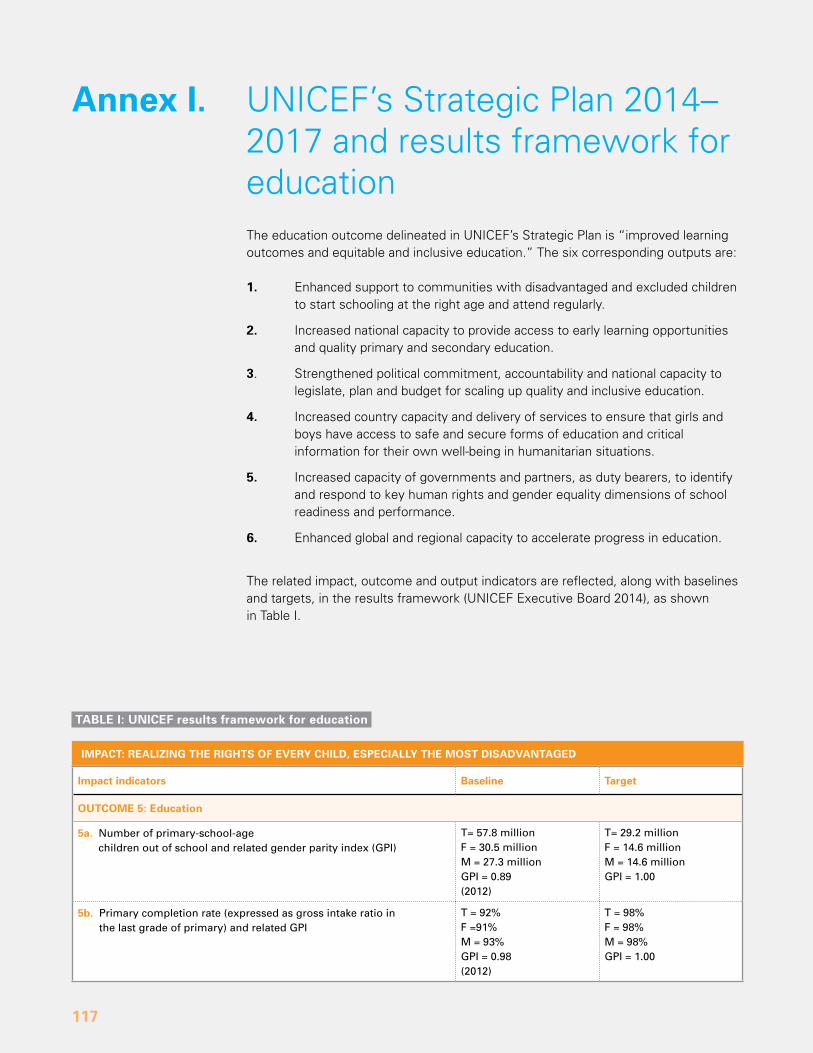
117
The education outcome delineated in unICEF’s strategic Plan is “improved learning outcomes and equitable and inclusive education.” The six corresponding outputs are:
1. Enhanced support to communities with disadvantaged and excluded children to start schooling at the right age and attend regularly.
2. Increased national capacity to provide access to early learning opportunities and quality primary and secondary education.
3. strengthened political commitment, accountability and national capacity to legislate, plan and budget for scaling up quality and inclusive education.
4. Increased country capacity and delivery of services to ensure that girls and boys have access to safe and secure forms of education and critical information for their own well-being in humanitarian situations.
5. Increased capacity of governments and partners, as duty bearers, to identify and respond to key human rights and gender equality dimensions of school readiness and performance.
6. Enhanced global and regional capacity to accelerate progress in education.
The related impact, outcome and output indicators are reflected, along with baselines and targets, in the results framework (unICEF Executive Board 2014), as shown in Table I.
annex i. unICEF’s strategic Plan 2014–2017 and results framework for education
taBlE i: unicEF results framework for education
impact indicators Baseline target
outcoME 5: Education
5a. Number of primary-school-age children out of school and related gender parity index (GPI)
T= 57.8 millionF = 30.5 millionM = 27.3 millionGPI = 0.89(2012)
T= 29.2 millionF = 14.6 millionM = 14.6 millionGPI = 1.00
5b. Primary completion rate (expressed as gross intake ratio in the last grade of primary) and related GPI
T = 92%F =91%M = 93%GPI = 0.98(2012)
T = 98%F = 98%M = 98%GPI = 1.00
iMPact: REaliZinG tHE RiGHtS oF EVERy cHild, ESPEcially tHE MoSt diSadVantaGEd
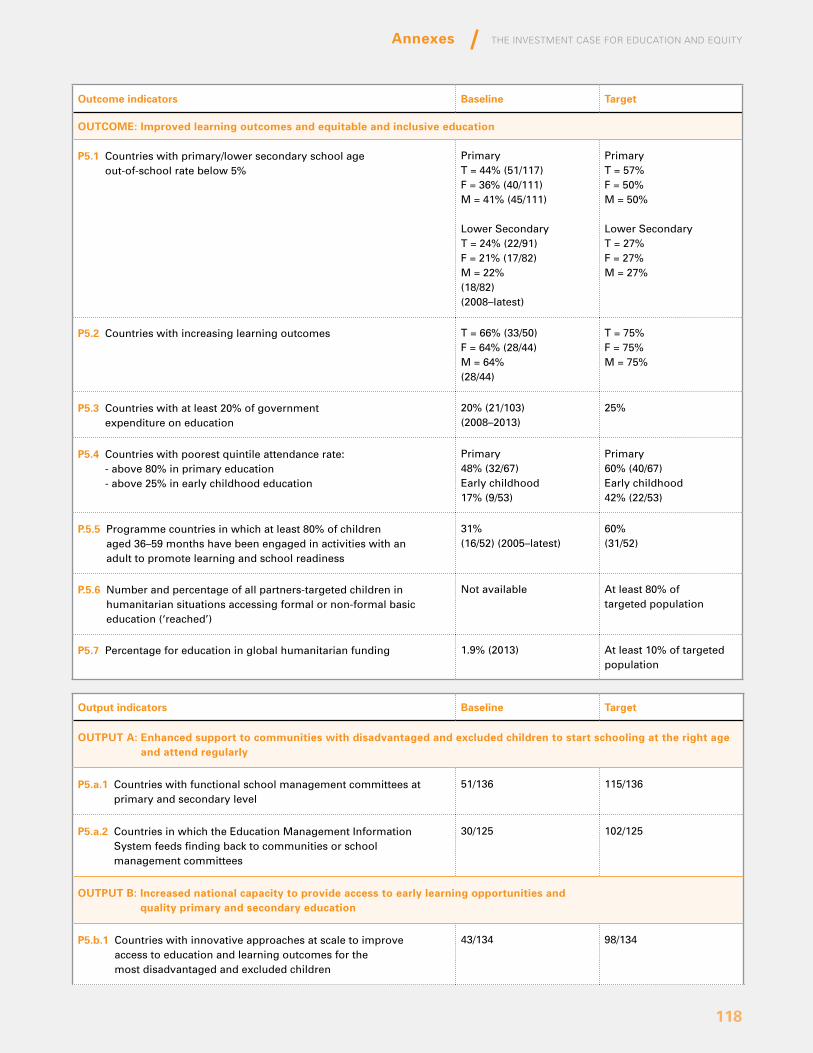
The InvesTmenT Case for eduCaTIon and equITy
118
Annexes
outcome indicators Baseline target
outcoME: improved learning outcomes and equitable and inclusive education
P5.1 Countries with primary/lower secondary school age out-of-school rate below 5%
PrimaryT = 44% (51/117)F = 36% (40/111)M = 41% (45/111)
Lower SecondaryT = 24% (22/91)F = 21% (17/82)M = 22%(18/82)(2008–latest)
PrimaryT = 57%F = 50%M = 50%
Lower SecondaryT = 27%F = 27%M = 27%
P5.2 Countries with increasing learning outcomes T = 66% (33/50)F = 64% (28/44)M = 64%(28/44)
T = 75%F = 75%M = 75%
P5.3 Countries with at least 20% of government expenditure on education
20% (21/103)(2008–2013)
25%
P5.4 Countries with poorest quintile attendance rate: - above 80% in primary education - above 25% in early childhood education
Primary48% (32/67)Early childhood17% (9/53)
Primary60% (40/67)Early childhood42% (22/53)
P.5.5 Programme countries in which at least 80% of children aged 36–59 months have been engaged in activities with an adult to promote learning and school readiness
31%(16/52) (2005–latest)
60%(31/52)
P.5.6 Number and percentage of all partners-targeted children in humanitarian situations accessing formal or non-formal basic education (‘reached’)
Not available At least 80% of targeted population
P5.7 Percentage for education in global humanitarian funding 1.9% (2013) At least 10% of targeted population
output indicators Baseline target
outPut a: Enhanced support to communities with disadvantaged and excluded children to start schooling at the right age and attend regularly
P5.a.1 Countries with functional school management committees at primary and secondary level
51/136 115/136
P5.a.2 Countries in which the Education Management Information System feeds finding back to communities or school management committees
30/125 102/125
outPut B: increased national capacity to provide access to early learning opportunities and quality primary and secondary education
P5.b.1 Countries with innovative approaches at scale to improve access to education and learning outcomes for the most disadvantaged and excluded children
43/134 98/134
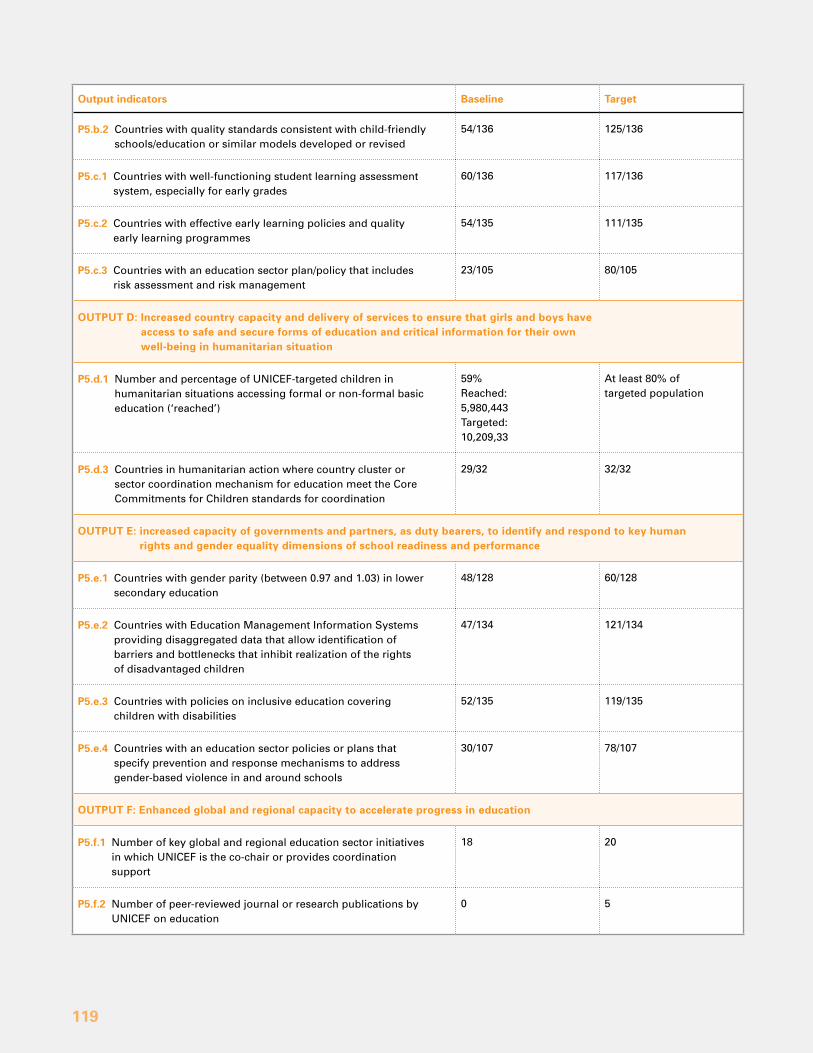
119
output indicators Baseline target
P5.b.2 Countries with quality standards consistent with child-friendly schools/education or similar models developed or revised
54/136 125/136
P5.c.1 Countries with well-functioning student learning assessment system, especially for early grades
60/136 117/136
P5.c.2 Countries with effective early learning policies and quality early learning programmes
54/135 111/135
P5.c.3 Countries with an education sector plan/policy that includes risk assessment and risk management
23/105 80/105
outPut d: increased country capacity and delivery of services to ensure that girls and boys have access to safe and secure forms of education and critical information for their own well-being in humanitarian situation
P5.d.1 Number and percentage of uNICEF-targeted children in humanitarian situations accessing formal or non-formal basic education (‘reached’)
59%Reached:5,980,443Targeted:10,209,33
At least 80% of targeted population
P5.d.3 Countries in humanitarian action where country cluster or sector coordination mechanism for education meet the Core Commitments for Children standards for coordination
29/32 32/32
outPut E: increased capacity of governments and partners, as duty bearers, to identify and respond to key human rights and gender equality dimensions of school readiness and performance
P5.e.1 Countries with gender parity (between 0.97 and 1.03) in lower secondary education
48/128 60/128
P5.e.2 Countries with Education Management Information Systems providing disaggregated data that allow identification of barriers and bottlenecks that inhibit realization of the rights of disadvantaged children
47/134 121/134
P5.e.3 Countries with policies on inclusive education covering children with disabilities
52/135 119/135
P5.e.4 Countries with an education sector policies or plans that specify prevention and response mechanisms to address gender-based violence in and around schools
30/107 78/107
outPut F: Enhanced global and regional capacity to accelerate progress in education
P5.f.1 Number of key global and regional education sector initiatives in which uNICEF is the co-chair or provides coordination support
18 20
P5.f.2 Number of peer-reviewed journal or research publications by uNICEF on education
0 5
120
references, bibliography*
* In order to serve as a readers’ resource, this list includes both references for in-text citations and bibliographical items consulted by the authors.
The InvesTmenT Case for eduCaTIon and equITy
121
References/bibliography
Abadzi, Helen. 2007. ‘Absenteeism and Beyond: Instructional time loss
and consequences’. Policy Research Working Paper, no. 4376. Washington, D.C.: World Bank.
Abadzi, Helen. 2009. ‘Instructional Time Loss in Developing Countries:
Concepts, measurement and implications’. World Bank Research Observer, vol. 24, no. 2 (August): 267–290.
Abadzi, Helen. 2011. ‘Reading Fluency Measurements in EFA FTI
Partner Countries: outcomes and improvement prospects’. GPE Working Paper Series on Learning, no. 1. Washington, D.C.: Education for All Fast Track Initiative Secretariat.
Akin, Mustafa Seref, and Vlad Valerica. 2011. ‘The Relationship between
Education and Foreign Direct Investment: Testing the Inverse u Shape’. European Journal of Economic and Political Studies, vol. 4, no. 1 (Summer): 27–46.
Altinok, Nadir. 2012. ‘A New International Database on the Distribution of
Student Achievement’. Background paper for the Education for All Global Monitoring Report 2012. Paris: united Nations Educational, Scientific and Cultural organization.
Arnold, Caroline, Kathy Bartlett, Saima Gowani, and Rehana Merali. 2006.
‘Is Everybody Ready? Readiness, transition and continuity – Lessons, reflections and moving forward’. Background paper prepared for the Education for All Global Monitoring Report 2007. Paris: united Nations Educational, Scientific and Cultural organization.
Balescut, Jill, and Kenneth Eklindh. 2006. ‘Historical perspective on education
for persons with disabilities’. Background paper for EFA Global Monitoring Report 2006. Paris: united Nations Educational, Scientific and Cultural organization.
Banerjee, Abhijit, Shawn Cole, Esther Duflo, and Leigh Linden. 2005.
‘Remedying Education: Evidence from two randomized experiments in India’. National Bureau of Economic Research Working Paper no. 11904. Quarterly Journal of Economics, vol. 122, no. 3 (November): 1,235–1,264. Cited in MIT Poverty Lab, 2005.
Bansagan, Kezia, and Hazel J. Panganiban. 2008. ‘The Impact of
Family Size on Children’s School Attendance in the Philippines’. Philippine Review of Economics, vol. 45, no. 2 (December): 202–234.
Barnett, Steven, W. 2008. ‘Preschool Education and Its Lasting Effects:
Research and Policy Implications’. Policy brief. Tempe, Ariz., and Boulder, Colo.: The Education and the Public Interest Center (EPIC) at the university of Colorado at Boulder and the Education Policy Research unit (EPRu) at Arizona State university.
Barro, Robert. J. 1991. ‘Economic Growth in a Cross-section of
Countries’, Quarterly Journal of Economics, vol. 106, no. 2 (May): 407–444.
Barro, Robert J., and Jong-Wha Lee. 2010. ‘A New Data Set of Educational
Attainment in the World, 1950–2010’. Working Paper, no. 15902. Cambridge, Mass.: National Bureau for Economic Research.
Barro, Robert J., and Jong-Wha Lee, www.barrolee.com, accessed from
The World Bank Development Indicators database, May 20, 2014.
Bassanini, Andrea, and Stefano Scarpetta. 2001. ‘The Driving Forces
of Economic Growth: Panel data evidence for the oECD countries’. oECD Economic Studies, no. 33 (II). organisation for Economic Co-operation and Development.
Becker, Gary S. 1964. Human Capital: A theoretical and empirical analysis,
with special reference to education. New york: National Bureau of Economic Research.
Bils, Mark, and Peter J. Klenow. 2000. ‘Does Schooling Cause Growth?’
American Economic Review, vol. 90, no. 5 (December): 1,160–1,183.
Bloom, David E., David Canning and Jaypee Sevilla. 2011. ‘Economic
growth and the demographic transition’. Working Paper no. 8685. Cambridge, Mass.: The National Bureau of Economic Research.
Bloom, David E., David Canning and Pia N. Malaney. 1999. ‘Demographic
Change and Economic Growth in Asia’. Working Paper no. 15. Cambridge, Mass.: Center for International Development, Harvard university.
Bourdon, Jean, and Alain Patrick Nkengné-Nkengné. 2007. ‘Les
enseignants contractuels: avatars
et fatalités de l’éducation pour tous’. Presentation at La professionnalisation des enseignants de l'éducation de base: les recrutements sans formation initiale. Sèvres, France. 11–15 June 2007.
Brossard, Mathieu, and Borel Foko. 2006. ‘Education’s Impact on
Economic Growth’. Washington, D.C. and Dakar: World Bank and uNESCo-Pôle de Dakar.
Bruns, Barbara, Deon Filmer and Harry Patrinos. 2011. Making Schools
Work: New evidence on accountability reforms. Washington, D.C.: World Bank.
Bruns, Barbara, Alain Mingat and Ramahatra Rakotamalala. 2003.
Achieving Universal Primary Education by 2015: A chance for every child. Washington, D.C.: World Bank.
Carr, David L., James R. Markusen and Keith E. Maskus. 2004. ‘Competition
for Multinational Investment in Developing Countries: Human Capital, Infrastructure, and Market Size’ in Challenges to Globalization: Analyzing the Economics, edited by Robert E. Baldwin and L. Alan Winters. Chicago: university of Chicago Press.
Chapman, Chris, Jennifer Laird and Angelina KewalRamani. 2012.
‘Trends in High School Dropout and Completion Rates in the united States: 1972–2009’. Washington, D.C.: National Center for Education Statistics, u.S. Department of Education.
Chaudhury, Nazmul, Jeffrey Hammer, Michael Kremer, Karthik
Muralidharan and F. Halsey Rogers. 2006. ‘Missing in Action: Teacher and health worker absence in developing countries’. Journal of Economic Perspectives, vol. 20, no. 1 (Winter): 91–116.
Cohen, Daniel, and Marcelo Soto. 2007. ‘Growth and Human Capital: Good
data, good results’. Journal of Economic Growth, vol. 12, no. 1 (March): 51–76.
Conn, Katherine. 2014. ‘Identifying Effective Education Interventions in
Sub-Saharan Africa: A meta-analysis of rigorous impact evaluations’. PhD dissertation. New york: Columbia university.
Consortium of Longitudinal Studies. 1983. As the twig is bent: lasting
122
effects of preschool programs. Hillsdale, N.J.: Erlbaum.
Crespo Cuaresma, Jesús, Wolfgang Lutz and Warren Sanderson. 2012. ‘Age
Structure, Education and Economic Growth’. Interim Report, no. IR-12-011. Laxenburg, Austria: Interna-tional Institute for Applied Systems Analysis.
Crouch, Luis, and Tazeen Fasih. 2004. ‘Patterns in Educational
Development: Implications for Further Efficiency Analysis’. unpublished manuscript provided by authors.
Crouch, Luis. 2012. ‘Quality, Equity Perspectives on ECE: Some
comments to frame the workshop’. Presentation at the High Level Technical Workshop on Improving the Quality of Early Childhood Education for All in the CEE/CIS Region (4–6 June). Athens: Global Partnership for Education.
de la Fuente, Angel, and Rafeal Doménech. 2006. ‘Human Capital
in Growth Regressions: How much difference does data quality make?’ Journal of the European Economic Association, vol. 4, no. 1 (March): 1–36.
de Walque, Damien, and Deon Filmer. 2011. ‘Trends and Socioeconomic
Gradients in Adult Mortality around the Developing World’. Policy Research Working Paper, no. 5716. Washington, DC: World Bank.
Dhaliwal, Iqbal, Esther Duflo, Rachel Glennerster and Caitlin Tulloch. 2012.
‘Comparative Cost-Effectiveness Analysis to Inform Policy in Developing Countries: A general framework with applications for education’. Cambridge, Mass.: Abdul Latif Jameel Poverty Action Lab, Massachusetts Institute of Technology.
Dollar, David and Aart Kraay. 2000. Growth Is Good for the Poor.
Washington D.C.: The World Bank.Duflo Esther, Pascaline Dupas and Michael Kremer. 2009. ‘Additional
Resources versus organizational Changes in Education: Experimental Evidence from Kenya’. unpublished manuscript from Abdul Latif Jameel Poverty Action Lab. Cambridge, Mass: Massachusetts Institute of Technology.
Edstats, http://data.uis.unesco.org/, accessed from the uNESCo Institute
for Statistics (uIS) March 2014. Education Policy and Data Center. www.epdc.org/data. Washington,
D.C.: FHI 360.Filmer, Deon. 2005. ‘Disability, Poverty and Schooling in Developing Coun-
tries: Results from 11 Household Surveys’. Social Protection Discus-sion Paper 0539. Washington, D.C.: The World Bank.
Fredriksen, Birger. 1981. ‘Progress towards regional targets for
universal primary education: A statistical review’. International Journal of Educational Development, vol.1, no.1 (April): 1¬–16.
Fredriksen, Birger. 1983. ‘The arithmetic of achieving universal primary
education’. International Review of Education, vol. 29, no. 2: 141–153.
Fredriksen, Birger, and Ruth Kagia. 2013. ‘Attaining the 2050 Vision for Africa:
Breaking the human capital barrier’. Global Journal of Emerging Market Economies, vol. 5, no. 3 (September): 269–328.
Gakidou, Emmanuela, Krycia Cowling, Rafael Lozano and Christopher J. L.
Murray. 2010. ‘Increased Educational Attainment and Its Effect on Child Mortality in 175 Countries between 1970 and 2009: A systematic analysis’. Lancet, vol. 376, no. 9745 (September): 959–974.
Glewwe, Paul W., Eric A. Hanushek, Sarah D. Humpage and Renato
Ravina. 2011. ‘School Resources and Educational outcomes in Developing Countries: A review of the literature from 1990 to 2010’. Working Paper, no. 17554. Cambridge, Mass.: National Bureau of Economic Research.
GMR (Education for All Global Monitoring Report). 2010.
‘Deprivation and Marginalization in Education’. www.unesco.org/new/fileadmin/MuLTIMEDIA/HQ/ED/GMR/html/dme-4.html. Paris: united Nations Educational, Scientific and Cultural organization.
GMR (Education for All Global Monitoring Report). 2011. ‘Education
in the key to lasting development’. http://www.unesco.org/fileadmin/MuLTIMEDIA/HQ/ED/GMR/pdf/gmr2010/MDG2010_Facts_and_ Figures_EN.pdf. Paris: united Nations Educational, Scientific and Cultural organization.
GMR (Education for All Global
Monitoring Report). 2013. ‘Children Still Battling to Go to School’. Policy Paper, no. 10. Paris: united Nations Educational, Scientific and Cultural organization.
GMR (Education for All Global Monitoring Report). 2014. ‘Aid Re-
ductions Threaten Education Goals’. Policy Paper, no. 13. Paris: united Nations Educational, Scientific and Cultural organization.
GPE (Global Partnership for Education). 2012. Results for Learning Report
2012: Fostering evidence-based dialogue to monitor access and quality in education. Washington, D.C.: Global Partnership for Education.
GPE (Global Partnership for Education). 2014. ‘Final Pledge Report:
Second Replenishment Pledging Conference’. Washington, D.C.: Global Partnership for Education.
Good, Roland H., Deborah C. Simmons and Sylvia B. Smith. 1998. ‘Effective
academic intervention in the united States: Evaluating and Enhancing the Acquisition of Early Reading Skills’. School Psychology Review, vol. 27, no.1: 45–56.
Government of the Gambia. 2011. ‘The Gambia Education Country
Status Report’, an education country status report’. Washington D.C.: The World Bank.
Gregorio, José de, and Jong-Wha Lee. 2002. ‘Education and Income
Distribution: New Evidence from Cross-country Data’, Review of Income and Wealth, vol. 48, no.3 (September): 395–416.
Hanushek Eric A., and Ludger Woessmann. 2007. Education Quality
and Economic Growth. Washington, D.C.: The World Bank.
Hanushek, Eric. A., and Ludger Woessmann. 2008. ‘The Role of
Cognitive Skills in Economic Development’. Journal of Economic Literature, vol. 46, no. 3 (September): 607–668.
Hanushek, Eric A., and Ludger Woessmann. 2012. ‘youth and Skills:
Putting Education to Work, GDP Projections’. Background paper for the Education for All Global Monitoring Report 2012. Paris: united Nations Educational, Scientific and Cultural organization.
Hanushek, Eric A., and Guido Schwerdt, Simon Wiederhold and Ludger
The InvesTmenT Case for eduCaTIon and equITy
123
References/bibliography
Woessmann. 2014. ‘Returns to Skills around the World: Evidence from PIAA’. Economics of Education Working Paper no. 4597. Munich: Center for Economic Studies, IFo Institute.
Hattori, Hiro. 2014. ‘Presentation on out-of-School Children’. New york:
united Nations Children’s Fund.Heckman, James J., and Peter J. Klenow. 1997. ‘Human Capital Policy’.
Chicago: university of Chicago. Heckman, James J., and Dimitriy V. Masterov. 2007. ‘The Productivity
Argument for Investing in young Children’. Review of Agricultural Economics, vol. 29, no. 3: 446–493.
Huong, Dao Lan, Hoang Van Minh, urban Janlert, Do Duc Van and
Peter Byass. 2006. ‘Socio-Economic Status Inequality and Major Causes of Death in Adults: A 5-year follow-up study in rural Vietnam’. Public Health, vol. 120, no. 6 (June): 497–504.
Hurt, L. S., C. Ronsmans, and S. Saha. 2004. ‘Effects of Education and other
Socioeconomic Factors on Middle Age Mortality in Rural Bangladesh’. Journal of Epidemiology & Community Health, vol. 58: 315–320.
Ingram, George, and Annababette Wils. 2009. ‘Global Education Trends
1970-2025: A brief review of data on ten key issues’. Washington, D.C.: Education Policy and Data Center, FHI 360.
(IMF) International Monetary Fund, oECD, united Nations and World
Bank. 2011. ‘Supporting the Development of More Effective Tax Systems: A report to the G-20 Development Working Group. Washington, D.C.: organisation for Economic Co-operation and Development.
Jaramillo, Adriana, and Alain Mingat. 2008. ‘Can Early Childhood Programs
be Financially Sustainable in Africa? Cited in Africa’s Future, Africa’s Challenge: Early Childhood Care and Development in Sub-Saharan Africa, edited by Marito Garcia, Alan Pence, and Judith L. Evans. Washington D.C.: The World Bank.
Kamano Pierre J., Rakotomalala Ramahatra, Bernard Jean-Marc,
Husson Guillaume, and Reuge Nicolas. 2010. ‘Les défis du système éducatif Burkinabè en appui à la croissance économique’. World Bank
Working Paper, no. 196. Washington, D.C.: The World Bank.
KC, Samir, and Harold Lentzner. 2010. ‘The Effect of Education on Adult
Mortality and Disability: A global perspective’. Vienna Yearbook of Population Research, vol. 8: 201–235.
Kravdal, Øystein. 2002. ‘Education and Fertility in Sub-Saharan Africa:
Individual and Community Effects’. Demography, vol. 39, no. 2 (May): 233–250.
Kremer, Michael, Nazmul Chaudhury, F. Halsey Rogers, Karthik
Muralidharan, and Jeffrey Hammer. 2005. ‘Teacher Absence in India: A snapshot’. Journal of the European Economic Association, vol. 3, no. 2–3 (April–May): 658–667.
Krueger, Alan B., and Mikael Lindahl. 2001. ‘Education for Growth: Why
and for whom?’ Journal of Economic Literature, vol. 39, no. 4 (December): 1,101–1,136.
Lange, Simon. 2014. ‘Projections to Zero’. Background paper prepared
for the Education for All Global Monitoring Report 2013/4. Paris: united Nations Educational, Scientific and Cultural organization.
Leathes, Bill, Roger Bonner, P. K. Das, Ripin Kalra and Nigel Wakeham.
2011. ‘Delivering Cost Effective and Sustainable School Infrastructure’. Guidance Note. London: united Kingdom Department for International Development.
Lewin, Keith M., and Ricardo Sabates. 2012. ‘Who gets what? Is improved
access to basic education pro-poor in Sub-Saharan Africa?’ International Journal of Educational Development, vol. 32, no. 4 (July): 517–528.
Lomborg, Bjørn, ed. 2013. How Much Have Global Problems Cost the
World? A scorecard from 1900 to 2050. Cambridge, uK: Cambridge university Press.
Lutz, Wolfgang, and KC Samir. 2011. ‘Human Capital: Integrating
Education and Population’. Science, vol. 333, no. 6042 (July); 587–592.
Lutz, Wolfgang, Anne Goujon, and Annababette Wils. 2003. ‘Forecasting
Human Capital using Demographic Multi-State Methods by Age, Sex, and Education to Show the Long-Term Effects of Investments in Education’. Working Paper WP-07-03. Washington, D.C.: Education Policy and Data Center, FHI 360.
Lutz, Wolfgang, Jesus Crespo Cuaresma, and Warren Sanderson. 2008.
‘The Demography of Educational Attainment and Economic Growth’. Science, vol. 319, no. 5866; 1047–1048.
Markusen, James, R. 2002. Multinational firms and the theory of international
trade. Cambridge, Mass.: MIT Press. Cited in Carr, 2004.
Majgaard, Kirsten, and Alain Mingat. 2012. ‘Education in Sub-Saharan
Africa: A comparative analysis’. Washington, D.C.: World Bank.
McEwan, Patrick J. 2014. ‘Improving Learning in Primary Schools of
Developing Countries: A meta- analysis of randomized experiments’. Review of Educational Research, vol. xx, no. x (october): 1–42.
Mincer, Jacob. 1994. Schooling, Experience, and Earnings.
New york: National Bureau of Economic Research.
Mingat, Alain. 2004. ‘La rémunération/ le statut des enseignants dans la
perspective de l’atteinte des objectifs du millénaire dans les pays d’Afrique subsaharienne francophone en 2015’. Washington, D.C. : The World Bank.
Mingat, Alain. 2013. ‘Technical Perspectives towards Revision of
the GPE Country Allocation Pattern’. Working Paper. Washington, D.C.: Global Partnership for Education Secretariat.
Mingat, Alain, and Shobhana Sosale. 2001. ‘Problèmes de politique
éducative relatifs au redoublement à l’école primaire dans les pays d’Afrique Sub-Saharienne’. Washington, D.C.: World Bank.
Mingat, Alain, and Jee-Peng Tan. 1996. ‘The Full Social Returns to
Education: Estimates based on countries’ economic growth performance’. Human Capital Development Working Paper, no. 73. Washington, D.C.: World Bank.
Ministry of Education and Sports, Cabo Verde. 2011. ‘Relatório do
Estado do Sistema Educativo Nacional (RESEN) Cabo Verde’. Praia: Government of Cape Verde.
Ministry of Primary and Secondary Education. 2014. ‘Situation de
l’allocation des enseignants aux établissements scolaires au Togo’. Lomé: Government of Togo.
Montenegro, Claudio, E., and Harry
124
Anthony Patrinos. 2013. ‘Returns to Schooling around the World’. Background Paper for the World Development Report 2013. Washington, D.C.: The World Bank.
Montenegro, Claudio E., and Harry Anthony Patrinos. 2014. ‘Comparable
Estimates of Returns to Schooling around the World’. Policy Research Working Paper, no. 7020. Washington, D.C.: World Bank.
Mostafa, Golam, and Jeroen K. van Ginneken. 2000. ‘Trends in and
Determinants of Mortality in the Elderly Population of Matlab, Bangladesh’. Social Science & Medicine, vol. 50, no. 6: 763–771.
Moreland, Scott, Ellen Smith Ellen, and Suneeta Sharma. 2010. ‘World
Population Prospects and unmet Need for Family Planning’. Revised october 2010. Washington, D.C.; Futures Group.
Mulkeen, Aidan. 2010. Teachers in Anglophone Africa: Issues in teacher
supply, training, and management. Washington, D.C.: The World Bank.
Mullis, Ina V.S., and Michael o. Martin, Pierre Foy, Alka Arora. 2012. ‘Trends
in International Mathematics and Study Science (TIMSS) 2011 International Results in Mathematics’. Chestnut Hill, Mass. and Amsterdam: TIMSS & PIRLS International Study Center, Lynch School of Education, Boston College and International Association for the Evaluation of Educational Achievement.
oECD (organisation for Economic for Economic Co-operation and
Development). 2011. ‘Growing Income Inequality in oECD Countries: What drives it and how can policy tackle it?’ oECD Forum on Tackling Inequality. Paris: organisation for Economic for Economic Co-operation and Development.
PASEC, CoNFEMEN. 1999. ‘Les facteurs de l’efficacité dans l’enseignement
primaire: les résultats du programme PASEC sur neuf pays d’Afrique et de l’océan Indien’. Dakar: CoNFEMEN.
PASEC, CoNFEMEN, 2004. ‘Le redoublement: pratiques et
conséquences dans l’enseignement primaire au Sénégal’. Dakar: CoNFEMEN.
PASEC, CoNFEMEN. 2011. ‘Synthèse des résultats PASEC VII, VIII et Ix.’
Dakar: CoNFEMEN. Patrinos, Harry Anthony, and George
Psacharopoulos. 2013. ‘Education: The income and equity loss of not having a faster rate of human capital accumulation’. In How Much Have Global Problems Cost the World? A scorecard from 1900 to 2050, edited by Bjørn Lomborg. Cambridge, uK: Cambridge university Press.
Pinnock, Helen. 2009. ‘Language and education: the missing link - How the
language used in schools threatens the achievement of Education for All’. Reading, uK: Save the Children and CfBT Education Trust.
Pôle de Dakar. 2002. ‘universal Primary Education: A Goal for All’. Statistical
Document for the Eighth Education Ministers’ Conference for African Countries. Dakar: uNESCo–BREDA.
Pôle de Dakar. 2005. ‘Education for All: Paving the way for action – Educa-
tion for All in Africa, Dakar + 5’. Dakar: uNESCo–BREDA.
Pôle de Dakar. 2006. ‘Eléments d’analyse du secteur éducatif au Togo’. Dakar:
uNESCo–BREDA.Pôle de Dakar. 2010a. ‘Eléments de Diagnostic du Système Educatif
Bissau-guinéen: Marges de Manoeuvre pour le Développement du Système Educatif dans une Perspective d’universalisation de l’Enseignement de Base et de Réduction de la Pauvreté’. Dakar: uNESCo–BREDA.
Pôle de Dakar. 2010b. ‘Rapport d’état sur le système éducatif national
mauritanien’. Dakar: uNESCo– BREDA.
Pôle de Dakar. 2011. ‘La question enseignante au Bénin: un diagnostic
holistique pour la construction d’une politique enseignante consensuelle, soutenable et durable’. Dakar: uNESCo–BREDA.
Pôle de Dakar. 2012a. ‘Les dépenses des ménages en éducation: une
perspective analytique et comparative pour 15 pays d’Afrique’. Dakar: uNESCo–BREDA.
Pôle de Dakar. 2012b. ‘Rapport d’état du système éducatif: Diagnostic du
système éducatif comorien pour une politique nouvelle dans le cadre de l’EPT’. Dakar: uNESCo–BREDA.
Pôle de Dakar. 2013. ‘Sao-Tomé et Principe: Rapport d’état du système
éducatif: une analyse sectorielle pour une amélioration de l’efficacité du système’. Dakar: uNESCo– BREDA.
Pôle de Dakar and the Government of Sierra Leone, the World Bank,
uNICEF, GPE, uIS. 2013. ‘Sierra Leone 2013: Education Country Status Report: An analysis for further improving the quality, equity and efficiency of the education system in Sierra Leone’. Dakar: uNESCo/Dakar - Pôle de Dakar
Pôle de Dakar Database. www.iipe-poledakar.org/en.
Dakar: International Institute for Educational Planning and united Nations Educational, Scientific and Cultural organization.
PPIu Education Department. 2014. ‘Balochistan Education Sector
Plan 2013-2018’. unpublished document made available to author. Quetta, Pakistan: Government of Balochistan.
Pritchett, Lant. 2006. ‘Does Learning to Add up Add up? The returns to
schooling in aggregate data’. In Handbook of the Economics of Education, vol. 1, edited by Eric Hanushek and Finis Welch. Amsterdam: North-Holland.
Psacharopoulos, George, and Harry Anthony Patrinos. 2004. ‘Returns to
Investment in Education: A further update’. Education Economics, vol. 12, no. 2 (August): 111–134.
Psacharopoulos, George, and Harry Anthony Patrinos. 2012. ‘Rates of
Return to Investment in Education: An international comparison’. Washington, D.C.: The World Bank.
Psacharopoulos, George 1994. ‘Returns to Investment in Education: A
global update’. World Development, vol. 22, no. 9: 1,325–1,343.
Qian, Nancy. 2005. ‘Quantity-Quality: The positive effect of family size
on school enrollment in China (Incomplete)’. Cambridge, Mass: Massachusetts Institute of Technology, Department of Economics.
Ravallion, Martin. 2001. ‘Growth, Inequality and Poverty: Looking
beyond averages’. Policy Research Working Paper, no. 2558. Washington D.C.: World Bank.
Read, Tony. 2014. ‘Where Have All the Textbooks Gone? The affordable
and sustainable provision of learning and teaching materials in sub-Saharan Africa – A guide to best and worst practices’. Washington, D.C.: World Bank.
The InvesTmenT Case for eduCaTIon and equITy
125
References/bibliography
Reinikka, Ritva, and Nathaneal Smith. 2004. ‘Public Expenditure Tracking
Surveys in Education’. Paris: International Institute for Educational Planning.
Rogers, F. Halsey, and Emiliana Vegas. 2009. ‘No More Cutting Class?
Reducing teacher absence and providing incentives for performance’. Policy Research Working Paper, no. 4847. Washington, D.C.: World Bank.
Romer, Paul M. 1994. ‘The origins of Endogenous Growth’. Journal of
Economic Perspectives, vol. 8, no. 1 (Winter): 3–22.
Ross, John, John Stover, and Demi Adalaja. 2005. `Profiles for Family
Planning and Reproductive Health Programs’, Second Edition. Washington, D.C.: Futures Group International.
Schultz, Theodore William. 1961. ‘Investment in Human Capital’.
American Economic Review, vol. 51 (March): 1–17.
Sedghi, Ami, George Arnett and Mona Chalabi. 2013. ‘Pisa 2012 Results:
Which Country Does best at reading, maths and science?’ The Guardian, 3 December. http://www.theguardian.com/news/datablog/2013/dec/03/pisa-results-country-best-reading-maths-science.
Sianesi, Barbara, and John Van Reenen. 2003. ‘The Returns to
Education: Macroeconomics’. Journal of Economic Surveys, vol. 17, no. 2 (April): 157–200.
Steer, Liesbet, Fazle Rabbani, and Adam Parker Adam. 2014. ‘Primary
Education Finance for Equity and Quality: An analysis of past success and future options in Bangladesh’. Working Paper, no. 3. Washington, D.C.: The Brookings Institution.
Theunynck, Serge. 2002. ‘School construction in developing countries,
what do we know?’ http://www.sheltercentre.org/sites/default/files/Theunynck%20(2002)%20School%20Construction%20in%20Develop-ing%20Countires.pdf.
Theunynck, Serge 2009. School Construction Strategies for universal
Primary Education in Africa: Should communities be empowered to build their own schools? Washington, D.C.: World Bank.
Thomas, Milan, and Nicholas Burnett. 2013. ‘Exclusion from Education:
The economic cost of out of school children in 20 countries.’ Washington, D.C.: Results for Development.
Thomas, Vinod, Wang yan, and Fan xibo. 2002. ‘A New Dataset on
Inequality in Education: Gini and Theil indices of schooling for 140 Countries, 1960-2000’. Revised october 25, 2002. Washington, D.C.: The World Bank.
Topel, Robert 1999. ‘Labor Markets and Economic Growth’ in Handbook
of Labor Economics, edited by orley Ashenfelter and David Card. Amsterdam: North Holland. Cited in Patrinos and Psacharopoulos, 2004.
uIS (uNESCo Institute for Statistics). 2012. ‘Reaching out-of-School
Children is Crucial for Development’. Fact Sheet, no. 18. Paris: united Nations Educational, Scientific and Cultural organization.
uIS and GMR (uNESCo Institute for Statistics and Education for All
Global Monitoring Report). 2013. ‘Schooling for Millions of Children Jeopardized by Reductions in Aid’. Policy Paper, no. 09. Montreal: united Nations Educational, Scientific and Cultural organization.
uIS and GMR (uNESCo Institute for Statistics and Education for All
Global Monitoring Report). 2014. ‘Progress in Getting All Children to School Stalls but Some Countries Show the Way Forward’. Policy Paper, no. 14/Fact Sheet, no. 28. Montreal: united Nations Educational, Scientific and Cultural organization.
uIS Data Centre. 2014. www.uis.unesco. org/datacentre/pages/default.aspx.
Montreal: uNESCo Institute for Statistics.
uNDP (united Nations Development Programme). 2009. Les Objectifs
du Millénaire pour le développement au Bénin: situation actuelle et perspectives. Cotonou, Benin: united Nations Development Programme.
uNDP (united Nations Development Programme). 2010. What Will It
Take To Achieve the Millennium Development Goals? An international assessment. New york: united Nations Development Programme.
uNDP (united Nations Development Programme). 2011. Towards Human
Resilience: Sustaining MDG progress in an age of economic uncertainty. New york: united Nations Development Programme.
uNESCo (united Nations Educational, Scientific and Cultural
organization). 2007. Education for All Global Monitoring Report 2007: Strong foundations – Early childhood care and education. Paris: united Nations Educational, Scientific and Cultural organization.
uNESCo (united Nations Educational, Scientific and Cultural
organization). 2010a. Education for All Global Monitoring Report 2010: Reaching the marginalized. Paris and oxford, uK: united Nations Educational, Scientific and Cultural organization and oxford university Press.
uNESCo (united Nations Educational, Scientific and Cultural organization).
2010b. ‘Methodological Guide for the Analysis of Teacher Issues.’ Paris: united Nations Educational, Scientific and Cultural organization.
uNESCo (united Nations Educational, Scientific and Cultural organization).
2014. Education for All Global Monitoring Report 2013/4: Teaching and learning – Achieving quality for all. Paris: united Nations Educational, Scientific and Cultural organization.
uNESCo, uNICEF (united Nations Educational, Scientific and Cultural
organization, united Nations Children’s Fund) The World Bank and the Global Partnership for Education. 2014. Education Sector Analysis Methodological Guidelines. Sector-Wide Analysis, with Emphasis on Primary and Secondary Education. New york: united Nations Children’s Fund.
united Nations office of the Special Representative of the Secretary-
General for Children and Armed Conflict and uNICEF. 2009. ‘Machel Study 10-year Strategic Review: Children and conflict in a changing world’. New york: united Nations Children’s Fund.
(uNHCR) united Nations High Commissioner for Refugees. 2014.
‘War’s Human Costs: uNHCR Global Trends 2013’. Geneva: united Nations High Commissioner for Refugees.
uNICEF. 2010. ‘Protecting Salaries of Frontline Teachers and Health
Workers’. Social and Economic Policy Working Briefs. New york: united Nations Children’s Fund.
126
uNICEF. 2014. ‘Education, Peacebuilding, and Resilience’. Background Paper: Kathmandu Resilience Workshop.
New york: united Nations Children’s Fund.
uNICEF Executive Board. 2013. The UNICEF Strategic Plan, 2014–2017:
Realizing the rights of every child, especially the most disadvantaged (E/ICEF/2013/21). New york: united Nations Economic and Social Coun-cil.
uNICEF Executive Board. 2014. Final Results Framework of the UNICEF Strategic Plan, 2014–2017 (E ICEF/ 2014/8). New york: united Nations
Economic and Social Council.uNICEF office of Research – Innocenti. 2014. ‘Children of the Recession:
The impact of the economic crisis on child well-being in rich countries’. uNICEF Innocenti Report Card, no. 12. Florence, Italy: united Nations Children’s Fund.
uNICEF and uIS (united Nations Children’s Fund and uNESCo
Institute for Statistics). 2005. Children out of School: Measuring exclusion from primary education. Montreal: uNESCo Institute for Statistics.
uNICEF and uIS (united Nations Children’s Fund and uNESCo
Institute for Statistics). 2013a. Global Initiative on Out-of-School Children: Democratic Republic of the Congo National survey on the situation of out-of-school children and adolescents.
uNICEF and uIS (united Nations Children’s Fund and uNESCo
Institute for Statistics). 2013b. out-of-School Children in the Balochistan, Khyber Pakhtunkhwa, Punjab and Sindh Provinces of Pakistan’. Islamabad: uNICEF Pakistan Country office. Kinshasa: united Nations Children’s Fund and uNESCo Institute for Statistics.
uNICEF and uIS (united Nations Children’s Fund and uNESCo
Institute for Statistics). 2014a. Global Initiative on Out-of-School Children: Eastern and Southern Africa regional report. Nairobi: united Nations Children’s Fund and uNESCo Institute for Statistics.
uNICEF and uIS (united Nations Children’s Fund and uNESCo
Institute for Statistics). 2014b. `Global Initiative on out-of-School Children: South Asia regional study
covering Bangladesh, India, Pakistan and Sri Lanka’. Kathmandu: uNICEF Regional office for South Asia.
uNICEF and uIS. 2014c. Global Initiative on Out-of-School Children: Regional
report for West and Central Africa. Dakar: united Nations Children’s Fund and uNESCo Institute for Statistics.
uNICEF and World Bank. 2013a. ‘Simulation for Equity in Education
(SEE): Background, methodology and pilot results’. New york: united Nations Children’s Fund.
uNICEF and World Bank, 2013b, ‘Simulations for Equity in Education
(SEE): Model description and user’s guide’. New york: united Nations Children’s Fund.
united Nations. 1948. Universal Declaration of Human Rights.
New york: united Nations.united Nations General Assembly. 2005. ‘In larger freedom: towards
development, security and human rights for all’. Report of the Secretary General. New york: united Nations General Assembly.
united Republic of Tanzania Ministry of Education and Vocational Training
and Pôle de Dakar. 2011. Beyond Primary Education, the Quest for Balanced and Efficient Policy Choices for Human Development and Economic Growth. Dakar: uNESCo– BREDA.
uNRWA (united Nations Relief and Works Agency for Palestinians in
the Near East). 2014. ‘uNRWA in Figures’. Jerusalem: united Nations Relief and Works Agency.
van Ginkel, Agatha. 2012. ‘Mother Tongue Instruction’. Presentation
at All Children Reading Workshop. Kigali. 1 March 2012.
WHo (World Health organization) and World Bank. 2011. World Report on
Disability. Geneva: World Health organization.
WIDE (World Inequality Database on Education).
www.education-inequalities.org. Paris: united Nations Educational, Scientific and Cultural organization.
World Bank. 2003a, World Development Report 2004: Making services work
for poor people. oxford, uK and Washington D.C.: oxford university Press and The World Bank.
World Bank. 2003b. ‘Rapport d’état du système éducatif national
Camerounais : Eléments de diagnostic pour la politique éducative dans le contexte de l’EPT et du DSRP’. Washington, D.C.: The World Bank.
World Bank. 2005. ‘Le système éducatif Guinéen: Diagnostic et perspectives
pour la politique éducative dans le contexte de contraintes macroéconomiques fortes et de réduction de la pauvreté’. Africa Region Human Development Working Paper Series. Washington, D.C.: The World Bank.
World Bank. 2007a. ‘Le système éducatif Burundais: Diagnostic et perspectives
pour une nouvelle politique éducative dans le contexte de l’éducation primaire gratuite pour tous’. Africa Human Development Working Paper Series. Washington, D.C: The World Bank.
World Bank. 2007b. ‘Le système éducatif Tchadien: Eléments de diagnostic
pour une politique éducative nouvelle et une meilleure efficacité de la dépense publique’. Africa Human Development Working Paper Series. Washington, D.C: The World Bank.
World Bank. 2008a. ‘Le système éducatif Centrafricain: Contraintes et marges
de manœuvre pour la reconstruction du système éducatif dans la perspective de la réduction de la pauvreté’. Africa Human Development Working Paper Series. Washington, D.C: The World Bank.
World Bank. 2008b. ‘Eléments de diagnostic du système éducatif
Malagasy: Le besoin d’une politique éducative nouvelle pour l’atteinte des objectifs du millénaire et de la réduction de la pauvreté’. Working Paper, no. 59103. Washington, D.C: The World Bank.
World Bank. 2009. ‘Le système éducatif Béninois: Analyse sectorielle
pour une politique éducative plus équilibrée et efficace. Africa Human Development Working Paper Series. Washington, D.C: The World Bank.
World Bank. 2010a. ‘Les défis du système éducatif Burkinabé en appui
à la croissance économique’. Africa Human Development Working Paper Series. Washington, D.C: The World Bank.
World Bank. 2010b. ‘The Education System in Malawi’. Working Paper,
no. 182, World Bank, Washington, DC.
World Bank. 2010c. ‘Le système éducatif Congolais: Diagnostic pour
une revitalisation dans un contexte macroéconomique plus favorable’. Africa Human Development Working Paper Series. Washington, D.C: The World Bank.
World Bank. 2010d. ‘Le système éducatif Malien: Analyse sectorielle
pour une amélioration de la qualité et de l’efficacité du système’. Africa Human Development Series, Working Paper, no. 198. Washington, D.C: The World Bank.
World Bank. 2011a. The Gambia Education Country Status Report.
Washington, D.C.: The World Bank.World Bank, 2011b, World Development Report 2011: Conflict, Security,
and Development. Washington, D.C.: The World Bank.
World Bank. 2011c. ‘Le système éducatif de la Côte d’Ivoire:
Comprendre les forces et les faiblesses du système pour identifier les bases d’une politique nouvelle et ambitieuse’. Africa Human Development Working Paper Series. Washington, D.C: The World Bank.
World Bank. 2011d. Rwanda Education Country Status Report: Toward
quality enhancement and achievement of universal nine year basic education: An education system in transition, a nation in transition. Washington, D.C.: The World Bank.
World Bank. 2013. ‘uganda: Public Expenditure Tracking Survey
(Education)’. Washington, D.C.: The World Bank.
The World Bank. 2015. Learning in the Face of Adversity: The uNRWA
Education Program for Palestine Refugees. Washington DC: The World Bank.
The InvesTmenT Case for eduCaTIon and equITy
128
References/bibliography
the investment case for Education and Equity
Published by unICEFEducation section, Programme division3 united nations Plazanew york, ny 10017, usa
www.unicef.org/publications
© united nations Children Fund (unICEF)January 2015


![Capital Mkt[1].(Equity Investment)](https://img.dokumen.tips/doc/110x75/577ce7921a28abf103957414/capital-mkt1equity-investment.jpg)