Embed Size (px)
Citation preview
The interrelationships between REIT capital
structure and investment
Jamie Alcock and Eva Steiner*
Department of Land Economy, University of Cambridge
Abstract
We explore the interdependence of investment and financing choices in US listedReal Estate Investment Trusts (REITs) in the period 1973-2011. We find that theinvestment and financing choices of REITs are interdependent, but they are notmade simultaneously. Our results suggest that investment determines leverage, butleverage has no apparent effect on investment decisions. The fundamental role ofinvestments for the financial success of the firm in the REIT business model leadsmanagers to prioritise the investment decision over the leverage decision. Conversely,the debt-overhang conflict between shareholders and debt holders that theoreticallydrives the reverse influence of leverage on the optimal investment policy does notappear to filter through to the actual investment choices of REITs. Our findingssuggest that REIT managers utilise the maturity dimension of capital structure tomitigate potential investment distortions and ensure that investment remains on itsvalue-maximising path. We also present novel evidence on the role of investmentsin driving a wedge between REIT target leverage and actual leverage levels, and onthe interplay of investments and leverage adjustments towards the target ratio inexplaining REIT capital structure dynamics.
- WORK IN PROGRESS -DO NOT CITE OR QUOTE WITHOUT PERMISSION
Key words: Agency conflict, capital structure, leverage, maturity, investment,REITs
∗ Corresponding Author: Department of Land Economy, University of Cambridge,19 Silver Street, Cambridge CB3 9EP, United Kingdom, [email protected]
Preprint submitted to 17 December 2013
1 Introduction
In any given period, the managers of Real Estate Investment Trusts (REITs) have
to choose a level of investment and how to fund this investment. They can begin by
considering the capital structure in place and then choose the level of investment
conditional on the capital available. Alternatively, managers can identify suitable
investment projects and then determine the appropriate capital structure to fund
these investment projects. A priori, it is unclear whether the investment decision or
the capital structure decision should take priority as both choices arguably have a
significant impact on firm value. Childs, Mauer, and Ott (2005) argue that lever-
age distorts the optimal exercise policy of growth options and that these distortions
may result in under- or over-investment, depending on the nature of the investment
opportunity. From this perspective, capital structure determines investment. In con-
trast, Lambrecht and Myers (2013) argue that managers choose leverage to keep
investment on its optimal path in order to maximise the utility of the rents that
they extract as a function of the income generated from the firm’s investments. In
this framework, capital structure follows investment.
If REIT managers follow the prediction in Childs, Mauer, and Ott (2005) and priori-
tise the leverage decision, then this reflects a conflict of interest between shareholders
and debt holders. In this framework, REITs are likely to underinvest in projects that
expand the firm’s asset base as equity holders have to bear the full cost of the project
but have to share the benefits of the investment with debt holders. Conversely, RE-
ITs are likely to over-invest in projects that facilitate the shifting of risk to debt
holders, that is, where a riskier new asset substitutes for a safer asset in place.
If, on the other hand, REIT managers follow the argument in Lambrecht and Myers
(2013) and prioritise the investment decision, then this reflects an agency conflict
between shareholders and managers. From this perspective, the leverage choice rep-
resents the residual parameter in managerial decisions. Managers are primarily in-
terested in maximising the rents they receive from the firm. Therefore, they focus on
implementing an optimal investment policy that maximises these rents. They choose
leverage to facilitate the implementation of this optimal policy. In this framework,
the question of optimal capital structure is of secondary importance. Empirically,
the direction of this relationship between investment and leverage choices therefore
offers insight into the question of which conflict of interest has the greater impact
on managerial decisions in REIT investment and capital structure choices.
2

The REIT sector provides an especially suitable field to study the interactions of
investment and capital structure choices due to the REIT regulation. In principle,
managers of industrial firms have to choose the level of dividend pay-out in addition
to investment and capital structure. For REITs, dividend payout is exogenously de-
termined by regulation. 1 As the sources and uses of capital must balance in every
period (Lambrecht and Myers, 2013), and as dividend pay-out is exogenously deter-
mined, identification of the interactions between investment and capital structure is
significantly more straight-forward for REITs than for industrial firms.
However, examining the interaction between leverage and investment in REITs
does not remove all endogeneity concerns. First, capital structure choices are multi-
dimensional (Alcock, Finn, and Tan, 2012; Barclay, Marx, and Smith, 2003; Johnson,
2003; Leland and Toft, 1996). These choices encompass leverage and debt maturity,
introducing a simultaneity bias. Further, as per the propositions in Childs, Mauer,
and Ott (2005) and Lambrecht and Myers (2013), the direction of the interaction
between leverage and investment is unclear. In addition, leverage and investment
choices may be simultaneously determined. Therefore, we estimate a system of equa-
tions using 3SLS regression. In order to identify the system, we determine a set of
instruments for debt maturity and investment. Our approach allows us to explore the
interrelationships between leverage and investment while simultaneously accounting
for the multi-dimensionality of capital structure by explicitly modelling maturity.
Consistent with Lambrecht and Myers (2013), we find that REIT investment influ-
ences leverage, but not vice versa. REIT managers appear to be more sensitive to the
investment decision than the capital structure choice. The REIT business model re-
lies on generating value from investing in real properties (Boudry, Kallberg, and Liu,
2010), placing the investment decision at the core of the REIT’s financial success.
Real estate assets are large, heterogenous, lumpy and characterised by low liquidity
(Harrison, Panasian, and Seiler, 2011). Transactions may thus be less frequent and
investment opportunities may arise in an irregular fashion. At the same time, the
REIT model requires a certain scale in order to achieve diversification given the
high levels of idiosyncratic risk embedded in the heterogenous, lumpy underlying
assets (Ball and Glascock, 2005). Consequently, REIT managers with the financial
flexibility to optimally respond to an investment opportunity when it arises are in a
superior position to enhance firm value and thereby increase the rents they receive.
1 The REIT regulation in different countries differs slightly, but all require an overwhelming majority ofnet income to be distributed as dividends. For example, in the USA REITs are required to pay out 90% ofnet income as dividends.
3
On the other hand, leverage may have a relatively weaker impact on REIT firm
value. The tax exemption of REITs reduces the value of the tax shield benefits of
debt (Howe and Shilling, 1988). The secure nature of real estate cash flows facilitates
redeployment in the event of bankruptcy and thus reduces financial distress costs
(Williamson, 1988). The simple REIT business model further limits agency costs that
may reduce firm value unless REITs employ leverage to mitigate the underlying
conflicts (Boudry, Kallberg, and Liu, 2010). As a result, the costs of sub-optimal
capital structure may be lower for REITs. If the consequences of sub-optimal capital
structure are less severe, then the pursuit of an optimal capital structure becomes a
secondary priority relative to the implementation of an optimal investment policy.
Our findings suggest that the fundamental role of investments for the financial suc-
cess of the REIT leads REIT managers to prioritise the investment decision over
the leverage decision. Conversely, the agency conflict between shareholders and debt
holders that drives the theoretical influence of leverage on the exercise policy of
growth options (Childs, Mauer, and Ott, 2005) does not appear to filter through
to actual investment choices. Our findings suggest that REIT managers adjust debt
maturity, rather than leverage, to mitigate the conflict between shareholders and
debt holders that potentially results in investment distortions and thus ensure that
investment remains on its optimal path.
Our findings contribute to several dimensions of the debate about REIT leverage
choices. The firm characteristic-based trade-off between the costs and benefits of
leverage suggests low incentives for REITs to use leverage and is at odds with the
empirical observation of persistently high levels of leverage in REITs (Harrison,
Panasian, and Seiler, 2011). The view of leverage as a residual variable employed as
a means of absorbing the implications of investment choices may consequently offer
a rational alternative explanation why REITs hold significant levels of leverage.
Our results also offer insight into the question why REIT leverage tends to exceed the
levels predicted by the static trade-off theory on the basis of the firm characteristics
that proxy for the various costs and benefits of leverage (Harrison, Panasian, and
Seiler, 2011). Specifically, we find that managerial efforts to optimise investment
drive a wedge between actual leverage and its static target. Consistent with the
focus on firm value, REIT managers also appear reluctant to adjust capital structure
back to its target if this risks diluting measures of firm value and performance
(Hovakimian, Opler, and Titman, 2001).
4
Further, most existing studies of multidimensional REIT financing choices consider
static leverage levels. 2 However, Graham and Leary (2011) report that within-firm
variation in leverage through time accounts for almost half of the total variation in
leverage on an industry-level. In this context, we find that investment is a significant
driver of changes in leverage. However, we also find that the deviation from target
leverage is significantly related to leverage dynamics. Our finding suggests that REIT
managers, while focusing on optimal investment, are also concerned about maintain-
ing a certain target level of leverage. This concern may reflect efforts to maintain
a certain target level of debt rating as proposed in Brown and Riddiough (2003).
Our findings therefore also establish original evidence on drivers of REIT leverage
dynamics.
From the perspective of managers, our results suggest that leverage may be used
to facilitate the implementation of the firm’s optimal investment policy and thus
enhance firm value. The multi-dimensionality of capital structure, especially the
maturity choice, allows managers to mitigate potential distortion effects that lever-
age in place may have on investment. From the point of view of investors, our results
imply that high levels of leverage in REITs are not necessarily a sign of inefficient
capital management.
2 Data and method
We examine all listed US REITs on Compustat (SIC Code 6798) from 1973, the
first year when Compustat offers the full range of data we require, to 2011. We
remove mortgage REITs (GIC Sub-industry 40402030). All firm data is obtained
from Compustat. Individual stock and market return data is from CRSP . Bond
yields are from the Federal Reserve Bank of St. Louis’s Economic Database.
We exclude firms with missing observations and firm observations where the ratio
of long-term debt to all debt lies outside [0,1]. Further, we winsorise all variables
except dummy variables and the median leverage ratio of the sample firms’ SIC
2-digit group at the 1st and 99th percentiles to control for any undue influence of
outliers.
Leverage is measured as the ratio of total debt to market value of assets, following
Billett, King, and Mauer (2007); Byoun (2008); Datta, Iskandar-Datta, and Raman
2 See, for instance, Alcock, Steiner, and Tan (2012); Ghosh, Giambona, Harding, and Sirmans (2011);Giambona, Harding, and Sirmans (2008).
5
(2005); Stohs and Mauer (1996). The rate of investment is the ratio of the change
in book capital from t− 1 to t plus depreciation over the beginning-of-period book
capital, where book capital is the book value of long-term debt, short-term debt,
measured as debt in current liabilities or, if missing, current liabilities, and common
equity, consistent with Fama and French (1999); Ott, Riddiough, and Yi (2005).
Given these variable definitions, we expect an inverse relationship between invest-
ments and leverage. This anticipated inverse relationship reflects that investments
are typically less than fully levered. The rate of investment is the annual change in
book capital over the value of book capital at the beginning of the year. Leverage
is the ratio of total debt relative to the market value of the assets at the end of
the year. Investments undertaken in the course of the year increase the value of the
assets at the end of the year. If these investments are less than fully levered, then
their contribution to the value of the assets is greater than the increase in debt taken
on to carry out these investments. This disproportionate increase in the value of the
assets relative to the value of the debt then generates an inverse relationship between
investments and leverage. As a result, if investments drive leverage, then we expect
a negative coefficient on the investment variable in the estimation of leverage.
Furthermore, we use the ratio of long-term debt (debt due after three years) to
total debt as a proxy for debt maturity, following Barclay, Marx, and Smith (2003).
The measurement of debt maturity varies in the literature, but Scherr and Hulburt
(2001) report that different measures have little impact on empirical results. See
Table 1 for details on variable definitions.
[Insert Table 1 about here.]
The estimation of leverage and investment
We estimate a 3SLS system of equations to explore the interactions in the choices of
firm leverage and investment, controlling for the endogenous determination of debt
6

maturity. We estimate the following system of equations:
Levit = β0,it + β1Invit + β2Matit + β3MBit + β4Abearnit + β5LnSizeit (1)
+ β6V olit + β7Dnolit + β8Profitit + β10Ditcit + β11Fait + uit
Invit = γ0,it + γ1Levit + γ2Matit + γ3MBit + γ4Retainedit + γ5Cashit (2)
+ γ6LnAgeit + γ7Equit + γ8Debtit + vit
Matit = δ0,it + δ1Levit + δ2Invit + δ3MBit + δ4Abearnit + δ5LnSizeit (3)
+ δ6V olit + δ7LnAmatit + δ8Dratedit + δ9Termit + eit
where uit, vit and eit are the residuals. The controls in (1) represent proxies for the
standard determinants of leverage, as discussed for instance in Harrison, Panasian,
and Seiler (2011). The variable MB is the market-to-book ratio. Abearn is abnormal
earnings. LnSize is the natural log of firm size. V ol is earnings volatility. Dnol is a
dummy for the presence of losses carried forward. Profit is firm profitability. Ditc
is a dummy for investment tax credits. Fa is the fixed assets ratio. See Table 2 for
details on variable definitions.
[Insert Table 2 about here.]
The identification of the system requires the choice of excluded instruments for the
endogenous variables. The instruments for the rate of investment (Inv) in (2) are
retained earnings (net of dividends) to total assets (Retained), cash to total assets
(Cash) and dummies for the presence of debt issues (Debtissue) or equity issues
(Equissue), following Riddiough and Wu (2009). In (3), the excluded instruments
for debt maturity (Mat) are the log of asset maturity (LnAmat), a dummy for the
presence of debt ratings (Drated) and the term structure (Brick and Ravid, 1985;
Diamond, 1991; Myers, 1977; Sharpe, 1991; Titman, 1992). These variables pass the
tests for relevant, strong and valid instruments.
The variables Dnol, Profit, MB, LnSize, Ret and Cash are measured at the fiscal
year-end prior to the year in which the dependent variable is measured (Billett,
King, and Mauer, 2007; Datta, Iskandar-Datta, and Raman, 2005; Johnson, 2003;
Riddiough and Wu, 2009). We include year fixed effects in (3) to capture the effect
of latent macroeconomic factors (Korajczyk and Levy, 2003).
The 3SLS model allows us to account for the dependence between regressors and the
error terms arising from endogeneity concerns as well as for potential cross-equation
7
correlation of the errors driven by the possible interactions between leverage, in-
vestment and maturity. In such a modelling situation, and if the error terms are
homoskedastic, 3SLS is a more efficient estimator than 2SLS (Greene, 2002). We
test for heteroskedastic errors using the Pagan and Hall (1983) test of heteroskedas-
ticity for instrumental variables estimation.
For robustness, we re-estimate Equations (1) to (3) but replace the levels of the main
variables of interest with their first differences. This specification allows a marginal
perspective on the relationships between leverage, investment and debt maturity
before examining these interactions more directly in a dynamic framework.
The estimation of deviations from target and leverage dynamics
We consider two aspects of leverage dynamics. First, we estimate the deviation from
target leverage (Dev) as a function of the rate of investment (Inv). We estimate the
following fixed-effects panel:
Devit = β0,it + β1Invit + β2Dnolit + β3L.ROAit + β4L.Retit + β5EPRit (4)
+ β6Transferit + β7Dratedit + vit
where vit is the residual. Lambrecht and Myers (2013) imply that managers are
not concerned about a target level of leverage and only focus on optimising invest-
ment. Consistent with this view, we expect that deviations from target leverage are
positively related to the rate of investment, hence we expect a positive sign on β1.
The dependent variable, the deviation from target leverage (Dev) is measured as the
difference between actual leverage and target leverage. We estimate target leverage
as the predicted values from a projection of actual firm leverage on a set of proxies
for the benefits and costs of leverage. 3 The predictors include Indmed, the annual
median industry (2-digit SIC group) leverage, Ditc, a dummy for the presence of
investment tax credits as a proxy for alternative tax shields, Prof , profitability,
MB, the market-to-book ratio, LnSize, the log of firm size, Fa, the fixed assets
ratio and V ol, earnings volatility. In the estimation of target leverage, we measure
all variables contemporaneously (Byoun, 2008). See Table 2 for the definitions of the
variables in the estimation of target leverage.
3 This selection is largely informed by Byoun (2008); Harrison, Panasian, and Seiler (2011); Hovakimian,Hovakimian, and Tehranian (2004); Hovakimian, Opler, and Titman (2001); Kayhan and Titman (2007);Leary and Roberts (2005). Our results are robust when including debt maturity in the determination oftarget leverage to account for the multidimensionality of capital structure choices (Alcock, Finn, and Tan,2012; Ghosh, Giambona, Harding, and Sirmans, 2011; Giambona, Harding, and Sirmans, 2008; Leland andToft, 1996).
8

We obtain the coefficients to predict the target leverage ratio from all firms except
financials, which include real estate investment firms, and construction firms. By
excluding these firms, we avoid any bias introduced through the nature of real estate
as the underlying asset class. 4
We use this regression to obtain predicted values rather than for statistical infer-
ence. Therefore, we do not need to ensure the robustness of the standard errors
(Hovakimian, Opler, and Titman, 2001). Further, Hovakimian, Opler, and Titman
(2001) discuss the question of variables potentially featuring in the estimation of
target leverage as well as that of dynamics in corporate capital structure. This con-
currence would imply heteroskedasticity in the target estimation. In order to correct
for any potential bias induced by this possibility, we estimate target leverage us-
ing FGLS and we assume that the error variance is a multiplicative function of the
independent variables. 5
In the panel estimation of the deviation from target leverage in (4), we control for
a set of variables commonly associated with leverage dynamics in empirical studies,
such as Byoun (2008); Hovakimian, Hovakimian, and Tehranian (2004); Hovakimian,
Opler, and Titman (2001); Kayhan and Titman (2007) and Leary and Roberts
(2005). See Table 3 for variable definitions and measurement.
[Insert Table 3 about here.]
Specifically, in Specification (1), we control for net operating losses carried forward
(Dnol), as firms that accumulate losses tend to be over-leveraged relative to their
target (Graham, 1996). Further, profitable firms may accumulate debt capacity in
the sense of the dynamic pecking order theory. We control for the past return on
assets (L.ROA), following Donaldson (1961) and Shyam-Sunder and Myers (1999).
Higher market values passively reduce leverage and thus the deviation from tar-
get. Therefore, we also include the lagged stock return of the firm (L.Ret) and its
earnings-to-price ratio (EPR), following Welch (2004).
We further control for impediments to adjusting the firm’s capital structure. One
such impediment arises due to a wealth transfer to debt holders when the firm issues
equity. This transfer is particularly large for firms with long-term debt and those
in financial distress. We therefore include an interaction term (Transfer) between
4 Our results are robust to estimating target leverage from REITs only.5 Our results are robust when estimating target leverage using OLS.
9
the ratio of short-term debt to all debt and a dummy that takes the value of unity
for negative operating income (Hovakimian, Opler, and Titman, 2001). Another
impediment arises due to adjustment costs. We add a dummy for the presence of
debt ratings (Drated) as these arguably reduce the cost of issuing capital (Cantillo
and Wright, 2000; Faulkender and Petersen, 2006; Lee, Lochhead, Ritter, and Zhao,
1996; Lemmon and Zender, 2010; Whited, 1992).
In Specification (2), we further control for the possibility that managers may be
reluctant to make adjustments to capital structure if these dilute accounting mea-
sures of value or performance. Therefore, we include a book value dilution dummy
(MBD) that takes the value of unity if the market-to-book ratio is greater than one,
and an earnings-per-share dilution dummy (EPSD) that takes the value of unity if
the earnings-to-price ratio exceeds the yield on Moody’s Baa-rated corporate bonds
(Graham and Harvey, 2001).
For additional robustness, we estimate an alternative Specification (3). We add con-
trol variables for various aspects of market timing, including L.EFWA, the lagged
external finance-weighted average market-to-book ratio (Baker and Wurgler, 2002),
the term spread (Term) for the cost of debt, and the relative cost of debt (RelCOD),
proxied by the yield on Moody’s Baa-rated corporate bonds over that on 10-year
government bonds (Ooi, Ong, and Li, 2010).
Here, we also control for the augment proposed in Byoun (2011), that the preser-
vation of future financial flexibility influences capital structure, by including the
earned-to-total capital ratio (Ecap), defined as retained earnings (item 36) relative
to total assets (item 6). This variable proxies for the development stage of a firm
and thus its need to retain financial slack to respond to future contingencies. 6
In all specifications, we further control for the REIT property sectors using their GIC
Subindex. Also, we include year fixed effects to capture the effect of latent macroe-
conomic shock factors (Korajczyk and Levy, 2003). We cluster standard errors by
firm (Petersen, 2009; Thompson, 2011).
Graham and Leary (2011) observe that many of the traditional capital structure
theories fail to explain changes in leverage. Lambrecht and Myers (2013) imply that
changes in leverage are a positive function of investment. Therefore, we re-estimate
6 REITs are required to pay out a substantial share of their income as dividends, arguable reducing thepotential to retain earnings (Lehman and Roth, 2010). Alternatively, Byoun (2011) also considers the cash-to-total-capital ratio. Our findings are robust to employing this alternative measure.
10
Specifications (1) to (3). We replace the dependent variable with changes in leverage,
measured as the first differences in the leverage series.
Descriptive statistics
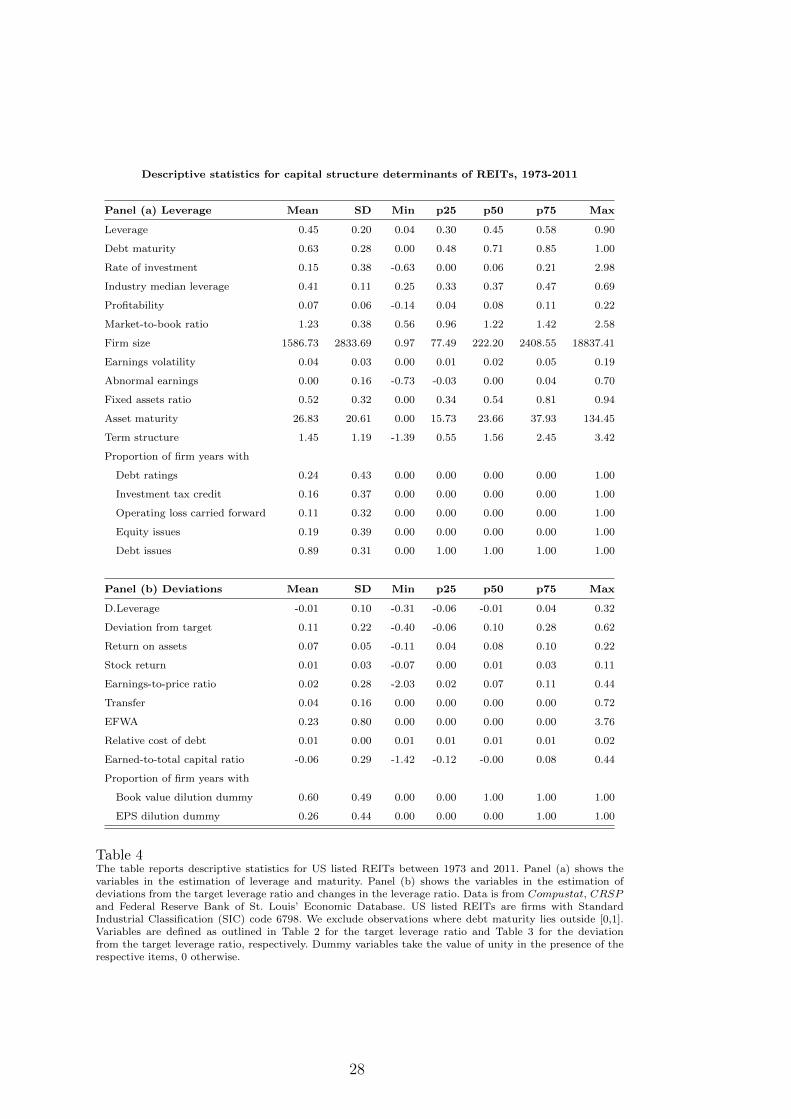
Panel (a) of Table 4 presents descriptive statistics for the characteristics of the
sample firms. The mean leverage ratio is 45%, higher than the leverage for the 2-
digit SIC group of 41%. 7 Debt maturity averages 63%, suggesting that more than
half of the debt held by REITs matures in more than three years. The average rate of
investment is 15%, broadly consistent with the values reported in Ott, Riddiough,
and Yi (2005). REIT growth opportunities, proxied by the market-to-book ratio,
have a mean of 1.23. REITs are generally viewed as value-stocks (Ball and Glascock,
2005), suggesting that some agency debt-equity conflicts may be of lesser concern.
The mean fixed assets ratio of REITs exceeds 50% and ranges up to 94%, reflecting
the asset requirement of the REIT regulation and the investment focus of REITs on
capital-intensive real estate assets. The average of REIT earnings volatility (0.04) is
relatively low. This is consistent with the view that the traditional REIT business
model focuses on the generation of stable income streams from the ownership and
operation of direct real estate assets (Boudry, Kallberg, and Liu, 2010). Average
asset maturity is c. 26 years, suggesting that the useful life of real estate is long.
Panel (b) of Table 4 summarises the potential drivers of leverage dynamics. Annual
changes in leverage are low on average, consistent with the observation in Lemmon,
Roberts, and Zender (2008) that leverage ratios are persistent through time. The
deviation from target leverage, the difference between actual and estimated target
leverage ratios, averages 11% above target and ranges from a minimum value of
22% below target to a maximum value of 62% above target, suggesting considerable
variation in leverage relative to the static, firm characteristic-informed target.
[Insert Table 4 about here.]
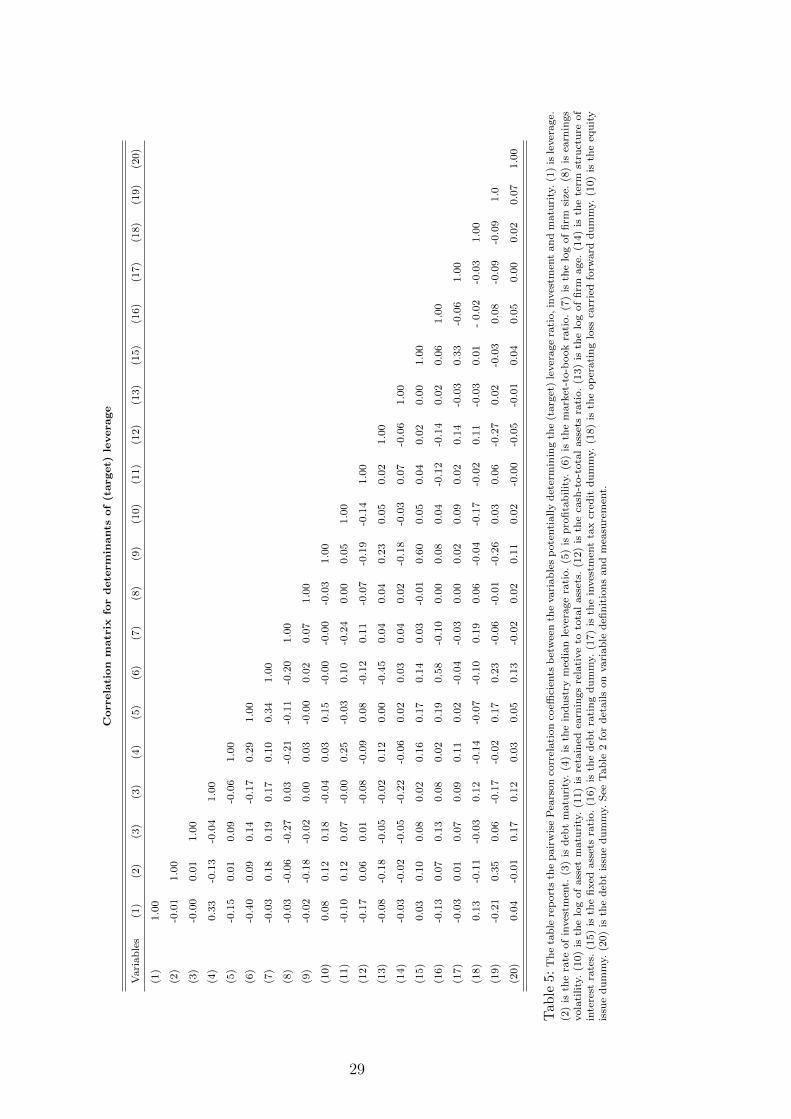
Table 5 presents the correlation matrix for the variables in the estimation of (tar-
get) leverage, investment and maturity. The matrix generally shows low levels of
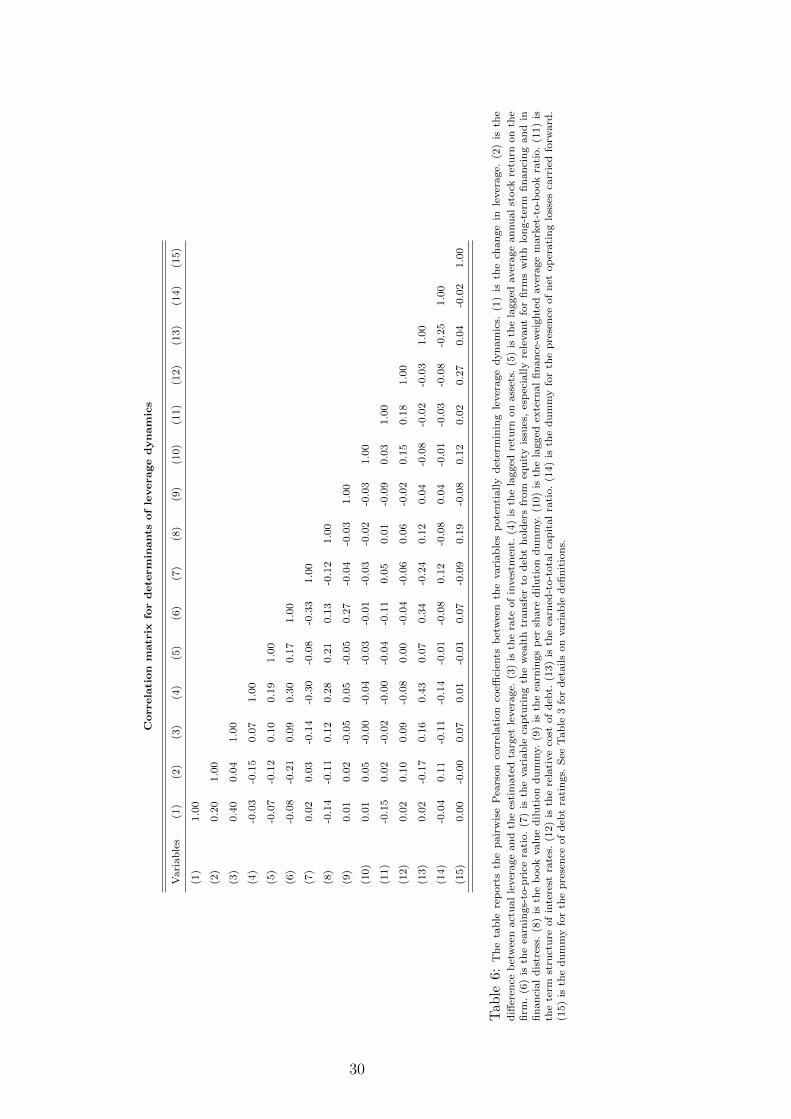
correlation among the predictors. Table 6 presents the corresponding matrix for
the variables in the estimation of leverage dynamics. Again, correlations among the
predictors are low, alleviating concerns surrounding potential multicollinearity.
7 This major group includes investment trusts, investment companies, holding companies, and miscellaneousinvestment offices
11

[Insert Tables 5 and 6 about here.]
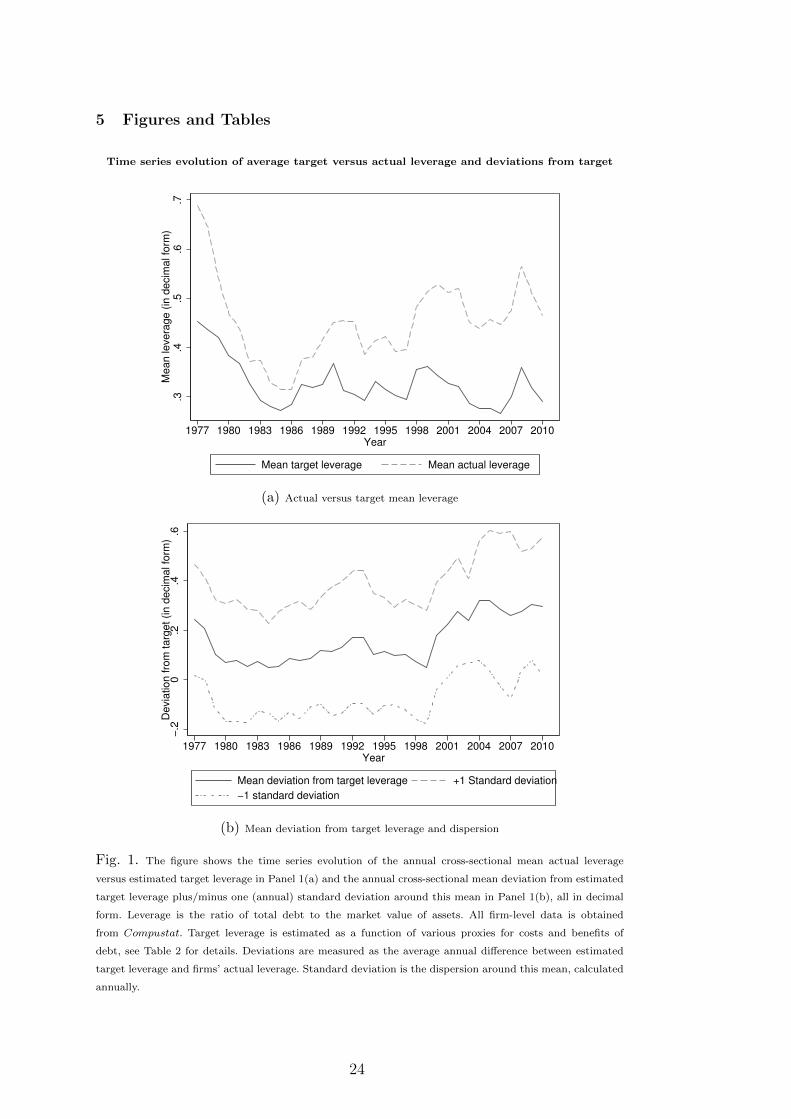
Figure 1(a) shows the evolution of leverage in US listed equity REITs from 1977
to 2011. Over this period, REITs have held significant levels of leverage, with a
median value of c. 45%. The figure also shows the optimal target leverage for these
REITs, estimated as a function of firm characteristics that proxy for the benefits and
costs of leverage. The median of estimated target leverage is c. 34%, suggesting that
REITs have on average exceeded their optimal leverage by c. 11%. This observation
is consistent with the view that REITs persistently hold more leverage than theory
suggests (Harrison, Panasian, and Seiler, 2011).
Figure 1(b) describes the evolution of deviations from target leverage. Deviations
fluctuate around a positive mean and the dispersion around this mean is significant
throughout the entire study period. This observation raises the question of the eco-
nomic forces that drive deviations between actual and target leverage. We suggest
that the rate of investment may be one of these forces and explore the evidence for
this proposition in a multivariate setting.
[Insert Figure 1 about here.]
3 Results
3.1 The interactions between leverage and investment
Table 7 shows the results for the 3SLS estimation of leverage, investment and matu-
rity, controlling for a comprehensive set of standard capital structure determinants
and drivers of corporate investment. Our results suggest that REIT investment in-
fluences leverage, but not vice versa. REIT managers appear to prioritise the choice
of investments over the leverage choice. This relative priority reflects managerial
efforts to keep investment on its optimal path in order to maximise the rents that
the managers extract from the firm. This finding is consistent with the theory of
(Lambrecht and Myers, 2013) and reflects the implications of the agency situation
between managers and equity holders.
[Insert Table 7 about here.]
Our finding also suggests the importance of the investment decision in the REIT
business model. Investments in real estate assets represent the primary business
activity of REITs (Boudry, Kallberg, and Liu, 2010). As a result, they are arguably
12
the core driver of value for REITs. The REIT regulation further requires these firms
to generate the majority of their income from the operation of the real estate assets
they invest in. Therefore, these investments also represent the major source of REIT
income. In Lambrecht and Myers (2013), income is the primary driver of the rents
that managers extract from the firm as a function of firm income. The two move in
lock-step. The maximisation of managerial rents then drives the relative priority of
investments over leverage decisions.
Our findings suggest that leverage follows investment, which takes priority in man-
agerial choices. Leverage therefore represents the residual decision in this agency-
driven framework. This perspective potentially sheds new light on REIT leverage
choices. The rationale developed in Lambrecht and Myers (2013) implies that lever-
age is chosen to absorb investment shocks. If the contribution to firm value from
these investments is greater than the costs of sub-optimal leverage, then this argu-
ment may provide a rational explanation for REIT leverage. This view is further
consistent with the observation in Graham and Leary (2011) that moderate changes
in leverage may have little effect on actual firm value along a broad range of pre-
issuance levels of leverage.
Childs, Mauer, and Ott (2005) argue that leverage influences investments as a re-
sult of the agency conflict between shareholders and debt holders. This conflict of
interests arguably distorts the optimal exercise policy of growth options. These dis-
tortions may result in under- or over-investment, depending on the nature of the
investment opportunity. We find no evidence that the level of leverage influences
the rate of investment in the sample of REITs that we study. At first sight, our
finding appears inconsistent with the proposition in Childs, Mauer, and Ott (2005).
However, our findings do not suggest that the agency conflict between shareholders
and debt holders that theoretically drives the effect of leverage on investment is
irrelevant in REITs. Rather, our findings suggest that REIT managers adjust debt
maturity, rather than leverage, to mitigate the implications of this conflict of interest
and thus preempt deviations of investment from its optimal path.
Specifically, the rationale in Childs, Mauer, and Ott (2005) may be interpreted as the
dynamic extension of the agency model of capital structure predicting a negative
impact of growth opportunities on leverage (Myers, 1977). We find that growth
opportunities, the basis for the possible distortions of investment decisions, measured
as the market-to-book ratio, are relevant for REIT leverage choices. The shareholder-
13
debt holder conflict does appear to exist in REITs. However, our findings suggest
that REIT managers put in place measures to mitigate the adverse consequences
of the agency conflict between shareholders and debt holders on actual investment
policy. In other words, this conflict appears to exist but REIT managers ensure that
is does not filter through to actual investment decisions.
Our findings suggest that the multi-dimensionality of capital structure allows REIT
managers to mitigate the adverse implications of the agency conflict between share-
holders and debt holders on investment. We find that debt maturity is an inverse
function of the rate of investment. Our finding suggests that REIT managers employ
the maturity dimension of capital structure in order to mitigate distortions in the
firm’s investment policies. This strategy is consistent with managerial incentives to
keep investment on its optimal path in order to maximise the rents that managers
earn as a function of the firm’s income (Lambrecht and Myers, 2013). This strat-
egy also appears to be effective, as the rate of investment seems to be higher when
maturity is shorter to reduce the incentives for underinvestment. Our finding is con-
sistent with the argument put forward in Childs, Mauer, and Ott (2005) that the
more frequent repricing of shorter term debt helps mitigate investment distortions.
Our result also resonates the static version of this theory posited in Hart (1993)
and the empirical evidence in Barclay and Smith (1995); Guedes and Opler (1996);
Stohs and Mauer (1996).
Barclay, Marx, and Smith (2003) argue that leverage and maturity are substitutes in
the mitigation of agency conflicts that may cause investment distortions, suggesting
and inverse relationship between these two dimensions of capital structure. This
substitution rationale implies that leverage is inversely related to debt maturity
and vice versa. We find evidence consistent with this rationale, as REIT leverage is
inversely related to debt maturity. However, we find that REIT debt maturity is not
significant in the determination of leverage.
Existing empirical evidence on the interactions between REIT leverage and maturity
is mixed. Ghosh, Giambona, Harding, and Sirmans (2011) and Alcock, Steiner, and
Tan (2012) find that REIT debt maturity has an inverse effect on leverage, but not
vice versa. Giambona, Harding, and Sirmans (2008) only find evidence for a two-way
interaction between REIT leverage and debt maturity when including the liquidation
value of the firm in the estimation. These findings suggest that the interrelationships
between REIT leverage and maturity respond to other fundamentals of the business
14
that have a first-order influence on capital structure. Our results suggest that the
existence of growth options and the exercise of these options, measured as the actual
rate of investment, have a significant impact on the nature of the interaction between
leverage and maturity.
We also find that investments are positively related to retained cash as a proxy for
liquidity constraints reflecting costly external finance and collateral capacity effects.
Our finding is consistent with the evidence presented in Riddiough and Wu (2009).
Further, we find that investment is positively related to equity issues, also consistent
with the evidence in Riddiough and Wu (2009). Ott, Riddiough, and Yi (2005) argue
that REITs finance new investments primarily using long-term debt. However, the
evidence presented here suggests that REITs employ a mix of debt and equity to
finance new investments.
In sum, it appears that the optimisation of corporate investment policy is a primary
driver of REIT leverage and maturity choices, consistent with the theory put forward
in Lambrecht and Myers (2013). The evidence on the remaining drivers of capital
structure choices in terms of leverage and debt maturity is generally consistent with
prior findings in the empirical corporate finance and REIT-specific literature. In the
following, we explore the empirical evidence for a number of additional implications
of the theory in Lambrecht and Myers (2013), as they relate to the role of leverage
targets and leverage dynamics through time.
3.2 Deviations from REIT target leverage
Table 8 presents the regression results for deviations from target leverage of US
listed equity REITs over the study period. Specification (1) controls for the stan-
dard set of factors driving or inhibiting dynamic adjustments to capital structure.
Specification (2) additionally controls for a set of accounting measures of value or
firm performance that might be of concern in making changes to the firm’s capital
structure. Specification (3) allows for measures of market timing as well as a mea-
sure of financial flexibility. Our evidence supports the implication of Lambrecht and
Myers (2013) that investment drives a wedge between target and actual leverage as
observed debt levels are the cumulative outcome of past investment decisions. Our
evidence is robust across the three Specifications.
[Insert Table 8 about here.]
15
We interpret our findings as evidence that deviations from target may not only
be the result of prohibitive adjustment costs that inhibit the correction of capital
structure towards its target as originally suggested in Fischer, Heinkel, and Zechner
(1989); Goldstein, Ju, and Leland (2001). Rather, our result suggests that there is
actual value potential in allowing temporary deviations of leverage from its target
level. These deviations are related to the rate of investment, suggesting that they
are driven by efforts to optimally exploit investment opportunities.
We find that the lag of returns on assets and the earnings-to-price ratio are inversely
related to deviations from target capital structure. This finding is consistent with the
notion that higher firm values passively reduce leverage (Hovakimian, Hovakimian,
and Tehranian, 2004; Hovakimian, Opler, and Titman, 2001; Kayhan and Titman,
2007; Welch, 2004).
Further, we find some evidence that the book value dilution measure is inversely
related to deviations from target leverage (Graham and Harvey, 2001; Hovakimian,
Hovakimian, and Tehranian, 2004). Our finding suggests that as the risk of diluting
this measure increases, leverage is kept more closely aligned with the target.
3.3 Evidence on REIT leverage dynamics
Table 9 presents the regression results for changes in leverage of US listed equity
REITs over the study period. Columns (1) to (3) replicate the specifications of the
regression for deviations from target leverage. We find that the rate of investment is
positively related to changes in leverage. This finding supports the proposition that
REIT leverage reflects external investment shocks. This finding is consistent with
the theory put forward in Lambrecht and Myers (2013).
[Insert Table 9 about here.]
We also find that the deviation from target leverage is positively associated with
changes in leverage. As leverage deviates from the target, the adjustments to capital
structure become more pronounced, consistent with a tendency to follow a broad
target ratio of leverage. Leverage dynamics appear to be sensitive to the current
level of leverage relative to the optimal target ratio, consistent with Graham and
Leary (2011) and Hovakimian, Opler, and Titman (2001).
Lambrecht and Myers (2013) imply that managers are not concerned about main-
taining an optimal target level of leverage. We find evidence to suggest that main-
16

taining an optimal target level of leverage is not irrelevant to REIT managers. While
the optimisation of the firm’s investment policy appears to be an important deter-
minant of REIT capital structure choices, REIT managers also seem to give some
consideration to target leverage levels. This evidence is consistent with findings pre-
sented for instance in Brown and Riddiough (2003), who report that REITs appear
to target a certain leverage ratio, albeit in order to maintain an investment-grade
bond rating. Our finding is also indirectly consistent with Dudley (2012) who argues
that large, lumpy investment projects, such as real estate investments, offer firms
an opportunity to adjust leverage at low marginal cost.
Further, we find that operating losses carried forward and the lag of return on assets
are positively related to changes in leverage. This finding is consistent with the
argument that changes in firm value, induced by losses accumulated in the past, or
by a higher return on assets in the past, passively induce changes in capital structure
(Donaldson, 1961; Graham, 1996; Shyam-Sunder and Myers, 1999).
We find some evidence that the book value dilution dummy is inversely related to
changes in leverage. This finding is consistent with Graham and Harvey (2001);
Hovakimian, Hovakimian, and Tehranian (2004). The risk of diluting this measure
of firm value appears to reduce the incentive for managers to make adjustments to
capital structure.
We also find some evidence that the earnings-to-price ratio is inversely related to
changes in leverage. As the earnings-to-price ratio increases, this implies a lower
market value of the firm, passively increasing leverage, potentially beyond the target
ratio. We would expect such a situation to prompt larger changes in leverage as the
firm seeks to adjust capital structure back to target, consistent with the arguments
put forward in Hovakimian, Hovakimian, and Tehranian (2004); Hovakimian, Opler,
and Titman (2001); Kayhan and Titman (2007); Welch (2004).
However, a higher earnings-to-price ratio may also imply that the firm is in a situa-
tion where it may not be ideal to issue equity as the price of equity is low. The evi-
dence for an inverse relationship between adjustments to leverage and the earnings-
to-price ratio may to some extent also reflect market timing considerations in capital
structure dynamics, broadly consistent with the rationale in Ooi, Ong, and Li (2010).
This interpretation of the earnings-to-price ratio in the context of changes in cor-
porate leverage may also help explain the lack of significance of some of the other
17
proxies for market timing, such as the term structure of interest rates and the relative
cost of corporate debt (Ooi, Ong, and Li, 2010).
On the other hand, we find that the lag of EFWA MB, the timing measure suggested
in Baker and Wurgler (2002), is inversely related to annual changes in leverage.
Baker and Wurgler (2002) present empirical evidence that their proposed measure
is inversely related to cumulative changes in leverage since the firm’s IPO. Our
evidence relates this measure to annual changes in leverage, but our results are
qualitatively consistent.
4 Conclusion
In this study, we explore the interdependence of investment and financing choices
in US listed REITs. We empirically contrast two conflicting theoretical predictions.
Childs, Mauer, and Ott (2005) focus on the shareholder-debt holder conflict to pro-
pose that leverage distorts the optimal investment policy. ON the other hand, Lam-
brecht and Myers (2013) argue that, based on the manager-shareholder conflict,
managers choose leverage to keep investment on its optimal path in order to max-
imise the utility of the rents they extract from the firm. Therefore, leverage follows
investment. Empirical evidence on the nature and direction of the relationship be-
tween leverage and investment offers insight into the question which agency conflict
dominates REIT investment and capital structure decisions.
Consistent with Lambrecht and Myers (2013), we find that investment determines
leverage in REITs, whereas leverage does not appear to be a determinant of the rate
of investment. This finding reflects the agency conflict between shareholders and
managers.The fundamental role of investments for the financial success of the firm
in the REIT business model leads managers to prioritise the investment decision over
the leverage decision in order to maximise the rents they extract as a function of
the firm’s income. Conversely, the debt-overhang conflict between shareholders and
debt holders that drives the reverse influence of leverage on the optimal investment
policy does not appear to filter through to the actual investment choices of REITs.
Our findings suggest that REIT managers utilise the maturity dimension of capital
structure to mitigate potential investment distortions and ensure that investment
remains on its rent-maximising path. Leverage appears to be the residual absorbing
the impact of investment choices. Our results therefore suggest a rational explanation
why tax-exempt, transparent REITs may hold significant levels of leverage.
18

We also present novel evidence on the role of investments in driving a wedge be-
tween REIT target leverage and actual leverage levels. We find that deviations from
the optimal target level of leverage that is determined statically as a function of
firm characteristics are driven by investment choices. Managerial efforts to optimise
investment appear to take priority over efforts to optimise leverage levels. However,
while investment is a significant determinant of leverage dynamics, REIT managers
also appear to be concerned about maintaining a certain target level of leverage.
As a result, our findings also shed new light on the interplay of investments and
leverage adjustments towards the target ratio in explaining REIT capital structure
dynamics.
19

References
Alcock, J., F. Finn, and K. J. K. Tan (2012): “The determinants of debtmaturity in Australian firms,” Accounting and Finance, 52(2), 313–341.
Alcock, J., E. Steiner, and K. J. K. Tan (2012): “Joint Leverage and MaturityChoices in Real Estate Firms: The Role of the REIT Status,” Journal of RealEstate Finance and Economics, Forthcoming.
Baker, M., and J. Wurgler (2002): “Market timing and capital structure,”Journal of Finance, 57(1), 1–30.
Ball, M., and J. L. Glascock (2005): Property Investment Funds for the UK:Potential Impact on the Private Rental Market. Council of Mortgage Lenders.
Barclay, M. J., L. M. Marx, and C. W. Smith (2003): “The joint determina-tion of leverage and maturity,” Journal of Corporate Finance, 9(2), 149–167.
Barclay, M. J., and C. Smith (1995): “The maturity structure of corporatedebt,” Journal of Finance, 50(2), 609–631.
Billett, M. T., T.-H. D. King, and D. C. Mauer (2007): “Growth opportuni-ties and the choice of leverage, debt maturity, and covenants,” Journal of Finance,62(2), 697–730.
Boudry, W. I., J. G. Kallberg, and C. H. Liu (2010): “An Analysis of REITSecurity Issuance Decisions,” Real Estate Economics, 38(1), 91–120.
Bradley, M., G. Jarrell, and E. Kim (1984): “On the existence of an optimalcapital structure: theory and evidence,” Journal of Finance, 39(3), 857–878.
Brick, I. E., and S. A. Ravid (1985): “On the relevance of debt maturity struc-ture,” Journal of Finance, 40(5), 1423–1437.
Brown, D. T., and T. J. Riddiough (2003): “Financing Choice and LiabilityStructure of Real Estate Investment Trusts,” Real Estate Economics, 31(3), 313–346.
Byoun, S. (2008): “How and When Do Firms Adjust Their Capital Structurestoward Targets?,” Journal of Finance, 63(6), 3069–3096.
(2011): “Financial Flexibility and Capital Structure Decision,” Workingpaper, SSRN eLibrary.
Cantillo, M., and J. Wright (2000): “How Do Firms Choose Their Lenders?An Empirical Investigation,” Review of Financial Studies, 13(1), 155–89.
Childs, P. D., D. C. Mauer, and S. H. Ott (2005): “Interactions of corporatefinancing and investment decisions: The effects of agency conflicts,” Journal ofFinancial Economics, 76(3), 667–690.
Datta, S., M. Iskandar-Datta, and Raman (2005): “Managerial stock owner-ship and the maturity structure of corporate debt,” Journal of Finance, 60(5),2333–2350.
DeAngelo, H., and R. Masulis (1980): “Optimal capital structure under corpo-rate and personal taxation,” Journal of Financial Economics, 8(1), 3–29.
Diamond, D. W. (1991): “Debt Maturity Structure and Liquidity Risk,” QuarterlyJournal of Economics, 106(3), 709–737.
Donaldson, G. (1961): Corporate debt capacity: a study of corporate debt policy.Harvard Graduate School of Business.
Dudley, E. (2012): “Capital structure and large investment projects,” Journal ofCorporate Finance, 18(5), 1168–1192.
Fama, E. F., and K. R. French (1999): “The Corporate Cost of Capital and theReturn on Corporate Investment,” Journal of Finance, 54(6), 1939–1967.
Faulkender, M., and M. A. Petersen (2006): “Does the source of capital affect
20

capital structure?,” Review of Financial Studies, 19(1), 45–79.Fischer, E. O., R. Heinkel, and J. Zechner (1989): “Dynamic Capital Struc-
ture Choice: Theory and Tests,” Journal of Finance, 44(1), 19–40.Frank, M., and V. Goyal (2003): “Testing the pecking order theory of capital
structures,” Journal of Financial Economics, 67(2), 217–248.Ghosh, C., E. Giambona, J. Harding, and C. Sirmans (2011): “How Entrench-
ment, Incentives and Governance Influence REIT Capital Structure,” Journal ofReal Estate Finance and Economics, 43(1), 39–72.
Giambona, E., J. P. Harding, and C. Sirmans (2008): “Explaining the vari-ation in REIT capital structure: the role of asset liquidation value,” Real EstateEconomics, 36(1), 111 – 137.
Goldstein, R., N. Ju, and H. Leland (2001): “An EBIT-Based Model of Dy-namic Capital Structures,” Journal of Business, 74(4), 483–512.
Graham, J., and C. Harvey (2001): “The theory and practice of corporate fi-nance: evidence from the field,” Journal of Financial Economics, 60(2), 187–243.
Graham, J. R. (1996): “Debt and the marginal tax rate,” Journal of FinancialEconomics, 41(1), 41–73.
Graham, J. R., and M. T. Leary (2011): “A Review of Empirical Capital Struc-ture Research and Directions for the Future,” Annual Review of Financial Eco-nomics, 3, 309–345.
Greene, W. H. (2002): Econometric Analysis. Prentice Hall, Englewood Cliffs,NJ., 5th edn.
Guedes, J., and T. Opler (1996): “The determinants of the maturity of corporatedebt issues,” Journal of Finance, 51(1), 1809–1833.
Harrison, D. M., C. A. Panasian, and M. J. Seiler (2011): “Further Evidenceon the Capital Structure of REITs,” Real Estate Economics, 39(1), 133–166.
Hart, O. (1993): Theories of Optimal Capital Structure: A Managerial DiscretionPerspective. Washington, DC: The Brookings Institution.
Hovakimian, A., G. Hovakimian, and H. Tehranian (2004): “Determinantsof target capital structure: The case of dual debt and equity issues,” Journal ofFinancial Economics, 71(3), 517–540.
Hovakimian, A., T. Opler, and S. Titman (2001): “The debt-equity choice,”Journal of Financial and Quantitative Analysis, 36(1), 1–24.
Howe, J. S., and J. D. Shilling (1988): “Capital Structure Theory and REITSecurity Offerings,” Journal of Finance, 43(4), 983–993.
Jensen, M. C., and W. H. Meckling (1976): “Theory of the firm: managerialbehavior, agency costs and ownership structure,” Journal of Financial Economics,3(4), 305–360.
Johnson, S. A. (2003): “Debt maturity and the effects of growth opportunities andliquidity risk on leverage,” Review of Financial Studies, 16(1), 209–236.
Kayhan, A., and S. Titman (2007): “Firms’ histories and their capital struc-tures,” Journal of Financial Economics, 83(1), 1–32.
Korajczyk, R. A., and A. Levy (2003): “Capital structure choice: macroeco-nomic conditions and financial constraints,” Journal of Financial Economics,68(1), 75–109.
Lambrecht, B., and S. C. Myers (2013): “The Dynamics of Investment, Payoutand Debt,” Working paper, MIT Sloan.
Leary, M. T., and M. R. Roberts (2005): “Do Firms Rebalance Their CapitalStructures?,” Journal of Finance, 60(6), 2575–2619.
Lee, I., S. Lochhead, J. Ritter, and Q. Zhao (1996): “The costs of raising
21
capital,” Journal of Financial Research, 19(1), 59–74.Lehman, R., and H. Roth (2010): “Global Real Estate Investment Trust Report
2010 - Against all odds,” Research report, Ernst & Young.Leland, H., and K. Toft (1996): “Optimal capital structure, endogenous
bankruptcy, and the term structure of credit spreads,” Journal of Finance, 51(3),987–1019.
Lemmon, M. L., M. R. Roberts, and J. F. Zender (2008): “Back to the Begin-ning: Persistence and the Cross-Section of Corporate Capital Structure,” Journalof Finance, 63(4), 1575–1608.
Lemmon, M. L., and J. F. Zender (2010): “Debt Capacity and Tests of CapitalStructure Theories,” Journal of Financial and Quantitative Analysis, 45(5), 1161–1187.
Myers, S. (1977): “Determinants of corporate borrowings,” Journal of FinancialEconomics, 5(2), 147–275.
Ooi, J. T., S.-E. Ong, and L. Li (2010): “An Analysis of the Financing Decisionsof REITs: The Role of Market Timing and Target Leverage,” Journal of RealEstate Finance and Economics, 40(2), 130–160.
Ott, S. H., T. J. Riddiough, and H.-C. Yi (2005): “Finance, Investment and In-vestment Performance: Evidence from the REIT Sector,” Real Estate Economics,33(1), 203–235.
Pagan, A. R., and A. D. Hall (1983): “Diagnostic tests as residual analysis,”Econometric Reviews, 2(2), 159–218.
Petersen, M. (2009): “Estimating standard errors in finance panel data sets: com-paring approaches,” Review of Financial Studies, 22(1), 435–480.
Rajan, R., and L. Zingales (1995): “”What do we know about capital structure?”some evidence from international data,” Journal of Finance, 50(5), 1421–1460.
Riddiough, T. J., and Z. Wu (2009): “Financial Constraints, Liquidity Manage-ment and Investment,” Real Estate Economics, 37(3), 447–481.
Scherr, F. C., and H. M. Hulburt (2001): “The debt maturity structure ofsmall firms,” Financial Management, 30(1), 85–111.
Sharpe, S. (1991): “Credit rationing, concessionary lending and debt maturitystructure,” Journal of Banking and Finance, 15(3), 581–604.
Shyam-Sunder, L., and S. Myers (1999): “Testing static tradeoff against peckingorder models of capital structure,” Journal of Financial Economics, 51(2), 219–244.
Stohs, M., and D. C. Mauer (1996): “The determinants of corporate debt ma-turity structure,” Journal of Business, 69(3), 279–312.
Strebulaev, I. A., and T. M. Whited (2011): “Dynamic Models and StructuralEstimation in Corporate Finance,” Foundations and Trends in Finance, 6(1-2),1–163.
Thompson, S. B. (2011): “Simple formulas for standard errors that cluster by bothfirm and time,” Journal of Financial Economics, 99(1), 1–10.
Titman, S. (1992): “Interest Rate Swaps and Corporate Financing Choices,” Jour-nal of Finance, 47(4), 1503–1516.
Titman, S., and R. Wessels (1988): “Determinants of capital structure,” Journalof Finance, 43(1), 1–19.
Welch, I. (2004): “Capital Structure and Stock Returns,” Journal of PoliticalEconomy, 112(1), 106–131.
Whited, T. M. (1992): “Debt, Liquidity Constraints, and Corporate Investment:Evidence from Panel Data,” Journal of Finance, 47(4), 1425–1460.
22

Williamson, O. E. (1988): “Corporate finance and corporate governance,” Journalof Finance, 43(3), 567–591.
Zwiebel, J. (1996): “Dynamic Capital Structure under Managerial Entrenchment,”American Economic Review, 86(5), 1197–1215.
23
5 Figures and Tables
Time series evolution of average target versus actual leverage and deviations from target
.3.4
.5.6
.7M
ean levera
ge (
in d
ecim
al fo
rm)
1977 1980 1983 1986 1989 1992 1995 1998 2001 2004 2007 2010Year
Mean target leverage Mean actual leverage
(a) Actual versus target mean leverage
−.2
0.2
.4.6
Devia
tion fro
m targ
et (in d
ecim
al fo
rm)
1977 1980 1983 1986 1989 1992 1995 1998 2001 2004 2007 2010Year
Mean deviation from target leverage +1 Standard deviation
−1 standard deviation
(b) Mean deviation from target leverage and dispersion
Fig. 1. The figure shows the time series evolution of the annual cross-sectional mean actual leverage
versus estimated target leverage in Panel 1(a) and the annual cross-sectional mean deviation from estimated
target leverage plus/minus one (annual) standard deviation around this mean in Panel 1(b), all in decimal
form. Leverage is the ratio of total debt to the market value of assets. All firm-level data is obtained
from Compustat. Target leverage is estimated as a function of various proxies for costs and benefits of
debt, see Table 2 for details. Deviations are measured as the average annual difference between estimated
target leverage and firms’ actual leverage. Standard deviation is the dispersion around this mean, calculated
annually.
24

Summary of main variables of interest
Variable Measurement Reference
Leverage Ratio of total debt (long-term debt, Com-pustat item 9, plus current liabilities, item34 or item 5 if missing) to market valueof assets (book value of assets, item 6, lessbook value of common equity, item 60, plusmarket value of common equity, commonshares outstanding, item 25, multiplied byannual close price, item 199)
Billett, King, and Mauer (2007);Byoun (2008); Datta, Iskandar-Datta, and Raman (2005); Stohsand Mauer (1996)
Rate of investment Ratio of the change in book capital fromt − 1 to t plus depreciation (item 14) overthe beginning-of-period book capital, wherebook capital is the book value of long-termdebt (item 9), short-term debt, measuredas debt in current liabilities (item 34) or,if missing, current liabilities (item 5), andcommon equity (item 60)
Fama and French (1999); Ott,Riddiough, and Yi (2005)
Debt maturity Ratio of long-term debt (measured debt dueafter three years) to total debt (long-termdebt, item 9, plus current liabilities, item34 or item 5 if missing)
Barclay, Marx, and Smith (2003)
Table 1The table shows the definition of the main variables of interest, REIT leverage, investment and debt maturity,alongside their measurement in terms of the corresponding Compustat data items. Compustat item numbersare as of 2013. All firm-level accounting data is obtained from Compustat.
25
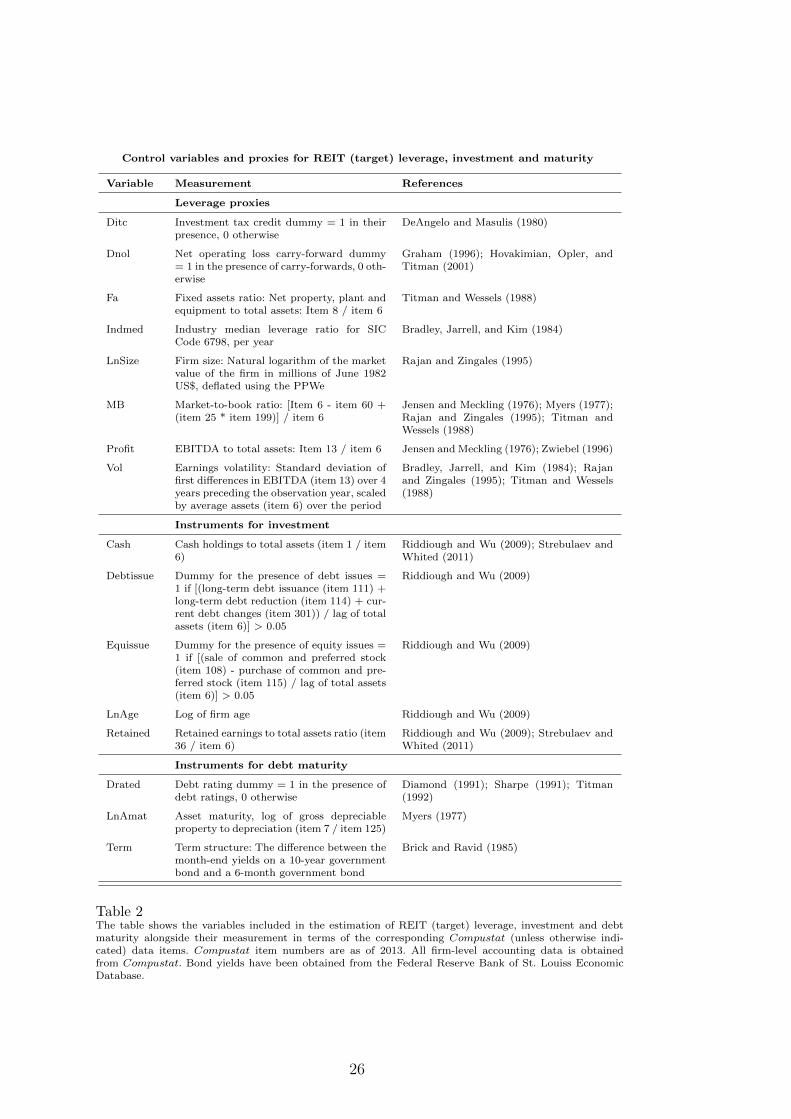
Control variables and proxies for REIT (target) leverage, investment and maturity
Variable Measurement References
Leverage proxies
Ditc Investment tax credit dummy = 1 in theirpresence, 0 otherwise
DeAngelo and Masulis (1980)
Dnol Net operating loss carry-forward dummy= 1 in the presence of carry-forwards, 0 oth-erwise
Graham (1996); Hovakimian, Opler, andTitman (2001)
Fa Fixed assets ratio: Net property, plant andequipment to total assets: Item 8 / item 6
Titman and Wessels (1988)
Indmed Industry median leverage ratio for SICCode 6798, per year
Bradley, Jarrell, and Kim (1984)
LnSize Firm size: Natural logarithm of the marketvalue of the firm in millions of June 1982US$, deflated using the PPWe
Rajan and Zingales (1995)
MB Market-to-book ratio: [Item 6 - item 60 +(item 25 * item 199)] / item 6
Jensen and Meckling (1976); Myers (1977);Rajan and Zingales (1995); Titman andWessels (1988)
Profit EBITDA to total assets: Item 13 / item 6 Jensen and Meckling (1976); Zwiebel (1996)
Vol Earnings volatility: Standard deviation offirst differences in EBITDA (item 13) over 4years preceding the observation year, scaledby average assets (item 6) over the period
Bradley, Jarrell, and Kim (1984); Rajanand Zingales (1995); Titman and Wessels(1988)
Instruments for investment
Cash Cash holdings to total assets (item 1 / item6)
Riddiough and Wu (2009); Strebulaev andWhited (2011)
Debtissue Dummy for the presence of debt issues =1 if [(long-term debt issuance (item 111) +long-term debt reduction (item 114) + cur-rent debt changes (item 301)) / lag of totalassets (item 6)] > 0.05
Riddiough and Wu (2009)
Equissue Dummy for the presence of equity issues =1 if [(sale of common and preferred stock(item 108) - purchase of common and pre-ferred stock (item 115) / lag of total assets(item 6)] > 0.05
Riddiough and Wu (2009)
LnAge Log of firm age Riddiough and Wu (2009)
Retained Retained earnings to total assets ratio (item36 / item 6)
Riddiough and Wu (2009); Strebulaev andWhited (2011)
Instruments for debt maturity
Drated Debt rating dummy = 1 in the presence ofdebt ratings, 0 otherwise
Diamond (1991); Sharpe (1991); Titman(1992)
LnAmat Asset maturity, log of gross depreciableproperty to depreciation (item 7 / item 125)
Myers (1977)
Term Term structure: The difference between themonth-end yields on a 10-year governmentbond and a 6-month government bond
Brick and Ravid (1985)
Table 2The table shows the variables included in the estimation of REIT (target) leverage, investment and debtmaturity alongside their measurement in terms of the corresponding Compustat (unless otherwise indi-cated) data items. Compustat item numbers are as of 2013. All firm-level accounting data is obtainedfrom Compustat. Bond yields have been obtained from the Federal Reserve Bank of St. Louiss EconomicDatabase.
26

Control variables and proxies for leverage dynamics
Variable Measurement References
Dnol Net operating loss carry-forward dummy = 1 in thepresence of carry-forwards, 0 otherwise
Graham (1996); Hovakimian,Opler, and Titman (2001)
Drated Debt rating dummy = 1 in the presence of debt rat-ings, 0 otherwise
Byoun (2008); Cantillo andWright (2000); Faulkender andPetersen (2006); Lee, Lochhead,Ritter, and Zhao (1996); Lem-mon and Zender (2010); Whited(1992)
Ecap Earned-to-total capital ratio: Retained earnings (item36) / total assets (item 6)
Byoun (2011)
EPR Earnings-to-price ratio: Item 172 / (item 125 * item199)
Ooi, Ong, and Li (2010)
EPSdum EPS dilution dummy = 1 if EP ratio > yield onMoody’s Baa rated corporate bonds, 0 otherwise
Graham and Harvey (2001);Hovakimian, Hovakimian, andTehranian (2004)
L.EFWA Lagged external finance-weighted average market-to-book ratio
Baker and Wurgler (2002); Kay-han and Titman (2007); Learyand Roberts (2005)
L.Ret Lagged average monthly stock return from CRSP Hovakimian, Hovakimian, andTehranian (2004); Hovakimian,Opler, and Titman (2001); Kay-han and Titman (2007); Ooi,Ong, and Li (2010); Welch(2004)
L.ROA Lag of EBITDA to total assets: Item 13 / item 6 Donaldson (1961); Frank andGoyal (2003); Hovakimian, Hov-akimian, and Tehranian (2004);Hovakimian, Opler, and Tit-man (2001); Kayhan and Tit-man (2007); Shyam-Sunder andMyers (1999)
MBdum Book value dilution dummy = 1 if market-to-book ra-tio >1, 0 otherwise
Graham and Harvey (2001);Hovakimian, Hovakimian, andTehranian (2004)
RelCOD Relative cost of debt: The difference between the yieldon Moody’s Baa corporate bonds and 10-year govern-ment bonds
Ooi, Ong, and Li (2010)
Term Term structure: The difference between the month-endyields on a 10-year government bond and a 6-monthgovernment bond
Ooi, Ong, and Li (2010)
Transfer Proportion of debt due in less than 3 years, and aninteraction between this variable and a dummy thattakes the value of unity for negative operating income(item 13)
Hovakimian, Opler, and Titman(2001)
Table 3The table shows the control variables included in the estimation of deviations from target leverage andchanges in leverage in terms of the corresponding Compustat (unless otherwise indicated) data items.Compustat item numbers are as of 2013. All firm-level accounting data is obtained from Compustat. Bondyields are from the Federal Reserve Bank of St. Louis’ Economic Database. Individual stock and aggregatestock market returns are from CRSP .
27
Descriptive statistics for capital structure determinants of REITs, 1973-2011
Panel (a) Leverage Mean SD Min p25 p50 p75 Max
Leverage 0.45 0.20 0.04 0.30 0.45 0.58 0.90
Debt maturity 0.63 0.28 0.00 0.48 0.71 0.85 1.00
Rate of investment 0.15 0.38 -0.63 0.00 0.06 0.21 2.98
Industry median leverage 0.41 0.11 0.25 0.33 0.37 0.47 0.69
Profitability 0.07 0.06 -0.14 0.04 0.08 0.11 0.22
Market-to-book ratio 1.23 0.38 0.56 0.96 1.22 1.42 2.58
Firm size 1586.73 2833.69 0.97 77.49 222.20 2408.55 18837.41
Earnings volatility 0.04 0.03 0.00 0.01 0.02 0.05 0.19
Abnormal earnings 0.00 0.16 -0.73 -0.03 0.00 0.04 0.70
Fixed assets ratio 0.52 0.32 0.00 0.34 0.54 0.81 0.94
Asset maturity 26.83 20.61 0.00 15.73 23.66 37.93 134.45
Term structure 1.45 1.19 -1.39 0.55 1.56 2.45 3.42
Proportion of firm years with
Debt ratings 0.24 0.43 0.00 0.00 0.00 0.00 1.00
Investment tax credit 0.16 0.37 0.00 0.00 0.00 0.00 1.00
Operating loss carried forward 0.11 0.32 0.00 0.00 0.00 0.00 1.00
Equity issues 0.19 0.39 0.00 0.00 0.00 0.00 1.00
Debt issues 0.89 0.31 0.00 1.00 1.00 1.00 1.00
Panel (b) Deviations Mean SD Min p25 p50 p75 Max
D.Leverage -0.01 0.10 -0.31 -0.06 -0.01 0.04 0.32
Deviation from target 0.11 0.22 -0.40 -0.06 0.10 0.28 0.62
Return on assets 0.07 0.05 -0.11 0.04 0.08 0.10 0.22
Stock return 0.01 0.03 -0.07 0.00 0.01 0.03 0.11
Earnings-to-price ratio 0.02 0.28 -2.03 0.02 0.07 0.11 0.44
Transfer 0.04 0.16 0.00 0.00 0.00 0.00 0.72
EFWA 0.23 0.80 0.00 0.00 0.00 0.00 3.76
Relative cost of debt 0.01 0.00 0.01 0.01 0.01 0.01 0.02
Earned-to-total capital ratio -0.06 0.29 -1.42 -0.12 -0.00 0.08 0.44
Proportion of firm years with
Book value dilution dummy 0.60 0.49 0.00 0.00 1.00 1.00 1.00
EPS dilution dummy 0.26 0.44 0.00 0.00 0.00 1.00 1.00
Table 4The table reports descriptive statistics for US listed REITs between 1973 and 2011. Panel (a) shows thevariables in the estimation of leverage and maturity. Panel (b) shows the variables in the estimation ofdeviations from the target leverage ratio and changes in the leverage ratio. Data is from Compustat, CRSPand Federal Reserve Bank of St. Louis’ Economic Database. US listed REITs are firms with StandardIndustrial Classification (SIC) code 6798. We exclude observations where debt maturity lies outside [0,1].Variables are defined as outlined in Table 2 for the target leverage ratio and Table 3 for the deviationfrom the target leverage ratio, respectively. Dummy variables take the value of unity in the presence of therespective items, 0 otherwise.
28
Correlation
matrix
fordete
rm
inants
of(target)
leverage
Vari
ab
les
(1)
(2)
(3)
(3)
(4)
(5)
(6)
(7)
(8)
(9)
(10)
(11)
(12)
(13)
(15)
(16)
(17)
(18)
(19)
(20)
(1)
1.0
0
(2)
-0.0
11.0
0
(3)
-0.0
00.0
11.0
0
(4)
0.3
3-0
.13
-0.0
41.0
0
(5)
-0.1
50.0
10.0
9-0
.06
1.0
0
(6)
-0.4
00.0
90.1
4-0
.17
0.2
91.0
0
(7)
-0.0
30.1
80.1
90.1
70.1
00.3
41.0
0
(8)
-0.0
3-0
.06
-0.2
70.0
3-0
.21
-0.1
1-0
.20
1.0
0
(9)
-0.0
2-0
.18
-0.0
20.0
00.0
3-0
.00
0.0
20.0
71.0
0
(10)
0.0
80.1
20.1
8-0
.04
0.0
30.1
5-0
.00
-0.0
0-0
.03
1.0
0
(11)
-0.1
00.1
20.0
7-0
.00
0.2
5-0
.03
0.1
0-0
.24
0.0
00.0
51.0
0
(12)
-0.1
70.0
60.0
1-0
.08
-0.0
90.0
8-0
.12
0.1
1-0
.07
-0.1
9-0
.14
1.0
0
(13)
-0.0
8-0
.18
-0.0
5-0
.02
0.1
20.0
0-0
.45
0.0
40.0
40.2
30.0
50.0
21.0
0
(14)
-0.0
3-0
.02
-0.0
5-0
.22
-0.0
60.0
20.0
30.0
40.0
2-0
.18
-0.0
30.0
7-0
.06
1.0
0
(15)
0.0
30.1
00.0
80.0
20.1
60.1
70.1
40.0
3-0
.01
0.6
00.0
50.0
40.0
20.0
01.0
0
(16)
-0.1
30.0
70.1
30.0
80.0
20.1
90.5
8-0
.10
0.0
00.0
80.0
4-0
.12
-0.1
40.0
20.0
61.0
0
(17)
-0.0
30.0
10.0
70.0
90.1
10.0
2-0
.04
-0.0
30.0
00.0
20.0
90.0
20.1
4-0
.03
0.3
3-0
.06
1.0
0
(18)
0.1
3-0
.11
-0.0
30.1
2-0
.14
-0.0
7-0
.10
0.1
90.0
6-0
.04
-0.1
7-0
.02
0.1
1-0
.03
0.0
1-
0.0
2-0
.03
1.0
0
(19)
-0.2
10.3
50.0
6-0
.17
-0.0
20.1
70.2
3-0
.06
-0.0
1-0
.26
0.0
30.0
6-0
.27
0.0
2-0
.03
0.0
8-0
.09
-0.0
91.0
(20)
0.0
4-0
.01
0.1
70.1
20.0
30.0
50.1
3-0
.02
0.0
20.1
10.0
2-0
.00
-0.0
5-0
.01
0.0
40.0
50.0
00.0
20.0
71.0
0
Tab
le5:
Th
eta
ble
rep
ort
sth
ep
air
wis
eP
ears
on
corr
elati
on
coeffi
cien
tsb
etw
een
the
vari
ab
les
pote
nti
ally
det
erm
inin
gth
e(t
arg
et)
lever
age
rati
o,in
ves
tmen
tan
dm
atu
rity
.(1
)is
lever
age.
(2)
isth
era
teof
inves
tmen
t.(3
)is
deb
tm
atu
rity
.(4
)is
the
ind
ust
rym
edia
nle
ver
age
rati
o.
(5)
isp
rofi
tab
ilit
y.(6
)is
the
mark
et-t
o-b
ook
rati
o.
(7)
isth
elo
gof
firm
size
.(8
)is
earn
ings
vola
tili
ty.
(10)
isth
elo
gof
ass
etm
atu
rity
.(1
1)
isre
tain
edea
rnin
gs
rela
tive
toto
tal
ass
ets.
(12)
isth
eca
sh-t
o-t
ota
lass
ets
rati
o.
(13)
isth
elo
gof
firm
age.
(14)
isth
ete
rmst
ruct
ure
of
inte
rest
rate
s.(1
5)
isth
efi
xed
ass
ets
rati
o.
(16)
isth
ed
ebt
rati
ng
du
mm
y.(1
7)
isth
ein
ves
tmen
tta
xcr
edit
du
mm
y.(1
8)
isth
eop
erati
ng
loss
carr
ied
forw
ard
du
mm
y.(1
0)
isth
eeq
uit
yis
sue
du
mm
y.(2
0)
isth
ed
ebt
issu
ed
um
my.
See
Tab
le2
for
det
ail
son
vari
ab
led
efin
itio
ns
an
dm
easu
rem
ent.
29
Correlation
matrix
fordete
rm
inants
ofleveragedynam
ics
Vari
ab
les
(1)
(2)
(3)
(4)
(5)
(6)
(7)
(8)
(9)
(10)
(11)
(12)
(13)
(14)
(15)
(1)
1.0
0
(2)
0.2
01.0
0
(3)
0.4
00.0
41.0
0
(4)
-0.0
3-0
.15
0.0
71.0
0
(5)
-0.0
7-0
.12
0.1
00.1
91.0
0
(6)
-0.0
8-0
.21
0.0
90.3
00.1
71.0
0
(7)
0.0
20.0
3-0
.14
-0.3
0-0
.08
-0.3
31.0
0
(8)
-0.1
4-0
.11
0.1
20.2
80.2
10.1
3-0
.12
1.0
0
(9)
0.0
10.0
2-0
.05
0.0
5-0
.05
0.2
7-0
.04
-0.0
31.0
0
(10)
0.0
10.0
5-0
.00
-0.0
4-0
.03
-0.0
1-0
.03
-0.0
2-0
.03
1.0
0
(11)
-0.1
50.0
2-0
.02
-0.0
0-0
.04
-0.1
10.0
50.0
1-0
.09
0.0
31.0
0
(12)
0.0
20.1
00.0
9-0
.08
0.0
0-0
.04
-0.0
60.0
6-0
.02
0.1
50.1
81.0
0
(13)
0.0
2-0
.17
0.1
60.4
30.0
70.3
4-0
.24
0.1
20.0
4-0
.08
-0.0
2-0
.03
1.0
0
(14)
-0.0
40.1
1-0
.11
-0.1
4-0
.01
-0.0
80.1
2-0
.08
0.0
4-0
.01
-0.0
3-0
.08
-0.2
51.0
0
(15)
0.0
0-0
.00
0.0
70.0
1-0
.01
0.0
7-0
.09
0.1
9-0
.08
0.1
20.0
20.2
70.0
4-0
.02
1.0
0
Tab
le6:
Th
eta
ble
rep
ort
sth
ep
air
wis
eP
ears
on
corr
elati
on
coeffi
cien
tsb
etw
een
the
vari
ab
les
pote
nti
ally
det
erm
inin
gle
ver
age
dyn
am
ics.
(1)
isth
ech
an
ge
inle
ver
age.
(2)
isth
e
diff
eren
ceb
etw
een
act
ual
lever
age
an
dth
ees
tim
ate
dta
rget
lever
age.
(3)
isth
era
teof
inves
tmen
t.(4
)is
the
lagged
retu
rnon
ass
ets.
(5)
isth
ela
gged
aver
age
an
nu
al
stock
retu
rnon
the
firm
.(6
)is
the
earn
ings-
to-p
rice
rati
o.
(7)
isth
evari
ab
leca
ptu
rin
gth
ew
ealt
htr
an
sfer
tod
ebt
hold
ers
from
equ
ity
issu
es,
esp
ecia
lly
rele
vant
for
firm
sw
ith
lon
g-t
erm
fin
an
cin
gan
din
fin
an
cial
dis
tres
s.(8
)is
the
book
valu
ed
ilu
tion
du
mm
y.(9
)is
the
earn
ings
per
share
dilu
tion
du
mm
y.(1
0)
isth
ela
gged
exte
rnal
fin
an
ce-w
eighte
daver
age
mark
et-t
o-b
ook
rati
o.
(11)
isth
ete
rmst
ruct
ure
of
inte
rest
rate
s.(1
2)
isth
ere
lati
ve
cost
of
deb
t.(1
3)
isth
eea
rned
-to-t
ota
lca
pit
al
rati
o.
(14)
isth
ed
um
my
for
the
pre
sen
ceof
net
op
erati
ng
loss
esca
rrie
dfo
rward
.(1
5)
isth
ed
um
my
for
the
pre
sen
ceof
deb
tra
tin
gs.
See
Tab
le3
for
det
ails
on
vari
ab
led
efin
itio
ns.
30
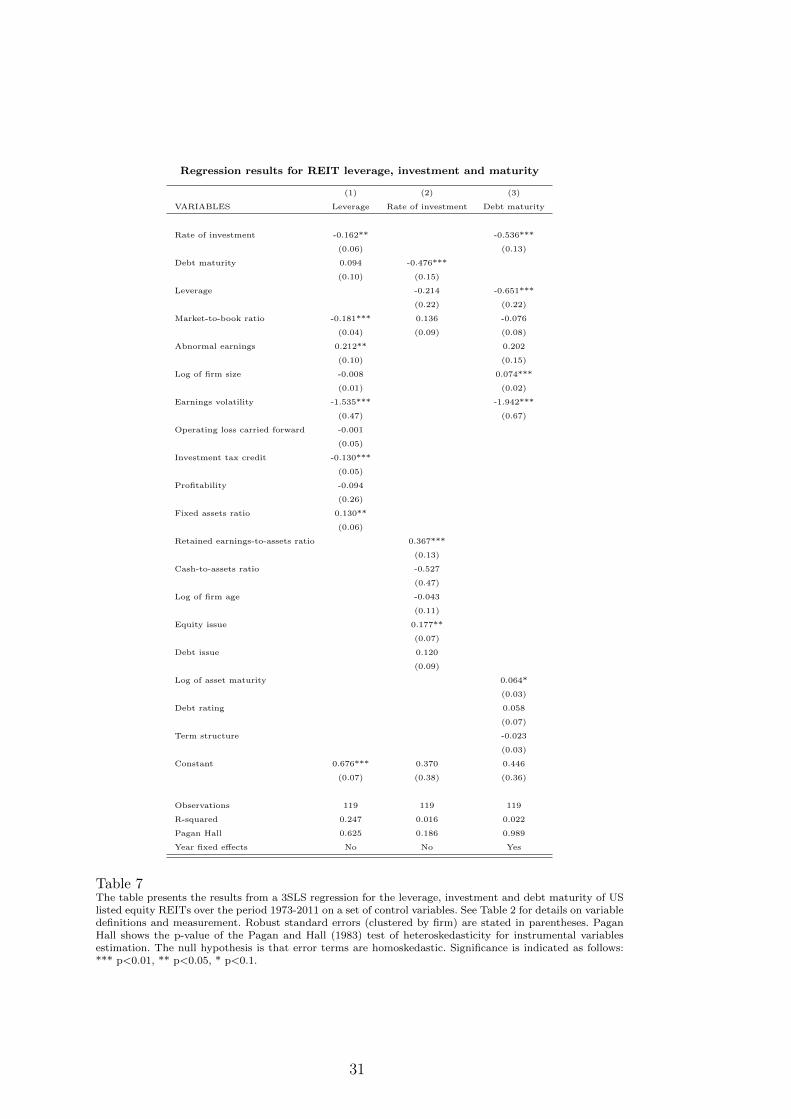
Regression results for REIT leverage, investment and maturity
(1) (2) (3)
VARIABLES Leverage Rate of investment Debt maturity
Rate of investment -0.162** -0.536***
(0.06) (0.13)
Debt maturity 0.094 -0.476***
(0.10) (0.15)
Leverage -0.214 -0.651***
(0.22) (0.22)
Market-to-book ratio -0.181*** 0.136 -0.076
(0.04) (0.09) (0.08)
Abnormal earnings 0.212** 0.202
(0.10) (0.15)
Log of firm size -0.008 0.074***
(0.01) (0.02)
Earnings volatility -1.535*** -1.942***
(0.47) (0.67)
Operating loss carried forward -0.001
(0.05)
Investment tax credit -0.130***
(0.05)
Profitability -0.094
(0.26)
Fixed assets ratio 0.130**
(0.06)
Retained earnings-to-assets ratio 0.367***
(0.13)
Cash-to-assets ratio -0.527
(0.47)
Log of firm age -0.043
(0.11)
Equity issue 0.177**
(0.07)
Debt issue 0.120
(0.09)
Log of asset maturity 0.064*
(0.03)
Debt rating 0.058
(0.07)
Term structure -0.023
(0.03)
Constant 0.676*** 0.370 0.446
(0.07) (0.38) (0.36)
Observations 119 119 119
R-squared 0.247 0.016 0.022
Pagan Hall 0.625 0.186 0.989
Year fixed effects No No Yes
Table 7The table presents the results from a 3SLS regression for the leverage, investment and debt maturity of USlisted equity REITs over the period 1973-2011 on a set of control variables. See Table 2 for details on variabledefinitions and measurement. Robust standard errors (clustered by firm) are stated in parentheses. PaganHall shows the p-value of the Pagan and Hall (1983) test of heteroskedasticity for instrumental variablesestimation. The null hypothesis is that error terms are homoskedastic. Significance is indicated as follows:*** p<0.01, ** p<0.05, * p<0.1.
31

Regression results for deviations from target leverage
(1) (2) (3)
VARIABLES Impediments Accounting measures Timing & Flexibility
Rate of investment 0.098*** 0.107*** 0.099***
(0.02) (0.02) (0.02)
Operating loss carried forward -0.005 -0.007 0.022
(0.03) (0.03) (0.03)
Lag of return on assets -0.412* -0.312* -0.409
(0.22) (0.19) (0.25)
Lag of stock return -0.336 -0.304 -0.327
(0.28) (0.25) (0.29)
Earnings-to-price ratio -0.061** -0.072*** -0.080***
(0.03) (0.02) (0.03)
Transfer 0.019
(0.04)
Debt rating 0.042
(0.04)
Book value dilution dummy -0.083***
(0.03)
EPS dilution dummy -0.002
(0.02)
Lag of EFWA MB 0.020
(0.03)
Term structure -0.001
(0.01)
Relative cost of debt -4.026
(5.39)
Earned-to-total capital ratio 0.027
(0.10)
Constant 0.228*** 0.289*** 0.103
(0.05) (0.05) (0.07)
Observations 688 688 640
R-squared 0.205 0.242 0.218
Number of firm clusters 121 121 116
Sector fixed effects Yes Yes Yes
Year fixed effects Yes Yes Yes
Table 8The table presents the results from a firm fixed effects panel regression of deviations from target leverage(dependent variable) of US listed equity REITs over the period 1973-2011 on a measure of the rate of invest-ment. Specification (1) controls for the standard set of factors driving or inhibiting dynamic adjustmentsto capital structure. Specification (2) additionally controls for a set of accounting measures of value or firmperformance that depend on leverage and thus might be of concern in making changes to the firm’s capitalstructure. Specification (3) allows for the dynamics of leverage and measures of market timing as well as ameasure of financial flexibility as an additional test for the robustness of Our results. See Table 3 for detailson variable definitions. Robust standard errors (clustered by firm) are stated in parentheses. Significance isindicated as follows: *** p<0.01, ** p<0.05, * p<0.1.
32

Regression results for changes in leverage
(1) (2) (3)
VARIABLES Impediments Accounting measures Timing & Flexibility
Deviation from target 0.297*** 0.284*** 0.296***
(0.05) (0.05) (0.05)
Rate of investment 0.114*** 0.116*** 0.125***
(0.02) (0.02) (0.02)
Operating loss carried forward 0.034** 0.033** 0.033*
(0.02) (0.02) (0.02)
Lag of return on assets 0.206** 0.225** 0.253**
(0.09) (0.09) (0.10)
Lag of stock return 0.011 0.006 -0.195
(0.20) (0.20) (0.16)
Earnings-to-price ratio -0.033 -0.040* -0.030
(0.02) (0.02) (0.02)
Transfer 0.021
(0.03)
Debt rating -0.012
(0.02)
Book value dilution dummy -0.019*
(0.01)
EPS dilution dummy -0.002
(0.01)
Lag of EFWA MB -0.022**
(0.01)
Term structure 0.000
(0.01)
Relative cost of debt -2.572
(3.33)
Earned-to-total capital ratio -0.024
(0.04)
Constant -0.034 -0.054*** -0.065
(0.02) (0.02) (0.05)
Observations 687 687 639
R-squared 0.404 0.406 0.412
Number of firm clusters 121 121 116
Sector fixed effects Yes Yes Yes
Year fixed effects Yes Yes Yes
Table 9The table presents the results from a firm fixed effects panel regression of changes in leverage (dependentvariable) of US listed equity REITs over the period 1973-2011 on a measure of the rate of investment.Specification (1) controls for the standard set of factors driving or inhibiting dynamic adjustments to capitalstructure. Specification (2) additionally controls for a set of accounting measures of value or firm performancethat depend on leverage and thus might be of concern in making changes to the firm’s capital structure.Specification (3) allows for the dynamics of leverage and measures of market timing as well as a measure offinancial flexibility as an additional test for the robustness of Our results. See Table 3 for details on variabledefinitions. Robust standard errors (clustered by firm) are stated in parentheses. Significance is indicated asfollows: *** p<0.01, ** p<0.05, * p<0.1.
33