Embed Size (px)
Citation preview


1
The Inter-Arab Investment Guarantee Corporation is an autonomous
Arab regional organization established in 1974 by a number of Arab states,
in accordance with a multilateral Convention deposited with the Ministry
of Foreign Affairs in the State of Kuwait. The Corporation commenced
its operations in mid-1975 and its membership currently encompasses all
the Arab states (excluding Comoros), in addition to a number of Arab-
international organizations.
OBJECTIVES:- The Corporation provides insurance coverage for inter-Arab investments
against non-commercial risks such as nationalization, confiscation,
expropriation, war, civil disturbances of a public nature, and currency
inconvertibility. Furthermore, the Corporation provides insurance for
Arab export credits to worldwide markets against commercial risks such
as default, insolvency, bankruptcy of the debtor or its refusal to receive
the goods, and against non-commercial risks such as cancellation of
import license, prevention of the entry or passage of the goods and other
non-commercial risks.
- The Corporation also promotes the flow of Arab capital among Arab
countries by undertaking activities complementary to its insurance
services, in particular, developing research with respect to identifying
investment opportunities and their conditions in the Arab countries.
Headquarters
Arab Organization’s Headquarters BuildingJamal Abdul Nasser Street and Airport Road Intersection,
Shuwaikh, KuwaitP.O.Box: (23568) - Safat 13096
Tel: (965) 484-4500, Fax: (965) 484-1240, 483-5489, 481-5741E-mail: [email protected]: www.iaigc.org
2
The Inter-Arab Investment Guarantee Corporation consists of the following structure:
1. The Shareholders’ Council
The Shareholders’ Council comprises of a representative from each of the countries and organizations subscribed to the Corporation’s capital. The Council is the highest authority of the Corporation and has all the powers necessary to execute the Corporation’s objectives. In particular, the Council formulates general policies, interprets and amends provisions of the Convention, adopts financial and administrative rules and regulations, and appoints members of the Board of Directors and the Director General.
2. The Board of Directors
The Board consists of eight part-time members appointed by the Shareholders’ Council for a three-year term. The Board elects its Chairman from among its members, prepares the financial and administrative rules for the Corporation and approves the operations and research programs and plans, in addition to determining how the Corporation’s capital is to be utilized. It also sets the annual budget and presents the annual report to the Shareholders’ Council.
The current members of the Board of Directors:
H.E. Mr. Nassir Ben Mohamad Al Quhtani Chairman
H.E. Mr. Khaled AB. Al-Mujhem Member
H.E. Mr. Ali Ramadhan Shnebesh Member
H.E. Mr. Jassem Rashed Al Shamsi Member
H.E. Mr. Mohammed Ali Taleb Member
H.E. Mr. Abdel Latif Chaabane Member
H.E. Mr. Abdel Qader M. Ahmed Member
H.E. Mr. Mohamad Ghassan Al-Habsh Member
3. The Director General
The Director General is the legal representative of the Corporation who is in charge of running the Corporation with the Board’s supervision. The Director General has the authority to conclude insurance agreements, invest the capital of the Corporation, prepare estimate budgets, prepare year-end statements, development, operations programs and plans and the Corporation’s research programs.
The current Director General: Mr. Fahad Rashid Al Ibrahim
4. Professional and Administrative Staff
The Corporation’s Structure

3
His Excellency the Chairman of the 33rd Session of the Shareholders’ Council of the
Inter-Arab Investment Guarantee Corporation,
In accordance with Article (12) (e) of the Inter-Arab Investment Guarantee Corporation’s
Convention, it is my pleasure to submit to your honorable Council for consideration the
Annual Report of the Board of Directors on the activity of the Corporation for the year
2005.
Please accept my highest consideration,
Nassir Ben Mohamad Al Quhtani
Chairman of the Board of Directors
Rabat, April 2006

4
Contents
Chapter One: IntroductionOverview of Global and Arab Economic Developments
and Summary of the Corporation’s Activities in 2005 ....................................................................................... 5
Chapter Two: Guarantee Operations2.1 Guarantee Operations ............................................................................................................................................................................. 14
2.2 Compensation and Recovery ........................................................................................................................................................ 20
2.3 Reinsurance ........................................................................................................................................................................................................... 20
2.4 Marketing Guarantee Services ..................................................................................................................................................... 20
2.5 Relationship with Guarantee Agencies ............................................................................................................................ 23
2.6 Special Accounts ............................................................................................................................................................................................. 24
TablesTable (1): Total Value of Guarantee Operations During 2005 ....................................................................... 25
Table (2): Value of Contracts Signed During 2005 by
Exporting Country & Type of Contract .................................................................................................................................... 26
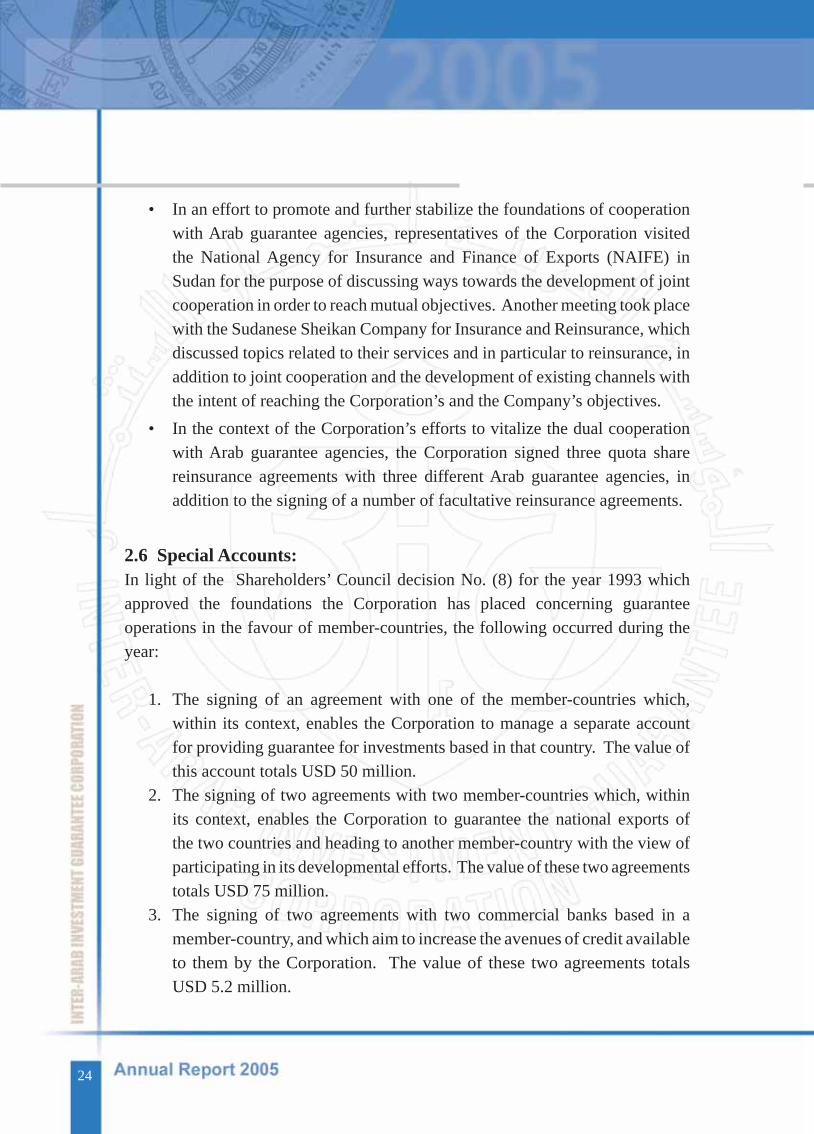
Table (3): Value of Contracts Signed During 2005 by
Host/Importing Country & Type of Contract .................................................................................................................... 27
Table (4): Value of Current Contracts & Outstanding Commitments
as at 31 December 2005 by Host/Importing Country ................................................................................................ 28
GraphsChart (1): Guarantee Contracts Signed During 2005 by Nationality of Guaranteed Parties ... 29
Chart (2): Guarantee Contracts Signed During 2005 by Host/Importing Countries ................ 29
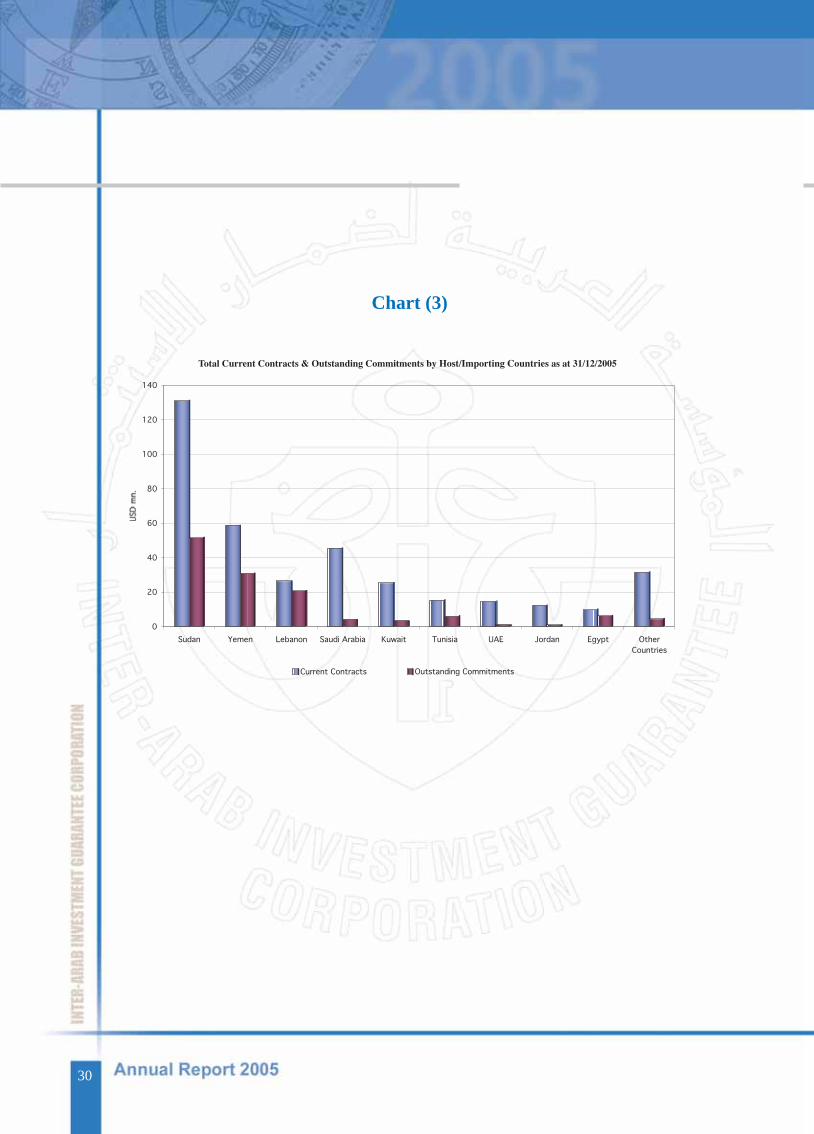
Chart (3): Total Current Contracts & Outstanding Commitments by Host/Importing
Countries as at 31 December 2005 ....................................................................................................................................................... 30
Chapter Three: Complementary Activities and Support Services3.1 Reports, Publications and Introductory Papers ...................................................................................................... 31
3.2 Conferences and Seminars ............................................................................................................................................................... 32
3.3 Cooperation with Regional and International Institutions ....................................................................... 32
3.4 Development of Human Resources ........................................................................................................................................ 34
3.5 Information Services ................................................................................................................................................................................ 34
Chapter four: Financial ReportAuditor’s Report ...................................................................................................................................................................................................... 39
Statement of Revenues and Expenses for the Year Ended 31 December 2005 ........................ 40
Balance Sheets at 31 December 2005 .......................................................................................................................................... 41
Statement of Changes in Equity for the Year Ended 31 December 2005 ........................................ 42
Statements of Cash Flows for the Year Ended 31 December 2005 ......................................................... 43
Notes to the Financial Statements, 31 December 2005 ........................................................................................... 44

5
1. World Economy
The world economy witnessed, according to International Monetary Fund. (IMF) sources, a slight decline in the rate of growth to around 4.3%, compared to a growth rate of 5.1% in 2004, and 4.0% in 2003. This was attributed to a decrease in the rate of growth of the Group of Advanced Economies to 2.5%, compared to a growth rate of 3.3% in 2004. Supported by continued growth in countries like China (9%) and India (7.1%), other Emerging Markets and Developing Countries witnessed a higher growth rate above world average, reaching around 6.4%, however below its growth rate of 7.3% in 2004. Total value of world input in 2005 is estimated to have reached around USD 43.9 trillion. On the other hand, inflation, as measured by the Consumer Price Index, maintained a low level in the Group of Advanced Economies, reaching around 2.2% in 2005, compared to 2.0% in 2004, while other Emerging Markets and Developing Countries maintained a higher inflation rate of 5.9%; close to their level of 5.8 % in 2004.
The global economy maintained its resilience in 2005, despite repercussions brought on by the continued and unprecedented rise in the prices of oil, which in turn triggered a rise in liquidity in an effort to seek higher earnings and returns. This was reflected in the robust stock markets and credit-fueled consumption stemming from strong consumer demand, which in turn brought on remarkable growth in the services sector.
Efforts continued towards great trade liberalization despite rising fears of neo-protectionism, which maintained sound monetary policies that aimed at curtailing inflationary policies, along with the adherence to more prudent fiscal policies that resulted in improved current account positions, enhanced structural reforms, institutional build-up and a more active role from the private sector.
With regards to Foreign Direct Investment (FDI) developments in 2005 and according to preliminary estimates by the United Nations Conference on Trade and Development (UNCTAD), global inflows during 2005 reached around USD 897 billion, rising remarkably by 29% of their level in 2004 (around USD 695 billion).
This positive influence was brought upon by continued world economic growth, increased cross-border mergers & acquisitions (M&A), robust international stock
Chapter One: Overview of Global and Arab Economic Developments, and Summary of the Corporation’s Activities in 2005

6
markets, an improved investment climate, successful investment promotion efforts of host countries, and improved procedures for doing business. FDI inflows to Developed Countries were estimated at around USD 573 billion, comprising 64% of total world FDI inflows, while FDI inflows to Developing Countries were estimated around USD 274 billion, comprising 30.5% of total FDI inflows, whereas Economies in Transition (south-eastern Europe and Commonwealth of Independent States) received around USD 50 billion, comprising a share of 5.5%. Main recipients of world FDI inflows were the United Kingdom (USD 219 billion), USA (USD 106 billion), China (USD 60 billion) and France (USD 48 billion).
Furthermore, according to the Institute of International Finance (IIF), being the association of the largest group of international financial and banking institutions, net private capital flows to emerging market economies (29 countries) surged to USD 358 billion in 2005; up from USD 319 billion in 2004 and driven by a net increase in portfolio investment from USD 37.8 billion to around USD 61.5 billion, while net FDI flows received by these countries maintained a higher level at around USD 136 billion, and net official flows reached a negative (USD 65 billion), down from negative (USD 27 billion) for the same period. Four Arab countries (Egypt, Tunisia, Algeria and Morocco) are included in IIF database.
With regards to world trade movement in 2005, trade volume in goods and services declined to a growth rate of 7.0%, compared to 10.3% in 2004. However it was still above its level of 5.4% in 2003. The value of world exports of goods and services increased from USD 11.2 trillion in 2004 to USD 12.6 trillion in 2005.
With respect to the guarantee industry, the global guarantee market maintained its stability and strength during 2005. Major export credit guarantee witnessed further expansion in their operations through the opening up of branches in new markets and entering into strategic alliances. Several guarantee agencies witnessed internal restructuring brought on by increases in their capital to accommodate recent market developments, improvement of business environment, and expansion of

7
world trade. Pricing of guarantee contracts increased in 2005 and included more flexible coverage terms and expanded payment periods, particularly to emerging market economies, which for the third consecutive year maintained a strong position attributed to their political stability, increased export revenues from oil and other primary commodities, which positively affected their credit rating and ability to access credit. Emerging market economies have increasingly become an integral part of world investment architecture, despite potential risks arising particularly from economic management related issues.
Efforts were further enhanced during 2005 to improve guarantee underwriting methods, including a shift in preference to open account payments rather than letters of credit (L/C’s), largely approving utilization of electronic means for the exchange of information and the processing of credit and shipping documents. Diversified products were introduced in response to emerging developments such as loan guarantees backed by proven oil reserves and the use of one-risk guarantee, whether political or commercial risk. Guarantee agencies paid further attention to environmental and social considerations in the projects approved. In this regard, European guarantee agencies launched an experimental 24-month program, through which long term credit coverage (15 years) will be provided for power generation projects utilizing renewable sources of energy.
2. Arab Economy
With regards to Arab economic developments and according to international sources, preliminary estimates reflected a stable economic growth rate in Arab countries reaching 5.4% in 2005; close to their level of 5.5% in 2004. A number of Arab countries realized higher growth rates between 6% and 10%, particularly the Arab oil-exporting countries. Inflation in Arab countries increased to reach around 10% in 2005, compared to 8.4 % in 2004, affected by continued high oil prices and rise in interest rates. Oil revenues witnessed an unprecedented increase, as a result of higher oil prices unseen in twenty years, entailing an increase in public expenditure, particularly in investment expenditure and public infrastructural

8
projects, reinforcing economic reform programs and the ability to service public debt, turning public deficits into surpluses in many Arab countries while enhancing existing budget surpluses in others. Current account position improved remarkably, consolidating external balances and sustaining higher official reserves for the Arab oil exporting countries.
With regards to Foreign Direct Investment (FDI) and according to initial estimates, FDI inflows received by Arab countries witnessed a massive increase estimated at around USD 29.6 billion in 2005, reaching for the first time 3.3% of total world FDI inflows, and around 10.8% of total FDI inflows to developing countries. FDI inflows were mainly concentrated in the UAE (USD 10 billion), Egypt (USD 4.1 billion), Saudi Arabia (USD 3.5 billion), Sudan (USD 2.1 billion) and Morocco (USD 1.2 billion), compared to a revised USD 19.8 billion in 2004, comprising around 2.7% of total world FDI inflows and around 8.2% of total FDI inflows to developing economies, and, at the time, were concentrated in the UAE (USD 8.4 billion), Saudi Arabia (USD 1.9 billion), Sudan (USD 1.5 billion), Egypt (USD 1.3 billion) and Syria (USD 1.2 billion). This increased share of FDI inflows to Arab countries was largely attributed to increased inter-Arab investments stemming from high oil prices and revenues to unprecedented levels, opening of new sectors for investment, particularly the services sector (communications, transport, electricity, media, civil aviation), oil, gas and mining sectors, expansion in establishment of major industrial, tourism and real estate projects, infrastructural projects (airports, seaports and railways), and continued privatization programs in a number of Arab countries, in addition to a rise in national investment promotion efforts, continued improvement of investment climate, enhancement of transparency, procedures facilitation, tackling investment impediments, attempts to increase availability of recent and accurate information and establishment of statistical databases in accordance with international criteria.
Inter-Arab Investments witnessed an unprecedented increase due to colossal financial surpluses resulting from high oil revenues. These funds were invested in attractive opportunities available in a number of Arab countries, particularly the tourism sector which received enormous investments exceeding USD 50 billion. The real estate sector also witnessed an unprecedented increase which entailed a notable growth of inter-Arab investments in this sector. Also, inter-Arab

9
investments increased in infrastructure, industry, communications and banking sectors, particularly after permission was granted for Arab banks to open branches or own other banks in several Arab countries. Similarly, investments increased in Arab stock markets and investment funds as a result of increased joint listing in Arab stock markets and the transformation of family-run companies into public shareholding companies, in order to be listed in Arab stock markets or in the New York and London stock markets. The year 2005 also witnessed further measure to launch the Unified Arab Stock Exchange, with its headquarters based in the “Smart Village” in Egypt. Efforts were intensified to attract Arab funds abroad and expatriate investments, to further support their role in adding to the local private sector contribution in terms of economic and social development.
With regards to Arab trade movement, it is expected to have increased in 2005 due to higher oil prices, fostering growth of Arab exports, of which oil exports comprises around 70%, enhanced access of Arab exports into world markets, improved quality of products exported, more adherence to international standards, and establishment of export development agencies.
The year 2005 also witnessed the implementation of Greater Arab Free Trade Area, consisting of (17) Arab countries, representing 90% and 95% of total Arab and inter-Arab trade, respectively. Furthermore, the Arab Union of exporters and importers was established, and a joint Arab company for trade and marketing was launched. Saudi Arabia became a member of World Trade Organization the (WTO), and (5) other Arab countries (Algeria, Sudan, Lebanon, Libya and Yemen) continued with the WTO membership accession process. Twelve Arab countries out of 149 WTO members are already full members, and Iraq acquired observer status.
The economic and commercial cooperation with Latin America was further enhanced during the year through the “Brasilia Summit”, as a number of Arab and Latin American countries agreed initially to establish free trade areas. Negotiations were also resumed between the USA and a number of Arab countries (Kuwait, Oman, UAE, and Egypt) for the purpose of establishing bilateral free trade areas (FTA’s), following the conclusion of similar agreements with Jordan, Morocco and Bahrain. Furthermore, a framework agreement for establishment of free trade areas between Turkey and the Arab Gulf countries, Syria and Egypt, was concluded during the year. The Arab Gulf countries also resumed negotiations towards the

10
establishment of free trade areas with the European Union countries and China. The first Arab-Russian business conference was convened during the year.
With respect to guarantee industry, Arab national and regional agencies witnessed rising activities in 2005, as reflected in the increase in number and quality of guarantee contracts signed compared to 2004, during which (308) guarantee contracts were signed, with the total number of current contracts reaching (1,727) contracts, whereas exports insured reached a total of USD 1.5 billion. Total Guarantee premium income is expected to have increased in 2005, compared to its level in 2004, reaching around USD 13 million. Paid compensation further dropped by 72% in 2004 compared to previous years, while recovery rates and the tendency for risk sharing continued to improve. Both recovery and loss ratios rose in 2004 to reach 68% and 18% respectively.
Cooperation among Arab and regional agencies increased during the year, particularly in factoring, reinsurance of exports to Iraq, provision of new guarantee services covering tourism, pre-shipping risks, letters of credit, cross- border financial leasing and improved debt collection methods. A number of obstacles continued to adversely affect operations of Arab guarantee agencies, of which ability to access international markets for reinsurance treaties, persistent weak public awareness of importance of insurance, continued usage of letters of credit (L/C’s) as a method of payment, and the ability to obtain credit information at reasonable costs. The Tenth Forum of Arab national and regional agencies, which is annually coordinated by the Corporation, convened towards the year end. Several recommendations were put forward, while realising the importance of formulating national legislations for rating Arab national guarantee agencies, acknowledgement by these agencies of offered guarantee as acceptable additional guarantees. Arab countries were also urged to adopt legislations necessary for obtaining reliable and transparent credit information, continued cooperation in technical matters, joint reinsurance operations, resorting to collective bargaining with international reinsurers, and recovery of paid compensations, while also emphasizing the need to exchange credit information and technical capacity building.

11
3. Summary of the Corporation’s Activities:
In 2005, IAIGC compounded its efforts in expanding and adding variety to its range of services, in both the investment and export credit guarantee fields. The outcome of these efforts took effect on three levels:
- An increase in guarantee limits,- An expansion in the volume of guarantee activities and - Diversification of guarantee mechanisms.
For the first time, the Corporation began to execute the Shareholders’ Council’s Decision no. (8) for the year 1993, which authorizes it to guarantee specific operations on behalf of member-countries which in turn expands the country limits.This was relevant to the following countries:
- The Kingdom of Saudi Arabia, which the Corporation provided guarantee for its exports to Iraq within a limit of USD 25 million through a reinsurance arrangement.
- The State of Kuwait, which entered into a special arrangement with the Corporation who in turn provides guarantee to Kuwaiti exports heading to Iraq for the amount of USD 50 million.
- The Republic of Sudan, which established a special account with the Corporation valued at USD 50 million, with the aim of expanding the country-limit guarantee for direct investments intended for Sudan.
On the other hand, agreements were entered into which enable the Corporation to manage the Special Accounts of some Arab banks, established with the aim of guaranteeing the letters of credit issued by these banks in favour of Arab exporters.As for the level of guarantee activity; the Corporation’s efforts and persistence on improving its performance led to a large expansion in the volume of general activity. The total value of guarantee operations signed during 2005 increased to approximately USD 303 million compared to the 2004 value which totaled approximately USD 135 million, which constitutes an increase of 125%.These operations included 61 Export Credit Guarantee Contract with a total value of USD 198 million, which is an increase of 47% when compared to the 47 active contracts in 2004 totaling USD 135 million. This also includes 3 Investment Guarantee Contracts with a total value of approximately USD 75 million. Also included are several reinsurance agreements valued at approximately USD 24 million, in addition to operations valued at USD 6.4 million under the special accounts.Total income generated from guarantee operations also rose towards the end of the

12
year, totaling approximately USD 2.7 million, which included the Corporation’s share of investment returns from the special accounts’ resources. The value of premium income from guarantee operations totaled approximately USD 2.04 million, which constitutes a 63% increase when compared to the USD 1.25 million generated in 2004.On another level, the Corporation focused on the developments that took place in the worldwide guarantee industry, which in turn elevated the standard of its services to a remarkable level, while it took care to diversify its existing line of guarantee products. And in addition to the amendment in the Convention concerning the member-country’s automatic approval to guarantee, should it not decline within 60 days from the date of application, the Corporation’s efforts regarding development of its operations continued through the following procedures:
- The addition of “Breach of Contract” risk to the non-commercial risks covered by the Corporation.
- The segregation of commercial risks from non-commercial risks in the Export Credit Guarantee contracts and the ability to cover any one of them individually.
- The inclusion of Leasing Guarantee as a new guarantee service and the drafting of a guarantee contract concerning it.
- The re-wording of the Comprehensive Export Credit Guarantee contract, the amendment of the general conditions and their separation from the special conditions, in addition to expanding the scope of the guarantee to cover services as well as goods.
While taking care to compound the trust and transparency in the financial statements, the Corporation worked on treating the concerns raised on its financial details, while applying the international accounting practices no. 32 and 39 as of 1st January 2005.Previously agreed upon capital was also settled, after a Shareholders’ Council decision to raise the capital of the Corporation, whereby it acquired according to its assessment USD 55.8 million from the participation of Arab financial institutions.On another note, all of the overdue portions of the capital were settled in addition to compensations due from several member-countries. The Corporation acquired an amount of USD 2.6 million in addition to USD 46 million, which is expected to be attained in the first quarter of 2006 according to an agreed-upon schedule of repayment with the Iraqi government.All these procedures reinforces the rights of all shareholders of the Corporation and opens up the opportunity to expand its activities and increase its income, with the aim of achieving its goals and purposes which it was created for.

13
As for its financial investments, the Corporation has followed the developments of the worldwide and Arab financial markets, and proceeded to transfer part of its portfolio to Gulf markets due to its rapid improvement in performance. Approximately USD 18 million was generated in terms of revenue which is an increase of more than 100% compared to revenue generated from the Corporation’s investments in 2004.In the context of the Corporations constant strive to stabilize the guarantee industry in the Arab world, it place a work program for the establishment of export credit guarantee agencies in member countries. The Corporation offered technical assistance to Sudan and Palestine in order to establish and train new guarantee agencies in these countries.On the other hand and for the benefits of the Guarantee Industry in the Arab countries, the Corporation continued its efforts to strengthen and formalize the cooperative relations with Arab Guarantee Agencies. In this context, the Corporation signed in 2005 Quota Share and Facultative reinsurance treaties with 4 national guarantee agencies. As for the Complementary activates and Support services for guarantee operations, the Corporation participated and attended a number of conferences and seminars that took place in Arab countries during 2005:
-Middle East Insurance Conference. (Bahrain).-Arab Banking Conference (United Arab Emirates)-Carthage Investment Forum (Tunisia)-Sudan Economic and Investment Conference. (Sudan)-Conference for Investment and Trade (Sudan)-Kuwait Products Export Seminar (Kuwait)- The Aqaba Special Economic Zone Authority (Jordan)-First Conference for Arab Manufacturers of Cables (Bahrain)
The Corporation also organized the Tenth Forum of Arab National Guarantee Agencies in Kuwait and organized a number of Forums on Guarantee and Finance in different countries including Libya, Sudan, Syria, Egypt and Yemen with the cooperation of Arab Investment Company (Riyadh).
The Corporation also organized with the General Secretariat of the Arab League cooperation a special meeting to activate the Unified Agreement for Investing Arab Funds in the Arab Countries, in accordance with the resolutions of the Economic and Social Council. The Corporation during the year entered into an agreement with the Multilateral Investment Guarantee Agency (MIGA) to translate into Arabic the content of FDI Promotion Center on the World Wide Web.

14
Chapter Two: Guarantee Operations
2.1 Guarantee Operations
2.1.1 Total Value of Operations:
The total value of guarantee operations signed during 2005 reached approximately USD 303.5 million (KD 88.8 million)1, registering a 125.5% increase in comparison to the value of contracts signed during 2004 which totaled USD134.6 million(KD 39.7 million)2 (see table 1). Total value of operations included the following:
2.1.1.1 Guarantee Contracts:
Sixty-four contracts were signed during 2005, with a cumulative value totaling approximately USD 273.2 million (KD 79.9 million); of which three of those contracts were investment guarantee (in addition to an addendum which raised the maximum guaranteed amount of a previously signed contract), cumulatively totaling approximately USD 74.9 million (KD 21.9 million). Sixty-one export credit guarantee contracts were also signed (in addition to nineteen addendums which increased the maximum guaranteed amounts of a number of previously signed contracts), totaling a value of approximately USD 198.3 million (KD 58 million).
2.1.1.2 Reinsurance:
The value of transactions attributed to the Corporation through reinsurance agreements totaled approximately USD 23.9 million (KD 7million) seven of which are facultative reinsurance agreements totaling USD 7.3 million (KD 2.1 million), in addition to the Corporation’s portion of a quota share treaty signed with an Arab guarantee agency; the value of which totaled approximatelyUSD 16.6 million (KD 4.9 million).
2.1.1.3 Operations signed within the context of special accounts:
The total value of these operations totaled approximately USD 6.4 million (KD 1.9 million). 1 USD 1 = KD 0.2925 as at 31/12/20052 USD 1 = KD 0.2952 as at 31/12/2004

15
The nature of these special accounts is explained in item 2.6.
Investors and exporters from twelve Arab countries benefited from the Corporation’s guarantee, along with two joint Arab-foreign companies. Leading these countries was Saudi Arabia (25.3%), after which came the United Arab Emirates (22.3%), Lebanon (13.1%), Egypt (12.4%), Kuwait (8.2%), the two above-mentioned companies (7%), Tunisia (5.5%), while six other Arab countries accounted for 6.2% of the value of these contracts (see Table 2).
Export Credit Guarantee Contracts Investment Guarantee contractsSpecial AccountsReinsurance
24.7 %
7.9 % 2.1 %
65.3 %
Value of Operations
Mill
ion
USD
Distribution of Guarantee Operations
Value of Operations
USD
mn.

16
The number of host and importing countries totaled 72, led by Sudan (31%), Saudi Arabia (16.2%), Yemen (14.5%), Kuwait (9.3%), the United Arab Emirates (4.8%), Jordan (4.4%), Qatar (2.2%), China (2.1%), Bahrain (1.9%), Egypt (1.6%), while sixty-two other countries accounted for 12% of the value of these contracts (see Table 3).
Guarantee Operations by Nationality of Guaranteed Parties
Other Countries
Oman
Jordan
Bahrain
Tunisia
Joint Cos.
Kuwait
Egypt
Lebanon
UAE
Saudi Arabia
USD mn.
Guarantee Operations by Nationality of Guaranteed Parties

17
2.1.2 Details of Guarantee Operations:
2.1.2.1 Investment Guarantee Contracts:1. Equity Participation Guarantee Contract for the participation in the capital
of a company in Yemen, signed with a Saudi Arabian company, valued at USD 30 million (KD 8.8 million).
2. Equity Participation Guarantee Contract for the participation in the capital of a company in Sudan, signed with a United Arab Emirates company, valued at USD 37.5 million (KD 10.9 million); USD 4 million of which were allocated to operations signed under the special accounts.
3. Equity Participation Guarantee Contract for the participation in the capital of a company in Syria, signed with a Bahraini company, valued at USD 1.4 million (KD 0.4 million).
4. An addendum to an Equity Participation Guarantee Contract of a company in Yemen, previously signed with a joint Arab-foreign company, valued at USD 10 million (KD 2.9 million).
Guarantee Operations by Importing Countries

18
2.1.2.2 Export Credit Guarantee Contracts:
Sixty-one Export Credit Guarantee Contracts were signed during the year, in addition to nineteen addendums which raised the maximum limits of previously signed contracts, and which brings the total value of contracts and addendums to approximately USD 198.3 million (KD 58 million). This constitutes a 47.3% increase, when compared to the Export Credit Guarantee Contracts signed in 2004 and which totaled approximately USD 134.6 million.Taking these contracts into account, the value of approved revolving limits totaled approximately USD 93.7 million (KD 27.4 million), which represents the Corporation’s maximum guarantee commitment at any point of time for approved importers towards guarantee applicants.
Clasification of Goods Under Export Credit Guarantee
Building Materials
Metal
Foodstuffs
Wood
Plastic Material
Transportation Vehicles
Chemicals
EquipmentAnimal Products
Miscellaneous
10 %
9 %
6 %5 % 5 %3 % 3 %
24 %
20 %15 %
Distribution of Contracts by Type
Classification of Goods Under Export Credit Guarantee

19
2.1.3 Value of Current Contracts & Outstanding Commitments:The value of current contracts totaled approximately USD 371.8 million (KD 108.7 million), distributed between 43.3% for Investment Guarantee contracts and 56.7% for Export Credit Guarantee contracts, in comparison with USD 266.1 million (KD 78.6 million) which represents the total value of current contracts as at 31 December 2004.
The total value of the Corporation’s guarantee commitments vis-à-vis the guaranteed parties as at 31 December 2005 reached approximately USD 129.4 million (KD 37.9 million)3, representing 34.8% of the total current contracts, in comparison to the total value of the Corporation’s commitments as at 31 December 2004 which totaled USD 100.3 million (see Table 4).
2.1.4 Results from Guarantee Operations:Total revenue generated from guarantee operations at the end of the year totaled
approximately USD 2.76 million (KD 807,000), which was generated from the
following:
2.1.4.1 USD 2.04 million (KD 597,000) generated by guarantee premium
from contracts signed; 30% of which were from Investment Guarantee
contracts and 70% of which were from Export Credit Guarantee
contracts.
2.1.4.2 USD 2,962 (KD 866) representing the Corporation’s share of premiums
generated from contracts signed under the special accounts.
The rate of generated premium therefore increased by 63.3%, compared with the premium of 2004.
2.1.4.3 USD 0.72 million (KD 210,000) which represent the Corporation’s
share of income generated from investing the resources of the special
accounts.
3 The outstanding Guarantee commitments represents the following:
• In the case of Investment Guarantee contracts: the value of investments executed.
• In the case of Export Credit Guarantee contracts: the value of shipments executed by not yet repaid.
Such commitments do not constitute compensation unless any of the risks covered is realized.

20
2.2 Compensation & Recovery:During the year, two compensations totaling USD 47,503 were paid to exporters against the realization of commercial risks. Two Exporters from an Arab country benefited from the compensations paid. The Corporation also recovered USD 170,621 for compensations paid against commercial losses incurred in a number of Arab countries.That being said, the loss ratio for 2005 is 2.3%, which represents the amount compensated during the year in comparison to the value of guarantee premiums.Conversely, the recovery ratio totaled 359.2%, which represents the amount the Corporation recovered during the year in comparison to the value of compensations paid.
2.3 Reinsurance:
2.3.1 The Corporation’s efforts in the reinsurance market resulted in the agreement to sign two Quota Share Reinsurance treaties with two large reinsurance specialists, whereby the Corporation intends to cede 50% of its short term commitments from the Export Credit Guarantee contracts signed.These two treaties serve the Corporation’s objective to increase its underwriting capacity while lessening its exposure to risks covered and losses that might results thereof. The two treaties will be active as of 1st of January 2006.
2.3.2 Inward Reinsurance:The cumulative value of operations accepted by the Corporation for reinsurance totaled approximately USD 23.9 million (KD 7 million); which was previously referred to in part 2.1.1.2
2.3.3 Outward Reinsurance:The Corporation signed four facultative reinsurance treaties with an export credit guarantee agency, with their cumulative value totaling USD 795,000, whereby the Corporation ceded to the Agency 50% of the value of the treaties.
2.4 Marketing Guarantee Services:
2.4.1 The Corporation continued its efforts to market the guarantee services through the following means:

21
2.4.2 The Corporation’s field missions covered 422 companies and corporations
in all of Saudi Arabia, Kuwait, Egypt, Lebanon, the United Arab Emirates, Qatar,
Yemen, Bahrain and Syria. The Corporation’s efforts during these visits focused
on markets and industries ranging from investment, manufacturing, electrical,
metal, foodstuffs, chemical, plastic, pharmaceutical, textile, banking, packaging
and others.
The Corporation also participated in the Kuwait Manufacturing Exhibition which
took place during the period of 19th February – 1st March 2005 in Kuwait City,
during which many important exporting companies were met.
2.4.3 Direct Mail Campaigns:Approximately 5,900 parties were contacted through the Corporation’s direct mail
campaign which included exporting companies, investment companies, financial
institutions and leasing companies from Kuwait, Saudi Arabia, Bahrain, the United
Arab Emirates, Lebanon, Syria, Egypt, Tunisia, Algeria and Morocco. These mailing
campaigns were executed by way of mail and fax, with the intention of introducing
companies and institutions to the Corporation’s two Guarantee Schemes, as well as
the Lease Guarantee service.
2.4.4 Introductory Material:The Corporation produced two new brochures for the Loan Guarantee Contract and
the Letter of Credit Guarantee Contract, in addition to new flyers specific to the
Corporation’s participation in numerous exhibitions, conferences and meetings.
2.4.5 BrokersSix brokerage agreements were signed during the year for the purpose of marketing
the guarantee services the Corporation offers. That being said, the number of active
brokerage agreements now total 61 at year end, distributed across 16 Arab countries,
in addition to a brokerage agreement for the marketing of the Corporation’s Loan
Guarantee in the United Kingdom and France.

22
2.4.6 Conferences and Meetings which the Corporation organized or participated in and related to guarantee operations:The Corporation organized the following five meetings during 2005 in five different member countries:
• A Meeting revolving around the mechanism for guaranteeing and financing export operations and investment projects, held in Khartoum – Sudan during the period 8 – 10 January 2005.
• A Meeting revolving around the mechanism for guaranteeing and financing export operations and investment projects, held in Damascus – Syria during the period 7 – 8 February 2005.
• A Meeting revolving around the mechanism for guaranteeing and financing export operations and investment projects, held in Cairo – Egypt during the period 4 – 5 May 2005.
• The Tenth Annual Meeting for Arab Export Credit Guarantee Agencies, held in Kuwait during the period 9 – 10 November 2005.
• A Meeting revolving around the mechanism for guaranteeing and financing export operations and investment projects, held in Sana’a – Yemen during the period 4 – 5 December 2005.
The Corporation also participated in six of the following meetings in five Arab countries:
• A Seminar for the exporting of Kuwaiti products and participation in Iraqi construction projects, which took place on 24th of February 2005 in Kuwait.
• The Middle East Insurance Meeting held in Bahrain during the period 8–9 March 2005.
• The Arab Banking Conference held in the United Arab Emirates during the period 4–5 April 2005.
• A Sudanese economic and investment meeting which was held during 1–2 May 2005 in Kuwait City.
• The Seventh Carthage Investment Forum which was held during 16–17 June 2005 in Tunis.
• The First Meeting for the Investment and Trade in Sudan during the period 14–15 September 2005, held in Khartoum.

23
2.5 Relationship with Guarantee Agencies:
• The Corporation organized the Tenth Annual Meeting for Arab Guarantee Agencies during the month of November 2005 in its headquarters in Kuwait. Guarantee agencies participated, as well as financial institutions and Arab banks.
On the first day, the Meeting discussed the most important developments occurring with each participating agency, in addition to the presentation of results of a comparison study commissioned by the Corporation and pertaining to the performance of member-agencies to a number of aspects related to their operations. The Corporation’s proposed expectations for the development of the meetings functions were also discussed. On the second day of the Meeting, the development of the relationship between guarantee agencies and financial institutions was discussed, along with ways on which both can reach their collective objectives. Two international experts each presented working papers pertaining to this subject.
The Meeting ultimately resulted in some recommendations; most importantly of which was to liaise with the Arab governments who have no national guarantee agencies and urge them to form the like, and to communicate with the central banks in order for them to issue the appropriate legislation for the formation of these Arab guarantee agencies and to consider the guarantee they issue as an added and acceptable guarantee. In addition to corresponding with the Economic and Social Board of the Arab League to motivate the member countries to adopt the legislation necessary for the transparent disclosure of credit information. The Meeting also recommended the formation of a committee comprising of guarantee agencies and financing institutions to discuss issues pertaining to the development of their bilateral relationship and to work on eliminating any obstacles that might obstruct such a development.
• A meeting was held between IAIGC and the Islamic Corporation for the Insurance of Investment and Export Credit (ICIEC), during which the possibility of developing the joint cooperation between the two corporations in areas pertaining to their services and objectives was discussed; most importantly coinsurance, reinsurance, marketing and underwriting procedures.
24
• In an effort to promote and further stabilize the foundations of cooperation with Arab guarantee agencies, representatives of the Corporation visited the National Agency for Insurance and Finance of Exports (NAIFE) in Sudan for the purpose of discussing ways towards the development of joint cooperation in order to reach mutual objectives. Another meeting took place with the Sudanese Sheikan Company for Insurance and Reinsurance, which discussed topics related to their services and in particular to reinsurance, in addition to joint cooperation and the development of existing channels with the intent of reaching the Corporation’s and the Company’s objectives.
• In the context of the Corporation’s efforts to vitalize the dual cooperation with Arab guarantee agencies, the Corporation signed three quota share reinsurance agreements with three different Arab guarantee agencies, in addition to the signing of a number of facultative reinsurance agreements.
2.6 Special Accounts:In light of the Shareholders’ Council decision No. (8) for the year 1993 which approved the foundations the Corporation has placed concerning guarantee operations in the favour of member-countries, the following occurred during the year:
1. The signing of an agreement with one of the member-countries which, within its context, enables the Corporation to manage a separate account for providing guarantee for investments based in that country. The value of this account totals USD 50 million.
2. The signing of two agreements with two member-countries which, within its context, enables the Corporation to guarantee the national exports of the two countries and heading to another member-country with the view of participating in its developmental efforts. The value of these two agreements totals USD 75 million.
3. The signing of two agreements with two commercial banks based in a member-country, and which aim to increase the avenues of credit available to them by the Corporation. The value of these two agreements totals USD 5.2 million.

25
Tab
le (
1)T
otal
Val
ue o
f G
uara
ntee
Ope
rati
ons
1. C
ontr
acts
Sig
ned
Und
er th
e C
orpo
ratio
n’s
Ow
n R
esou
rces U
SDK
D
Inve
stm
ent
74,8
73,0
0021
,900
,353
Exp
ort C
redi
t19
8,34
6,69
758
,016
,409
Rei
nsur
ance
23,8
76,2
106,
983,
791
Tota
l29
7,09
5,90
786
,900
,553
2. C
ontr
acts
Sig
ned
Und
er S
peci
al A
ccou
nts
USD
KD
Inve
stm
ent
4,00
0,00
01,
170,
000
Exp
ort C
redi
t2,
427,
439
710,
026
Tota
l6,
427,
439
1,88
0,02
6
Gra
nd T
otal
303,
523,
346
88,7
80,5
79

26
Tab
le (
2)V
alue
of
Con
trac
ts S
igne
d D
urin
g 20
05 b
y E
xpor
ting
Cou
ntry
& T
ype
of C
ontr
act
(in
US
Dol
lars
and
KD
Equ
ival
ent)
Export
ing
Countr
yIn
ves
tmen
t C
ontr
acts
Export
Cre
dit
Contr
acts
Tota
l%
of
Tota
lU
SD
KD
%U
SD
KD
%U
SD
KD
1-
Sau
di A
rabia
30,0
00,0
00
8,7
75,0
00
38.0
4%
46,7
42,5
22
13,6
72,1
88
20.8
1%
76,7
42,5
22
22,4
47,1
88
25.2
8%
2-
UA
E37,5
00,0
00
10,9
68,7
50
47.5
4%
30,2
64,0
12
8,8
52,2
24
13.4
7%
67,7
64,0
12
19,8
20,9
74
22.3
3%
3-
Leb
anon
-
--
39,8
29,5
80
11,6
50,1
52
17.7
3%
39,8
29,5
80
11,6
50,1
52
13.1
2%
4-
Egypt
-
--
37,6
73,0
53
11,0
19,3
68
16.7
7%
37,6
73,0
53
11,0
19,3
68
12.4
1%
5-
Kuw
ait
-
--
24,7
67,8
48
7,2
44,5
96
11.0
3%
24,7
67,8
48
7,2
44,5
96
8.1
6%
6-
Join
t C
o.’
s10,0
00,0
00
2,9
25,0
00
12.6
8%
11,1
45,0
00
3,2
59,9
13
4.9
6%
21,1
45,0
00
6,1
84,9
13
6.9
7%
7-
Tunis
ia -
-
-16,6
28,6
36
4,8
63,8
76
7.4
0%
16,6
28,6
36
4,8
63,8
76
5.4
8%
8-
Bah
rain
1,3
73,0
00
401,6
03
1.7
4%
4,6
82,0
00
1,3
69,4
85
2.0
8%
6,0
55,0
00
1,7
71,0
88
1.9
9 %
9-
Jord
an -
-
-4,4
54,1
00
1,3
02,8
24
1.9
8%
4,4
54,1
00
1,3
02,8
24
1.4
7%
10-
Om
an -
-
-4,2
10,0
00
1,2
31,4
25
1.8
7%
4,2
10,0
00
1,2
31,4
25
1.3
9%
11-
Sudan
-
--
3,2
39,2
00
947,4
66
1.4
4%
3,2
39,2
00
947,4
66
1.0
7%
12-
Alg
eria
-
--
714,3
95
208,9
61
0.3
2%
714,3
95
208,9
61
0.2
3%
13-
Pal
esti
ne
-
--
300,0
00
87,7
50
0.1
3%
300,0
00
87,7
50
0.1
0 %
Tota
l for
the
Yea
r78,8
73,0
00
23,0
70,3
53
100%
224,6
50,3
46
65,7
10,2
26
100%
303,5
23,3
46
88,7
80,5
79
100%
% o
f T
ota
l25.9
9%
74.0
1%
27
Tab
le (
3)V
alue
of
Con
trac
ts S
igne
d D
urin
g 20
05 b
y H
ost/
Im
port
ing
Cou
ntry
& T
ype
of C
ontr
act
(in
US
Dol
lars
and
KD
Equ
ival
ent)
Hos
t/ Im
port
ing
Cou
ntry
Inve
stm
ent C
ontr
acts
Exp
ort C
redi
t Con
trac
tsTo
tal
% o
f To
tal
USD
KD
%U
SDK
D%
USD
KD
1 -
Suda
n 3
7,50
0,00
0 1
0,96
8,75
0 47
.54%
56,
486,
924
16,
522,
425
25.1
4% 9
3,98
6,92
4 2
7,49
1,17
5 30
.97%
2 -
Saud
i Ara
bia
-
--
49,
083,
235
14,
356,
846
21.8
5% 4
9,08
3,23
5 1
4,35
6,84
6 16
.17%
3 -
Yem
en 4
0,00
0,00
0 1
1,70
0,00
0 50
.71%
4,1
05,8
76
1,2
00,9
69
1.83
% 4
4,10
5,87
6 1
2,90
0,96
9 14
.53%
4 -
Kuw
ait
-
--
28,
170,
142
8,2
39,7
66
12.5
4% 2
8,17
0,14
2 8
,239
,766
9.
28%
5 -
UA
E -
-
- 1
4,67
7,95
0 4
,293
,300
6.
53%
14,
677,
950
4,2
93,3
00
4.84
%6
-Jo
rdan
-
--
13,
222,
658
3,8
67,6
27
5.89
% 1
3,22
2,65
8 3
,867
,627
4.
36%
7 -
Qat
ar -
-
- 6
,531
,827
1
,910
,559
2.
91%
6,5
31,8
27
1,9
10,5
59
2.15
%8
-C
hina
-
--
6,2
95,1
74
1,8
41,3
38
2.80
% 6
,295
,174
1
,841
,338
2.
07%
9 -
Bah
rain
-
--
5,9
24,9
63
1,7
33,0
52
2.64
% 5
,924
,963
1
,733
,052
1.
95%
10 -
Egy
pt -
-
- 4
,978
,572
1
,456
,232
2.
22%
4,9
78,5
72
1,4
56,2
32
1.64
%11
-O
man
-
--
4,7
64,0
70
1,3
93,4
90
2.12
% 4
,764
,070
1
,393
,490
1.
57%
12 -
Syri
a 1
,373
,000
4
01,6
03
1.74
% 2
,797
,048
8
18,1
37
1.25
% 4
,170
,048
1
,219
,739
1.
37%
13 -
Fran
ce -
-
- 4
,171
,563
1
,220
,182
1.
86%
4,1
71,5
63
1,2
20,1
82
1.37
%14
-It
aly
-
--
3,5
84,1
76
1,0
48,3
71
1.60
% 3
,584
,176
1
,048
,371
1.
18%
15 -
Switz
erla
nd -
-
- 3
,102
,650
9
07,5
25
1.38
% 3
,102
,650
9
07,5
25
1.02
%16
-G
erm
any
-
--
2,6
99,8
09
789
,694
1.
20%
2,6
99,8
09
789
,694
0.
89%
17 -
Indi
a -
-
- 2
,139
,708
6
25,8
64
0.95
% 2
,139
,708
6
25,8
64
0.70
%18
-T
unis
ia -
-
- 1
,597
,245
4
67,1
94
0.71
% 1
,597
,245
4
67,1
94
0.53
%19
-M
oroc
co -
-
- 1
,184
,950
3
46,5
98
0.53
% 1
,184
,950
3
46,5
98
0.39
%20
-L
ibya
-
--
1,1
24,4
14
328
,891
0.
50%
1,1
24,4
14
328
,891
0.
37%
21 -
Serb
ia -
-
- 1
,000
,000
2
92,5
00
0.45
% 1
,000
,000
2
92,5
00
0.33
%22
-U
SA -
-
- 9
00,2
74
263
,330
0.
40%
900
,274
2
63,3
30
0.30
%23
-Sp
ain
-
--
761
,201
2
22,6
51
0.34
% 7
61,2
01
222
,651
0.
25%
24 -
Leb
anon
-
--
727
,291
2
12,7
33
0.32
% 7
27,2
91
212
,733
0.
24%
25 -
Mal
ta -
-
- 7
15,4
91
209
,281
0.
32%
715
,491
2
09,2
81
0.24
%26
-Se
nega
l -
-
- 6
12,8
02
179
,245
0.
27%
612
,802
1
79,2
45
0.20
%27
-T
urke
y -
-
- 4
93,5
65
144
,368
0.
22%
493
,565
1
44,3
68
0.16
%28
-Po
rtug
al -
-
- 4
12,5
98
120
,685
0.
18%
412
,598
1
20,6
85
0.14
%29
-G
reat
Bri
tain
-
--
306
,824
8
9,74
6 0.
14%
306
,824
8
9,74
6 0.
10%
30 -
Irel
and
-
--
228
,504
6
6,83
7 0.
10%
228
,504
6
6,83
7 0.
08%
31 -
Indo
nesi
a -
-
- 1
99,2
92
58,
293
0.09
% 1
99,2
92
58,
293
0.07
%32
-Si
ngap
ore
-
--
198
,291
5
8,00
0 0.
09%
198
,291
5
8,00
0 0.
07%
33 -
Srila
nka
-
--
198
,291
5
8,00
0 0.
09%
198
,291
5
8,00
0 0.
07%
34 -
Alg
eria
-
--
193
,536
5
6,60
9 0.
09%
193
,536
5
6,60
9 0.
06%
35 -
Gre
ece
-
--
166
,917
4
8,82
3 0.
07%
166
,917
4
8,82
3 0.
05%
36 -
Bru
nei
-
--
163
,426
4
7,80
2 0.
07%
163
,426
4
7,80
2 0.
05%
37 -
Can
ada
-
--
163
,426
4
7,80
2 0.
07%
163
,426
4
7,80
2 0.
05%
38 -
Aus
tria
-
--
123
,060
3
5,99
5 0.
05%
123
,060
3
5,99
5 0.
04%
39 -
34 O
ther
Cou
ntri
es -
-
- 4
42,6
06
129
,462
0.
20%
442
,606
1
29,4
62
0.15
%To
tal f
or th
e Y
ear
78,
873,
000
23,
070,
353
100%
224
,650
,346
6
5,71
0,22
6 10
0%30
3,52
3,34
6 8
8,78
0,57
9 10
0%%
of
Tota
l25
.99%
74.0
1%

28
Hos
t/ Im
port
ing
Cur
rent
Inve
stm
ent
Con
trac
tsC
urre
nt E
xpor
t Cre
dit
Con
trac
tsTo
tal C
urre
ntC
ontr
acts
(2)
Out
stan
ding
Com
mitm
ents
for I
nves
tmen
t Con
tract
sO
utst
andi
ng C
omm
itmen
tsfo
r Exp
ort C
redi
t Con
tract
sTo
tal O
utst
andi
ngC
omm
itmen
ts(3
)
Cou
ntry
USD
KD
USD
KD
USD
KD
USD
KD
USD
KD
USD
KD
%Jo
rdan
- -
12,2
17,2
123,
573,
535
12,2
17,2
123,
573,
535
- -
955,
898
279,
600
955,
898
279,
600
0.74
%U
AE
- -
14,5
14,0
344,
245,
355
14,5
14,0
344,
245,
355
- -
1,15
7,29
833
8,51
01,
157,
298
338,
510
0.89
%B
ahra
in -
- 4,
599,
442
1,34
5,33
74,
599,
442
1,34
5,33
7 -
- 25
4,20
974
,356
254,
209
74,3
560.
20%
Tuni
sia
14,7
58,7
004,
316,
920
500,
000
146,
250
15,2
58,7
004,
463,
170
5,90
3,48
01,
726,
768
- -
5,90
3,48
01,
726,
768
4.56
%A
lger
ia -
- 10
0,00
029
,250
100,
000
29,2
50 -
- -
- -
- -
Saud
i Ara
bia
- -
45,4
49,3
0713
,293
,922
45,4
49,3
0713
,293
,922
- -
4,12
1,22
21,
205,
457
4,12
1,22
21,
205,
457
3.18
%Su
dan
64,3
18,2
0318
,813
,074
66,6
86,0
0719
,505
,657
131,
004,
210
38,3
18,7
3114
,551
,243
4,25
6,23
936
,940
,969
10,8
05,2
3351
,492
,212
15,0
61,4
7239
.78%
Syri
a1,
373,
000
401,
603
2,47
5,00
072
3,93
83,
848,
000
1,12
5,54
01,
373,
000
401,
603
250,
000
73,1
251,
623,
000
474,
728
1.25
%O
man
- -
3,97
3,20
21,
162,
162
3,97
3,20
21,
162,
162
- -
289,
625
84,7
1528
9,62
584
,715
0.22
%U
SA -
- 75
7,25
022
1,49
675
7,25
022
1,49
6 -
- -
- -
- -
Qat
ar -
- 4,
775,
757
1,39
6,90
94,
775,
757
1,39
6,90
9 -
- 91
1,09
326
6,49
591
1,09
326
6,49
50.
70%
Kuw
ait
- -
25,2
32,3
407,
380,
459
25,2
32,3
407,
380,
459
- -
3,46
9,51
41,
014,
833
3,46
9,51
41,
014,
833
2.68
%L
eban
on25
,700
,000
7,51
7,25
062
3,40
018
2,34
526
,323
,400
7,69
9,59
520
,827
,810
6,09
2,13
416
,650
4,87
020
,844
,460
6,09
7,00
516
.10%
Lib
ya -
- 1,
062,
267
310,
713
1,06
2,26
731
0,71
3 -
- -
- -
- -
Egy
pt -
- 9,
797,
634
2,86
5,80
89,
797,
634
2,86
5,80
8 -
- 6,
266,
198
1,83
2,86
36,
266,
198
1,83
2,86
34.
84%
Mor
occo
- -
300,
000
87,7
5030
0,00
087
,750
- -
- -
- -
- Y
emen
55,0
00,0
0016
,087
,500
3,70
9,78
31,
085,
112
58,7
09,7
8317
,172
,612
30,2
09,0
478,
836,
146
619,
434
181,
184
30,8
28,4
819,
017,
331
23.8
2%Fr
ance
- -
682,
224
199,
551
682,
224
199,
551
- -
682,
224
199,
551
682,
224
199,
551
0.53
%Sp
ain
- -
177,
990
52,0
6217
7,99
052
,062
- -
- -
- -
- Se
rbia
- -
1,00
0,00
029
2,50
01,
000,
000
292,
500
- -
- -
- -
- It
aly
- -
91,8
3526
,862
91,8
3526
,862
- -
28,0
008,
190
28,0
008,
190
0.02
%M
alta
- -
714,
395
208,
961
714,
395
208,
961
- -
- -
- -
- Sw
itzer
land
- -
2,83
9,20
083
0,46
62,
839,
200
830,
466
- -
- -
- -
- G
erm
any
- -
965,
090
282,
289
965,
090
282,
289
- -
534,
232
156,
263
534,
232
156,
263
0.41
%In
done
sia
- -
166,
771
48,7
8116
6,77
148
,781
- -
- -
- -
- C
anad
a -
- 16
3,42
647
,802
163,
426
47,8
02 -
- -
- -
- -
Sing
apor
e -
- 19
8,29
158
,000
198,
291
58,0
00 -
- -
- -
- -
Bru
nei
- -
163,
426
47,8
0216
3,42
647
,802
- -
- -
- -
- C
hina
- -
6,00
0,00
01,
755,
000
6,00
0,00
01,
755,
000
- -
- -
- -
- In
dia
- -
547,
701
160,
203
547,
701
160,
203
- -
81,2
0023
,751
81,2
0023
,751
0.06
%Sr
ilank
a -
- 19
8,29
158
,000
198,
291
58,0
00 -
- -
- -
- -
Tota
l16
1,14
9,90
347
,136
,347
210,
681,
275
61,6
24,2
7337
1,83
1,17
810
8,76
0,62
072
,864
,580
21,3
12,8
9056
,577
,764
16,5
48,9
9612
9,44
2,34
437
,861
,886
100.
00%
Tabl
e (4
)V
alue
of
Cur
rent
Con
trac
ts &
Out
stan
ding
Com
mitm
ents
as
at 3
1/12
/200
5 by
Hos
t/ Im
port
ing
Cou
ntry
& T
ype
of C
ontr
act
(In
USD
and
its
Equ
ival
ent i
n K
D)
(1)
1. E
xclu
ding
the
cont
ract
s &
com
mitm
ents
und
er th
e re
insu
ranc
e qu
ota
shar
e tr
eaty
2. C
urre
nt c
ontr
acts
rep
rese
nt th
e va
lue
of g
uara
ntee
con
trac
ts, w
heth
er e
xecu
ted
or n
ot3.
The
out
stan
ding
Gua
rant
ee c
omm
itmen
ts r
epre
sent
s th
e fo
llow
ing:
• Fo
r In
vest
men
t Gua
rant
ee c
ontr
acts
: th
e va
lue
of in
vest
men
ts e
xecu
ted.
• Fo
r E
xpor
t Cre
dit G
uara
ntee
con
trac
ts:
the
valu
e of
shi
pmen
ts e
xecu
ted
by n
ot y
et r
epai
d.

29
Investment Export Credit
Chart (1)
Chart (2)
USD
mn.
USD
mn.
Guarantee Contracts Signed During 2005 by Host/Importing Countries
Guarantee Contracts Signed During 2005 by Nationality of Guaranteed Parties
Investment Export Credit
30
Chart (3)
0
20
40
60
80
100
120
140
Sudan Yemen Lebanon Saudi Arabia Kuwait Tunisia UAE Jordan Egypt OtherCountries
Current Contracts Outstanding Commitments
Total Current Contracts & Outstanding Commitments by Host/Importing Countries as at 31/12/2005

31
Chapter Three: Complementary Activities & Support Services
3.1 Reports, Publications and Introductory Papers:
3.1.1 The Annual Report on Investment Climate in the Arab Countries:
• The Annual Report on Investment Climate in the Arab Countries 2004 was issued and distributed in 2005 to all concerned parties in member countries, regional organizations, Arab investors and businessmen, media and research centers in the Arab region and abroad.
• The Corporation issued, for the first time in English, an executive summary of the Annual Report on Investment Climate in the Arab Countries 2004. It was uploaded onto the Corporation’s website (www.iaigc.org) and distributed to several parties including regional and international organizations and interested foreign investors.
3.1.2 The Quarterly Bulletin "Daman Al-Istithmar":Four issues of the quarterly Bulletin "Daman Al-Istithmar" were published during 2005 and distributed to government parties concerned in investment, banking and investment institutions, research centers and interested individuals. The Bulletin was also made available on the Corporation’s website. The bulletin covered regular items and other emerging ones, and covered the following topics: the Shareholders’ Council Meeting, Board of Directors Meetings, the Corporation’s activities, developments in the Arab world, investment trends, recent international publications and indices, reflecting Arab countries’ position in a number of selected international indices.
3.1.3 Introductory Papers:Four introductory papers were prepared during the year, covering the following topics:
• "Activating the Unified Agreement for Investing Arab Funds in the Arab Countries”, presented during the expert meeting held in Cairo on 12 January 2005 and co-organized by the Corporation and the General Secretariat of the Arab league (the Department for Environment, Habitat and Sustainable Development).
32
• "Mechanisms and Role of Insurance in Exports Development", presented during the training program on “Modern Methods for Developing and Financing External Trade”, held in Kuwait during the period 19-23 March 2005 and organized by the Arab Planning Institute.
• "Role of the Corporation in Enhancement of Arab Investments and Trade", presented by the Director General of the Corporation during the First Conference for Arab Manufacturers of Cables, held in Manama during the period 25-27 April 2005 and organized by MIDAL CABLES Ltd.
• "Role of Guarantee Industry in the Enhancement of Investments", presented during the First International Conference for Investments and Trade in Sudan, held in Khartoum during the period 14-15 September 2005, organized by (IEP) Company and sponsored by the Ministry of Investment in the Republic of Sudan.
3.2 Conferences and Seminars:
• The Corporation took part in (29) conferences and meetings relevant to its core business, (6) of which were meetings on Arab joint action, (2) meetings were held with international organizations relevant to the Corporation's core business, and (21) meetings covered specialized economic and investment issues.
3.3 Cooperation with Regional and International Institutions:
• The Corporation cooperated with the General Secretariat of the Arab League to organize an expert meeting, in accordance with the Economic and Social Council resolutions, to activate the Unified Agreement for Investing Arab Funds in the Arab Countries, held in Cairo on 12 January 2005, at the headquarter of the General Secretariat of the Arab League.
• The Corporation took part in the four Preparatory Committee meetings held during the year regarding convening of the Eleventh Conference of Arab Businessmen and Investors, to be held in the Kingdom of Bahrain during the period 6-7 March 2006. The meetings were also attended by the General Secretariat of the Arab League, the General Union of
33
Chambers of Commerce, Industry and Agriculture for Arab Countries, and representatives of the host country (Kingdom of Bahrain). During those meetings, the conference arrangements were elaborately discussed. The Corporation addressed the Arab Investment Promotion Agencies (IPA’s) to participate in this conference, and invited around (300) persons from its client base, Arab joint organizations and unions, Arab and Arab-foreign joint banks, as well as Arab national guarantee agencies and other regional organizations.
• The Corporation and the Multilateral Investment Guarantee Agency (MIGA) signed a technical cooperation agreement during the year, entailing IAIGC to be in charge of arabizing MIGA’s online FDI Promotion Centre (www.fdipromotion.com). An ad-hoc team was formed to implement the project, including the tasks of translating and adapting the investment promotion toolkit and the preparation of an Arabic/English glossary for investment promotion terminology, to be later uploaded onto the Corporation’s website.
• In the course of fostering relations with international parties involved in investment promotion, the Corporation took part in the tenth annual conference of the World Investment Promotion Agencies (WIPA), of which the Corporation had become a member in 2000, held in Geneva during the period 9-11 March 2005. The WIPA conference represented a significant platform for the exchange of expertise on modern techniques and experiences in investment promotion, as well as analysis of foreign investment trends.
• In the frame of technical support to Arab investment promotion agencies, the Corporation discussed with an international commercial information company based in London, the United Kingdom, the project of establishing an electronic gate for matching investment opportunities for the purpose of enhancing the abilities of Arab investment promotion agencies, with the aim of promoting available investment opportunities and increasing their share of world FDI inflows. The Corporation approached the Arab investment promotion agencies to detect their perspectives in this regard, which they agreed to put on hold.

34
3.4 Development of Human Resources:The Corporation pursued its program to enhance human resources development, by means of upgrading staff technical skills. A number of Corporation staff benefited from four technical training courses during 2005, as detailed hereunder:
• Management and Assessment of Securities Portfolios and Investment Trust, organized in Kuwait by the International Business Institute during the period from 14 -18 May 2005.
• Risk Management, organized in Kuwait by the International Business Institute during the period from 4 - 8 June 2005.
• Remuneration and Refunds, organized in Paris by the Compagnie Francaise d’Assurance pour le Commerce Exterieur (Coface) during the period 13 - 14 June 2005.
• Stock Markets' Position, organized in Kuwait by the New Frontiers Institute on 19 December 2005.
3.5 Information Services:Staff computer skills were further enhanced during the year, in terms of electronic documents management and modernization of in-house developed infrastructure of IT and adopted software applications as follows:
3.5.1 Networks:
• Training staff on electronic document management system (FileNet).
• Upgrading servers by adopting the most recent Microsoft software, security systems, other main network equipment, and the new edition of electronic e-mail system.
• Updating the Corporation's website by uploading the Corporation's publications issued during the year (the Annual Report, four issues of the quarterly bulletin, the Investment Climate 2004 and its English Executive Summary). Efforts were initiated during the year to re-assess the Corporation's website for the purpose of further developing it.
• Application of a new backup system was introduced (on a daily, weekly and monthly basis).

35
3.5.2 Software:
• Updating accounting system and converting database to (Oracle) system.
• Finalizing the upgrading and testing phases of the electronic system for portfolio management and data conversion.
• Updating the in-house systems for investment guarantees, as well as compensation and recovery in the Operations Department.
• Following up and developing the in-house system for export credit guarantees, to better cope with emerging developments within the Operations Department.
3.6 Media Activities:During the year, the Corporation performed the following activities:
• Issued (10) press releases within the framework of the Corporation’s Media Program which were prepared and adopted for 2005 and cover; organizing the first Forum on Guarantee and Finance in Khartoum; signing of an agreement with the government of the Republic of Sudan for the management of a special account for direct investment guarantees to Sudan; convening of the second Forum on Guarantee and Finance in Damascus; signing of two reinsurance agreements with the Export Credit Guarantee Company of Egypt, during the convening of the third Forum on Guarantee and Finance in Cairo, co-organized with the Arab Investment Company; signing of a reinsurance agreement with the Saudi Development Fund; attending the third meeting of the Preparatory Committee of the Eleventh Conference of Arab Businessmen and Investors; organizing a training course on “leasing”; signing of an agreement with Kuwait Investment Authority, by which the Corporation manages the guarantee special account designated for Kuwaiti exports to Iraq; organizing the Tenth Forum of Arab National Guarantee Agencies and its recommendations.

36
• Completed media coverage of its activities in a number of local and Arab newspapers during the year. A total of (162) news items were detected on the Corporation, 49% of which quoted material from its publications (Investment Climate in the Arab Countries 2004, and the four issues of the Quarterly Bulletin “Daman Al-Istithmar”), 43% covering the Corporation’s activities (core business, forums, and conferences), while (8%) covered the press releases issued by the Corporation.

37
The Corporation’s Balance Sheet as of 31 December 2005 reveals that the total assets amounted to KD 97,721,372 (USD 334,090,160) which is an increase of KD 10,553,390 (USD 36,079,966) from the year 2004, as shown by the following chart:
The Corporation’s investments has increased from KD 39,849,593 as of 311December 2004 to KD 52,631,706 as of 31 December 2005 with an increase by KD 12,782,113 ( USD 43,699,531) from year 2004. These investments comprise of bonds, portfolios, funds and equity participation in the Arab Trade Finance Program. The following chart shows the percentage distribution of investments as of 31 December 2005:
Chapter Four: Financial Report

38
Shareholders’ Equity increased to KD 86,977,119 (USD 297,357,672) as of 31 December 2005, compared to KD 77,287,960 (USD 264,232,342) as of 31 December 2004.
The Corporation’s paid up capital increased to KD 42,073,827 (USD 143,842,144) as of 31 December 2005, compared to KD 36,173,327 (USD 123,669,494) as of 31 December 2004. The increase of KD 5,900,500 represents the remaining amount from the second installment due in 2004 from The Arab Authority for Agriculture Investment and Development and The Arab Bank for Economic Development in Africa as their subscription to the Corporation’s capital, and the third installment from Arab Monetary Fund and Arab Fund for Economic and Social Development as well for the year 2005.
The General Reserve increased from KD 39,670,699 (USD 135,626,321) as of 31 December 2004 to KD 41,575,051 (USD 142,136,926) as of 31 December 2005.
Furthermore, the Fair value cumulative changes increased from KD 1,443,934 (USD 4,936,526) as of 31 December 2004 to KD 3,328,241 (USD 11,378,602) as of 31 December 2005.
The total income which included revenues of investments, portfolios, guarantee premium, currency exchange and other earnings amounted to KD 3,601,194 (USD 12,311,774) as of 31 December 2005, compared to KD 2,090,272 (USD 7,146,229) as of 31 December 2004. The Corporation realized a net profit of KD 1,904,352 (USD 6,510,605) as of 31 December 2005, compared to a net profit of KD 462,228 (USD 1,580,267) as of 31 December 2004.
As for the Corporation’s investments, particularly with regards to funds and bonds, the profit for year 2005 amounted to KD 1,884,307 (USD 6,442,075) which is recorded in the Fair value cumulative changes account as part of Shareholders’ Equity.
Total expenditures as of 31 December 2005 amounted to KD 1,696,842 (USD 5,801,169) compared to KD 1,628,044 (USD 5,565,962) as of 31 December 2004, registering an increase of KD 68,798 (USD 235,207) which is 4.23%.

39
AUDITORS’ REPORT
TO THE CHAIRMAN AND MEMBERS OF COUNCIL
OF THE INTER-ARAB INVESTMENT GUARANTEE CORPORATION AN ARAB CORPORATION WITH A SPECIAL INDEPENDENT LEGAL STATUS
We have audited the accompanying balance sheet of The Inter-Arab Investment Guarantee Corporation as of 31 December 2005 and the related statements of revenues and expenses, changes in equity and cash flows for the year then ended. These financial statements are the responsibility of the Corporation’s management. Our responsibility is to express an opinion on these financial statements based on our audit.We conducted our audit in accordance with International Standards on Auditing. Those Standards require that we plan and perform the audit to obtain reasonable assurance about whether the financial statements are free of material misstatement. An audit includes examining, on a test basis, evidence supporting the amounts and disclosures in the financial statements. An audit also includes assessing the accounting principles used and significant estimates made by management, as well as evaluating the overall financial statement presentation. We believe that our audit provides a reasonable basis for our opinion.In our opinion, the financial statements present fairly, in all material respects, the financial position of the Corporation as of 31 December 2005, and the results of its operations and its cash flows for the year then ended in accordance with International Financial Reporting Standards.Furthermore, in our opinion proper books of account have been kept by the Corporation and we obtained all the information and explanations that we required for the purpose of our audit. We further report that, to the best of our knowledge and belief, no violations of the Corporation’s Convention have occurred during the year ended 31 December 2005 that might have had a material effect on the business of the Corporation or on its financial position.Without qualifying our opinion, we draw attention to Note (9) to the financial statements. As indicated in the note, the Corporation entered into an agreement with the Ministry of Finance of a member state in which all amounts owed by that member totaling KD 35,387,612 were consolidated and rescheduled for payment over a period of five years. Whilst, the member state is still experiencing difficult political and economic conditions, the amount owed is deemed recoverable and accordingly no provision has been made in the accompanying financial statements for any loss in the event of default.
WALEED A. AL OSAIMILICENCE NO. 68 AOF ERNST & YOUNG
Kuwait, 9 March 2006

40
Statement of Revenues and Expenses Year ended 31 December 2005
Restated
Note2005KD
2004KD
REVENUES:Gross guarantee premiums 586,511 366,043Guarantee premiums ceded 5,351 (10,891)
------------------------- -------------------------
Net guarantee premiums 591,862 355,152Expenses and other commission (15,125) (5,414)
------------------------- -------------------------
Guarantee results 576,737 349,738Commission income on guarantee funds 209,720 -
------------------------- -------------------------
786,457 349,738Bank interest 36,265 7,120Interest on bonds 92,893 85,545Investment income 3 3,228,153 1,549,688Foreign exchange (loss) gain (572,255) 14,053Interest on claim from member state - 47,760Other miscellaneous income 29,681 36,368
------------------------- -------------------------
TOTAL REVENUES 3,601,194 2,090,272------------------------- -------------------------
EXPENSES: 4First Chapter - Salaries, wages and bonuses 1,032,360 969,756Second Chapter - General and administrative expenses 578,194 553,476Third Chapter - Capital expenses 85,828 80,279Fourth Chapter - Provisions and others 460 24,533
------------------------- -------------------------
TOTAL EXPENSES 1,696,842 1,628,044------------------------- -------------------------
NET PROFIT FOR THE YEAR 1,904,352 462,228------------------------- -------------------------
The Attached notes 1 to 23 form part of these financial statements.

41
Restated
Note2005KD
2004KD
ASSETSCash and cash equivalents 5 808,195 1,990,159Investments at fair value through statement of revenues and expenses
6 22,774,548 20,401,455
Investments available for sale 7 29,857,158 19,448,138Claim from member state 8 18,968 748,866Receivable from member state 9 35,387,612 - Promissory notes receivable - 3,804,981Recoverable claims 10 2,403,461 26,967,126Accrued interest 11 503,390 7,840,046Reinsurance claims receivable 12 4,461,337 4,847,992Accounts receivable and other assets 13 478,735 54,531Property and equipment 14 1,027,968 1,064,688
------------------------- -------------------------
TOTAL ASSETS 97,721,372 87,167,982------------------------- -------------------------
LIABILITIES AND EQUITYLIABILITIESAccounts payable and other liabilities 15 507,984 541,060Obligations under finance lease 16 1,336,963 1,352,447Reinsurance claims payable 12 7,625,080 7,974,536Due to savings and social security fund - 11,979Employee savings and end of service benefits 17 1,274,226 -
------------------------- -------------------------
TOTAL LIABILITIES 10,744,253 9,880,022------------------------- -------------------------
EQUITYPaid-up capital 18 42,073,827 36,173,327General reserve 19 41,575,051 39,670,699Cumulative changes in fair value 3,328,241 1,443,934
------------------------- -------------------------
TOTAL EQUITY 86,977,119 77,287,960------------------------- -------------------------
TOTAL LIABILITIES AND EQUITY 97,721,372 87,167,982------------------------- -------------------------
Balance Sheet at 31 December 2005
The Attached notes 1 to 23 form part of these financial statements.

42
Cum
ulat
ive
Paid
-up
Gen
eral
chan
ges
inR
etai
ned
capi
tal
rese
rve
fair
val
ueea
rnin
gsTo
tal
KD
KD
KD
KD
KD
Bal
ance
at 3
1 D
ecem
ber
2003
, as
prev
ious
ly r
epor
ted
25,3
98,6
1549
,991
,331
- -
75,3
89,9
46A
djus
tmen
t ari
sing
on
the
adop
tion
of th
e re
vise
d IA
S 39
(N
ote
2)-
(620
,405
)62
0,40
5-
- Pr
ior
year
adj
ustm
ent (
Not
e 22
)-
(10,
162,
455)
- -
(10,
162,
455)
----
----
----
----
----
----
---
----
----
----
----
----
---
----
----
----
----
----
----
---
----
----
----
----
----
---
----
----
----
----
----
----
-
Res
tate
d ba
lanc
e at
31
Dec
embe
r 20
03
25,3
98,6
1539
,208
,471
620,
405
- 65
,227
,491
----
----
----
----
----
----
---
----
----
----
----
----
---
----
----
----
----
----
----
---
----
----
----
----
----
---
----
----
----
----
----
----
-
Cha
nge
in f
air
valu
e of
ava
ilabl
e fo
r sa
le in
vest
men
ts d
urin
g th
e ye
ar-
- 82
3,52
9-
823,
529
----
----
----
----
----
----
---
----
----
----
----
----
---
----
----
----
----
----
----
---
----
----
----
----
----
---
----
----
----
----
----
----
-
Tota
l inc
ome
reco
gnis
ed d
irec
tly in
equ
ity-
- 82
3,52
9-
823,
529
Profi
t for
the
year
- -
- 46
2,22
846
2,22
8--
----
----
----
----
----
---
----
----
----
----
----
----
---
----
----
----
----
----
---
----
----
----
----
----
----
---
----
----
----
----
----
---
Tota
l inc
ome
and
expe
nses
for
the
year
- -
823,
529
462,
228
1,28
5,75
7C
apita
l inc
reas
e10
,349
,712
- -
- 10
,349
,712
Paym
ent o
f un
paid
cap
ital
425,
000
- -
- 42
5,00
0T
rans
fer
to g
ener
al r
eser
ve-
462,
228
- (4
62,2
28)
- --
----
----
----
----
----
---
----
----
----
----
----
----
---
----
----
----
----
----
---
----
----
----
----
----
----
---
----
----
----
----
----
---
Bal
ance
at 3
1 D
ecem
ber
2004
36,1
73,3
2739
,670
,699
1,44
3,93
4-
77,2
87,9
60--
----
----
----
----
----
---
----
----
----
----
----
----
---
----
----
----
----
----
---
----
----
----
----
----
----
---
----
----
----
----
----
---
Bal
ance
at 3
1 D
ecem
ber
2004
,as
pre
viou
sly
repo
rted
36,1
73,3
2752
,793
,984
- -
88,9
67,3
11
Adj
ustm
ent a
risi
ng o
n th
e ad
optio
n of
the
revi
sed
IAS
39 (
Not
e 2)
-
(1,4
43,9
34)
1,44
3,93
4-
- Pr
ior
year
adj
ustm
ent (
Not
e 22
)-
(11,
679,
351)
- -
(11,
679,
351)
----
----
----
----
----
----
---
----
----
----
----
----
---
----
----
----
----
----
----
---
----
----
----
----
----
---
----
----
----
----
----
----
-
Res
tate
d ba
lanc
e at
31
Dec
embe
r 20
04
36,1
73,3
2739
,670
,699
1,44
3,93
4-
77,2
87,9
60--
----
----
----
----
----
---
----
----
----
----
----
----
---
----
----
----
----
----
---
----
----
----
----
----
----
---
----
----
----
----
----
---
Cha
nge
in f
air
valu
e of
ava
ilabl
e fo
r sa
le in
vest
men
ts d
urin
g th
e ye
ar-
- 2,
984,
651
- 2,
984,
651
Rea
lised
on
sale
of
avai
labl
e fo
r sa
le in
vest
men
ts-
- (1
,100
,344
)-
(1,1
00,3
44)
----
----
----
----
----
----
---
----
----
----
----
----
---
----
----
----
----
----
----
---
----
----
----
----
----
---
----
----
----
----
----
----
-
Tota
l inc
ome
reco
gnis
ed d
irec
tly in
equ
ity-
- 1,
884,
307
- 1,
884,
307
Profi
t for
the
year
- -
- 1,
904,
352
1,90
4,35
2--
----
----
----
----
----
---
----
----
----
----
----
----
---
----
----
----
----
----
---
----
----
----
----
----
----
---
----
----
----
----
----
---
Tota
l inc
ome
and
expe
nses
for
the
year
- -
1,88
4,30
71,
904,
352
3,78
8,65
9C
apita
l inc
reas
e5,
900,
500
- -
- 5,
900,
500
Tra
nsfe
r to
gen
eral
res
erve
- 1,
904,
352
- (1
,904
,352
)-
----
----
----
----
----
----
---
----
----
----
----
----
---
----
----
----
----
----
----
---
----
----
----
----
----
---
----
----
----
----
----
----
-
Bal
ance
at 3
1 D
ecem
ber
2005
42,0
73,8
2741
,575
,051
3,32
8,24
1-
86,9
77,1
19--
----
----
----
----
----
---
----
----
----
----
----
----
---
----
----
----
----
----
---
----
----
----
----
----
----
---
----
----
----
----
----
---
Stat
emen
t of
Cha
nges
in E
quit
y Y
ear
ende
d 31
Dec
embe
r 20
05
The
Atta
ched
not
es 1
to 2
3 f
orm
par
t of
thes
e fin
anci
al s
tate
men
ts.

43
Restated
Note2005KD
2004KD
OPERATING ACTIVITIESNet Profit for the year 1,904,352 462,228Adjustments for:Depreciation 36,720 36,720Investment income (3,228,153) (1,549,688)Interest income (129,158) (140,425)Finance lease charges 94,671 95,684
------------------------- -------------------------
Changes in operating assets and liabilities: (1,321,568) (1,095,481)Claim from member state 729,898 - Receivable from member state 317,690 - Recoverable claims - 29,507Reinsurance claims receivable 386,655 33,842Accounts receivable and other assets (209,395) 38,565Employees savings and end of service benefits 71,499 (26,095)Accounts payable and other liabilities (33,076) 117,805Reinsurance claims payable (349,456) (72,167)
------------------------- -------------------------
Cash used in operations (407,753) (974,024)Dividends received 123,777 81,357Interest received 129,158 92,665
------------------------- -------------------------
Net cash used in operating activities (154,818) (800,002)------------------------- -------------------------
INVESTING ACTIVITIESPurchase of investments available for sale (19,044,788) (9,274,952)Proceeds from sale of investments available for sale 13,244,379 4,219,269Purchase of investments at fair value through statement of revenue and expenses (1,017,082) (3,243,409)
------------------------- -------------------------
Net cash used in investing activities (6,817,491) (8,299,092)------------------------- -------------------------
FINANCING ACTIVITIESPayment of finance lease obligations (110,155) (110,155)Proceeds from capital increase and unpaid capital 5,900,500 10,774,712
------------------------- -------------------------
Net cash from financing activities 5,790,345 10,664,557------------------------- -------------------------
NET (DECREASE) INCREASE IN CASH AND CASH EQUIVALENTS
(1,181,964) 1,565,463
------------------------- -------------------------
Cash and cash equivalents at beginning of the year 1,990,159 424,696------------------------- -------------------------
CASH AND CASH EQUIVALENTS AT END OF THE YEAR
5 808,195 1,990,159
------------------------- -------------------------
Statement of Cash Flows Year ended 31 December 2005
The Attached notes 1 to 23 form part of these financial statements.

44
1. ACTIVITIES
The Corporation is an Arab Corporation with a special independent legal status that was incorporated in accordance with a Convention between Arab member states. Its main objectives are to provide guarantee for Inter-Arab investments against non-commercial risks and trade financing between member countries for both commercial and non-commercial risks as defined in its Convention. The Corporation also promotes investments and trade between its member states.
The Corporation is located in Kuwait and its registered address is at P.O. Box 23568 Safat, 13096 – State of Kuwait.
At 31 December 2005, the Corporation had 50 employees (2004: 47 employees).
The financial statements were authorized for issue by the Corporation’s Board of Directors on 9 March 2006.
2. SIGNIFICANT ACCOUNTING POLICIES
Basis of preparation
The financial statements have been prepared in accordance with International Financial Reporting Standards and practices followed by the “Arab Organizations”.
The financial statements are prepared under the historical cost Convention except for the measurement at fair value of investments available for sale and investments at fair value through the statement of revenues and expenses.
The accounting policies are consistent with those used in the previous year except for the adoption of the revised accounting standards discussed below.
The adoption of the applicable revised and new accounting standards that formed part of the International Accounting Standards Board’s improvements project and are applicable from 1 January 2005 has had no material impact on the financial statements during the year except for the adoption of the revised IAS 32 and IAS 39 as discussed below. The comparative figures have been restated as a result of the adoption of the revised IAS 32 and IAS 39.
Notes to the Financial Statements 31 December 2005

45
Adoption of the revised IAS 32 and IAS 39
The Corporation has adopted the revised IAS 32 “Financial Instruments: Disclosure and Presentation” and IAS 39 “Financial Instruments: Recognition and Measurement” with effect from 1 January 2005. The main changes are as follows:
Certain available for sale investments have been redesignated on 1 January 2005 as investments at fair value through the statement of revenues and expenses.
The total value of available for sale investments redesignated as investments at fair value through statement of revenues and expenses was KD 20,401,455 at 1 January 2005. The total value of these available for sale investments redesignated as investments at fair value through statement of revenues and expenses as at 1 January 2004 was KD 14,925,260.
The Corporation now classifies non-trading investments upon initial recognition into the following two categories:
• Available for sale
• Investments at fair value through statement of revenues and expenses
In accordance with the transitional provisions of the revised standard, the Corporation has reclassified with effect from 1 January 2004 positive fair value adjustments of KD 620,405 from general reserve to cumulative changes in fair value as at that date. In addition, the Corporation reclassified changes in fair value of KD 823,529 previously reported in the statement of revenues and expenses for the year ended 31 December 2004 to cumulative changes in fair value in equity for the same period. The impact of this was to reduce the net profit for the year ended 31 December 2004 by KD 823,529.
Available for sale investments
After initial recognition at cost (including transaction costs associated with the acquisition) available for sale investments are remeasured at fair value unless fair value cannot be reliably measured.
Changes in fair value of the investments are reported as a separate component of
Notes to the Financial Statements 31 December 2005

46
equity until the investment is derecognised or the investment is determined to be impaired. On derecognition or impairment, the cumulative gain or loss previously reported in equity is included in the statement of revenues and expenses.
Investments at fair value through statement of revenues and expenses
Investments classified as “Investments at fair value through statement of revenues and expenses” upon initial recognition are remeasured at fair value with all changes in fair value being recorded in the statement of revenues and expenses.
Impairment of available for sale investments
In the case of available for sale equity investments reversal of previously recognised impairment losses are no longer recorded through the statement of revenues and expenses but as increases in cumulative changes in fair value. There was no impact on the statement of revenues and expenses for 2004 as there were no such reversals in that year.
Derecognition of financial assets
With effect from 1 January 2005, a financial asset (in whole or in part) is derecognised either when the contractual rights, to the cash flows from the financial asset expire, the Corporation has transferred substantially all the risks and rewards of ownership or when it has neither transferred nor retained substantially all the risks and rewards and when it no longer has control over the asset or a proportion of the asset.
Recognition and derecognition of financial assets and liabilities
A financial asset or a financial liability is recognised when the Corporation becomes a party to the contractual provisions of the instrument. A financial asset is de-recognised either when the contractual rights to cash flows from the financial asset expires, the Corporation has transferred substantially all the risks and rewards of ownership or when it has neither transferred nor retained substantially all the risks and rewards, and when it no longer has control over the asset or a proportion of
Notes to the Financial Statements 31 December 2005

47
the asset. A financial liability is de-recognised when the obligation specified in the contract is discharged, cancelled or expired.
Trade and settlement date accounting
All “regular way” purchases and sales of financial assets are recognised on the trade date, i.e. the date that the Corporation commits to purchase or sell the asset. Regular way purchases or sales are purchases or sales of financial assets that require delivery of assets within the time frame generally established by regulation or Convention in the market place.
Cash and cash equivalents
Cash includes cash in hand and at banks. Cash equivalents include cash and bank balances and deposits with an original maturity of three months or less.
Promissory notes receivable
Promissory notes are stated at face value less provision for amounts deemed uncollectable. Interest earned on the promissory notes, if any, is recognised on a time proportion basis and included separately under accrued interest in the balance sheet.
Recoverable claims
In accordance with the Corporation’s Convention, claims incurred and paid by the Corporation in compensating insured individuals and entities against non-commercial risks are reimbursable from the respective member state. Claims paid in relation to commercial risks are the responsibility of the importer and are subject to reinsurance arrangements. Accordingly, recoverable claims are stated at face value less, in rare circumstances, provision for doubtful accounts.
Notes to the Financial Statements 31 December 2005

48
Receivables
Receivables are stated at face value, after provision for doubtful accounts.
Property and equipment
Property and equipment are stated at cost less accumulated depreciation and impairment losses. Depreciation is computed on a straight-line basis over the estimated useful lives of items of property and equipment. The useful life and depreciation method are reviewed periodically to ensure that the method and period of depreciation are consistent with the expected pattern of economic benefits from items of property and equipment.
Impairment and uncollectibility of financial assets
An assessment is made at each balance sheet date to determine whether there is objective evidence that a specific financial asset may be impaired. If such evidence exists, any impairment loss is recognised in the statement of revenues and expenses. Impairment is determined as follows:
(a) For assets carried at fair value, impairment is the difference between cost and fair value;
(b) For assets carried at cost, impairment is the difference between cost and the present value of future cash flows discounted at the current market rate of return for a similar financial asset.
Payables
Accounts payable are stated at their cost.
End of service indemnity
The end of service indemnity for the Director General is calculated in accordance with article No. (6) of the resolution made by the Arab Ministers of Finance and Economy in Abu Dhabi. The end of service indemnity for other employees is based on employees’ salaries and accumulated periods of service or on the basis of
Notes to the Financial Statements 31 December 2005

49
employment contracts, where such contracts provide extra benefits. In accordance with article (31) of the employees’ internal policy, the indemnities are paid together with the employee savings.
Income recognition
Net guarantee premiums are taken into income over the terms of the policies to which they relate on a pro-rata basis. Dividend income is recognised when the right to receive payment is established. Interest income is recognised on a time proportion basis. Interest on doubtful or overdue accounts is suspended and recognised in the statement of revenues and expenses as and when received.
Foreign currencies
Foreign currency transactions are recorded in Kuwaiti Dinars at the rates of exchange prevailing on the date of the transaction. Monetary assets and liabilities denominated in foreign currencies at the balance sheet date are retranslated into Kuwaiti Dinars at the rate of exchange prevailing on that date. Exchange differences are reported in the statement of revenues and expenses.
Finance leases
Assets acquired under finance lease agreements are capitalised in the balance sheet and are depreciated over their useful economic lives. A corresponding liability is recorded in the balance sheet for rental obligations under the finance lease. The finance charge is allocated over the period of the lease so as to produce a constant rate of interest on the remaining obligation.
Reinsurance
In the normal course of business, the Corporation cedes certain levels of risk in various areas of exposure with reinsurance companies. Reinsurance contracts do not relieve the Corporation from its obligations to policy- holders; accordingly, failure of reinsurance companies to honour their obligations could result in losses to the Corporation. In the opinion of management, the Corporation’s exposure to
Notes to the Financial Statements 31 December 2005

50
such losses is minimal since losses incurred in compensating policyholders are the ultimate responsibility of counter parties or member states. Amounts recoverable from reinsurance companies are estimated in a manner consistent with the related claim liability.
Financial instruments
Financial assets and financial liabilities carried on the balance sheet include cash and cash equivalents, investments, accounts and notes receivable, accrued interest, recoverable claims and payables. The accounting policies on recognition and measurement of these items are disclosed in the respective accounting policies found in this Note. Financial assets and financial liabilities are offset when the Corporation has a legally enforceable right to offset and intends to settle either on a net basis or to realise the asset and settle the liability simultaneously.
Fair values
For investments traded in organized financial markets, fair value is determined by reference to stock exchange quoted market bid prices at the close of business on the balance sheet date.
For investments where there is no quoted market price, a reasonable estimate of the fair value is determined by reference to an earnings multiple, or an industry specific earnings multiple or a value based on a similar publicly traded company, or is based on the expected cash flows of the investment. Fair value estimates take into account liquidity constraints and assessment for any impairment.
Investments with no reliable measures of their fair values and for which no fair value information could be obtained are carried at their initial cost less impairment in value.
The fair value of interest bearing financial instruments is estimated based on discounted cash flows using interest rates for items with similar terms and risk characteristics.
Notes to the Financial Statements 31 December 2005

51
Contingencies
Contingent liabilities are not recognised in the financial statements. They are disclosed unless the possibility of an outflow of resources embodying economic benefits is remote. A contingent asset is not recognised in the financial statements but disclosed when an inflow of economic benefits is probable.
Provisions
Provision are recognised when the Corporation has a present obligation (legal or contractual) arising from a past event and the costs to settle the obligation are both probable and measurable.
Judgements
In the process of applying the Corporation’s accounting policies, management has made the following significant judgements, apart from those involving estimations, which have the most significant effect in the amounts recognised in the financial statements:
Classification of investments
Management decides on acquisition of an investment whether it should be classified as, at fair value through statement of revenues and expenses, or available for sale.
Classification of investments as fair value through statement of revenues and expenses depends on how management monitor the performance of these investments. When they have readily available reliable fair values and the changes in fair values are reported as part of the results for the period, they are classified as at fair value through statement of revenues and expenses.
All other investments are classified as available for sale.
Impairment of investments
The Corporation treats available for sale equity investments as impaired when there has been a significant or prolonged decline in the fair value below its cost or where other objective evidence of impairment exists. The determination of what
Notes to the Financial Statements 31 December 2005

52
is “significant” or “prolonged” requires considerable judgement. In addition, the Corporation evaluates other factors, including normal volatility in share price for quoted equities and the future cash flows and the discount factors for unquoted equities.
Estimation uncertainty
The preparation of financial statements in conformity with International Financial Reporting Standards requires management to make estimates and assumptions that affect the reported amounts of assets and liabilities and disclosure of contingent assets and liabilities at the date of the financial statements and the reported amounts of revenues and expenses during the reporting period. Actual results could differ from those estimates.
The key assumptions concerning the future and other key sources of estimation uncertainty at the balance sheet date, that have a significant risk of causing a material adjustment to the carrying amounts of assets and liabilities within the next financial year are discussed below:
Valuation of unquoted equity investments
Valuation of unquoted equity investments is normally based on one of the following:
• recent arm’s length market transactions;
• current fair value of another instrument that is substantially the same ; or
• the expected cash flows discounted at current rates applicable for items with similar terms and risk characteristics; or
• other valuation models.
The determination of the cash flows and discount factors for unquoted equity investments requires significant estimation.
Notes to the Financial Statements 31 December 2005

53
3. INVESTMENT INCOME Restated
2005 KD
2004 KD
Realised loss from investments at fair value through state-ment of revenues and expenses
- (31,101)
Realised gain (loss) on available for sale investments 1,768,365 (4,415)
Unrealised gain on investments at fair value through state-ment of revenues and expenses
1,336,011 1,498,427
Dividends from funds 115,763 75,291
Dividend from Arab Trade Finance Program 8,014 6,066
Gain on redemption and sale of bonds - 5,420------------------------- -------------------------
3,228,153 1,549,688------------------------- -------------------------
4. EXPENSES
General and administrative expenses include finance lease charges in the amount of KD 94,671 (2004: KD 95,684). Capital expenses represent depreciation charge and expenditure on minor capital items which is expensed as incurred.
5. CASH AND CASH EQUIVALENTS2005KD
2004KD
Cash in hand and at banks 808,195 366,559
Time deposit maturing within three months - 1,623,600------------------------- -------------------------
808,195 1,990,159------------------------- -------------------------
Notes to the Financial Statements 31 December 2005

54
6. INVESTMENTS AT FAIR VALUE THROUGH STATEMENT OF REVENUES AND EXPENSES
These represent portfolios of primarily quoted investments managed by specialist investment managers.
7. INVESTMENTS AVAILABLE FOR SALE2005KD
2004KD
Bonds 3,215,384 1,753,881Managed funds 26,276,043 17,328,526Investment in Arab Trade Finance Program 365,731 365,731
------------------------- -------------------------
29,857,158 19,448,138------------------------- -------------------------
The managed funds primarily represent quoted investments managed by specialist investment managers.
The Corporation owns 0.25% of the capital of the Arab Trade Finance Program, which was established within the framework of the Arab Monetary Fund, to stimulate inter-Arab trade. Due to the unpredictable nature of future cash flows and the lack of suitable other methods for arriving at a reliable measure of fair value, the investment is carried at cost.
8. CLAIM FROM MEMBER STATE
This claim represents amounts due from a member state in respect of its unpaid capital contribution, together with delay interest, following a decision by council and agreements between the Corporation and this member.
Notes to the Financial Statements 31 December 2005

55
9. RECEIVABLE FROM MEMBER STATE
This represents amount owed to the Corporation by a member state that has been unable, due to difficult political and economic conditions, to settle their obligations on the due dates.
Under the terms of an agreement dated 15 December 2005 entered into with the Ministry of Finance of the member state, the Corporation agreed to waive interest receivable in the amount of USD 41,920,050 (including approximately USD 5.2 million that was accrued prior to the agreement date) from the previously accrued delay interest, consolidate and reschedule all amounts payable under the agreement comprising:
2005U.S.$
Promissory notes 12,889,505Recoverable claims (Note 10) 83,011,202Unwaived delay interest (Note11) 25,082,583
-------------------------
120,983,290-------------------------
Equivalent in KD 35,387,612-------------------------
Under the terms of the agreement, the member state will repay the rescheduled debt as follows:
U.S.$ Due by 31 March 2006 46,000,000Due in 5 annual installments starting 31 December 2006 at an interest rate of 2% per annum 74,983,290
-------------------------
Total 120,983,290-------------------------
Equivalent in KD 35,387,612-------------------------
Notes to the Financial Statements 31 December 2005

56
10. RECOVERABLE CLAIMS2005
U.S.$2004
U.S.$
Balance at beginning of the year 91,352,053 89,924,901Net claims paid during the year 48,271 494,450Claims recovered during the year (172,154) (560,600)Amount transferred from escrow account - 1,493,302Rescheduled under agreement with member state (Note 9) (83,011,202) -
------------------------- -------------------------
Balance at end of the year 8,216,968 91,352,053------------------------- -------------------------
Equivalent in KD 2,403,461 26,967,126------------------------- -------------------------
These amounts represent compensation claims paid to Arab nationals against risks realised in member states. In accordance with the inter member states Convention, such compensation claims are reimbursable from the importer or member state in which the risk is realised. Accordingly, in the opinion of management, the above claims are recoverable in full.
11. ACCRUED INTEREST
The Corporation accrues delay interest on claims recoverable from counter parties and member states that have not met their obligations within the usual timeframe; the details of the interest are as follows:
Restated2005KD
2004KD
Balance at beginning of the year 7,840,046 18,002,501Interest accrued during the year 120,173 - Waiver of delay interest and other adjustment - (10,162,455)Rescheduled under agreement with member state (Note 9) (7,336,656) -
------------------------- -------------------------
Balance at end of the year 623,563 7,840,046Less: Interest suspended (120,173) -
------------------------- -------------------------
503,390 7,840,046------------------------- -------------------------
Notes to the Financial Statements 31 December 2005

57
12. REINSURANCE CLAIMS
Reinsurance claims receivable represent the reinsurance companies’ share of claims incurred and paid by the Corporation under the respective reinsurance contract. Reinsurance claims payable represent amounts refundable to the reinsurance companies following reimbursement by the counter party or member state. In making settlement with a given reinsurance company, the Corporation will observe amounts owed by the reinsurance company and settle on a net basis.
13. ACCOUNTS RECEIVABLE AND OTHER ASSETS2005KD
2004KD
Commission income 196,109 - Employee receivables 199,598 - Other debit balances 83,028 54,531
------------------------- -------------------------
478,735 54,531------------------------- -------------------------
14. PROPERTY AND EQUIPMENT
Property and equipment are substantially represented in the carrying amount of the Corporation’s premises, which were acquired under a finance lease based on the space allocated to and occupied by the Corporation in the Joint Building of the Arab Organizations. The premises are being depreciated over the 40-year lease term and the related depreciation charge for the year amounted to KD 36,720 (2004: KD 36,720).
Notes to the Financial Statements 31 December 2005

58
15. ACCOUNTS PAYABLE AND OTHER LIABILITIES2005KD
2004KD
Due to reinsurance companies 2,472 71,302Accrued staff leave 121,654 118,613Provision for legal encyclopedia 13,757 13,757Other liabilities 370,101 337,388
------------------------- -------------------------
507,984 541,060------------------------- -------------------------
16. OBLIGATIONS UNDER FINANCE LEASE
The obligations under the finance lease are payable as follows: 2005 KD
2004 KD
Within one year 110,155 110,155In the second to fifth years inclusive 550,775 550,775Over five years 2,423,410 2,533,565
------------------------- -------------------------
3,084,340 3,194,495Less: Finance charges allocated to future periods (1,747,377) (1,842,048)
------------------------- -------------------------
1,336,963 1,352,447------------------------- -------------------------
17. EMPLOYEE SAVINGS AND END OF SERVICE BENEFITS
Previously, the Corporation established and managed a savings and social security fund in accordance with article (31) of the employees’ internal policy, as approved by resolution No. (6) of 1981 and the Director General’s resolution dated 1 January 1984 for the benefit of the employees. During the year, in accordance with the Director General’s resolution dated 19 June 2005, the Corporation suspended the savings and social security fund scheme and absorbed the assets and liabilities of the fund.
Notes to the Financial Statements 31 December 2005

59
Under the new scheme, the employee is entitled to the following:
(a) Entitlement to end of service indemnity under the Corporation bye-laws
(b) The amount deducted from the employees at the rate of 7% of the monthly salary
(c) An award from the Corporation of 5% per annum of the aggregate of (a) and (b) above less amounts advanced to the employee, at the discretion of the Director General based on employee performance.
All these amounts are not invested on behalf of the employees as was the case under the previous scheme.
Notes to the Financial Statements 31 December 2005

60
18. PAID-UP CAPITAL
At 31 December 2005, the capital of the Corporation and the share of each member state and other authorities are as follows:
Issued Paid2005KD
2004KD
2005KD
2004KD
A. Member State:
The Hashemite Kingdom of Jordan 525,000 525,000 525,000 525,000United Arab Emirates 2,350,000 2,350,000 2,350,000 2,350,000Kingdom of Bahrain 500,000 500,000 500,000 500,000The Republic of Tunisia 1,250,000 1,250,000 1,250,000 1,250,000People’s Democratic Republic of Algeria 1,250,000 1,250,000 1,250,000 1,250,000Republic of Djibouti 200,000 200,000 200,000 200,000Kingdom of Saudi Arabia 3,750,000 3,750,000 3,750,000 3,750,000Republic of Sudan 1,217,932 1,217,932 1,217,932 1,217,932Syrian Arab Republic 500,000 500,000 500,000 500,000Somali Democratic Republic 58,735 58,735 58,735 58,735Republic of Iraq 500,000 500,000 500,000 500,000Sultanate of Oman 750,000 750,000 750,000 750,000State of Palestine 500,000 500,000 - -State of Qatar 2,000,000 2,000,000 2,000,000 2,000,000State of Kuwait 3,000,000 3,000,000 3,000,000 3,000,000Republic of Lebanon 500,000 500,000 500,000 500,000The Socialist Peoples’ Libyan Arab Jamahiriyah 2,500,000 2,500,000 2,500,000 2,500,000Arab Republic of Egypt 1,250,000 1,250,000 1,250,000 1,250,000Kingdom of Morocco 2,000,000 2,000,000 2,000,000 2,000,000The Islamic Republic of Mauritania 500,000 500,000 500,000 500,000The Republic of Yemen 1,000,000 1,000,000 1,000,000 1,000,000
------------------------- ------------------------- ------------------------- -------------------------
26,101,667 26,101,667 25,601,667 25,601,667B. Arab Financial Authorities:
Arab Fund for Economical and Social Development 15,202,800 15,202,800 9,121,680 6,081,120Arab Monetary Fund 8,118,000 8,118,000 4,870,800 3,247,200BADEA 5,106,960 5,106,960 2,042,784 1,021,392Arab Authority for Agricultural Investment and Development
1,092,240 1,092,240 436,896 221,948
------------------------- ------------------------- ------------------------- -------------------------
55,621,667 55,621,667 42,073,827 36,173,327------------------------- ------------------------- ------------------------- -------------------------
The payment of the share capital of the State of Palestine is postponed based on the shareholders’ council resolution number (4) of 1981.
Notes to the Financial Statements 31 December 2005

61
19. GENERAL RESERVE
Article (24) of the Corporation’s Convention states that “Net income realised from the Corporation’s operations is to be accumulated to establish a reserve equal to three times the capital”, after which time, the Council shall decide the manner of utilisation or distribution of the realised annual profits, provided that no more than 10 percent of such profits shall be distributed and that the distribution shall be made in proportion to the share of each member in the capital of the Corporation.
20. CONTINGENT AND UNRECORDED LIABILITIES
a) The underlying value of written guarantee contracts in force as of 31 December 2005 amounted to KD 37,861,886 (2004: KD 29,606,113). At the balance sheet date there were no written guarantee contracts reinsured against commercial and non-commercial risks (2004: KD 1,658,978 against non-commercial risk).
b) Included in reinsurance claims receivable is an amount of KD 1,167,195 that has been blocked by one of the Arab banks. The bank, together with an Arab exporter, filed a claim on the Corporation of U.S.$ 1,040,000 (equivalent to KD 304,200 at the rate of exchange prevailing at 31 December 2005). The claimed amount plus interest at 21% from the date the amount became payable until payment is made has been awarded to the claimants; accordingly, the bank may possibly recover this claim from the blocked amount. The Corporation has challenged the validity of this case’s arbitration proceedings and the matter is still pending before the court.
c) Another claim has been raised by an Arab company in the amount of KD 982,175 plus interest from 26 May 1996 until the date of payment. During 1998, an award was issued in favour of the claimant for the amount plus interest of 7% from the date the amount became payable until payment is made. It is the policy of the Corporation to record such obligation when payment is made and to charge the respective member state with the amount.
In the opinion of management and in accordance with the Corporation’s business practices, all litigations and claims are the ultimate responsibility of the
Notes to the Financial Statements 31 December 2005

62
importer in the case of commercial risks and the ultimate responsibility of the respective member state in the case of non-commercial risks. Accordingly, no provision has been made in the accompanying financial statements in respect of the matters discussed above.
21. FINANCIAL INSTRUMENTS
In the normal course of business, the Corporation uses primary financial instruments such as cash and cash equivalents, investments, accounts and notes receivable, accrued interest, recoverable claims and payables and as a result, the Corporation is exposed to the following risks:
Interest rate risk
Financial instruments are subject to the risk of changes in value due to changes in the level of interest.
The effective interest rates and the periods in which interest bearing financial assets are repriced or mature are as follows:
Less thanWithin1 - 5
Effectiveinterest
31 December 20051 year
KDyearsKD
More than 5 years
TotalKD rate %
Bonds 1,470,351 1,322,910 422,123 3,215,384 2-5Claim from member state 18,968 - - 18,968 7Receivable from member state 13,455,000 21,932,612 - 35,387,612 2Recoverable claims 2,403,461 - - 2,403,461 5
---------------------- ---------------------- ---------------------- ----------------------
17,347,780 23,255,522 422,123 41,025,425---------------------- ---------------------- ---------------------- ----------------------
Less thanWithin1 - 5
Effectiveinterest
31 December 2004 (Restated)1 year
KDyearsKD
More than 5 years
TotalKD rate %
Time deposit 1,623,600 - - 1,623,600 1 - 2Bonds - 1,753,881 - 1,753,881 2 - 5Claim from member state 748,866 - - 748,866 7Promissory notes receivable - 3,804,981 - 3,804,981 5Recoverable claims - 26,967,126 - 26,967,126 5
---------------------- ---------------------- ---------------------- ----------------------
2,372,466 32,525,988 - 34,898,454---------------------- ---------------------- ---------------------- ----------------------
Notes to the Financial Statements 31 December 2005

63
Credit risk
Credit risk is the risk that one party to a financial instrument will fail to discharge an obligation and cause the other party to incur a financial loss. Financial assets, which potentially subject the Corporation to credit risk, consist principally of cash at banks and bonds. Cash is placed with high credit rating financial institutions. Bonds are issued by either high credit rating financial institutions or governments. In the opinion of management, financial assets related to the Corporation’s investment guarantee business do not expose the Corporation to credit risk since such business is backed up by the member states.
Foreign currency risk
The Corporation incurs foreign currency risk on transactions that are denominated in a currency other than the Kuwaiti Dinar. The Corporation ensures that the net exposure is kept to an acceptable level, by dealing in currencies that do not fluctuate significantly against the Kuwaiti Dinar.
Liquidity risk
Liquidity risk is the risk that the Corporation will encounter difficulty in raising funds to meet commitments associated with financial instruments. To manage this risk, the Corporation invests in bank deposits or other investments that are readily realisable.
Cash flow risk
Cash flow risk is the risk that future cash flows associated with a monetary financial instrument will fluctuate in amount. At present, the Corporation has no significant exposure to such risk.
Market risk
Market risk is the risk that the value of a financial instrument will fluctuate as a result of changes in market prices, whether those changes are caused by factors specific to the individual security, or its issuer, or factors affecting all securities traded in the market.
Notes to the Financial Statements 31 December 2005

64
The Corporation is exposed to market risk with respect to its investments.
The Corporation limits market risk by having substantially all of its investments managed by specialized investment management firms.
Equity price risk
Equity price risk arises from the change in the fair values of equity investments. The Corporation manages this risk through diversification of investments in terms of geographical distribution and industry concentrations.
Fair value of financial instruments
Fair value is defined as the amount at which the instrument could be exchanged in a current transaction between knowledgeable willing parties in an arm’s length transaction, other than in forced or liquidation sale. Fair values are obtained from quoted market prices, discounted cash flow models and other models as appropriate. At the balance sheet date, the fair values of financial instruments approximate their carrying amounts, except that it was not possible to reliably measure the fair value of certain investments available for sale as indicated in Note (7).
22. PRIOR YEAR ADJUSTMENT
The prior year adjustment relates to the reversal of accrued delay interest that was waived pursuant to an agreement between the Corporation and the Ministry of Finance of a member state (Note 9). The financial statements for 2004 have been restated to correct the accrual and recognition of delay interest whose recoverability was deemed uncertain at the time of recognition.
23. COMPARATIVE FIGURES
Certain of the prior year amounts have been reclassified to conform with the current year presentation.
Notes to the Financial Statements 31 December 2005