Embed Size (px)
Citation preview

The Influence of Velocity Based Resistance Training on
Neuromuscular Strength and Power Adaptations in Semi-
Professional Rugby Union and Professional Rugby League Players
Gurdeep Singh
A thesis submitted to AUT University in fulfilment of the Master of
Sport and Exercise (MSpEx)
2016
School of Sport and Recreation
Primary Supervisor: Dr. Adam Storey
Secondary Supervisor: Associate Professor Nic Gill
1
Table of Contents
Attestation of authorship ................................................................................................... 5
Acknowledgements ........................................................................................................... 6
Co-authored works ............................................................................................................ 7
Author contributions ......................................................................................................... 8
List of tables ...................................................................................................................... 9
List of figures .................................................................................................................. 10
List of abbreviations ........................................................................................................ 12
Abstract ........................................................................................................................... 13
CHAPTER ONE. PREFACE ....................................................................................... 15
1.1 Thesis rationale and significance........................................................................... 16
1.2 Research aims and hypothesis ............................................................................... 17
1.3 Originality of the thesis ......................................................................................... 18
1.4 Study limitations .................................................................................................... 19
1.5 Study delimitations ................................................................................................ 20
1.6 Thesis organization ................................................................................................ 21
CHAPTER TWO. THE INFLUENCE OF TRADITIONAL PERCENTAGE
BASED RESISTANCE TRAINING AND VELOCITY BASED RESISTANCE
TRAINING PRACTICES ON STRENGTH AND POWER ADAPTATIONS:
LITERATURE REVIEW ............................................................................................. 23
2.1 Preface ................................................................................................................... 24
2.2 Introduction ........................................................................................................... 25
2.3 Literature review search methods .......................................................................... 28
2.4 TRADITIONAL PERCENTAGE BASED RESISTANCE TRAINING
METHODOLOGIES ................................................................................................... 29
2.4.1 Strength resistance training methodology and adaptations ............................. 29
2.4.2 Power resistance training methodology and adaptations ................................ 31
2.5 VELOCITY BASED RESISTANCE TRAINING METHODOLOGIES ............ 33
2.5.2 Linear position transducer velocity profiling technology ............................... 33
2.5.3 Overview of isokinetic and isoinertial velocity based resistance training
methods used in the current literature ...................................................................... 37
2.5.4 Velocity based resistance training neuromuscular adaptations ...................... 39
2.5.5 Load-velocity relationship .............................................................................. 42
2.5.6 Monitoring fatigue and controlling exercise load with movement velocity ... 48
2.5.7 Sport specific strength and power adaptations to velocity based resistance
training ..................................................................................................................... 51
2.6 MONITORING TRAINING VOLUME AND LOAD ......................................... 52
2.6.1 Autoregulatory and traditional prescribed training programmes .................... 52
2
2.6.2 Session RPE and psychological wellness questionnaire monitoring .............. 55
2.6.3 Salivary cortisol .............................................................................................. 59
2.7 Conclusions ........................................................................................................... 60
2.7.1 Practical applications of velocity based resistance training in strength and
conditioning practices .................................................................................................. 61
2.7.2 Future research ................................................................................................... 62
CHAPTER THREE. THE VELOCITY PROFILING OF SEMI-PROFESSIONAL
RUGBY UNION AND PROFESSIONAL RUGBY LEAGUE PLAYERS ............. 63
3.1 Preface ................................................................................................................... 64
3.2 Introduction ........................................................................................................... 65
3.3 Methods ................................................................................................................. 68
3.3.1 Experimental approach to the problem ........................................................... 68
3.3.2 Participants...................................................................................................... 68
3.3.3 Testing procedures .......................................................................................... 69
3.3.3.1 Bench press .................................................................................................. 70
3.3.3.2 Back squat .................................................................................................... 70
3.3.3.3 Power clean ................................................................................................. 70
3.3.4 Statistical analysis ........................................................................................... 72
3.4 Results ................................................................................................................... 73
3.4.1 Rugby union velocity profiling ....................................................................... 73
3.4.1.1 Bench press .................................................................................................. 73
3.4.1.2 Back squat .................................................................................................... 73
3.4.1.3 Power clean ................................................................................................. 73
3.4.2 Rugby league velocity profiling ..................................................................... 74
3.4.2.1 Bench press .................................................................................................. 74
3.4.2.2 Back squat .................................................................................................... 74
3.4.2.3 Power clean ................................................................................................. 74
3.5 Discussion ............................................................................................................. 77
3.6 Conclusions ........................................................................................................... 81
3.7 Practical applications ............................................................................................. 82
CHAPTER FOUR. THE INFLUENCE OF A 5-WEEK VELOCITY BASED
RESISTANCE TRAINING PROGRAMME ON NEUROMUSCULAR
STRENGTH AND POWER ADAPTATIONS IN PROFESSIONAL RUGBY
LEAGUE PLAYERS: A CASE STUDY ..................................................................... 85
4.1 Preface ................................................................................................................... 86
4.2 Introduction ........................................................................................................... 87
4.3 Methods ................................................................................................................. 91
4.3.1 Experimental approach to the problem ........................................................... 91

3
4.3.2 Participants...................................................................................................... 91
4.3.3 Resistance training programme ...................................................................... 92
4.3.4 Saliva, psychological wellness questionnaire monitoring and session RPE
monitoring collection ............................................................................................... 93
4.3.5 Testing procedures .......................................................................................... 96
4.3.5.1 Countermovement jump (CMJ) and squat jump (SJ) ................................... 96
4.3.5.2 Bench press and back squat ......................................................................... 96
4.3.5.3 Power clean ................................................................................................. 98
4.3.6 Statistical analysis .............................................................................................. 98
4.4 Results ................................................................................................................... 99
4.4.1 Intended vs actual total tonnage lifted and session RPE ................................ 99
4.4.2 Saliva collection and wellness questionnaire monitoring ............................... 99
4.4.3 Countermovement jump (CMJ) ...................................................................... 99
4.4.4 Squat jump (SJ) ............................................................................................. 100
4.4.5 Strength and power assessments ................................................................... 100
4.4.5.1 Bench press ................................................................................................ 100
4.4.5.2 Back squat .................................................................................................. 100
4.4.5.3 Power clean ............................................................................................... 101
4.5 Discussion ........................................................................................................... 111
4.6 Conclusions ......................................................................................................... 115
4.7 Practical applications ........................................................................................... 117
CHAPTER FIVE. GENERAL SUMMARY ............................................................ 118
5.1 Summary ............................................................................................................. 119
5.2 Future research .................................................................................................... 121
5.3 Practical applications ........................................................................................... 122
REFERENCES .............................................................................................................. 124
APPENDICES .............................................................................................................. 139
Appendix 1: Study one velocity profiling tables ....................................................... 140
Table 1: Rugby union forwards and backs bench press peak and mean velocity for
each % of 1RM ...................................................................................................... 140
Table 2: Rugby union forwards and backs back squat peak and mean velocity for
each % of 1RM ...................................................................................................... 140
Table 3: Rugby union forwards and backs power clean peak and mean velocity for
each % of 1RM ...................................................................................................... 141
Table 4: Rugby league forwards and backs bench press peak and mean velocity for
each % of 1RM ...................................................................................................... 141
Table 5: Rugby league forwards and backs back squat peak and mean velocity for
each % of 1RM ...................................................................................................... 142

4
Table 6: Rugby league forwards and backs power clean peak and mean velocity for
each % of 1RM ...................................................................................................... 142
Appendix 2: Participant information sheet ................................................................ 143
Appendix 3: Consent form ........................................................................................ 148
Appendix 4: Athlete psychological wellness monitoring form ................................. 150
5
Attestation of authorship
I hereby declare that this submission is my own work and that, to the best my knowledge
and belief, it contains no material previously published or written by another person
(except where explicitly defined in the acknowledgements), nor material which to a
substantial extent has been submitted for the award of any other degree or diploma of a
university or other institution of higher learning.
Signature:
Date: 18/03/2016

6
Acknowledgements
Dr. Adam Storey. Words cannot express how grateful I am for all your efforts you have
put into my Master’s journey. The supervision you have given me has extended over and
above what is required and have always provided me with valuable and timely feedback
along the way. Your honesty and scrutiny of my work has helped me develop as an
academic and has motivated me to continue down this path. I cannot thank you enough
and I hope to work with you again in the future.
Assoc. Prof. Nic Gill. You have provided invaluable feedback of my work along the way
that has not only helped me develop my academic skills but also my view on research and
how this can be applied practically in strength and conditioning practice. I would like to
thank you for the opportunity you provided me in allowing me to observe the All Blacks
preparation in the lead up to the World Cup, this is an experience I will always look back
fondly on.
Special thank you to Brad Anderson (Auckland Rugby), Dean Rice (North Harbour
Rugby), and all present and past staff at the NZ Vodafone Warriors for allowing me to
carry out my research with an outstanding bunch of athletes. I am truly grateful for the
opportunity each organization provided me to complete my research with high calibre
athletes.
The School of Sport and Recreation, AUT University. I wish to thank you for the
opportunity and resources you have provided me to undertake this research.
Participants. A big thank you to all participants who took part in this research. Without
your involvement this research and thesis would have not been possible and I am truly
grateful for all your efforts throughout this thesis.
Last but not least, thank you to my parent’s for their unconditional support throughout
my journey, none of what I have achieved to date would have been possible without your
help. I cannot thank you enough.
All experimental studies within this thesis received ethics approval from AUTEC
(approval number 15/15)
7
Co-authored works
The following manuscripts are in preparation for submission for peer reviewed journal
publication as a result of the work presented in this thesis. Due to the chosen submission
format, there may be some unavoidable repetition within each chapter;
Singh, G., Gill, N., Storey, A. (2016). The influence of velocity based resistance
training practices on strength and power adaptations: a literature review.
Strength and Conditioning Journal. (Targeted publication)
Singh, G., Gill, N., Storey, A. (2016). The velocity profiling of semi-
professional rugby union and professional rugby league players. Journal of
Strength and Conditioning Research. (Targeted publication)
Singh G., Gill, N., Storey, A. (2016). The influence of a 5-week velocity based
resistance training programme on neuromuscular strength and power adaptations
in professional rugby league players: A case study. Journal of Strength and
Conditioning Research. (Targeted Publication)
8
Author contributions
The Master’s candidate Gurdeep Singh was the primary contributor (90%) to the
research within this thesis and any analysis and interpretation from the associated
results. All co-authors have approved the inclusion of the joint work in this thesis.
Master’s candidate: Gurdeep Singh
Primary supervisor: Dr. Adam Storey
Secondary supervisor: Associate Professor Nic Gill

9
List of Tables
Table 1. Changes in mean propulsive velocity (m.s-1) attained with each relative load
from initial test (T1) to retest (T2), following 6-weeks of bench press resistance
training ............................................................................................................................ 44
Table 2. Example load-velocity profile protocol for a given exercise ........................... 46
Table 3. Schematic weekly calculation of training load, monotony and strain of training
load, monotony and strain ............................................................................................... 56
Table 4. Anthropometric characteristics of the rugby union and rugby league participants
......................................................................................................................................... 69
Table 5. Rugby union and rugby league example warm-up routine .............................. 71
Table 6. Velocity profiling sets and reps protocol ......................................................... 72
Table 7. Rugby union velocity training zones for the bench press, back squat and power
clean ................................................................................................................................ 83
Table 8. Rugby league velocity training zones for the bench press, back squat and power
clean ................................................................................................................................ 84
Table 9. Descriptive characteristics of the training programme performed by the velocity
based training group and traditional percentage based training group ........................... 95
Table 10. Total intervention intended vs actual tonnage lifted for the velocity based
training group and traditional percentage based training group.................................... 102
Table 11. Salivary cortisol concentrations pre and post light, moderate and heavy
intensity training weeks and mean weekly endocrine and neuromuscular psychological
wellness questionnaire monitoring scores for the velocity based training group and
traditional percentage based training group .................................................................. 103
Table 12. Pre and post intervention countermovement jump results for the velocity based
training group and traditional percentage based training group.................................... 104
Table 13. Pre and post intervention squat jump results for the velocity based training
group and traditional percentage based training group ................................................. 105
Table 14. Pre and post intervention strength and power results for the velocity based
training group and traditional percentage based training group.................................... 106

10
List of Figures
Figure 1. Example of an athlete’s load-velocity profile for the bench press exercise. Load
(%1RM) is plotted on the x-axis and the achieved velocity (m.s-1) is plotted on the y-axis
......................................................................................................................................... 46
Figure 2. Estimation of 1RM from warm-up sets for the squat exercise during a training
block. The dotted line represents pre-training block 1RM values with the blue line
representing daily variation in maximum strength in relation to daily biological status 50
Figure 3. Rugby union forwards and backs mean velocity spectrum for the bench press
exercise across loading intensities of 20-95% 1RM. The mean velocity achieved for each
loading intensity is plotted from each positional groups mean with 95% confidence
intervals ........................................................................................................................... 75
Figure 4. Rugby union forwards and backs mean velocity spectrum for the back squat
exercise across loading intensities of 20-95% 1RM. The mean velocity achieved for each
loading intensity is plotted from each positional groups mean with 95% confidence
intervals ........................................................................................................................... 75
Figure 5. Rugby union forwards and backs peak velocity spectrum for the power clean
exercise across loading intensities of 20-95% 1RM. The peak velocity achieved for each
loading intensity is plotted from each positional groups mean peak velocity with 95%
confidence intervals ........................................................................................................ 75
Figure 6. Rugby league forwards and backs mean velocity spectrum for the bench press
exercise across loading intensities of 20-95% 1RM. The mean velocity achieved for each
loading intensity is plotted from each positional groups mean with 95% confidence
intervals ........................................................................................................................... 76
Figure 7. Rugby league forwards and backs mean velocity spectrum for the back squat
exercise across loading intensities of 20-95% 1RM. The mean velocity achieved for each
loading intensity is plotted from each positional groups mean with 95% confidence
intervals ........................................................................................................................... 76
Figure 8. Rugby league forwards and backs peak velocity spectrum for the power clean
exercise across loading intensities of 20-95% 1RM. The peak velocity achieved for each
loading intensity is plotted from each positional groups mean peak velocity with 95%
confidence intervals ........................................................................................................ 76
Figure 9. Velocity based training group and traditional percentage based training group
actual mean bench press (±SD) weekly tonnage and mean session RPE. Week 1 = Light
week (70-75%), Week 2 = Moderate week (75-80%), Week 3 = Light week (70-75%),
Week 4 = Moderate week (75-80%), Week 5 = Heavy week (80-85%) ...................... 107

11
Figure 10. Velocity based training group and traditional percentage based training group
actual mean back squat (±SD) weekly tonnage and mean session RPE. Week 1 = Light
week (70-75%), Week 2 = Moderate week (75-80%), Week 3 = Light week (70-75%),
Week 4 = Moderate week (75-80%), Week 5 = Heavy week (80-85%) ...................... 108
Figure 11. Velocity based training group and traditional percentage based training group
actual mean power clean (±SD) weekly tonnage and mean session RPE. Week 1 = Light
week (70-75%), Week 2 = Moderate week (75-80%), Week 3 = Light week (70-75%),
Week 4 = Moderate week (75-80%), Week 5 = Heavy week (80-85%) ...................... 109
Figure 12. Velocity based training group and traditional percentage based training group
mean weekly psychological wellness questionnaire scores (±SD) and mean salivary
cortisol (±SD) response for light (70-75%), moderate (75-80%) and, heavy intensity
training weeks (80-85%) ............................................................................................... 110

12
List of abbreviations
AU Arbitrary units PP Peak power
APRE Autoregulatory progressive
resistance exercise
PV Peak velocity
R2 Coefficient of determination Pmax Peak power output
CV Coefficient of variation RFD Rate of force development
CMJ Countermovement jump RPE Rating of perceived exertion
ES Effect size RTF Reps to fatigue
EMG Electromyography activity RHIE Repeat high intensity effort
bouts
FPS Fixed pushing speed Sal-C Salivary cortisol
GPS Global positioning system SPS Self-selected pushing speed
IMCA Intended maximal concentric action SD Standard deviation
ICC Intra class correlation coefficient SEE Standard error of estimate
Kg Kilograms SSC Stretch shortening cycle
LPT Linear position transducer SJ Squat jump
MV Mean velocity 3RM Three repetition maximum
MVC Maximal voluntary contraction TUT Time under tension
MVF Maximal voluntary force TPT Traditional percentage based
training
m.s-1 Meters per second VL Vastus lateralis
MPV Mean propulsive velocity VBT Velocity based training
MVT Minimum velocity threshold W Watts
MHC Myosin heavy chain composition
N Newton’s
1RM One repetition maximum
PF Peak force

13
Abstract
The vast majority of resistance training programming in rugby union and rugby league
training environments have for decades utilized traditional percentage based training
(TPT) methods to develop the physical components required for successful performance,
in particular strength and power. However, a major shortcoming of this method is that it
does not take into account athlete’s daily biological status and readiness to train. Thus,
movement velocity is a variable that could be of great interest when designing resistance
training programmes to optimize neuromuscular strength and power adaptations. At
present, there is a paucity of research that has detailed the influence movement velocity
has on enhancing neuromuscular strength and power adaptations in semi-professional
rugby union and professional rugby league players. Thus, the purpose of this thesis was
to; 1) review the current literature pertaining to VBT methods and its current applications
in resistance training, 2) document the velocity profiles of semi-professional rugby union
and professional rugby league players across various load spectrums and, 3) determine
the influence of a 5-week velocity based training (VBT) programme on neuromuscular
strength and power adaptations in professional rugby league players. Through an
extensive literature review, it was identified that several key areas exist for incorporating
movement velocity in the design and implementation of resistance training. Chapter three
investigated the velocity profiles of semi-professional rugby union and professional rugby
league players across a loading spectrum of 20-95% 1RM during the bench press, back
squat and power clean exercises. Regardless of playing code, this investigation revealed
that unique VBT zones exist for loads lifted between 20-95% 1RM for the exercises. The
unique VBT zones identified for each code and exercise may provide a novel approach
in accurately prescribing daily training loads for a pre-selected training intensity based
on an athlete’s ability to maintain a prescribed movement velocity. During Chapter four,
a 5-week case study design training intervention was conducted with five professional
rugby league players to investigate the influence of performing resistance training within
specific VBT zones. Pre and post-intervention measures of performance included
maximal countermovement jump (CMJ), squat jump (SJ) and 3RM performances for the
bench press, back squat and power clean exercises. In addition, measures of psychological
wellness (as determined by questionnaire) and physiological stress (as determined by
salivary cortisol) were conducted throughout the intervention period. Following the 5-
week training intervention, the VBT participants substantially improved neuromuscular
CMJ and SJ performance. In addition, greater increases in training load were performed
by the VBT group when compared to the intended values based off TPT methods.
14
Furthermore, although the VBT group performed greater training loads, no substantial
variance in reported session RPE values were observed between both groups. In terms of
recovery, the VBT group reported higher weekly wellness questionnaire scores and
elicited less physiological training stress for light and heavy intensity training weeks
when compared to the TPT group. In conclusion, this investigation provides evidence that
performing isoinertial resistance training within specific VBT zones may be an effective
training stimulus to enhance neuromuscular strength and power performance whilst
limiting excessive fatigue in professional rugby league players. In addition, movement
velocity should be a primary focus within rugby union and rugby league training
environments when designing and implementing strength and power training
programmes.

15
CHAPTER ONE: PREFACE

16
1.1 Thesis rationale and significance
The physiological demands of rugby union and rugby league are highly complex,
requiring athletes to possess high levels of muscular strength and power (Duthie et al.,
2003; Gabbet et al., 2008). Additionally, an athlete’s capacity to rapidly generate high
levels of muscular force are considered key characteristics of successful competition
performance (Gabbet et al., 2008). It can be considered that the role of a strength and
conditioning professional is to provide athletes with individualized resistance training
programmes that maximize their ability to transfer strength and power training to
competition performance.
At present, the majoriy of strength and power resistance training programmes have placed
a great deal of emphasis toward enhancing muscular strength and power with traditional
percentage based methods. For example, when training for muscular power, endurance,
hypertrophy or strength, the following percentages of an athlete’s baseline one repetition
maximum (1RM) are typically prescribed; 30-85%, ≤ 65%, 60-85% and, ≥80% of 1RM
respectively (Baechle & Earle, 2008). However, a major shortcoming of this traditional
method is that the velocity component of a given exercise is often an overlooked and
under-utilized performance measure.
Previous research has demonstrated that the greatest muscular strength and power
improvements occur when specific resistance training is performed at or near the optimal
training velocity (Behm & Sale, 1993). Additionally, it has been shown that a close
relationship exists between relative load and the movement velocity that is attained during
resistance training (R2 = 0.98) (Gonzalez-Badillo & Sancehez-Medina, 2010). This
relationship makes it possible to determine with great precision the real intensity of effort
or work being incurred by an athlete at loads performed between 30% to 95% of 1RM.
Thus, a velocity based training (VBT) method could complement traditional percentage
based training (TPT) by allowing individuals to train within specific velocity zones across
different load spectrums during strength and power training phases. In addition, having a
velocity based focus may have important implications for the accurate prescription of
training loads based on an athlete’s ability to maintain a prescribed movement velocity.
Such an approach may also aid in fatigue monitoring by utilizing autoregulatory type
programming and further research is warranted in this area.
From the existing literature it is evident that VBT shows promise in providing an effective
alternative training stimulus to improve strength and power adaptations when compared

17
to TPT training methods. However, there is very limited research addressing the effects
of optimizing VBT in improving neuromuscular strength and power adaptations.
Thus, the primary aim of this thesis was to address the overarching question of; “what is
the influence of utilizing specific velocity training zones across different load spectrums
as a means to optimize the development of strength and power in semi-professional rugby
union and professional rugby league players?” The secondary aim was to examine and
compare the psychological wellness and salivary cortisol stress response between VBT
and TPT programmes to determine if VBT induces the same psychological and
physiological stress response as TPT.
This thesis will aim to provide a substantive and original contribution to our knowledge
in implementing and understanding the use of specific velocity zones across different load
spectrums as a means to maximize neuromuscular strength and power adaptations. This
will be achieved by conducting three studies; 1) reviewing the current literature pertaining
to VBT methods and its current applications in resistance training, 2) documenting the
velocity profiles of semi-professional rugby union and professional rugby league players
across various load spectrums and, 3) determining the influence of a 5-week VBT
programme on neuromuscular strength and power adaptations in professional rugby
league players. These studies will provide new insights in how to effectively implement
and optimize strength and power resistance training with the use of velocity to the field
of strength and conditioning practice. Although, the majority of the research will have a
direct relevance to rugby union and rugby league strength and power resistance training
programming, the findings of the research will have significant applications to a variety
of athletic and sporting codes.
1.2 Research aims and hypothesis
The major aims of the work provided in this thesis were to:
1) Develop a better understanding of the strength and power velocity profiles across
different load spectrums for the bench press, back squat and power clean exercises
in semi-professional rugby union and professional rugby league players.
2) Develop a better understanding of specific VBT zones across different load
spectrums as a training stimulus to elicit subsequent strength and power

18
adaptations in semi-professional rugby union and professional rugby league
players.
3) Examine and compare the psychological wellness and salivary cortisol stress
response between VBT and TPT programmes to determine if VBT induces the
same psychological and physiological stress response as TPT methods in
professional rugby league players.
The following hypotheses were made for the studies undertaken in this thesis:
1) The strength and power velocity profiling across different load spectrums for the
bench press, back squat and power clean exercises will provide a large range of
velocities at lighter loads when compared to heavier loads due to the propulsive
and braking phases that occur at light and heavy loading intensities (%1RM).
Additionally, multi-joint compound movements (i.e. power clean and back squat)
that require greater activation and synchronization of agonist and antagonist
muscle groups will result in a larger spread of velocity profiles across the different
load spectrums when compared to the bench press exercise.
2) The prescription of specific velocity training zones across different load
spectrums during isoinertial resistance training provides a superior training
stimulus in enhancing subsequent strength and power performance/adaptations
when compared to TPT methods in professional rugby league players.
3) The psychological wellness and salivary cortisol stress response to a VBT
programme elicits the same psychological and physiological stress response when
compared to TPT programmes in professional rugby league players.
1.3 Originality of the thesis
Currently, there exists very limited research that has addressed the influence of VBT in
improving neuromuscular strength and power adaptations. More specifically, to the best
of our knowledge, no study has investigated the influence of optimizing specific VBT
zones across different load spectrums as a means to enhance neuromuscular strength and
power in professional rugby league players. In addition, no study has investigated the
psychological wellness and salivary cortisol stress response between VBT and TPT
programmes in professional rugby league players.
19
1.4 Study limitations
1. Due to in-season competition constraints, a limited number of rugby league
participants (n = 11) were available for Study one when compared to the availability
of the rugby union players (n = 41). Therefore, the ability to perform between code
statistical analyses were limited.
2. During Study one, no pre-intervention 1RM testing was allowed due to the in-season
competition constraints placed on the athletes from senior coaching staff. Therefore,
the testing loads for the velocity profiling of the bench press, back squat and power
clean exercises were based off the participants’ previous 1RM values that were
obtained within a four week period prior to the commencement of the study. Due to
these constraints, it is possible that the testing loads prescribed for each percentage of
1RM (20-95%) may have not necessarily reflected the participants’ true maximum
strength and power capabilities. However, natural variation in a participant’s 1RM
ability is an inherent issue with exercise prescription and testing. For example,
previous research has demonstrated that an athlete’s actual 1RM can change rapidly
after a few training sessions and often the obtained value is not the athlete’s true
maximum due to daily fluctuations in biological status (Gonzalez-Badillo & Sanchez-
Medina, 2010).
3. Ten participants originally volunteered to take part in Study two. However, a large
dropout of participants occurred due to; 1) in-season competition constraints placed
on athletes from senior coaching staff and, 2) injuries sustained during on field
training sessions and matches. To overcome this situation, a single subject case study
was employed where five professional rugby league players undertook the 5-week
training intervention as opposed to the original study design of 5 VBT vs. 5 TPT
participant allocation.
4. The proposed statistical analyses during Study two included traditional null
hypothesis testing (t-tests), statistical correlation testing and effect sizes. However,
due to the large dropout of participants prior to the commencement of Study two, it
was only possible to describe all data variables as means and standard deviations and
differences in pre and post testing between groups as percentage changes.
5. The training intervention length for Study two was limited to 5-weeks due to the
professional rugby league player’s in-season competition schedule. Thus, the 5-week
training intervention period that comprised of 10 training sessions may have been an
20
insufficient time period to elicit improvements in strength and power performance in
professional athletes.
6. Participant 5 from the TPT group was unable to complete the majority of strength and
power post-testing due to an injury sustained during competition in the final week of
the intervention. In addition, participant 3 from the VBT was unable to complete the
strength testing due to an injury sustained during competition in the final week of the
intervention.
7. Due to the inherent nature of rugby league competition, the collisions and impacts
encountered during training and competition may have negatively influenced the
salivary cortisol stress response. However, this was out of the researcher’s control and
the salivary collection methods used in this thesis were in accordance with previous
research studies conducted by Crewther et al., (2009), Crewther et al., (2013) and,
Beaven et al., (2008) which assessed the salivary cortisol stress response to resistance
training in rugby union players.
8. In the original design for Study two, pre and post-intervention strength testing
involved the performance of a 1RM for the bench press, back squat and power clean
exercises. However, immediately prior to the start of Study two, the senior coaching
staff of the professional rugby league team requested the researchers to replace the
1RM protocols with 3RM protocols due to injury concerns. Consequently, this may
have influenced the negligible improvements in strength performance as the athletes
were not accustomed to performing 3RM assessments.
1.5 Study delimitations
1. Semi-professional rugby union and professional rugby league players were chosen as
the participants for this thesis. Each participant had extensive resistance training
experience and these levels of athlete were chosen to ensure expertise in each of the
prescribed lifts. Therefore, changes in performance are more likely to be attributed to
the training stimulus as opposed to a learning effect.
2. During Study two, the professional rugby league players were provided with a ≥ one-
hour rest period following a field/skill session. This was done to allow for sufficient
neuromuscular recovery before commencing their assigned resistance training
programme.

21
3. In order to combat the single subject case study design limitations employed during
Study two, multiple pre and post-intervention trials were performed for the CMJ and
SJ to account for error and change associated with; measurement error (random
change, technological error, biological error), learning effect, and variation in kinetic
outputs (systematic change).
4. The professional rugby league players were accustomed to performing weekly
wellness questionnaire monitoring as this is a main staple in their weekly assessment
of neuromuscular and wellness monitoring procedures.
1.6 Thesis organization
To address the overarching question of “what is the influence of utilizing specific velocity
training zones across different load spectrums as a means to optimize the development of
strength and power adaptations in semi-professional rugby union and professional rugby
league players”, this thesis has been divided into five chapters that includes both original
research and reviews of the literature.
Chapter two consists of a review of the literature that explores in detail a variety of the
key variables pertaining to strength and conditioning practice. Firstly, this review covers
the TPT methodologies employed for strength and power neuromuscular adaptations.
Next, an overview of VBT methods is presented with particular focus placed on the
neuromuscular and sport specific adaptations arising from VBT along with the
subsequent training monitoring applications of VBT.
Chapter three comprises of an experimental velocity profiling study that was conducted
to determine each semi-professional rugby union and professional rugby league player’s
velocity profile across a set training load spectrum of 20, 30, 45, 60, 75, 80, 85, 90 and
95% 1RM for the bench press, back squat and power clean exercises.
Chapter four comprises of an experimental case study that examined the effectiveness of
a 5-week VBT intervention on improving neuromuscular strength and power adaptations
when compared to a TPT programme in professional rugby league players. In addition,
the psychological wellness and salivary cortisol stress response between VBT and TPT
methods were examined to determine if VBT elicits the same psychological and
physiological stress response as TPT.

22
The fifth and final chapter comprises an overall discussion and summary of the main
research findings presented in this thesis. Subsequently, practical recommendations are
suggested for strength and conditioning practitioners, in regards to employing VBT and
the kinetic variable of velocity as a practical tool to maximize strength and power
adaptations and as a means to asses and monitor athlete performance. To conclude, future
research recommendations and study limitations are presented.
References are included as an overall reference list of the entire thesis at the conclusion
of the thesis. The referencing format is presented in APA 6th format for consistency
throughout the entire thesis. The appendices presented include relevant material including
informed consent form, information sheets, wellness monitoring form and ethical
approval.
23
CHAPTER TWO: THE INFLUENCE OF TRADITIONAL PERCENTAGE
BASED RESISTANCE TRAINING AND VELOCITY BASED RESISTANCE
TRAINING PRACTICES ON STRENGTH AND POWER ADAPTATIONS:
LITERATURE REVIEW

24
2.1 Preface
The purpose of this chapter is to review the current literature relating to factors that
influence neuromuscular strength and power adaptations. Particular emphasis is placed
on the current literature pertaining to the applications of VBT profiling technology and
strength and power assessment strategies along with an overview of VBT methods
currently used in the literature. Additionally, the neuromuscular and sport specific
adaptations to VBT and current monitoring strategies are reviewed. Collectively, the
literature review provides a comprehensive understanding of how VBT methods can be
implemented in professional sporting environments to enhance subsequent
neuromuscular strength and power adaptations when compared to TPT methods.
25
2.2 Introduction
Rugby union and rugby league are classified as collision based field sports that are
intermittent in nature and require high levels of muscular strength and power (Gabbett,
2005a; Roberts et al., 2008). Rugby union and rugby league match play are punctuated
with frequent challenging contests involving repeat high intensity effort (RHIE) bouts of
maximal accelerations, high impact collisions and frequent static and dynamic tasks when
attempting to gain or maintain possession of the ball (Cunniffe et al., 2009; Deutsch et
al., 2007; Gabbett, 2005a; Smart et al., 2014). There are distinct differences in the
physiological profiles between rugby union and rugby league players that owe to the
differing match play demands of each sport. Rugby league features less on-field players
than rugby union (13 vs 15) and requires players to retreat 10 meters towards their own
goal line for six tackles before possession is handed over. This results in greater sprinting
velocities due to large spaces between attackers and defenders and higher contact-
orientations in order to keep an opposition player upright and stopping the ball from going
to ground for as long as possible. Conversely, rugby union allows contesting for the ball
straight after the tackle with players only required to retreat behind the ruck. This results
in a greater number of short maximal accelerations and lower contact-orientations that
are force-dominant movements (Cross et al., 2015). These demands require players to be
proficient in both high force and velocity-dominant exercises (Cross et al., 2015).
Consequently, high levels of muscular strength and power play a significant role in the
success of rugby union and rugby league match play and have been shown to be key
performance measures that demonstrate correlations between line breaks, tackle breaks,
tackling efficiency and tries scored (Crewther et al., 2009; Gabbett et al., 2011b; Smart et
al., 2014).
The optimal combination of training variables for the development of strength and power
performance remains an area of great interest among strength and conditioning
practitioners. A key area of conjecture is which training stimulus and load provides
optimal improvements in functional strength and power performance and these loads are
typically expressed as a percentage of an athete’s one repetition maximum (1RM) for a
given exercise. In addition, guidelines for developing or enhancing muscular strength and
power in rugby union and rugby league players typically involves quantifying strength
and power training by calculating the load x reps x sets which equates to the total volume
lifted in a session (Kraemer & Ratamess, 2004). Many researchers have suggested that
heavy training loads (>80% 1RM) (Campos et al., 2002; Hakkinen et al., 1985; Tricolli

26
et al., 2005; Wilson et al., 1993) may be superior in enhancing strength and power
performance. However, some suggest lighter loads (50-70% 1RM) (Lyttle et al., 1996;
McBride et al., 2002) and, some suggest a combination of loads (Adams et al., 1992;
Harris et al., 2000).
A method postulated to improve strength and power performance is the power-load
relationship that identifies optimal training loads where mechanical power output is
maximized (Pmax) (Baker et al., 2001a; Baker et al., 2001b; Kaneko et al., 1983; Newton
& Kraemer, 1994; Wilson et al., 1993). This method suggests that training with loads
corresponding to optimum power output should result in improvements of 10-20-meter
sprint times and small-moderate improvements in 1RM lower and upper body strength
performance (Blazevich & Jenkins, 2002; Harris et al., 2008). However, major
shortcomings of this method include; 1) this training method cannot be applied to
developing specific skeletal muscle performance traits of starting strength, speed-
strength, strength-speed, accelerative strength, and absolute strength and, 2) there exists
considerable inter-individual and exercise specific differences in the load where Pmax
occurs. Conversely, it is suggested how the load that is actually lifted or moved may be
more significant in developing functional neuromuscular adaptations (Harris, Cronin, &
Keogh, 2007). Thus, the concept of velocity specific resistance training is an important
consideration when designing and implementing resistance training programmes.
However, the velocity component of a given exercise is often an overlooked and under-
utilized performance measure.
Previous research has demonstrated that the greatest muscular strength and power
improvements occur when specific resistance training is performed at or near the optimal
training velocity (Behm & Sale, 1993). The optimal training velocity can be defined as a
prescribed movement velocity that influences both neural and muscular components that
consequently maximizes functional strength and power performance (Behm & Sale,
1993). In addition, it has been shown that a close relationship exists between relative load
and the movement velocity that is attained during resistance training (R2 = 0.98)
(Gonzalez-Badillo & Sanchez-Medina, 2010). This relationship makes it possible to
determine with great precision the real intensity of effort or work being incurred by an
athlete at loads performed between 30% to 95% of 1RM. Thus, a velocity based training
(VBT) method could potentially replace the use of traditional percentage based training
(TPT) by allowing individuals to train within specific velocity zones across different load
spectrums during strength and power training phases. VBT is a method used by strength
27
and conditioning practitioners to determine the optimal loading strategies for strength and
power training by using the velocity at which an athlete can move an external load that is
independent of 1RM (Mann, Ivey, & Sayers, 2015). Training within specific VBT zones
provides a novel approach in identifying specific loads that will enhance the specificity
of resistance training that takes into account an athlete’s fluctuations in performance as a
result of the stressors encountered during training and competition (Mann et al., 2015).
Therefore, movement velocity may be considered a fundamental component in rugby
union and rugby league resistance training programming, as it is demonstrated the
velocity at which loads are lifted may determine the resulting training effect and its
transference to sports performance (Gonzalez-Badillo, Rodriguez-Rosell, Sanchez-
Medina, Gorostiaga, & Pareja-Blanco, 2014).
The majority of past research regarding velocity specificity has been conducted with the
use of isokinetic dynamometry equipment. Because isokinetic muscle actions are
considered to be less specific to actual sporting movements the results from isokinetic
research are somewhat questionable (Cronin, McNair, & Marshall, 2002). Therefore,
isoinertial (i.e. constant mass) training appears to be more specific to actual sporting
movements and would be more applicable in practical settings. This may be due to the
actual movement of isoinertial training being determined by the contractile impulse
applied by the musculoskeletal system and the magnitude of the external load.
Consequently, isoinertial training would be associated with a higher movement velocity,
provided the intention is to accelerate a load with maximum dynamic effort (McBride et
al., 2002; Schilling et al., 2008). A highly cited study in the literature conducted by Behm
and Sale (1993) suggest that the principal stimuli that elicits velocity specific training
adaptations is the intention to move explosively. According to Behm and Sale (1993) this
“internal velocity” (i.e. muscle contraction speed) is believed to be more important during
strength and power training regardless of contraction type, load or actual movement
velocity. However, there exists contrary evidence that suggests that velocity specific
improvements in neuromuscular strength and power are more likely elicited by utilizing
the actual movement velocity that could play a significant role in determining velocity-
specific effects to resistance training (Kaneko et al., 1983; McBride et al., 2002). For
example, Gonzalez-Badillo and colleagues (2010) demonstrate that each percentage of
1RM loading intensity has its own unique velocity training zone. Therefore, training with
light (0-55% 1RM), moderate (60-75% 1RM) or high intensity (80-95% 1RM) loads with
the intention to move explosively, as controlled by load within specific velocity training

28
zones may optimize adaptation of specific skeletal muscle performance traits including;
starting speed, speed-strength, strength-speed, accelerative strength and absolute
strength/power. Consequently, this may improve goal-oriented resistance training tasks
by inducing neuromuscular adaptations within skeletal muscle, altering its force-velocity
characteristics and adaptations within the neural system, increasing the recruitment of
higher threshold motor units and enhancing the coordination and activation of agonist,
synergistic and antagonist muscle groups (Almasbakk & Hoff, 1996). However, the
mechanisms responsible for the velocity-specific resistance training effects on intrinsic
skeletal muscle characteristics and performance enhancement are currently not well
understood and requires further investigation.
There currently exists a paucity in the literature in addressing the effects of performing
resistance training within specific velocity zones across different load spectrums as a
means to maximize neuromuscular strength and power performance in semi-professional
rugby union and professional rugby league players. In addition, by examining the
influence VBT has on enhancing strength and power performance, this will provide a
greater understanding of the relative importance VBT has on programme design and its
effect on neuromuscular strength and power adaptations. In regards to this contention,
comparisons between TPT and VBT methods are discussed within this review of the
literature. First, the TPT methods relating to strength and power methodologies and
adaptations are discussed. Second, the velocity profiling technology and strength and
power assessment strategies along with an overview of VBT methods currently used in
the literature are reviewed. In addition, the neuromuscular and sport specific adaptations
to VBT are reviewed. Thereafter, monitoring training volume and load in resistance
training are discussed. Finally, VBT practical application recommendations are provided
and we highlight the potential areas for future research.
2.3 Literature review search methods
The search for scientific literature relevant to this review was conducted using the AUT
library and Google Scholar databases. Key search terms used were, ‘velocity’,
‘neuromuscular adaptations’, ‘strength and power’, and ‘rugby union and rugby league’.
In order to further broaden the literature search, a manual reference list screen for related
articles was conducted on each of the retrieved articles and published reviews (Cormie et
al., 2011). Using the aforementioned search strategies, 1,888 potentially relevant articles

29
were returned. Following a review of the titles and abstracts, the total was narrowed to
107 articles by implementing the following inclusion criteria; 1) the literature was
published in English, 2) appeared in a peer reviewed journal from 1960 to December 2015
and, 3) articles needed to reference “rugby union”, “rugby league”, “velocity”,
“movement velocity”, “resistance training” and its relation to strength and power
adaptations to TPT and VBT methods.
2.4 TRADITIONAL PERCENTAGE BASED TRAINING METHODOLOGIES
2.4.1 Strength resistance training methodology and adaptations
Maximum strength can be defined as the maximum amount of force (dynamic or
isometric) an athlete can produce against an external load and is typically assessed with
the one repetition maximum (1RM) for a given exercise (Zatsiorsky & Kraemer, 1995).
It is suggested that the dosage required to develop maximal strength is generally described
as high in frequency (3-5 weekly sessions), moderate volume (3-6 sets x 2-6 repetitions
x load (kg), high intensity (80-100% 1RM), and utilizing long rest periods (3-5 minutes)
(McMaster et al., 2013; Peterson et al., 2005; Ratamess et al., 2009). In addition, the
design of strength training programmes are often a composite of manipulating several
acute resistance training variables (i.e. repetition velocity, exercise type, order, sets and
repetitions, percentage of 1RM and rest duration). Exercise intensity (%1RM) is generally
acknowledged as the most important stimulus related to enhancing strength adaptations
and is commonly identified with relative loading intensities of an athlete’s percentage of
1RM (Kraemer & Ratamess, 2004). The overall structure of a strength training cycle is
typically periodized into macro-cycles (1 year cycle) which is then further subdivided
into mesocycles (2-3 month cycles) and micro-cycles (4 week cycles) in an attempt to
achieve optimal maximum strength improvements throughout preparation, competition
and transition periods (Burgener, 1994; Fleck, 1999; Matveyev, 1992). From a practical
perspective, an advantage of prescribing strength training from the aforementioned acute
resistance training variables is that it provides strength and conditioning practitioners with
a simple and cost effective means to individualize athlete training loads for a pre-selected
training intensity. However, a major shortcoming of this method is that it requires the
direct assessment of an athlete’s 1RM for a given exercise which provides limitations.
For example, the direct assessment of a 1RM can be a time consuming process (Braith,
Graves, Legget, & Pollock, 1993) and the obtained 1RM value may not necassarily reflect

30
the athlete’s true maximum strength due to daily fluctuations in biological status
(Gonzalez-Badillo & Sanchez-Medina, 2010).
Improvements in maximum strength may also be attributed to a combination of neural,
metabolic, hormonal and muscular morphological adaptations. The initial strength gains
that occur following a training period are attributed to neural adaptations which include
increased neural activation, firing frequency, intermuscular and intramuscular
coordination, motor unit synchronization and excitation and, peak electromyography
muscular activity (Hakkinen et al., 1985; Jones et al., 1989; Sale, 1988; Zatsiorsky &
Kraemer, 1995;). However, following several months of resistance training, further
strength gains are attributed to morphological adaptations which include increases in
muscle cross-sectional area, musculotendinous stiffness and thickness and changes in
fascicle length and pennation angle that are thought to further develop maximum strength
capabilities (Blazevich & Sharp, 2005; Folland & Williams, 2007; Fry, 2004; Hakkinen,
1994; Hakkinen et al., 1985; Moritani & DeVries, 1979). Furthermore, the training status
of an athlete plays an important role in the rate of maximum strength improvement.
Specifically, trained athletes are considered to have limited potential for maximal strength
gains and are required to perform higher intensities and execute heavy loads to increase
maximal strength (Kraemer & Ratamess, 2005). This is in agreement with Hakkinen and
colleagues (1985) who demonstrated that loads >80% 1RM are required to produce
further neural adaptations in advanced resistance trained athletes. Similarly, Berger,
(1962) and Campos et al., (2002) demonstrated that loads corresponding to >80% 1RM
were most effective for increasing maximum dynamic strength. This may be due to
heavier loads being characterized by slower movement velocities that consequently result
in longer contraction durations or time under tension (TUT) that are important for strength
and hypertrophic adaptations to occur. In addition, heavier loads produce greater forces
that are suggested to maximally recruit higher threshold fast twitch muscle fibers that
specifically enhance dynamic 1RM strength (Hakkinen et al., 1985). However, as with
training intensity, it is suggested that training volume (sets x reps x load) may perhaps be
just as important in eliciting improvements in strength adaptations in trained athletes.
That is, altering one or several of the aforementioned resistance training variables may
stimulate several systems including the metabolic and hormonal response (Kraemer &
Ratamess, 2004; Tan, 1999). Previous research has suggested that configuring a strength
training stimulus to promote the accumulation of metabolites such as lactate may increase
31
the secretion of various anabolic (i.e. testosterone and human growth hormone) and
catabolic (i.e. cortisol) hormones (Crewther, Cronin, & Keogh, 2005) which may
facilitate further adaptations in maximal strength in resitance trained athletes (Crewther
et al., 2005; Kraemer & Ratamess, 2005; Mangine et al., 2015). It is generally believed
that testosterone and cortisol control short-term and long-term changes in protein
metabolism, muscle size and force potential (Kraemer & Ratamess, 2005). In addition, it
is proposed that testosterone not only facilitates endocrine mechanisms in the anabolic
process, it may also have a direct effect on neural receptors such as increasing the amount
of neurotransmitters being released and the length and diameter of dendrites that may be
of particular importance in force and power production (Kraemer & Ratamess, 2005).
Therefore, it can be suggested that in trained athletes, due to their limited potential for
strength improvement, utilizing high intensity loads (>80% 1RM) or configuring a
strength training stimulus that elicits greater secretion of anabolic hormones may
facilitate further adaptations in maximal strength. However, this contention remains of
great debate in the literature and it may be that a combination of the numerous neural,
metabolic, hormonal, and muscle morphological responses to strength training may
influence further adaptations in maximum strength rather than one single mechanism.
Conversely, it may be that trained athletes require a wide variety of programme design
whereby the intensity and velocity of movement may be more significant in developing
further adaptations in maximum strength with further investigation warranted in this area
(Cormie et al., 2011).
2.4.2 Power resistance training methodology and adaptations
Power can be defined as the ability to generate maximal force rapidly under the concentric
portion of the power-time curve when utilizing a given load (Sapega & Drillings, 1983).
The load that maximizes power output is often referred to as the Pmax load which is often
predicted based on a polynomial equation applied to the individual power-load curve and
is expressed as either mean or peak power (Baker et al., 2001a; Baker et al., 2001b; Bevan
et al., 2010; Harris et al., 2007; McGuigan et al., 2009). From a practical perspective,
maximal power represents the greatest instantaneous power produced during a single
movement performed with the goal of producing maximal velocity at take off, release or
impact (Kraemer & Newton, 2000; Newton & Kraemer, 1994). This usually consists of
performing movements such as sprinting, jumping and throwing tasks that apply to a wide

32
variety of sports. However, one of the fundamental principles underlying power
production is an athletes baseline strength status. As power is the product of force
multiplied by velocity (Stone et al., 2003), an individual cannot possess a high level of
power without first being relatively strong (Cormie et al., 2011).
The required dose to develop maximal power is considered to be optimized with three to
five weekly sessions, performed at or below 60% 1RM with three to six sets of two to six
repetitions performed for each exercise (Baker & Newton, 2006; Cormie et al., 2011;
Kawamori & Haff, 2004). However, previous research has suggested that resistance
trained athletes may require higher loading intensities (70-85%) in order to maximize
power output (Baker & Newton, 2006; Kaneko et al., 1983; Newton et al., 1997; Wilson
et al., 1993). These suggested higher training loads are in agreement with McBride et al.,
(2002) and Wilson et al., (1993) who demonstrated that heavier loads (i.e. 4 sets of 3-6
reps at 70-90% 1RM) improved power production in resistance trained men by increasing
the force component.
The basis for the prescription of heavy loads for resistance trained athletes is suggested
to be related to hypertrophic adaptations and greater motor unit recruitment as near
maximal force production is needed to maximally recruit higher threshold fast twitch
muscle fibers. In contrast, it is suggested that lighter loads (20-60% 1RM) also be used
to optimize power output due to the higher movement velocities achieved at these loads
that may enhance intramuscular coordination such as synchronization and firing
frequency of motor units (Cormie et al., 2011; Cronin & Crewther, 2004; Hakkinen et al.,
1985). Consequently, strength and conditioning practitioners have implemented a range
of traditional percentage based power training modalities that include; ballistic,
plyometric and weightlifting type exercises in an attempt to develop maximal power
capabilities.
An advantage of the aforementioned training modalities is that they allow for loads to be
accelerated throughout an entire range of motion, they increase muscular contraction
force output and electromyography (EMG) muscular activity during the concentric phase
and, they produce greater velocity and power outputs with high intensity training loads
(70-85% 1RM) (Bosco et al., 1982; Cormie et al., 2007; De Villiers & Venter, 2015; Haff
et al., 1997; Kawamori et al., 2005; Komi & Gollhofer, 1997; Newton et al., 1996; Voigt
et al., 1998). In addition, it is suggested that these exercise modalities may allow for a
greater overloading of the neuromuscular system that is hypothesized to contribute to
33
adaptations in greater neural activation and enhanced rate of force development (RFD)
which is considered of paramount importance for successful athletic performance
(Cormie et al., 2007; McBride et al., 2002; Newton et al., 1999). However, disadvantages
of traditional percentage based power training methods include that Pmax output is greatly
influenced by the type of muscle action performed and the magnitude of load applied to
a specific movement pattern. This will affect factors such as the stretch reflex, storage of
elastic energy, neural activation and, recruitment of higher threshold fast twitch muscle
fibers (Bosco et al., 1982; Komi & Gollhofer, 1997; McBride et al., 1999; Newton et al.,
1996; Wilson et al., 1993; Voigt et al., 1998). In addition, the optimal load that maximizes
Pmax output is highly inter-individual and exercise specific whereby it is suggested that
performing loads that maximize Pmax outputs may be no more effective than performing
traditional heavy resistance training (>80% 1RM) (Harris et al., 2008).
Collectively, the ability to generate maximal power is critical to successful athletic
performance and is influenced by an athlete’s strength status. In addition, maximal power
appears to be influenced by a variety of neuromuscular factors that include muscle cross-
sectional area and fiber type composition as well as motor unit recruitment, firing
frequency, and synchronization. Furthermore, maximal power is also influenced by the
type of muscle action performed and the magnitude of load applied to a specific
movement pattern. However, the suggested exercises and loading intensities needed for
maximal power output appear to be conflicting and provide confusion as to the
appropriate selection of loads and exercises that may maximize Pmax output. Therefore,
the development of an effective power training strategy should consider the actual
movement velocities achieved for a specified exercise with further investigation
warranted in this area.
2.5 VELOCITY BASED RESISTANCE TRAINING METHODOLOGIES
2.5.2 Linear position transducer velocity profiling technology
The use of technology within the strength and conditioning industry to measure and
monitor an athlete’s physical status continues to grow significantly. The use of linear
position transducers (LPT), global positioning systems (GPS) and accelerometers used in
combination or separately, are examples of technology that are currently being utilized in
the strength and conditioning field for the purpose of measuring performance and
monitoring training (Sato et al., 2015). Monitoring the progress of an athlete’s training is

34
an essential role of the strength and conditioning professional. The monitoring process
allows the efficacy of prescribed training programmes to be evaluated and indicates
whether adjustments are needed to the prescribed training stimulus (Harris, Cronin,
Taylor, Boris, & Sheppard, 2010).
Previous research has demonstrated that LPT devices provide valid and reliable kinetic
measures of strength and power performance at the point of attachment for a given
exercise (CV < 3%, r = 0.59 – 1.00, p < 0.05 – 0.001) (Crewther et al., 2011b; Drinkwater
et al., 2007). These devices house a stainless steel cable that is wound on a precisely
machined constant diameter cylinder-shaped spool that turns as the measuring cable reels
and unreels (Harris et al., 2010). As the LPT’s cable reels and unreels along with a
moveable object (i.e. Olympic barbell), the rotating spool and sensor creates an electrical
signal proportional to the cables linear extension and velocity (Harris et al., 2010). This
converts a physical attribute (i.e. power) into a form of measurement or transfers
information of the kinetic and kinematic quality of movement. The velocity of a specified
movement can then be calculated from the displacement and time [velocity =
displacement (d) / time (t)]. Acceleration can also be calculated from the changes in
velocity over time [acceleration = velocity (v) / time (t)] (Harris et al., 2010).
The majority of LPT devices now include software that can provide real-time feedback
on strength and power output via display screens or handheld devices such as iPhones
and tablets. Such feedback provides real-time quantifiable evidence of the true effort or
work being performed by an athlete to the strength and conditioning practitioner. This
feedback measure may result in increases in a goal-orientated movement task within a
strength or power session by enhancing a specific skeletal muscle performance trait such
as strength-speed. It is demonstrated by Gonzalez-Badillo and Sanchez-Medina (2010),
that although a participant’s 1RM value may increase after a period of strength training,
the velocity that is obtained at each percentage of 1RM remains stable. In contrast, if a
participant’s 1RM value does not change significantly following a period of strength
training, velocity capabilities may have still improved at various loads (Harris et al.,
2010). Additionally, it is considered that the intention to move a load explosively and the
actual movement velocity obtained during a specified movement task are vital stimuli to
optimize strength and power adaptations (Cormie, McGuigan, & Newton, 2011). That is,
the intention to move a load explosively irrespective of contraction type, load and
movement are believed to influence velocity specific adaptations to resistance training
(Behm & Sale, 1993). However, the majority of literature indicates that velocity specific
35
adaptations to resistance training are elicited by the actual movement velocity of a
specified movement (Caiozzo et al., 1981; Kaneko et al., 1983; McBride et al., 2002).
Thus, both the intention to move a load explosively and the actual movement velocity
achieved for a specified movement are both vital stimuli required to elicit velocity specific
neuromuscular strength and power adaptations to resistance training (Cormie et al., 2011).
Therefore, strength and conditioning practitioners should place less emphasis on
increasing 1RM values and the total load lifted in a session and place greater focus on
moving loads across different load spectrums at higher movement velocities when
developing neuromuscular strength and power performance.
When measuring velocity during basic non-ballistic type strength training exercises such
as the bench press and back squat, the measurement of mean concentric velocity is
considered to better represent the ability of the athlete to move a load throughout the
entire concentric phase (Jidovtseff, Harris, Crielaard, & Cronin, 2011). In addition, when
measuring velocity during ballistic type power exercises such as the power clean and
jump squats, the measurement of peak velocity is considered to yield higher consistency
between sessions (Randell, Cronin, Keogh, Gill, & Pedersen, 2011). This is easily
measurable and achievable with LPT devices that allow strength and conditioning
practitioners to monitor velocity at set training load spectrums and examine a range of
kinetic data that can provide a detailed diagnostic of the effectiveness of a resistance
training session. In addition, LPT’s allow a quick and reliable means in enabling strength
and conditioning practitioners to accurately prescribe training loads based on an athlete’s
ability to maintain a prescribed movement velocity that may also aid in fatigue
monitoring. Furthermore, strength and conditioning practitioners can identify the point
on the load spectrum where the mechanical variable of interest such as peak power is
maximized (Pmax). Cormie and colleagues (2011) demonstrate that the ability to generate
maximal power output is not only influenced by the type of movement applied but also
the load that is applied to that movement. It is suggested that power output varies
dramatically across different loading intensities (0-85% 1RM) that may consequently
influence the type and magnitude of performance improvement obtained, as well as the
resulting neuromuscular adaptation (Baker et al., 2001a; Cormie et al., 2007; Kawamori
et al., 2005).
A study conducted by Baker and colleagues (2001a) demonstrated that power-trained
athletes maximized power output in the jump squat when performing loads at Pmax (55-
59% 1RM, 1851 ± 210W), which was significantly different to performing loads of 40kg
36
(1587 ± 242W), 60kg (1711 ± 206W), 80kg (1796 ± 218W), and 100kg (1823 ± 230W)
relative to each participants 1RM full squat. Similarly, Baker et al., (2001b) demonstrated
that power-trained athletes maximized power ouput in the bench press throw when
performing loads at Pmax (55 ± 5.3% 1RM, 598 ± 99W), which was greater than
performing loads at 40kg (482 ± 54W), 50kg (533 ± 70W), 60kg (568 ± 83), 70kg (588
± 95W), and 80kg (580 ± 112W) relative to each participants 1RM bench press.
Collectively, these results suggest that power-trained athletes may require higher loading
intensities in order to maximize power output for a given exercise than the previously
suggested lower intensity ranges of 30-45% 1RM (Kaneko et al., 1983; Newton et al.,
1997; Wilson et al., 1993). Therefore, LPT devices may allow for the prescription of
individual and daily exercise specific loads that may maximize Pmax output rather than
arbitrarily setting training loads that may not be appropriate for that given day due to daily
fluctuations in biological status.
In contrast, prescribing loads that maximize Pmax outputs provide limitations in that this
method cannot be applied to developing specific skeletal muscle performance traits that
include; starting strength, speed-strength, strength-speed, accelerative strength, and
absolute strength during a periodized resistance training programme. Additionally, there
are a number of calculation techniques utilized to analyse power data during unloaded
and loaded conditions that include multiplying the force-time curve by the velocity-time
curve, resulting in a power-time curve for the movement analysed (Cormie, McBride, &
McCaulley, 2007; McBride et al., 2002). However, this calculation method provides
limitations in that it does not account for the exclusion of system mass in force
calculations. A study conducted by McBride et al., (2002) demonstrated that the power-
time, force-time and, velocity-time curves during the concentric phase of unloaded
conditions is higher in comparison to loaded conditions due to the increased acceleration
throughout a specified movement. Therefore, the resulting power-time curve may have
marked decreases in peak power, force and velocity output and consequently
underestimate or misinterpret optimal power training loads (Cormie et al., 2007). Thus,
VBT may provide a more comprehensive training approach in accurately prescribing
daily training loads that maximize strength and power performance.
In summary, LPT devices provide a variety of assessment and monitoring strategies that
offer a more in depth understanding of velocity specific strength and power adaptations
when compared to traditional field based quantification of sets x reps x load. Taking this
into consideration, with the frequent and continued use of LPT technology within sporting
37
organizations, this will lead to improved strength and power programming and
subsequent improvements in athletic performance.
2.5.3 Overview of isokinetic and isoinertial velocity based resistance training used
in the literature
The specificity principle suggests that greater improvements in strength and power
performance are obtained when resistance training is similar to the sports performance
pattern. This would suggest that athletes perform resistance training that simulates sport
specific muscle actions and velocities that are encountered during sporting competition.
A number of studies have investigated the effects of velocity specific isokinetic training
with both slow and fast velocity training of the elbow flexors and leg extensors/flexors
(Coburn et al., 2006; Kaneko et al., 1983; Wilson et al., 1993). In addition, the majority
of isoinertial studies have investigated the effects of velocity specific isoinertial training
with either low-load high velocity or high-load slow velocity training (Baker et al., 2001a;
Moss et al., 1997; Wilson et al., 1993). It is generally accepted that isokinetic muscle
actions are considered to be less specific to actual sporting movements and the practical
applications of the results from isokinetic research are somewhat questionable (Cronin et
al., 2002). Additionally, isoinertial resistance training is suggested to be more specific to
actual sporting movements as it facilitates the nervous systems ability to activate agonist,
antagonist and synergistic muscle activity that is essential to successful sporting
performance (Cronin et al., 2002).
A study conducted by Kaneko and colleagues (1983) investigated the influence of load-
controlled isokinetic velocity specific adaptations in the elbow flexors with training loads
of 0, 30, 60 and 100% of isometric voluntary contraction force. The results demonstrated
that training with heavy load (100% MVC) mainly improved performance at the high
portion of the force-velocity curve whereas, training with light load (0-30% MVC) mainly
improved performance at the high velocity portion of the curve. It was concluded that
resistance equal to 30% of maximal isometric strength in an elbow flexor movement
maximized power output. Similarly, Moss et al., (1997) investigated the effect of maximal
isoinertial strength training in the elbow flexors at loads of 15, 35 and 90% of 1RM. The
results demonstrated that training with light loads of 15% and 35% of 1RM resulted in
velocity specific improvements in 1RM strength (6.6% and 10.1%). In contrast, it was
also demonstrated that training with heavy loads (90% 1RM) significantly increased
38
maximal strength (15.2%) and power output at 15% 1RM. Additionally, Wilson and
colleagues (1993) demonstrated that high velocity training maximized power output with
isoinertial loads equivalent to 30% of participant’s maximum isometric force that
produced significant improvements in CMJ (17.6%) and isokinetic leg extension (7%)
performance when training with light loads and high velocities. Conversely, Baker and
colleagues (2001a) demonstrated that mechanical power output is maximized at 55-59%
of full squat 1RM in trained athletes. Collectively, the aforementioned studies results
suggest that athletes may maximize power output at slightly higher intensities (48-63%
1RM) than previously recommended (30-45% 1RM) intensities. In addition, it is also
suggested that lighter intensities (30-45% 1RM) may be effective in stimulating higher
movement velocities and it would appear that a range of intensities may maximize
velocity and power output. In contrast, a study conducted by Coburn and colleagues
(2006) demonstrated that isokinetic leg extension in 30 adult women (age 19-29 years)
who had not participated in a resistance training programme three months prior to testing,
increased peak torque significantly at slow velocity training (30°/s) when compared to
fast velocity training (270°/s). Specifically, it was demonstrated that slow velocity
training increased peak torque (24.4%) at both slow and fast velocities, whereas fast
velocity training increased peak torque (11.5%) only at a fast velocity. A similar study
conducted by Prevost and colleagues (1999) demonstrated contradictory results in 18
novice resistance trained males (age 19-35 years) whereby the slow velocity training
group demonstrated no change in peak torque. However, the fast velocity training group
significantly increased peak torque (22.1%) only at the fast training velocity. Conversely,
other isokinetic investigations have demonstrated that high velocity training induces
strength gains at both slow and fast velocities, whereas slow velocity training provides
improvements only at slow velocity training conditions (Coyle et al., 1981; Lesmes et al.,
1978; Moffroid & Whipple, 1970). Collectively, these studies suggest that training at
specific movement velocities may be an important consideration in improving strength
and power performance.
The mechanisms underlying velocity specific isokinetic and isoinertial resistance training
adaptations from the aforementioned studies are by no means clear. The results from these
studies appear to be conflicting with the majority of isokinetic studies suggesting that
subjects performing resistance training at fast velocities will mainly improve performance
at fast velocities than those who train at slow velocities and vice versa. Furthermore, the
majority of isoinertial studies suggest that performing resistance training at a range of
39
loading intensities specific to a participants individual 1RM may optimize velocity and
power output. Many methodological aspects may have influenced the differences
between studies such as firstly defining what constitutes slow and fast velocity training
and whether one exercise velocity is optimal for improving functional performance. Since
high velocity and high load resistance training effects different portions of the force-
velocity curve, it can be suggested that combining both slow and fast velocity movements
as part of comprehensive resistance training programme may optimize adaptation within
the neuromuscular system by performing a range of velocities encountered during
sporting competition. In contrast, the effect of combining both slow and high velocity
training as part of a comprehensive resistance training programme in order to improve
functional neuromuscular performance are currently not well understood. In addition,
isokinetic dynamometry muscle actions are considered to be less specific to actual
sporting movements therefore, it is important future research involving velocity specific
resistance training in athletes utilize isoinertial techniques with further research warranted
in this area.
2.5.4 Velocity based resistance training neuromuscular adaptations
The mechanisms responsible for VBT neuromuscular adaptations are currently not well
understood. It has been suggested that velocity specific adaptations to resistance training
may be due to several factors including; enhanced coordination and specificity of
movement, increased discharge of high threshold motor units, enhanced intramuscular
and intermuscular coordination and increased stress placed on fast twitch muscle fibers
(Cronin et al., 2002; Enoka, 1997; Tricoli et al., 2001). Since fast and slow twitch fibers
differ in contractile properties, a training induced enhancement of fast twitch fiber
activation may have a marked effect on velocity specific adaptations (Tricoli et al., 2001).
According to Behm and Sale (1993), the principal stimuli responsible for eliciting
velocity specific adaptations are the motor unit activation recruitment patterns associated
with the intention to move a load explosively regardless of actual movement velocity and
load. In addition, Jones and colleagues (2001) suggest that the use of intended maximal
concentric action (IMCA) lifting techniques may increase neuromuscular peak power
(PP) and peak velocity (PV) capabilities across a range of loading intensities (40-90%
1RM) provided the subject attempts maximum acceleration with each repetition.
However, McBride et al., (2002) demonstrated a significant finding in that the velocity at
which a participant trains, as controlled by load, results in velocity specific changes in

40
muscular electrical activity and improvements in peak force (PF) and Pmax muscular
capabilities. Therefore, it appears that the intention to move a load explosively and the
actual movement velocity as controlled by load are both vital stimuli for improving
velocity specific neuromuscular performance capabilities and possible neural adaptations.
Conversely, a study conducted by de Oliveira and colleagues (2013) investigated the
effect of high velocity concentric knee extension resistance training over a 6-week
training intervention on the RFD at early (<100 m.s-1) and late (>100 m.s-1) phases of
rising muscle force. The results demonstrated that RFD increased 39-71% at time
intervals up to 90 m.s-1 from the onset of muscle contraction, whereas no change occurred
at later time intervals. Similarly, Anderson and Aagaard (2006) demonstrated that RFD
is influenced by diverse factors at early (<100 m.s-1) and late phases (>100 m.s-1) from
the onset of muscle contraction. It is suggested that the early phase of RFD is largely
influenced by neural drive (Gruber & Gollhofer, 2004) and intrinsic muscle properties
including fiber type and myosin heavy chain composition (MHC) (Anderson, Anderson,
Zebis, & Aargaard, 2010). However, the late phase of RFD is demonstrated to be closely
related to factors that promote improvements in maximal strength. In addition, Tillin and
colleagues (2012) demonstrated that short-term high velocity strength training improved
maximal voluntary force (MVF) (11%) at all measured time points from the onset of
muscle contraction. The improvement in MVF is suggested to be primarily due to
enhanced agonist neural drive, motorneuron recruitment, firing frequency and peripheral
adaptations in increased muscle-tendon unit stiffness (34%) between 50% and 90% MVF.
Furthermore, a study conducted by Hakkinen and colleagues (1985) demonstrated that
high velocity strength training (0-60% 1RM) were accompanied by and correlated with
the increase in fast twitch muscle fiber cross-sectional area and the percentage of fast
twitch fibers of the involved muscle correlated (p< 0.05) with the improvement in
isometric RFD (24%) and the rate of onset in muscle activation (38%). This suggests that
velocity specific adaptations in RFD or rate of onset in muscle activation is influenced by
high velocity specific movements that contribute to the increase in rate of neural
activation. Similarly, Ivy and colleagues (1981) demonstrated that PP and rate of power
production were correlated (0.57 to 0.73) with the percentage of type II fibers and Tricoli
et al., (2001) confirm that participants with a higher type II fiber percentage were able to
produce higher power at specific trained velocities. In regards to skeletal muscle
architectural adaptations, Blazevich and colleagues (2003) demonstrated that participants
who performed only high velocity training exhibited a decrease in vastus lateralis (VL)

41
fascicle angle and an increase in VL fascicle length (p< 0.05 at distal, p< 0.1 at proximal).
The observed morphological changes in decreased fascicle angle and increased fascicle
length may in turn allow more sarcomeres to be arranged in series that may facilitate
greater rapid transmission of force to the tendon that may consequently increase
contractile RFD and contractile impulse (Fukunaga et al., 1997; Gans & Gaunt, 1991;
Kawakami et al., 1993; Kumagai et al., 2000; Storey et al., 2012). With this in mind,
morphological adaptations are likely due to the force and velocity characteristics of a
given exercise rather than the movement pattern performed (Blazevich et al., 2003).
Moreover, these muscular architectural characteristics appear to coincide with the
determinants of maximum velocity of muscular shortening that are suggested to be
consistent with improvements in strength, power and sprint performance (Abe, Kumagai,
& Brechue, 2000).
Therefore, it can be suggested that two possible neuromuscular adaptations to VBT may
include mechanisms of adaptations within the skeletal muscle itself (Duchateaus &
Hainaut, 1984) and adaptations within the nervous system that may affect the muscle
force-velocity curve and preferential recruitment of higher threshold motor units. It
appears that the intention to move a load explosively and the actual movement velocity
as controlled by load are both vital stimuli for improving velocity specific neuromuscular
performance capabilities and possible neural adaptations. Furthermore, placing emphasis
on producing high velocity movements across a range of loading intensities (40-90%
1RM), rather than producing maximal force may provide a more effective training
stimulus in improving neuromuscular strength and power performance when compared
to sustained high-load low velocity contractions.
Collectively, this may have important implications for resistance training prescription as
the instruction of accelerating a load with maximum velocity may be just as important as
prescribing individual training loads that may substantially improve neural drive, intrinsic
muscle activation and fiber type and pennation angle morphology. It appears that velocity
specific resistance training may provide desirable neuromuscular and muscle
morphological adaptations that may enhance athletic performance. However, the
neuromuscular and muscle morphological adaptations to velocity specific resistance
training are currently not well understood with further investigation warranted in this area.

42
2.5.5 Load-velocity relationship
The determination of an individual athlete load-velocity profile for a particular exercise
may be of great interest to strength and conditioning practitioners as this allows individual
tracking of an athlete’s progress over training blocks and velocity specific adaptations
across a spectrum of velocity demands (Jovanovic & Flanagan, 2014). An ongoing
dilemma faced by strength and conditioning practitioners is the issue of how to accurately
quantify, assess and monitor a prescribed training stimulus in order to maximize strength
and power adaptations. A common method used in the field to assess and monitor strength
and power performance is with the use of a traditional one repetition maximum (1RM)
test. However, major shortcomings of the direct assessment of 1RM include a higher
association with injury risk and the process can be time consuming and impractical for
large groups such as team sports (Braith et al., 1993). Additionally, it is observed that an
athlete’s actual 1RM can change quite rapidly after only a few training sessions and often
the obtained value is not the athlete’s true maximum that can be associated with daily
fluctuations in biological status (Gonzalez-Badillo & Sanchez-Medina, 2010). For
example, Jovanovic and colleagues (2014) demonstrated that an ~18% difference exists
above or below a previously tested 1RM which suggests a ~36% difference exists around
a pre-training block 1RM due to daily variability in biological status and readiness to
train. Alternatively, the repetitions to fatigue (RTF) test, performed with a submaximal
weight has been widely investigated to identify the relationship between loading intensity
(%1RM) and repetition failure to establish a repetition maximum continuum. This method
certainly eliminates the need for a traditional 1RM test. However, increasing evidence
demonstrates that repetition failure does not necessarily convey the magnitude of muscle
strength and may be counterproductive by inducing excessive fatigue and mechanical and
metabolic strain (Gonzalez-Badillo & Sanchez-Medina, 2010).
Movement velocity is a variable that could be of great interest in assessing and monitoring
a prescribed training stimulus. The relationship between load and velocity can be
described by a simple linear regression equation that produces a slope and intercept of the
line. The strength of this relationship can be described by simple statistics including the
coefficient of determination (R2) and standard error of the estimate (SEE) (Vincent &
Weir, 2012). A recent study conducted by Gonzalez-Badillo and colleagues (2010)
demonstrated that a close relationship exists between relative load and the movement
velocity that is attained during resistance training (R2 = 0.98) (Gonzalez-Badillo &
Sanchez-Medina, 2010) (refer to Table 1). During this investigation, 120 strength trained
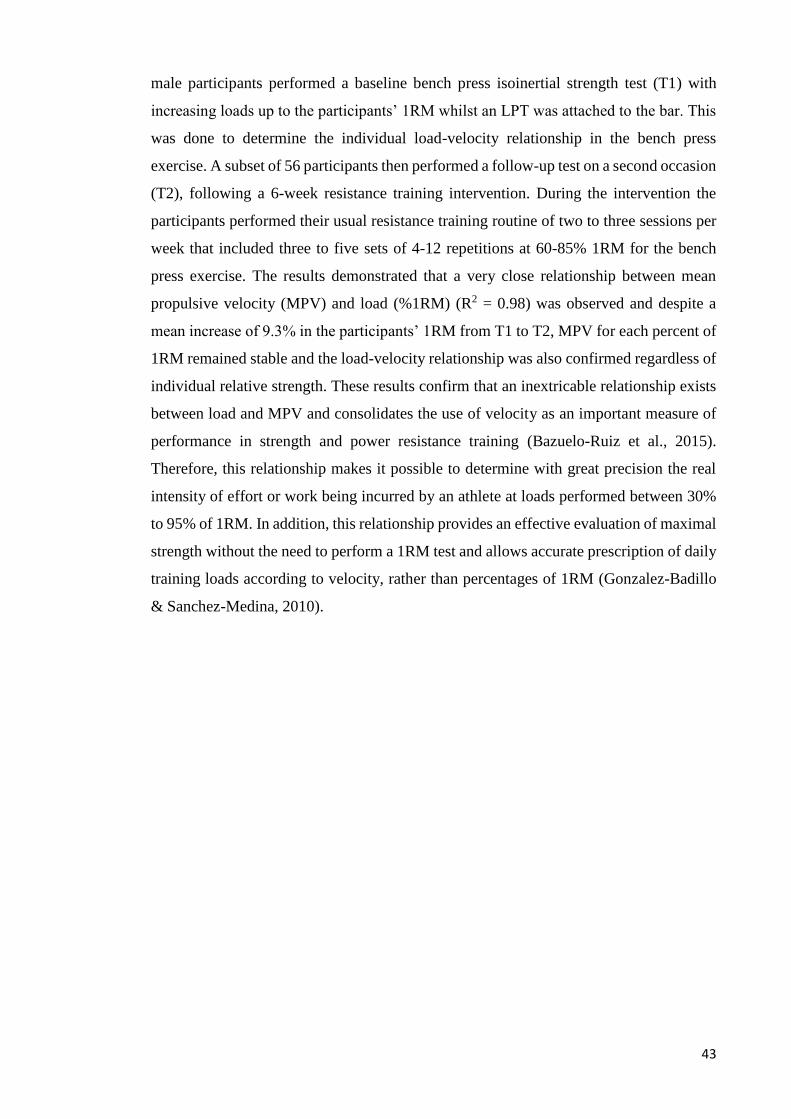
43
male participants performed a baseline bench press isoinertial strength test (T1) with
increasing loads up to the participants’ 1RM whilst an LPT was attached to the bar. This
was done to determine the individual load-velocity relationship in the bench press
exercise. A subset of 56 participants then performed a follow-up test on a second occasion
(T2), following a 6-week resistance training intervention. During the intervention the
participants performed their usual resistance training routine of two to three sessions per
week that included three to five sets of 4-12 repetitions at 60-85% 1RM for the bench
press exercise. The results demonstrated that a very close relationship between mean
propulsive velocity (MPV) and load (%1RM) (R2 = 0.98) was observed and despite a
mean increase of 9.3% in the participants’ 1RM from T1 to T2, MPV for each percent of
1RM remained stable and the load-velocity relationship was also confirmed regardless of
individual relative strength. These results confirm that an inextricable relationship exists
between load and MPV and consolidates the use of velocity as an important measure of
performance in strength and power resistance training (Bazuelo-Ruiz et al., 2015).
Therefore, this relationship makes it possible to determine with great precision the real
intensity of effort or work being incurred by an athlete at loads performed between 30%
to 95% of 1RM. In addition, this relationship provides an effective evaluation of maximal
strength without the need to perform a 1RM test and allows accurate prescription of daily
training loads according to velocity, rather than percentages of 1RM (Gonzalez-Badillo
& Sanchez-Medina, 2010).
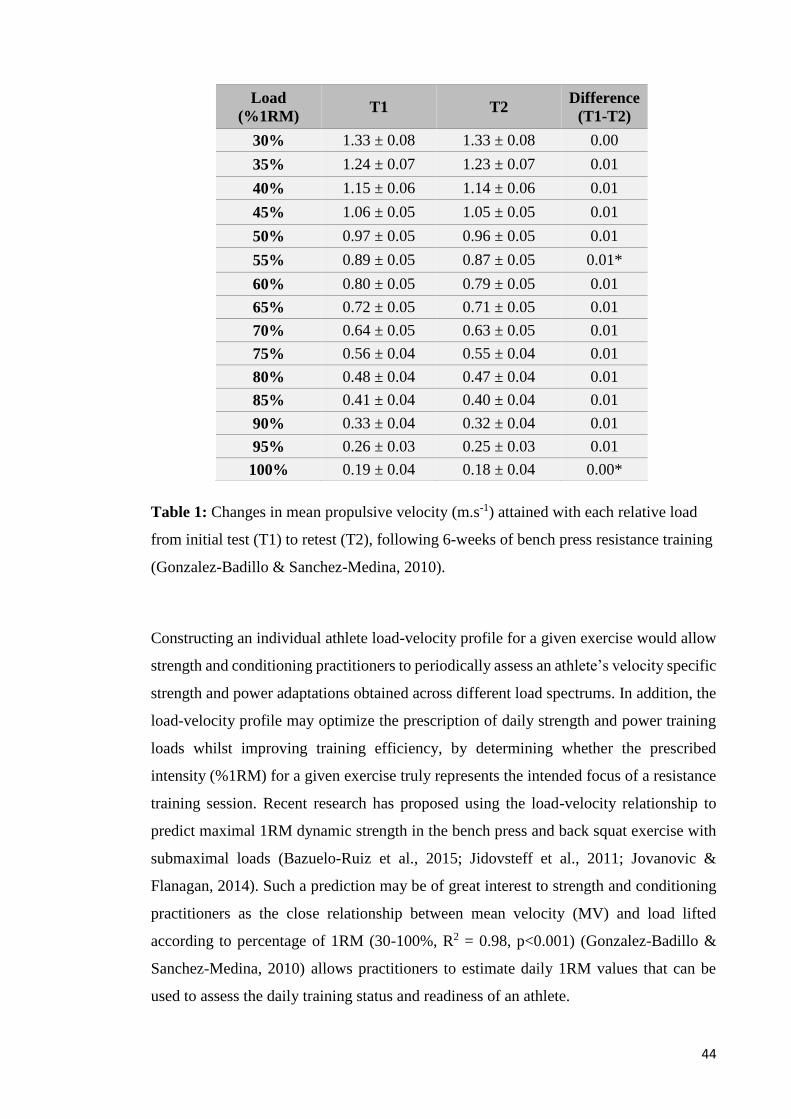
44
Table 1: Changes in mean propulsive velocity (m.s-1) attained with each relative load
from initial test (T1) to retest (T2), following 6-weeks of bench press resistance training
(Gonzalez-Badillo & Sanchez-Medina, 2010).
Constructing an individual athlete load-velocity profile for a given exercise would allow
strength and conditioning practitioners to periodically assess an athlete’s velocity specific
strength and power adaptations obtained across different load spectrums. In addition, the
load-velocity profile may optimize the prescription of daily strength and power training
loads whilst improving training efficiency, by determining whether the prescribed
intensity (%1RM) for a given exercise truly represents the intended focus of a resistance
training session. Recent research has proposed using the load-velocity relationship to
predict maximal 1RM dynamic strength in the bench press and back squat exercise with
submaximal loads (Bazuelo-Ruiz et al., 2015; Jidovsteff et al., 2011; Jovanovic &
Flanagan, 2014). Such a prediction may be of great interest to strength and conditioning
practitioners as the close relationship between mean velocity (MV) and load lifted
according to percentage of 1RM (30-100%, R2 = 0.98, p<0.001) (Gonzalez-Badillo &
Sanchez-Medina, 2010) allows practitioners to estimate daily 1RM values that can be
used to assess the daily training status and readiness of an athlete.
Load
(%1RM) T1 T2
Difference
(T1-T2)
30% 1.33 ± 0.08 1.33 ± 0.08 0.00
35% 1.24 ± 0.07 1.23 ± 0.07 0.01
40% 1.15 ± 0.06 1.14 ± 0.06 0.01
45% 1.06 ± 0.05 1.05 ± 0.05 0.01
50% 0.97 ± 0.05 0.96 ± 0.05 0.01
55% 0.89 ± 0.05 0.87 ± 0.05 0.01*
60% 0.80 ± 0.05 0.79 ± 0.05 0.01
65% 0.72 ± 0.05 0.71 ± 0.05 0.01
70% 0.64 ± 0.05 0.63 ± 0.05 0.01
75% 0.56 ± 0.04 0.55 ± 0.04 0.01
80% 0.48 ± 0.04 0.47 ± 0.04 0.01
85% 0.41 ± 0.04 0.40 ± 0.04 0.01
90% 0.33 ± 0.04 0.32 ± 0.04 0.01
95% 0.26 ± 0.03 0.25 ± 0.03 0.01
100% 0.19 ± 0.04 0.18 ± 0.04 0.00*
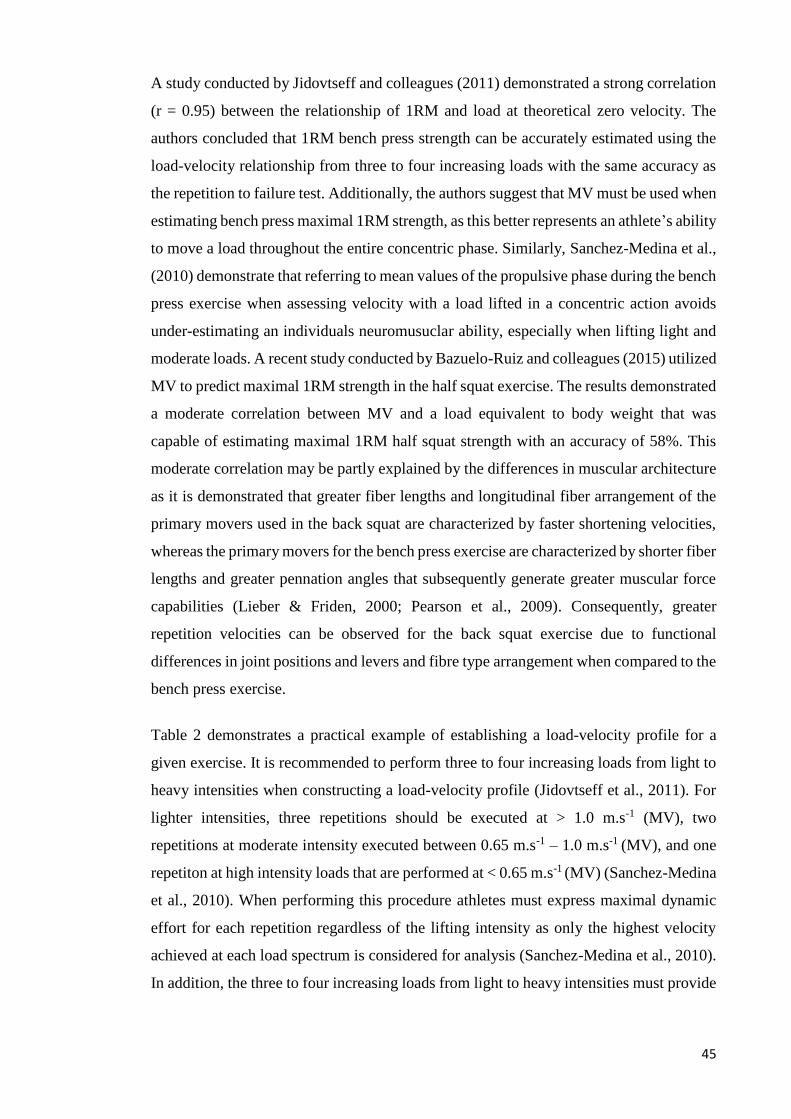
45
A study conducted by Jidovtseff and colleagues (2011) demonstrated a strong correlation
(r = 0.95) between the relationship of 1RM and load at theoretical zero velocity. The
authors concluded that 1RM bench press strength can be accurately estimated using the
load-velocity relationship from three to four increasing loads with the same accuracy as
the repetition to failure test. Additionally, the authors suggest that MV must be used when
estimating bench press maximal 1RM strength, as this better represents an athlete’s ability
to move a load throughout the entire concentric phase. Similarly, Sanchez-Medina et al.,
(2010) demonstrate that referring to mean values of the propulsive phase during the bench
press exercise when assessing velocity with a load lifted in a concentric action avoids
under-estimating an individuals neuromusuclar ability, especially when lifting light and
moderate loads. A recent study conducted by Bazuelo-Ruiz and colleagues (2015) utilized
MV to predict maximal 1RM strength in the half squat exercise. The results demonstrated
a moderate correlation between MV and a load equivalent to body weight that was
capable of estimating maximal 1RM half squat strength with an accuracy of 58%. This
moderate correlation may be partly explained by the differences in muscular architecture
as it is demonstrated that greater fiber lengths and longitudinal fiber arrangement of the
primary movers used in the back squat are characterized by faster shortening velocities,
whereas the primary movers for the bench press exercise are characterized by shorter fiber
lengths and greater pennation angles that subsequently generate greater muscular force
capabilities (Lieber & Friden, 2000; Pearson et al., 2009). Consequently, greater
repetition velocities can be observed for the back squat exercise due to functional
differences in joint positions and levers and fibre type arrangement when compared to the
bench press exercise.
Table 2 demonstrates a practical example of establishing a load-velocity profile for a
given exercise. It is recommended to perform three to four increasing loads from light to
heavy intensities when constructing a load-velocity profile (Jidovtseff et al., 2011). For
lighter intensities, three repetitions should be executed at > 1.0 m.s-1 (MV), two
repetitions at moderate intensity executed between 0.65 m.s-1 – 1.0 m.s-1 (MV), and one
repetiton at high intensity loads that are performed at < 0.65 m.s-1 (MV) (Sanchez-Medina
et al., 2010). When performing this procedure athletes must express maximal dynamic
effort for each repetition regardless of the lifting intensity as only the highest velocity
achieved at each load spectrum is considered for analysis (Sanchez-Medina et al., 2010).
In addition, the three to four increasing loads from light to heavy intensities must provide
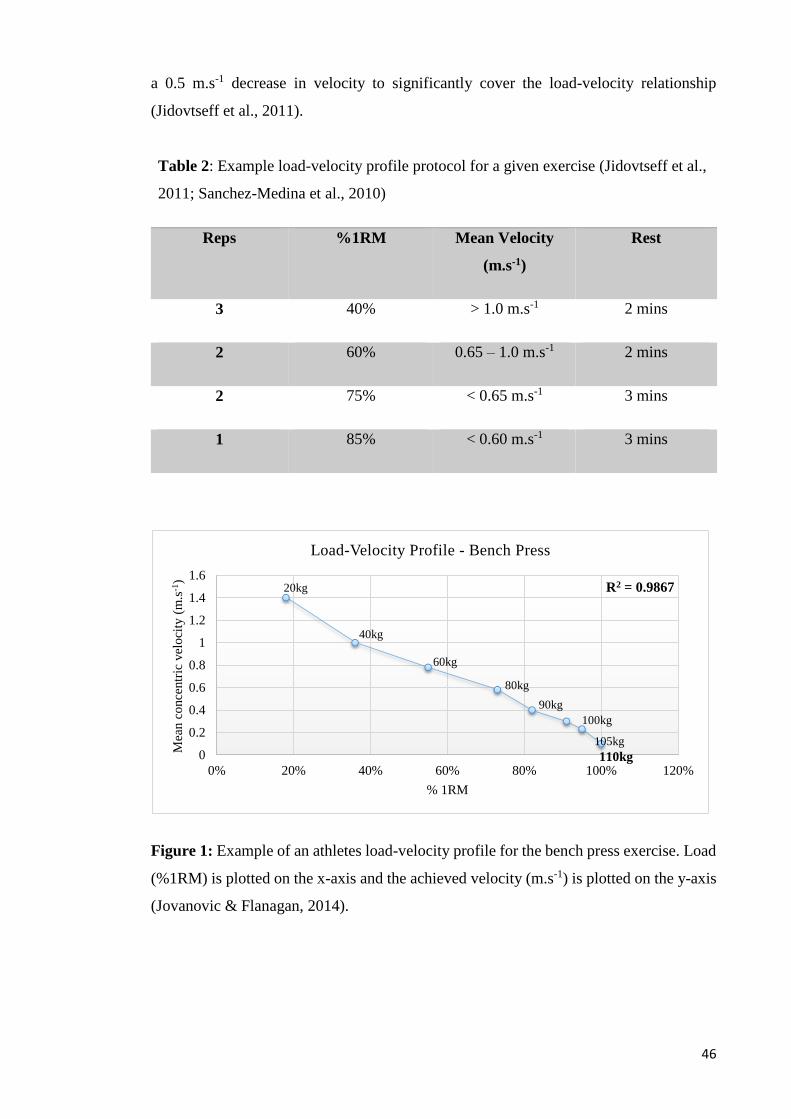
46
a 0.5 m.s-1 decrease in velocity to significantly cover the load-velocity relationship
(Jidovtseff et al., 2011).
Figure 1: Example of an athletes load-velocity profile for the bench press exercise. Load
(%1RM) is plotted on the x-axis and the achieved velocity (m.s-1) is plotted on the y-axis
(Jovanovic & Flanagan, 2014).
Table 2: Example load-velocity profile protocol for a given exercise (Jidovtseff et al.,
2011; Sanchez-Medina et al., 2010)
Reps %1RM Mean Velocity
(m.s-1)
Rest
3 40% > 1.0 m.s-1 2 mins
2 60% 0.65 – 1.0 m.s-1 2 mins
2 75% < 0.65 m.s-1 3 mins
1 85% < 0.60 m.s-1 3 mins
0
0.2
0.4
0.6
0.8
1
1.2
1.4
1.6
0% 20% 40% 60% 80% 100% 120%
Mea
n c
once
ntr
ic v
elo
city
(m
.s-1
)
% 1RM
Load-Velocity Profile - Bench Press
40kg
60kg
80kg
90kg
100kg
105kg
110kg
R2 = 0.986720kg
47
It must be highlighted that a load-velocity profile must be constructed for individual upper
body and lower body exercises. The kinematics and kinetics associated with commonly
prescribed multi-joint resistance exercises such as the bench press, prone bench pull and
back squat provide key differences in the load-velocity and power-load relationships that
may be attributed to the differing muscular architecture and strength curves (Pearson et
al., 2009; Sanchez-Medina et al., 2014). As previously mentioned, the primary movers
used in exercises such as the back squat and prone bench pull exercises are characterized
by faster shortening velocities, whereas the primary movers for the bench press exercise
generate greater muscular force capabilities (Lieber & Friden, 2000; Pearson, et al.,
2009). A study conducted by Sanchez-Medina and colleagues (2014) demonstrated that
the MPV (p<0.001) and absolute Pmax values obtained for mean power output for the
prone bench pull (495 ± 81 W) were always significantly higher when compared to the
bench press exercise (400 ± 80 W) for loads performed between 30% – 100% 1RM with
the differences between exercises becoming larger as the load approached 1RM.
Similarly, Pearson et al., (2009) demonstrated that MV for the concentric phase of the
prone bench pull to be 525% greater than the bench press at 100% 1RM and mean power
being 442% greater at the equivalent load. Additionally, Izquierdo et al., (2006a)
demonstrated that MV decreased at a greater rate during the bench press when compared
to the back squat exercise. For example, the velocity that was attained during repetitions
performed at 75, 70, 65 and 60% 1RM were significantly higher in the back squat when
compared to the bench press exercise. It is likely that the differences in repetition velocity
during the bench press, prone bench pull and back squat may vary between the different
muscle groups due to functional differences in joint position and levers, fiber type
distribution and biomechanical characteristics of the open and closed upper and lower
body kinetic chains (Izquierdo et al., 2006a). Therefore, load-velocity profiles should be
generated for individual exercises to account for the unique kinematic and kinetic
differences between exercises.
The results of the aforementioned studies confirm previous research regarding the
importance of considering the contribution of the propulsive and braking phases
(Sanchez-Medina et al., 2010) when assessing upper body and lower body muscular
strength and power during isoinertial resistance training. An important aspect to take into
account when lifting loads in isoinertial conditions is there exists a considerable portion
of the concentric phase that is allocated to decelerating a moving resistance especially
when lifting light and moderate loads. Sanchez-Medina and colleagues (2010)

48
demonstrated that the lighter the load and higher the movement velocity (<70% 1RM),
the greater the duration of the braking phase. Similarly, Izquierdo and colleagues (2006a)
demonstrated that high velocity repetitions performed at 60-75% 1RM provide extended
deceleration phases that may induce shorter concentric efforts and reduce repetition
intensity. However, it is demonstrated that when loads are sufficiently high (>80% 1RM)
the braking phase disappears and the full concentric phase can be considered entirely
propulsive (Sanchez-Medina et al., 2010). This further highlights the importance of
evaluating the training effect by referring to mean mechanical values of the concentric
propulsive phase of the bench press and back squat exercise, especially when moving
loads <70% 1RM to avoid under-estimating an athletes neuromuscular ability.
The creation of a load-velocity profile for an individual upper body or lower body
exercise may inform future decisions of the efficacy of a prescribed strength and power
training stimulus. This may be of particular interest to strength and conditioning
practitioners who are not solely concerned with developing maximal strength but may
also be interested in velocity specific strength and power adaptations across different load
spectrums. In addition, the load-velocity relationship has been shown to provide accurate
predictions in dynamic 1RM strength and power values with submaximal loads. Such a
prediction can be used as a guide in prescribing daily training loads and identifying the
point on the load spectrum where power (Pmax) is maximized in relation to an athlete’s
daily biological status. Consequently, this may replace the need for a traditional 1RM test
and arbitrarily prescribing strength and power training loads based off an athlete’s pre-
training block 1RM value.
2.5.6 Monitoring fatigue and controlling exercise load with movement velocity
Recent research has demonstrated that by monitoring movement velocity during
isoinertial resistance training conditions it may be possible to limit the amount of
metabolic stress and neuromuscular fatigue accumulated during resistance training
(Sanchez-Medina & Gonzalez-Badillo, 2011). It is demonstrated that for a given muscle
action performed over a set of repetitions the velocity of each repetition slows naturally,
(Mookerjee & Ratamess, 1999; Pasquet et al., 2000) and the continued performance
becomes progressively more difficult as the production of metabolic by products and
fatigue increases. In support of these findings, Sanchez-Medina and colleagues (2011)
demonstrated a near perfect correlation between the decline in MPV over prescribed sets

49
and post-exercise lactate concentrations for the bench press (r = 0.95, p<0.001) and back
squat (r = 0.97, p <0.001) exercises. In addition, post-exercise ammonia concentrations
followed a curvelinear trend in relation to velocity loss where an increase in blood
ammonia levels above baseline values coincided with a ~30-35% of loss in velocity
during the back squat and bench press, respectively. An increase in blood ammonia levels
has been demonstrated to be indicative of accelerated purine nucleotide degradation that
is associated with a slow and energy consuming process that can significantly reduce
performance for up to 48-72 hours post-exercise, thereby necessitating longer recovery
times (Hellsten-Westing, Norman, Balsom, & Sjodin, 1993).
In order to control the accumulation of metabolic by products and extent of
neuromuscular fatigue it can be suggested to prescribe loading strategies using velocity
zones and velocity stops. A velocity zone can be defined as specific velocity zone that an
athlete must perform a resistance training movement within in order to develop a specific
skeletal muscle performance trait (i.e. 0.20 – 0.25 m.s-1 for absolute strength).
Conversely, a velocity stop can be defined as a prescribed movement velocity for each
repetition and a minimum velocity threshold (MVT) is set, in which the individual is not
allowed to drop below, as a means to minimize neuromuscular fatigue (Jovanovic &
Flanagan, 2014). This novel method can be used to control the total volume load lifted in
a resistance training session by ensuring athletes remain within a target velocity zone or
by not dropping below a MVT as opposed to arbitrarily prescribing loads based off pre-
training block relative or absolute 1RM values (Jovanovic & Flanagan, 2014). It can be
observed from Figure 2 that the daily estimated 1RM values that are based off the
associated warm-up sets tend to be different from the pre-training block 1RM values.
Therefore, applying velocity zones or velocity stops during training sets may provide a
simple but effective means to control the extent of neuromuscular fatigue and allow
athletes to maintain maximal velocities by taking into account the daily variability in
maximum strength.

50
Figure 2: Estimation of 1RM from warm-up sets for the squat exercise during a training
block. The dotted line represents pre-training block 1RM values with the blue line
representing daily variation in maximum strength in relation to daily biological status
(Jovanovic & Flanagan, 2014).
A study conducted by Padulo and colleagues (2012) investigated the effect of minimizing
velocity loss during sets at fixed pushing speeds (FPS) and self-selected pushing speeds
(SPS) to determine its influence of muscular strength improvements after a 3-week
training intervention with the bench press exericse. The FPS group performed the bench
press exercise at 85% 1RM within a starting velocity range of 0.36 – 0.45 m.s-1 with each
set terminated when velocity decreased below a threshold of 20%. Conversely, the SPS
group performed the bench press at 85% 1RM until volitional fatigue. The results
demostrated that after three and five days post intervention, the FPS group significantly
improved muscular strength by 10.20% and maximal speed by 2.22% whilst, the SPS
group improved muscular strength by 0.17% and maximal speed by 0.11%. Additionally,
the FPS group completed less repetitions and as a result, the total volume load was
significantly less (-62%) when compared to the SPS group. The authors concluded that
moving a load with maximal effort and minimizing velocity loss within sets may
positively enhance neuromuscular strength adaptations.
Therefore, a decrease in repetition velocity both within sets and between sets may provide
evidence of impaired neuromuscular function that may be controlled with setting velocity
110.0
120.0
130.0
140.0
150.0
160.0
170.0
180.0
190.0
200.0
10/0
4/2
013
11/0
4/2
013
12/0
4/2
013
13/0
4/2
013
14/0
4/2
013
15/0
4/2
013
16/0
4/2
013
17/0
4/2
013
18/0
4/2
013
19/0
4/2
013
20/0
4/2
013
21/0
4/2
013
22/0
4/2
013
23/0
4/2
013
24/0
4/2
013
25/0
4/2
013
26/0
4/2
013
27/0
4/2
013
28/0
4/2
013
29/0
4/2
013
30/0
4/2
013
1/0
5/2
01
3
2/0
5/2
01
3
3/0
5/2
01
3
4/0
5/2
01
3
5/0
5/2
01
3
1 R
M (
kg)
Date
Estimated 1RM 1RM
51
thresholds to limit the accumulation of metaboilc stress and neuromuscular fatigue. In
addition, utilizing velocity zones or velocity stops may provide a novel approach in
autoregulating and individualizing training volume and load that may be sensitive to
changes in daily maximum strength and may optimize the training response. However, it
is important to note that the velocity zones and velocity stops may differ between
commonly prescribed multi-joint resistance exercises such as the bench press and back
squat due to key differences in the load-velocity and power-load relationships that may
be attributed to the differing muscular architecture and strength curves (Pearson et al.,
2009; Sanchez-Medina et al., 2014). At present, the effect of utilizing velocity to monitor
fatigue and control exercise volume load are currently not well understood and further
research is warranted in this area.
2.5.7 Sport specific strength and power adaptations to velocity based resistance
training
The majority of isoinertial resistance training studies have compared VBT to either half
maximal velocity or high intensity strength training and its transference to sports
performance. Isoinertial VBT studies have reported significant improvements in
performance measures following training interventions that comprised of two to four
supervised resistance training sessions per week across 4 – 10 week periods (Delecluse
et al., 1995; Gonzalez-Badillo et al., 2014; Pareja-Blanco et al., 2014). A study conducted
by Delecluse and colleagues (1995) investigated the effects of high intensity and high
velocity training on different phases of 100-meter sprint performance. The results of the
study demonstrated that high velocity training resulted in improved initial acceleration,
maximum speed and significant improvements in total 100-meter sprint times.
Conversely, high intensity training only resulted in improved acceleration during the
initial phase of the 100-meter sprint (Delecluse et al., 1995). With regards to strength
adaptation, Pareja-Blanco and colleagues (2014) demonstrated that maximal velocity vs.
half maximal velocity training during a full squat in resistance trained men seemed to be
of greater importance than time under tension (TUT) for inducing strength improvements.
In addition, maximal velocity training improved maximum strength (Effect size: 0.94 vs.
0.54) and velocity development (ES: 1.76 vs. 0.75) to a greater extent across both light
and heavy loads. Similarly, Gonzalez-Badillo and colleagues (2014) demonstrated that
maximal concentric velocity efforts during the bench press exercise resulted in
significantly greater gains in 1RM strength (18.2 vs. 9.7%), velocity developed against

52
light (11.5 vs. 4.5%) and heavy (36.2 vs. 17.3%) loads when compared to half maximal
concentric velocity efforts. In addition to significantly improving in all strength
performance variables, the maximal concentric velocity group spent less total time under
tension when compared to the half maximal concentric group (223 vs. 361 seconds) which
supports the findings of Pareja-Blanco and colleagues (2014). However, the previous
investigations of Pareja-Blanco et al., (2014) and Gonzalez-Badillo et al., (2014) provide
limitations in that participants were instructed to perform a maximal intended lift during
the warm up set and the velocity of this lift was then used to predict a percent of 1RM
from the load-velocity relationship (e.g. 0.79 m.s-1 = ~60% of 1RM). Each participant was
then instructed to maintain a target velocity zone prescribed for each repetition with the
predicted training load during each subsequent training week (e.g. week 1 = 0.90 m.s-1).
However, both studies failed to specify whether the training sessions performed were
either strength or power training phases.
Velocity specificity in resistance training to improve sport specific strength and power
adaptations are currently not well understood. There is evidence that suggests that sport
specific movement patterns and high velocity training are associated with improvements
in strength and power performance. However, there lacks evidence to support the use of
high velocity resistance training to improve strength and power performance when
compared to traditional heavy resistance training. Based on the available evidence it is
difficult to recommend a movement velocity that will maximize sport specific strength
and power performance and further research is warranted.
2.6 MONITORING TRAINING VOLUME AND LOAD
2.6.1 Autoregulatory and traditional prescribed training programmes
Periodization of a strength and power training stimulus is widely acknowledged as crucial
to optimizing the training response. Central to the theory of periodization is the principle
of progressive overload, which refers to the muscular and nervous system adapting to
meet the needs of lifting an increasing load (Mann et al., 2010). This can be achieved by
manipulating a number of resistance training variables that include; repetition speed,
varying rest periods between sets and, altering training volume by changing the number
of sets, reps and exercises performed throughout training blocks (Fleck & Kraemer,
2004). However, it is important to understand how the manipulation of these resistance
training variables affects improvements not only in muscular strength and power

53
performance but also the influence this has on internal load. Internal load can be defined
as the physiological (i.e. heart rate and blood lactate) and psychological (i.e. RPE and
mood monitoring) stress imposed on an athlete that is measured independently of external
load (i.e. power output, speed and acceleration) (Halson, 2014). An on-going dilemma
faced by strength and conditioning practitioners is how to accurately quantify and monitor
resistance training volume and load throughout different training phases as there is no
universally agreed upon best method. Thus, most traditional percentage based resistance
training methods quantify a resistance training stimulus by calculating the sets x reps x
load which equates to the total volume load lifted in a training session (Kraemer &
Ratamess, 2004). In addition, a number of calculations have been utilized to determine
daily, weekly, or monthly workload that include;
1) The volume index (VI) which determines workloads relative to body mass;
VI = volume load (kg) ÷ Body mass (kg)
2) Training intensity (TI) determines the overall intensity of the training programme;
TI = volume load (kg) ÷ repetitions and,
3) Training efficiency (TE) determines the change score from baseline measures in a
specified exercise (i.e. bench press baseline score to 12 weeks) from the amount of
absolute workload performed (i.e. volume load)
TE = change score ÷ volume load (kg) (Haff, 2010; Painter et al., 2012;
Harries et al., 2015).
These methods are used extensively by strength and conditioning practitioners due to its
simplicity and the absence of expensive computer software and performance technology
(Randell et al., 2010). However, when resistance training is periodized according to
developing a specific skeletal muscle performance trait (i.e. speed-strength or strength-
speed), monitoring becomes much more difficult as it is important to establish if the
prescribed training stimulus is truly enhancing the intended development of a specific
skeletal muscle performance trait. As previously mentioned, resistance training provides
a complex model for monitoring training volume and load where factors such as repetition
speed, sets, reps and rest periods continually change throughout strength and power
training phases. Therefore, traditional percentage based quantification of training volume
and load may be inadequate because of the prevailing importance of intensity and velocity
of movement during strength and power resistance training (McGuigan & Foster, 2004a).

54
A less common and understudied form of monitoring training volume and load is
autoregulation of resistance training (Mann et al., 2010). Autoregulation is a form of
training that adjusts to the individual athlete’s readiness to train on a day-to-day or week-
to-week basis (Mann et al., 2010). This type of monitoring is based off allowing athlete’s
to increase strength and power at their own rate as individual athletes may respond
differently to a given training stimulus and the training load required for adaptation may
differ significantly from one athlete to another (Halson, 2014; Mann et al., 2010). Thus,
the use of autoregulatory training may maximize strength and power adaptations over
different training blocks by allowing athletes to progress at their own rate.
The rating of perceived exertion (RPE), autoregulatory progressive resistance exercise
(APRE) and VBT have recently been investigated to quantify and monitor training
volume and load. Several investigations have demonstrated the RPE to be a valid and
reliable method (r = 0.88-0.95) of quantifying and monitoring training volume and load
across different loading intensities (Day et al., 2004; McGuigan et al., 2004b; Singh et
al., 2007). In addition, it is suggested that the use of a Borg CR-10 RPE scale can be
utilized to prescribe weekly resistance training intensity (i.e. RPE 2 = easy, 5 = somewhat
hard, 7 = hard, 10 = maximal) (Day et al., 2004) as opposed to percentages of 1RM. This
is suggested to allow strength and conditioning practitioners to be confident that the
athlete is working within the intended intensity range which is necessary for continued
increases in strength and power performance (Fleck & Kraemer, 2004). However,
prescribing resistance training intensity based off RPE values rather than percentages of
1RM has not previously been investigated. Conversely, Mann and colleagues (2010)
investigated the effect of performing 6-weeks of APRE and traditional linear
periodization on strength improvements in college athletes. This investigation
demonstrated that APRE was more effective in improving bench press and back squat
strength and upper body endurance when compared to traditional linear periodization.
These findings provide evidence that RPE and APRE is effective in monitoring and
regulating training volume and load. However, major shortcomings of these methods
include requiring strength and conditioning practitioners to wait until a set has been
performed or when a resistance training session has been completed before making
adjustments in training volume and load. Alternatively, VBT allows adjustments to be
made in training volume and load before the first set is performed. For example, due to
the close relationship that exists between relative load and the movement velocity (R2 =
0.98) (Gonzalez-Badillo & Sanchez-Medina, 2010), it is suggested that performing three
55
to four warm-up sets with increasing loads (i.e. 40-85% 1RM) enables an estimation of a
daily 1RM value. From this estimated value, adjustments can be made to training volume
and load according to an athlete’s daily variation in maximum strength and readiness to
train (Jidovtseff et al., 2011; Jovanovic & Flanagan, 2014). Therefore, VBT may provide
a superior approach in monitoring training volume and load when compared to other
autoregulatory resistance training methods. In addition, the increasing availability of a
variety of velocity monitoring technology such as linear position transducers (LPT) (i.e.
Gymaware), accelerometer-based technology (i.e. Push Band) and free apps (i.e.
Barsense) make VBT a easy and novel method of quantifying and monitoring resistance
training volume and load in a practical setting for the strength and conditioning
practitioner (Cronin et al., 2003; Gonzalez-Badillo & Sanchez-Medina, 2010; Jovanovic
& Flanagan, 2014; Mann et al., 2015).
2.6.2 Session RPE and psychological wellness questionnaire monitoring
The session RPE and psychological wellness questionnaire monitoring have been
proposed as non-invasive and inexpensive means of monitoring training load (Halson,
2014; McGuigan & Foster, 2004a). It is suggested that session RPE provides an accurate
monitoring tool for the calculation of training load by simply obtaining the athlete’s
global intensity of a resistance training session and then multiplying by the duration or
number of repetitions performed in a resistance training session (i.e. RPE = 7 x 60 mins
= 420) to provide a session load (McGuigan & Foster, 2004a). This then provides the
strength and conditioning practitioner with information regarding daily and weekly
training loads where further simple calculations of training monotony and strain can also
be made from session RPE values (Table 3). Training monotony can be defined as a
measure of day-to-day training variability that has been shown to be related to the onset
of overtraining when monotonous training is combined with high training loads (Foster,
1998). In addition, training strain can be defined as the overall training stress encountered
during a training week that is calculated from training load and monotony scores (Foster,
1998). These monitoring strategies can be easily calculated with the formulas provided
below;
Training monotony = mean daily training load ÷ standard deviation of the daily
training load
Training strain = weekly training load x monotony

56
A study conducted by Day and colleagues (2004) investigated the reliability of the session
RPE scale to quantify resistance exercise intensity during low (50% 1RM), moderate
(70% 1RM), and heavy (90% 1RM) intensity training. The results demonstrated that
session RPE values were reported to be higher for heavy intensity resistance training (6.9
± 1.4) when compared to moderate (5.2 ± 1.5) and low (3.3 ± 1.4) intensity resistance
training. This indicates that performing less repetitions at high intensities were perceived
to be more difficult than performing more repetitions and lower intensities. This is in
agreement with Sweet and colleagues (2004) who demonstrated session RPE values
decreased from 6.3 ± 1.4 to 5.7 ± 1.7 and 3.8 ± 1.6 that coincided with the decrease in
percentage of 1RM from 90% to 70% and 50% respectively. In addition, McGuigan et
Table 3. Schematic weekly calculation of training load, monotony and strain
(McGuigan & Foster, 2004a)
Day Training
Activity
Session
RPE
Duration (mins or
repetitions)
Load
Monday
Conditioning
Resistance
training
6
6
120
64
720
384
Tuesday Team training 5 120 600
Wednesday Match 7 180 1,260
Thursday Team training
Conditioning
3
3
60
40
180
120
Friday
Team training
Resistance
training
5
7
120
72
600
504
Saturday Conditioning 6 120 720
Sunday Team training 2 25 50
Weekly Load (AU) 5,138
Monotony (x SD) 1.43
Strain (load x monotony) 3,200

57
al., (2004b) investigated the reliability of session RPE to determine physical effort during
low intensity (30% 1RM) and high intensity (75% 1RM) resistance training. The results
demonstrated a significant difference between session RPE values for the low (1.9) and
high (7.1) resistance training intensities. It was concluded that session RPE provides a
valid and reliable method (r = 0.88-0.95) of quantifying and monitoring training load
across different loading intensities during resistance training. Therefore, session RPE
appears to be a valid and reliable method for quantifying and monitoring resistance
training load (Day et al., 2004; McGuigan & Foster, 2004b).
Changes in mood and affective psychological states have been described as consistent,
sensitive and, early markers of overreaching and overtraining in competitive athletes
(Meeusen et al., 2006; Urhausen & Kindermann, 2002). In particular, mood has been
demonstrated to show a consistent dose-response relationship to training load (Bouget,
Rouveix, Michaux, Pequignot, & Filaire, 2006). Psychological wellness questionnaires
typically measure recovery with perceptions of wellbeing (i.e. fatigue), perceived stress,
current mood, and behavioural symptoms (i.e. insomnia) that are influenced by both
training and non-training stressors (Kellman, 2010; Main & Grove, 2009; Rushall, 1990;
Shearer et al., 2015). A number of psychological wellness questionnaires are used in elite
sporting environments to monitor training load that include the profile of mood states
(POMS) (Morgan, Brown, Raglin, O'Connor, & Ellickson, 1987), the recovery-stress
questionnaire (REST-Q-Sport) (Laux, Krumm, Diers, & Flor, 2015), daily analysis of life
demands for athletes (DALDA) (Rushall, 1990), the total recovery scale (TQR) (Kentta
& Hassmen, 1998) and, the brief assessment of mood (BAM) (Shearer et al., 2015). This
form of monitoring provides practitioners with a great degree of certainty when
prescribing and adjusting training loads with the intention of optimizing adaptation and
performance (Coutts & Cormack, 2014; Halson, 2014; Taylor et al., 2012). In addition,
recent research has suggested that psychological wellness questionnaire monitoring may
be more sensitive and reliable than traditional physiological and biochemical monitoring
measures (i.e. creatine kinase activity) (Buchheit et al., 2013; Halson, 2014; Meeusen et
al., 2013; O'Connor et al., 1989; Urhausen & Kindermann, 2002). A recent survey
conducted in high performance sports in Australia and New Zealand identified that 91%
of elite/professional sporting programmes use a form of psychological wellness
questionnaire monitoring (Taylor, Chapman, Cronin, Newton, & Gill, 2012).
A study conducted by Morgan and colleagues (1987) investigated administrating the
POMS questionnaire in 16 male swimmers at the beginning, middle and end of a training

58
season. The results demonstrated that the POMS questionnaire revealed significant
changes in mood were due to a significant increase in fatigue (p < 0.01) and a significant
decrease in vigor (p < 0.01). In other words, the POMS questionnaire indicates to have a
dose-response relationship with periods of high training loads and periods where
reductions in training load occur. In addition, McNair et al., (1992) demonstrated that the
POMS questionnaire exhibits a test-retest reliability for measures of mood (0.56-0.74),
psychological states (0.16-0.33) and traits (0.80-0.90) that can be detected following
periods of increased training as brief as three days (O'Connor, Morgan, Raglin, Barksdale,
& Kalin, 1989). Furthermore, Kellman and Kallus (2001) developed the REST-Q-Sport
questionnaire that identifies the extent to which athletes are physically or mentally
stressed and their capabilities towards recovery. The REST-Q-Sport questionnaire has
been demonstrated to provide a valid and reliable (p < 0.01) (Davis, Orzeck, & Keelan,
2007) method to measure psychological and recovery states in athletes and has been
reported to have a dose-response relationship with training load, creatine kinase activity,
stress-recovery states, and the prediction of injuries (Kellman & Gunther, 2000; Kellman
et al., 2001; Laux et al., 2015). However, major shortcomings of the aforementioned
psychological wellness questionnaires is that they typically consist of 25-65 questions
that take at least 10 minutes to complete. From a practical perspective, it is suggested that
psychological wellness questionnaires take less than one minute to complete to ensure
long term adherence and reduce bias of reporting unfavourable coping strategies (Saw et
al., 2015; Shearer et al., 2015). Thus, the majority of elite/professional sporting
programmes use custom-designed questionnaires that typically place emphasis on rating
muscle soreness, fatigue, mood and sleep quality and consist of 4-12 questions that are
measured on a 1-5 or 1-10 Likert point scale (Shearer et al., 2015). One such questionnaire
that may be of interest to sports scientists and strength and conditioning practitioners in
professional environments is the psychological wellness questionnaire implemented by
McLean and colleagues (2010) that investigated the neuromuscular, endocrine, and
perceptual fatigue responses during different length between-match microcycles in
professional rugby league players. The custom-made psychological wellness
questionnaire was based on the recommendations of Hooper et al., (1995) that consisted
of five questions and assessed fatigue, sleep quality, general muscle soreness, stress
levels, and mood on a five point Likert scale (1 = “poor recovery”, 5 = “fully recovered”).
The results demonstrated that the overall psychological wellness measure was sensitive
to detect changes in fatigue and muscle soreness one to five days post a competition
match. In addition, perceptions of fatigue and general muscle soreness provided important

59
information regarding adaptation to training and the extent of muscle damage sustained
during training and competition. Therefore, this custom-made questionnaire provides an
inexpensive and non-invasive monitoring tool that can be considered a useful indicator to
detect changes in psychological and physiological states in professional athletes.
However, due to the short form of this questionnaire, other simple assessments of
neuromuscular recovery such as the countermovement jump (CMJ) and hand grip test
should be utilized alongside the questionnaire to provide a greater understanding of the
responses to training volume and load to optimize performance in professional athletes.
2.6.3 Salivary cortisol
The measurement of salivary cortisol has been proposed as a non-invasive and time
efficient means of monitoring the stress response to resistance training. Salivary cortisol
collection provides benefits of the possibility of collecting multiple samples in a relatively
time efficient manner, especially where serum collection is undesirable or difficult to
obtain such as in professional sporting environments (Lewis, 2006; Vining, McGinley, &
Symons, 1983). In addition, saliva measures the free bioavailable hormone levels in the
body when compared to serum measures that only measure the protein bound non-
bioavailable hormone levels (Aardal-Eriksson, Karlberg, & Holm, 1998). Furthermore,
strong correlations (r = 0.97) have been reported between salivary and serum levels of
cortisol (Vining et al., 1983). Therefore, salivary cortisol may actually provide a better
measure than serum cortisol of the stress response to resistance training as it more
accurately measures the unbound biological active cortisol hormone when compared to
serum measures (McGuigan et al., 2004b; Vining et al., 1983).
The endocrine system is suggested to play an important role in strength and power
adaptations by mediating the remodelling of skeletal muscle. Specifically, alterations in
concentrations of the anabolic hormone testosterone and catabolic hormone cortisol may
mediate acute and chronic changes in protein metabolism, muscle growth and force
potential (Crewther et al., 2005). In addition, there is a consensus that hormonal responses
to resistance training protocols are dependant on the amount of muscle mass activated,
exercise order, training load, sets and reps and length of rest interval between sets
(Kraemer et al., 1990). However, movement velocity is a parameter that may also affect
the hormonal response to resistance training and thus, the resulting neuromuscular
adaptation (Smilios et al., 2014). It has been demonstrated that an increase in movement
60
velocity is associated with a higher heart rate, blood lactate concentrations, energy
expenditure and augmented disruption of muscle ultra-structure (Hunter et al., 2003;
Mazzetti et al., 2007). Furthermore, the execution of a movement with maximum velocity
may augment the RFD and muscular electrical activity that may in turn induce a higher
hormonal response through peripheral and neural mechanisms (Smilios et al., 2014).
A study conducted by Smilios and colleagues (2014) investigated the effect of maximum
(Vmax) and submaximum (70%Vmax) movement velocities during hypertrophy type
resistance exercise protocols on testosterone, human growth hormone, and cortisol
responses in resistance trained men. The results demonstrated that performing resistance
exercise with maximum movement velocities (Vmax) increases testosterone and human
growth hormone to a similar extent when compared to performing resistance exercise
with submaximum movement velocities (70%Vmax). In contrast, no significant difference
was observed in cortisol responses to the maximum and submaximum movement lifting
velocity conditions. Similarly, Goto et al., (2008) and Headley et al., (2011) demonstrated
reduced or unchanged cortisol responses to submaximum movement velocities during
hypertrophy type resistance exercise. However, the aforementioned studies provide
numerous limitations that inlcude; 1) they employed fixed TPT movement velocities (e.g.
2 seconds for the eccentric and concentric phases) and, 2) failed to equate total volume
load between maximum and submaximum movement velocity groups that may have
influenced the differing hormonal responses.
Based on the available evidence, salivary cortisol provides a non-invasive and reliable
measure of the stress response to resistance training. In addition, the influence that
movement velocity has on elicitng salivary cortisol stress during strength and power
training are yet to be determined and further investigation is warranted in this area.
2.7 Conclusions
Collectively, it is evident that the concept of velocity specific resistance training is an
important consideration when designing and implementing resistance training
programmes. It is demonstrated that a close relationship exists between relative load and
the movement velocity that is attained during resistance training (R2 = 0.98) (Gonzalez-
Badillo & Sanchez-Medina, 2010). This relationship makes it possible to determine with
great precision the real intensity of effort or work being incurred by an athlete at loads
performed between 30% to 95% of 1RM. In addition, previous research has demonstrated

61
the intention to move a load explosively and the actual movement velocity achieved as
controlled by load are both vital stimuli for improving velocity specific neuromuscular
performance capabilities and possible neural adaptations (Behm & Sale, 1993; McBride
et al., 2002). Consequently, the velocity at which loads are lifted may determine the
resulting training effect and its transference to sports performance (Gonzalez-Badillo et
al., 2014). It is suggested the velocity specific adaptations to resistance training are
mediated by a combination of muscular morphological, molecular and neural factors that
may influence adaptation at the skeletal muscle (Kraemer & Ratamess., 2005). In
addition, velocity specific adaptations to resistance training may include several factors
including; enhanced coordination and specificity of movement, increased discharge of
high threshold motor units, enhanced intramuscular and intermuscular coordination and
increased stress placed on fast twitch muscle fibers (Cronin et al., 2002; Enoka, 1997;
Tricoli et al., 2001). Therefore, it can be suggested that two possible neuromuscular
adaptations to VBT include mechanisms of adaptations within the skeletal muscle itself
(Duchateaus & Hainaut, 1984) and adaptations within the nervous system that may affect
the muscle force-velocity curve and preferential recruitment of higher threshold motor
units. However, the velocity specific neuromuscular adaptations to resistance training are
currently not well understood and further research is warranted.
2.7.1 Practical applications of velocity based resistance training in strength and
conditioning practices
When designing resistance training programmes, strength and conditioning practitioners
should consider movement velocity as an important variable to optimize neuromuscular
strength and power adaptations. LPT devices should be frequently used in sporting
environments as a monitoring strategy that will allow for the prescription of individual
and daily exercise specific loads from the load-velocity relationship which will lead to
improved strength and power programming. With this in mind, a load-velocity profile
should be created for specific upper body and lower body strength and whole body power
exercises for individual athletes. Constructing an individual athlete load-velocity profile
for a given exercise allows strength and conditioning practitioners to periodically assess
an athlete’s velocity-specific strength and power adaptations across different loading
spectrums that may inform future decisions of the efficacy of a prescribed strength and
power training stimulus. In addition, by utilizing velocity zones or velocity stops this may
provide a novel approach in prescribing daily training loads that are sensitive to daily
62
fluctuations in biological status and readiness to train. This is achieved by ensuring
athletes remain within a target velocity zone or do not drop below a MVT that allows for
autoregulating and individualizing daily training volume and load. Consequently,
applying velocity zones or velocity stops both within sets and between sets will control
the excessive accumulation of metabolic-by-products and neuromuscular fatigue that will
allow athletes to maintain maximal lifting velocities throughout strength and power
training phases by taking into account athletes daily variability in maximum strength and
readiness to train.
2.7.2 Future research
Currently, a paucity of literature exists in performing resistance training within specific
VBT zones and its subsequent effect on neuromuscular strength and power adaptations.
Longitudinal research investigating performing resistance training within specific VBT
zones has yet to be undertaken. Therefore, future research should investigate the influence
of performing resistance training within specific VBT zones and its effect on improving
subsequent neuromuscular strength and power adaptations across different loading
spectrums. During such interventions, the changes in neuromuscular strength and power
performance should be habitually tracked throughout strength and power training phases
to determine the velocity specific neuromuscular adaptations to VBT. Additionally, as it
is suggested strength and power performance is enhanced at or near the optimal training
velocity, determining the specific VBT zones that enhance neuromuscular strength and
power adaptations is warranted.

63
CHAPTER THREE: THE VELOCITY PROFILING OF SEMI-
PROFESSIONAL RUGBY UNION AND PROFESSIONAL RUGBY
LEAGUE PLAYERS
64
3.1 Preface
Given the spectrum of strength and power demands encountered during rugby union and
rugby league competition (i.e. tackling, pushing, lifting, jumping and scrummaging) it
would be advantageous to determine which resistance training stimulus enhances skeletal
muscle performance traits such as starting strength, speed-strength, strength-speed,
accelerative strength, and absolute strength/power to a greater extent. From the review of
literature it was evident that; 1) there is very limited research that has addressed the effects
of optimizing VBT in improving neuromuscular strength and power adaptations and, 2)
no study to date has investigated the optimal velocity training zones for the development
of specific skeletal muscle performance traits in semi-professional rugby union and
professional rugby league players. Therefore, the purpose of this chapter was to document
the velocity profiles and identify specific velocity training zones across different load
spectrums (%1RM) in the bench press, back squat and power clean exercises in semi-
professional rugby union and professional rugby league players. The results of this
investigation are used in the subsequent training intervention that is intended to maximize
neuromuscular strength and power performance in professional rugby league players
(Chapter four).
65
3.2 Introduction
It is common place that resistance training programmes utlilize traditional percentage
based training (TPT) methods to improve measures of maximal strength and power
performance in professional athletes (Mann et al., 2015). However, an ongoing dilemma
faced by strength and conditioning practitioners is the issue of how to accurately quantify,
assess and monitor a prescribed training stimulus in order to maximize strength and power
adaptations. Several acute resistance training variables (i.e. exercise type, order, sets and
repetitions, percentage of one repetition maximum and rest duration) have traditionally
been associated with configuring and prescribing a strength and power training stimulus
(Kraemer & Ratamess, 2004). In addition, exercise intensity is generally acknowledged
as the most important stimulus related to enhancing strength and power adaptations and
is commonly identified with relative loading intensities of an athlete’s percentage of one
repetition maximum (1RM) for a given exercise (Kraemer & Ratamess, 2004).
Manipulation of the aforementioned resistance training variables are suggested to shape
the magnitude and type of physiological responses and ultimately the neuromuscular
adaptations to strength and power training. This traditional TPT method often requires
the direct assessment of an athlete’s 1RM for a given exercise. However, major
shortcomings of the direct assessment of 1RM includes a higher association with injury
risk and this process can be time consuming and impractical for large groups such as team
sports (Braith et al., 1993). In addition, it is observed that an athlete’s actual 1RM can
change quite rapidly after only a few training sessions and often the obtained value is not
the athlete’s true maximum that can be associated with daily fluctuations in biological
status (Gonzalez-Badillo & Sanchez-Medina, 2010). For example, Jovanovic and
colleagues (2014) demonstrated that an ~18% difference exists above or below a
previously tested 1RM which suggests an ~36% difference exists around a pre-training
block 1RM due to daily variability in biological status and readiness to train. Therefore,
arbitrarily prescribing training loads (kg) based off a pre-training block 1RM and a pre-
selected intensity (e.g. 80% 1RM) may not necessarily reflect the intended focus of a
resistance training session as this will negatively accumulate higher fatigue (e.g. 80% +
18% = 98% 1RM) or under prepare an athlete (e.g. 80% - 18% = 62%) due to fluctuations
in daily variability.
Thus, the aforementioned limitations suggest trying to find a better way of configuring
and prescribing a resistance training stimulus to optimize the intended focus of resistance

66
training session. Movement velocity is a variable that could be of great interest when
designing resistance training programmes to optimize neuromuscular strength and power
adaptations. It is suggested that how the load that is actually lifted or moved may be more
significant in developing functional neuromuscular strength and power adaptations
(Harris et al., 2007). However, the velocity component of a given exercise is often an
overlooked and under-utilized performance measure. Previous research has demonstrated
that the greatest muscular strength and power improvements occur when specific
resistance training is performed at or near the optimal training velocity (Behm & Sale,
1993) and as velocity deviates from the trained velocity, the less effective training will be
(Caiozzo et al., 1981). Additionally, it is demonstrated that a inextricable relationship
exists between relative load and the movement velocity that is attained during resistance
training with loads between 30% to 95% 1RM (R2 = 0.98) (Gonzalez-Badillo & Sanchez-
Medina, 2010). This relationship makes it possible to determine with great precision the
real intensity of effort or work being incurred by an athlete as the mean velocity attained
with each % of 1RM (30-95% 1RM) is a very stable indicator of the actual percentage of
1RM that each load (kg) represents (Gonzalez-Badillo & Sanchez-Medina, 2010).
Furthermore, it is demonstrated that each percent of 1RM loading intensity has its own
unique velocity training zone and although an athlete’s 1RM value may increase after a
period of strength training, the velocity that is obtained at each percentage of 1RM
remains stable (Gonzalez-Badillo & Sanchez-Medina, 2010).
Given the spectrum of strength and power demands encountered during rugby union and
rugby league competition (i.e. tackling, pushing, lifting, jumping and scrummaging) it
would be advantageous to determine whether skeletal muscle performance traits such as
starting strength, speed-strength, strength-speed, accelerative strength, and absolute
strength/power that effect different portions of the force-velocity curve may be optimized
within specific velocity training zones. The aforementioned skeletal muscle performance
traits can be defined as;
1) Starting strength – The ability to overcome inertia rapidly and is developed using
light loads that are moved at exceedingly high movement velocities (Bondarchuk,
2014, Mann et al., 2015)
2) Speed-strength – The ability to move light loads at high movement velocities with
a specific focus on improving explosive strength (Siff, 2000)
3) Strength-speed – The ability to rapidly move moderately heavy loads at moderate
movement velocities (Roman, 1986)
67
4) Accelerative strength – The ability to rapidly move a heavy load at low-moderate
movement velocities (Mann et al., 2015)
5) Absolute strength – The ability to exert maximal force at low movement velocities
that is approaching the athletes 1RM (Mann et al., 2015)
Previous research in rugby union and rugby league players have investigated enhancing
acute strength and power performance with complex training methods (i.e. strength
training coupled with heavy and light ballistic exercises) (Argus et al., 2012; Baker &
Newton., 2005; Bevan et al., 2009; McMaster et al., 2014). In addition, previous authors
have attempted to determine optimal training loads across a variety of loading spectrums
to enhance power output with ballistic (i.e. bench press throw and squat jumps) (Baker et
al., 2001a; Baker et al., 2001b; Bevan et al., 2010; Turner et al., 2015) and weightlifting
type exercises (i.e. power clean) (De Villiers & Venter., 2015; Kilduff et al., 2007).
However, the effectiveness of complex training methods and determining optimal loads
to enhance power output for athletic performance in elite team sport athletes remain
debateable, as these studies provide limitations that include prescribing training loads
based off traditional percentage based methods that do not take into account an athlete’s
daily biological status and readiness to train. Thus, movement velocity may provide an
alternative approach in prescribing strength and power training by utilizing velocity zones
or velocity stops (Jovanovic & Flanagan, 2014). This novel approach may allow for
accurate training loads to be prescribed for a pre-selected training intensity that may be
sensitive to daily variability in maximum strength and readiness to train as opposed to
prescribing training loads based off pre-training block 1RM values.
An interesting study conducted in youth soccer players demonstrated that using
movement velocity as a reference to prescribe resistance training with relative loads
between 45-70% 1RM significantly enhanced full squat strength (p < 0.01) and CMJ
performance (p < 0.05) when compared to performing TPT maximum repetitions (Lopez-
Segovia, Palao Andres, & Gonzalez-Badillo, 2010). However, no conclusive evidence
has been reported from previous investigations that support performing resistance training
within specific velocity zones and to the best of our knowledge, no studies have yet
specifically examined this issue in semi-professional rugby union and professional rugby
league players.
Therefore, the purpose of the present investigation was to document the velocity profiles
and to identify specific velocity training zones across different load spectrums (%1RM)

68
in the bench press, back squat and power clean exercises that may maximize
neuromuscular strength and power performance in semi-professional rugby union and
professional rugby league players.
3.3 Methods
3.3.1 Experimental approach to the problem
This empirical research study was designed to provide comprehensive descriptive
information about the strength and power velocity profiles of semi-professional rugby
union and professional rugby league players. In order to determine the velocity profiles
of each participant across loading spectrums of 20-95% 1RM for the bench press, back
squat and power clean exercises, participants were required to perform a prescribed
number of sets and reps at each designated training intensity whilst a linear position
transducer (LPT) was attached to the barbell. The bench press and back squat exercises
were chosen for the purpose of assessing upper and lower body maximal strength,
respectively, whilst the power clean was chosen as a measure of whole body power
production (De Villiers & Venter, 2015; Hoffman et al., 2004; Seitz et al., 2014). These
exercises are widely used in athletic training environments and all the participants in the
present study were familiar with generating maximum effort and executing the exercises
with efficient technique. The LPT device provided instantaneous feedback via its
software platform for measures of force, power and velocity.
3.3.2 Participants
Forty-one semi-professional rugby union participants from two New Zealand premiership
rugby union teams and eleven professional rugby league participants from a National
Rugby League (NRL) competition team volunteered to take part in this study (Table 4).
The following inclusion criteria was imposed for each participant for the purpose of this
study; 1) a competitive male rugby league or a competitive rugby union athlete aged 18-
30 years, 2) have no current acute or chronic injuries or medical conditions, 3) have been
involved in a structured resistance training programme for ≥ 2 years, 4) possess
appropriate joint mobility to perform the bench press, back squat and power clean
movements with appropriate technique and, 5) are not using any performance enhancing
or banned substances (World Anti-Doping Agency 2015). All testing procedures and risks

69
were clearly and fully explained and written consent for each participant was obtained
prior to the commencement of the study. The research study was approved by the AUT
University Ethics Committee (AUTEC), Auckland, New Zealand.
3.3.3 Testing Procedures
Prior to the commencement of each testing session, all participants were required to
complete a standardised warm up procedure as prescribed by their respective playing
organization (Table 5). Additionally, a warm up set of the relevant exercise was
performed with the barbell only prior to the commencement of the testing session. During
the testing sessions, participants performed a prescribed number of sets and reps at each
designated training load spectrum of 20, 30, 45, 60, 75, 80, 85, 90 and 95% 1RM for the
bench press, back squat and power clean exercise (Table 6). A wire from a linear position
transducer (LPT) (Gymaware PowerTool, Kinetic Performance PTY Ltd., ACT,
Australia) was attached to the inside of the Olympic barbell with a Velcro strap during
the exercises. The concentric maximum peak and mean velocities (m.s-1) achieved were
calculated and recorded instantaneously using the LPT software platform which has been
reported to provide valid and reliable measures of strength and power movements (CV <
3%, r = 0.59 – 1.00, p < 0.05 – 0.001) (Drinkwater et al, 2007; Crewther et al., 2011b).
The training load for each set spectrum was determined from the participants’ previous
Table 4. Anthropometric characteristics of the rugby union and rugby league
participants (mean ± SD)
Age (years) Weight (kg) Height (cm)
Rugby Union
(n=41)
Forwards
(n=29) 20.7 ± 2.1 107.3 ± 9.8 187.6 ± 7.4
Backs (n=12) 20.3 ± 2.0 84.8 ± 7.9 181.1 ± 3.9
Rugby
League
(n=11)
Forwards
(n=7) 22.9 ± 2.1 103.3 ± 7.8 183.4 ± 4.8
Backs (n=4) 23.0 ± 2.2 88.8 ± 8.3 178.0 ± 6.5

70
1RM obtained for each lift within a four-week period due to in-season competition
constraints placed on the participants from coaching staff.
3.3.3.1 Bench press
The bench press exercise was performed on an adjustable power rack (Life Fitness,
Hammer Strength, Auckland, New Zealand) with a loaded 20kg Olympic barbell placed
horizontally at the chosen height of the participant. The bench press was performed with
the participants lying with their back flat on a bench with arms fully extended and hands
gripping the bar approximately shoulder width apart whilst the knees were bent at a 90-
degree angle and feet fixed to the ground. The depth of the bench press was set to touch
the chest without bouncing the bar. Additionally, participants were instructed to perform
the bench press without the bar leaving the hands (i.e. not throwing it) and their back had
to remain flat on the bench at all times. Each participant was instructed to descend the
barbell during the eccentric phase (2 seconds) in a controlled motion. However,
participants were instructed to execute the concentric phase with maximal dynamic effort.
Three minutes rest was provided between sets.
3.3.3.2 Back squat
The back squat exercise was performed with participants starting in the upright position
with knees and hips fully extended, feet placed approximately shoulder width apart and
the Olympic barbell positioned approximately across the acromion joint. The depth for
the back squat was set at a knee angle of 90-degrees (visually determined) before
returning to the upright position. Each participant was instructed to descend the barbell
during the eccentric phase (2 seconds) in a controlled motion. However, participants were
instructed to execute the concentric phase with maximal dynamic effort. Additionally,
participants were instructed to perform the back squat with feet fixed to the ground at all
times. Three minutes rest was provided between sets.
3.3.3.3 Power clean
The power clean exercise was performed on a weightlifting platform (Life Fitness,
Hammer Strength, Auckland, New Zealand) that consisted of a 20kg Olympic barbell that
was loaded with bumper plates. All repetitions were performed from the ground with the
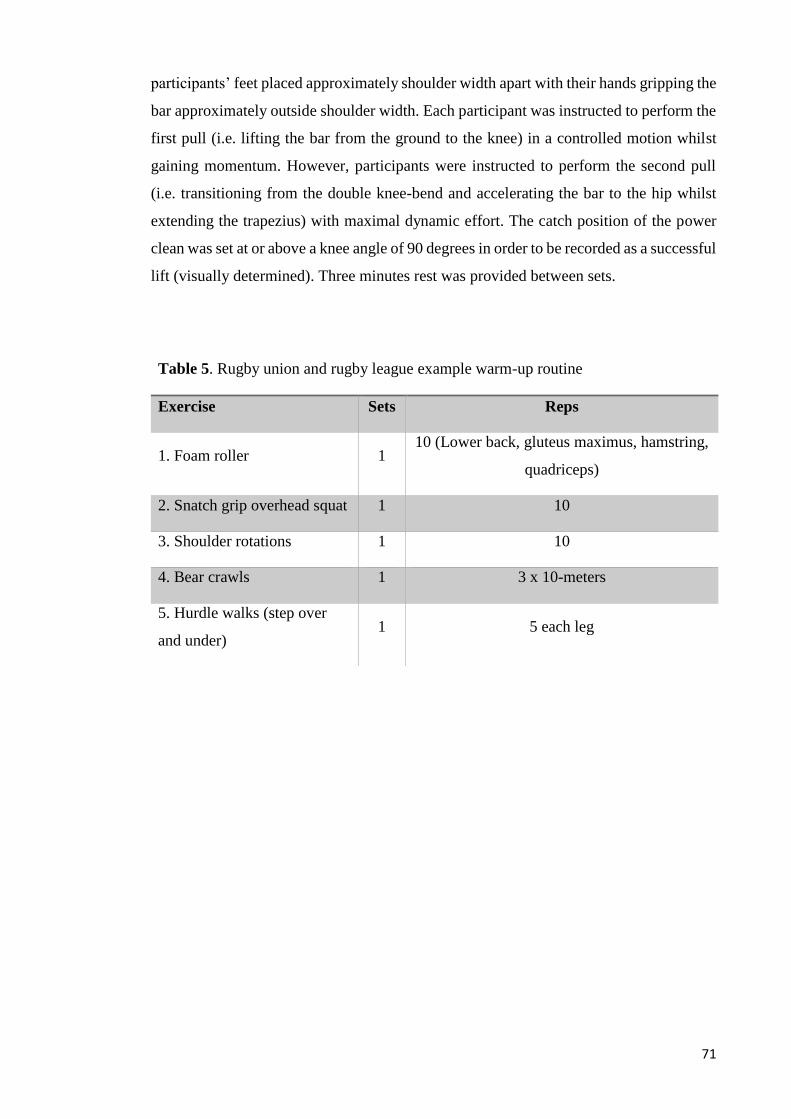
71
participants’ feet placed approximately shoulder width apart with their hands gripping the
bar approximately outside shoulder width. Each participant was instructed to perform the
first pull (i.e. lifting the bar from the ground to the knee) in a controlled motion whilst
gaining momentum. However, participants were instructed to perform the second pull
(i.e. transitioning from the double knee-bend and accelerating the bar to the hip whilst
extending the trapezius) with maximal dynamic effort. The catch position of the power
clean was set at or above a knee angle of 90 degrees in order to be recorded as a successful
lift (visually determined). Three minutes rest was provided between sets.
Table 5. Rugby union and rugby league example warm-up routine
Exercise Sets Reps
1. Foam roller 1 10 (Lower back, gluteus maximus, hamstring,
quadriceps)
2. Snatch grip overhead squat 1 10
3. Shoulder rotations 1 10
4. Bear crawls 1 3 x 10-meters
5. Hurdle walks (step over
and under) 1 5 each leg

72
3.3.4 Statistical Analysis
Standard statistical methods of mean ± standard deviations (SD) were used to report the
velocity profiling data. Initial checks of normality were conducted using the Shapiro-
Wilks test to determine differences between groups. Independent sample t-tests were
computed by means of t-test or its nonparametric equivalent utilizing the Mann-Whitney
U Test. A significance level of p < 0.05 was selected to indicate statistical significance
between groups.
Table 6. Velocity profiling sets and reps protocol
%1RM Sets Reps Rest Bench Press
and Back
Squat Tempo
Power
Clean
Tempo
20% 1 3 3 mins 2:0:X X:X:X
30% 1 3 3 mins 2:0:X X:X:X
45% 1 3 3 mins 2:0:X X:X:X
60% 1 3 3 mins 2:0:X X:X:X
75% 1 2 3 mins 2:0:X X:X:X
80% 1 2 3 mins 2:0:X X:X:X
85% 1 1 3 mins 2:0:X X:X:X
90% 1 1 3 mins 2:0:X X:X:X
95% 1 1 3 mins 2:0:X X:X:X
Tempo durations; 2 = 2 seconds down for the eccentric phase of the lift, 0 = no
pause at the bottom of the lift and, X = maximal dynamic movement
73
3.4 Results
3.4.1 Rugby union velocity profiling
3.4.1.1 Bench Press
Significant differences were found between forwards and backs for peak velocity (m.s-1)
at 75% 1RM (17.8%). In addition, significant differences were found between forwards
and backs for mean velocity (m.s-1) at loading intensities of 85% 1RM (21.6%), and at
95% 1RM (36.4%) (p < 0.05) (refer to appendix Table 1). However, no significant
differences between forwards and backs were found for peak velocity (m.s-1) at 20, 30,
45, 60, 80, 85, 90 and 95% 1RM and mean velocity (m.s-1) at 20, 30, 45, 60, 80 and 90%
1RM loading intensities (p > 0.05). Results for forwards and backs bench press mean
velocity (m.s-1) analysis across loading intensities of 20-95% 1RM are illustrated in
Figure 3.
3.4.1.2 Back squat
Significant differences were found between forwards and backs for peak velocity (m.s-1)
at 30% 1RM (18.7%) and 45% 1RM (23.9%). In addition, significant differences were
found between forwards and backs for mean velocity (m.s-1) at 45% 1RM (21.4%) (p <
0.05) (refer to appendix Table 2). However, no significant differences between forwards
and backs were found for peak velocity (m.s-1) at 20, 60, 75, 80, 85, 90 and 95% 1RM
and mean velocity (m.s-1) at 20, 30, 60, 75, 80, 85, 90 and 95% 1RM loading intensities
(p > 0.05). Results for forwards and backs back squat mean velocity (m.s-1) analysis
across loading intensities of 20-95% 1RM are illustrated in Figure 4.
3.4.1.3 Power clean
No significant differences exist between forwards and backs across loading intensities of
20-95% 1RM for peak and mean velocities (m.s-1) (p > 0.05) (refer to appendix Table 3).
Results for forwards and backs power clean peak velocity (m.s-1) analysis across loading
intensities of 20-95% 1RM are illustrated in Figure 5.

74
3.4.2 Rugby league velocity profiling
3.4.2.1 Bench press
No significant differences exist between forwards and backs across loading intensities of
20-95% 1RM for peak and mean velocities (m.s-1) (p > 0.05) (refer to appendix Table 4).
Results for forwards and backs bench press mean velocity (m.s-1) analysis across loading
intensities of 20-95% 1RM are illustrated in Figure 6.
3.4.2.2 Back squat
A significant difference between forwards and backs only existed for mean velocity (m.s-
1) at 75% 1RM loading intensity (17.9%) (p < 0.05) (refer to appendix Table 5). Results
for forwards and backs back squat mean velocity (m.s-1) analysis across loading
intensities of 20-95% 1RM are illustrated in Figure 7.
3.4.2.3 Power clean
Significant differences between forwards and backs were found for peak velocity (m.s-1)
at 20% 1RM (14.4%) and 75% (8.2%) 1RM loading intensities (p < 0.05) (refer to
appendix Table 6). Results for forwards and backs power clean peak velocity (m.s-1)
analysis across loading intensities of 20-95% 1RM are illustrated in Figure 8.

75
*
**
0.00
0.20
0.40
0.60
0.80
1.00
1.20
1.40
1.60
20% 30% 45% 60% 75% 80% 85% 90% 95%
Mea
n V
elo
city
(m
.s-1
)
%1RMRugby Union Forwards Rugby Union Backs
Figure 3. Rugby union forwards and backs mean velocity spectrum for the bench press
exercise across loading intensities of 20-95% 1RM. The mean velocity achieved for each
loading intensity is plotted from each positional groups mean with 95% confidence intervals.
* = significant difference
*
0.00
0.20
0.40
0.60
0.80
1.00
1.20
20% 30% 45% 60% 75% 80% 85% 90% 95%
Mea
n V
elo
city
(m
.s-1
)
%1RMRugby Union Forwards Rugby Union Backs
0.00
0.50
1.00
1.50
2.00
2.50
3.00
3.50
4.00
20% 30% 45% 60% 75% 80% 85% 90% 95%
Pea
k V
elo
city
(m
.s-1
)
%1RMRugby Union Forwards Rugby Union Backs
Figure 4. Rugby union forwards and backs mean velocity spectrum for the back squat
exercise across loading intensities of 20-95% 1RM. The mean velocity achieved for each
loading intensity is plotted from each positional groups mean with 95% confidence intervals.
* = significant difference
Figure 5. Rugby union forwards and backs peak velocity spectrum for the power clean exercise
across loading intensities of 20-95% 1RM. The peak velocity achieved for each loading intensity
is plotted from each positional groups mean with 95% confidence intervals. * = significant
difference
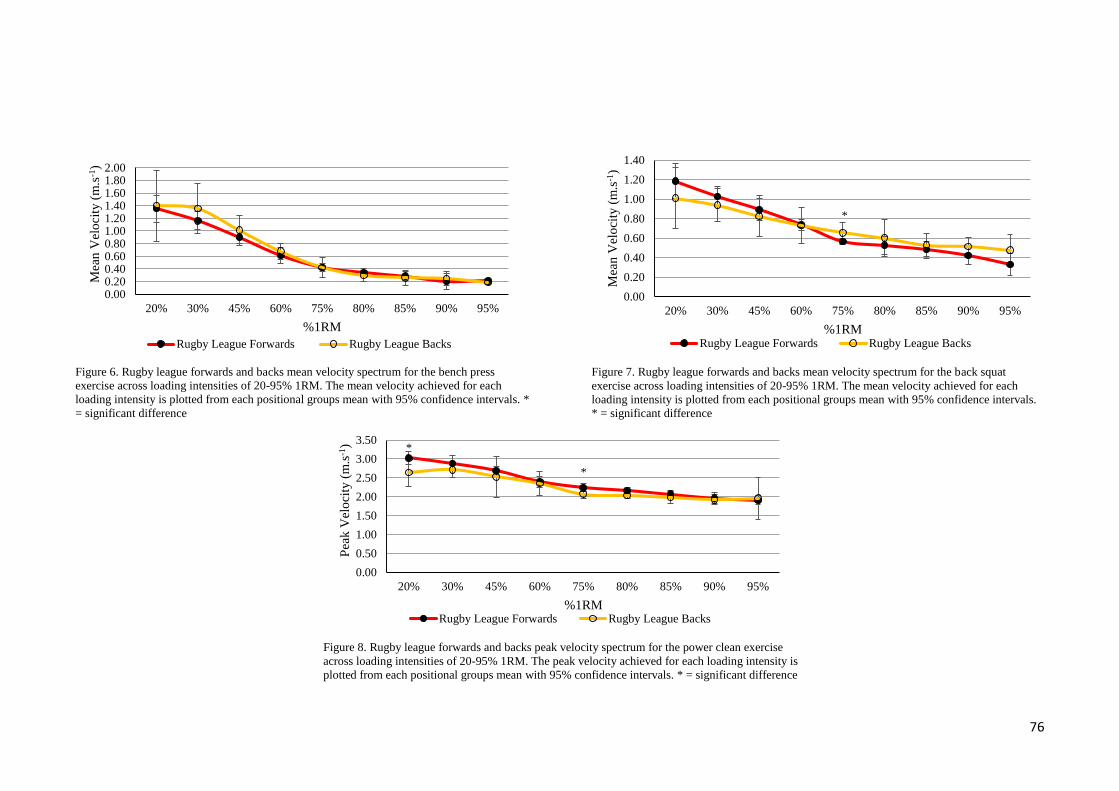
76
0.000.200.400.600.801.001.201.401.601.802.00
20% 30% 45% 60% 75% 80% 85% 90% 95%
Mea
n V
elo
city
(m
.s-1
)
%1RM
Rugby League Forwards Rugby League Backs
*
0.00
0.20
0.40
0.60
0.80
1.00
1.20
1.40
20% 30% 45% 60% 75% 80% 85% 90% 95%
Mea
n V
elo
city
(m
.s-1
)
%1RMRugby League Forwards Rugby League Backs
Figure 6. Rugby league forwards and backs mean velocity spectrum for the bench press
exercise across loading intensities of 20-95% 1RM. The mean velocity achieved for each
loading intensity is plotted from each positional groups mean with 95% confidence intervals. *
= significant difference
Figure 7. Rugby league forwards and backs mean velocity spectrum for the back squat
exercise across loading intensities of 20-95% 1RM. The mean velocity achieved for each
loading intensity is plotted from each positional groups mean with 95% confidence intervals.
* = significant difference
*
*
0.00
0.50
1.00
1.50
2.00
2.50
3.00
3.50
20% 30% 45% 60% 75% 80% 85% 90% 95%
Pea
k V
elo
city
(m
.s-1
)
%1RMRugby League Forwards Rugby League Backs
Figure 8. Rugby league forwards and backs peak velocity spectrum for the power clean exercise
across loading intensities of 20-95% 1RM. The peak velocity achieved for each loading intensity is
plotted from each positional groups mean with 95% confidence intervals. * = significant difference

77
3.5 Discussion
The purpose of this study was to develop a better understanding of the strength and power
velocity profiles for the bench press, back squat, and power clean exercises across loading
intensities of 20-95% 1RM in semi-professional rugby union and professional rugby
league players. It was hypothesized that the strength and power velocity profiles for the
bench press, back squat and power clean exercises would provide a large range of
velocities at lighter loads when compared to heavier loads due to the propulsive and
braking phases that occur at light and heavy loading intensities (%1RM). Additionally, it
was hypothesized that multi-joint compound movements (i.e. power clean and back
squat) that require greater activation and synchronization of agonist and antagonist
muscle groups would result in a larger spread of velocity profiles when compared to the
bench press exercise.
To the best of our knowledge, this is the first study that has analysed the velocity profiles
of semi-professional rugby union and professional rugby league players across loading
intensities of 20-95% 1RM in the bench press, back squat and power clean exercises. The
main finding of this study was that unique VBT zones exist for loads lifted between 20-
95% 1RM for the bench press, back squat and power clean exercises in semi-professional
rugby union and professional rugby league players whereby subtle differences exist
between each code with further investigation warranted.
On closer examination, it was identified that potential differences exist between positional
groups within each code across loading intensities of 20-95% 1RM for each exercise that
requires further investigation. In addition, it can be speculated that the observed unique
VBT zones can be further broken down to focus specifically on enhancing specific
skeletal muscle performance traits within a periodized strength and power resistance
training programme that include starting strength, speed-strength, strength-speed,
accelerative strength and absolute strength/power (Table 7 and 8). Thus, the present study
adds to previous research by corroborating that each percent of 1RM (30-95% 1RM)
loading intensity has its own unique VBT zone (Gonzalez-Badillo & Sanchez-Medina,
2010) and provides evidence for considering movement velocity in strength and power
training programmes.
Specifically, the results of this study demonstrated that; 1) during the bench press
exercise, rugby union backs produced higher peak and mean velocities at moderate to
high intensity ranges (75-95% 1RM) when compared to rugby union forwards.

78
Conversely, rugby union forwards produced higher peak and mean velocities for the back
squat exercise at low to moderate intensity ranges (20-60% 1RM) when compared to
rugby union backs whilst no differences were observed for the power clean exercise, 2)
rugby league backs produced higher peak and mean velocities for the bench press exercise
at low intensity ranges (30-45% 1RM) when compared to rugby league forwards and, 3)
rugby league forwards produced higher peak and mean velocities for the back squat at
low intensity ranges (20-45% 1RM) when compared to rugby league backs who produced
higher peak and mean velocities at mid to high intensity ranges (75-95% 1RM) whilst no
differences were observed for the power clean exercise.
The observed differences in lifting velocities within each code may be partly explained
by the different demands placed on rugby union forwards and backs and rugby league
forwards and backs during competition. It is well established that the demands placed on
rugby union and rugby league players vary according to specific positions played. High
levels of muscular strength and power and the capacity to generate high levels of muscular
force rapidly are considered to be critical attributes for performing the tackling, lifting,
pushing and pulling tasks during match play (Gabbett, 2005b; Meir et al., 2001). Forwards
typically have superior maximum upper and lower body absolute strength levels when
compared to backs due to differences in body mass and the higher frequency of tackling,
mauling and rucking activities (Crewther et al., 2009). In addition, previous investigations
have demonstrated that rugby union players have superior upper (873 – 1,300 W vs. 340
– 610 W) and lower (4,750 – 5,755 W vs. 1,850 – 1,990 W) body muscular power outputs
when compared to rugby league players with similar trends observed in maximal strength
capabilities (Argus et al., 2009; Baker, 2001a; Baker, 2002; Baker et al., 2008; Bevan et
al., 2010; Comfort et al., 2011; Crewther et al., 2009). These differences are likely due to
rugby union players predominantly training and competing with relatively lower body
orientations during tackles, rucks, scrums, and mauls. In addition, there is less space
between attackers and defenders during match play whereby acceleration becomes vital
(Cross et al., 2015). In comparison, rugby league players predominantly train and
compete in more of an upright position with higher contact orientations in the resultant
vertical-horizontal plane due to the main focus being on securing the ball and keeping an
opposition player upright for as long as possible (Cross et al., 2015). However, rugby
league players tend to be more homogenous in anthropometrical characteristics and
muscular strength and power capabilities when compared to rugby union players due to

79
the different demands, playing styles and tactics encountered between each respective
code (Twist & Worsfold, 2015).
A unique finding of this investigation was that for a given exercise modality (i.e. upper
body strength: bench press, lower body strength: back squat and whole body power:
power clean) the pattern of decline in the MV and PV achieved across the same loading
intensities of 20-95% 1RM decreased at a greater rate in the power clean than the bench
press and back squat. Furthermore, with regards to velocity declines between upper and
lower body strength movements, the MV and PV decreased at a greater rate in the bench
press when compard to the back squat exercise. The observed decline in MV between the
upper and lower body strength and whole body power movements may be attributed to
the differing muscular constraints (i.e. as determined by skeletal muscle architecture) and
strength curves that exist for each given exercise. For example, it is likely that the
differences in repetition velocity during the bench press, back squat and power clean may
vary between the different muscle groups due to functional differences in joint position
and levers, fiber type distribution and biomechanical characteristics of the open and
closed upper and lower body kinetic chains (Izquierdo et al., 2006a). Previous research
has demonstrated that greater fiber lengths and longitudinal fiber arrangement of the
primary movers used in the back squat and power clean exercises are characterized by
faster shortening velocities, whereas the primary movers for the bench press exercise are
characterized by shorter fiber lengths and greater pennation angles that subsequently
generate greater muscular force capabilities (Lieber & Friden, 2000; Pearson et al., 2009).
Furthermore, research has also highlighted the importance of considering the contribution
of the propulsive and braking phases (Sanchez-Medina et al., 2010) when assessing upper
body and lower body muscular strength and power during isoinertial resistance training.
During this study, participants were instructed to perform the concentric phase of the
bench press and back squat movement with maximum dynamic effort whilst participants
were instructed to perform the power clean with maximal dynamic effort throughout the
entire lift. However, participants were also instructed to perform the bench press without
the bar leaving the hands and back remaining flat on the bench at all times. Additionally,
participants were instructed to perform the back squat without jumping and keeping their
feet fixed to the ground at all times. Consequently, this may have influenced the current
results as it is demonstrated that when lifting loads in isoinertial conditions there exists a
considerable portion of the concentric phase that is allocated to decelerating a moving
resistance especially when lifting light and moderate loads. Sanchez-Medina and
80
colleagues (2010) demonstrated that the lighter the load and the higher the movement
velocity (<70% 1RM), the greater the duration of the braking phase. Similiarly, Izquierdo
and colleagues (2006a) demonstrated that high velocity repetitions performed at 60-75%
1RM provide extended deceleration phases that may induce shorter concentric efforts and
reduce repetition intensity. However, it is demonstrated that when loads are sufficiently
high (>80% 1RM) the braking phase disappears and the full concentric phase can be
considered entirely propulsive (Sanchez-Medina et al., 2010). Therefore, when
comparing results between studies it is important to consider adhering to similar methods
employed in the current study.
As previously shown, the greatest muscular strength and power improvements occur
when specific resistance training is performed at or near the optimal training velocity
(Behm & Sale, 1993). Additionally, as velocity deviates from the optimal training
velocity, the less effective training will be (Caiozzo et al., 1981). Thus, a critical
component of VBT is that training at optimal velocities rather than at a % of 1RM will
allow an athlete to perform resistance training with specific loads that will maximize
training specificity. In addition, the inextricable relationship that exists between relative
load and the movement velocity (R2 = 0.98) makes it possible to enhance the quality of
effort of work performed by an athlete for loads executed between 30% to 95% 1RM
(Gonzalez-Badillo & Sanchez-Medina, 2010). Furthermore, if movement velocity is
routinely measured for every repetition of a given exercise it is possible to determine
whether the prescribed training load (kg) for a pre-selected training intensity (%1RM)
truly represents the intended focus a resistance training session (Gonzalez-Badillo &
Sanchez-Medina, 2010; Pareja-Blanco., 2014). Consequently, VBT becomes a type of
autoregulatory training whereby training loads (kg) and volume (sets x reps x load) can
be adjusted to account for daily fluctutations in biological status and an athlete’s readiness
to train (Kraemer & Fleck, 2007; Mann et al., 2010). For example, if an athlete is
executing a given exercise at a slower velocity than usual, adjustments can be made in
the form of decreasing training load (kg) in order for the athlete to execute loads within a
specified VBT zone to maximize the intended focus of the resistance training session (i.e.
strength-speed).
This novel method provides advantages in allowing strength and conditioning
practitioners to accurately prescribe training loads based on an athlete’s ability to
maintain a prescribed movement velocity that may also aid in fatigue monitoring
(Jidovtseff et al., 2011; Jovanovic & Flanagan, 2014). Recent research has demonstrated

81
that velocity naturally declines during resistance training as fatigue develops (Izquierdo
et al., 2006a; Jidovtseff et al., 2011; Sanchez-Medina & Gonzalez-Badillo, 2011) and the
decline in movement velocity can be interpreted as evidence of impaired neuromuscular
function (Sanchez-Medina & Gonzalez-Badillo, 2011). Therefore, by taking into account
the daily biological status of an athlete and adjusting training loads accordingly, strength
and power performance can be maximized by training within specific VBT zones as it is
demonstrated the velocity at which loads are lifted may consequently influence the
resulting training effect (Behm & Sale, 1993; Cormie et al., 2007; Kawamori et al., 2005;
Pareja-Blanco et al., 2013).
It must be acknowledged that several key limitations exist in the current study. Firstly,
due to in-season competition constraints, a limited number of rugby league participants
(n = 11) were available for the study when compared to the availability of the rugby union
players (n = 41) that consequently prevented cross code positional comparisons.
Secondly, the loads prescribed for each exercise across the set loading intensities (20-
95% 1RM) may have not necessarily reflected each participant’s true maximum strength
and power capabilities. This is due to in-season competition constraints which prevented
pre-intervention 1RM testing. As a result, each participant’s historical 1RM value
obtained within a four-week period prior to the commencement of the study was used to
assign the testing loads for each lift. Lastly, minor injuries sustained during training and
competition may have hindered each athlete’s ability to display maximal dynamic effort
for each of the prescribed lifts across the set loading intensities of 20-95% 1RM.
3.6 Conclusions
The main finding of the present investigation was that unique VBT zones exist for the
bench press, back squat and power clean exercises in semi-professional rugby union and
professional rugby league players. This may provide key advantages in the design of
resistance training programmes by focusing on enhancing specific skeletal muscle
performance traits within a periodized strength and power resistance training programme
that include starting strength, speed-strength, strength-speed, accelerative strength and
absolute strength/power. Consequently, this provides strength and conditioning
practitioners with a novel method to accurately prescribe training loads (kg) for a pre-
selected intensity (%1RM) based on an athlete’s ability to maintain a prescribed
movement velocity.
82
3.7 Practical applications
For the strength and conditioning practitoner, VBT offers a novel and unique approach to
maximizing strength and power performance in professional athletes. The findings of the
present investigation provide important practical applications for the prescription of
strength and power resistance training utilizing movement velocity. In addition, by
utilizing the suggested VBT zones, strength and power performance can be maximized
by allowing strength and conditioning practitioners to accurately prescribe training loads
based on an athlete’s ability to maintain a prescribed movement velocity that will
consequently optimize the development of the intended specific skeletal muscle
performance trait. Furthermore, VBT may also serve as a useful tool for strength and
conditioning practitioners to not only enhance strength and power performance, but it also
aids in controlling the extent of neuromuscular fatigue and the accumulation of excessive
metabolic by products that may influence adaptations to resistance training. This is
achieved by adjusting daily training loads according to a athlete’s daily biological status
and readiness to train and further research is warranted in this area.
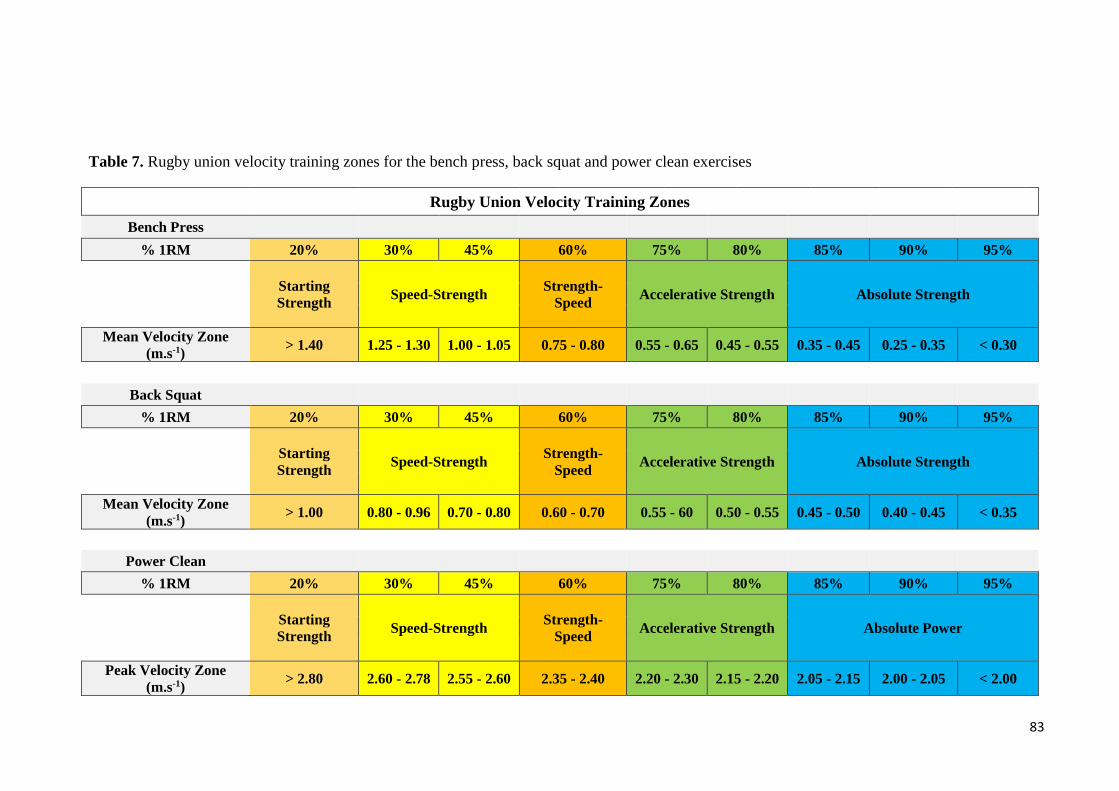
83
Table 7. Rugby union velocity training zones for the bench press, back squat and power clean exercises
Rugby Union Velocity Training Zones
Bench Press
% 1RM 20% 30% 45% 60% 75% 80% 85% 90% 95%
Starting
Strength Speed-Strength
Strength-
Speed Accelerative Strength Absolute Strength
Mean Velocity Zone
(m.s-1) > 1.40 1.25 - 1.30 1.00 - 1.05 0.75 - 0.80 0.55 - 0.65 0.45 - 0.55 0.35 - 0.45 0.25 - 0.35 < 0.30
Back Squat
% 1RM 20% 30% 45% 60% 75% 80% 85% 90% 95%
Starting
Strength Speed-Strength
Strength-
Speed Accelerative Strength Absolute Strength
Mean Velocity Zone
(m.s-1) > 1.00 0.80 - 0.96 0.70 - 0.80 0.60 - 0.70 0.55 - 60 0.50 - 0.55 0.45 - 0.50 0.40 - 0.45 < 0.35
Power Clean
% 1RM 20% 30% 45% 60% 75% 80% 85% 90% 95%
Starting
Strength Speed-Strength
Strength-
Speed Accelerative Strength Absolute Power
Peak Velocity Zone
(m.s-1) > 2.80 2.60 - 2.78 2.55 - 2.60 2.35 - 2.40 2.20 - 2.30 2.15 - 2.20 2.05 - 2.15 2.00 - 2.05 < 2.00

84
Table 8. Rugby league velocity training zones for the bench press, back squat and power clean exercises
Rugby League Velocity Training Zones
Bench Press
% 1RM 20% 30% 45% 60% 75% 80% 85% 90% 95%
Starting
Strength Speed-Strength Strength-Speed Accelerative Strength Absolute Strength
Mean Velocity Zone
(m.s-1) > 1.40 1.15 - 1.35 0.90 - 1.05 0.60 - 0.70 0.38 - 0.45 0.30 - 0.35 0.25 - 0.30 0.20 - 0.25 < 0.20
Back Squat
% 1RM 20% 30% 45% 60% 75% 80% 85% 90% 95%
Starting
Strength Speed-Strength Strength-Speed Accelerative Strength Absolute Strength
Mean Velocity Zone
(m.s-1) > 1.20 0.95 - 1.05 0.85 - 0.90 0.70 - 0.75 0.55 - 0.70 0.50 - 0.60 0.45 - 0.50 0.40 - 0.50 < 0.35
Power Clean
% 1RM 20% 30% 45% 60% 75% 80% 85% 90% 95%
Starting
Strength Speed-Strength Strength-Speed Accelerative Strength Absolute Power
Peak Velocity Zone
(m.s-1) > 3.00 2.70 - 2.85 2.50 - 2.70 2.35 - 2.40 2.05 - 2.25 2.05 - 2.15 1.95 - 2.05 1.90 - 1.95 < 1.90

85
CHAPTER FOUR: THE INFLUENCE OF A 5-WEEK VELOCITY BASED
RESISTANCE TRAINING PROGRAMME ON NEUROMUSCULAR
STRENGTH AND POWER ADAPTATIONS IN PROFESSIONAL RUGBY
LEAGUE PLAYERS: A CASE STUDY
86
4.1 Preface
In the previous chapter it was revealed that unique VBT zones exists for loads lifted
between 20-95% 1RM for the bench press, back squat and power clean exercises in
professional rugby league players. Specifically, it was demonstrated that skeletal muscle
performance traits that include starting strength, speed-strength, strength-speed,
accelerative strength and absolute strength/power can be maximized within specific VBT
zones. This chapter implements the information presented in the previous chapter with a
5-week training intervention where participants performed isoinertial resistance training
either within specific VBT zones or with TPT methods across different load spectrums.
Therefore, the primary purpose of this chapter was to develop a better understanding of
performing isoinertial resistance training within specific VBT zones across different load
spectrums as a training stimulus to elicit subsequent strength and power adaptations when
compared to TPT methods. The second purpose of this chapter was to compare and
examine the psychological wellness and salivary cortisol stress response between VBT
and TPT programmes to determine if VBT induces the same psychological and
physiological stress response as TPT in professional rugby league players.

87
4.2 Introduction
Resistance training is widely recognized as an effective primary tool for improving or
maintaining neuromuscular strength and power in athletes. The neuromuscular system
specifically adapts to the stimulus applied, resulting in increases in muscle strength and
functional performance (Ratamess et al., 2009). Traditional percentage based resistance
training programmes often involve manipulating several acute variables (i.e. exercise
intensity, exercise type, order, sets, repetitions and rest duration) simultaneously. In
addition, the total volume load is often calculated (i.e. sets x reps x load) to achieve
specific performance outcomes. However, this traditional method fails to take into
account movement velocity that could be of great interest when designing resistance
training programmes to optimize neuromuscular strength and power adaptations.
The training principle of specificity suggests that movement velocity is an important
consideration when designing resistance training programmes as greater improvements
in strength and power performance have been shown to occur at or near the optimal
training velocity (Behm & Sale, 1993). The optimal training velocity can be defined as a
prescribed movement velocity that influences both neural and muscular components that
consequently maximizes functional strength and power performance (Behm & Sale,
1993). Research on movement velocity during resistance training is scarce with the
majority of studies examining the effect of velocity specific neuromuscular adaptations
on isokinetic dynamometry equipment (Coburn et al., 2006; Kaneko et al., 1983; Wilson
et al., 1993). However, it is generally accepted that isokinetic muscle actions are
considered to be less specific to actual sporting movements and the practical applications
of the results from isokinetic research are somewhat questionable (Cronin et al., 2002).
Isoinertial resistance (i.e. constant mass) training is the most commonly available type of
resistance training in sporting settings and is suggested to be more specific to actual
sporting movements as it facilitates the nervous systems ability to activate agonist,
antagonist and synergistic muscle activity that is essential to successful sporting
performance (Cronin et al., 2002). The majority of isoinertial VBT studies have compared
both maximal and half maximal lifting velocities of strength training and the associated
transference to sports performance following two to four supervised resistance training
sessions per week across 4–10 week periods (Delecluse et al., 1995; Gonzalez-Badillo et
al., 2014; Pareja-Blanco et al., 2014). These studies have reported significant
improvements when training with maximum concentric velocity efforts in 100-meter

88
sprint times, maximum strength (18.2 vs. 9.7%) and velocity development with light (11.5
vs. 4.5%) and heavy (36.2 vs. 17.3%) loads when compared to half maximal concentric
velocity efforts. On closer examination, the velocity specific adaptations to resistance
training appear to be largely influenced by adaptations within the nervous system or by
changes within the skeletal muscle itself. The velocity specific adaptations within the
nervous system are suggested to provide unique improvements in the frequency at which
motor units discharge that provide greater increases in maximal muscular shortening
velocity, twitch and tetanic rate of tension development (Behm & Sale, 1993; Duchateaus
& Hainaut, 1984). Consequently, this may result in a training induced enhancement of
fast twitch fiber activation (Tricoli et al., 2001) and increased skeletal muscle contraction
velocity, peak power (PP) and rate of force development (RFD) that may be associated
with the enhancement of sport specific tasks (Ikegawa et al., 2008). In addition, skeletal
muscle fiber type transitions or desirable morphological changes in muscle fascicle length
and/or pennation angle may subsequently alter muscle force-velocity characteristics
(Blazevich et al., 2003). Therefore, movement velocity may be considered a fundamental
component of resistance training as the velocity at which loads are lifted may determine
the resulting training effect and its transference to sports performance (Gonzalez-Badillo
et al., 2014).
Numerous resistance training methods have been postulated to improve strength and
power performance that include utilizing the power-load relationship to identify training
loads that maximize Pmax output. Progressing this contention, it is suggested that training
with loads that maximize mechanical Pmax output may improve 10-20-meter sprint times
and elicit small-moderate improvements in lower body and upper body strength
performance (Blazevich & Jenkins, 2002; Harris et al., 2008). However, previous
research has demonstrated that this method may be no more effective than performing
heavy resistance training (>80% 1RM) through improving the force component that plays
an important role in training adaptations of maximal muscular power output (Hakkinen
et al., 1985; Harris et al., 2008; Kaneko et al., 1983; McBride et al., 2002; Moss et al.,
1997). Conversely, it is suggested that training at specific movement velocities may
improve strength and power performance mainly at the trained velocity. In addition, as
velocity begins to deviate from the intended training velocity, the less effective training
will be (Caiozzo et al., 1981; Kanehisa & Miyashita, 1983). Furthermore, it is suggested
that athletes should simulate the velocity and acceleration profiles associated with desired
successful sporting performance and that resistance training loads should accommodate

89
these profiles, whereby functional strength and power adaptations may be optimized
(Cronin et al., 2002; Jones et al., 2001). This can be achieved by utilizing velocity zones
or velocity stops that may provide a novel approach in autoregulating and individualizing
training volume and load by being sensitive to changes in daily maximum strength.
Velocity zones can be defined as specific velocity zones that an athlete must perform a
resistance training movement within in order to develop a specific skeletal muscle
performance trait (i.e. 0.20 – 0.25 m.s-1 for absolute strength). Conversely, a velocity stop
can be defined as a prescribed movement velocity for each repetition and a minimum
velocity threshold (MVT) is set, in which the individual is not allowed to drop below, as
a means to minimize neuromuscular fatigue (Jovanovic & Flanagan, 2014). Combining
both velocity zones and velocity stops appropriately may allow for maximal velocities to
be maintained throughout training blocks by prescribing optimal training loads in relation
to daily biological status and limiting neuromuscular fatigue. Taking this into
consideration, it can be suggested that utilizing movement velocity to monitor fatigue and
to control exercise volume, may positively influence the enhancement of muscular
strength and/or power across different load spectrums. However, despite these potential
advantages, the majority of VBT isoinertial studies have emphasized maximal and half
maximal lifting velocities and failed to equate the total volume load lifted between groups
whilst manipulating several training variables simultaneously (Delecluse et al., 1995;
Gonzalez-Badillo et al., 2014; Pareja-Blanco et al., 2014). Therefore, the mechanisms
responsible for the muscle morphological and strength and power adaptations to VBT are
difficult to interpret due to studies not focusing on movement velocity as the independent
variable and failing to equate the total volume load lifted between groups.
It is well established that the acute and chronic biological alterations of the anabolic
hormones testosterone and catabolic hormone cortisol contribute to positive adaptations
in muscle growth, strength and power performance (Crewther, Lowe, Weatherby, Gill, &
Keogh, 2009). Various studies have investigated the hormonal response to TPT and have
demonstrated that protocols that are high in volume, moderate to high in intensity,
incorporate short rest intervals and target large muscle groups are associated with the
greatest acute increases in testosterone and cortisol (Kraemer & Ratamess, 2005).
Additionally, altering one of the aforementioned parameters or their configuration (i.e.
increasing number of sets or reduction in rest interval), creates a unique stimulus that
modifies the hormonal response to resistance training (Smilios, Tsoukos, Zafeiridis,
Spassis, & Tokmakidis, 2014). In contrast, movement velocity is also an important

90
parameter that may greatly influence the biological stress arising from resistance training.
Movement velocity is demonstrated to be associated with a higher heart rate, energy
expenditure and an augmented disruption of muscle ultra-structure (Hunter et al., 2003;
Mazzetti et al., 2007; Shepstone et al., 2005). Additionally, the execution of a resistance
training movement with intended maximum velocity during light intensity (0-30% 1RM)
explosive movements (McBride et al., 2002) and heavy strength training loads (Behm &
Sale, 1993), may increase the recruitment of higher threshold motor units along with
activating a greater muscle mass which may consequently induce a greater hormonal
response (Carpentier et al., 1996; Smilios et al., 2014). Previous research examining the
effect of movement velocity on cortisol repsonse have reported reduced (Goto,
Takahashi, Yamamoto, & Takamatsu, 2008) or unchanged (Headley et al., 2011) cortisol
concentrations when performing the bench press and knee extension exercises with fast
movement velocities when compared with slow movement velocities. However, these
studies provide limitations as they prescribed movement velocities based off traditional
fixed lifting tempos (2:2 and 2:4 or 1:1 and 3:3) for the concentric and eccentric phases
and only utilized low to moderate loads (40-75% 1RM). The use of cortisol as a method
to monitor catabolic states in athletes, and to predict athletic performance and the
overtraining syndrome has gained interest among strength and conditioning professionals.
Additionally, salivary cortisol has been shown to respond promptly to bouts of both high
and low intensity resistance exercise and power-based interventions in rugby league and
rugby union players. Thus, cortisol is deemed to be a reliable and valid measurement tool
of strength and power resistance exercise load (Crewther et al., 2009; Crewther et al.,
2011a; McGuigan et al., 2004b; McLellan et al., 2010). In addition, psychological
wellness questionnaire monitoring provides an efficient and non-invasive monitoring
strategy that exhibits a dose-response relationship with training load and provides an early
marker of overreaching and/or overtraining in athletes (Gastin et al., 2013; Main & Grove,
2009; Raglin, 2001; Urhausen & Kindermann, 2002).
The primary purpose of the present investigation was to develop a better understanding
of performing resistance training within specific VBT zones across different load
spectrums as a training stimulus to elicit subsequent strength and power adaptations when
compared to TPT methods in professional rugby league players. The second purpose of
the present investigation was to compare and examine the psychological wellness and
salivary cortisol stress response between VBT and TPT programmes to determine if VBT
91
induces the same psychological and physiological stress response as TPT in professional
rugby league players.
4.3 Methods
4.3.1 Experimental approach to the problem
To investigate whether VBT performed with isoinertial external loads across different
load spectrums elicited subsequent improvements in neuromuscular strength and power
performance, a single subject case study pre-intervention and post-intervention design
was employed. Neuromuscular strength and power performance measures of 3RM bench
press, back squat, power clean, countermovement jump (CMJ) and squat jump (SJ) were
determined and measures of force, power, velocity and displacement were considered for
analysis for the CMJ and SJ. This approach allowed us to assess the unique effect of
performing VBT within specific velocity zones across different load spectrums as an
ecologically valid training stimulus to elicit improvements in strength and power
performance in professional rugby league players.
4.3.2 Participants
Ten participants from a National Rugby League (NRL) competition team volunteered to
take part in this study. The participants competed in both the NRL competition and New
South Wales (NSW) cup competition from March 2015 to September 2015. However,
five participants were removed from the study due to failure to complete physical
assessments and their assigned resistance training programmes due to unforeseen match
related injuries and/or availability constraints placed upon the athletes from the senior
coaching staff. Subsequently, five professional rugby league athletes (mean ± SD, age
22.2 ± 1.3 years, height 182.6 ± 4.16 cm, mass 98.4 ± 7.8 kg) participated in the case
study. The following inclusion criteria was imposed for each participant for the purpose
of this study; 1) a competitive male rugby league athlete aged 18-30 years, 2) no current
acute or chronic injuries or medical conditions, 3) have been involved in a high
performance resistance training programme for ≥ 2 years, 4) possess an appropriate level
of joint mobility to perform the bench press, back squat and power clean movements with
correct technique, 5) not using any performance enhancing or banned substances (World
Anti-Doping Agency 2015) and, 6) free from saliva borne infectious disease. Informed

92
written consent was collected from all athletes prior to commencing the investigation.
Study procedures were approved by the AUT University Ethics Committee (AUTEC),
Auckland, New Zealand.
4.3.3 Resistance training programme
This study employed a 5-week training intervention where participants performed two
supervised resistance training sessions per week (10 total training sessions) during the in-
season competition phase. In addition, training weeks were periodized with low, moderate
and heavy intensity training weeks with the addition of a taper week to allow for
neuromuscular recovery. Participants were randomly assigned to either the VBT group
(n = 3) or TPT group (n = 2). Training sessions took place at the participant’s usual
training base under the direct supervision of the investigator at the same time of day
(13:30 ± 1 hour) for each participant. All participants were required to refrain from
performing additional resistance training exercise outside of the prescribed training
programme but continued with their coach specific skills and cardiovascular conditioning
sessions.
The magnitude of training volume (i.e. sets, reps, intended training intensity and rest)
between the TPT vs. VBT groups were kept identical within each training session. The
training loads performed by the TPT group were prescribed from each participant’s
previous 1RM for the bench press, back squat and power clean that was obtained within
a four-week period prior to the commencement of the study. In-season competition
constraints placed on the participants from coaching staff prevented the researchers from
obtaining immediate pre-intervention 1RM values. Conversely, the VBT group
performed an autoregulatory type programme whereby the training loads were
determined by a target mean velocity zone (m.s-1) that was associated with each particular
training intensity for the bench press and back squat exercises and a target peak velocity
zone (m.s-1) for the power clean exercise. The target velocity zones were determined
following a velocity strength and power profiling session for the bench press, back squat
and power clean exercises across a load spectrum of 20-95% 1RM (refer to study one).
Descriptive characteristics of the resistance training programme for the VBT group and
TPT group are presented in Table 9. During each training session, the VBT group attached
a linear position transducer (LPT) (GymAware PowerTool, Kinetic Performance PTY
Ltd., ACT, Australia) to the inside of an Olympic barbell that registered the kinematics

93
of every repetition in real time whereby the LPT software calculated an estimation of the
kinetics of each exercise. The immediate feedback allowed participants to adjust their
subsequent training load (following consultation with the primary investigator) according
to the concentric velocity that was achieved for the preceding set to ensure they were
training within the required velocity zone (m.s-1). The VBT group were instructed to
perform the concentric phase for each repetition of the bench press and back squat with
maximal dynamic effort whilst, participants were instructed to perform the power clean
with maximal dynamic effort throughout the entire movement. Participants were
instructed to perform the bench press without the bar leaving the hands and back
remaining flat on the bench at all times. Additionally, participants were instructed to
perform the back squat with feet fixed to the ground at all times. The depth of the bench
press was set to touch the chest without bouncing the bar. The depth for the back squat
was set at a knee angle of 90 degrees and the power clean catch was set at or above a knee
angle of 90 degrees. The depth of the bench press and back squat and catch position of
the power clean were visually determined and the participants were provided with one
warning if the required movement depth was not achieved. The TPT group were also
instructed to perform each exercise with maximum dynamic effort. However, the TPT
participants did not receive any quantitative feedback for their movement velocity (i.e. a
LPT was not attached to the bar) in order to replicate the participant’s regular training
environment.
4.3.4 Saliva, psychological wellness questionnaire and session RPE monitoring
collection
Psychological wellness questionnaire monitoring and pre and post saliva collection was
performed for each of the two resistance training sessions completed on assigned light
(Week 1, 70-75% 1RM), moderate (Week 2, 75-80% 1RM) and heavy (Week 5, 80-85%
1RM) intensity training weeks. All participants were required to refrain from performing
additional resistance training exercise outside of the prescribed training programme.
Additionally, session RPE was collected for all prescribed resistance training sessions
throughout the 5-week training intervention. The psychological wellness questionnaire
was derived from a previous study conducted in professional rugby league players by
McLean and colleagues (2010). The psychological wellness questionnaire monitoring
collection was performed 30 minutes prior to the commencement of a resistance training
session that consisted of 8 questions relating to perceived fatigue, sleep quality, stress,

94
mood and muscle soreness which were rated on a 1-5 scale (refer to appendix 4). In
addition, a wellness threshold of 25 points was set out of a possible 50 points to determine;
1) an athlete’s readiness to train and, 2) their degree of neuromuscular recovery from a
previous training session (McLean et al., 2010). A wellness score below 25 points
indicates that an athlete may not have recovered effectively from a previous training
session and may have accumulated excessive fatigue. Conversely, a wellness score above
25 points indicates an athlete has recovered effectively from a previous training session
and has not accumulated excessive fatigue. Saliva collection was performed 15 minutes
pre training and within 15 minutes post training. A 2-mL saliva sample was collected via
passive drool, with saliva samples stored at -80 degrees before assay analysis for salivary
cortisol (Sal-C) concentrations following the conclusion of the 5-week training
intervention (Crewther et al., 2009). The salivary collection timeline was set for low,
moderate and high intensity weeks to account for in-season competition matches and
logistical reasons. The analysis of salivary cortisol concentrations involved three steps;
1) sample centrifugation, 2) extraction of the clear supernatant and, 3) Elecsys cortisol
assay analysis performed at the AUT Roche Diagnostics Laboratory. Salivary collection
was specifically chosen due to its ability to measure the free bioavailable hormone levels
in the body (Aardal-Eriksson et al., 1998). Conversely, other methods such as serum
collection only measures the protein bound non-available hormone levels (Aardal-
Eriksson et al., 1998). Therefore, saliva collection provides a non-invasive and accurate
measurement of hormone levels in dynamic endocrine tests (r = 0.76-0.85, p < 0.001)
(Aardal-Eriksson et al., 1998; Duplessis et al., 2010). Session-RPE was collected within
30 minutes following the cessation of each training session utilizing the Borg CR-10 RPE
scale which has been shown to be a reliable and valid method of quantifying resistance
exercise load (McGuigan et al., 2004b).
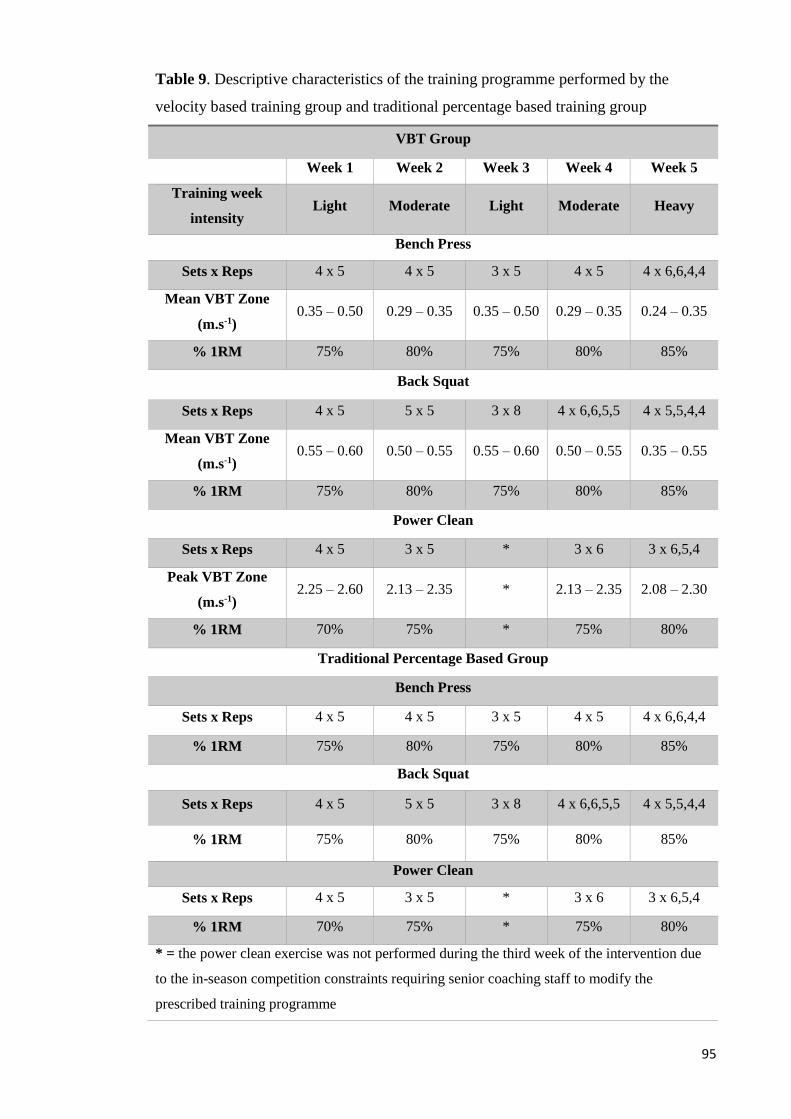
95
Table 9. Descriptive characteristics of the training programme performed by the
velocity based training group and traditional percentage based training group
VBT Group
Week 1 Week 2 Week 3 Week 4 Week 5
Training week
intensity Light Moderate Light Moderate Heavy
Bench Press
Sets x Reps 4 x 5 4 x 5 3 x 5 4 x 5 4 x 6,6,4,4
Mean VBT Zone
(m.s-1) 0.35 – 0.50 0.29 – 0.35 0.35 – 0.50 0.29 – 0.35 0.24 – 0.35
% 1RM 75% 80% 75% 80% 85%
Back Squat
Sets x Reps 4 x 5 5 x 5 3 x 8 4 x 6,6,5,5 4 x 5,5,4,4
Mean VBT Zone
(m.s-1) 0.55 – 0.60 0.50 – 0.55 0.55 – 0.60 0.50 – 0.55 0.35 – 0.55
% 1RM 75% 80% 75% 80% 85%
Power Clean
Sets x Reps 4 x 5 3 x 5 * 3 x 6 3 x 6,5,4
Peak VBT Zone
(m.s-1) 2.25 – 2.60 2.13 – 2.35 * 2.13 – 2.35 2.08 – 2.30
% 1RM 70% 75% * 75% 80%
Traditional Percentage Based Group
Bench Press
Sets x Reps 4 x 5 4 x 5 3 x 5 4 x 5 4 x 6,6,4,4
% 1RM 75% 80% 75% 80% 85%
Back Squat
Sets x Reps 4 x 5 5 x 5 3 x 8 4 x 6,6,5,5 4 x 5,5,4,4
% 1RM 75% 80% 75% 80% 85%
Power Clean
Sets x Reps 4 x 5 3 x 5 * 3 x 6 3 x 6,5,4
% 1RM 70% 75% * 75% 80%
* = the power clean exercise was not performed during the third week of the intervention due
to the in-season competition constraints requiring senior coaching staff to modify the
prescribed training programme

96
4.3.5 Testing procedures
Pre and post-intervention neuromuscular strength and power assessments were performed
one week before and one week after the cessation of the study. The following tests were
performed in a single session in the following order; 1) countermovement jump (CMJ),
2) squat jump (SJ), 3) 3RM power clean, 4) 3RM back squat, and 5) 3RM bench press.
4.3.5.1 CMJ and SJ
Lower body power was measured pre and post-intervention using an explosive
bodyweight CMJ and SJ performed on a portable AMTI force plate (AMTI Force and
Motion, Watertown, MA, USA). Participants lowered their body position to a self-
selected depth for both the CMJ and SJ. Each participant was instructed to execute the
entire motion of the CMJ including arm swing with maximal dynamic effort. Conversely,
participants were instructed to hold the SJ position with hands on hips at a self-selected
hip and knee angle for two seconds before the verbal instruction of “jump” was given to
execute the SJ motion with maximal dynamic effort (Gutierrez-Davila et al., 2014;
Markovic et al., 2014; Morrissey et al., 1998; Pareja-Blanco et al., 2014). Four maximal
CMJs, separated by a 5-10 second rest period were executed whilst, a three-minute rest
period was provided before executing four maximal SJs, separated by a 5-10 second rest
period. CMJ and SJ peak force (PF), peak power (PP), peak velocity (PV) and
displacement were registered and considered for analysis. The test-retest reliability for
CMJ and SJ performance measures of force, power, velocity and displacement were not
possible to assess in the current study. However, previous research has reported AMTI
force plate reliability for measures of force (ICC = 0.80 - 0.97; CV = 2.1% - 6.4%)
(Buckthorpe et al., 2012; Cronin et al., 2004), power (ICC = 0.94; CV = 10.4%) and
velocity (ICC = 0.94; CV = 9.7%) (Hansen, Cronin, & Newton, 2011).
4.3.5.2 Bench press and back squat
The bench press and back squat exercises were performed on an adjustable power rack
(Life Fitness, Hammer Strength, Auckland, New Zealand) with a loaded 20kg Olympic
barbell placed horizontally at the chosen height of the participant. The bench press and
back squat were chosen for the purpose of assessing upper and lower body maximal
strength, respectively, in this study as they are exercises that are widely used in athletic

97
training environments. In addition, all the participants in the present study were familiar
with generating maximum force and executing the exercises with efficient technique. The
bench press was performed with the participants lying with their back flat on a bench with
arms fully extended and hands gripping the bar approximately shoulder width apart whilst
the knees were bent at a 90-degree angle and feet fixed to the ground. The depth of the
bench press was set to touch the chest without bouncing the bar. The back squat was
performed with participants starting in the upright position with knees and hips fully
extended, feet placed approximately shoulder width apart and the Olympic barbell
positioned approximately across the acromion joint. The depth for the back squat was set
at a knee angle of 90-degrees (visually determined) before returning to the upright
position. Each participant was instructed to descend the barbell during the eccentric phase
for the bench press and back squat in a controlled motion. However, participants were
instructed to execute the concentric phase of the bench press and back squat with maximal
dynamic effort. Participants were also instructed to perform the bench press without the
bar leaving the hands and back remaining flat on the bench at all times. Additionally,
participants were instructed to perform the back squat with feet fixed to the ground at all
times. As previously mentioned, the pre-intervention 1RM bench press and back squat
maximum strength values for each participant were obtained from historical data that
were assessed within a four-week period of the participants commencing the study. The
post-intervention bench press and back squat maximum strength characteristics of
participants were assessed with a 3RM as it was not possible to perform 1RM assessment
due to in-season competition constraints placed on participants from coaching staff.
Therefore, a predicted 1RM value was generated from the Brzycki (1993) formula that is
shown to be a reliable method for predicting 1RM (r2 = 0.98).
Predicted 1RM = Load (kg)/1.0278 - (0.0278 x number of reps)
The post-intervention loading intensities were individually adjusted for each participant
with 2.5 to 5kg load increments for both the bench press and back squat so that a
maximum 3RM could be precisely determined. A warm-up set for both the bench press
and back squat was executed with five repetitions on the 20kg Olympic barbell only, three
repetitions executed at light loads (< 60% 1RM), three repetitions executed at moderate
loads (70 – 80% 1RM), before loads were executed at above 80% 1RM to determine
maximal 3RM dynamic strength. Strong verbal encouragement was provided to motivate
participants to execute maximal effort. Inter-set rest periods ranging between three to five
minutes were provided for each participant.

98
4.3.5.3 Power clean
The power clean exercise was performed on a weightlifting platform (Life Fitness,
Hammer Strength, Auckland, New Zealand) that consisted of a 20kg Olympic barbell that
was loaded with bumper plates. The power clean was chosen for the purpose of assessing
whole body power in this study as it is an exercise that is widely used in athletic training
environments (De Villiers & Venter, 2015; Hoffman et al., 2004; Seitz et al., 2014). In
addition, all participants in the present study were familiar with generating whole body
power and executing the power clean exercise with efficient technique. All repetitions
were performed from the ground with the participants’ feet placed approximately
shoulder width apart with their hands gripping the bar approximately outside shoulder
width. Each participant was instructed to perform the first pull (i.e. lifting the bar from
the ground to the knee) in a controlled motion whilst gaining momentum. However,
participants were instructed to perform the second pull (i.e. transitioning from the double
knee-bend and accelerating the bar to the hip whilst extending the trapezius) with
maximal dynamic effort. The catch position of the power clean was set at or above a knee
angle of 90-degrees in order to be recorded as a successful lift. As noted above, it was not
possible to perform a post-intervention 1RM assessment due to in-season competition
constraints placed on participants from coaching staff. Therefore, the post-intervention
power clean maximum for each participant were assessed with a 3RM and a predicted
1RM value was generated from the Brzycki (1993) formula. Strong verbal encouragement
was provided to motivate participants to execute maximal effort. Inter-set rest periods
ranging between three to five minutes were provided for each participant.
4.3.6 Statistical analysis
The proposed statistical analysis methods for the present investigation included reporting
means and standard deviations to describe all data variables. Analysis of the efficacy of
the training programme included computing independent t-tests to compare the percent
change in the variables of interest using IBM SPSS software version 22. Cohen’s effect
statistics were to be used to describe the differences in pre and post testing between
groups. The effect size magnitude were to be calculated according to the Cohen scale
where d = 0.2 is considered a small effect, d = 0.5 is moderate and d = 0.8 is a large effect
size (Cohen, 1992). A significance level of p < 0.05 was to be selected to indicate
statistical significance. However, due to the large drop out of participants prior to the

99
commencement of the research study, it was only possible to describe all data variables
as means and standard deviations and differences in pre and post testing between groups
as percentage changes.
4.4 Results
4.4.1 Intended vs actual total tonnage lifted and session RPE
The VBT group’s actual total tonnage that was lifted for the bench press, back squat and
power clean exercises was higher than the intended loads throughout the intervention
period (Table 10). Interestingly, the VBT group and TPT group did not report major
dissimilarities in perceived internal load (Figures 9 – 11).
4.4.2 Saliva collection and wellness questionnaire monitoring
During the low intensity training week, the TPT group on average elicited a greater
increase in Sal-C (+52.3%) when compared to the VBT group (+12.8%). In addition, a
greater increase in Sal-C was observed for the TPT group (+472.6%) during the heavy
intensity training week whilst the VBT group elicited less Sal-C (+99.0%). However, Sal-
C response for the moderate intensity training week are indefinite with the VBT group
showing a decrease in Sal-C (-1.1%) whilst a greater decrease was observed in TPT group
(-30.0%) (Table 11). In relation to the weekly psychological wellness questionnaire
monitoring data, the VBT group reported higher weekly psychological wellness scores
for light (37.7 ± 1.4 vs 35.5 ± 3.1), moderate (35.5 ± 2.7 vs 29.5 ± 0.7) and heavy (35.0
± 1.6 vs 29.0 ± 3.5) intensity training weeks when compared to the TPT group. The higher
psychological wellness questionnaire scores reported by the VBT group indicated that the
participants recovered more effectively from previous resistance training sessions and did
not accumulate excessive fatigue.
4.4.3 Countermovement jump (CMJ)
Analysis between initial pre and post intervention testing showed substantial changes in
CMJ and SJ force, power, velocity and displacement between participants in the VBT
group and TPT group (Table 12). Participants 1-2 in the VBT group showed substantial
improvements in CMJ force (N) (+15.9 and +66.8%), power (W) (+31.8 and +76.3%),
100
velocity (m.s-1) (+2.9 and +36.9%) and displacement (m.s-1) (+2.8 and +67.9%). In
addition, participant 3 in the VBT group showed similar improvements in CMJ force (N)
(+30.9%), power (W) (+9.3%) and displacement (m.s-1) (+32.7%) however, showed a
decrease in velocity (m.s-1) (-11.3%). Participant 4 in the TPT group showed decreases
across all CMJ performance variables of force (N) (-28.2%), power (W) (-9.8%), velocity
(m.s-1) (-19.0%) and displacement (m.s-1) (-51.6%) (Table 12).
4.4.4 Squat jump (SJ)
Participant 2 in the VBT group improved across all performance variables of force (N)
(+105.7%), power (W) (+35.0%), velocity (m.s-1) (+12.8%) and displacement (m.s-1)
(+131.6%). Similar improvements were observed for participant 1 and 3 in the VBT
group for force (N) (+32.2% and +41.5%), power (N) (+6.8% and +5.5%) and
displacement (m.s-1) (+7.4% and +62.1%). However, both participants showed decreases
in velocity (m.s-1) (-11.6% and -16.3%). Participant 4 in the TPT group showed
improvements in only power (W) (+8.8%) and velocity (m.s-1) (+3.9%) however, showed
decreases in force (N) (-6.4%) and displacement (m.s-1) (-5.6%) (Table 13).
4.4.5 Strength and power assessments
4.4.5.1 Bench press
Analysis between initial pre and post intervention testing showed only participant 1 in the
VBT group improved bench press maximal strength with an increase of +1.5%.
Participant 2 in the VBT group showed a decrease in maximal bench press strength by -
2.3% whilst, participant 4 and 5 in the TPT group showed a greater decrease in maximal
bench press strength by -3.7% and 10.4% (Table 14).
4.4.5.2 Back squat
Analysis between initial pre and post intervention testing showed only participant 1 in the
VBT group improved maximal back squat strength with an increase of +5.9%. Participant
2 in the VBT group showed a decrease in maximal back squat strength by -7.7% whilst,
participant 4 in the TPT group showed a greater decrease in maximal back squat strength
by -17.6% (Table 14).
101
4.4.5.3 Power clean
Analysis between initial pre and post intervention testing showed only participant 2 in the
VBT group improved power clean maximal power with an increase of +1.5%. Participant
1 in the VBT group showed a decrease in power clean maximal power by -7.3% whilst,
participant 4 in the TPT group showed no change in power clean maximal power (Table
14).

102
Table 10. Total intervention intended vs actual tonnage lifted for the velocity based training group and traditional percentage based training group
Velocity Based Training Group
Bench Press Back Squat Power Clean
Intended Actual % Change Intended Actual % Change Intended Actual % Change
Participant 1 1160kg 1235kg +6.8% 1805kg 1860kg +3.1% 835kg 930kg +11.4%
Participant 2 1660kg 1720kg +3.6% 1805kg 1865kg +3.3% 885kg 930kg +5.9%
Participant 3 1885kg 1985kg +5.3% 1855kg 1910kg +3.0% 945kg 990kg +4.8%
Traditional Percentage Based Training Group
Participant 4 1425kg 1425kg 0% 1785kg 1785kg 0% 625kg 625kg 0%
Participant 5 1325kg 1325kg 0% 1336kg 1336kg 0% 790kg 790kg 0%

103
Table 11. Salivary cortisol concentrations pre and post light, moderate and heavy intensity training weeks and mean weekly endocrine and
neuromuscular psychological wellness questionnaire monitoring scores for the velocity based training group and traditional percentage based
training group
Velocity Based Training Group Traditional Percentage Based Training Group
Intensity
%1RM Pre Sal-C Post Sal-C % Change
Wellness
Score Pre Sal-C Post Sal-C % Change
Wellness
Score
Light (70-75%) 13.7 ± 11.7 15.4 ± 12.1 +12.8% 37.7 ± 1.4 8.1 ± 3.9 12.3 ± 3.8 +52.3% 35.5 ± 3.1
Moderate (75-
80%) 5.7 ± 3.8 5.4 ± 1.8 -1.1% 35.5 ± 2.7 10.8 ± 4.6 7.6 ± 3.6 -30.0% 29.5 ± 0.7
Heavy (80-85%) 8.5 ± 2.6 16.8 ± 26.1 +98.9% 35.0 ± 1.6 6.5 ± 1.1 37.4 ± 46.0 +472.6% 29.0 ± 3.5
Mean ± SD, 1RM = one repetition maximum

104
Table 12. Pre and post intervention countermovement jump results for the velocity based training group and traditional percentage based training
group
Velocity Based Training Group
Force (N) Power (W) Velocity (m.s-1) Displacement (m.s-1)
Pre Post % Change Pre Post % Change Pre Post %
Change Pre Post % Change
Participant
1
1341 ±
204
1554 ±
92 +15.9%
4692 ±
488
6186 ±
644 +31.8%
2.96 ±
0.31
3.04 ±
0.17 +2.9%
0.46 ±
0.06
0.47 ±
0.16 +2.8%
Participant
2
1487 ±
507
2480 ±
90 +66.8%
5378 ±
1100
9482 ±
356 +76.3%
3.23 ±
0.12
4.43 ±
0.05 +36.9%
0.55 ±
0.02
0.93 ±
0.02 +67.9%
Participant
3
1691 ±
414
2214 ±
514 +30.8%
5669 ±
199
6199 ±
430 +9.3%
3.37 ±
0.29
2.99 ±
0.18 -11.3%
0.55 ±
0.06
0.73 ±
0.04 +32.7%
Traditional Percentage Based Training Group
Participant
4
1932 ±
436
1388 ±
44 -28.2%
6523 ±
1549
5886 ±
252 -9.8%
3.89 ±
0.88
3.15 ±
0.12 -19.0%
1.30 ±
1.23
0.63 ±
0.14 -51.6%
Participant
5
1752 ±
568 * *
5241 ±
380 * *
2.74 ±
0.14 * *
0.47 ±
0.08 * *
* = did not complete post testing due to injury sustained during competition in the final week of the intervention

105
Table 13. Pre and post intervention squat jump results for the velocity based training group and traditional percentage based training group
Velocity Based Training Group
Force (N) Power (W) Velocity (m.s-1) Displacement (m.s-1)
Pre Post % Change Pre Post % Change Pre Post % Change Pre Post % Change
Participant 1 1598 ±
519
2112 ±
536 +32.2%
4713 ±
238
5033 ±
101 +6.8%
3.01 ±
0.03
2.66 ±
0.05 -11.6%
0.61 ±
0.45
0.66 ±
0.06 +7.4%
Participant 2 1230 ± 48 2530 ±
35 +105.7%
5852 ±
715
7899 ±
1567 +35.0%
3.28 ±
0.23
3.70 ±
0.70 +12.8%
0.44 ±
0.02
1.03 ±
0.19 +131.6%
Participant 3 1752 ±
923
2479 ±
56 +41.5%
5991 ±
401
6318 ±
344 +5.5%
3.54 ±
0.14
2.96 ±
0.14 -16.3%
0.52 ±
0.04
0.84 ±
0.14 +62.1%
Traditional Percentage Based Training Group
Participant 4 1976 ± 87 1850 ±
488 -6.4%
5071 ±
931
5514 ±
1511 +8.8%
3.01 ±
0.57
3.13 ±
0.77 +3.9%
0.81 ±
0.30
0.76 ±
0.24 -5.6%
Participant 5 1872 ±
492 * *
4522 ±
111 * *
2.51 ±
0.06 * *
0.63 ±
0.11 * *
* = did not complete post testing due to injury sustained during competition in the final week of the intervention

106
Table 14. Pre and post intervention strength and power results for the velocity based training group and traditional percentage based training group
Velocity Based Training Group
Bench Press Back Squat Power Clean
Pre 1RM Post 1RM % Change Pre 1RM Post 1RM % Change Pre 1RM Post 1RM % Change
Participant 1 120kg 122kg +1.5% 170kg 180kg +5.9% 120kg 111kg -7.3%
Participant 2 130kg 127kg -2.3% 195kg 180kg -7.7% 120kg 122kg +1.5%
Participant 3 180kg * * 180kg * * 125kg * *
Traditional Percentage Based Training Group
Participant 4 110kg 106kg -3.7% 180kg 148kg -17.6% 90kg 90kg 0%
Participant 5 130kg 116kg -10.4% 150kg * * 100kg * *
* = did not complete post testing due to injury sustained during competition in the final week of the intervention

107
0
50
100
150
200
250
300
350
400
450
500
Week 1 Week 2 Week 3 Week 4 Week 5
Mea
n T
ota
l T
onnag
e (k
g)
Bench Press
VBT
TPT
6
7
5
6
7
55
55
5
0
1
2
3
4
5
6
7
8
Week 1 Week 2 Week 3 Week 4 Week 5
Mea
n R
PE
VBT
TPT
Figure 9. Velocity based training group and traditional percentage based training group actual mean bench press (±SD) weekly
tonnage and mean session RPE. Week 1 = Light week (70-75%), Week 2 = Moderate week (75-80%), Week 3 = Light week
(70-75%), Week 4 = Moderate week (75-80%), Week 5 = Heavy week (80-85%).

108
0
50
100
150
200
250
300
350
400
450
500
550
600
Week 1 Week 2 Week 3 Week 4 Week 5
Mea
n T
ota
l T
onnag
e (k
g)
Back Squat
VBT
TPT
66
5
66
66
5
5 5
0
1
2
3
4
5
6
7
8
Week 1 Week 2 Week 3 Week 4 Week 5
Mea
n R
PE VBT
TPT
Figure 10. Velocity based training group and traditional percentage based training group actual mean back squat (±SD) weekly
tonnage and mean session RPE. Week 1 = Light week (70-75%), Week 2 = Moderate week (75-80%), Week 3 = Light week (70-
75%), Week 4 = Moderate week (75-80%), Week 5 = Heavy week (80-85%).

109
0
50
100
150
200
250
300
350
400
Week 1 Week 2 Week 3 Week 4 Week 5
Mea
n T
ota
l T
onnag
e (k
g)
Power Clean
VBT
TPT
66 6
6
66
5 5
0
1
2
3
4
5
6
7
8
Week 1 Week 2 Week 3 Week 4 Week 5
Mea
n R
PE VBT
TPT
Figure 11. Velocity based training group and traditional percentage based training group actual mean power clean (±SD) weekly
tonnage and mean session RPE. Week 1 = Light week (70-75%), Week 2 = Moderate week (75-80%), Week 3 = Light week (70-
75%), Week 4 = Moderate week (75-80%), Week 5 = Heavy week (80-85%). *Week 3 - the power clean exercise was not
performed during the third week of the intervention due to the in-season competition constraints requiring senior coaching staff to
modify the prescribed training programme.
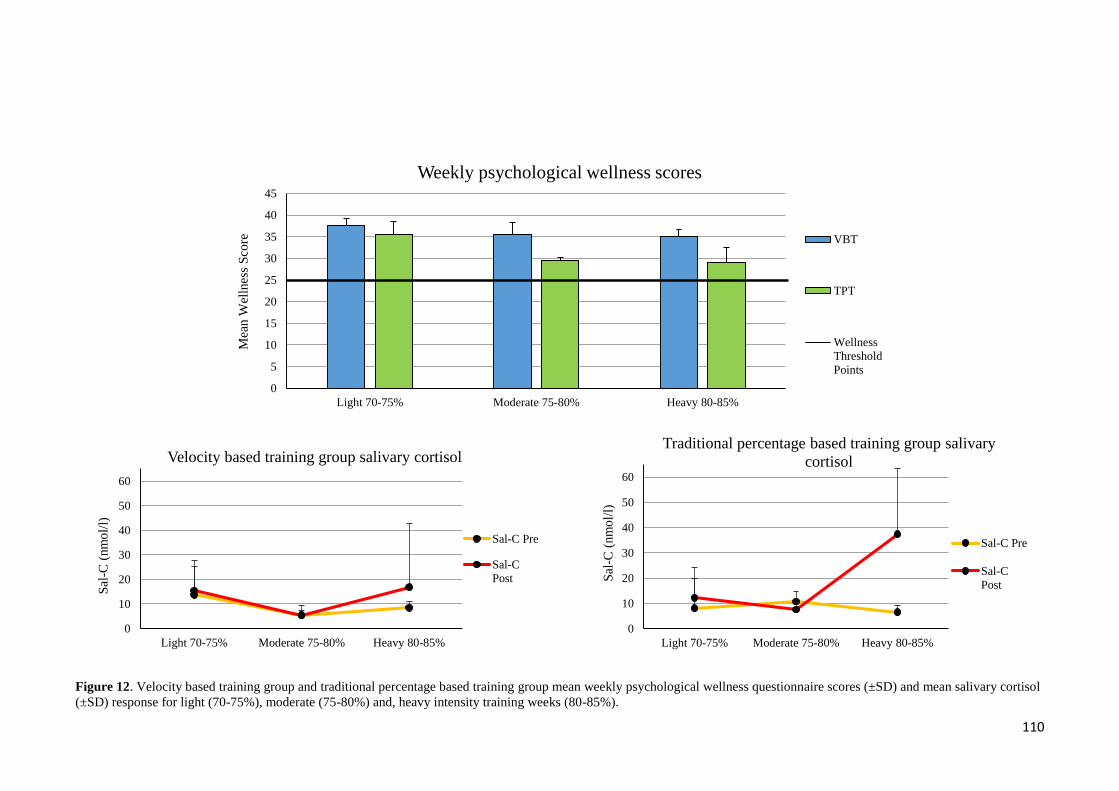
110
0
5
10
15
20
25
30
35
40
45
Light 70-75% Moderate 75-80% Heavy 80-85%
Mea
n W
elln
ess
Sco
re
Weekly psychological wellness scores
VBT
TPT
Wellness
Threshold
Points
0
10
20
30
40
50
60
Light 70-75% Moderate 75-80% Heavy 80-85%
Sal
-C (
nm
ol/
l)
Velocity based training group salivary cortisol
Sal-C Pre
Sal-C
Post
Figure 12. Velocity based training group and traditional percentage based training group mean weekly psychological wellness questionnaire scores (±SD) and mean salivary cortisol
(±SD) response for light (70-75%), moderate (75-80%) and, heavy intensity training weeks (80-85%).
0
10
20
30
40
50
60
Light 70-75% Moderate 75-80% Heavy 80-85%
Sal
-C (
nm
ol/
l)
Traditional percentage based training group salivary
cortisol
Sal-C Pre
Sal-C
Post
111
4.5 Discussion
The primary purpose of this study was to determine the influence of performing resistance
training within specific VBT zones on subsequent strength and power adaptations when
compared to TPT methods in professional rugby league players. It must be highlighted
that a major limitation of this study was that a small sample size was used due to in-season
competition constraints placed on potential participants. The authors acknowledge this
limitation and the findings of this study will be discussed with this in mind.
The main findings of this investigation were that a substantial increase in CMJ and SJ
performance was observed after the 5-week intervention in the VBT group. In addition,
greater increases in training load were performed by the VBT group when compared to
the intended values based off TPT methods (i.e. prescribing loads based off a pre-
intervention 1RM value), whilst no change was observed in the TPT group. A novel
finding of this investigation was that although the VBT group performed greater weekly
tonnages, no substantial variance in reported session RPE values were observed between
both groups. Additionally, the VBT group reported higher weekly wellness questionnaire
scores and remained considerably above the set wellness threshold of 25 points when
compared to the TPT group. Furthermore, the VBT group elicited less Sal-C training
stress for light and heavy intensity training weeks when compared to the TPT group.
These results demonstrate that VBT allows greater training volumes to be performed
without incurring excessive perceived internal load. In addition, the VBT participants
were able to enhance neuromuscular recovery between training sessions to a greater
extent which corresponded with greater perceived psychological wellness scores and
optimized participant’s readiness to train. However, it must be acknowledged that the
limitations of the current findings include; 1) participant 5 from the TPT group did not
complete the CMJ, SJ, back squat and power clean testing due to injury. In addition,
participant 3 from the VBT group did not complete the final bench press, back squat and
power clean testing due to injury sustained during competition in the final week of the
intervention and, 2) the power clean exercise was not performed during the third week of
the intervention due to the in-season competition constraints requiring senior coaching
staff to modify the prescribed training programme.
Despite these limitations, this study provides evidence to suggest that performing
isoinertial resistance training within specific VBT zones across different loading
spectrums may be an effective training stimulus to improve the neuromuscular strength

112
and power characteristics in professional rugby league players when compared to TPT
methods. Whilst further research is needed, with a greater sample size, the results
observed for the VBT group are in agreement with previous research that have suggested
VBT may be an effective complementary resistance training method for improving
neuromuscular strength and power performance (Gonzalez-Badillo et al., 2014; Padulo et
al., 2012; Pareja-Blanco et al., 2014). In addition, the present findings are similar to those
reported by Pareja-Blanco and colleagues (2014) who demonstrated a significant
improvement in measures of CMJ height (+8.9%, ES: 0.63, p < 0.001) and 1RM back
squat dynamic performance (+18%, ES: 0.94, p < 0.001) following 6-weeks of maximal
intended concentric velocity training utilizing the back squat exercise.
The tangible improvements in neuromuscular strength and power performance after the
5-week VBT protocol may be attributed to a combination of muscular morphological,
molecular and neural factors that may influence adaptation at the skeletal muscle level
and further investigation is warranted in this area. However, it cannot be discounted that
the observed improvements in strength and power performance may have been influenced
by the greater total training loads performed by the VBT group as greater training loads
affect the mechanical and metabolic stresses that are believed to influence and shape the
magnitude of strength and power adaptations (Mangine et al., 2015; Moritani, 1993;
Ratamess et al., 2009). A unique and important aspect of this investigation was that the
magnitude of training volume (sets, reps, intended intensity and rest) were kept identical
for both the VBT group and TPT group (Table 9). In contrast, the training loads executed
per session differed between groups as the TPT group performed loads based off their
previous 1RM whilst the VBT group performed an autoregulatory type programme
whereby the performed loads were determined by a target velocity zone prescribed for
each load spectrum.
Despite all participants being exposed to the same training volume in terms of sets and
reps, the actual total tonnage of the VBT group for the bench press (+5.1%), back squat
(+3.1%) and power clean (+7.1%) exercises were higher when compared to intended
values based off TPT methods. Interestingly, although the VBT group performed greater
total actual tonnage for the bench press, back squat and power clean exercises, no
substantial variances were reported in session RPE values between both groups (Figures
9 – 11). This is in agreement with Hatfield and colleagues (2006) who demonstrated that
performing the shoulder press and back squat exercises at higher movement velocities
elicited more repetitions, higher peak power and volume load between 60-80% 1RM
113
whilst no significant differences were reported in session RPE when compared to the slow
velocity training group. Based on these findings it can be suggested that VBT may provide
an alternative strategy in autoregulating training volume and load when compared to the
autoregulatory progressive resistance exercise (APRE) and RPE methods (Day et al.,
2004; Mann et al., 2010; McGuigan et al., 2004b; Singh et al., 2007). That is, performing
resistance training within specific VBT zones can be used to individualize daily training
volume and load both within and between sets when compared to the APRE and RPE
methods that require practitioners to wait until a training set or session has been
completed before making necessary adjustments. This means that performing resistance
training within specific VBT zones may aid in identifying daily optimal training loads for
a pre-selected training intensity that is sensitive to an athlete’s daily fluctuations in
maximum strength and readiness to train. In addition, it appears that the VBT group were
able to train closer to the intended focus of the assigned light, moderate and, heavy
intensity training weeks (i.e. their RPE’s were higher in the heavy intensity training weeks
and lower in the light intensity training weeks) when compared to the TPT group.
Therefore, VBT may improve the quality of work or effort performed in each training
session and may provide advantages in allowing athlete’s to improve strength and power
performance at their own rate.
Consequently, VBT may provide strength and conditioning practitioners with an efficient
strength and power training periodization model that will allow athlete’s to maintain
maximal lifting velocities throughout strength and power training phases. Furthermore,
the observations of the researcher during the training period in the VBT group revealed
an enhanced level of competitiveness and motivation as a result of the immediate
feedback regarding movement velocity. Thus, the competitive training environment may
have also influenced the improvements in strength and power performance observed in
the present study. The observations of the researcher are in agreement with Randell and
colleagues (2011) who demonstrated that the immediate knowledge of velocity achieved
for every repetition during the jump squat exercise significantly improved CMJ (4.6%),
horizontal jump (2.6%) and 10-30-meter sprint performance (0.9–1.4%) in professional
rugby players. In addition, Mann and colleagues (2015) also corroborate the researchers’
observations with their own experiences.
It has been suggested that optimal adaptation to a prescribed resistance training stimulus
depends on the appropriate selection of an overload stimulus based on the neuromuscular
systems susceptibility to change (Cormie et al., 2011). However, the control of the actual

114
training volume (i.e. sets x reps x intended intensity) performed by the two groups enabled
us to isolate the influence movement velocity has on the observed neuromuscular strength
and power changes. With this in mind, the present results indicate that the actual
movement velocity achieved, as controlled by load, across different loading spectrums is
a vital stimulus for improving velocity specific neuromuscular performance capabilities
and possible neural adaptations (Behm & Sale, 1993; McBride et al., 2002). Previous
research has found similar findings whereby performing high velocity movements
provided velocity specific adaptations in improved peak force, peak power, peak velocity,
muscular electrical activity, RFD and rate of neural activation (Anderson et al., 2006; de
Oliveira et al., 2013; Hakkinen et al., 1985; Jones et al., 2001; McBride et al., 2002; Tillin
et al., 2012). Additionally, placing emphasis on producing high velocity movements
across a range of loading intensities, rather than producing maximal force has been
suggested to induce greater improvements in neuromuscular strength and power
performance (Jones et al., 2001).
In terms of Sal-C responses, performing resistance training within specific VBT zones
elicited less Sal-C training stress during light (+12.8 vs. +52.3%) and heavy (+98.9 vs.
+472.6%) intensity training weeks when compared to the TPT group. However, Sal-C
training stress elicited between each resistance training method during moderate intensity
training weeks remains indefinite with decreases in Sal-C response observed post
training. In addition, although the VBT group performed greater total tonnage during
light, moderate and heavy intensity training weeks, Sal-C response remained lower than
the TPT group who performed less total tonnage across all training weeks (Figures 9 -
12). These results are in contrast to previous research that have suggested Sal-C, as a
stress hormone increases more after the execution of greater volume protocols that are
associated with higher metabolic stress when compared with lower volume protocols
(Crewther et al., 2011a; McCaulley et al., 2009; Smilios et al., 2003).
When tracking Sal-C response during light, moderate and heavy intensity training weeks
alongside psychological wellness questionnaire monitoring, the VBT group reported
higher weekly psychological wellness questionnaire scores and remained 12.7 points
above the set threshold of 25 points for the light intensity training week, 10.5 points for
the moderate intensity training week and 10 points for the heavy intensity training week.
This is greater than the TPT group who reported lower wellness points above the set
threshold of 10.5 points for the light intensity week, 4.5 points for the moderate intensity
training week and 4 points for the heavy intensity training week. With this in mind, the

115
present results suggest that the VBT protocol may have been effective in enhancing
neuromuscular recovery between training sessions and may have limited the
accumulation of metabolic by products and controlled the extent of neuromuscular fatigue
by taking into account participants daily biological status and readiness to train
(Jovanovic et al., 2014; Sanchez-Medina et al., 2011). In addition, by using movement
velocity as a type of autoregulatory training control, the physiological stress responses to
resistance training appears to be attenutaed (i.e. decreased Sal-C stress response and
greater psychological wellness questionnaire scores).
4.6 Conclusions
The present investigation provides preliminary data that supports further research into
performing isoinertial resistance training within specific VBT zones across different
loading spectrums in enhancing neuromuscular strength and power adaptations in
professional rugby league players. This form of resistance training appears to facilitate
tangible improvements in neuromuscular strength and power performance over a five-
week concurrent training and competition period. Thus, the use of specific VBT zones
for upper and lower body strength and whole body power exercises appear to provide
advantages in optimizing the development of specific skeletal muscle performance traits
that include starting strength, speed-strength, strength-speed, accelerative strength, and
absolute strength/power that effect different portions of the force-velocity curve. In
addition, movement velocity may provide a novel method in autoregulating the total
volume load lifted in a resistance training session by ensuring athletes remain within a
target velocity zone. Consequently, this will allow strength and conditioning practitioners
to accurately prescribe daily training loads whilst improving training efficiency by
determining whether the prescribed intensity (%1RM) and load (kg) for a given exercise
truly represents the intended focus of a resistance training session. Finally, the acute Sal-
C responses pre and post training and its relation to weekly psychological wellness
questionnaire scores, suggests VBT elicits less training stress and limits the accumulation
of metabolic by products and controls the extent of neuromuscular fatigue. Therefore,
VBT may provide strength and conditioning practitioners with a novel and effective
complementary resistance training method to improve strength and power adaptations
whilst enhancing training efficiency in professional athletes with further investigation
warranted. In addition, monitoring movement velocity alongside psychological wellness
questionnaires provides a simple and non-invasive method to determine the extent of

116
psychological and neuromuscular fatigue incurred during the in-season competition
phase.
When interpreting the current results, it is important to acknowledge the limitations that
are associated with the single subject case study research design. Firstly, as only
professional rugby league players participated in the current investigation the results
cannot be generalized to amateur players. In addition, due to the fact the study was
conducted in a contact sport, competition and field-based training induced minor injuries
may have hindered strength and power improvements. Furthermore, as the conclusions
are based on standard statistical methods of means ± SD and percentage change, we
acknowledge that the current results have a high degree of variability based on individual
and group interpretation. Therefore, it is important that future research use traditional null
hypothesis testing (t-tests), statistical correlation testing, effect sizes and larger sample
sizes.
Due to in-season competition constraints, the training loads performed by the TPT group
were prescribed off previous 1RM values for the bench press, back squat and power clean
exercises that was obtained within a four-week period prior to the commencement of the
study. Ideally, pre-intervention 1RM testing would have been completed immediately
prior to the commencement of the study to ensure an accurate prescription of the training
loads. However, as previously mentioned, the degree of variability in an athlete’s daily
maximum strength and readiness to train (Gonzalez-Badillo & Sanchez-Medina, 2010)
may have not necessarily represented each participant’s true maximum strength and
power capabilities.
It must be recognised that any mechanisms driving the observed improvements in
neuromuscular strength and power adaptations can only be theorized since alterations in
muscular morphology and nervous system adaptations were not assessed and is
consequently a limitation of the present investigation. However, the current investigation
did manage to identify the efficacy of VBT as a simple and effective training method in
an applied practical setting and the duration of the training cycle is a representation of a
realistic strength and power cycle in which professional athletes are exposed to during in-
season competition phases. Future VBT studies should look to analyse the muscular
morphological and nervous system adaptations associated with this modality of training
over extended training periods to determine its influence on enhancing neuromuscular
strength and power adaptations in elite sport settings.
117
Whilst the use of saliva collection for subsequent analysis of cortisol is a non-invasive
and practical method to determine resistance training stress in the current population, it
must also be recognised that the concurrent training methods employed in the current
investigation may have produced variations in Sal-C concentrations and induced
measurement error. In addition, it is possible that the cortisol responses may have been
influenced by the high impact nature of rugby league training and competition. Therefore,
future studies should look to investigate the hormonal responses to VBT under controlled
conditions to determine the influence VBT has on both anabolic and catabolic hormone
responses and its role in neuromuscular strength and power adaptations.
4.7 Practical applications
VBT may provide strength and conditioning practitioners with an effective
complementary resistance training modality in enhancing neuromuscular strength and
power adaptations in professional athletes. This training modality may be suited to both
pre-season and in-season competition training phases and may be of particular interest to
strength and conditioning practitioners who are not solely concerned with developing
maximal strength but may also be interested in velocity specific strength and power
adaptations across different load spectrums. Consequently, VBT may complement TPT
methods by overcoming its shortcomings by ensuring the accurate prescription of daily
strength and power training loads as opposed to arbitrarily prescribing training loads
based off an athlete’s pre-training block 1RM value. This approach will optimize the
intended focus of a resistance training session and may also provide motivational and
competitive advantages within elite sport settings which research has suggested to be
associated with positive strength and power adaptations (Randell et al., 2011). In addition,
performing isoinertial resistance training within specific VBT zones is a novel approach
that allows the autoregulation and individualization of both training volume and intensity
both within and between sets that is sensitive to daily fluctuations in biological status and
readiness to train. Therefore, VBT may aid in fatigue monitoring and reduce hormonal
training stress typically associated with resistance training. However, a limitation of
incorporating VBT in a practical setting is the expense of a LPT (i.e. Gymaware) that
may make VBT impractical for some athletes and practitioners. Therefore, alternatives
such as free mobile phone applications (e.g. Barsense and Bar Sensei) may make VBT
easier and more affordable to apply in practical settings.

118
CHAPTER FIVE: GENERAL SUMMARY

119
5.1 Summary
The design and implementation of resistance training programmes in semi-professional
rugby union and professional rugby league players have for decades utilized TPT methods
to improve neuromuscular strength and power performance at various percentages of
1RM. However, movement velocity is a variable that is gaining great interest among
strength and conditioning practitioners to achieve specific strength and power
performance outcomes. To the best of our knowledge, no study to date has investigated
the velocity profiles of semi-professional rugby union and professional rugby league
players across different loading spectrums for the bench press, back squat and power
clean exercises. In addition, no studies have investigated the influence of performing
resistance training within specific VBT zones and its subsequent effect on neuromuscular
strength and power adaptations. Therefore, this Master’s thesis sought to investigate the
overarching question of, “what is the influence of utilizing specific VBT zones across
different load spectrums as a means to optimize the development of strength and power
adaptations in semi-professional rugby union and professional rugby league players?”
The major conclusions of this thesis are that unique VBT zones exist for the bench press,
back squat and power clean exercises in semi-professional rugby union and professional
rugby league players. In addition, utilizing specific VBT zones for upper body and lower
body strength and whole body power exercises across different load spectrums is an
effective training modality to enhance neuromuscular strength and power performance
whilst limiting the psychological and physiological stress response in professional rugby
league players.
The first aim of this thesis was formulated due to the paucity of literature that currently
exists in examining the velocity profiles of semi-professional rugby union and
professional rugby league players across various loading spectrums. In addition, there
was limited literature regarding the identification of optimal velocity training zones to
enhance the development of neuromusuclar strength and power performance. As such,
the first experimental study in this thesis (Chapter three) sought to examine the velocity
profiles of semi-professional rugby union and professional rugby league players during
the bench press, back squat and power clean exercises across different loading spectrums
between 20-95% 1RM. The findings of this investigation revealed that unique VBT zones
exist for loads lifted between 20-95% 1RM for the bench press, back squat and power
clean exercises in semi-professional rugby union and professional rugby league players.

120
Specifically, rugby union and rugby league players are able to maximize bench press
starting strength > 1.40 m.s-1, speed-strength between 0.90-1.35 m.s-1, strength-speed
between 0.60-0.80 m.s-1, accelerative strength between 0.30-0.65 m.s-1 and, absolute
strength < 0.20 m.s-1. Additionally, back squat performance can be maximized for starting
strength > 1.00-1.20 m.s-1, speed-strength between 0.70-1.05 m.s-1, strength-speed
between 0.60-0.75 m.s-1, accelerative strength between 0.50-0.70 m.s-1 and, absolute
strength < 0.35 m.s-1. Furthermore, power clean performance can be maximized for
starting strength > 2.80-3.00 m.s-1, speed-strength between 2.50-2.85 m.s-1, strength-
speed between 2.35-2.40 m.s-1, accelerative strength between 2.05-2.30 m.s-1 and,
absolute power < 1.90 m.s-1. These results support the findings of Gonzalez-Badillo and
Sanchez-Medina (2010) who demonstrate that that an inextricable relationship exists
between relative load and the movement velocity that is attained during resistance training
with loads performed between 30% to 95% 1RM and that each percent of 1RM loading
intensity has it own unique velocity training zone (Gonzalez-Badillo & Sanchez-Medina,
2010). In addition, it was identified that subtle differences in velocities achieved for each
exercise exist between each code and that potential differences exist between positional
groups within each code. However, further investigation is needed with a larger sample
size in order to make comparisons between and within codes possible. The proposed VBT
zones may provide key advantages in the design of resistance training programmes by
focusing on enhancing specific skeletal muscle performance traits within a periodized
strength and power resistance training programme. Subsequently, it was concluded that
by utilizing the suggested VBT zones, strength and power performance can be maximized
by allowing strength and conditioning practitioners to accurately prescribe training loads
based on an athlete’s ability to maintain a prescribed movement velocity.
The second aims of this thesis was to; 1) develop a better understanding of the specific
VBT zones identified in Study one as a training stimulus to elicit subsequent strength and
power adaptations in professional rugby league players and, 2) examine and compare the
psychological wellbeing and salivary cortisol stress response between VBT and TPT
programmes to determine if VBT induces the same psychological and physiological stress
response as TPT methods in professional rugby league players. As such, the second
experimental study in this thesis (Chapter four) employed a 5-week training intervention
and utilized a single subject case study design where five professional rugby league
players were randomly assigned to the either the VBT group (n = 3) or TPT group (n =
2). Substantial improvements in CMJ and SJ performance were observed in the VBT

121
group participant’s. In addition, greater increases in training load were performed by the
VBT group when compared to the intended values based off traditional percentage based
methods whilst no change was observed in the TPT group. Furthermore, although the
VBT group performed greater training loads, no substantial variance in reported session
RPE values were observed between both groups. A novel finding of this investigation
was that the VBT group reported higher weekly wellness questionnaire scores and elicited
less Sal-C training stress during light (+12.8 vs. +52.3%) and heavy (+98.9 vs. +472.6%)
intensity training weeks when compared to the TPT group. These results suggest that
VBT allows greater training volumes to be performed without incurring excessive
perceived internal load. In addition, VBT allows for enhanced neuromuscular recovery
between training sessions as determined by the VBT participants’ greater perceived
psychological wellness scores and optimized readiness to train. Thus, it is supported that
performing isoinertial resistance training within specific VBT zones across different
loading spectrums is an effective training stimulus to enhance neuromuscular strength
and power adaptations whilst enhancing training efficiency in professional rugby league
players during the in-season competition phase.
5.2 Future research
The studies in this thesis have provided a deeper insight into VBT facilitating greater
improvements in strength and power performance when compared to TPT methods
during the in-season competition phase in professional rugby league players. These
findings have also highlighted potential avenues for future research that may continue to
develop our understanding of how VBT may be an effective complementary resistance
training method to enhance neuromuscular strength and power performance in semi-
professional rugby union and professional rugby league environments.
Future research into the influence VBT has on enhancing neuromuscular strength and
power adaptations in semi-professional rugby union and professional rugby league
players should include the effect of this training modality during the pre-season
preparation period. This period usually lasts four months during which time the greatest
training volumes and loads are incurred which typically results in the greatest
improvements in strength and power capabilities. Knowledge of the magnitude VBT has
on not only enhancing neuromuscular strength and power performance but also limiting
the accumulation of excessive metabolic by products and neuromuscular fatigue during
122
both pre-season and in-season phases in semi-professional rugby union and professional
rugby league players may have important practical applications to ensure strength and
power capabilities are maintained or enhanced throughout pre-season and in-season
training phases.
Future research should also employ similar methods of testing and training to the current
interventional studies along with examining the velocity profiles of additional key lifts
such as the push press and bent over row and/or derivatives of Olympic lifts such as clean
pulls and snatch pulls. In addition, future research should look to examine and compare
the velocity profiles between rugby union and rugby league positional groups with larger
sample sizes. It is recommended that rugby union and rugby league players have a sound
degree of the technical skill and knowledge of the prescribed exercises before employing
the recommended testing and training protocols. In addition, the technical ability of the
rugby union and rugby league players should be similar to those used in this thesis to
allow for a comparsion of the results.
Tracking the velocity specific intrinsic skeletal muscle adaptations of rugby union and
rugby league players should include habitual assessment over training blocks that will
provide advantages in assessing an athlete’s progress over a spectrum of velocity
demands and determine the efficacy of a prescribed strength and power training stimulus.
For example, although an athlete’s 1RM value may have not improved following a period
of strength and power training, skeletal muscle velocity capabilities may have improved
at various submaximal loads. Finally, by examining the muscle architectural responses
and adaptations to VBT a better understanding of the specific neuromuscular strength and
power adaptations to VBT will be gained.
5.3 Practical applications
The interventional studies in this thesis were designed to enhance resistance training
prescription and to provide strength and conditioning practitioners with alternative
resistance training strategies to improve neuromuscular strength and power performance
in semi-professional rugby union and professional rugby league environments.
The velocity profiling information presented in Chapter three has provided a unique
understanding of the specific VBT zones that may optimize neuromusuclar strength and
power performance for the bench press, back squat and power clean exercises across

123
different load spectrums of 20-95% 1RM in semi-professional rugby union and
professional rugby league players. The findings of this investigation provide strength and
conditioning practitioners with important information to enhance the quality of work or
effort performed by an athlete during a resistance training session. In addition, the
suggested VBT zones allow strength and conditioning practitioners to prescribe accurate
training loads based on an athlete’s ability to maintain a prescribed movement velocity
that will consequently optimize the development of the intended skeletal muscle
performance trait that includes; starting strength, speed-strength, strength-speed,
accelerative strength and absolute strength/power.
Chapter four demonstrates that performing isoinertial resistance training within specific
VBT zones across different loading spectrums is an effective training stimulus to enhance
neuromuscular strength and power adaptations in professional rugby league players.
Strength and conditioning practitioners can utilize a VBT approach that includes utilizing
velocity zones or velocity stops rather than percentages of 1RM. This method provides
numerous advantages, such as prescribing training loads that are sensitive to daily
fluctuations in maximum strength and readiness to train during in-season strength and
power training blocks. Combining both velocity zones and velocity stops allows for the
autoregulation of daily training volume and load both within sets and between sets which
may limit excessive neuromuscular fatigue. Consequently, this will allow maximal lifting
velocities to be maintained throughout training blocks where subsequent neuromuscular
strength and power performance can be enhanced during short in-season strength and
power training phases. Furthermore, a VBT approach will enhance training efficiency and
the immediate knowledge of movement velocities achieved for a given exercise will
provide motivational and competitive advantages which research has suggested to be
associated with positive strength and power adaptations.
124
References
Aagaard, P., Simonsen, E. B., Andersen, J. L., Magnusson, P., & Dyhre-Poulsen, P.
(2002). Increased rate of force development and neural drive of human skeletal
muscle following resistance training. Journal of Applied Physiology, 93(4),
1318-1326.
Aardal-Eriksson, E., Karlberg, B. E., & Holm, A. C. (1998). Salivary cortisol an
alternative to serum cortisol determinations in dynamic function tests. Clinical
Chemistry and Laboratory Medicine, 36(4), 215-222.
Abe, T., Kumagai, K., & Brechue, W. F. (2000). Fascicle length of leg muscles is
greater in sprinters than distance runners. Medicine and Science in Sports and
Exercise, 32(6), 1125-1129.
Adams, G. R., & Bamman, M. M. (2012). Characterization and regulation of
mechanical loading-induced compensatory muscle hypertrophy. Comprehensive
Physiology, 2(4), 2829-2870.
Adams, K., O'Shea, J. P., O'Shea, K. l., & Climstein, M. (1992). The effect of ten weeks
of squat, plyometric, squat-plyometric training on power production. Journal of
Applied Sport Science Research, 6(1), 36-41.
Allen, D. G., Lamb, G. D., & Westerblad, H. (2008). Skeletal muscle fatigue: Cellular
mechanisms. Physiology Review, 88(1), 287-332.
Almasbakk, B., & Hoff, J. (1996). Coordination, the determinant of velocity specificity?
Journal of Applied Physiology, 81(5), 2046-2052.
Anderson, L. L., & Aagaard, P. (2006). Influence of maximal muscle strength and
intrinsic muscle contractile properties on contractile rate of force development.
European Journal of Applied Physiology, 96(1), 46-52.
Anderson, L. L., Anderson , J. L., Zebis, M. K., & Aargaard, P. (2010). Early and late
rate of force development : Differential adaptive responses to resistance
training? Scandanavian Journal of Medicine and Science in Sports, 20(1), 162-
169.
Argus, C. K., Gill, N. D., Keogh, J. W., Hopkins, W. G., & Beaven, M. C. (2009).
Changes in strength, power, and steroid hormones during a professional rugby
union competition. Journal of Strength and Conditioning Research, 23(5), 1583-
1592.
Argus, C. K., Gill, N. D., Keogh, J. W., McGuigan, M. R., & Hopkins, W. G. (2012).
Effects of two contrast training programs on jump performance in rugby union
players during a competition phase. International Journal of Sports Physiology
and Performance, 7(1), 68-75.
Baker, D. (2002). Differences in strength and power among junior-high, senior-high,
college-aged, and elite professional rugby league players. Journal of Strength
and Conditioning Research, 16(4), 581-585.
Baker, D. G., & Newton, R. U. (2008). Comparison of lower body strength, power,
acceleration, speed, agility, and sprint momentum to describe and compare
playing rank among professional rugby league players. Journal of Strength and
Conditioning Research, 22(1), 153-158.
Baker, D. G., & Newton, R. U. (2006). Adaptations in upper-body maximal strength
and power output resulting from long-term resistance training in experienced
strength-power athletes. Journal of Strength and Conditioning Research, 20(3),
541-546.
Baker, D., & Newton, R. U. (2005). Acute effect on power output of alternating an
agonist and anatagonist muscle exercise during complex training. Journal of
Strength and Conditioning Research, 19(1), 202-205.

125
Baker, D., Nance, S., & Moore, M. (2001a). The load that maximizes the average
mechanical power output during jump squat in power-trained athletes. Journal
of Strength and Conditioning Research, 15(1), 92-97.
Baker, D., Nance, S., & Moore, M. (2001b). The load that maximizes the average
mechanical power output during explosive bench press throws in highly trained
athletes. Journal of Strength and Conditioning Research, 15(1), 20-24.
Baker, D., Wilson, G., & Carlyon, R. (1994). Periodization: The effect on strength of
manipulating volume and intensity. Journal of Strength and Conditioning
Research, 8(4), 235-242.
Bazuelo-Ruiz, B., Padial, P., Garcia-Ramos, A., Morales-Artacho, A. J., Miranda, M.
T., & Feriche, B. (2015). Predicting maximal dynamic strength from the load-
velocity relationship in squat exercise. Journal of Strength and Conditioning
Research, 29(7), 1999-2005.
Behm, D., & Sale, D. (1993). Velocity Specificity of Resistance Training. Sports
Medicine, 15(6), 374-388.
Berger, R. A. (1962). Optimum repetitions for the development of strength. Research
Quarterly. American Association for Health, Physical Education and
Recreation., 33(3), 334-338.
Bevan, H. R., Bunce, P. J., Owen, N. J., Bennett, M. A., Cook, C. J., Cunningham, D. J.,
. . . Kilduff, L. P. (2010). Optimal loading for the development of peak power
output in professional rugby players. Journal of Strength and Conditioning
Research, 24(1), 43-47.
Bevan, H. R., Owen, N. J., Cunningham, D. J., Kilduff, L. P., & Kingsley, M. I. (2009).
Complex training in professional rugby players: Influence of recovery time on
upper-body power output. Journal of Strength and Conditioning Research,
23(6), 1780-1785.
Blazevich, A. J. (2006). Effects of physical training and detraining, immobilisation,
growth and aging on human fascicle geometry. Sports Medicine, 36(12), 1003-
1017.
Blazevich, A. J., & Jenkins, D. G. (2002). Effect of movement speed of resistance
training on sprint and strength performance in concurrently training elite junior
sprinters. Journal of Sports Sciences, 20(12), 981-990.
Blazevich, A. J., & Sharp, N. C. (2005). Understanding muscle architectural adaptation:
Macro and micro level research. Cells Tissue Organs, 181(1), 1-10.
Blazevich, A. J., Gill, N. D., Bronks, R., & Newton, R. U. (2003). Training-specific
muscle architecture adaptation after 5-weeks training in athletes. Medicine and
Science in Sports and Exercise, 35(12), 2013-2022.
Bondarchuk, A. P. (2014). Olympian manual for strength and size. Muskegon, MI:
Ultimate Athlete Concepts.
Bouget, M., Rouveix, M., Michaux, O., Pequignot, J. M., & Filaire, E. (2006).
Relationships among training stress, mood and dehydroepiandrosterone
sulphate/cortisol ratio in female cyclists. Journal of Sports Sciences, 24(12),
1297-1302.
Bourgeois, A., Leunes, A., & Meyers, M. (2010). Full-scale and short-form of the
profile of mood states: A factor analytic comparison. Journal of Sports
Behaviour, 33(4), 355-376.
Buchheit, M., Racinais, S., Bilsborough, J. C., Bourdon, P. C., Voss, S. C., Hocking, J.,
. . . Coutts , A. J. (2013). Monitoring fitness, fatigue and running performance
during a preseason training camp in elite football players. Journal of Science
and Medicine in Sport, 16(6), 550-555.
126
Bosco, C., Viitasalo, J. T., Komi, P. V., & Luhtanen, P. (1982). Combined effect of
elastic energy and myoelectrical potentiation during stretch-shortening cycle
exercise. Acta Physiologica Scandinavica, 114(4), 557-565.
Braith, R. W., Graves, J. E., Legget, S., & Pollock, M. L. (1993). Effect of training on
the relationship between maximal and submaximal strength. Medicine and
Science in Sports and Exercise, 25(1), 132-138.
Brillon, D. J., Zheng, B., Campbell, R. G., & Matthews, D. E. (1995). Effect of cortisol
on energy expenditure and amino acid metabolism in humans. American Journal
of Physiology, 268, E501-513.
Brzycki, M. (1993). Strengh testing - Predicitng a one-rep max from reps-to-fatigue.
Journal of Physical Education, Recreation and Dance, 64(1), 88-90.
Buckthorpe, M. W., Hannah, R., Pain, T. G., & Folland, J. P. (2012). Reliability of
neuromuscular measurements during explosive isometric contractions, with
special reference to electromyography normalization techniques. Muscle Nerve,
46(4), 566-576.
Burgener, M. (1994). Constructing a year-round strength and conditioning program for
high school athletes. Strength and Conditioning, 16(2), 47-53.
Caiozzo, V. S., Perrine, J. J., & Edgerton, V. R. (1981). Training induced alterations of
the in vivo force-velocity relationship of human muscle. Journal of Applied
Physiology, 51(3), 750-754.
Campos, G. E., Luecke, T. J., Wendeln, H. K., Toma, K., Hagerman, F. C., Murray, T.
F., . . . Staron, R. S. (2002). Muscular adaptations in response to three different
resistance-training regimens: Specificity of repetition maximum training zones.
European Journal of Applied Physiology, 88(1-2), 50-60.
Cardinale, M., & Stone, M. H. (2006). Is testosterone influencing explosive
performance? Journal of Strength and Conditioning Research, 20(1), 103-107.
Carlock, J. M., Smith, S. L., Hartman, M. J., Morris, R. T., Ciroslan, D. A., Pierce, K.
C., . . . Stone, M. H. (2004). The relationship between vertical jump power
estimates and weightlifting ability: A field-test approach. Journal of Strength
and Conditioning Research, 18(3), 534-539.
Carpentier, A., Duchateau, J., & Hainaut, K. (1996). Velocity-dependent muscle
strategy during plantar-flexion in humans. Journal of Electromyography and
Kinesiology, 6(4), 225-233.
Chimera, N. J., Swanik, K. A., Swanik, C. B., & Straub, S. J. (2004). Effects of
plyometric training on muscle-activation strategies and performance in female
athletes. Journal of Athletic Training, 39(1), 24-31.
Coburn, J. W., Housh, T. J., Malek, M. H., Weir, J. P., Cramer, J. T., Beck, T. W., &
Johnson, G. O. (2006). Neuromuscular responses to three days of velocity-
specific isokinetic training. Journal of Strength and Conditioning Research,
20(4), 892-898.
Cohen, J. (1992). A power primer. Psychological Bulletin, 112(1), 155-159.
Comfort, P., Graham-Smith, P., Mathews, M. J., & Bamber, C. (2011). Strength and
power characteristics in english elite rugby league players. Journal of Strength
and Conditioning Research, 25(5), 1374-1384.
Cormie, P., McBride, J. M., & McCaulley, G. O. (2007). Validation of power
measurement techniques in dynamic lower body resistance exercises. Journal of
Applied Biomechanics, 23, 103-118.
Cormie, P., McCaulley, G. O., & McBride, J. M. (2007). Power versus strength-power
jump squat training: Influence on the load-power relationship. Medicine and
Science in Sports and Exercise, 39(6), 996-1003.

127
Cormie, P., McCaulley, G. O., Triplett, N. T., & McBride, J. M. (2007). Optimal
loading for maximal power output during lower-body resistance exercises.
Medicine and Science in Sports and Exercise, 39(2), 340-349.
Cormie, P., McGuigan, M. R., & Newton, R. U. (2011). Developing maximal
neuromuscular power. Part 2 - Training considerations for improving maximal
power production. Sports Medicine, 41(2), 125-146.
Coutts, A., & Cormack, S. J. (2014). Monitoring the training response. In: High-
performance training for sports. Eds: Joyce, D. & Lewindon, D. Champaign, IL:
Human Kinetics Publishers.
Coyle, E. F., Feiring, D. C., Rotkis, T. C., Cote, R. W., Roby, F. B., Lee, W., &
Wilmore, J. H. (1981). Specificity of power improvements through slow and fast
isokinetic training. Journal of Applied Physiology, 51(6), 1437-1442.
Crewther, B., Cronin, J., & Keogh, J. (2005). Possible stimuli for strength and power
adaptation: Acute mechanical responses. Sports Medicine, 35(11), 967-989.
Crewther, B. T., Kilduff, L. P., Cook, C. J., Middleton, M. K., Bunce, P. J., & Yang, G.
Z. (2011a). The acute potentiating effects of back squats on athlete performance.
Journal of Strength and Conditioning Research, 25(12), 3319-3325.
Crewther, B. T., Kilduff, L. P., Cunningham, D. J., Cook, C., Owen, N., & Yang, G. Z.
(2011b). Validating two systems for estimating force and power. International
Journal of Sports Medicine, 32(4), 254-258.
Crewther, B. T., Lowe, T., Weatherby, R. P., Gill, N., & Keogh, J. (2009).
Neuromuscular performance of elite rugby union players and relationships with
salivary hormones. Journal of Strength and Conditioning Research, 23(7), 2046-
2053.
Cronin, J. B., McNair, P. J., & Marshall, R. N. (2002). Is velocity-specific strength
training important in improving functional performance? Journal of Sports
Medicine and Physical Fitness, 42(3), 267-273.
Cronin, J. B., McNair, P. J., & Marshall, R. N. (2003). Force-velocity analysis of
strength-training techniques and load: Implications for training strategy and
research. Journal of Strength and Conditioning Research, 17(1), 148-155.
Cronin, J., & Crewther, B. (2004b). Training volume and strength and power
development. Journal of Science and Medicine in Sport, 7(2), 144-155.
Cronin, J. B., Raewyn, H. D., & McNair, P. J. (2004a). Reliability and validity of linear
position transducer for measuring jump performance. Journal of Strength and
Conditioning Research, 18(3), 590-593.
Cross, M. R., Brughelli, M., Brown, S. R., Samozino, P., Gill, N. D., Cronin, J. B., &
Morin, J. B. (2015). Mechanical properties of sprinting in elite rugby union and
rugby league. International Journal of Sports Physiology and Performance.,
10(6), 695-702.
Cunniffe, B., Proctor, W., Baker, J. S., & Davies, B. (2009). An evalutaion of the
physiological demands of elite rugby union using global positioning system
tracking software. Journal of Strength and Conditioning Research, 23(4), 1195-
1203.
Davis, H., Orzeck, T., & Keelan, P. (2007). Psychometric item evaluations of the
recovery-stress questionnaire for athletes. Psychology of Sport and Exercise,
8(6), 917-938.
Day, M. L., McGuigan , M. R., Brice, G., & Foster , C. (2004). Monitoring exercise
intensity during resistance training using the session RPE scale. Journal of
Strength and Conditioning Research, 18(2), 353-358.
de Kloet, R. E., Joels, M., & Holsboer, F. (2005). Stress and the brain: from adaptation
to disease. Nature Reviews Neuroscience, 6(6), 463-475.
128
de Oliveira, F. B., Rizatto, G. F., & Denadai, B. S. (2013). Are early and late of force
development differently influenced by fast-velocity resistance training? Clinical
Physiology and Functional Imaging, 33(4), 282-287.
De Villiers, N., & Venter , R. E. (2015). Optimal training loads for the hang clean and
squat jump in under-21 rugby union players. African Journal for Physical,
Health Education, Recreation and Dance, 21(2), 665-674.
Delecluse , C., Van Coppenolle, H., Willems, E., Van Leemputte, M., Diels, R., &
Goris, M. (1995). Influence of high-resistance and high velocity training on
sprint performance. Medicine and Science in Sports and Exercise, 27(8), 1203-
1209.
Deutsch, M. U., Kearney, G. A., & Rehrer, N. J. (2007). Time-motion analysis of
professional rugby union players during match-play. Journal of Sports Sciences,
25(4), 461-472.
Drinkwater, E. J., Galna, B., McKenna, M. J., Hunt, P. H., & Pyne, D. B. (2007).
Validation of an optical encoder during free weigth resistance movements and
analysis of bench press sticking point power during fatigue. Journal of Strength
and Conditioning Research, 21(2), 510-517.
Duchateaus, J., & Hainaut, K. (1984). Isometric or dynamic training: Differential effects
on mechanical properties of human muscle. Journal of Applied Physiology,
56(2), 296-301.
Duplessis, C., Rascona, D., Cullum, M., & Yeung, E. (2010). Salivary and free cortisol
evaluation. Military Medicine, 175(5), 340-346.
Duthie, G., Pyne, D., & Hooper, S. (2003). Applied Physiology and Game Analysis of
Rugby Union. Sports Medicine, 33(13), 973-991.
Enoka, R. M. (1997). Neural adaptations with chronic physical activity. Journal of
Biomechanics, 30(5), 447-455.
Fleck, S. J. (1999). Periodized strength training: A critical review. Journal of Strength
and Conditioning Research, 13(1), 82-89.
Fleck, S. J., & Kraemer, W. J. (2004). Basic principles of resistance training exercise
and prescription. In: designing resistance training programs. Champaign, IL:
Human Kinetics.
Folland, J. P., & Williams, A. G. (2007). The adaptations to strength training:
Morphological and neurological contributions to increased strength. Sports
Medicine, 37(2), 145-168.
Folland, J. P., Irish, C. S., Roberts, J. C., Tarr, J. E., & Jones, D. A. (2002). Fatigue is
not a necessary stimulus for strength gains during resistance training. British
Journal of Sports Medicine, 36(5), 370-374.
Foster, C., Florhaug, J. A., Franklin, J., Gottschal, L., Hrovatin, L. A., Parker, S., . . .
Dodge, C. (2001). A new approach to monitoring exercise training. Journal of
Strength and Conditioning Research, 15(1), 109-115.
Foster, C., Hector, L. L., Welsh, R., & Schrager, M. (1995). Effects of specific vs cross
training on running performance. European Journal of Applied Physiology,
70(4), 367-372.
Fry, A. C. (2004). The role of resistance exercise intensity on muscle fibre adaptations.
Sports Medicine, 34(10), 663-679.
Fukunaga, T., Kawakami, Y., Kuno , S., Funato, K., & Fukahiro, S. (1997). Muscle
architecture and function in humans. Journal of Biomechanics, 30(5), 457-463.
Gabbett, T. J. (2005a). Science of Rugby League: A review. Journal of Sports Sciences,
23(9), 961-976.
Gabbett, T. J. (2005b). A comparison of physiological and anthropometric
characteristics among playing positions in junior rugby league players. British
Journal of Sports Medicine, 39(9), 675-680.
129
Gabbett, T., King, T., & Jenkins, D. (2008). Applied Physiology of Rugby League.
Sports Medicine, 38(2), 119-138.
Gabbett, T. J., Jenkins, D. G., & Abernethy, B. (2011b). Correlates of tackling ability in
high performance rugby league players. Journal of Strength and Conditioning
Research, 25(1), 72-79.
Gans, C., & Gaunt, A. S. (1991). Muscle architecture in relation to function. Journal of
Biomechanics, 24(Suppl 1), 53-65.
Gastin, P. B., Denny, M., & Dean, R. (2013). Perceptions of wellness to monitor
adaptive responses to training and competition in elite Australian football.
Journal of Strength and Conditioning Research, 29(9), 2518-2526.
Gonzalez-Badillo, J. J., & Sanchez-Medina, L. (2010). Movement velocity as a measure
of loading intensity in resistance training. International Journal of Sports
Medicine, 31(5), 347-352.
Gonzalez-Badillo, J. J., Pareja-Blanco, F., Rodriguez-Rosell, D., Abad-Herencia, J. L.,
del Ojo-Lopez, J. J., & Sanchez-Medina, L. (2015). Effects of velocity-based
resistance training on young soccer players of different ages. Journal of Strength
and Conditioning Research, 29(5), 1329-1338.
Gonzalez-Badillo, J. J., Rodriguez-Rosell, D., Sanchez-Medina, L., Gorostiaga, E. M.,
& Pareja-Blanco, F. (2014). Maximal intended velocity training induces greater
gains in bench press performance than deliberately slower half-velocity training.
European Journal of Sport Science, 14(8), 772-781.
Goto, K., Takahashi, K., Yamamoto, M., & Takamatsu, K. (2008). Hormone and
recovery responses to resistance exercise with slow movement. Journal of
Physiological Sciences, 58(1), 7-14.
Gruber, M., & Gollhofer, A. (2004). Impact of sensorimotor training on the rate of force
development and neural activation. European Journal of Applied Physiology,
92(1-2), 98-105.
Gutierrez-Davila, M., Amaro, F. J., Garrido, J. M., & Rojas, J. (2014). An analysis of
two styles of arm action in the vertical countermovement jump. Sports
Biomechanics, 13(2), 135-143.
Haff, G. G. (2010). Quantifying workloads in resistance training: A brief review.
Strength and Conditioning Journal, 10(19), 31-40.
Haff, G. G., Stone, M., O'Bryant, H. S., Harman, E., Dinan, C., & Johnson, R. (1997).
Force-time dependent characteristics of dynamic and isometric muscle actions.
Journal of Strength and Conditioning Research, 11(4), 269-272.
Hakkinen, K. (1994). Neuromuscular adaptation during strength training, aging,
detraining and immobilization. Physical and Rehabilitation Medicine, 6, 161-
198.
Hakkinen, K., Alen, M., & Komi, P. V. (1985). Changes in isometric force-and
relaxation-time, electromyographic and muscle fibre characteristics of human
skeletal muscle during strength training and detraining. Acta Physiologica
Scandinavica, 125(4), 573 .
Hakkinen, K., Pakarinen, A., Alen, M., Kauhanen, H., & Komi, P. V. (1987).
Relationships between training volume, physical performance capacity, and
serum hormone conentrations during prolonged training in elite weight lifters.
International Journal of Sports Medicine, 8(Suppl), 61-65.
Hakkinen, K., Allen, M., Kraemer, W. J., Gorostiaga, E., Izquiredo, M., Rusko, H., . . .
Paavolainen, L. (2003). Neuromuscular adaptations during concurrent strength
and endurance training versus strength training. European Journal of Applied
Physiology, 89(1), 42-52.
Halson, S. L. (2014). Monitoring training load to understand fatigue in athletes. Sports
Medicine, 44(2), 139-147.
130
Halson, S. L. (2014). Monitoring training load to understand fatigue in athletes. Sports
Medicine, 44(2), 139-147.
Hansen, K. T., Cronin, J. B., & Newton, M. J. (2011). The reliability of linear position
transducer, force plate and combined measurement of explosive power-time
variables during loaded jump squat in elite athletes. Sport Biomechanics, 10(1),
46-58.
Hansen, S., Kvorning, T., Kjaer, M., & Sjogaard, G. (2001). The effect of short-term
strength training on human skeletal muscle: the importance of physiologically
elevated hormone levels. Scandanavian Journal of Medicine and Science in
Sports, 11(6), 347-354.
Harries, S. K., Lubans, D. R., & Callister, R. (2015). Comparison of resistance training
progression models on maximal strength in sub-elite adolescent rugby union
players. Journal of Science and Medicine in Sport, 19(2), 1-7.
Harris, G. R., Stone, M. H., O'Bryant, H. S., Proulx, C. M., & Johnson, R. L. (2000).
Short-term performance effects of high power, high force, or combined weight-
training methods. Journal of Strength and Conditioning Research, 14(1), 14-20.
Harris, N., Cronin, J., & Keogh, J. (2007). Contraction force specificity and its
relationship to functional performance. Journal of Sports Sciences, 25(2), 201-
212.
Harris, N. K., Cronin, J. B., & Hopkins, W. G. (2007). Power outputs of a machine
squat-jump across a spectrum of loads. Journal of Strength and Conditioning
Research, 21(4), 1260-1264.
Harris, N. K., Cronin, J. B., Hopkins, W. G., & Hansen, K. T. (2008). Squat jump
training at maximal power loads vs. heavy loads: effect on sprint ability. Journal
of Strength and Conditioning Research, 22(6), 1742-1749.
Harris, N., Cronin, J., Taylor, K., Boris, J., & Sheppard, J. (2010). Understanding
position transducer technology for strength and conditioning practitioners.
Strength and Conditioning Journal, 32(4), 66-79.
Hatfield, D. L., Kraemer, W. J., Spiering, B. A., Hakkinen, K., Volek, J. S., Shimano,
T., . . . Maresh, C. M. (2006). The impact of velocity of movement on
performance in resistance exercise. Journal of Strength and Conditioning
Research, 20(4), 760-766.
Headley, S. A., Henry, K., Nindl, B. C., Thompson, B. A., Kraemer, W. J., & Jones, M.
T. (2011). Effects of lifitng tempo on 1 repetition maximum and hormonal
repsonses to a bench press protocol. Journal of Strength and Conditioning
Research, 25(2), 406-413.
Hellsten-Westing, Y., Norman, B., Balsom, P. D., & Sjodin, B. (1993). Decreased
resting levels of adenine nucleotides in human skeletal muscle after high-
intensity training. Journal of Applied Physiology, 74(5), 2523-2528.
Hoffman, J. R., Cooper, J., Wendell, M., & Kang, J. (2004). Comparison of olympic vs.
traditional power lifitng training programs in football players. Journal of
Strength and Conditioning Research, 18(1), 129-135.
Hooper, S., & Mackinnon, L. (1995). Monitoring overtraining in athletes. Sports
Medicine, 20(5), 321-327.
Hori, N., Newton, R. U., Andrews, W. A., Kawamori, N., McGuigan, M. R., & Nosaka,
K. (2008). Does the hang power clean differentiate performance of jumping,
sprinting, and changing of direction? Journal of Strength and Conditioning
Research, 22(2), 412-418.
Hunter, G. R., Seelhorst, D., & Snyder, S. (2003). Comparison of metabolic and heart
rate responses to super slow vs. traditional resistance training. Journal Strength
and Conditioning Research, 17(1), 76-81.

131
Ikegawa, S., Funato, K., Tsunado, N., Kanehisa, H., Fukunaga, T., & Kawakami, Y.
(2008). Muscle force per cross-sectional area in inversely related with pennation
angle in strength trained athletes. Journal of Strength and Conditioning
Research, 22(1), 128-131.
Ivy, J. L., Withers, R. T., Brose, G., Maxwell, B. D., & Costill, D. L. (1981). Isokinetic
contractile properties of the quadriceps with relation to fiber type. European
Journal of Applied Physiology and Occupational Physiology, 47(3), 247-255.
Izquierdo, M., Gonzalez-Badillo, J. J., Hakkinen, K., Ibanez, J., Altadill, A., Eslava, J.,
& Gorostiaga, E. M. (2006a). Effect of loading on unintentional lifting velocity
declines during single sets of repetitions to failure during upper and lower
extremity muscle actions. International Journal of Sports Medicine, 27(9), 718-
724.
Izquierdo, M., Ibanez, J., Gonzalez-Badillo, J. J., Hakkinen, K., Ratamess, N. A.,
Kraemer, W. J., . . . Gorostiaga, E. M. (2006b). Differential effects of strength
training leading to failure versus not to failure on hormonal responses, strength,
and muscle power gains. Journal of Applied Physiology, 100(5), 1647-1656.
Jidovtseff, B., Harris, N. K., Crielaard, J. M., & Cronin, J. B. (2011). Using the load-
velocity relationship for 1RM prediction. Journal of Strength and Conditioning
Research, 25(1), 267-270.
Jones, K., Bishop, P., Hunter, G., & Fleisig, G. (2001). The effects of varying
resistance-training loads on intermediate and high velocity specific adaptations.
Journal of Strength and Conditioning Research, 15(3), 349-356.
Jones, D. A., Rutherford, O. M., & Parker, D. F. (1989). Physiological changes in
skeletal muscle as a result of strength training. Quartetly Journal of
Experimental Physiology, 74(3), 233-256.
Jovanovic, M., & Flanagan, E. P. (2014). Researched applications of velocity based
strength training. Journal of Australian Strength and Conditioning, 22(2), 58-69.
Jurimae, J., Abernethy, P. J., Blake, K., & McEniery, M. T. (1996). Changes in the
mysosin heavy chain isoform profile of the triceps brachii muscle following 12
weeks of resistance training. European Journal of Applied Physiology, 74(3),
287-292.
Jurimae, J., Abernethy, P. J., Quigley, B. M., Blake, K., & McEniery, M. T. (1997).
Differences in muscle contractile characteristics among body builders,
endurance trainers and control subjects. European Journal of Applied
Physiology, 75(4), 357-362.
Kanehisa, H., & Miyashita, M. (1983). Specificity of velocity in strength training.
Journal of Applied Physiology, 52(1), 104-106.
Kaneko, M., Fuchimoto, T., Toji, H., & Suei, K. (1983). Training effect of different
loads on the force-velocity relationship and mechanical power output in human
muscle. Scandanavian Journal of Sports Science, 5, 50-55.
Kawakami, Y., Abe, T., & Fukunaga, T. (1993). Muscle-fiber pennation angles are
greater in hypertrophied than in normal muscles. Journal of Applied Physiology,
74(6), 2740-2744.
Kawamori, N., & Haff, G. G. (2004). The optimal training load for development of
muscular power. Journal of Strength and Conditioning Research, 18(3), 675-
684.
Kawamori, N., Crum, A. J., Blumert, P. A., Kulik, J. R., Childers, J. T., Wood, J. A., . . .
Haff, G. G. (2005). Influence of different relative intensities on power output
during the hang power clean: Identification of the optimal load. Journal of
Strength and Conditioning Research, 19(3), 698-708.

132
Kellman, M. (2010). Preventing overtraining in athletes in high-intensity sports and
stress/recovery monitoring. Journal of Medicine and Science in Sports, 20(Suppl
2), 95-102.
Kellman, M., & Gunther, K. D. (2000). Changes in stress and recovery in elite rowers
during the preparation for the Olympic Games. Medicine and Science in Sports
and Exercise, 32(3), 676-683.
Kellman, M., & Kallus, K. W. (2001). Recovery-stress questionnaire for athletes: User
manual. Champaign, IL: Human Kinetics.
Kellman, M., Altenburg, D., Lormes, W., & Steinacker, J. M. (2001). Assessing stress
and recovery during the preparation for the world championships in rowing. The
Sport Pscychologist, 15(2), 151-167.
Kentta, G., & Hassmen, P. (1998). Overtraining and recovery. A conceptual model.
Sports Medicine, 26(1), 1-16.
Kentta, G., Hassmen, P., & Raglin, J. S. (2006). Mood state monitoring of training and
recovery in elite kayakers. European Journal of Sport Science, 6(4), 245-253.
Kilduff, L. P., Bevan, H., Owen, N., Kingsley, M. I., Bunce, P., Bennett, M., &
Cunningham, D. (2007). Optimal loading for peak power output during the hang
power clean in professional rugby players. International Journal of Sports
Physiology and Performance, 2(3), 260-269.
Komi, P. V., & Gollhofer, A. (1997). Stretch reflexes can have an important role in
force enhancement during SSC exercise. Journal of Applied Biomechanics,
13(4), 451-460.
Kraemer, W. J., & Fleck, S. (2007). Optimizing strength training: Designing nonlinear
periodization workouts. Champaign, IL: Human Kinetics.
Kraemer, W. J., & Newton, R. U. (2000). Training for muscular power. Physical
Medicine and Rehabilitation, 11(2), 341-368.
Kraemer, W. J., & Ratamess, N. A. (2005). Hormonal responses and adaptations to
resistance exercise and training. Sports Medicine, 35(4), 339-361.
Kraemer, W. J., Fleck, S. J., & Evans, W. J. (1996). Strength and power training;
Physiological mechanisms of adaptation. Exercise and Sport Sciences Reviews,
24, 363-397.
Kraemer, J. B., Stone, M. H., O'Bryant, H. S., Conley, M. S., Johnson, R. L., & Nieman,
D. C. (1997). Effects of single vs multiple sets of weight training: Impact of
volume, intensity, and variation. Journal of Strength and Conditioning
Research, 11(3), 143-147.
Kraemer, W. J., Marchitelli, L., Gordon, S. E., Harman, E., Dziados, J. E., Mello, R., . .
. Fleck, S. J. (1990). Hormonal and growth factor responses to heavy resistance
exercise protocols. Journal of Apllied Physiology, 69(4), 1442-1450.
Kraemer, W. J., & Ratamess, N. A. (2004). Fundamentals of resistance training:
Progession and exercise prescription. Medicine and Science in Sports and
Exercise, 36(4), 674-688.
Kraemer, W. J., Patton, J. F., Gordon, S. E., Harman, E. A., Deschnes, K. R., Reynolds,
K., . . . Dziados, J. E. (1995). Compatibility of high-intensity strength and
endurance training on hormonal and skleletal muscle adaptations. Journal of
Applied Physiology, 78(3), 976-989.
Kumagai, K., Abe, T., Brechue, W. F., Ryushi, T., Takano, S., & Mizuno, M. (2000).
Sprint performance is related to muscle fascicle length in male 100-m sprinters.
Journal of Applied Physiology, 88(3), 811-816.
Laux, P., Krumm, B., Diers, M., & Flor, H. (2015). Recovery-stress balance and injury
risk in professional football players: A prospective study. Journal of Sports
Sciences, 33(20), 2140-2149.

133
Lesmes, G. R., Costill, D. L., Coyle, E. F., & Fink, W. J. (1978). Muscle strength and
power changes during maximal isokinetic training. Medicine and Science in
Sports, 10(4), 266-269.
Lewis, J. G. (2006). Steriod analysis in saliva: an overview. The Clinical Biochemist
Review, 27(1), 139-145.
Lieber, R. L., & Friden, J. (2000). Functional and clinical significance of skeletal
muscle architecture. Muscle and Nerve, 23(11), 1647-1666.
Lopez-Segovia, M., Palao Andres, J. M., & Gonzalez-Badillo, J. J. (2010). Effect of 4
months of training on aerobic power, strength, and acceleration in two under-19
soccer teams. Journal of Strength and Conditioning Research, 24(10), 2705-
2714.
Lyttle, A. D., Wilson, G. J., & Ostrowski, K. J. (1996). Enhancing performance:
maximal power versus combined weights and plyometrics training. Journal of
Strength and Conditioning Research, 10(3), 173-179.
Main, L., & Grove, J. R. (2009). A multi-component assessment model for monitoring
training distress among athletes. European Journal of Sports Science, 9(4), 195-
202.
Mangine, G. T., Hoffman, J. R., Fukuda, D. H., Stout, J. R., & Ratamess, N. A. (2015).
Improving muscle strength and size: The importance of training volume,
intensity, and status. Kinesiology, 47(2), 131-138.
Mann, J. B., Ivey, P. A., & Sayers, S. P. (2015). Velocity-based training in football.
Strength and Conditioning Journal, 37(6), 52-57.
Mann, J. B., Thyfault, J. P., Ivey, P. A., & Sayers, S. P. (2010). The effect of
autoregulatory progressive resistance exercise vs. linear periodization on
strength improvement in college athletes. Journal of Strength and Conditioning
Research, 24(7), 1718-1723.
Markovic, S., Mirkov, D. M., Nedeljkovic, A., & Jaric, S. (2014). Body size and
countermovement depth confound relationship between muscle power output
and jumping performance. Human Movement Science, 33(1), 203-210.
Matveyev, L. P. (1992). Modern procedures for the construction of macrocycles.
Modern Athletic Coach, 30, 32-34.
Mazzetti, S., Douglas, M., Yocum, A., & Harber, M. (2007). Effect of explosive versus
slow contraction and exercise intensity on energy expenditure. Medicine and
Science in Sports and Exercise, 39(8), 1291-1301.
McBride, J. M., Triplett-McBride, T., Davie, A., & Newton, R. U. (2002). The effect of
heavy-vs. light load jump squats on the development of strength, power and
speed. Journal of Strength and Conditioning Research, 16(1), 75-82.
McCarthy, J. P., Pozniak, M. A., & Agre, J. C. (2002). Neuromuscular adaptations to
concurrent strength and endurance training. Medicine and Science in Sports and
Exercise, 34(3), 511-519.
McCaulley, G. O., McBride, J. M., Cormie, P., Hudson, M. B., Nuzzo, J. L., Quindry, J.
C., & Triplett, T. N. (2009). Acute hormonal and neuromuscular responses to
hypertrophy, strength,and power type resistance exercise. European Journal of
Applied Physiology, 105(5), 695-704.
McDonagh, M. N., & Davies, C. M. (1984). Adaptive response of mammalian skeletal
muscle to exercise with high loads. European Journal of Applied Physiology,
52(2), 139-155.
McGuigan, M. R., & Foster, C. (2004a). A new approach to monitoring resistance
training. Strength and Conditioning Journal, 26(6), 42-47.
McGuigan, M. R., Egan, D. A., & Foster, C. (2004b). Salivary cortisol response and
perceived exertion during high intensity and low intensity bouts of resistance
exercise. Journal of Sports Science and Medicine, 3(1), 8-15.

134
McGuigan, M. R., Cormack, S., & Newton, R. U. (2009). Long-term power
performance of elite Australian rules football players. Journal of Strength and
Conditioning Research, 23(1), 26-32.
McLean, B. D., Coutts, A. J., Kelly, V., McGuigan, M. R., & Cormack, S. J. (2010).
Neuromuscular, endocrine, and perceptual fatigue responses during different
length between-match microcycles in professional rugby league players.
International Journal of Sports Physiology and Performance, 5(3), 367-383.
McLellan, C. P., Lovell, D. I., & Gass, G. C. (2010). Creatine kinase and endocrine
responses of elite players pre, during, and post rugby league match play. Journal
of Strength and Conditioning Research, 24(11), 2908-2919.
McMaster, D. T., Gill , N., Cronin, J., & McGuigan, M. (2013). The development,
retention and decay rates of strength and power in elite rugby union, rugby
league and American football: A systematic review. Sports Medicine, 43(5),
367-384.
McMaster, D., Gill, N., McGuigan, M., & Cronin, J. (2014). Effects of complex
strength and ballistic training on maximum strength, sprint ability and force-
velocity-power profiles of semi-professional rugby union players. Journal of
Australian Strength and Conditioning, 22(1), 17-30.
Meeusen, R., Duclos, M., Foster, C., Fry, A., Gleeson, M., Nieman, D., . . . Urhausen,
A. (2013). Prevention, diagnosis and treatment of the overtraining syndrome:
Joint consensus statement of the European College of Sport Science (ECSS) and
the American College of Sports (ACSM). European Journal of Sport Science,
13(1), 1-24.
Meeusen, R., Duclos, M., Gleeson, M., Rietjens, G., Steinacker, J., & Urhausen, A.
(2006). Prevention, diagnosis and treatment of the overtraining syndrome. ECSS
position statement "task force". European Journal of Sports Science, 6(1), 1-14.
Meir, R., Newton, R., Curtis, E., Fardell, M., & Butler, B. (2001). Physical fitness
qualities of professional rugby league football players: Determination of
positional differences. Journal of Strength and Conditioning Research, 15(4),
450-458.
Moffroid, M. T., & Whipple, R. H. (1970). Specificity of speed of exercise. Physical
Therapy, 50(12), 1692-1700.
Mookerjee, S., & Ratamess, N. A. (1999). Comparison of strength differences and joint
action durations between full and partial range of motion bench press exercise.
Journal of Strength and Conditioning Research, 13(1), 76-81.
Morgan, W. P., Brown, D. R., Raglin, J. S., O'Connor, P. J., & Ellickson, K. A. (1987).
Psychological monitoring of overtraining and staleness. British Journal of
Sports Medicine, 21(3), 107-114.
Moritani , T. (1993). Neuromuscular adaptations during the acquisition of muscle
strength, power and motor tasks. Journal of Biomechanics, 26(Suppl 1), 95-107.
Moritani, T., & DeVries, H. A. (1979). Neural factors versus hypertrophy in the time
course of muscle strength gain. American Journal of Physical Medicine, 58(3),
115-130.
Morrissey, M. C., Harman, E. A., Frykman, P. N., & Han, K. H. (1998). Early phase
differential effect of slow and fast barbell squat training. The American Journal
of Sports Medicine, 26(2), 221-230.
Moss, B. M., Refsnes, P. E., Abildgaard, A., Nicolaysen, K., & Jensen, J. (1997).
Effects of maximal effort strength training with different loads on dynamic
strength, cross-sectional area, load-power and load-velocity relationships.
European Journal of Applied Physiology, 75(3), 193-199.
Murray, D. P., & Brown, L. E. (2006). Variable velocity in the periodized model.
Strength and Conditioning Journal, 28(1), 88-92.

135
Newton, R. U., & Kraemer, W. J. (1994). Developing explosive muscular power:
Implications for a mixed method training strategy. Strength and Conditioning
Journal, 16(5), 20-31.
Newton, R., Murphy, A., Humphries, B., Wilson, G., Kraemer, W., & Hakkinen, K.
(1997). Influence of load and stretch shortening cycle on the kinematics, kinetics
and muscle activation that occurs during explosive bench press throws.
European Journal of Applied Physiology, 75(4), 333-342.
Newton, R. U., Kraemer, W. J., & Hakkinen, K. (1999). Effect of ballistic training on
preseason preparation of elite volleyball players. Medicine and Science in Sports
and Exercise, 31(2), 323-330.
Newton, N. U., Kraemer, W. J., Hakkinen, K., Humphries, B. J., & Murphy, A. J.
(1996). Kinematics, kinetics, and muscle activation during explosive upper body
movements. Journal of Applied Biomechanics, 12(1), 31-43.
Noble, B. J., Borg, G., Jacobs, I., Ceci, R., & Kaiser, P. (1983). A category-ratio
perceived exertion scale: Relationship to blood and muscle lactate and heart rate.
Medicine and Science in Sport and Exercise, 15(6), 523-528.
Nosaka, K., Sakamoto, K., Newton, M., & Sacco, P. (2001). The repeated bout effect of
reduced-load eccentric exercise on elbow flexor muscle damage. European
Journal of Applied Physiology, 85(1-2), 34-40.
O'Bryant, H. S., Byrd, R., & Stone, M. H. (1988). Cycle ergometer performance and
maximum leg and hip strength adapatations to two different methods of weight
training. Journal of Applied Sports Science, 2(2), 27-30.
O'Connor, P. J., Morgan, W. P., Raglin, J. S., Barksdale, C. M., & Kalin, N. H. (1989).
Mood state and salivary cortisol levels following overtraining in female
swimmers. Psychoneuroendocrinology, 14(4), 303-310.
Padulo, J., Mignogna, P., Mignardi, S., Tonni, F., & Ottavio, S. D. (2012). Effect of
different pushing speeds on bench press. International Journal of Sports
Medicine, 33(5), 376-380.
Painter, K. B., Haff, G. G., Ramsey, M. W., McBride, J., Triplett, T., Sands, W. A., . . .
Stone, M. H. (2012). Strength gains: Block versus daily undulating periodization
weight training among track and field athletes. International Journal of Sports
Physiology and Performance, 7(2), 161-169.
Pareja-Blanco, F., Rodriguez-Rosell, D., Sanchez-Medina, L., Gorostiaga, E. M., &
Gonzalez-Badillo, J. J. (2014). Effect of movement velocity during resistance
training on neuromuscular performance. International Journal of Sports
Medicine, 35(11), 916-924.
Pasquet, B., Carpentier, A., Duchateau, J., & Hainaut, K. (2000). Muscle fatigue during
concentric and eccentric contractions. Muscle Nerve, 23(11), 1727-1735.
Pearson, S. N., Cronin, J. B., Hume, P. A., & Slyfield, D. (2009). Kinematics and
kinetics of the bench-press and bench-pull exercises in a strength-trained
sporting population. Sport Biomechanics, 8(3), 245-254.
Peterson, M. D., Rhea, M. R., & Alvar, B. A. (2005). Applications of the dose-response
for muscular strength development: A review of meta-analytic efficacy and
reliability for designing training prescription. Journal of Strength and
Conditioning Research, 19(4), 950-958.
Poliquin, C. (1988). Five steps to increasing the effectiveness of your strength training
program. National Strength and Conditioning Association, 10(3), 34-39.
Prevost, M. C., Nelson, A. G., & Maraj, B. K. (1999). The effect of two days of
velocity-specific isokinetic training on torque production. Journal of Strength
and Conditioning Research, 13(1), 35-39.
Raglin, J. S. (2001). Psychological factors in sport performance: The mental health
model revisited. Sports Medicine , 31(12), 875-890.
136
Randell, A. D., Cronin, J. B., Keogh, J. W., Gill, N. D., & Pedersen, M. C. (2011).
Reliability of performance velocity for jump squats under feedback and
nonfeedback conditions. Journal of Strength and Conditioning Research,
25(12), 3514-3518.
Rapp, G., & Weicker, H. (1982). Comparative studies on fast muscle myosin light
chains after different training programs. International Journal of Sports
Medicine, 3(1), 58-60.
Ratamess, N. A., Alvar, B. A., Evetoch, T. K., Housh, T. J., Kibler, B., Kraemer, W. J.,
& Triplett, N. T. (2009). American college of sports medicine position stand.
Progression models in resistance training for healthy adults. Medicine and
Science in Sports and Exercise, 41(3), 687-708.
Rhea, M. R., Ball, S. D., Phillips, W. T., & Burkett, L. N. (2002). A comparison of
linear and daily undulating periodized programs with equated volume and
intensity for strength. Journal of Strength and Conditioning Research, 16(2),
250-255.
Roberts, S. P., Trewartha, G., Higgitt, R. J., El-Abd, J., & Stokes, K. A. (2008). The
physical demands of elite english rugby union. Journal of Sports Sciences,
26(8), 825-833.
Roman, R. A. (1986). The training of the Weightlifter. Moscow, ID: Sportivny Press.
Rutherford, O. M., & Jones, D. A. (1986). The role of learning and coordination in
strength training. European Journal of Applied Physiology, 55(1), 100-105.
Rushall, B. S. (1990). A tool for measuring stress tolerance in elite athletes. Journal of
Applied Sport Psychology, 2(1), 51-66.
Sale, D. G. (1988). Neural adaptation to resistance training. Medicine and Science in
Sports and Exercise, 20(Suppl 5), 135-145.
Sanchez-Medina, L., & Gonzalez-Badillo, J. J. (2011). Velocity loss as an indicator of
neuromuscular fatigue during resistance training. Medicine and Science in
Sports and Exercise, 43(9), 1725-1734.
Sanchez-Medina, L., Gonzalez-Badillo, J. J., Perez, C. E., & Pallares, J. G. (2014).
Velocity and power-load relationships of the bench pull vs. bench press
exercises. International Journal of Sports Medicine, 35(3), 209-216.
Sanchez-Medina, L., Perez, C. E., & Gonzalez-Badillo, J. J. (2010). Importance of the
propulsive phase in strength assessment. International Journal of Sports
Medicine, 31(2), 123-129.
Sapega, A., & Drillings, G. (1983). The definition and assessment of muscular power.
Journal of Orthopaedic and Sports Physical Therapy, 5(1), 7-9.
Sato, K., Beckham, G. K., Carroll, K., Bazyler, C., Sha, Z., & Haff, G. G. (2015).
Validity of wireless device measuring velocity of resistance exercises. Journal
of Trainology, 4(1), 15-18.
Saw, A. E., Main, L. C., & Gastin, P. B. (2015). Monitoring athletes through self-report:
Factors influencing implementation. Journal of Sports Science and Medicine,
14(1), 137-146.
Schilling, B. K., Falvo, M. J., & Chiu, L. Z. (2008). Force-velocity impulse-momentum
relationships: Implications for the efficacy of purposefully slow resistance
training. Journal of Sports Science and Medicine, 7(2), 299-304.
Seitz, L. B., Trajano, G. S., & Haff, G. G. (2014). The back squat and power clean:
Elicitation of different degrees of potentiation. International Journal of Sports
Physiology and Performance, 9(4), 643-649.
Shearer, D. A., Kilduff, L. P., Finn, C., Jones, R. M., Bracken, R. M., Mellalieu, S. D., .
. . Cook, C. J. (2015). Measuring recovery in elite rugby players: The brief
assessment of mood, endocrine changes, and power. Research Quarterly for
Exercise and Sport, 86(4), 379-386.
137
Shepstone, T. N., Tang, J. E., Dallaire, S., Schuenke, M. D., Staron, R. S., & Phillips, S.
M. (2005). Short term high vs. low-velocity isokinetic lengthening training
results in greater hypertrophy of the elbow flexors in young men. Journal of
Applied Physiology, 98(5), 1768-1776.
Siff, M. C. (2000). Supertraining. Denver, CO: Supertraining Institute.
Singh, F., Foster, C., Tod, D., & McGuigan, M. R. (2007). Monitoring different types of
resistance training using session rating of perceived exertion. International
Journal of Sports Physiology and Performance, 2(1), 34-45.
Smart, D. J., Hopkins, W. G., & Gill, N. D. (2013). Differences and changes in the
physical characteristics of professional and amateur rugby union players.
Journal of Strength and Conditioning Research, 27(11), 3033-3044.
Smart, D., Hopkins, W. G., Quarrie, K. L., & Gill, N. (2014). The relationship between
physical fitness and game behaviours in rugby union players. European Journal
of Sports Science, 14(Suppl 1), S8-17.
Smilios, I., Tsoukos, P., Zafeiridis, A., Spassis, A., & Tokmakidis, S. P. (2014).
Hormonal responses after resistance exercise performed with maximum and
submaximum movement velocities. Applied Physiology, Nutrition, and
Metabolism, 39(3), 351-357.
Stone, M. H., O'Bryant, H. S., McCoy, L., Coglianese, R., Lehmkuhl, M., & Schilling,
B. (2003). Power and maximum strength relationships during performance of
dynamic and static weighted jumps. Journal of Strength and Conditioning
Research, 17(1), 140-147.
Stone, M. H., O'Bryant, H., & Garhammer, J. (1981). A hypothetical model for strength
training. Journal of Sports Medicine, 21(4), 342-351.
Storey, A., Wong, S., Smith, H. K., & Marshall, P. (2012). Divergent muscle functional
and architectural responses to two successive high intensity resistance exercise
sessions in competitive weightlifters and resistance trained adults. European
Journal of Applied Physiology, 112(10), 3629-3639.
Sweet, T. W., Foster, C., McGuigan, M. R., & Brice, G. (2004). Quantitation of
resistance training using the session rating of perceived exertion method.
Journal of Strength and Conditioning Research, 18(4), 796-802.
Tan, B. (1999). Manipulating resistance training program variables to optimize
maximum strength in men: A review. Journal of Strength and Conditioning
Research, 13(3), 289-304.
Taylor, K., Chapman, D. W., Cronin, J. B., Newton, M. J., & Gill, N. (2012). Fatigue
monitoring in high performance sport: A survey of current trends. Journal of
Australian Strength and Conditioning Research, 20(1), 12-23.
Tesch, P. A., Ploutz-Snyder, L. L., Ystrom, L., Castro, M. J., & Dudley, G. A. (1998).
Skeletal muscle glycogen loss evoked by resistance exercise. Journal of Strength
and Conditioning Research, 12(2), 67-73.
Tillin, N. A., Pain, M. G., & Folland, P. (2012). Short-term training for explosive
strength causes neural and mechanical adaptations. Experimental Physiology,
97(5), 630-641.
Tricoli, V., Lamas, L., Carnevale, R., & Ugrinowitsch, C. (2005). Short-term effects on
lower-body functional power development: Weightlifting vs. vertical jump
training programs. Journal of Strength and Conditioning Research, 19(2), 433-
437.
Tricoli, V. A., Richard, M. D., Parcell, A. C., & Sawyer, R. D. (2001). Internal vs
external velocity: Effects of strength training protocols on velocity-specific
adaptations and human skeletal muscle variables. Medicine and Science in
Sports and Exercise, 33(5), 264-270.

138
Turner, T. S., Tobin, D. P., & Delahunt, E. (2015). Optimal loading range for the
development of peak power output in the hexagonal barbell jump squat. Journal
of Strength and Conditioning Research, 29(6), 1627-1632.
Twist, C., & Worsfold, P. (2015). The science of rugby. New York, NY 10017:
Routledge.
Ugrinowitsch, C., Tricoli, V., Rodacki, A. L., Batista, M., & Ricard, M. D. (2007).
Influence of training background on jumping height. Journal of Strength and
Conditioning Research, 21(3), 848-852.
Urhausen, A., & Kindermann, W. (2002). Diagnosis of overtraining: What tools do we
have? Sports Medicine, 32(2), 95-102.
Vincent, W., & Weir, J. (2012). Statistics in Kinesiology. (4th Edition ed.). Champaign.
IL: Human Kinetics.
Vining, R. F., McGinley, R. A., Maksvytis, J. J., & Ho, K. Y. (1983). Salivary cortisol:
A better measure of adrenal corticol function than serum cortisol. Annals of
Clinical Biochemistry, 20(Pt 6), 329-335.
Voigt, M., Dyhre-Poulsen, P., & Simonsen, E. B. (1998). Modulation of short latency
stretch reflexes during human hopping. Acta Physiologica Scandinavica, 163(2),
181-194.
Willardson, J. M., Emmett, J., Oliver, J. A., & Bressel, E. (2008). Effect of short-term
failure versus nonfailure training on lower body muscular endurance.
International Journal of Sports Physiology Performance, 3(3), 279-293.
Wilson, G. J., Newton, R. U., Murphy, A. J., & Humphries, B. J. (1993). The optimal
training load for the development of dynamic athletic performance. Medicine
and Science in Sports and Exercise, 25(11), 1279-1286.
Zatsiorsky, V. M., & Kraemer, W. J. (1995). Science and practice of strength training.
Second edition. Champaign: Human Kinetics.

139
APPENDICES
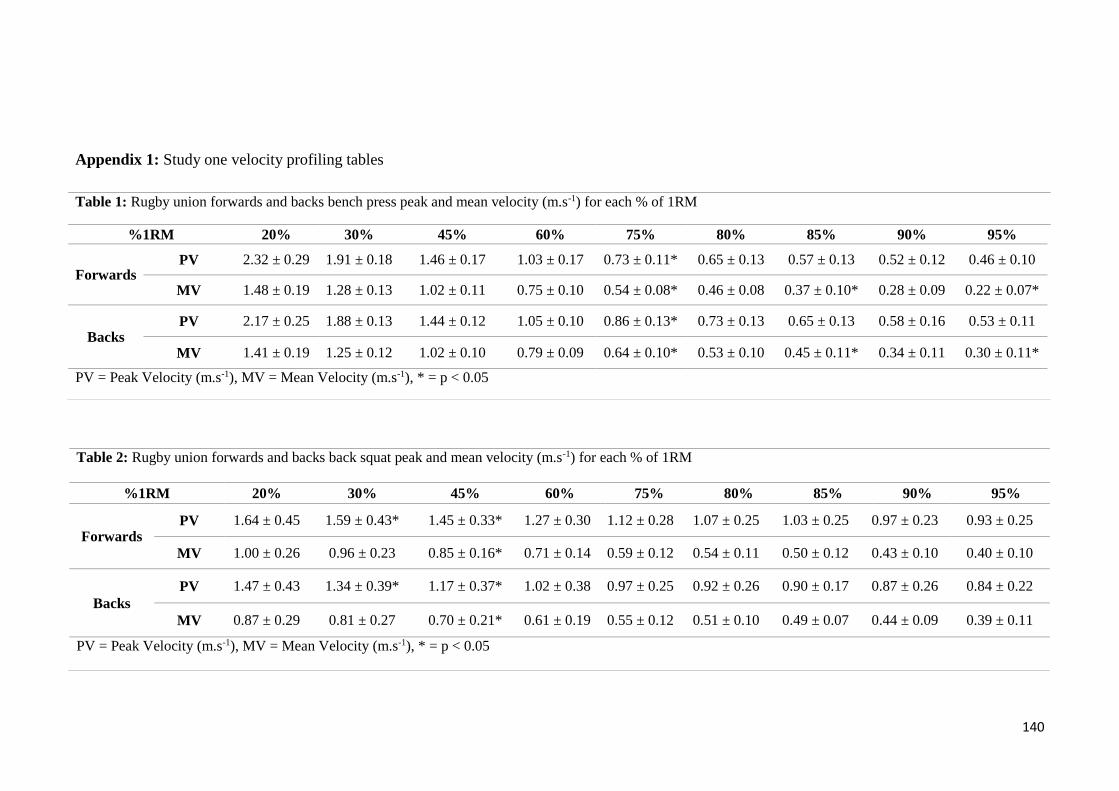
140
Appendix 1: Study one velocity profiling tables
Table 1: Rugby union forwards and backs bench press peak and mean velocity (m.s-1) for each % of 1RM
%1RM 20% 30% 45% 60% 75% 80% 85% 90% 95%
Forwards PV 2.32 ± 0.29 1.91 ± 0.18 1.46 ± 0.17 1.03 ± 0.17 0.73 ± 0.11* 0.65 ± 0.13 0.57 ± 0.13 0.52 ± 0.12 0.46 ± 0.10
MV 1.48 ± 0.19 1.28 ± 0.13 1.02 ± 0.11 0.75 ± 0.10 0.54 ± 0.08* 0.46 ± 0.08 0.37 ± 0.10* 0.28 ± 0.09 0.22 ± 0.07*
Backs PV 2.17 ± 0.25 1.88 ± 0.13 1.44 ± 0.12 1.05 ± 0.10 0.86 ± 0.13* 0.73 ± 0.13 0.65 ± 0.13 0.58 ± 0.16 0.53 ± 0.11
MV 1.41 ± 0.19 1.25 ± 0.12 1.02 ± 0.10 0.79 ± 0.09 0.64 ± 0.10* 0.53 ± 0.10 0.45 ± 0.11* 0.34 ± 0.11 0.30 ± 0.11*
PV = Peak Velocity (m.s-1), MV = Mean Velocity (m.s-1), * = p < 0.05
Table 2: Rugby union forwards and backs back squat peak and mean velocity (m.s-1) for each % of 1RM
%1RM 20% 30% 45% 60% 75% 80% 85% 90% 95%
Forwards PV 1.64 ± 0.45 1.59 ± 0.43* 1.45 ± 0.33* 1.27 ± 0.30 1.12 ± 0.28 1.07 ± 0.25 1.03 ± 0.25 0.97 ± 0.23 0.93 ± 0.25
MV 1.00 ± 0.26 0.96 ± 0.23 0.85 ± 0.16* 0.71 ± 0.14 0.59 ± 0.12 0.54 ± 0.11 0.50 ± 0.12 0.43 ± 0.10 0.40 ± 0.10
Backs
PV 1.47 ± 0.43 1.34 ± 0.39* 1.17 ± 0.37* 1.02 ± 0.38 0.97 ± 0.25 0.92 ± 0.26 0.90 ± 0.17 0.87 ± 0.26 0.84 ± 0.22
MV 0.87 ± 0.29 0.81 ± 0.27 0.70 ± 0.21* 0.61 ± 0.19 0.55 ± 0.12 0.51 ± 0.10 0.49 ± 0.07 0.44 ± 0.09 0.39 ± 0.11
PV = Peak Velocity (m.s-1), MV = Mean Velocity (m.s-1), * = p < 0.05
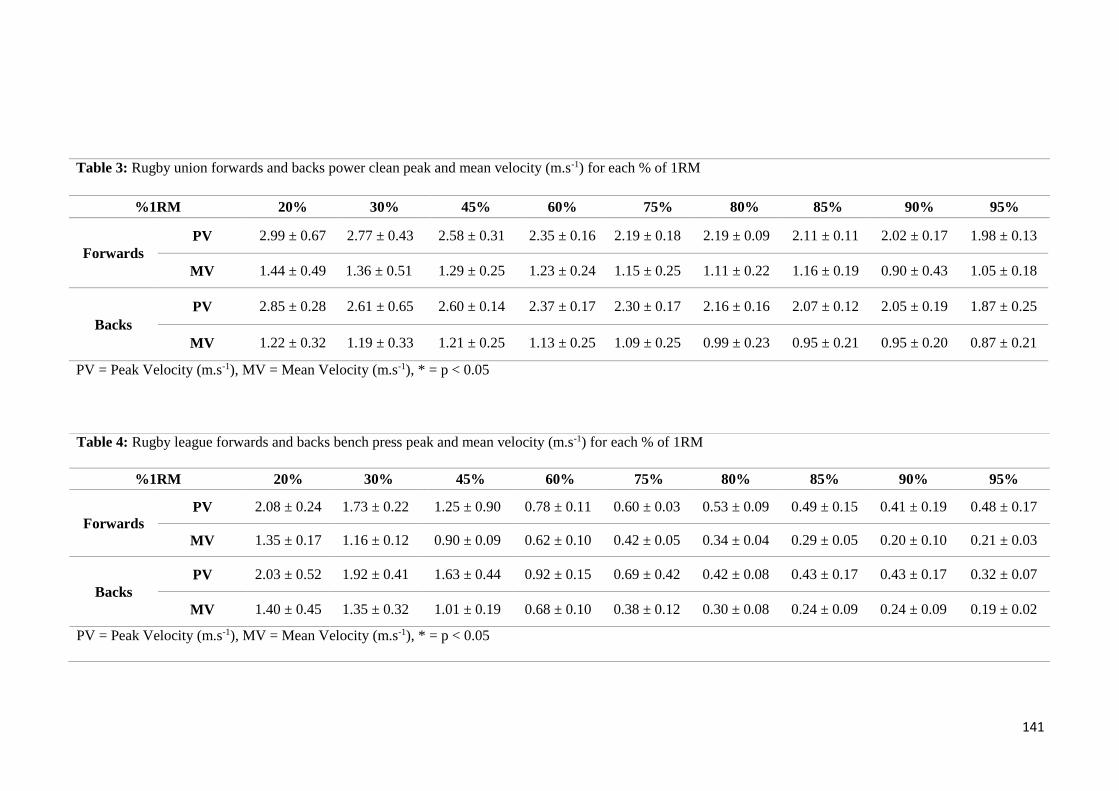
141
Table 3: Rugby union forwards and backs power clean peak and mean velocity (m.s-1) for each % of 1RM
%1RM 20% 30% 45% 60% 75% 80% 85% 90% 95%
Forwards
PV 2.99 ± 0.67 2.77 ± 0.43 2.58 ± 0.31 2.35 ± 0.16 2.19 ± 0.18 2.19 ± 0.09 2.11 ± 0.11 2.02 ± 0.17 1.98 ± 0.13
MV 1.44 ± 0.49 1.36 ± 0.51 1.29 ± 0.25 1.23 ± 0.24 1.15 ± 0.25 1.11 ± 0.22 1.16 ± 0.19 0.90 ± 0.43 1.05 ± 0.18
Backs
PV 2.85 ± 0.28 2.61 ± 0.65 2.60 ± 0.14 2.37 ± 0.17 2.30 ± 0.17 2.16 ± 0.16 2.07 ± 0.12 2.05 ± 0.19 1.87 ± 0.25
MV 1.22 ± 0.32 1.19 ± 0.33 1.21 ± 0.25 1.13 ± 0.25 1.09 ± 0.25 0.99 ± 0.23 0.95 ± 0.21 0.95 ± 0.20 0.87 ± 0.21
PV = Peak Velocity (m.s-1), MV = Mean Velocity (m.s-1), * = p < 0.05
Table 4: Rugby league forwards and backs bench press peak and mean velocity (m.s-1) for each % of 1RM
%1RM 20% 30% 45% 60% 75% 80% 85% 90% 95%
Forwards
PV 2.08 ± 0.24 1.73 ± 0.22 1.25 ± 0.90 0.78 ± 0.11 0.60 ± 0.03 0.53 ± 0.09 0.49 ± 0.15 0.41 ± 0.19 0.48 ± 0.17
MV 1.35 ± 0.17 1.16 ± 0.12 0.90 ± 0.09 0.62 ± 0.10 0.42 ± 0.05 0.34 ± 0.04 0.29 ± 0.05 0.20 ± 0.10 0.21 ± 0.03
Backs
PV 2.03 ± 0.52 1.92 ± 0.41 1.63 ± 0.44 0.92 ± 0.15 0.69 ± 0.42 0.42 ± 0.08 0.43 ± 0.17 0.43 ± 0.17 0.32 ± 0.07
MV 1.40 ± 0.45 1.35 ± 0.32 1.01 ± 0.19 0.68 ± 0.10 0.38 ± 0.12 0.30 ± 0.08 0.24 ± 0.09 0.24 ± 0.09 0.19 ± 0.02
PV = Peak Velocity (m.s-1), MV = Mean Velocity (m.s-1), * = p < 0.05
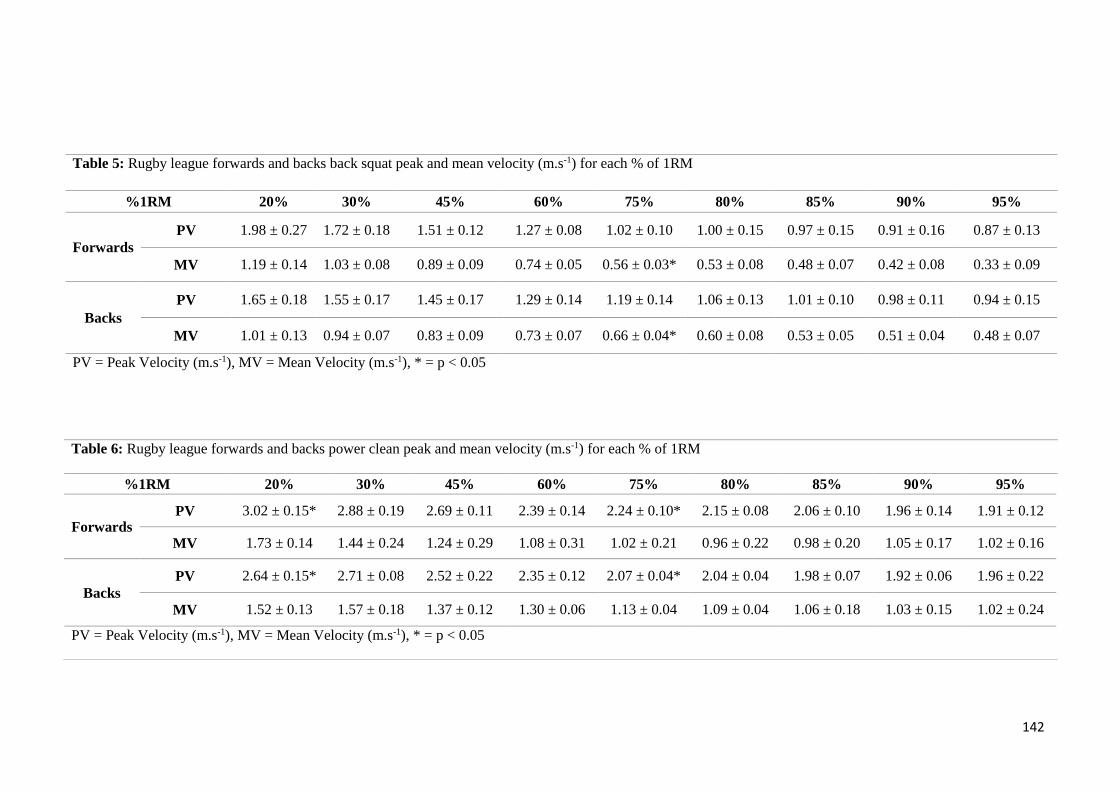
142
Table 5: Rugby league forwards and backs back squat peak and mean velocity (m.s-1) for each % of 1RM
%1RM 20% 30% 45% 60% 75% 80% 85% 90% 95%
Forwards
PV 1.98 ± 0.27 1.72 ± 0.18 1.51 ± 0.12 1.27 ± 0.08 1.02 ± 0.10 1.00 ± 0.15 0.97 ± 0.15 0.91 ± 0.16 0.87 ± 0.13
MV 1.19 ± 0.14 1.03 ± 0.08 0.89 ± 0.09 0.74 ± 0.05 0.56 ± 0.03* 0.53 ± 0.08 0.48 ± 0.07 0.42 ± 0.08 0.33 ± 0.09
Backs
PV 1.65 ± 0.18 1.55 ± 0.17 1.45 ± 0.17 1.29 ± 0.14 1.19 ± 0.14 1.06 ± 0.13 1.01 ± 0.10 0.98 ± 0.11 0.94 ± 0.15
MV 1.01 ± 0.13 0.94 ± 0.07 0.83 ± 0.09 0.73 ± 0.07 0.66 ± 0.04* 0.60 ± 0.08 0.53 ± 0.05 0.51 ± 0.04 0.48 ± 0.07
PV = Peak Velocity (m.s-1), MV = Mean Velocity (m.s-1), * = p < 0.05
Table 6: Rugby league forwards and backs power clean peak and mean velocity (m.s-1) for each % of 1RM
%1RM 20% 30% 45% 60% 75% 80% 85% 90% 95%
Forwards PV 3.02 ± 0.15* 2.88 ± 0.19 2.69 ± 0.11 2.39 ± 0.14 2.24 ± 0.10* 2.15 ± 0.08 2.06 ± 0.10 1.96 ± 0.14 1.91 ± 0.12
MV 1.73 ± 0.14 1.44 ± 0.24 1.24 ± 0.29 1.08 ± 0.31 1.02 ± 0.21 0.96 ± 0.22 0.98 ± 0.20 1.05 ± 0.17 1.02 ± 0.16
Backs
PV 2.64 ± 0.15* 2.71 ± 0.08 2.52 ± 0.22 2.35 ± 0.12 2.07 ± 0.04* 2.04 ± 0.04 1.98 ± 0.07 1.92 ± 0.06 1.96 ± 0.22
MV 1.52 ± 0.13 1.57 ± 0.18 1.37 ± 0.12 1.30 ± 0.06 1.13 ± 0.04 1.09 ± 0.04 1.06 ± 0.18 1.03 ± 0.15 1.02 ± 0.24
PV = Peak Velocity (m.s-1), MV = Mean Velocity (m.s-1), * = p < 0.05
143
Appendix 2: Participant information sheet
Participant Information
Sheet
Date Information Sheet Produced: 20.01.15
Project Title
The influence of velocity based resistance training on neuromuscular strength and
power adaptations in semi-professional rugby union and professional rugby league
players.
An invitation to participate:
Hi, my name is Gurdeep Singh and I am currently a strength and conditioning intern
with the New Zealand Vodafone Warriors franchise. I am also currently a Masters
student at AUT University. I am inviting you to participate in the above named study
which is a research based investigation conducted by Mr. Gurdeep Singh and supervised
by Dr. Adam Storey and Associate Professor Nic Gill. Participation in this study is
completely voluntary and any decision to participate or not participate it is entirely your
own decision. If you decide you no longer want to participate in the study you are free
to withdraw yourself or any information that you have provided for this research study
at any time prior to the completion of the data collection process without being
disadvantaged in anyway. Your consent to participate in this research study will be
indicated by you signing and dating the consent form. Signing the consent form
indicates that you have read and understood this information sheet, freely given your
consent to participate, and that there has been no coercion or inducement to participate
by the researchers from AUT.
What is the purpose of this research:
Traditional percentage-based training is commonly used to prescribe the total load and
intensity of the load lifted in a set or session which is based off an athlete’s percentage
of maximum (1RM). However, this method often overlooks the velocity component of
an exercise which is a critical factor in developing functional strength and power
performance.
Significant improvements in sport specific sprinting and jumping performance have
been shown to occur following velocity based training (VBT) as well as improvements
in strength and power production capabilities. The enhancements in performance are
likely due to resistance training being performed at velocities that provide increased
selective activation of fast twitch muscle fibres. Consequently, this may lead to
increased muscle contraction velocities and peak power outputs which can have a
positive influence on sport specific tasks such as sprinting and jumping. Additionally,
144
velocity based training may enhance the anabolic response for strength and power
adaptation by creating a desirable hormonal environmental response.
At present, there is a lack of specific research that has investigated the influence of VBT
in providing subsequent improvements in strength and power performance Therefore,
the primary purpose of this study is to develop a better understanding of specific VBT
zones performed across different load spectrums as a training stimulus to elicit
subsequent strength and power adaptations in professional rugby union and rugby
league players. The secondary aim is to examine and compare the hormonal responses
between VBT and traditional percentage-based training programmes in professional
rugby league and union players.
These findings will contribute towards a Master’s degree and will be presented in a
thesis and journal-article format which may also include conference presentations.
Am I eligible to participate?
You are eligible to participate in this study if you are; 1) a professional male rugby league
or rugby union player aged 18-30 years, 2) have no current acute or chronic injuries or
medical conditions, 3) involved in a high performance resistance training programme for
≥ 2 years, 4) appropriate joint mobility to perform the bench press, back squat and power
clean movements with appropriate technique, 5) are not using any performance enhancing
or banned substances as per the World Anti-Doping Agency Code (2015) and 6) free from
any saliva borne infectious diseases.
What will happen in this research?
Familiarisation Session:
Once you have decided to participate in the study and have met the inclusion criteria,
you will be required to attend a familiarisation session at your usual training location at
least three days prior to the commencement of the first training session. During the
familiarisation session all participants will perform a series of submaximal lifts for the
bench press, back squat and power clean exercises with a linear position transducer
(LPT) attached to the barbell. The LPT will measure how fast you are moving the
barbell during each of these given exercises. Adequate familiarisation will be provided
prior to the commencement of the first training session with the total familiarisation
session lasting approximately 30 minutes for each participant.
Testing Session:
The pre and post testing sessions will include quantitative measures of strength and
power including the assessment of a one repetition maximum (1RM) for the bench
press, back squat and power clean exercises along with a maximal countermovement
jump test and a 40m sprint test. The pre testing will be conducted one week prior to the
commencement of the first training session and post testing will be conducted three
days after the cessation of the 6-week training intervention. All testing sessions will
take approximately 1 hour.
Training
Once you have completed the familiarisation and testing session, you will be randomly
assigned (verbally and in written form) to a traditional percentage-based training (TPB)
group (control) or a velocity based training (VBT) group (experimental). All participants

145
will be required to perform 4 supervised training sessions of approximately 90min
duration per week across the 6-week intervention period. Both the TPB and VBT groups
will perform movement-matched upper and lower body strength exercises (i.e. bench
press and back squat) and a whole body power exercise (i.e. power clean) throughout the
6-week intervention. Furthermore, both groups will be volume (i.e. sets, reps and rest
period) matched. However, the training loads lifted per session between groups may differ
as the TPB group will perform prescribed loads based off a percentage of their 1RM (i.e.
85-95% 1RM for strength movements and 45-75% 1RM for power movements).
Conversely, the training loads that are prescribed for the VBT group will be determined
by the target velocity zone (m.s-1) that will be prescribed for each load spectrum (i.e.
velocity at 85% 1RM for strength movements and velocity at 60% 1RM for power
movements). Each training week will be characterized by a linear increase in intensity
whilst a decrease in volume (sets and reps) will differentiate light, moderate and heavy
training weeks. Additionally, you will be required to provide a salivary sample 15 minutes
pre training and within 15 minutes post training. Pre training salivary collection will
require you to; 1) refrain from eating, drinking or using oral hygiene products for at least
30 minutes prior to the collection, 2) rinse your mouth out well with distilled water for at
least one minute and will then spit out or swallow the water, 3) wait five minutes
following the oral rinse, and 5) drool into a 50mL sterile tube until a 2mL sample is
provided. The post training salivary collection will be performed in the same fashion as
the pre testing sample collection procedure. Between training sessions, you may continue
with your coach specific skills and cardiovascular conditioning sessions. However, you
must refrain from performing any other resistance training outside the prescribed
programme.
What are the discomforts and risks?
You will be asked to perform submaximal (light to moderate intensity) and maximal
(heavy intensity) resistance training during the 6-week intervention data collection
period and therefore may experience some discomfort for a short period of time during
each training session. However, the intensity of the resistance training will be similar to
what is experienced during your usual training programme.
How will these discomforts and risks be alleviated?
Being an professional athlete who regularly performs resistance training and is familiar
with the high training intensities performed on a daily basis, the resistance exercise
intensities prescribed will be similar to what you experience in a typical training day
and week. If you are experiencing discomfort at any stage during the training
intervention you are encouraged to inform the researcher supervising the session at the
time in order to best address the problem. If you have any questions regarding the risk
or discomfort that you anticipate, please feel free to address these concerns to the
researcher so that you feel comfortable at all times throughout the process.
What are the benefits?
Participants will gain a personalised athletic profile regarding their 1RM, peak power
and peak velocity performance for the bench press, back squat and power clean
exercises as well as their individual hormonal response to resistance training. New
knowledge for researchers and practitioners will be gained as we look to determine if
velocity based training can influence improvements in strength and power performance
to a greater extent when compared to traditional percentage-based training. The wider
professional sporting community will be educated as to the differences between

146
traditional percentage-based training and velocity based-training. This could lead to
education regarding exercise prescription for athletes during strength and power training
phases in New Zealand.
The results of this research are intended for publication and will contribute to part of my
master’s thesis and will also be submitted to peer-reviewed journals for publication.
What compensation is available for injury or negligence
In the unlikely event of a physical injury as a result of your participation in this study,
rehabilitation and compensation for injury by accident may be available from the
Accident Compensation Corporation, providing the incident details satisfy the
requirements of the law and the Corporation’s regulations.
How will my privacy be protected
Your privacy will be protected at all times by the data being de-identified (i.e. coded
numbers I.D 432 will be assigned to your data instead of your name), and the researcher
will not disclose any participants involvement in this study. No names or pictures will
not be used in reporting unless the participant gives written consent following the AUT
protocols and is organised via the AUT University relations team. During the research
study, only the applicant and named researchers will have access to the data collected.
However, following the cessation of the research study, the data collected throughout
the study maybe passed onto coaches within your organisation, only once the research
study is completed. The future use of the data collected from the research study may be
used for further analysis and submitted to peer-viewed journals or submitted to
conferences. However, only the group averages of the descriptive characteristics (age,
height, weight etc.) will be published, and thus the participants will not be identifiable
from the publications related to this study. Your privacy and anonymity will be up held
as the primary concern when handling the data collected.
All data collected will be stored on password protected computers or in securely locked
files. Following completion of the data analysis process your data will be stored by the
AUT University SPRINZ research officer in the AUT University SPRINZ secure Ethics
and Data facility at the AUT Millennium campus for ten years. Following the ten-year
storage period all hard copies of data will be destroyed (shredded) and electronic data
will be deleted.
What are the costs of participating in this research?
There will be no financial cost for you being involved with this study. You will be
required to commit approximately 2 hours towards pre and post testing and
familiarisation sessions and 6 hours per week for 6 weeks for the training intervention.
What opportunity do I have to consider this invitation?
It will be appreciated if you could let us know within two weeks whether you would like
to or be available to take part in the study or not. After consideration you may withdraw
your participation up until the completion of data collection.

147
How do I agree to participate in this research?
If you agree to participate in this research study you will be required to complete a
Participant Consent Form which can be obtained from Gurdeep Singh.
Will I receive feedback on the results of this research?
Yes, participants will gain a personalised athletic profile regarding their 1RM, peak power
and peak velocity performance for the bench press, back squat and power clean exercise.
In addition, all participants will receive information regarding their individual hormonal
response to resistance training. It is your choice whether you share this information with
your coach or other people.
What do I do if I have concerns about this research?
Any concerns regarding the nature of this project should be notified in the first instance
to the Primary Project Supervisor: Dr. Adam Storey, [email protected], 021
2124200.
Concerns regarding the conduct of the research should be notified to the Executive
Secretary of AUTEC Kate O’Connor, [email protected], 921 9999 ext 6038.
Whom do I contact for further information about this research?
Researcher Gurdeep Singh
AUT-Millennium, 17 Antares Place,
Mairangi Bay
02102878507
Project supervisor Dr. Adam Storey
AUT-Millennium, 17 Antares Place,
Mairangi Bay
0212124200
Second research supervisor Associate Professor Nic Gill
AUT-Millennium, 17 Antares Place,
Mairangi Bay
Approved by the Auckland University of Technology Ethics Committee on 25/03/2015
AUTEC Reference number 15/15

148
Appendix 3: Consent form
Consent Form For use when laboratory or field-testing is involved.
Project title: The influence of velocity based resistance training on
neuromuscular strength and power adaptations in semi-
professional rugby union and professional rugby league players.
Project Supervisor: Dr. Adam Storey
Researcher: Gurdeep Singh
Please tick each statement as they apply to you;
I have read and understood the information provided about this research project
in the Information Sheet dated 20th January 2015.
I have had an opportunity to ask questions and to have them answered.
I understand that I may withdraw myself or any information that I have provided
for this project at any time prior to completion of data collection, without being
disadvantaged in any way.
I am a professional male rugby union or rugby league player aged 18-30 years.
I am not suffering from any current acute or chronic injuries and medical
conditions.
I have been involved in a high performance resistance training programme for >2
years.
I am not using any performance enhancing or banned substances as per the 2015
World Anti-Doping Code.
o I am aware that data collected throughout the research study maybe passed onto
coaches within
my organisation, only once the research study is completed.
I am free from any saliva borne infectious disease.
I agree to answer questions and provide physical effort to the best of my ability
throughout testing.
I agree to take part in this research.
I wish to receive a copy of the report from the research (please tick one): Yes
No
Participant’s signature:
.....................................................…………………………………………………………
149
Participant’s name:
.....................................................…………………………………………………………
Participant’s Contact Details (if appropriate):
………………………………………………………………………………………..
………………………………………………………………………………………..
………………………………………………………………………………………..
Date:
Approved by the Auckland University of Technology Ethics Committee on 25/03/2015
AUTEC Reference number 15/15
Note: The Participant should retain a copy of this form.

150
Appendix 4: Athlete psychological wellness monitoring form
Name: Date:
5 4 3 2 1
Fatigue Very Fresh Fresh Average More Tired Than
Usual Always Tired
Sleep Quality Very Good Good Average Poor Very Poor
Muscle Soreness Feeling Great Feeling Good Average Change In Soreness
Tightness Very Sore and Tight
Stress Levels Very Relaxed Relaxed Average Feeling Stressed Highly Stressed
Mood Hard To Aggravate Less Irritable Than
Usual Average
Fairly Easily
Aggravated Highly Irritable
Perceived
Training/Playing
Performance
Very Happy
Performing Well
Satisfied With
Performance Average
Not Satisfied With
Performance
Very Dissatisfied With
Performance
Participant Wellness Questionnaire
Daily Neuromuscular, Endocrine and Mood States Questionnaire

151
Rate Any Muscle Soreness or Tightness
10 9 8 7 6 5 4 3 2 1 0
Fresh
No Problems Normal
More Symptoms
Than Usual
Sudden Increase in
Symptoms Over Past
Week
Restricted By
Tightness Or
Soreness
Pain Interrupting
Training or
Playing
Rate Your Sleep Quality OVER THE PAST WEEK
10 9 8 7 6 5 4 3 2 1
Better Than Usual Normal Some Sleep Irregularity
but Waking Refreshed
Poor Sleep and NOT
Refreshed Very Poor Overall Sleep
Total: …………/50
Approved by the Auckland University of Technology Ethics Committee on 25/03/2015 AUTEC Reference number 15/15


