Embed Size (px)
Citation preview
Copyright ©, 2015 International Ataturk Alatoo University.
Eurasian Journal of Business and Economics 2015, 8 (15), 21-37. DOI: 10.17015/ejbe.2015.015.02
The Impacts of Political Terrorism on Gross Domestic Product in Eurasia: A Spatial Data Analysis Huseyin ALTAY*, Fatih CELEBIOGLU**
Abstract
The aim of this paper is to investigate impact of political terrorism on GDP for Eurasia region countries by using spatial statistics in the period of 1996-2013. For this purpose, quantile maps, Moran’s Scotterplots, LISA (Local Indicators of Spatial Association) statistics are performed. We firstly found that there are the negative impacts of political terrorism on GDP. Secondly, countries as Iceland, Ireland, UK, Portugal, Spain, Norway, Sweden, Italy, Austria, Czech Rep., Denmark, Slovenia, Belgium, France, Germany, Luxemburg, Switzerland, Finland, and Netherland are determined as the strongest positive attraction centers in all Europe countries. Thirdly, Asian countries as India, Uzbekistan, Afghanistan, Kyrgyzstan, Nepal, Tajikistan, Bangladesh and Myanmar are obtained as the strongest negative attraction centers for Asia. The rest of countries in Asia have been negatively affected by these negative attraction centers. Finally, for the big part of Asia (exclude countries as Japan, South Korea) regions, political terrorism is one of the biggest factors of poorness and weakness of per capita GDP.
Keywords: Eurasia, ESDA, Spatial Analysis, Political Terrorism, Gross Domestic Product
JEL Code Classification: E01, O19, R12
UDC: 330.55(4/5): 323.28
*Associate Professor, Bilecik Seyh Edebali University, Bilecik, Turkey. E-mail: [email protected] **Associate Professor, Department of Economics, Dumlupinar University, Kutahya, Turkey. E-mail: [email protected]
Huseyin ALTAY & Fatih CELEBIOGLU
Page |22 EJBE 2015, 8 (15)
1. Introduction
Terrorism has increasingly been a topic of interest in the socio-politic and socio-economic agenda of many countries over the recent years. Right after the events of 9/11, this issue became part of the academic agenda as well. After 9/11, Al-Qaeda led by Osama Bin Laden (who was killed in Pakistan on May 2, 2011) has become a symbol of global terrorism. The final goals of terrorism are just as difficult to grasp
1
as the factors that explain it. Terrorism is a multi-dimensional phenomenon. It is perceived by many as a religious problem only (it is perceived as especially an Islamic problem, even though the Qur’an does not support terrorism), but empirical evidence indicates that it is also related to various economic, social, cultural and political dimensions (Crenshaw, 1981; Abadie, 2004; Bandyopadhyay and Younas, 2011; Bloomberg et al., 2004; Piazza, 2006; Araz-Takay et al., 2009; Derin-Güre, 2010; Piazza, 2011; Bloomberg and Hess, 2008).
There is no consensus for definition of terrorism. Many scientist, policy makers, social activists and international institutions debate on what is terrorism. Terrorism is the premeditated use or threat of use of violence by individuals or subnational groups to obtain a political or social objective through the intimidation of a large audience, beyond that of the immediate victim (Sandler and Enders, 2010).
Terrorism is classified by purpose as follow: political terrorism, non-political terrorism, quasi terrorism, limited political terrorism, and official or state terrorism. Some researchers use both of state terrorism and political terrorism as an equivalent word. We use also equivalent word these concepts. We focus on political terrorism in this paper. Political terrorism is violent criminal behavior designed primarily to generate fear in the community, or substantial segment of it, for political purposes (Cooper, 1976). But Wood and Gibney (2010) differently define “political terror” as follow:
“The PTS measures “state terror”: violations of physical or personal integrity rights carried out by a state (or its agents). This category of human rights violations will be familiar to scholars of state repression and political violence and includes abuses such as extrajudicial killing, torture or similar physical abuse, disappearances, and political imprisonment.”
In this study, we follow up Wood and Gibney (2010). To understand relations between terrorism and per capita GDP, we use political terror scale as an indicator. The Political Terror Scale is a numerical coding on a 5-point scale of state-
1 Enders and Sandler (2006) define terrorism as “the premeditated use or threat to use violence by individuals or sub-national groups in order to obtain a political or social objective through the intimidation of a large audience beyond that of the immediate victims”. According to ITSR, the International Terrorism and Security Research (2011), terrorism qualifies “a criminal act that influences an audience beyond the immediate victim”. The aim of terror, by implying violence, is to create fear and chaos.
The Impacts of Political Terrorism on Gross Domestic Product in Eurasia: A Spatial Data…
EJBE 2015, 8 (15) Page | 23
sponsored domestic political terror through imprisonments, torture, disappearances and violations of the rule of law.
Our goal in this paper focuses on the phenomenon of spatial dependence, also called spatial autocorrelation, of political terrorism and per capita GDP in Eurasia. While the literature proposes some evidence of spatial autocorrelation in the distribution of crime and violence, mostly at the city-level (see, for instance, Murray et al., 2001; Eck et al., 2005; Anselin et al., 2000), the spatial distribution of political terrorism and GDP has never been investigated under the lens of ESDA
23.
As such, we intend to fill this gap.
In section 2, we explain literature of relations between terrorism (state or non-state) and GDP. In order to investigate the spatial distribution of political terrorism and per capita GDP across Eurasian countries and identify the presence of spatial autocorrelation, section 3 below will describe our data and show a choropleth map of the distribution of this variable. Our Exploratory Spatial Data Analysis based on the traditional spatial statistical techniques (Anselin 1988) is performed in section 4. Finally, section 5 proposes some concluding remarks.
2. Literature Review
In recent years many scientist have been working on relationships between terror and economic variables. Most of the literature focusing on terrorism investigates its negative impacts on trade (Souza et al., 2010; Mirza and Verdier, 2006a, 2006b; Fratianni and Kang, 2006; Nitsch and Schumacher, 2004), on the national or regional gross domestic product (Abadie and Gardeazabal, 2003; Blomberg et al., 2004; Barth et al., 2006; Gaibulloev and Sandler, 2008) or foreign direct investments (Klein, 2007; Raby, 2003; Shahrestani and Anaraki, 2008).Many papers show that there are negative but significant relations between terror and economic variables.
2.1. Literature on Relations between Terrorism and its Economic Impacts
Impacts of terrorism on economic life are analyzed by many researchers into two different approaches. First one is non-state terrorism; second one is state-terrorism (political terrorism). A lot of studies on non-state terrorism are mostly chosen by researchers and its literature is very wide.
Abadie and Gardeazabal (2003) analyze the economic effects of conflict, using the terrorist conflict in Basque Country as a case study. They obtained that after the outbreak of terrorism, per capita GDP in Basque Country declined about 10 percent points relative to the other controlled regions. Blomberg et al. (2004) perform an
2 Here are some of the studies in this regard: Rey and Montouri (1999), Ying (2000) Manfred et al. (2001), Le Gallo and Ertur (2003), Perobelli and Haddad (2003), Van Oort and Atzema (2004), Dall’erba (2005), Voss et al.. (2006), Ezcuerra et al. (2007, 2008), Battisti and Di Vaio (2008) Celebioglu and Dall’erba (2010), Altay and Celebioglu (2012).
Huseyin ALTAY & Fatih CELEBIOGLU
Page |24 EJBE 2015, 8 (15)
empirical investigation of the macroeconomic consequences of international terrorism and interactions with alternative forms of collective violence. They found that the incidence of terrorism may have an economically significant negative effect on growth, albeit one that is considerably smaller and less persistent than that associated with either external wars or internal conflict.
Results of Abadie (2004)’s paper indicate as experienced recently in Iraq and previously in Spain and Russia, transitions from an authoritarian regime to a democracy may be accompanied by temporary increases in terrorism. Their results suggest that geographic factors are important to sustain terrorist activities.
Barth et al. (2006) investigate the impact of terrorism on these variables using annual panel data from 1970 to 2003. Their results show that terrorism is indeed associated with adverse economic effect. According to this paper terrorist incidents have a negative and significant impact on economic growth. Abadie and Gardeazabal (2007) develop an economic model to show that terrorism may have a large impact on the allocation of productive capital across countries, even if it represents a small fraction of the overall economic risk.
Gaibulloev and Sandler (2008) examine the impact of terrorism and conflicts on income per capita growth in Asia for 1970–2004. Their panel estimations show that transnational terrorist attacks had a significant growth-limiting effect. Shahrestani and Anaraki (2008) investigate the effects of terrorism on such variables as GDP growth, foreign direct investment (FDI) and total factor productivity (TFP) with cross section data of 2005 for a sample of both developed and developing countries. Their results suggest that terrorism has adversely and significantly affected economic growth, FDI and TFP around the world. Gries et al. (2009) test the impact of economic performance on domestic terrorism for seven Western European countries by using Hsiao-Granger Causality Model. Their findings indicate that (a) the role of economic performance in determining terrorist violence appears to have been important for some countries and (b) all attacked economies have been successful in adjusting to the threat of terrorism.
Bandyopadhyay and Younas (2011) found that political freedom has a significant and non-linear effect on domestic terrorism, but this effect is not significant in the case of transnational terrorism. Some of our other novel findings are that while geography and fractionalization may limit a county’s ability to curb terrorism, the presence of strong legal institutions deters it.
Rusnak et al. (2012) demonstrate the use of location quotients to control for social and physical contextual risk in Turkey, a nation that has experienced high levels of terrorism. They discuss how counterterrorism resources combined with proper data can be directed to geographic areas where attacks are most likely to occur.
A smaller number of researchers focus on state terrorism/political terrorism in their papers. We give a couple of the samples literature about state terrorism/political terrorism.
The Impacts of Political Terrorism on Gross Domestic Product in Eurasia: A Spatial Data…
EJBE 2015, 8 (15) Page | 25
Ross (1993) investigates causes of oppositional political terrorism can be explained by three categories of theories: structural, psychological, and rational choice. Kisangani and Nafziger (2006) undertakes preliminary analysis to increase understanding of state terrorism. Using lags, they find that rent-seeking is a major factor in explaining democides or the murder of people by the state. More specifically, leaders are likely to tolerate dissension up to a point; however, as rent-seeking activities or as exports of minerals reach a threshold of 26%, state terrorism tends to increase. Past democides and economic growth of GDP reduce the incidence of democides, the murder of people by the state.
Papers those focusing on spatial analysis of terrorism are also very limited. LaFree et al. (2012) examine spatial and temporal patterns of terrorist attacks by the Spanish group ETA (Euskadi Ta Askatasuna) between 1970 and 2007. They find that after ETA moved toward a more attrition based attack strategy, subsequent attacks were significantly more likely to occur outside the Basque region and to target non-adjacent regions. They also find that hierarchical diffusion was more common when a longer time elapsed between attacks and that attacks against Madrid were unlikely to be followed immediately by more attacks on Madrid or surrounding provinces. Siebeneck et al. (2009) focuses on terrorist incidents in Iraq, which are defined here as attacks, both successful and unsuccessful, in order to detect patterns in the establishment of terrorist activity spaces. Using Geographic Information Science (GIS), this project carries out a series of spatial and temporal cluster identification analyses on recent terrorist incidents in Iraq.
There is no spatial analysis that focusing on relations between political terror scale and per capita GDP in literature. For this reason, we want to investigate spatial relations between political terror scale and per capita GDP in Eurasian countries.
3. Data Analysis
Per capita GDP data set comes from IMF online databases. Other data on terrorism (political terror scale, noted PTS from now on) comes from the World Bank’s Worldwide Governance Indicators Database. The database classifies all the following events as acts of terror: political killings, disappearances, tortures, independence of the judiciary system, imprisonments because of an individual’s ethnicity, race, political or religious beliefs, government censorship, and restrictions on domestic and foreign travel, freedom of political participation. The original values of the Politic Terror Scale (PTS) are between 0 and 1 where a value close to 1 indicates a low level of terrorism. All the data are measured annually over the 1996 - 2013 period. Our dataset consists of 84 countries in Europe and Asia.
Two choropleth maps of the distribution of PTS and per capita GDP in the period of 1996-2013 are available in figure 1 and in figure 2 below. We display the distribution of PTS over the whole period. All the European countries display higher levels of PTS than their Asian peers.
Huseyin ALTAY & Fatih CELEBIOGLU
Page |26 EJBE 2015, 8 (15)
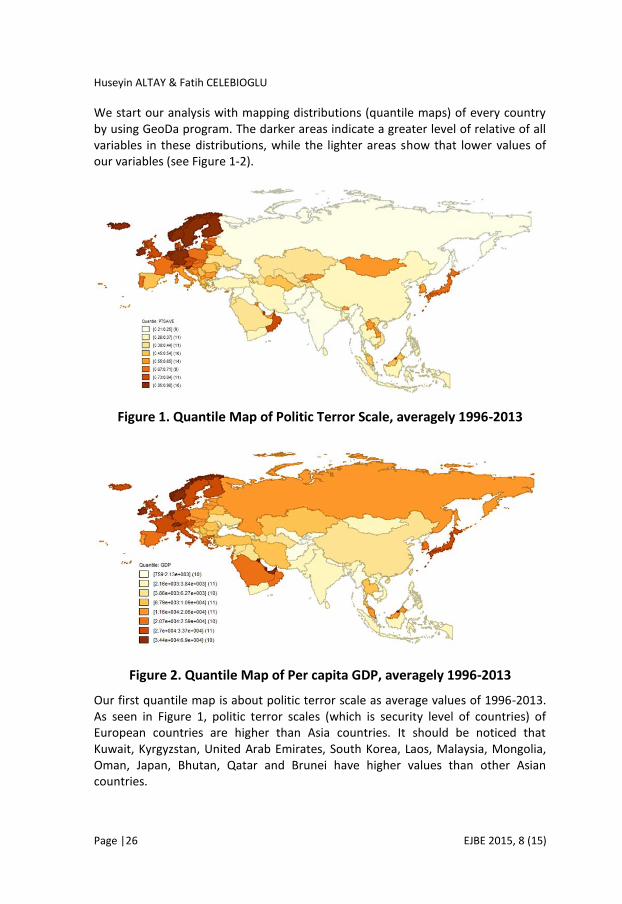
We start our analysis with mapping distributions (quantile maps) of every country by using GeoDa program. The darker areas indicate a greater level of relative of all variables in these distributions, while the lighter areas show that lower values of our variables (see Figure 1-2).
Figure 1. Quantile Map of Politic Terror Scale, averagely 1996-2013
Figure 2. Quantile Map of Per capita GDP, averagely 1996-2013
Our first quantile map is about politic terror scale as average values of 1996-2013. As seen in Figure 1, politic terror scales (which is security level of countries) of European countries are higher than Asia countries. It should be noticed that Kuwait, Kyrgyzstan, United Arab Emirates, South Korea, Laos, Malaysia, Mongolia, Oman, Japan, Bhutan, Qatar and Brunei have higher values than other Asian countries.
The Impacts of Political Terrorism on Gross Domestic Product in Eurasia: A Spatial Data…
EJBE 2015, 8 (15) Page | 27
When we look at the distribution of mapping (see Figure 2) in terms of per capita GDP, we see countries as Japan, Kuwait, Qatar, United Arab Emirates and mostly European countries have superior figures. But countries as Afghanistan, Nepal, Uzbekistan, Kyrgyzstan, Bangladesh, Myanmar, Laos, North Korea and Cambodia have the lowest values in the Eurasia.
4. LISA (Local Indicators of Spatial Association) Analysis
4.1. What is Spatial Weight Matrix?
A spatial weight matrix is the necessary tool to impose a neighborhood structure on a spatial dataset. As usual in the spatial statistics literature, neighbors are defined by a binary relationship (0 for non-neighbors, 1 for neighbors). We have used two basic approaches to define neighborhood: contiguity (shared borders) and distance. Contiguity-based weights matrices include rook and queen. Areas are neighbors under the rook criterion if they share a common border, not vertices. Distance-based weights matrices include distance bands and k nearest neighbors. Based on these two concepts, we decided to create a weight matrix to investigate the distribution of our variables of interest: k_8 nearest neighbor matrix. Due to space constraints, we give the k_8 nearest neighbor matrix only below:
*
( ) 0
( ) 1 ( ) ( ) ( ) / ( ) 8
( ) 0 ( )
ij
ijij ij i ij ij
j
ij ij i
w k if i j
w k if d D k and w k w k w k for k
w k if d kD
whereij
d is great circle distance between centroids of region i and j and ( )i
D k is
the 8th
order smallest distance between regions i and j such that each region i
has exactly 8 neighbors. Now that the weight matrix has been defined, we estimate a couple of spatial statistics that will shed some light on the spatial distribution of our variables. The most common of them is Moran’s I which is a measure of global spatial autocorrelation (Anselin 1988).
4.2. Moran’s I Value
Spatial autocorrelation refers to the correlation of a variable with itself in space. It can be positive (when high values correlate with high neighboring values or when values correlate with low neighboring values low) or negative (spatial outliers for high-low or low-high values). Note that positive spatial autocorrelation can be associated with a small negative value (e.g., -0.01) since the mean in finite samples is not centered on 1. Spatial autocorrelation analysis includes tests and visualization of both global (test for clustering) and local (test for clusters) Moran’s I statistic (Anselin et al. 2006).
(1)
Huseyin ALTAY & Fatih CELEBIOGLU
Page |28 EJBE 2015, 8 (15)
Global spatial autocorrelation is a measure of overall clustering and it is measured here by Moran's I. It captures the extent of overall clustering that exists in a dataset. It is assessed by means of a test of a null hypothesis of random location. Rejection of this null hypothesis suggests a spatial pattern or spatial structure, which provides more insights about a data distribution that what a quantile map or box plot does. For each variable, it measures the degree of linear association between its value at one location and the spatially weighted average of neighboring values (Anselin et al. 2007; Anselin, 1995) and is formulated as follows:
*
1 1
1 1
( )n n
ij it jti j
t n n
it jti j
w k x x
I
x x
Where *
ijw is the (row-standardized) degree of connection between the spatial
units i and j andijx is the variable of interest in region i at year t (measured as a
deviation from the mean value for that year). Values of I larger (smaller) than the expected value ( ) 1/ ( 1)E I n indicate positive (negative) spatial
autocorrelation. In our study, this value is (-0.0120). There are different ways to draw inference here. The approach we use is a permutation approach with 999 permutations. It means that 999 re-sampled datasets were automatically created for which the I statistics are computed. The value obtained for the actual dataset has then been compared to the empirical distribution obtained from these re-sampled datasets.
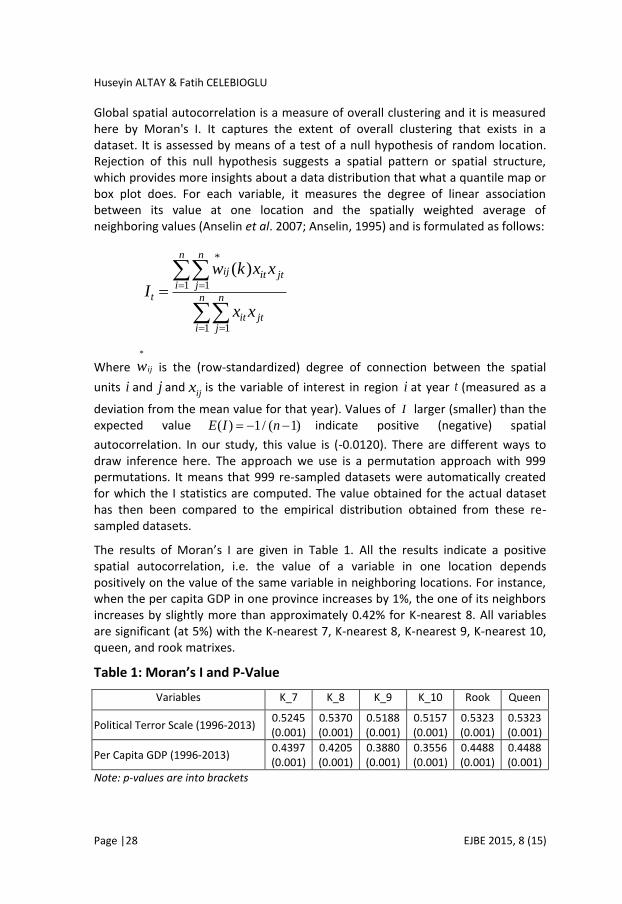
The results of Moran’s I are given in Table 1. All the results indicate a positive spatial autocorrelation, i.e. the value of a variable in one location depends positively on the value of the same variable in neighboring locations. For instance, when the per capita GDP in one province increases by 1%, the one of its neighbors increases by slightly more than approximately 0.42% for K-nearest 8. All variables are significant (at 5%) with the K-nearest 7, K-nearest 8, K-nearest 9, K-nearest 10, queen, and rook matrixes.
Table 1: Moran’s I and P-Value
Variables K_7 K_8 K_9 K_10 Rook Queen
Political Terror Scale (1996-2013) 0.5245 (0.001)
0.5370 (0.001)
0.5188 (0.001)
0.5157 (0.001)
0.5323 (0.001)
0.5323 (0.001)
Per Capita GDP (1996-2013) 0.4397 (0.001)
0.4205 (0.001)
0.3880 (0.001)
0.3556 (0.001)
0.4488 (0.001)
0.4488 (0.001)
Note: p-values are into brackets
(2)
The Impacts of Political Terrorism on Gross Domestic Product in Eurasia: A Spatial Data…
EJBE 2015, 8 (15) Page | 29
But Moran’s I values for queen and rook matrixes in terms of per capita GDP are higher than the others. But we can’t use rook and queen matrixes because of this matrix types are not consider neighborless countries (islands). In this point, we have to choose one of the K-nearest approach matrixes. We use K-nearest 8 matrix in the next stages of this study. There are two reasons; firstly, similar studies mostly use 10% criteria for neighborship settings. Secondly, Moran’s I value of political terror scale is the highest value.
4.3. LISA Analysis (Both Univariate and Multivariate Level)
LISA statistics (Local Indicators of Spatial Association) can be defined the presence of spatial autocorrelation for each of the location of our sample. It captures the presence or absence of significant spatial clusters or outliers for each location. Combined with the classification into four types defined in the Moran scatter plot above, LISA indicates significant local clusters (high–high or low–low) or local spatial outliers (high–low or low–high). The average of the Local Moran statistics is proportional to the Global Moran's I value (Anselin 1995; Anselin et al. 2007).
Anselin (1995) formulated the local Moran’s statistics for each region i and year t
as the follows:
2
0
0
/i
i ij j i
j i
xI w x with m x n
m
whereij
w is the elements of the row-standardized weights matrix W and ( )i j
x x is
the observation in region ( )i j . The significant results (at 5%) of the LISA statistics
are given in table 2. Their significance level is based on a randomization approach with 999 permutations of the neighboring provinces for each observation.
4.3.1. Univariate LISA Analysis
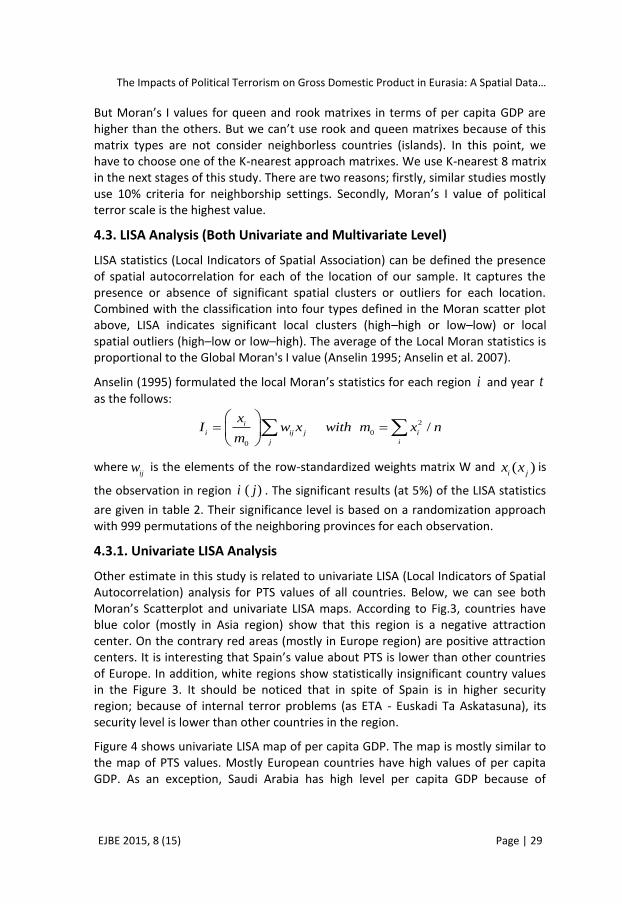
Other estimate in this study is related to univariate LISA (Local Indicators of Spatial Autocorrelation) analysis for PTS values of all countries. Below, we can see both Moran’s Scatterplot and univariate LISA maps. According to Fig.3, countries have blue color (mostly in Asia region) show that this region is a negative attraction center. On the contrary red areas (mostly in Europe region) are positive attraction centers. It is interesting that Spain’s value about PTS is lower than other countries of Europe. In addition, white regions show statistically insignificant country values in the Figure 3. It should be noticed that in spite of Spain is in higher security region; because of internal terror problems (as ETA - Euskadi Ta Askatasuna), its security level is lower than other countries in the region.
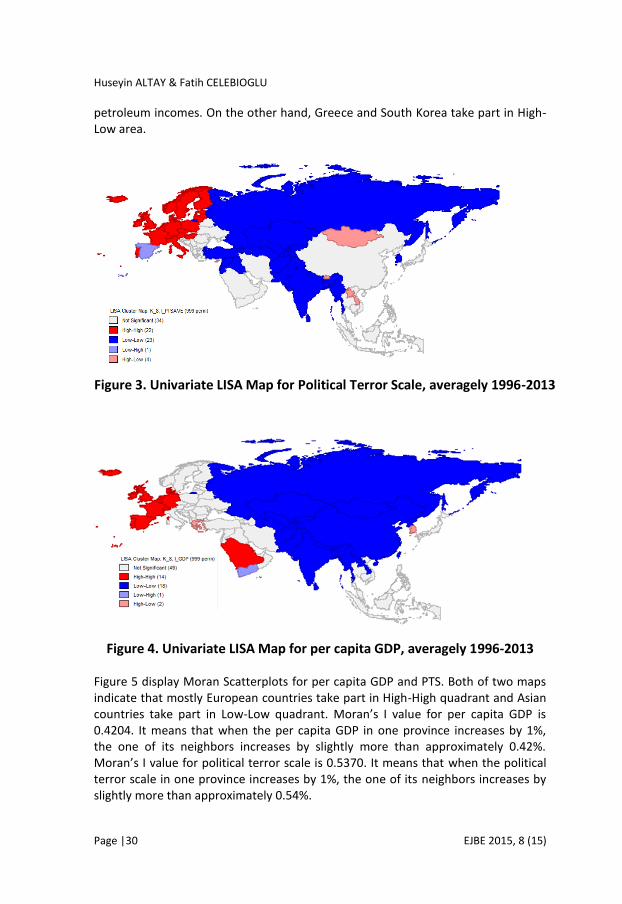
Figure 4 shows univariate LISA map of per capita GDP. The map is mostly similar to the map of PTS values. Mostly European countries have high values of per capita GDP. As an exception, Saudi Arabia has high level per capita GDP because of
(3)
Huseyin ALTAY & Fatih CELEBIOGLU
Page |30 EJBE 2015, 8 (15)
petroleum incomes. On the other hand, Greece and South Korea take part in High-Low area.
Figure 3. Univariate LISA Map for Political Terror Scale, averagely 1996-2013
Figure 4. Univariate LISA Map for per capita GDP, averagely 1996-2013
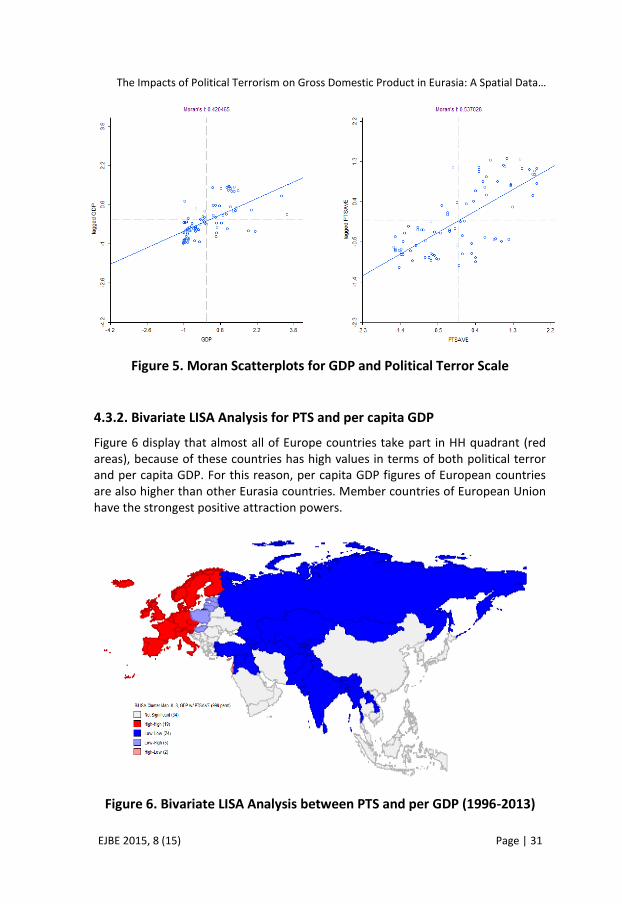
Figure 5 display Moran Scatterplots for per capita GDP and PTS. Both of two maps indicate that mostly European countries take part in High-High quadrant and Asian countries take part in Low-Low quadrant. Moran’s I value for per capita GDP is 0.4204. It means that when the per capita GDP in one province increases by 1%, the one of its neighbors increases by slightly more than approximately 0.42%. Moran’s I value for political terror scale is 0.5370. It means that when the political terror scale in one province increases by 1%, the one of its neighbors increases by slightly more than approximately 0.54%.
The Impacts of Political Terrorism on Gross Domestic Product in Eurasia: A Spatial Data…
EJBE 2015, 8 (15) Page | 31
Figure 5. Moran Scatterplots for GDP and Political Terror Scale
4.3.2. Bivariate LISA Analysis for PTS and per capita GDP
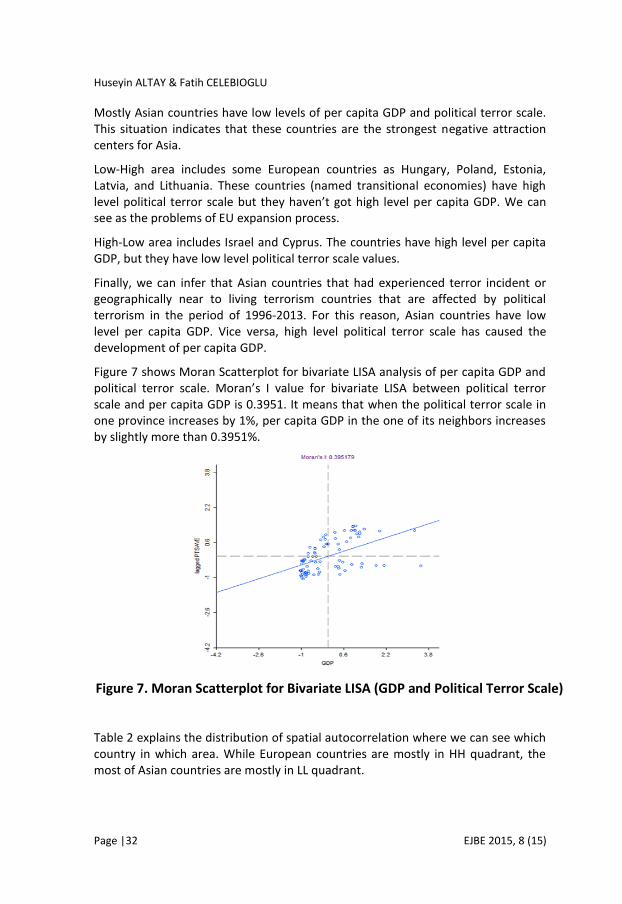
Figure 6 display that almost all of Europe countries take part in HH quadrant (red areas), because of these countries has high values in terms of both political terror and per capita GDP. For this reason, per capita GDP figures of European countries are also higher than other Eurasia countries. Member countries of European Union have the strongest positive attraction powers.
Figure 6. Bivariate LISA Analysis between PTS and per GDP (1996-2013)
Huseyin ALTAY & Fatih CELEBIOGLU
Page |32 EJBE 2015, 8 (15)
Mostly Asian countries have low levels of per capita GDP and political terror scale. This situation indicates that these countries are the strongest negative attraction centers for Asia.
Low-High area includes some European countries as Hungary, Poland, Estonia, Latvia, and Lithuania. These countries (named transitional economies) have high level political terror scale but they haven’t got high level per capita GDP. We can see as the problems of EU expansion process.
High-Low area includes Israel and Cyprus. The countries have high level per capita GDP, but they have low level political terror scale values.
Finally, we can infer that Asian countries that had experienced terror incident or geographically near to living terrorism countries that are affected by political terrorism in the period of 1996-2013. For this reason, Asian countries have low level per capita GDP. Vice versa, high level political terror scale has caused the development of per capita GDP.
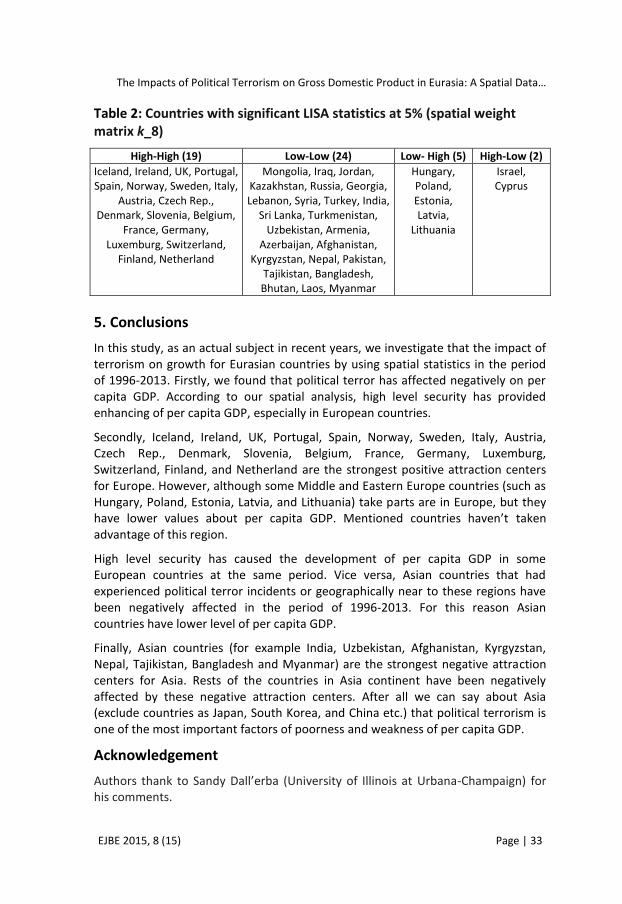
Figure 7 shows Moran Scatterplot for bivariate LISA analysis of per capita GDP and political terror scale. Moran’s I value for bivariate LISA between political terror scale and per capita GDP is 0.3951. It means that when the political terror scale in one province increases by 1%, per capita GDP in the one of its neighbors increases by slightly more than 0.3951%.
Figure 7. Moran Scatterplot for Bivariate LISA (GDP and Political Terror Scale)
Table 2 explains the distribution of spatial autocorrelation where we can see which country in which area. While European countries are mostly in HH quadrant, the most of Asian countries are mostly in LL quadrant.
The Impacts of Political Terrorism on Gross Domestic Product in Eurasia: A Spatial Data…
EJBE 2015, 8 (15) Page | 33
Table 2: Countries with significant LISA statistics at 5% (spatial weight matrix k_8)
High-High (19) Low-Low (24) Low- High (5) High-Low (2)
Iceland, Ireland, UK, Portugal, Spain, Norway, Sweden, Italy,
Austria, Czech Rep., Denmark, Slovenia, Belgium,
France, Germany, Luxemburg, Switzerland,
Finland, Netherland
Mongolia, Iraq, Jordan, Kazakhstan, Russia, Georgia, Lebanon, Syria, Turkey, India,
Sri Lanka, Turkmenistan, Uzbekistan, Armenia,
Azerbaijan, Afghanistan, Kyrgyzstan, Nepal, Pakistan,
Tajikistan, Bangladesh, Bhutan, Laos, Myanmar
Hungary, Poland, Estonia, Latvia,
Lithuania
Israel, Cyprus
5. Conclusions
In this study, as an actual subject in recent years, we investigate that the impact of terrorism on growth for Eurasian countries by using spatial statistics in the period of 1996-2013. Firstly, we found that political terror has affected negatively on per capita GDP. According to our spatial analysis, high level security has provided enhancing of per capita GDP, especially in European countries.
Secondly, Iceland, Ireland, UK, Portugal, Spain, Norway, Sweden, Italy, Austria, Czech Rep., Denmark, Slovenia, Belgium, France, Germany, Luxemburg, Switzerland, Finland, and Netherland are the strongest positive attraction centers for Europe. However, although some Middle and Eastern Europe countries (such as Hungary, Poland, Estonia, Latvia, and Lithuania) take parts are in Europe, but they have lower values about per capita GDP. Mentioned countries haven’t taken advantage of this region.
High level security has caused the development of per capita GDP in some European countries at the same period. Vice versa, Asian countries that had experienced political terror incidents or geographically near to these regions have been negatively affected in the period of 1996-2013. For this reason Asian countries have lower level of per capita GDP.
Finally, Asian countries (for example India, Uzbekistan, Afghanistan, Kyrgyzstan, Nepal, Tajikistan, Bangladesh and Myanmar) are the strongest negative attraction centers for Asia. Rests of the countries in Asia continent have been negatively affected by these negative attraction centers. After all we can say about Asia (exclude countries as Japan, South Korea, and China etc.) that political terrorism is one of the most important factors of poorness and weakness of per capita GDP.
Acknowledgement
Authors thank to Sandy Dall’erba (University of Illinois at Urbana-Champaign) for his comments.
Huseyin ALTAY & Fatih CELEBIOGLU
Page |34 EJBE 2015, 8 (15)
References Abadie A. (2004), “Poverty, Political Freedom, and the Roots of Terrorism”, NBER Working Paper No: 10859, Cambridge, http://www.nber.org/papers/w10859.
Abadie A. and Gardeazabal J. (2003), “The Economic Cost of Conflict: A Case Study of the Basque County”, The American Economic Review, 93 (1), 113-132. http://dx.doi.org/10.1257/000282803321455188
Abadie A. and Gardeazabal J. (2007), “Terrorism and the World Economy”, Department of Foundations of Economic Analysis II Working Papers No: 2005-19.
Altay H. and Celebioglu F. (2012) “Spatial Analysis of Concentration in Production and Trade: An Exploratory Spatial Data Analysis for Emerging Markets”, Akdeniz University, International Journal of Alanya Faculty of Business, 4- 2, 125-140.
Anselin L. (1988), Spatial Econometrics: Methods and Models, Kluwer Academic Publishers, Dordrecht. http://dx.doi.org/10.1007/978-94-015-7799-1
Anselin L. (1995), Local Indicator of Spatial Association – LISA. Geographical Analysis 27, 93–115. http://dx.doi.org/10.1111/j.1538-4632.1995.tb00338.x
Anselin L., Sridharan S. and Gholston S. (2007), “Using Exploratory Spatial Data Analysis to Leverage Social Indicator Databases: The Discovery of Interesting Patterns”, Social Indicators Research 82, 287–309.http://dx.doi.org/10.1007/s11205-006-9034-x
Anselin L., Syabri I. and Kho Y. (2006), “GeoDa: An Introduction to Spatial Data Analysis”, Geographical Analysis 38, 5–22. http://dx.doi.org/10.1111/j.0016-7363.2005.00671.x
Anselin, L., J. Cohen, D. Cook, W. Gorr, G. Tita (2000), “Spatial Analyses of Crime,” In David Duffee (ed.), Criminal Justice 2000: Volume 4. Measurement and Analysis of Crime and Justice. Washington, DC: National Institute of Justice, pp.213–262.
Araz-Takay B., Arin K. P., Omay T. (2009) “The Endogenous and Non-Linear Relationship between Terrorism and Economic Performance: Turkish Evidence”, Defence and Peace Economics, 20 (1), 1 – 10. http://dx.doi.org/10.1080/10242690701775509
Bandyopadhyay S. and Younas J. (2011), “Poverty, political freedom, and the roots of terrorism in developing countries: An empirical assessment”, Federal Reserve Bank of St. Louis, Working Paper 2009-023D, http://research.stlouisfed.org/wp/2009/2009-023.pdf
Barth J.R., Li T., McCarthy D., Phumiwasana T. and Yago G. (2006), “Economic Impacts of Global Terrorism:From Munich to Bali”, Capital Studies, Milken Institute.
Battisti M. and Di Vaio G. (2008) A Spatially Filtered Mixture of β-Convergence Regressions for EU Regions, 1980–2002, Empirical Economics. 34, 105–121. http://dx.doi.org/10.1007/s00181-007-0168-8
Blomberg B.S., Hess G.D. and Orphanides A. (2004), “The Macroeconomic Consequences of Terrorism”, Journal of Monetary Economics, 51, 1007-1032. http://dx.doi.org/10.1016/j.jmoneco.2004.04.001
Blomberg S.B. and Hess G.D. (2008) “The Lexus and the Olive Branch: Globalization, Democratization, and Terrorism”, pp. 116-147; inside of “Terrorism, Economic Development, and Political Openness” (Editors: Philip Keefer and Norman Loayza), Cambridge Publishing.
Celebioglu F. and Dall’erba S. (2010) Spatial Disparities across the Regions of Turkey: An Exploratory Spatial Data Analysis, The Annals of Regional Science, 45, 2, 379-400. http://dx.doi.org/10.1007/s00168-009-0313-8
The Impacts of Political Terrorism on Gross Domestic Product in Eurasia: A Spatial Data…
EJBE 2015, 8 (15) Page | 35
Cooper H.H.A. (1976), Disorders and Terrorism, National Advisory Committee on Criminal Justice Standards and Goals, Washington D.C.
Crenshaw M. (1981) “The Causes of Terrorism”, Comparative Politics, 13 (4), 379-399. http://dx.doi.org/10.2307/421717
Dall’erba S. (2005) Distribution of Regional Income and Regional Funds in Europe 1989–1999: An Exploratory Spatial Data Analysis, The Annals of Regional Science, 39, 121-148. http://dx.doi.org/10.1007/s00168-004-0199-4
Derin-Güre P. (2010) “Separatist Terrorism and the Economic Conditions in South-Eastern Turkey”, Defence and Peace Economics, 22(4) 393-407. http://dx.doi.org/10.1080/10242694.2010.491727
Eck J. E., Chainey S., Cameron J. G., Leitner M., and Wilson R. E. (2005), Mapping Crime: Understanding Hot Spots, U.S. Department of Justice Office of Justice Programs National Institute of Justice, Special Report, August, www.ojp.usdoj.gov/nij
Enders W. and Sandler T. (2006), The Political Economy of Terrorism, Cambridge University Press, NewYork.
Ezcuerra R., Iraizoz B., Pascual P. and Rapún M (2008) Spatial Disparities in the European Agriculture: A Regional Analysis, Applied Economics, 40 (13), July 2008. 1669-1684(16).
Ezcuerra R., Pascual P. and Rapún M. (2007) Spatial Disparities in the European Union: An Analysis of Regional Polarization, The Annals of Regional Science, 41, 401–429. http://dx.doi.org/10.1007/s00168-006-0111-5
Fratianni M. and Kang H. (2006) International Terrorism, International Trade, and Borders, Indiana University, Kelley School of Business, Department of Business, Economics and Public Policy, Working Paper No: 2006-13, USA.
Gaibulloev K. and Sandler T. (2008), “The Impact of Terrorism and Conflicts on Growth in Asia,1970–2004”, ADB Institute Discussion Paper No. 113, Tokyo: Asian Dev. Bank Ins., http://www.adbi.org/discussionpaper/2008/07/25/2665.terrorism.impact.growth. conflicts.asia.1970.2004/.
Gries T., Krieger T. and Meierrieks D. (2009), “Casual Linkages Between Domestic Terrorism and Economic Growth”, Center for International Economics Working Papers Series No: 2009-2, Germany.
ITSR, International Terrorism and Security Research,http://www.terrorism-research.com/, 2011.
Kisangani E. E. and Nafziger W. (2007) “The Political Economy of State Terror”, Defence and Peace Economics, 18:5, 405-414. http://dx.doi.org/10.1080/10242690701455433
Klein A. (2007) The Costs of Terror: The Economic Consequences of Global Terrorism, (Editor: Konrad-Adenauer-Stiftung, Analysen&Argumente), No:41, May.
Lafree G., Dugan L., Xie M. and Singh P.(2012) “Spatial and Temporal Patterns of Terrorist Attacks by ETA 1970 to 2007”, Journal of Quantitative Criminology, 28, 7–29. http://dx.doi.org/10.1007/s10940-011-9133-y
Le Gallo J. and Ertur C. (2003) Exploratory spatial data analysis of the distribution of regional per capita GDP in Europe, 1980–1995, Papers in Regional Science, 82, 2, 175-201. http://dx.doi.org/10.1007/s101100300145
Manfred F.M., Fröhlich J., Gassler H. and Varga A. (2001) The Role Of Space in The Creation of New Technological Knowledge in Austria: An Exploratory Spatial Data Analysis, In:
Huseyin ALTAY & Fatih CELEBIOGLU
Page |36 EJBE 2015, 8 (15)
Manfred F.M. and Fröhlich J. (Eds.), Knowledge, Complexity and Innovation Systems, Springer, Berlin, 124-145.
Mirza D. and Verdier T. (2006a) International Trade, Security, and Transnational Terrorism: Theory and Empirics, World Bank Policy Research Working Paper 4093.
Mirza D. and Verdier T. (2006b) Are Lives a Substitute for Livelihoods? Terrorism, Security, and U.S. Bilateral Imports, World Bank Policy Research Working Paper 4094.
Murray A., McGuffog I., Western J. S. and Mullins P. (2001), Exploratory Spatial Data Analysis Techniques for Examining Urban Crime: Implications for Evaluating Treatment, British Journal of Criminolgy, 41, 2, 309-329. http://dx.doi.org/10.1093/bjc/41.2.309
Nitsch V. and Schumacher D. (2004) Terrorism and International Trade: An Empirical Investigation, European Journal of Political Economy, 20, 423–433. http://dx.doi.org/10.1016/j.ejpoleco.2003.12.009
Perobelli F.S. and Haddad E.(2003), “Brazillian Interregional Trade: An Exploratory Spatial Analysis”, TD-Nereus, http://www.econ.fea.usp.br/nereus/td%5CNereus_25_03.pdf, 25.
Piazza J.A. (2006) “Rooted in Poverty? Terrorism, Poor Economic Development, and Social Cleavages”, Terrorism and Political Violence, 18: 159–177. http://dx.doi.org/10.1080/095465590944578
Piazza J.A. (2011) “Poverty, Minority Economic Discrimination, and Domestic Terrorism”, Journal of Peace Research 48 (3), 339-353. http://dx.doi.org/10.1177/0022343310397404
Raby G. (2003) The Costs of Terrorism and the Benefits of Cooperating to Combat Terrorism, Department of Foreign Affairs and Trade, Economic Analytical Unit, Australia.
Rey S.J. and Montouri B.D. (1999) US Regional Income Convergence: A Spatial Econometric Perspective, Regional Studies, 33, 143–156. http://dx.doi.org/10.1080/00343409950122945
Ross, J.I. (1993) “Structural Causes of Oppositional Political Terrorism: Towards a Causal Model”, Journal of Peace Research, 30 (3), 317–329. http://dx.doi.org/10.1177/0022343393030003006
Rusnak D. M., Kennedy L.W., Eldivan I.S. and Caplan J.M. (2012) “Analyzing Terrorism Using Spatial Analysis Techniques: A Case Study of Turkish Cities”, in book: Evidence-Based Counterterrorism Policy, (Eds. Lum C. and Kennedy L. W.), Springer.
Sandler T. and Enders W. (2010), “Economic Consequences of Terrorism in Developed and Developing Countries: An Overview” pp. 17-47, In Edited Book (by Philip Keefer and Norman Loayza) Terrorism, Economic Development, and Political Openness, Cambridge University Press, London.
Shahrestani H. and Anaraki N. K. (2008), “Protectivity versus Productivity and Economic Growth: Empirical Evidence from Selected Countries”, International Business & Economics Research Journal, 7 (10), 43-51.
Siebeneck L.K., Medina R. M., Yamada I. and Hepner G. F. (2009) “Spatial and Temporal Analyses of Terrorist Incidents in Iraq, 2004–2006”, Studies in Conflict & Terrorism, 32, 591–610. http://dx.doi.org/10.1080/10576100902961789
Souza J., Mirza D. and Verdier T. (2010) Terrorism Networks and Trade: Does the Neighbor Hurt? CEPII Working Papers no: 2010-04, Paris.
Van Oort F.G. and Atzema O.A.L.C. (2004) On the Conceptualization of Agglomeration Economies: The Case of New Firm Formation in the Dutch ICT Sector, the Annals of Regional Science, 38, 263–290.
The Impacts of Political Terrorism on Gross Domestic Product in Eurasia: A Spatial Data…
EJBE 2015, 8 (15) Page | 37
Voss P.R., Long D.D., Hammer R.B. and Friedman S. (2006) County Child Poverty Rates in the US: A Spatial Regression Approach, Population Research and Policy Review, 25, 369–391. http://dx.doi.org/10.1007/s11113-006-9007-4
Wood R. M. and Gibney M. (2010) “The Political Terror Scale (PTS): A Re-introduction and a Comparison to CIRI”, Human Rights Quarterly, 32 (2), 367-400. http://dx.doi.org/10.1353/hrq.0.0152
Ying L.G. (2000) Measuring the Spillover Effects: Some Chinese Evidence, Papers in Regional Science, 79, 75–89. http://dx.doi.org/10.1007/s101100050004
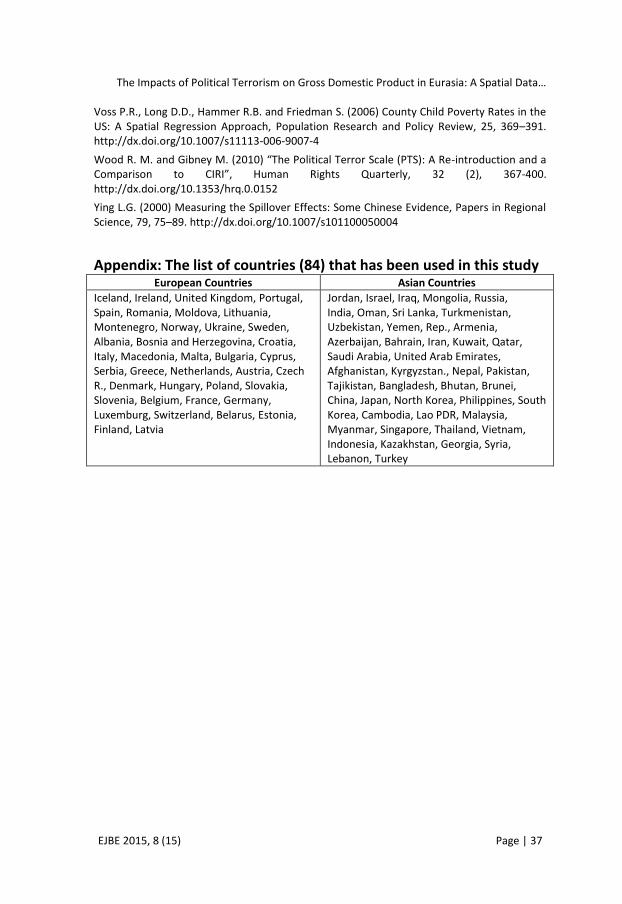
Appendix: The list of countries (84) that has been used in this study European Countries Asian Countries
Iceland, Ireland, United Kingdom, Portugal, Spain, Romania, Moldova, Lithuania, Montenegro, Norway, Ukraine, Sweden, Albania, Bosnia and Herzegovina, Croatia, Italy, Macedonia, Malta, Bulgaria, Cyprus, Serbia, Greece, Netherlands, Austria, Czech R., Denmark, Hungary, Poland, Slovakia, Slovenia, Belgium, France, Germany, Luxemburg, Switzerland, Belarus, Estonia, Finland, Latvia
Jordan, Israel, Iraq, Mongolia, Russia, India, Oman, Sri Lanka, Turkmenistan, Uzbekistan, Yemen, Rep., Armenia, Azerbaijan, Bahrain, Iran, Kuwait, Qatar, Saudi Arabia, United Arab Emirates, Afghanistan, Kyrgyzstan., Nepal, Pakistan, Tajikistan, Bangladesh, Bhutan, Brunei, China, Japan, North Korea, Philippines, South Korea, Cambodia, Lao PDR, Malaysia, Myanmar, Singapore, Thailand, Vietnam, Indonesia, Kazakhstan, Georgia, Syria, Lebanon, Turkey