Embed Size (px)
Citation preview
The Impact of Reversing Regulatory Arbitrage on LoanOriginations: Evidence from Bank Holding Companies
David H. Downs & Lan Shi
# Springer Science+Business Media New York 2014
Abstract Mortgage banking subsidiaries of bank holding companies (BHCs) becameincreasingly active players in the mortgage origination market during the last decade.At the time, the Federal Reserve Board (FRB) had supervisory power over BHCs, andunder the Bank Holding Company Act was authorized to monitor and examine thesubsidiaries of BHCs under certain circumstances. However, this authority did notclearly extend to routine examinations of nonbank subsidiaries of BHCs. Thischanged between 2007 and 2009 due to FRB policy on consumer compliancesupervision for nonbank subsidiaries of BHCs. Our empirical analysis tests for theimpact of the new policy on the quantity and quality of loan originations by mortgagebanking subsidiaries of BHCs. We use a difference-in-differences estimator with thecontrol group being other types of lenders. We show that loan production moved frommortgage banking subsidiaries to their affiliated depository institutions after the policychange. The quality of loans originated by mortgage banking subsidiaries of BHCsincreased after the policy change: The denial rates for mortgage applications in-creased, loan-to-income ratios decreased, and the proportion of owner occupiedhouses increased in mortgage banking subsidiaries more than they did in other typesof lenders.
Keywords Regulatory arbitrage . Housingmarket . Mortgage banking . Bank holdingcompanies . Incentives . Loan origination
JEL Classifications G01 . G21 . G28
J Real Estate Finan EconDOI 10.1007/s11146-014-9468-x
D. H. Downs (*)The Kornblau Institute, Virginia Commonwealth University, Snead Hall, 301 West Main Street,Richmond, VA 232844000, USAe-mail: [email protected]
L. ShiOffice of the Comptroller of the Currency, Enterprise Risk Analysis Division, 400 7th St SW,Washington, DC 20219, USAe-mail: [email protected]
Introduction
The 2008 credit crisis exposed various loopholes in U.S. financial system regulations,including those for security markets, lenders, and consumer protection. The lax loanorigination standards of lenders were a critical element in the U.S. mortgage marketdebacle. One regulatory loophole had received earlier attention. In 2004, the Govern-ment Accounting Office (GAO) issued a report detailing the Federal Reserve Board(FRB)’s lack of examination power over mortgage banking subsidiaries (MBSs) ofbank holding companies (BHCs) with respect to consumer protection compliance(GAO 2004). The impact of this loophole, which created an opportunity for regulatoryarbitrage—and its subsequent reversal—is the focus of this paper.
There are various types of mortgage lenders in the U.S. First are the depository-takinglending institutions, which include commercial banks, thrifts, and credit unions. Theyreceive deposits and originate loans. Due to the importance of these institutions and thefederal deposit insurance they receive, they are heavily regulated by correspondingfederal agencies; see Section 2 and Table 1 for more details.1 They are monitored androutinely examined for (1) safety and soundness and (2) compliance with federal laws,including consumer protection laws. The second type of lender is the non-depositoryindependent mortgage companies, which do not take deposits. Rather, they use equityand borrowed money to engage in mortgage lending. Independent mortgage companiesare subject to state licensing requirements, laws, and regulations. In many cases, stateoversight has been light. The last type of lender is non-depositoryMBSs of bank holdingcompanies (BHC). For instance, one of the largest subprime mortgage lenders wasCountrywide Home Loans, which was a subsidiary of Countrywide Financial Corp.,which in turn was a BHC—the parent company of Countrywide Bank, FSB, a federallychartered bank.2 The FRB regulates BHCs, which it monitors and examines. Under theBank Holding Act, the FRB has the authority to examine MBSs under certain circum-stances, but the authority does not extend clearly to their routine examination withrespect to compliance with consumer protection laws (GAO 2004). Similar to indepen-dent mortgage companies, MBSs of BHCs need to obey state laws and regulations.
The originate-to-distribute mortgage financing model gave lenders incentives toincrease loan origination volume and de-emphasize loan origination quality (Keys,Mukherjee, Seru, and Vig 2010; Purnanandam 2011; Kau, Keenan, Lyubimov, andSlawson 2012). While all lenders faced such incentives and competitive pressure,depository institutions were subject to supervision by their federal regulatory agenciesfor (1) safety and soundness (evaluating capital adequacy, reviewing risk profile, andestablishing regulatory ratings for capital, assets, management, earnings, and liquidity)and (2) consumer protection. Given the fact that independent mortgage companies andMBSs of BHCs were lightly regulated, they quickly sprang up to fill the appetite forloans from the secondary market.3 Many of the originated loans turned out to be of lowquality, and later defaulted (Mian and Sufi 2009; Demyanyk and Van Hemert 2011).
1 Depository institutions can also set up non-depository MBSs to engage in the lending business, and they aresupervised by their respective federal agencies as well.2 Countrywide Bank later became a thrift, and thus its regulator changed from the OCC to OTS.3 It should be noted that in the years running up to the 2007 subprime crisis, some states toughened theirmortgage broker and bank licensing requirements and enacted laws, which were more stringent than thefederal laws, to battle predatory lending.
D.H. Downs, L. Shi
In July 2007, the FRB initiated a pilot program to begin examining MBSs of BHCsfor compliance with consumer protection laws and regulations.4 The policy requiresFRB staff to conduct risk-focused consumer compliance supervision of—and investi-gate consumer complaints against—these entities with respect to activities covered bythe consumer protection laws and regulations within the FRB’s enforcementjurisdiction.
This significant policy change raises interesting questions. Did the quantity of loansmade by MBSs of BHCs decrease afterwards? And, how might the quality of loanshave changed? We aim to answer these questions. In doing so, we will contribute to theliterature on how organizations exploit loopholes in regulations—regulatory arbi-trage—and how they respond when a loophole is closed.
A significant hurdle in any period-specific study examining regulatory change is theconfounding (or potential confounding) events of the time. Admittedly, our biggestchallenge is the articulation of a careful empirical plan to disentangle the policy changeand the financial environment of the study period. This plan is addressed and executedin the sections that follow.
Several papers are closely related to and complement ours. Keys et al. (2009)examine mortgage companies as lightly regulated parties. The authors find that inde-pendent mortgage companies did not have a lower quality of loan origination than otherlender types, a seeming puzzle that our paper addresses: While independent mortgage
4 In September 2009, the FRB formally issued an important policy relating to the FRB’s supervision ofnonbank subsidiaries of bank holding companies (BHCs) and foreign banking organizations (FBOs).
Table 1 Regulatory environment for various types of lenders before 2010 Dodd-Frank Act
Routine exams by federal agencies(safety and soundness, consumerprotection, etc.)
State laws and regulations(such as anti-predatorylaws)
National banks and their mortgagebanking subsidiaries
Yes, by OCC No; federal preemptionsince 2004
Federal thrifts and their mortgagebanking subsidiaries
Yes, by OTS No; federal preemptionsince 2001
State-chartered banks, members ofFRB, and their mortgage bankingsubsidiaries
Yes, by FRB Yes
State chartered banks, non-membersof FRB, and their mortgagebanking subsidiaries
Yes, by FDIC Yes
MBSs of BHCs Consumer protection: No, before July2007; Yes, by FRB after July 2007
Yes
State licensed independent mortgagecompanies
Consumer protection: Yes, by HUD Yes
This table shows the regulatory environment for lenders prior to the July 2010 Dodd-FrankAct. OCC=Office ofthe Comptroller of the Currency of the Department of Treasury. OTS=Office of Thrift Supervision (merged intoOCC in 2011) of the Department of Treasury. FRB=Federal Reserve Board and its branches. FDIC=FederalDeposit Insurance Corporation. HUD=U.S. Department of Housing and Urban Development
The Impact of Reversing Regulatory Arbitrage on Loan Originations
companies were under light state regulations, other types of lenders—and in particular,MBSs of BHCs—were also subject to light regulation.5
Demyanyk and Loutskina (2013), whose paper is closely related to ours, examineregulatory arbitrage by mortgage companies, particularly MBSs of BHCs during theperiod leading up to the credit crisis. Our paper complements their study by examiningthe impact of reversing regulatory arbitrage on MBSs of BHCs.6 Agarwal et al. (2013)examine the regulatory inconsistency between federal and state regulation for state-chartered commercial banks and find that inconsistent oversight hampers theeffectiveness of regulation. Agarwal and Evanoff (2013) examine how BHCs steeredprime borrowers into subprime loans by moving them from the depositories of a BHCto the MBS of the BHC.
The balance of the paper begins with a more in-depth review of the institutionalenvironment and the rule change. In the following sections we develop our hypotheses,describe the research design with particular emphasis on the identification strategies,discuss the data and present the empirical results. The final section summarizes the keyfinding and offers a conclusion.
Institutional Background
Regulatory Environment—Context
With respect to regulatory agencies, there are six types of lenders: federal-charterednational banks and their MBSs, thrifts and their MBSs, FRB-member state-charteredbanks, non-FRB-member state-chartered banks, MBSs of bank holding companies, andindependent mortgage companies.
During the sample period and at the federal level, national banks and their MBSs aresupervised and regulated by the Office of Comptroller of the Currency (OCC); thriftsand their MBSs are supervised and examined by the Office of Thrift Supervision(OTS),7 state-chartered banks that are members of the federal reserve system and theirsubsidiaries are supervised by federal reserve banks, state-chartered banks that are notmembers of federal reserve system and their subsidiaries are supervised by the FDIC,MBSs of BHCs are (lightly) supervised by FRB, and independent mortgage companiesare lightly regulated by HUD, with enforcement carried out by the Federal TradeCommission (FTC) for violation of federal laws.8 Table 1 lists the regulatory environ-ment for various types of lenders.
Many federally and state-chartered banks and thrifts, as well as their subsidiaries, arepart of larger financial or bank holding companies. These banks and thrifts are
5 Ding et al. (2010), in a series of papers, examine the impact of federal preemption on national banks’ lendingpractices.6 A relatively larger literature examines regulatory capital arbitrage; for example, see Calem and Follain(2007).7 The OTS became part of the OCC in July 2011.8 As for state-level laws and regulations, OTS-chartered thrifts and their MBSs have been exempt from stateconsumer protection laws and regulations since as early as in 1990s. OCC-chartered banks were exemptstarting in 2004 (see the notice by the OCC in 2004). State-chartered banks and their mortgage bankingsubsidiaries are subject to state consumer protection laws and regulations, as are state-licensed independentmortgage companies. MBSs of BHCs must obey state consumer protection laws and regulations as well.
D.H. Downs, L. Shi
supervised by the corresponding federal and state regulatory agencies, as discussedabove. At the same time, these holding companies may also include nonbank subsid-iaries, such as finance and mortgage companies, that are subsidiaries of BHCs.Although these MBSs engage in financial activities that may be subject to federalconsumer protection and fair lending laws, unlike depository institutions they are notsubject to routine supervisory examinations for compliance with those laws. As notedin the GAO report (GAO 2004), while the FRB has supervisory power over BHCs forpurposes of the Bank Holding Company Act, it lacks clear authority to examine MBSsfor their compliance with consumer protection laws, in the same way that the federalregulators monitor their depository institutions. This group of lenders—MBSs ofBHC—is the focus of our study.
Nonbank subsidiaries of holding companies engaged in a significant amount ofsubprime mortgage lending during the years leading to the 2007 crisis. Of the totalsubprime loan originations made by the top 25 subprime lenders in the first 6 months of2003, 24 % were originated by nonbank subsidiaries of holding companies (GAO2004). In addition, of the 178 lenders on HUD’s 2001 subprime lender list, 20 % werenonbank subsidiaries of holding companies. These subsidiaries have also been targetsof some of the most notable federal and state enforcement actions involving abusivelending. For example, The Associates and Fleet Finance, both nonbank subsidiaries ofbank holding companies, were defendants in two of the three largest cases involvingsubprime lending brought forward by the FTC (GAO 2004).
Federal consumer protection laws do not give the FRB specific enforcement juris-diction over nonbank subsidiaries. For this reason, the FTC is the primary federalagency monitoring nonbank subsidiary compliance with consumer protection laws.While the FTC is the primary federal enforcer of consumer protection laws for thesenonbank subsidiaries, it is a law-enforcement, rather than a supervisory, agency. Thus,the FTC’s mission and resource allocations are focused on conducting investigations inresponse to consumer complaints and other information rather than on routine moni-toring and examination responsibilities. Moreover, while MBSs of BHCs have to obeystate laws and regulations, states vary widely in the extent to which they regulatepractices that can constitute predatory lending.
FRB Policy Change Related to MBSs of BHCs
On September 14, 2009, the FRB issued an important policy relating to the supervisionof nonbank subsidiaries of BHCs.9 The policy required that FRB staff conduct risk-focused consumer compliance supervision of, and investigate consumer complaintsagainst, these entities with respect to activities covered by the consumer protection lawsand regulations within the FRB’s enforcement jurisdiction. In its press release accom-panying the policy, the FRB stated that the policy was “designed to improve the[FRB’s] understanding of the consumer compliance risk that certain products andservices may pose to the holding companies and consumers and to guide supervisoryactivities for these entities.”
The new policy built on a joint pilot project that the FRB launched in July2007 with the FTC, OTS, and associations of state regulators. The project focused
9 The new regulation also applied to foreign banking organizations (FBOs).
The Impact of Reversing Regulatory Arbitrage on Loan Originations
on a select group of non-depository lenders with significant subprime mortgageoperations. The policy provided for FRB supervision of eleven consumer protectionlaws: (1) the Truth in Lending Act, (2) the Equal Credit Opportunity Act, (3) theHome Ownership and Equity Protection Act (HOEPA), (4) the Fair Credit BillingAct, (5) the Consumer Leasing Act, (6) the Fair Credit Reporting Act, (7) the FairDebt Collection Practices Act, (8) the Home Mortgage Disclosure Act, (9) theTruth in Savings Act, (10) any FRB rules promulgated under the Federal TradeCommission Act, and (11) the Real Estate Settlement Procedures Act. Theselaws—and especially HOEPA—provide protection to borrowers against lenders’predatory lending behavior.
Under the new policy, the FRB was to conduct consumer compliance risk assess-ments for nonbank subsidiaries of BHCs and FBOs. Based on these risk assessments,which examined off-site and on-site reviews and consumer complaints, the FRBplanned supervisory activities. These supervisory activities would be risk-focusedand include continuous monitoring, discovery reviews, and targeted or full-scopeexaminations with transaction testing. In addition, consumer complaints would beinvestigated. Formal enforcement actions include written agreements, civil monetarypenalties, and cease and desist orders.
Historically, consumer compliance at the nonbank subsidiaries of BHCs and FBOshave received little attention from the FRB; absent a large number of consumercomplaints or other indications of a problem, these companies could expect to addressconsumer compliance issues on their own. The FRB’s decision to play an active role insupervising consumer compliance by nonbank subsidiaries of BHCs spurred a renewedfocus on consumer compliance issues.
For nonbank subsidiaries of BHCs and FBOs, the new policy was intended todramatically alter how they managed consumer compliance issues: Going forward,they would receive treatment comparable to that of their affiliated banks with regard tothe scope and depth of examination and supervision (Morrison & Foerster 2009).
Hypotheses
A BHC can use its bank and MBSs to lend money. Prior to 2007, MBSs did not receiveexamination in the same way that their depository affiliates (i.e., banks, thrifts, andcredit unions) did for consumer protection compliance. The compliance risk, therefore,was lower for MBSs. Demyanyk and Loutskina (2013), for instance, document thatMBSs of BHCs originated lower quality loans than their affiliated depositories underthe same BHC. Agarwal and Evanoff (2013) document that depository institutions ofBHCs steered borrowers to subprime loans originated by mortgage affiliates under thesame BHC.
As discussed in Section 2, MBSs of BHCs are to be examined by the FRB for theirconsumer protection as a result of the 2007–09 policy change. In sum, FRB not onlyconducts ex post investigations, but also ex ante examinations with respect to compli-ance with consumer protection laws. While depositories under BHCs are still undermuch stricter safety and soundness regulations than MBSs under BHCs, at least withrespect to consumer protection compliance, the two identities are now on a levelingplaying field.
D.H. Downs, L. Shi
Thus, we have our first two hypotheses
Hypothesis 1a MBSs of BHCs will reduce lending volume with the FRB policychange on supervision on MBSs of BHCs.
Hypothesis 1b Their affiliated banks or thrifts will fill in the reduced lending by MBSsof BHCs by increasing lending volume.
In the case of loans still being originated by MBSs of BHCs, although formerly theycould pursue quantity with little regard for loan origination quality or consumerinterests—as long as they could sell and get financing from warehouse lenders—theyare now examined and supervised for originated loans to determine whether theirlending practices violate federal consumer protection laws and regulations. This extramonitoring is hypothesized to raise the cost of engaging in abusive lending; therefore,we have:
Hypothesis 2a Loans originated by MBSs of BHCs after the policy change are ofhigher quality than those originated before the policy change.
The banks or thrifts affiliated with MBSs of BHCs (affiliated depositories) are underthe same regulatory supervision as they were before the program change. Therefore, wehave a second hypothesis stated as a null:
Hypothesis 2b Loans originated by affiliated depositories after the policy change are ofthe same quality as those originated before the policy change.
Research Design
Identification Strategies
Other simultaneous policy changes could affect our results, particularly the Dodd-FrankAct. The Act, however—a sweeping reform intended to affect national banks, thrifts,and mortgage companies—was passed in mid-2010 and expected to take effect18 months later. Its effects, therefore, do not influence our analysis, which exploitsdata that begin in 2000 and end in 2010.
Several policy changes took effect around July 2007. For example, in June 2007 theFRB, in partnership with other federal banking agencies and two state bankingregulators issued a statement on mortgage lending practices. It is important, therefore,that we separate the effect of other policy changes from the FRB change of oversight ofMBSs of BHCs. We note that this policy change applied to both depositories andmortgage companies.
Probably the most prominent event that might confound our analysis is the 2007subprime crisis, after which the private-label securitization market, which securitizedmost of the jumbo, Alt-A, and subprime loans, literally shut down; the governmentsponsored agency (GSE) and government agency channel were still working. Thispotentially affected mortgage companies, either MBSs under BHCs or independentmortgage companies that relied heavily on a fluid private label market.
The Impact of Reversing Regulatory Arbitrage on Loan Originations
To isolate the effect of FRB policy change from that of the impact of the disappear-ance of the private label securitization (PLS) market, we use the independent mortgagecompanies as the control group, as the PLS market might have affected mortgagecompanies as much, if not more, than it affected MBSs under BHCs. In what follows,we examine whether this is true.
One direct way to determine whether a lender would be affected by the PLS marketis to identify to what degree it relies on PLS as the ultimate funding source. HMDArequires the lender to report the disposition of the originated loan at the end of the yearof origination. The disposition is categorized as (1) held in the lender’s portfolio, (2)sold to GSE or a government agency (Ginnie Mae or Farmer Mac), (3) sold to aninstitution that the seller of the loan knows or reasonably believes will securitize theloan, (4) sold to an institution that the seller of the loan does not know will securitizethe loan and that the seller knows frequently holds or disposes of loans by means otherthan securitization; this type of purchaser includes depositories, non-depositories,affiliates, and others.
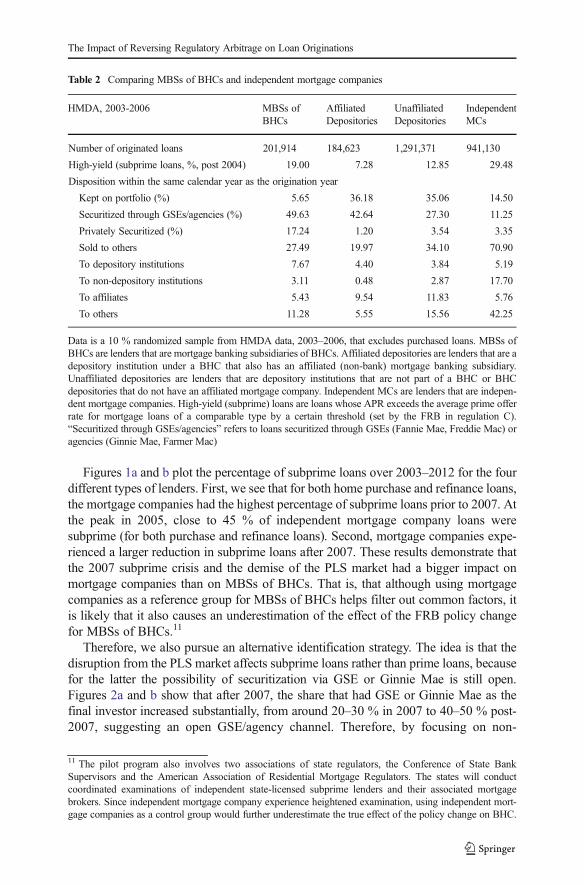
Table 2 shows that (1) the percentage of loans kept on the lender’s portfolio isaround 10 percentage point lower for MBSs of BHCs than for independent mortgagecompanies and (2) the percentage of loans that are private-label securitized is around 10percentage points higher for MBSs of BHCs than for independent mortgage compa-nies—yet (3) the percentage of loans securitized through GSEs is close to 40 percent-age points higher for MBSs of BHCs than for independent mortgage companies. Thissuggests that MBSs of BHCs originated more conforming loans than independentmortgage companies. Since the GSE channel was still open and functioning duringand after the 2007 subprime crisis, this is evidence that MBSs of BHCs were lessdisrupted by the market upheaval than independent mortgage companies. Therefore,using independent mortgage companies as the control group in estimating the effect ofFRB policy change would tend to underestimate (i.e., provide a lower bound of) theeffect of FRB policy change on MBSs of BHCs.10
The disappearance of the PLS market mainly affected subprime loans, and thereforeanother way to examine whether MBSs of BHCs relied on the PLS market as much asindependent mortgage companies is to look at the proportion of subprime loans in theirlending.
High interest rates can be associated with high-risk loans, often involving subprimeborrowers (borrowers with impaired credit history). The Home Mortgage DisclosureAct (HMDA) data does not report the interest rate charged for originated loans, exceptin the case in which the APR exceeds the average prime offer rate for mortgage loans ofa comparable type by a certain threshold (set by the FRB in Regulation C). In this case,the rate spread is reported (since 2004 in the HMDA). Researchers treat this as a sign ofsubprime loans, and we follow suit here (Dell’ariccia, Igan, and Laeven 2012;Demyanyk and Loutskina 2013).
10 A potential weakness of using HMDA data is that the lender does not know the final disposition for manyof its loans—it only knows the investor at the end of the calendar year of the origination year. Other datasets have information on the final investor. Demyanyk and Loutskina (2013) report that the portion that isprivate-label securitized is close to 10 percentage points lower for MBSs of BHCs than for independentmortgage companies, and the portion that is securitized through GSEs is close to 20 percentage points higherfor MBSs of BHCs than for independent mortgage companies. Overall, these numbers are consistent withour findings here.
D.H. Downs, L. Shi
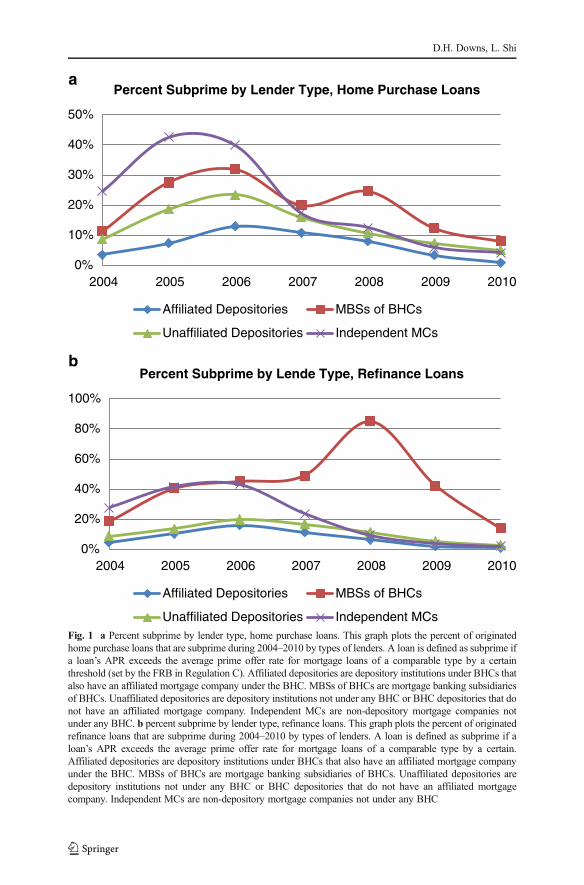
Figures 1a and b plot the percentage of subprime loans over 2003–2012 for the fourdifferent types of lenders. First, we see that for both home purchase and refinance loans,the mortgage companies had the highest percentage of subprime loans prior to 2007. Atthe peak in 2005, close to 45 % of independent mortgage company loans weresubprime (for both purchase and refinance loans). Second, mortgage companies expe-rienced a larger reduction in subprime loans after 2007. These results demonstrate thatthe 2007 subprime crisis and the demise of the PLS market had a bigger impact onmortgage companies than on MBSs of BHCs. That is, that although using mortgagecompanies as a reference group for MBSs of BHCs helps filter out common factors, itis likely that it also causes an underestimation of the effect of the FRB policy changefor MBSs of BHCs.11
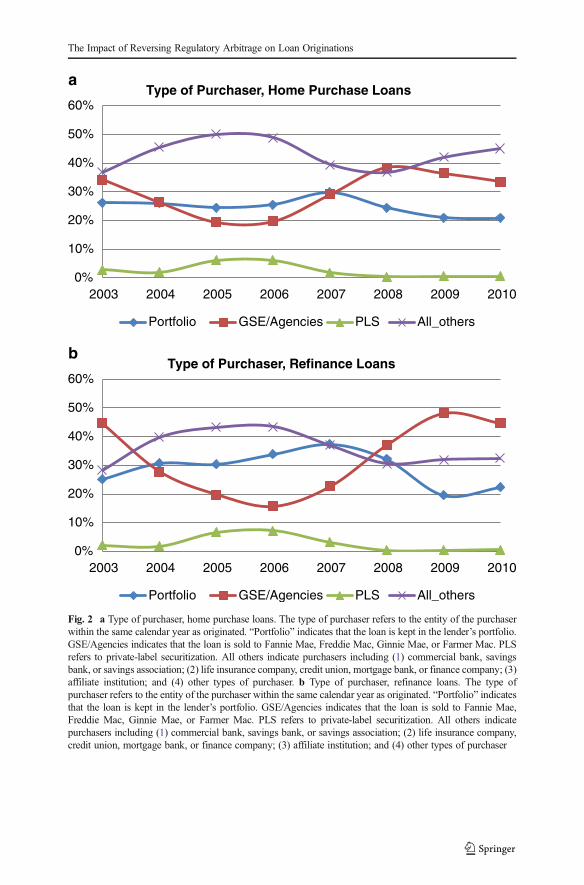
Therefore, we also pursue an alternative identification strategy. The idea is that thedisruption from the PLS market affects subprime loans rather than prime loans, becausefor the latter the possibility of securitization via GSE or Ginnie Mae is still open.Figures 2a and b show that after 2007, the share that had GSE or Ginnie Mae as thefinal investor increased substantially, from around 20–30 % in 2007 to 40–50 % post-2007, suggesting an open GSE/agency channel. Therefore, by focusing on non-
11 The pilot program also involves two associations of state regulators, the Conference of State BankSupervisors and the American Association of Residential Mortgage Regulators. The states will conductcoordinated examinations of independent state-licensed subprime lenders and their associated mortgagebrokers. Since independent mortgage company experience heightened examination, using independent mort-gage companies as a control group would further underestimate the true effect of the policy change on BHC.
Table 2 Comparing MBSs of BHCs and independent mortgage companies
HMDA, 2003-2006 MBSs ofBHCs
AffiliatedDepositories
UnaffiliatedDepositories
IndependentMCs
Number of originated loans 201,914 184,623 1,291,371 941,130
High-yield (subprime loans, %, post 2004) 19.00 7.28 12.85 29.48
Disposition within the same calendar year as the origination year
Kept on portfolio (%) 5.65 36.18 35.06 14.50
Securitized through GSEs/agencies (%) 49.63 42.64 27.30 11.25
Privately Securitized (%) 17.24 1.20 3.54 3.35
Sold to others 27.49 19.97 34.10 70.90
To depository institutions 7.67 4.40 3.84 5.19
To non-depository institutions 3.11 0.48 2.87 17.70
To affiliates 5.43 9.54 11.83 5.76
To others 11.28 5.55 15.56 42.25
Data is a 10 % randomized sample from HMDA data, 2003–2006, that excludes purchased loans. MBSs ofBHCs are lenders that are mortgage banking subsidiaries of BHCs. Affiliated depositories are lenders that are adepository institution under a BHC that also has an affiliated (non-bank) mortgage banking subsidiary.Unaffiliated depositories are lenders that are depository institutions that are not part of a BHC or BHCdepositories that do not have an affiliated mortgage company. Independent MCs are lenders that are indepen-dent mortgage companies. High-yield (subprime) loans are loans whose APR exceeds the average prime offerrate for mortgage loans of a comparable type by a certain threshold (set by the FRB in regulation C).“Securitized through GSEs/agencies” refers to loans securitized through GSEs (Fannie Mae, Freddie Mac) oragencies (Ginnie Mae, Farmer Mac)
The Impact of Reversing Regulatory Arbitrage on Loan Originations
0%
10%
20%
30%
40%
50%
a
b
2004 2005 2006 2007 2008 2009 2010
Affiliated Depositories MBSs of BHCs
Unaffiliated Depositories Independent MCs
0%
20%
40%
60%
80%
100%
2004 2005 2006 2007 2008 2009 2010
Percent Subprime by Lende Type, Refinance Loans
Affiliated Depositories MBSs of BHCs
Unaffiliated Depositories Independent MCs
Percent Subprime by Lender Type, Home Purchase Loans
Fig. 1 a Percent subprime by lender type, home purchase loans. This graph plots the percent of originatedhome purchase loans that are subprime during 2004–2010 by types of lenders. A loan is defined as subprime ifa loan’s APR exceeds the average prime offer rate for mortgage loans of a comparable type by a certainthreshold (set by the FRB in Regulation C). Affiliated depositories are depository institutions under BHCs thatalso have an affiliated mortgage company under the BHC. MBSs of BHCs are mortgage banking subsidiariesof BHCs. Unaffiliated depositories are depository institutions not under any BHC or BHC depositories that donot have an affiliated mortgage company. Independent MCs are non-depository mortgage companies notunder any BHC. b percent subprime by lender type, refinance loans. This graph plots the percent of originatedrefinance loans that are subprime during 2004–2010 by types of lenders. A loan is defined as subprime if aloan’s APR exceeds the average prime offer rate for mortgage loans of a comparable type by a certain.Affiliated depositories are depository institutions under BHCs that also have an affiliated mortgage companyunder the BHC. MBSs of BHCs are mortgage banking subsidiaries of BHCs. Unaffiliated depositories aredepository institutions not under any BHC or BHC depositories that do not have an affiliated mortgagecompany. Independent MCs are non-depository mortgage companies not under any BHC
D.H. Downs, L. Shi
0%
10%
20%
30%
40%
50%
60%
2003 2004 2005 2006 2007 2008 2009 2010
Type of Purchaser, Home Purchase Loansa
b
Portfolio GSE/Agencies PLS All_others
0%
10%
20%
30%
40%
50%
60%
2003 2004 2005 2006 2007 2008 2009 2010
Type of Purchaser, Refinance Loans
Portfolio GSE/Agencies PLS All_others
Fig. 2 a Type of purchaser, home purchase loans. The type of purchaser refers to the entity of the purchaserwithin the same calendar year as originated. “Portfolio” indicates that the loan is kept in the lender’s portfolio.GSE/Agencies indicates that the loan is sold to Fannie Mae, Freddie Mac, Ginnie Mae, or Farmer Mac. PLSrefers to private-label securitization. All others indicate purchasers including (1) commercial bank, savingsbank, or savings association; (2) life insurance company, credit union, mortgage bank, or finance company; (3)affiliate institution; and (4) other types of purchaser. b Type of purchaser, refinance loans. The type ofpurchaser refers to the entity of the purchaser within the same calendar year as originated. “Portfolio” indicatesthat the loan is kept in the lender’s portfolio. GSE/Agencies indicates that the loan is sold to Fannie Mae,Freddie Mac, Ginnie Mae, or Farmer Mac. PLS refers to private-label securitization. All others indicatepurchasers including (1) commercial bank, savings bank, or savings association; (2) life insurance company,credit union, mortgage bank, or finance company; (3) affiliate institution; and (4) other types of purchaser
The Impact of Reversing Regulatory Arbitrage on Loan Originations
subprime loans that were not materially impacted by the 2007 subprime crisis and itsaftermath, we can identify the change in behavior by MBSs of BHCs in response to the2007 FRB policy change.
We also examine the affiliated depositories (depositories under BHCs that have anaffiliated MBS); the natural comparison group for them is unaffiliated depositories(BHC depositories without affiliated MBSs and independent depositories).
Specification
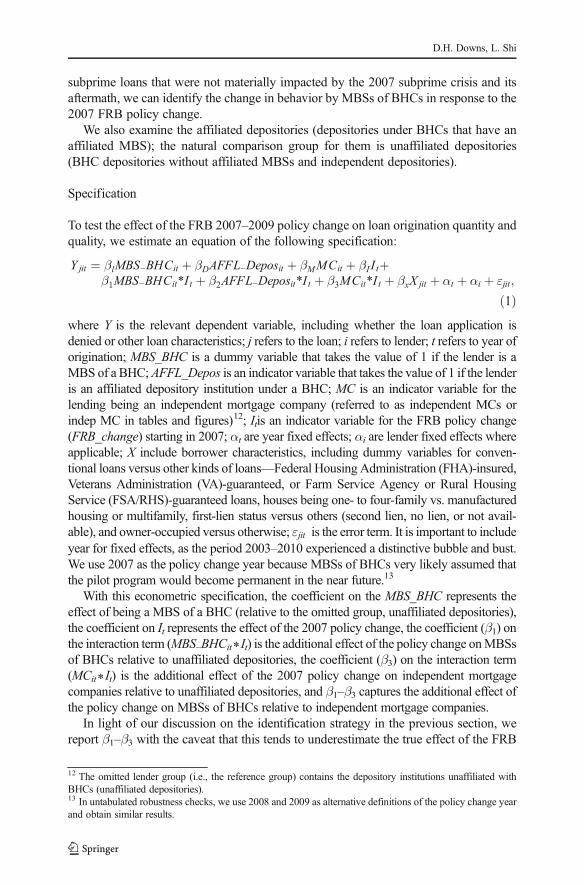
To test the effect of the FRB 2007–2009 policy change on loan origination quantity andquality, we estimate an equation of the following specification:
Y jit ¼ βlMBS−BHCit þ βDAFFL−Deposit þ βMMCit þ βI I tþβ1MBS−BHCit*I t þ β2AFFL−Deposit*I t þ β3MCit*I t þ βxX jit þ αt þ αi þ εjit;
ð1Þwhere Y is the relevant dependent variable, including whether the loan application isdenied or other loan characteristics; j refers to the loan; i refers to lender; t refers to year oforigination; MBS_BHC is a dummy variable that takes the value of 1 if the lender is aMBS of a BHC;AFFL_Depos is an indicator variable that takes the value of 1 if the lenderis an affiliated depository institution under a BHC; MC is an indicator variable for thelending being an independent mortgage company (referred to as independent MCs orindep MC in tables and figures)12; Itis an indicator variable for the FRB policy change(FRB_change) starting in 2007; αt are year fixed effects; αi are lender fixed effects whereapplicable; X include borrower characteristics, including dummy variables for conven-tional loans versus other kinds of loans—Federal Housing Administration (FHA)-insured,Veterans Administration (VA)-guaranteed, or Farm Service Agency or Rural HousingService (FSA/RHS)-guaranteed loans, houses being one- to four-family vs. manufacturedhousing or multifamily, first-lien status versus others (second lien, no lien, or not avail-able), and owner-occupied versus otherwise; εjit is the error term. It is important to includeyear for fixed effects, as the period 2003–2010 experienced a distinctive bubble and bust.We use 2007 as the policy change year because MBSs of BHCs very likely assumed thatthe pilot program would become permanent in the near future.13
With this econometric specification, the coefficient on the MBS_BHC represents theeffect of being a MBS of a BHC (relative to the omitted group, unaffiliated depositories),the coefficient on It represents the effect of the 2007 policy change, the coefficient (β1) onthe interaction term (MBS−BHCit∗It) is the additional effect of the policy change onMBSsof BHCs relative to unaffiliated depositories, the coefficient (β3) on the interaction term(MCit∗It) is the additional effect of the 2007 policy change on independent mortgagecompanies relative to unaffiliated depositories, and β1–β3 captures the additional effect ofthe policy change on MBSs of BHCs relative to independent mortgage companies.
In light of our discussion on the identification strategy in the previous section, wereport β1–β3 with the caveat that this tends to underestimate the true effect of the FRB
12 The omitted lender group (i.e., the reference group) contains the depository institutions unaffiliated withBHCs (unaffiliated depositories).13 In untabulated robustness checks, we use 2008 and 2009 as alternative definitions of the policy change yearand obtain similar results.
D.H. Downs, L. Shi
policy change on MBSs of BHCs. Following our discussion of the alternative identi-fication strategy in the previous section, we also report the coefficient β1 in a sample ofnon-subprime loans; we treat this as our preferred specification.
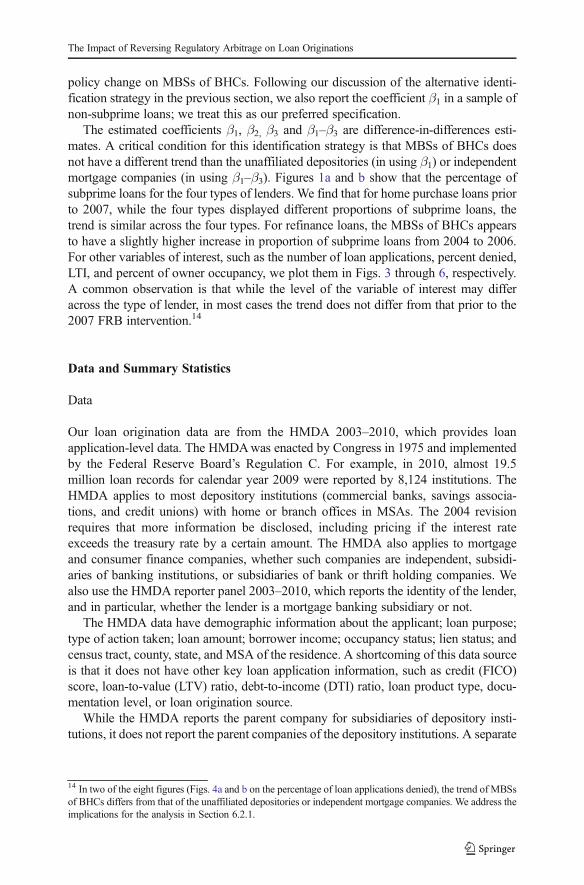
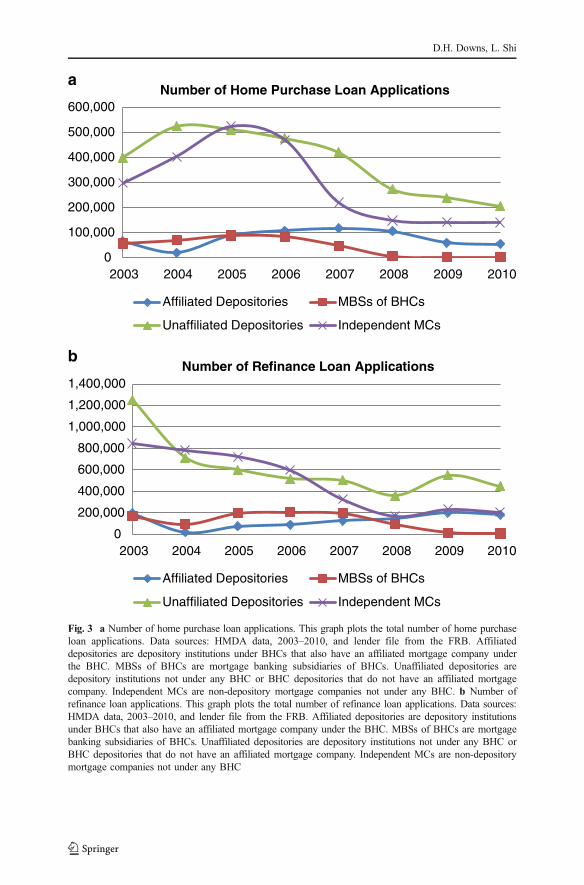
The estimated coefficients β1, β2, β3 and β1–β3 are difference-in-differences esti-mates. A critical condition for this identification strategy is that MBSs of BHCs doesnot have a different trend than the unaffiliated depositories (in using β1) or independentmortgage companies (in using β1–β3). Figures 1a and b show that the percentage ofsubprime loans for the four types of lenders. We find that for home purchase loans priorto 2007, while the four types displayed different proportions of subprime loans, thetrend is similar across the four types. For refinance loans, the MBSs of BHCs appearsto have a slightly higher increase in proportion of subprime loans from 2004 to 2006.For other variables of interest, such as the number of loan applications, percent denied,LTI, and percent of owner occupancy, we plot them in Figs. 3 through 6, respectively.A common observation is that while the level of the variable of interest may differacross the type of lender, in most cases the trend does not differ from that prior to the2007 FRB intervention.14
Data and Summary Statistics
Data
Our loan origination data are from the HMDA 2003–2010, which provides loanapplication-level data. The HMDAwas enacted by Congress in 1975 and implementedby the Federal Reserve Board’s Regulation C. For example, in 2010, almost 19.5million loan records for calendar year 2009 were reported by 8,124 institutions. TheHMDA applies to most depository institutions (commercial banks, savings associa-tions, and credit unions) with home or branch offices in MSAs. The 2004 revisionrequires that more information be disclosed, including pricing if the interest rateexceeds the treasury rate by a certain amount. The HMDA also applies to mortgageand consumer finance companies, whether such companies are independent, subsidi-aries of banking institutions, or subsidiaries of bank or thrift holding companies. Wealso use the HMDA reporter panel 2003–2010, which reports the identity of the lender,and in particular, whether the lender is a mortgage banking subsidiary or not.
The HMDA data have demographic information about the applicant; loan purpose;type of action taken; loan amount; borrower income; occupancy status; lien status; andcensus tract, county, state, and MSA of the residence. A shortcoming of this data sourceis that it does not have other key loan application information, such as credit (FICO)score, loan-to-value (LTV) ratio, debt-to-income (DTI) ratio, loan product type, docu-mentation level, or loan origination source.
While the HMDA reports the parent company for subsidiaries of depository insti-tutions, it does not report the parent companies of the depository institutions. A separate
14 In two of the eight figures (Figs. 4a and b on the percentage of loan applications denied), the trend of MBSsof BHCs differs from that of the unaffiliated depositories or independent mortgage companies. We address theimplications for the analysis in Section 6.2.1.
The Impact of Reversing Regulatory Arbitrage on Loan Originations
0
100,000
200,000
300,000
400,000
500,000
600,000
2003 2004 2005 2006 2007 2008 2009 2010
Number of Home Purchase Loan Applications
b
a
Affiliated Depositories MBSs of BHCs
Unaffiliated Depositories Independent MCs
0
200,000
400,000
600,000
800,000
1,000,000
1,200,000
1,400,000
2003 2004 2005 2006 2007 2008 2009 2010
Number of Refinance Loan Applications
Affiliated Depositories MBSs of BHCs
Unaffiliated Depositories Independent MCs
Fig. 3 a Number of home purchase loan applications. This graph plots the total number of home purchaseloan applications. Data sources: HMDA data, 2003–2010, and lender file from the FRB. Affiliateddepositories are depository institutions under BHCs that also have an affiliated mortgage company underthe BHC. MBSs of BHCs are mortgage banking subsidiaries of BHCs. Unaffiliated depositories aredepository institutions not under any BHC or BHC depositories that do not have an affiliated mortgagecompany. Independent MCs are non-depository mortgage companies not under any BHC. b Number ofrefinance loan applications. This graph plots the total number of refinance loan applications. Data sources:HMDA data, 2003–2010, and lender file from the FRB. Affiliated depositories are depository institutionsunder BHCs that also have an affiliated mortgage company under the BHC. MBSs of BHCs are mortgagebanking subsidiaries of BHCs. Unaffiliated depositories are depository institutions not under any BHC orBHC depositories that do not have an affiliated mortgage company. Independent MCs are non-depositorymortgage companies not under any BHC
D.H. Downs, L. Shi
file (provided by Glenn Canner of the FRB) contains such information; therefore, wecan identify the MBSs and depositories under the same BHC.
Summary Statistics
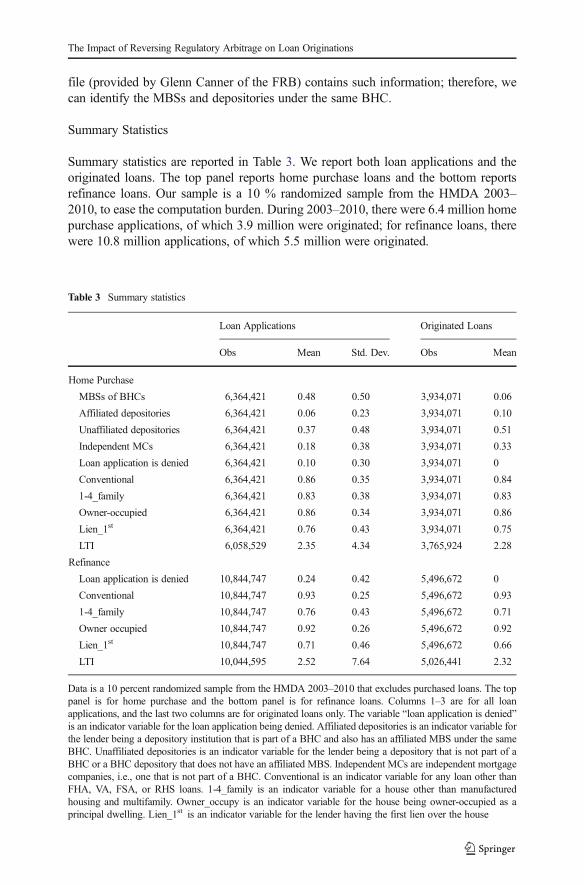
Summary statistics are reported in Table 3. We report both loan applications and theoriginated loans. The top panel reports home purchase loans and the bottom reportsrefinance loans. Our sample is a 10 % randomized sample from the HMDA 2003–2010, to ease the computation burden. During 2003–2010, there were 6.4 million homepurchase applications, of which 3.9 million were originated; for refinance loans, therewere 10.8 million applications, of which 5.5 million were originated.
Table 3 Summary statistics
Loan Applications Originated Loans
Obs Mean Std. Dev. Obs Mean
Home Purchase
MBSs of BHCs 6,364,421 0.48 0.50 3,934,071 0.06
Affiliated depositories 6,364,421 0.06 0.23 3,934,071 0.10
Unaffiliated depositories 6,364,421 0.37 0.48 3,934,071 0.51
Independent MCs 6,364,421 0.18 0.38 3,934,071 0.33
Loan application is denied 6,364,421 0.10 0.30 3,934,071 0
Conventional 6,364,421 0.86 0.35 3,934,071 0.84
1-4_family 6,364,421 0.83 0.38 3,934,071 0.83
Owner-occupied 6,364,421 0.86 0.34 3,934,071 0.86
Lien_1st 6,364,421 0.76 0.43 3,934,071 0.75
LTI 6,058,529 2.35 4.34 3,765,924 2.28
Refinance
Loan application is denied 10,844,747 0.24 0.42 5,496,672 0
Conventional 10,844,747 0.93 0.25 5,496,672 0.93
1-4_family 10,844,747 0.76 0.43 5,496,672 0.71
Owner occupied 10,844,747 0.92 0.26 5,496,672 0.92
Lien_1st 10,844,747 0.71 0.46 5,496,672 0.66
LTI 10,044,595 2.52 7.64 5,026,441 2.32
Data is a 10 percent randomized sample from the HMDA 2003–2010 that excludes purchased loans. The toppanel is for home purchase and the bottom panel is for refinance loans. Columns 1–3 are for all loanapplications, and the last two columns are for originated loans only. The variable “loan application is denied”is an indicator variable for the loan application being denied. Affiliated depositories is an indicator variable forthe lender being a depository institution that is part of a BHC and also has an affiliated MBS under the sameBHC. Unaffiliated depositories is an indicator variable for the lender being a depository that is not part of aBHC or a BHC depository that does not have an affiliated MBS. Independent MCs are independent mortgagecompanies, i.e., one that is not part of a BHC. Conventional is an indicator variable for any loan other thanFHA, VA, FSA, or RHS loans. 1-4_family is an indicator variable for a house other than manufacturedhousing and multifamily. Owner_occupy is an indicator variable for the house being owner-occupied as aprincipal dwelling. Lien_1st is an indicator variable for the lender having the first lien over the house
The Impact of Reversing Regulatory Arbitrage on Loan Originations
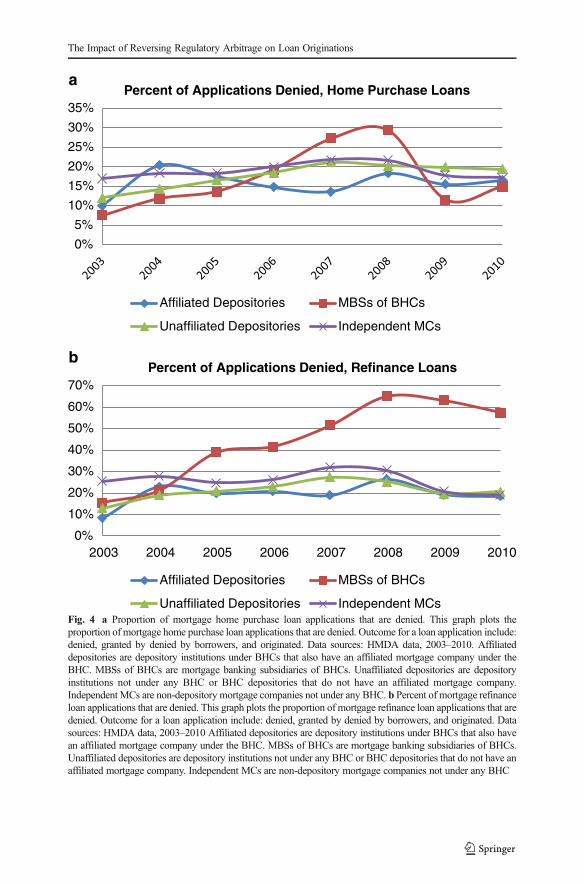
In home purchase applications, 48 % were submitted to MBSs of BHCs, 6 % to aBHC depository with an affiliated MBS (i.e., affiliated depositories), 37 % to unaffil-iated depositories, and 18 % to independent mortgage companies. The picture fororiginated loans is different. Six percent were originated by MBSs of BHCs, 10 %by affiliated depositories, 51 % by unaffiliated depositories, and 33 % by independentmortgage companies. The numbers suggest that MBSs of BHCs have higher denialrates than the other types of lenders. As will be shown in Fig. 4a, MBSs of BHCs havehigher denial rates than other lenders post-2007.
Ten percent of home purchase and 24 % of refinance loans were denied by lenders.Eighty-six percent of home purchase and 92 % of refinance applications and origina-tions were for owner-occupied homes. Close to 75 % of home purchase loan applica-tions and originations involved first liens, and close to 70 % for refinance loans. Loan-to-income ratio is 2.35 on average for home purchase applications and 2.28 for homepurchase originations. For refinance loans, mean LTI is 2.52 for home-purchaseapplications and 2.32 for originations.
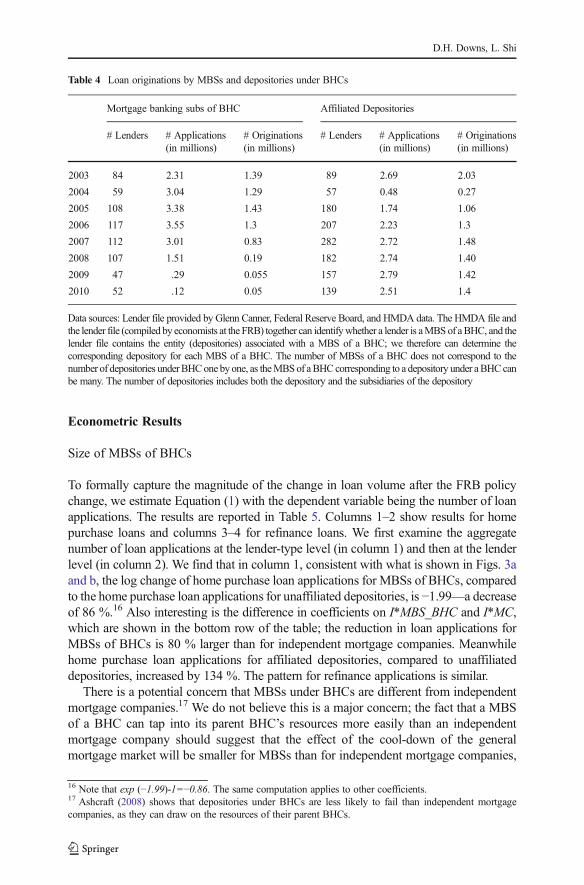
Table 4 shows the MBSs of BHCs and the affiliated depositories and yearly numbersfor lenders, loan applications, and originations 2003–2010. Columns 1–3 report thestatistics for MBSs of BHCs, and columns 4–7 report the three statistics for affiliateddepositories.15
For the number of subsidiaries and depositories under BHCs, the reduction in thenumber of subsidiaries is greater than that for depositories: The number of MBSs underBHCs declined from 108 in 2005 to 52 in 2010, and the number of depositories underBHCs from 180 to 139. In terms of loan originations, while the origination volume forMBSs of BHCs decreased dramatically from 1.43 million in 2005 to 0.05 million in2010, the volume for affiliated depositories increased from 1.3 million to 1.4 millionover the same period.
Note that the overall mortgage market experienced a sharp downturn over thisperiod; as shown in Figs. 3a and b, which plot the number of mortgage applicationsfor home purchase and refinance, respectively, the number drastically decreased fordepository institutions that are unaffiliated with BHCs and for independent mortgagecompanies as well. Therefore, we find that during a broad downturn in the mortgageorigination market, the number of applications made to MBSs of BHCs sharplydecreased, while the volume for depositories under BHCs was almost unchanged; thisis consistent with BHCs relocating business fromMBSs to the affiliated depositories. Aprominent example of relocating origination activity within BHCs is the CountrywideGroup. Its MBS was Countrywide Home Loans, and the depository under the Groupwas Countrywide Bank. The FRB is the federal regulator for Countrywide Group,while OCC (and later OTS) supervised and regulated Countrywide Bank. In 2006, thenumber of mortgage originations for Countrywide Home Loans was 833,855, and177,301for Countrywide Bank. In 2008, the number for Countrywide Home Loans wasonly 2,478, while the number for Countrywide Bank shot up to 485,121.
15 Appendix, Table A.1 provides information on the type of depositories under BHCs from 2006 to 2009. In2006, for example, 207 depositories were under BHCs. In terms of both the number of lenders and the numberof loan originations, the majority were OCC-chartered national banks and their subsidiaries. During 2007–2008, OTS-chartered national thrifts began to have a significant market share. Overall, the majority of thedepositories under BHCs were nationally chartered banks or thrifts.
D.H. Downs, L. Shi
0%
5%
10%
15%
20%
25%
30%
35%Percent of Applications Denied, Home Purchase Loans
Affiliated Depositories MBSs of BHCs
Unaffiliated Depositories Independent MCs
0%
10%
20%
30%
40%
50%
60%
70%
2003 2004 2005 2006 2007 2008 2009 2010
Percent of Applications Denied, Refinance Loans
Affiliated Depositories MBSs of BHCs
Unaffiliated Depositories Independent MCs
a
b
Fig. 4 a Proportion of mortgage home purchase loan applications that are denied. This graph plots theproportion of mortgage home purchase loan applications that are denied. Outcome for a loan application include:denied, granted by denied by borrowers, and originated. Data sources: HMDA data, 2003–2010. Affiliateddepositories are depository institutions under BHCs that also have an affiliated mortgage company under theBHC. MBSs of BHCs are mortgage banking subsidiaries of BHCs. Unaffiliated depositories are depositoryinstitutions not under any BHC or BHC depositories that do not have an affiliated mortgage company.Independent MCs are non-depository mortgage companies not under any BHC. b Percent of mortgage refinanceloan applications that are denied. This graph plots the proportion of mortgage refinance loan applications that aredenied. Outcome for a loan application include: denied, granted by denied by borrowers, and originated. Datasources: HMDA data, 2003–2010 Affiliated depositories are depository institutions under BHCs that also havean affiliated mortgage company under the BHC. MBSs of BHCs are mortgage banking subsidiaries of BHCs.Unaffiliated depositories are depository institutions not under any BHC or BHC depositories that do not have anaffiliated mortgage company. Independent MCs are non-depository mortgage companies not under any BHC
The Impact of Reversing Regulatory Arbitrage on Loan Originations
Econometric Results
Size of MBSs of BHCs
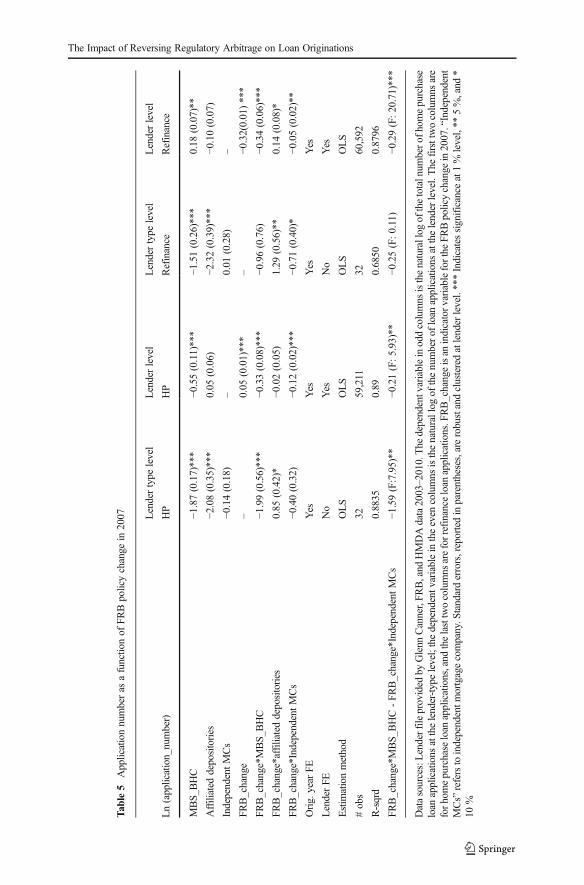
To formally capture the magnitude of the change in loan volume after the FRB policychange, we estimate Equation (1) with the dependent variable being the number of loanapplications. The results are reported in Table 5. Columns 1–2 show results for homepurchase loans and columns 3–4 for refinance loans. We first examine the aggregatenumber of loan applications at the lender-type level (in column 1) and then at the lenderlevel (in column 2). We find that in column 1, consistent with what is shown in Figs. 3aand b, the log change of home purchase loan applications for MBSs of BHCs, comparedto the home purchase loan applications for unaffiliated depositories, is −1.99—a decreaseof 86 %.16 Also interesting is the difference in coefficients on I*MBS_BHC and I*MC,which are shown in the bottom row of the table; the reduction in loan applications forMBSs of BHCs is 80 % larger than for independent mortgage companies. Meanwhilehome purchase loan applications for affiliated depositories, compared to unaffiliateddepositories, increased by 134 %. The pattern for refinance applications is similar.
There is a potential concern that MBSs under BHCs are different from independentmortgage companies.17 We do not believe this is a major concern; the fact that a MBSof a BHC can tap into its parent BHC’s resources more easily than an independentmortgage company should suggest that the effect of the cool-down of the generalmortgage market will be smaller for MBSs than for independent mortgage companies,
16 Note that exp (−1.99)-1=−0.86. The same computation applies to other coefficients.17 Ashcraft (2008) shows that depositories under BHCs are less likely to fail than independent mortgagecompanies, as they can draw on the resources of their parent BHCs.
Table 4 Loan originations by MBSs and depositories under BHCs
Mortgage banking subs of BHC Affiliated Depositories
# Lenders # Applications(in millions)
# Originations(in millions)
# Lenders # Applications(in millions)
# Originations(in millions)
2003 84 2.31 1.39 89 2.69 2.03
2004 59 3.04 1.29 57 0.48 0.27
2005 108 3.38 1.43 180 1.74 1.06
2006 117 3.55 1.3 207 2.23 1.3
2007 112 3.01 0.83 282 2.72 1.48
2008 107 1.51 0.19 182 2.74 1.40
2009 47 .29 0.055 157 2.79 1.42
2010 52 .12 0.05 139 2.51 1.4
Data sources: Lender file provided by Glenn Canner, Federal Reserve Board, and HMDA data. The HMDA file andthe lender file (compiled by economists at the FRB) together can identifywhether a lender is aMBSof aBHC, and thelender file contains the entity (depositories) associated with a MBS of a BHC; we therefore can determine thecorresponding depository for each MBS of a BHC. The number of MBSs of a BHC does not correspond to thenumber of depositories underBHCone byone, as theMBSof aBHCcorresponding to a depository under aBHCcanbe many. The number of depositories includes both the depository and the subsidiaries of the depository
D.H. Downs, L. Shi
Tab
le5
Applicationnumberas
afunctio
nof
FRBpolicychange
in2007 Lendertype
level
Lenderlevel
Lendertype
level
Lenderlevel
Ln(application_number)
HP
HP
Refinance
Refinance
MBS_
BHC
−1.87(0.17)***
−0.55(0.11)***
−1.51(0.26)***
0.18
(0.07)**
Affiliated
depositories
−2.08(0.35)***
0.05
(0.06)
−2.32(0.39)***
−0.10(0.07)
IndependentMCs
−0.14(0.18)
–0.01
(0.28)
–
FRB_change
–0.05
(0.01)***
–−0
.32(0.01)***
FRB_change*MBS_
BHC
−1.99(0.56)***
−0.33(0.08)***
−0.96(0.76)
−0.34(0.06)***
FRB_change*affiliateddepositories
0.85
(0.42)*
−0.02(0.05)
1.29
(0.56)**
0.14
(0.08)*
FRB_change*IndependentMCs
−0.40(0.32)
−0.12(0.02)***
−0.71(0.40)*
−0.05(0.02)**
Orig.
year
FEYes
Yes
Yes
Yes
LenderFE
No
Yes
No
Yes
Estim
ationmethod
OLS
OLS
OLS
OLS
#obs
3259,211
3260,592
R-sqrd
0.8835
0.89
0.6850
0.8796
FRB_change*MBS_
BHC-FR
B_change*IndependentMCs
−1.59(F:7.95)**
−0.21(F:5.93)**
−0.25(F:0.11)
−0.29(F:20.71)***
Datasources:Lenderfile
provided
byGlenn
Canner,FR
B,and
HMDAdata2003–2010.The
dependentvariableinoddcolumns
isthenaturallog
ofthetotalnum
bero
fhom
epurchase
loan
applications
atthelender-typelevel;thedependentvariableintheeven
columns
isthenaturallog
ofthenumberof
loan
applications
atthelenderlevel.The
firsttwocolumns
are
forh
omepurchase
loan
applications,and
thelasttwocolumns
areforrefinance
loan
applications.F
RB_changeisan
indicatorv
ariableforthe
FRBpolicychange
in2007.“Independent
MCs”
referstoindependentm
ortgagecompany.S
tandarderrors,reportedinparentheses,arerobustandclusteredatlenderlevel.***Indicatessignificance
at1%
level,**
5%,and
*10
%
The Impact of Reversing Regulatory Arbitrage on Loan Originations
yet we find that the shrinkage in mortgage volume is actually much larger for MBSs ofBHCs than for independent mortgage companies. This is consistent with the impact theFRB change has on MBSs of BHCs.
We sought to determine whether this change in volume can be attributed to the entryand exit of lenders or within-lender activities. Recall that Table 4 shows that the numberof MBSs of BHCs decreased from 117 in 2006 to 52 in 2010. To formally isolate theeffect of entry and exit of lenders from within-lender behavior changes, we regresslender level loan applications on the same explanatory variables and include lenderfixed effects. Results are reported in columns 2 and 4 of Table 5. The specification withlender fixed effects allows us to capture within-lender variations in loan applications.Results for home purchase loans are in column 2 and for refinance loans in column 4.We find that the coefficient on the interaction term FRB change*MBS_BHC is stillsignificantly negative. However, the magnitude is subdued: home purchase applicationsin MBSs of BHCs decreased by 27 % more than unaffiliated depositories, and 19 %more than independent mortgage companies. This suggests that while part of thedecrease is due to within-lender reduction in loan applications, a larger part stems fromthe exit of lenders with a “MBSs of BHCs” organizational form.
Similarly, the coefficient on the interaction term FRB_change*AFFL_Depos is ofmuch smaller magnitude when lender fixed effects is included than without lender fixedeffects. Combined with the finding that the number of affiliated depositories increasedfrom 57 in 2004 to 282 in 2007 (shown in Table 4), the estimate suggests that the increasein loan applications for affiliated depositories is largely due to more lenders assuming theorganizational form of depositories under BHCs. The difference in findings when lenderfixed effects is included highlights the importance of lender turnover in the loanorigination market. Similar patterns are found for refinance loan applications.
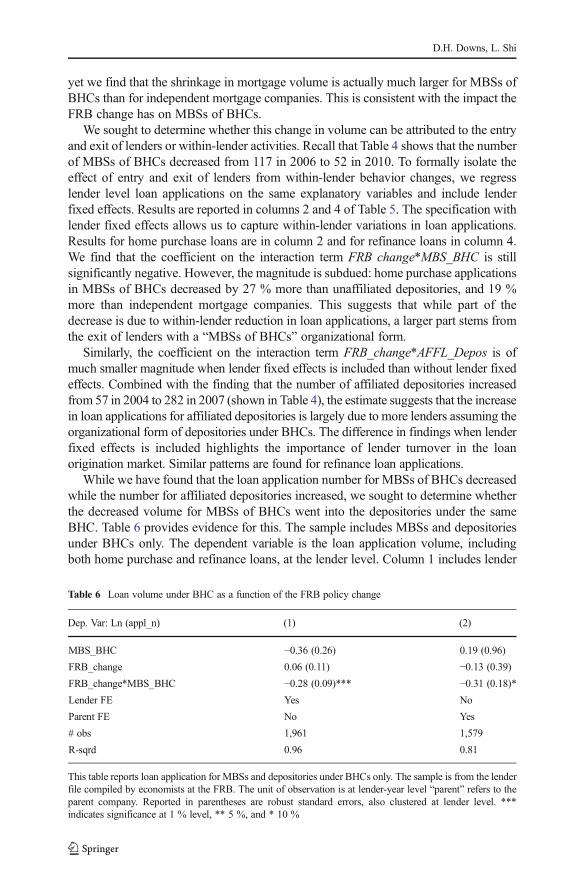
While we have found that the loan application number for MBSs of BHCs decreasedwhile the number for affiliated depositories increased, we sought to determine whetherthe decreased volume for MBSs of BHCs went into the depositories under the sameBHC. Table 6 provides evidence for this. The sample includes MBSs and depositoriesunder BHCs only. The dependent variable is the loan application volume, includingboth home purchase and refinance loans, at the lender level. Column 1 includes lender
Table 6 Loan volume under BHC as a function of the FRB policy change
Dep. Var: Ln (appl_n) (1) (2)
MBS_BHC −0.36 (0.26) 0.19 (0.96)
FRB_change 0.06 (0.11) −0.13 (0.39)
FRB_change*MBS_BHC −0.28 (0.09)*** −0.31 (0.18)*
Lender FE Yes No
Parent FE No Yes
# obs 1,961 1,579
R-sqrd 0.96 0.81
This table reports loan application for MBSs and depositories under BHCs only. The sample is from the lenderfile compiled by economists at the FRB. The unit of observation is at lender-year level “parent” refers to theparent company. Reported in parentheses are robust standard errors, also clustered at lender level. ***indicates significance at 1 % level, ** 5 %, and * 10 %
D.H. Downs, L. Shi
fixed effects; the results are consistent with what is reported in Table 5: Loan volume inMBSs of BHCs decreased more than affiliated depositories did. Column 2 includes theparent company fixed effects. With the inclusion of the parent company fixed effects,the coefficient on the interaction term captures the effect of the policy change on MBSsof BHCs relative to the depositories within the same BHC. The coefficient on it issignificantly negative, suggesting that within the same BHC, loan application volumefor MBSs of BHCs decreased substantially relative to their affiliated depositories.
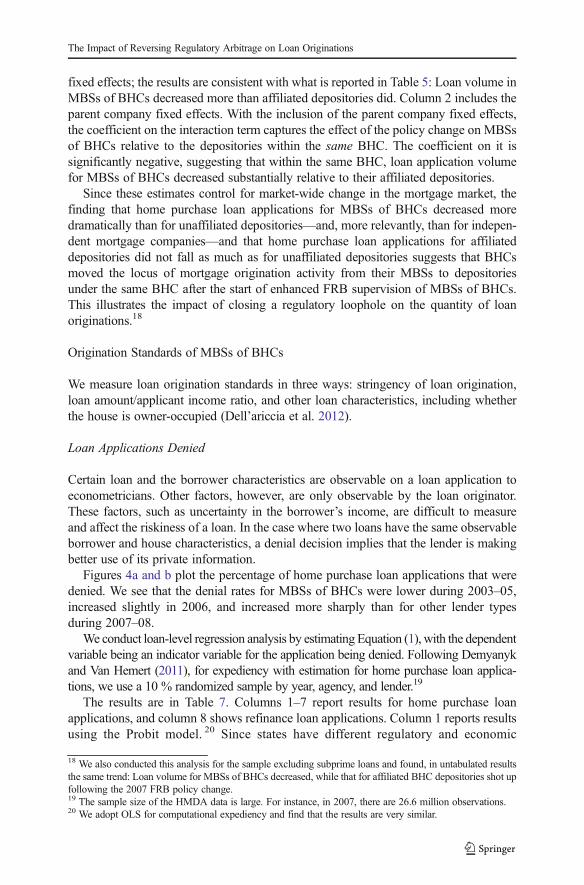
Since these estimates control for market-wide change in the mortgage market, thefinding that home purchase loan applications for MBSs of BHCs decreased moredramatically than for unaffiliated depositories—and, more relevantly, than for indepen-dent mortgage companies—and that home purchase loan applications for affiliateddepositories did not fall as much as for unaffiliated depositories suggests that BHCsmoved the locus of mortgage origination activity from their MBSs to depositoriesunder the same BHC after the start of enhanced FRB supervision of MBSs of BHCs.This illustrates the impact of closing a regulatory loophole on the quantity of loanoriginations.18
Origination Standards of MBSs of BHCs
We measure loan origination standards in three ways: stringency of loan origination,loan amount/applicant income ratio, and other loan characteristics, including whetherthe house is owner-occupied (Dell’ariccia et al. 2012).
Loan Applications Denied
Certain loan and the borrower characteristics are observable on a loan application toeconometricians. Other factors, however, are only observable by the loan originator.These factors, such as uncertainty in the borrower’s income, are difficult to measureand affect the riskiness of a loan. In the case where two loans have the same observableborrower and house characteristics, a denial decision implies that the lender is makingbetter use of its private information.
Figures 4a and b plot the percentage of home purchase loan applications that weredenied. We see that the denial rates for MBSs of BHCs were lower during 2003–05,increased slightly in 2006, and increased more sharply than for other lender typesduring 2007–08.
We conduct loan-level regression analysis by estimating Equation (1), with the dependentvariable being an indicator variable for the application being denied. Following Demyanykand Van Hemert (2011), for expediency with estimation for home purchase loan applica-tions, we use a 10 % randomized sample by year, agency, and lender.19
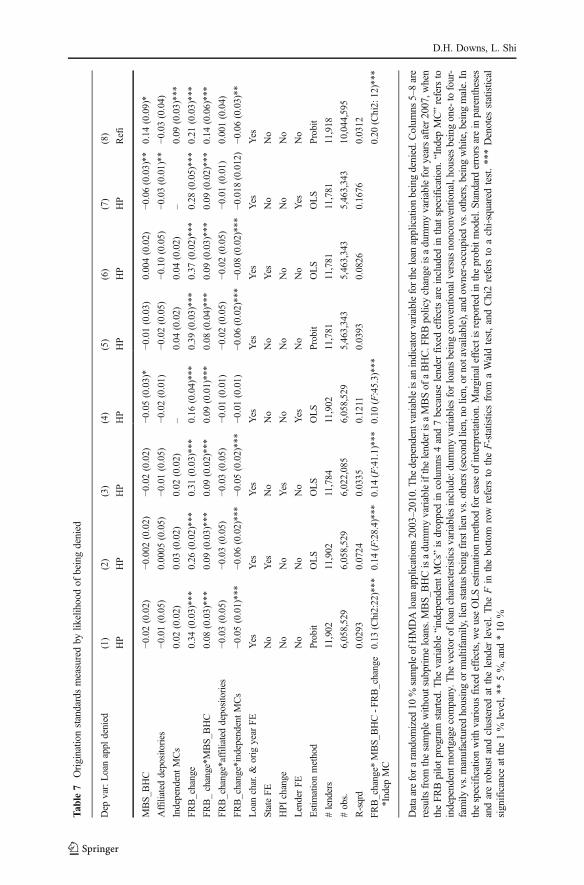
The results are in Table 7. Columns 1–7 report results for home purchase loanapplications, and column 8 shows refinance loan applications. Column 1 reports resultsusing the Probit model. 20 Since states have different regulatory and economic
18 We also conducted this analysis for the sample excluding subprime loans and found, in untabulated resultsthe same trend: Loan volume for MBSs of BHCs decreased, while that for affiliated BHC depositories shot upfollowing the 2007 FRB policy change.19 The sample size of the HMDA data is large. For instance, in 2007, there are 26.6 million observations.20 We adopt OLS for computational expediency and find that the results are very similar.
The Impact of Reversing Regulatory Arbitrage on Loan Originations
Tab
le7
Originationstandardsmeasuredby
likelihoodof
beingdenied
Dep
var:Loanappl
denied
(1)
(2)
(3)
(4)
(5)
(6)
(7)
(8)
HP
HP
HP
HP
HP
HP
HP
Refi
MBS_
BHC
−0.02(0.02)
−0.002
(0.02)
−0.02(0.02)
−0.05(0.03)*
−0.01(0.03)
0.004(0.02)
−0.06(0.03)**
0.14
(0.09)*
Affiliated
depositories
−0.01(0.05)
0.0005
(0.05)
−0.01(0.05)
−0.02(0.01)
−0.02(0.05)
−0.10(0.05)
−0.03(0.01)**
−0.03(0.04)
IndependentMCs
0.02
(0.02)
0.03
(0.02)
0.02
(0.02)
–0.04
(0.02)
0.04
(0.02)
–0.09
(0.03)***
FRB_change
0.34
(0.03)***
0.26
(0.02)***
0.31
(0.03)***
0.16
(0.04)***
0.39
(0.03)***
0.37
(0.02)***
0.28
(0.05)***
0.21
(0.03)***
FRB_change*M
BS_
BHC
0.08
(0.03)***
0.09
(0.03)***
0.09
(0.02)***
0.09
(0.01)***
0.08
(0.04)***
0.09
(0.03)***
0.09
(0.02)***
0.14
(0.06)***
FRB_change*affiliateddepositories
−0.03(0.05)
−0.03(0.05)
−0.03(0.05)
−0.01(0.01)
−0.02(0.05)
−0.02(0.05)
−0.01(0.01)
0.001(0.04)
FRB_change*independentMCs
−0.05(0.01)***
−0.06(0.02)***
−0.05(0.02)***
−0.01(0.01)
−0.06(0.02)***
−0.08(0.02)***
−0.018
(0.012)
−0.06(0.03)**
Loanchar.&
orig
year
FE
Yes
Yes
Yes
Yes
Yes
Yes
Yes
Yes
StateFE
No
Yes
No
No
No
Yes
No
No
HPI
change
No
No
Yes
No
No
No
No
No
LenderFE
No
No
No
Yes
No
No
Yes
No
Estim
ationmethod
Probit
OLS
OLS
OLS
Probit
OLS
OLS
Probit
#lenders
11,902
11,902
11,784
11,902
11,781
11,781
11,781
11,918
#obs.
6,058,529
6,058,529
6,022,085
6,058,529
5,463,343
5,463,343
5,463,343
10,044,595
R-sqrd
0.0293
0.0724
0.0335
0.1211
0.0393
0.0826
0.1676
0.0312
FRB_change*
MBS_
BHC-F
RB_change
*Indep
MC
0.13
(Chi2:22)***
0.14
(F:28.4)***
0.14
(F:41.1)***
0.10
(F:45.3)***
0.20
(Chi2:
12)***
Dataareforarandom
ized
10%
sampleof
HMDAloan
applications
2003–2010.The
dependentvariableisan
indicatorv
ariablefortheloan
applicationbeingdenied.C
olum
ns5–8are
results
from
thesamplewith
outsubprim
eloans.MBS_
BHCisadummyvariableifthelenderisaMBSof
aBHC.F
RBpolicychange
isadummyvariableforyearsafter2007,w
hen
theFR
Bpilotprogram
started.
The
variable“independent
MCs”
isdroppedin
columns
4and7becauselender
fixedeffectsareincluded
inthatspecification.
“Indep
MC”refersto
independentm
ortgagecompany.T
hevector
ofloan
characteristicsvariablesinclude:dummyvariablesforloansbeingconventionalversusnonconventional,houses
beingone-tofour-
family
vs.m
anufacturedhousingor
multifam
ily,lienstatus
beingfirstlienvs.others(secondlien,no
lien,or
notavailable),and
owner-occupied
vs.others,beingwhite,being
male.In
thespecificationwith
variousfixedeffects,weuseOLSestim
ationmethodforease
ofinterpretatio
n.Marginaleffectisreported
intheprobitmodel.S
tandarderrorsareinparentheses
andarerobustandclusteredat
thelender
level.The
Fin
thebotto
mrow
refers
totheF-statisticsfrom
aWaldtest,andChi2refers
toachi-squaredtest.***Denotes
statistical
significance
atthe1%
level,**
5%,and
*10
%
D.H. Downs, L. Shi
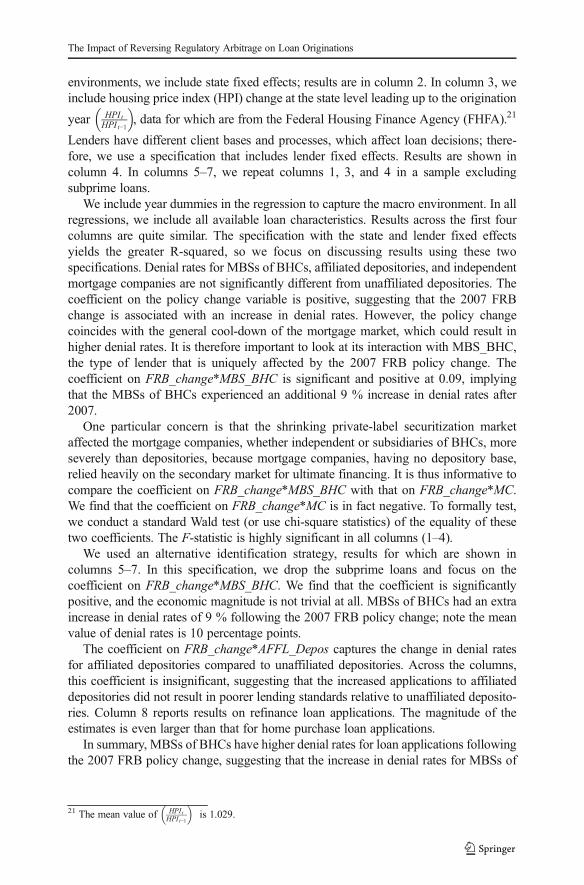
environments, we include state fixed effects; results are in column 2. In column 3, weinclude housing price index (HPI) change at the state level leading up to the origination
year HPItHPI t−1
� �, data for which are from the Federal Housing Finance Agency (FHFA).21
Lenders have different client bases and processes, which affect loan decisions; there-fore, we use a specification that includes lender fixed effects. Results are shown incolumn 4. In columns 5–7, we repeat columns 1, 3, and 4 in a sample excludingsubprime loans.
We include year dummies in the regression to capture the macro environment. In allregressions, we include all available loan characteristics. Results across the first fourcolumns are quite similar. The specification with the state and lender fixed effectsyields the greater R-squared, so we focus on discussing results using these twospecifications. Denial rates for MBSs of BHCs, affiliated depositories, and independentmortgage companies are not significantly different from unaffiliated depositories. Thecoefficient on the policy change variable is positive, suggesting that the 2007 FRBchange is associated with an increase in denial rates. However, the policy changecoincides with the general cool-down of the mortgage market, which could result inhigher denial rates. It is therefore important to look at its interaction with MBS_BHC,the type of lender that is uniquely affected by the 2007 FRB policy change. Thecoefficient on FRB_change*MBS_BHC is significant and positive at 0.09, implyingthat the MBSs of BHCs experienced an additional 9 % increase in denial rates after2007.
One particular concern is that the shrinking private-label securitization marketaffected the mortgage companies, whether independent or subsidiaries of BHCs, moreseverely than depositories, because mortgage companies, having no depository base,relied heavily on the secondary market for ultimate financing. It is thus informative tocompare the coefficient on FRB_change*MBS_BHC with that on FRB_change*MC.We find that the coefficient on FRB_change*MC is in fact negative. To formally test,we conduct a standard Wald test (or use chi-square statistics) of the equality of thesetwo coefficients. The F-statistic is highly significant in all columns (1–4).
We used an alternative identification strategy, results for which are shown incolumns 5–7. In this specification, we drop the subprime loans and focus on thecoefficient on FRB_change*MBS_BHC. We find that the coefficient is significantlypositive, and the economic magnitude is not trivial at all. MBSs of BHCs had an extraincrease in denial rates of 9 % following the 2007 FRB policy change; note the meanvalue of denial rates is 10 percentage points.
The coefficient on FRB_change*AFFL_Depos captures the change in denial ratesfor affiliated depositories compared to unaffiliated depositories. Across the columns,this coefficient is insignificant, suggesting that the increased applications to affiliateddepositories did not result in poorer lending standards relative to unaffiliated deposito-ries. Column 8 reports results on refinance loan applications. The magnitude of theestimates is even larger than that for home purchase loan applications.
In summary, MBSs of BHCs have higher denial rates for loan applications followingthe 2007 FRB policy change, suggesting that the increase in denial rates for MBSs of
21 The mean value of HPItHPIt−1
� �is 1.029.
The Impact of Reversing Regulatory Arbitrage on Loan Originations
BHCs around the time of the 2007 FRB policy change is far more than the effect offactors such as the disappearance of the private-label securitization market.22
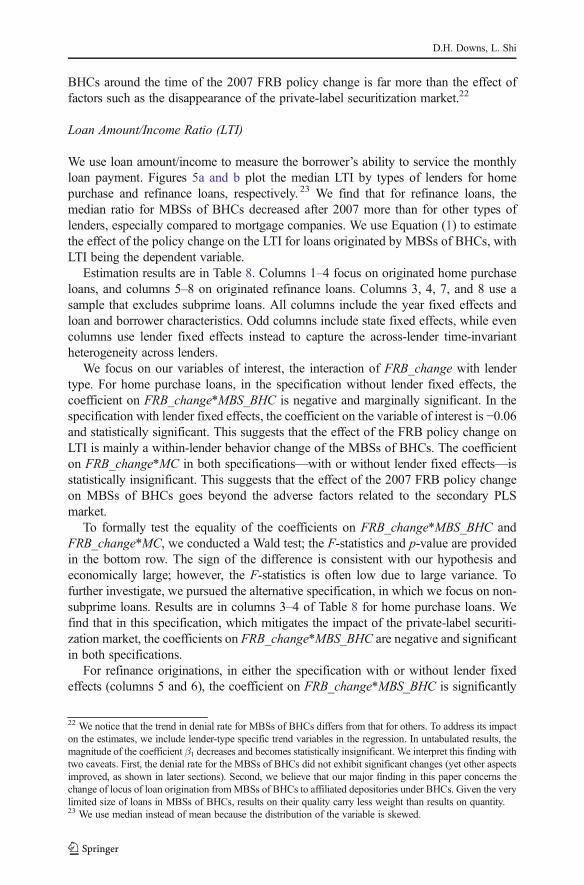
Loan Amount/Income Ratio (LTI)
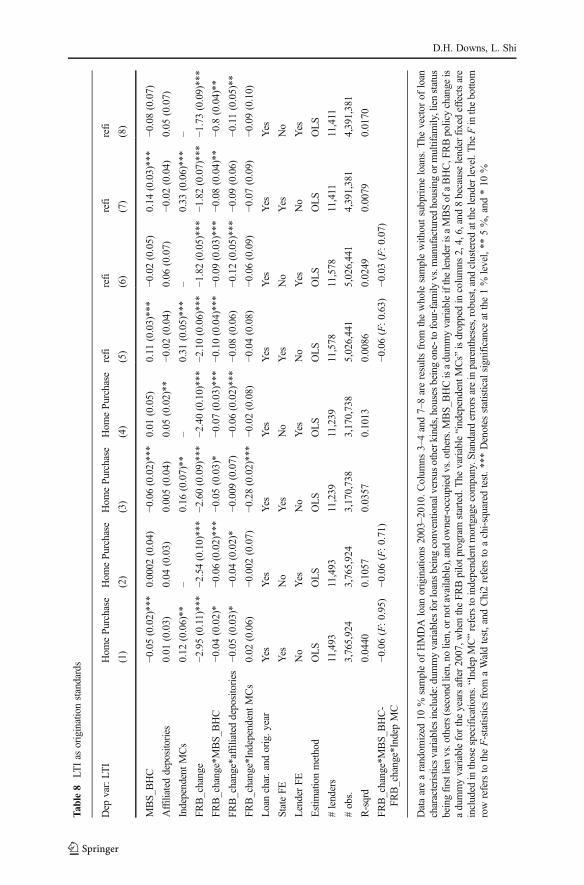
We use loan amount/income to measure the borrower’s ability to service the monthlyloan payment. Figures 5a and b plot the median LTI by types of lenders for homepurchase and refinance loans, respectively. 23 We find that for refinance loans, themedian ratio for MBSs of BHCs decreased after 2007 more than for other types oflenders, especially compared to mortgage companies. We use Equation (1) to estimatethe effect of the policy change on the LTI for loans originated by MBSs of BHCs, withLTI being the dependent variable.
Estimation results are in Table 8. Columns 1–4 focus on originated home purchaseloans, and columns 5–8 on originated refinance loans. Columns 3, 4, 7, and 8 use asample that excludes subprime loans. All columns include the year fixed effects andloan and borrower characteristics. Odd columns include state fixed effects, while evencolumns use lender fixed effects instead to capture the across-lender time-invariantheterogeneity across lenders.
We focus on our variables of interest, the interaction of FRB_change with lendertype. For home purchase loans, in the specification without lender fixed effects, thecoefficient on FRB_change*MBS_BHC is negative and marginally significant. In thespecification with lender fixed effects, the coefficient on the variable of interest is −0.06and statistically significant. This suggests that the effect of the FRB policy change onLTI is mainly a within-lender behavior change of the MBSs of BHCs. The coefficienton FRB_change*MC in both specifications—with or without lender fixed effects—isstatistically insignificant. This suggests that the effect of the 2007 FRB policy changeon MBSs of BHCs goes beyond the adverse factors related to the secondary PLSmarket.
To formally test the equality of the coefficients on FRB_change*MBS_BHC andFRB_change*MC, we conducted a Wald test; the F-statistics and p-value are providedin the bottom row. The sign of the difference is consistent with our hypothesis andeconomically large; however, the F-statistics is often low due to large variance. Tofurther investigate, we pursued the alternative specification, in which we focus on non-subprime loans. Results are in columns 3–4 of Table 8 for home purchase loans. Wefind that in this specification, which mitigates the impact of the private-label securiti-zation market, the coefficients on FRB_change*MBS_BHC are negative and significantin both specifications.
For refinance originations, in either the specification with or without lender fixedeffects (columns 5 and 6), the coefficient on FRB_change*MBS_BHC is significantly
22 We notice that the trend in denial rate for MBSs of BHCs differs from that for others. To address its impacton the estimates, we include lender-type specific trend variables in the regression. In untabulated results, themagnitude of the coefficient β1 decreases and becomes statistically insignificant. We interpret this finding withtwo caveats. First, the denial rate for the MBSs of BHCs did not exhibit significant changes (yet other aspectsimproved, as shown in later sections). Second, we believe that our major finding in this paper concerns thechange of locus of loan origination fromMBSs of BHCs to affiliated depositories under BHCs. Given the verylimited size of loans in MBSs of BHCs, results on their quality carry less weight than results on quantity.23 We use median instead of mean because the distribution of the variable is skewed.
D.H. Downs, L. Shi
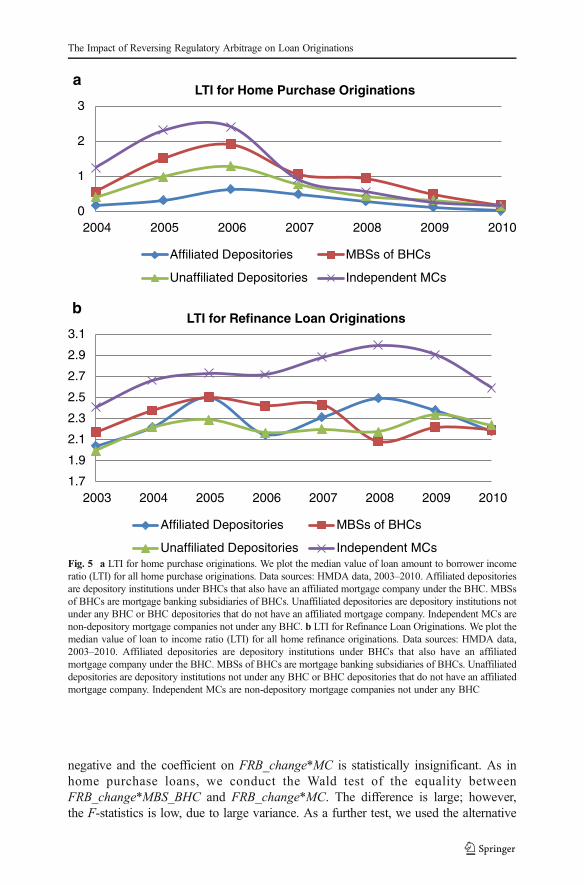
negative and the coefficient on FRB_change*MC is statistically insignificant. As inhome purchase loans, we conduct the Wald test of the equality betweenFRB_change*MBS_BHC and FRB_change*MC. The difference is large; however,the F-statistics is low, due to large variance. As a further test, we used the alternative
0
1
2
3
2004 2005 2006 2007 2008 2009 2010
LTI for Home Purchase Originations
Affiliated Depositories MBSs of BHCs
Unaffiliated Depositories Independent MCs
1.7
1.9
2.1
2.3
2.5
2.7
2.9
3.1
2003 2004 2005 2006 2007 2008 2009 2010
LTI for Refinance Loan Originations
Affiliated Depositories MBSs of BHCs
Unaffiliated Depositories Independent MCs
a
b
Fig. 5 a LTI for home purchase originations. We plot the median value of loan amount to borrower incomeratio (LTI) for all home purchase originations. Data sources: HMDA data, 2003–2010. Affiliated depositoriesare depository institutions under BHCs that also have an affiliated mortgage company under the BHC. MBSsof BHCs are mortgage banking subsidiaries of BHCs. Unaffiliated depositories are depository institutions notunder any BHC or BHC depositories that do not have an affiliated mortgage company. Independent MCs arenon-depository mortgage companies not under any BHC. b LTI for Refinance Loan Originations. We plot themedian value of loan to income ratio (LTI) for all home refinance originations. Data sources: HMDA data,2003–2010. Affiliated depositories are depository institutions under BHCs that also have an affiliatedmortgage company under the BHC. MBSs of BHCs are mortgage banking subsidiaries of BHCs. Unaffiliateddepositories are depository institutions not under any BHC or BHC depositories that do not have an affiliatedmortgage company. Independent MCs are non-depository mortgage companies not under any BHC
The Impact of Reversing Regulatory Arbitrage on Loan Originations
Tab
le8
LTIas
originationstandards
Dep
var:LT
IHom
ePu
rchase
Hom
ePu
rchase
Hom
ePu
rchase
Hom
ePu
rchase
refi
refi
refi
refi
(1)
(2)
(3)
(4)
(5)
(6)
(7)
(8)
MBS_
BHC
−0.05(0.02)***
0.0002
(0.04)
−0.06(0.02)***
0.01
(0.05)
0.11
(0.03)***
−0.02(0.05)
0.14
(0.03)***
−0.08(0.07)
Affiliated
depositories
0.01
(0.03)
0.04
(0.03)
0.005(0.04)
0.05
(0.02)**
−0.02(0.04)
0.06
(0.07)
−0.02(0.04)
0.05
(0.07)
IndependentMCs
0.12
(0.06)**
–0.16
(0.07)**
–0.31
(0.05)***
–0.33
(0.06)***
–
FRB_change
−2.95(0.11)***
−2.54(0.10)***
−2.60(0.09)***
−2.40(0.10)***
−2.10(0.06)***
−1.82(0.05)***
−1.82(0.07)***
−1.73(0.09)***
FRB_change*MBS_
BHC
−0.04(0.02)*
−0.06(0.02)***
−0.05(0.03)*
−0.07(0.03)***
−0.10(0.04)***
−0.09(0.03)***
−0.08(0.04)**
−0.8
(0.04)**
FRB_change*affiliateddepositories
−0.05(0.03)*
−0.04(0.02)*
−0.009
(0.07)
−0.06(0.02)***
−0.08(0.06)
−0.12(0.05)***
−0.09(0.06)
−0.11(0.05)**
FRB_change*IndependentMCs
0.02
(0.06)
−0.002
(0.07)
−0.28(0.02)***
−0.02(0.08)
−0.04(0.08)
−0.06(0.09)
−0.07(0.09)
−0.09(0.10)
Loanchar.and
orig.y
ear
Yes
Yes
Yes
Yes
Yes
Yes
Yes
Yes
StateFE
Yes
No
Yes
No
Yes
No
Yes
No
LenderFE
No
Yes
No
Yes
No
Yes
No
Yes
Estim
ationmethod
OLS
OLS
OLS
OLS
OLS
OLS
OLS
OLS
#lenders
11,493
11,493
11,239
11,239
11,578
11,578
11,411
11,411
#obs.
3,765,924
3,765,924
3,170,738
3,170,738
5,026,441
5,026,441
4,391,381
4,391,381
R-sqrd
0.0440
0.1057
0.0357
0.1013
0.0086
0.0249
0.0079
0.0170
FRB_change*MBS_
BHC-
FRB_change*IndepMC
−0.06(F:0.95)
−0.06(F:0.71)
−0.06(F:0.63)
−0.03(F:0.07)
Dataarearandom
ized
10%
sampleof
HMDA
loan
originations
2003–2010.
Colum
ns3–4and7–8areresults
from
thewholesamplewith
outsubprimeloans.The
vector
ofloan
characteristicsvariablesinclude:dummyvariablesforloans
beingconventionalversusotherk
inds,housesbeingone-tofour-fam
ilyvs.m
anufacturedhousingor
multifam
ily,lienstatus
beingfirstlienvs.others(secondlien,no
lien,or
notavailable),and
owner-occupied
vs.others.MBS_
BHCisadummyvariableifthelenderisaMBSof
aBHC,F
RBpolicychange
isadummyvariablefortheyearsafter2007,w
hentheFR
Bpilotp
rogram
started.The
variable“independent
MCs”
isdroppedin
columns
2,4,6,and8becauselenderfixedeffectsare
included
inthosespecifications.“IndepMC”referstoindependentm
ortgagecompany.S
tandarderrorsareinparentheses,robust,and
clusteredatthelenderlevel.The
Finthebottom
row
refersto
theF-statisticsfrom
aWaldtest,and
Chi2refersto
achi-squaredtest.*
**Denotes
statisticalsignificance
atthe1%
level,**
5%,and
*10
%
D.H. Downs, L. Shi
specification. Shown in columns 7–8, we find that the coefficient onFRB_change*MBS_BHC, in the specification either without or with lender fixedeffects, is significantly negative. These findings suggest that the reduction of LTI inrefinance loans, and thus the higher origination standard, is an effect of the FRB policychange on MBSs of BHCs and not an effect of the 2007 market on non-depositorymortgage companies.24
Also worth noting is that the coefficient on FRB_change*AFFL_Depos is statisti-cally negative in the specification with lender fixed effects in both home purchase andrefinance loans. This suggests that the affiliated depositories experienced a lower LTIand, as a result, higher standards compared to unaffiliated depositories after the policychange. Taken together with results for MBSs of BHCs, while the policy changerelocated loan productions fromMBSs to their affiliated depositories, the LTI decreasedfor MBSs and did not increase for affiliated depositories under BHCs. This supportsHypotheses 2a and 2b, that loans originated in MBSs of BHCs after the 2007 FRBpolicy change improved, while those in affiliated depositories did not worsen.
Percent of Loans for Owner Occupancy
We also look at other loan characteristics to get a fuller sense of loan origination quality.The HMDA data include whether the house is owner-occupied or occupied by others, aseither a second home or investment property. One aspect of the loose underwritingstandards that contribute to a housing bubble is that speculators borrow money to investin houses in anticipation of a price appreciation and then flip them. It is well establishedthat an owner-occupied house is less likely to result in default and is better cared for. Loansfor investment purposes, therefore, are riskier than those for those for owner occupancy.Accordingly, we examine the percentage of loan originations that are for owner-occupiedhouses as one aspect of loan underwriting standards. Figures 6a and b plot the percentagesfor home purchase and refinance loans, respectively. They show that the percentage ofloans for owner occupancy decreased forMBSs of BHCs (as well as for others) from 2003to 2005, but climbed back afterward. The increase in the proportion of owner-occupiedproperties from 2007 to 2008 was larger than that for depositories. The extra effect of the2007 policy change on MBSs of BHCs is more prominent for refinance loans.
We conduct loan-level analysis using the specification in the baseline equation, inwhich the dependent variable is 1 if the house is owner-occupied and 0 otherwise. Resultsare shown in Table 9. The first four columns are for home purchase loans and the last fourfor refinance loans. Columns 1, 2, 5, and 6 use the full sample, while columns 3, 4, 7, and8 focus on the sample without the subprime loans. Odd columns use the Probit model, andeven columns use OLS with lender fixed effects included.
We find that for home purchase loans, the coefficient on FRB_change*MBS_BHC ispositive in both specifications. We notice that the coefficient on FRB_change*MC isalso positive, and the F-statistics for the equality of the two coefficients is low. Tofurther investigate, we use the specification that excludes subprime loans, thus miti-gating the effect of the change in the private-label securitization market. Results are inColumns 3–4 of Table 9. We find that the coefficient on FRB_change*MBS_BHCremains positive and significant.
24 In all regressions, the coefficients on the loan characteristics variables are reasonably estimated.
The Impact of Reversing Regulatory Arbitrage on Loan Originations
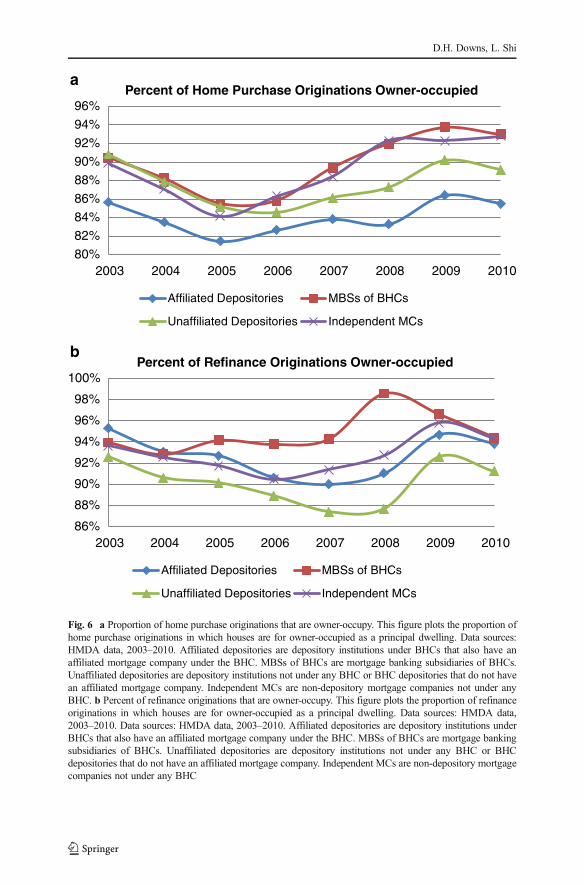
80%
82%
84%
86%
88%
90%
92%
94%
96%
2003 2004 2005 2006 2007 2008 2009 2010
Percent of Home Purchase Originations Owner-occupied
Affiliated Depositories MBSs of BHCs
Unaffiliated Depositories Independent MCs
86%
88%
90%
92%
94%
96%
98%
100%
2003 2004 2005 2006 2007 2008 2009 2010
Percent of Refinance Originations Owner-occupied
Affiliated Depositories MBSs of BHCs
Unaffiliated Depositories Independent MCs
a
b
Fig. 6 a Proportion of home purchase originations that are owner-occupy. This figure plots the proportion ofhome purchase originations in which houses are for owner-occupied as a principal dwelling. Data sources:HMDA data, 2003–2010. Affiliated depositories are depository institutions under BHCs that also have anaffiliated mortgage company under the BHC. MBSs of BHCs are mortgage banking subsidiaries of BHCs.Unaffiliated depositories are depository institutions not under any BHC or BHC depositories that do not havean affiliated mortgage company. Independent MCs are non-depository mortgage companies not under anyBHC. b Percent of refinance originations that are owner-occupy. This figure plots the proportion of refinanceoriginations in which houses are for owner-occupied as a principal dwelling. Data sources: HMDA data,2003–2010. Data sources: HMDA data, 2003–2010. Affiliated depositories are depository institutions underBHCs that also have an affiliated mortgage company under the BHC. MBSs of BHCs are mortgage bankingsubsidiaries of BHCs. Unaffiliated depositories are depository institutions not under any BHC or BHCdepositories that do not have an affiliated mortgage company. Independent MCs are non-depository mortgagecompanies not under any BHC
D.H. Downs, L. Shi
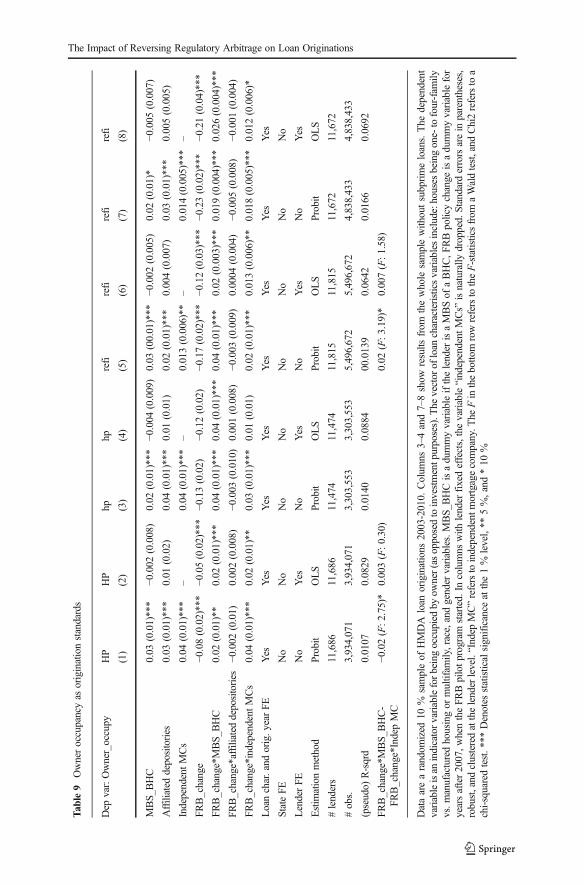
Tab
le9
Owneroccupancyas
originationstandards
Dep
var:Owner_occupy
HP
HP
hphp
refi
refi
refi
refi
(1)
(2)
(3)
(4)
(5)
(6)
(7)
(8)
MBS_
BHC
0.03
(0.01)***
−0.002
(0.008)
0.02
(0.01)***
−0.004
(0.009)
0.03
(00.01)***
−0.002
(0.005)
0.02
(0.01)*
−0.005
(0.007)
Affiliated
depositories
0.03
(0.01)***
0.01
(0.02)
0.04
(0.01)***
0.01
(0.01)
0.02
(0.01)***
0.004(0.007)
0.03
(0.01)***
0.005(0.005)
IndependentMCs
0.04
(0.01)***
–0.04
(0.01)***
–0.013(0.006)**
–0.014(0.005)***
–
FRB_change
−0.08(0.02)***
−0.05(0.02)***
−0.13(0.02)
−0.12(0.02)
−0.17(0.02)***
−0.12(0.03)***
−0.23(0.02)***
−0.21(0.04)***
FRB_change*MBS_
BHC
0.02
(0.01)**
0.02
(0.01)***
0.04
(0.01)***
0.04
(0.01)***
0.04
(0.01)***
0.02
(0.003)***
0.019(0.004)***
0.026(0.004)***
FRB_change*affiliateddepositories
−0.002
(0.01)
0.002(0.008)
−0.003
(0.010)
0.001(0.008)
−0.003
(0.009)
0.0004
(0.004)
−0.005
(0.008)
−0.001
(0.004)
FRB_change*independentMCs
0.04
(0.01)***
0.02
(0.01)**
0.03
(0.01)***
0.01
(0.01)
0.02
(0.01)***
0.013(0.006)**
0.018(0.005)***
0.012(0.006)*
Loanchar.and
orig.y
earFE
Yes
Yes
Yes
Yes
Yes
Yes
Yes
Yes
StateFE
No
No
No
No
No
No
No
No
LenderFE
No
Yes
No
Yes
No
Yes
No
Yes
Estim
ationmethod
Probit
OLS
Probit
OLS
Probit
OLS
Probit
OLS
#lenders
11,686
11,686
11,474
11,474
11,815
11,815
11,672
11,672
#obs.
3,934,071
3,934,071
3,303,553
3,303,553
5,496,672
5,496,672
4,838,433
4,838,433
(pseudo)
R-sqrd
0.0107
0.0829
0.0140
0.0884
00.0139
0.0642
0.0166
0.0692
FRB_change*MBS_
BHC-
FRB_change*IndepMC
−0.02(F:2
.75)*
0.003(F:0.30)
0.02
(F:3.19)*
0.007(F:1.58)
Dataarearandom
ized
10%
sampleof
HMDA
loan
originations
2003-2010.
Colum
ns3–4and7–8show
results
from
thewhole
samplewith
outsubprimeloans.The
dependent
variableisan
indicatorvariableforbeingoccupied
byow
ner(asopposedtoinvestmentpurposes).T
hevector
ofloan
characteristicsvariablesinclude:houses
beingone-tofour-fam
ilyvs.m
anufacturedhousingor
multifam
ily,race,andgender
variables.MBS_
BHCisadummyvariableifthelender
isaMBSof
aBHC,F
RBpolicychange
isadummyvariablefor
yearsafter2007,w
hentheFR
Bpilotprogram
started.
Incolumns
with
lender
fixedeffects,thevariable“independent
MCs”
isnaturally
dropped.
Standard
errorsarein
parentheses,
robust,and
clusteredatthelenderlevel.“Indep
MC”refersto
independentm
ortgagecompany.T
heFin
thebottom
rowrefersto
theF-statisticsfrom
aWaldtest,and
Chi2refersto
achi-squaredtest.*
**Denotes
statisticalsignificance
atthe1%
level,**
5%,and
*10
%
The Impact of Reversing Regulatory Arbitrage on Loan Originations
For refinance loans, we find that after the FRB policy change in 2007, the percent-age of owner occupancy for MBSs of BHCs increased relative to unaffiliated depos-itories. Independent mortgage companies experienced a much smaller increase relativeto unaffiliated depositories. The effect is present in both the specification with andwithout lender fixed effects. F-statistics for the difference of the two coefficients islarger than for home purchase loans, but still affected by the large variance. Resultsfrom the alternative specification (in columns 7–8) show that the coefficient onFRB_change*MBS_BHC is significant and positive. We interpret the combined resultsfrom the home purchase and refinance loans as suggesting that the effect of the policychange on MBSs of BHCs is not an artifact of the 2007 change in the private-labelsecuritization market on mortgage companies. This provides more evidence for theimpact of the 2007 FRB policy change on the loan origination quality of MBSs ofBHCs.
In summary, and in consideration of all previously discussed caveats, ourfindings illustrate the impact of eliminating regulatory arbitrage on MBSs ofBHCs on their loan origination behavior, in terms of both origination quantityand quality.
Conclusion
Our goal in this paper is to shed new light on the evolving nexus of housingfinance and financial regulatory policies. In the U.S. mortgage originationmarket, which is heavily regulated, there is room for regulatory arbitrage. Wefind that in the period following the 2007 FRB policy that sharply increasedsupervision of MBSs of BHCs, lending activity moved away from MBSs totheir affiliated depositories under the parent BHC. The increase in loan origi-nation quality, measured as high denial rates, low LTI, and more loans forowner occupancy, is greater for MBSs of BHCs after the 2007 policy changethan for unaffiliated depositories—as well as, in many cases, independentmortgage companies. The affiliated depositories did not experience a reductionin quality after the policy change. Furthermore, these findings are present, andeven strengthened, when we focus on non-subprime loans, suggesting that theeffect of the FRB policy change is more than an artifact of the 2007 marketdisruption, which included the near-demise of the PLS market. Our studydemonstrates how unified regulation can ameliorate the arbitrage opportunitiesthat result from uneven regulation of players by regulators.
Acknowledgements We gratefully acknowledge the comments and suggestions of Joseph Nichols(our discussant), and other participants at the 2013 AREUEA National Conference in Washington,D.C. We extend our appreciation to Glenn Canner, Bob Avery and Marsha Courchane for assistance inaccessing data. Downs acknowledges the support of The Kornblau Institute at Virginia CommonwealthUniversity. The views expressed in this paper are solely the authors’ and do not represent those of theOffice of the Comptroller of the Currency or the U.S. Department of Treasury. All errors remain ourown.
D.H. Downs, L. Shi
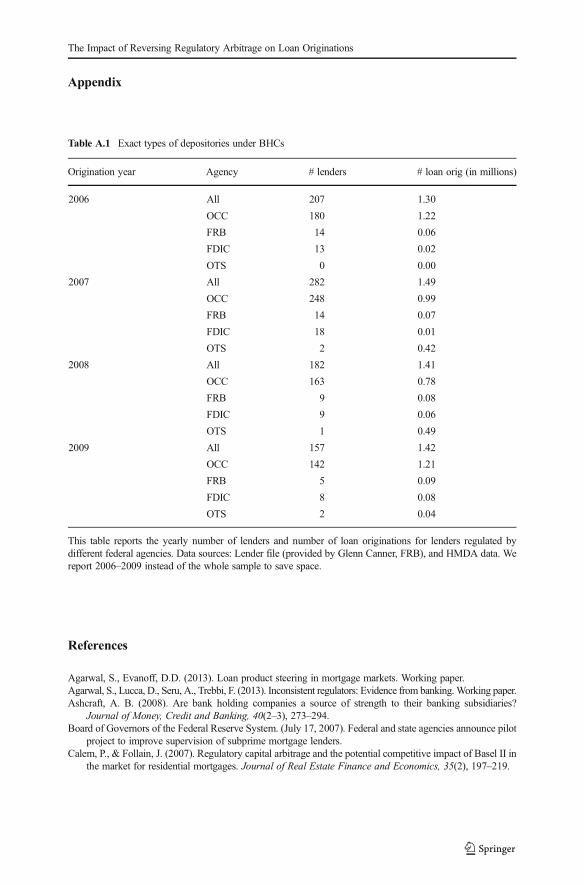
Appendix
References
Agarwal, S., Evanoff, D.D. (2013). Loan product steering in mortgage markets. Working paper.Agarwal, S., Lucca, D., Seru, A., Trebbi, F. (2013). Inconsistent regulators: Evidence from banking.Working paper.Ashcraft, A. B. (2008). Are bank holding companies a source of strength to their banking subsidiaries?
Journal of Money, Credit and Banking, 40(2–3), 273–294.Board of Governors of the Federal Reserve System. (July 17, 2007). Federal and state agencies announce pilot
project to improve supervision of subprime mortgage lenders.Calem, P., & Follain, J. (2007). Regulatory capital arbitrage and the potential competitive impact of Basel II in
the market for residential mortgages. Journal of Real Estate Finance and Economics, 35(2), 197–219.
Table A.1 Exact types of depositories under BHCs
Origination year Agency # lenders # loan orig (in millions)
2006 All 207 1.30
OCC 180 1.22
FRB 14 0.06
FDIC 13 0.02
OTS 0 0.00
2007 All 282 1.49
OCC 248 0.99
FRB 14 0.07
FDIC 18 0.01
OTS 2 0.42
2008 All 182 1.41
OCC 163 0.78
FRB 9 0.08
FDIC 9 0.06
OTS 1 0.49
2009 All 157 1.42
OCC 142 1.21
FRB 5 0.09
FDIC 8 0.08
OTS 2 0.04
This table reports the yearly number of lenders and number of loan originations for lenders regulated bydifferent federal agencies. Data sources: Lender file (provided by Glenn Canner, FRB), and HMDA data. Wereport 2006–2009 instead of the whole sample to save space.
The Impact of Reversing Regulatory Arbitrage on Loan Originations
Dell’ariccia, G., Igan, D., & Laeven, L. (2012). Credit booms and lender behavior: evidence from thesubprime mortgage market. Journal of Money, Credit, and Banking, 44(2–3), 367–84.
Demyanyk, Y. S, Loutskina, E. (May 3, 2013). Mortgage companies and regulatory arbitrage. FRB ofCleveland Working Paper WP 12-20R; Darden Business School Working Paper No. 2051001.Available at SSRN: http://ssrn.com/abstract=2051001.
Demyanyk, Y., & Van Hemert, O. (2011). Understanding the subprime mortgage crisis. Review of FinancialStudies, 24(6), 1848–1880.
Ding, L., Quercia, R. G., Reid, C., White, A. (2010). The impact of state anti-predatory lending laws on theforeclosure crisis. Federal Reserve press release.
Kau, J., Keenan, D., Lyubimov, C., & Slawson, V. (2012). Asymmetric information in the subprime mortgagemarket. Journal of Real Estate Finance and Economics, 44(1), 67–89.
Keys, B. J., Mukherjee, T., Seru, A., & Vig, V. (2009). Financial regulation and securitization: evidence fromsubprime loans. Journal of Monetary Economics, 56, 700–720.
Keys, B. J., Mukherjee, T., Seru, A., & Vig, V. (2010). Did securitization lead to lax screening? evidence fromsubprime loans. Quarterly Journal of Economics, 125(1), 307–362.
Mian, A., & Sufi, A. (2009). The consequence of mortgage credit expansion: evidence from the U.S. mortgagedefault crisis. Quarterly Journal of Economics, 124(4), 1449–1496.
Morrison & Foerster. (2009). Federal Reserve issues policy on consumer compliance supervision for nonbanksubsidiaries of bank holding companies and foreign banking organizations. Sept. 18, Client alert.
Purnanandam, A. K. (2011). Originate-to-distribute model and the sub-prime mortgage crisis. Review ofFinancial Studies, 24, 1881–1915.
United States General Accounting Office. (2004). Consumer protection: Federal and state agencies facechallenges in combating predatory lending. GAO 04–280
United States Office of the Comptroller of the Currency. (January 13, 2004). Preemption and visitorial powers.
D.H. Downs, L. Shi


![Reversing and Malware Analysis Training Articles [2012] . cracking/Reversing... · Reversing and Malware Analysis Training Articles ... Step 1: Start with what you ... Reversing and](https://img.dokumen.tips/doc/110x75/5ab905fd7f8b9ac10d8db0ab/reversing-and-malware-analysis-training-articles-2012-crackingreversingreversing.jpg)