Embed Size (px)
Citation preview

CHAPTER 5
THE IMPACT OF PLANT RESIDUES ON CROP
PRODUCTIVITY AND ON THE DYNAMICS OF
NUTRIENTS AND C FROM ADDED RESIDUES
5.1 IntroductionThe experiment reported in Chapter 4 showed that wheat growth was significantly influenced
by different qualities of added plant residues. However, in this study little direct measurement of
nutrient dynamics was made. It is clear that there is a need to study and monitor the fate of carbon
and nutrients from residue in detail for their effective use and management to improve and to sustainthe soil organic matter and soil productivity in the longer term. However, monitoring of changes in
organic matter is constrained by the difficulty of detecting changes against a large and variable
background of existing soil organic matter. It therefore requires techniques to monitor changes in
organic matter in soil in comparison with the changes that take place when residues are not added.
In the past, nutrient dynamics have often been monitored by the use of radioisotope or by
directly measuring the level of soil organic matter in long-term experiments. O'Brien (1984) used the
"bomb carbon" 140 radioisotope technique to study the effects of pasture improvement and
earthworms on carbon input rate and decomposition time and diffusivity down the profile. Although
this technique is very valuable for monitoring the stability of agricultural systems, the study of soil
organic matter dynamics is now at an exciting stage of development with the increasing use of stable
isotopes such as 13C and 15N. The natural abundance of 13 C is now being used to investigate the
turnover of soil organic matter resulting from the addition of residues derived from a different
photosynthetic pathway than that of soil organic matter (Martin et al., 1990; Cerri et al., 1991). For
example, soil studies of organic matter dynamics following deforestation and long term cultivation
(Cerri et al., 1991) have shown that it is possible to quantify the losses of C derived from native
vegetation and the carbon input from crop residues. This is important work and the potential of using13 C and 15 N to monitor the organic matter dynamics is an exciting one.
A glasshouse experiment, using drained pots, was undertaken with some of the plant residues
(Flemingia leaf, medic hay and wheat straw) used in the previous experiment labelled with 15 N and35S. The 8130 technique was also used and evaluated to monitor changes in soil carbon. The
objectives of the study were;

CHAPTER 5 : THE IMPACT OF PLANT RESIDUES ON CROP PRODUCTIVITY... 75
1. To study the impact of plant residue and inorganic fertiliser additions on the growth of
Japanese millet.
2. To determine the effects of plant residue quality on carbon and nutrient dynamics.
3. To determine the influence of inorganic fertiliser on residue carbon and nutrient dynamics.
4. To evaluate the use of stable isotopes of 13 0 and 15N and radioactive isotope of 35 S to
investigate the dynamics of soil organic matter.
5.2 Materials and MethodsThe experiment consisted of 2 phases, a plant residue production phase in which 35S and 15N
labelled plant residues were produced (April 1994 - October 1994) and an experimental phase from
November 1994 - February 1995. In the experimental phase there were two separate experiments; a
glasshouse experiment and an in vitro perfusion experiment.
5.2.1 Plant Residue Production PhasePlastic pots (30 cm diameter for Flemingia and 20 cm diameter for wheat and medic) lined
with a plastic bag were filled with a potting mixture (a 1:1 by volume of vermiculite and sand), to a
point slightly below the upper level of the pots. In order to promote aeration, drainage holes were
made in the base of the plastic bag and the pots placed in a collection basin to avoid isotope
contamination. Flemingia trees, approximately 1 m high, were transplanted into the 30 cm pots.
Wheat and medic seeds were planted in the potting mixture and were treated with fungicide
(Benomyl-Benlate DF) just after planting to control fungus.
After planting, the pots were periodically weighed and watered to, or near, field capacity every
2 - 3 days. The pots were placed in a glasshouse in which the temperature was maintained between
20 and 30 °C with artificial lighting provided to maintain the daylength at about 13 hours day-1.
A complete nutrient solution was prepared and applied to each pot weekly. The sources of
nutrient and rate of application are presented in Appendix 5.1. After 4 applications the medic plants
and Flemingia trees exhibited symptoms of nutrient toxicity and the pH of the potting mixture was
found to be low (pH = 5.3). The frequency of fertiliser application was then reduced to be every 3
weeks and an amount of CaOH 2 solution was applied to each pot to raise the pH to about 6.5.
Once the plants were growing well, the Flemingia trees were partially defoliated and the
seedlings of wheat and medic thinned to 10 and 5 seedlings per pot, respectively. Applications of 15N
and 35S solution were then commenced. The 15 N was applied as 98.94% enriched 15NH 4CI in
solution. The 15NH4CI solution applied had a concentration of 0.242 mg 15 N mL-1 and 5 mL of this
solution was applied by syringe to each pot every two days.
For the 35S application, carrier free Ca35SO4 was diluted with distilled and deionised water to
give a solution containing approximately 0.068 MBq mL -1 . A syringe was used to apply 5 mL of the35S solution over the soil surface making sure that no solution contacted the plant. The time and
frequency of the application was the same as the 15 N solution.

76 CHAPTER 5 : THE IMPACT OF PLANT RESIDUES ON CROP PRODUCTIVITY...
Any excess solution draining through the pot and collected in the basins was returned to the
soil surface daily, using a syringe.
Flemingia trees and medic plants were occasionally sprayed with insecticide (Rogor-
Dimethoate) to control aphids and miticide (Apollo SC-Clofentezine) to control red spider.
Mature Flemingia leaf was collected over 3 harvests and the healthy leaf from the second
harvest was used for the experiment. Wheat and medic plants were harvested at maturity by cutting
the plants at just above soil level. The harvested residues were then cut into smaller pieces, oven-
dried at 65 °C, and stored.
5.2.2 Experimental Phase
a) In vitro Perfusion ExperimentThe 3 labelled plant residues, Flemingia leaf, medic hay and wheat straw, were evaluated for
the breakdown rate and associated nutrient releases in an in vitro perfusion experiment. The residues
were arranged in a Completely Randomised Design. The procedures for this perfusion experiment
were the same as those described in Chapter 3. Key chemical characteristics of the residues used
are presented in Table 5.1.
Table 5.1 : Chemical characteristics of the 3 plant residues used in the glasshouse experiment
Properties Plant residuesFlemingia leaf Medic hay Wheat straw
Carbon (%) 47.25 44.04 41.52Nitrogen (%) 3.70 2.76 0.36Phosphorus (%) 0.25 0.20 0.25Potassium (%) 1.24 3.29 1.24Sulfur (%) 0.23 0.29 0.23Magnesium (%) 0.37 0.57 0.37Calcium (%) 0.95 1.12 0.95Sodium (%) 0.01 0.23 0.01Iron (pg/g) 104.7 124.40 104.67Zinc (1,19/g) 27.1 32.25 27.08C:N ratio 12.8 16.0 116.615N (atom%) 2.46853 3.46179 8.169228130 (%0) -24.91 -26.32 -26.14
The experiment was carried out for a period of 42 days in the controlled temperature (25 °C)
laboratory at the Department of Agronomy and Soil Science, University of New England. Data were
analysed by analysis of variance using the IRRISTAT computer program (IRRI, 1992). Mean
separation was achieved using Duncan's Multiple Range Technique (DMRT).

0-8 cm
8-16 cm
16-24 cm
CHAPTER 5 : THE IMPACT OF PLANT RESIDUES ON CROP PRODUCTIVITY... 77
b) Glasshouse Experiment
i) Soil and pot preparationA Soloth soil from Mackay, Queensland was collected from an area which has been under C4
vegetation (sugarcane) for more than 50 years. The soil was air-dried, cleaned and passed through a
2 mm sieve before being used in the experiment. Key chemical properties of the soil are presented in
Table 5.2.
Pots, 30 cm deep, were made from 15 cm internal diameter Polyvinyl Chloride (PVC) pipe
fitted and silicone sealed with PVC end caps which had several holes (2 mm diameter) at the base. A
fine nylon screen (1 mm hole size) was placed above the holes to prevent the loss of soil particles.
The pots were then placed on top of a modified end cap, to enable the collection of leachate. Before
the soil was added to the pots they were divided into depths of 0 - 8, 8 - 16 and 16 - 24 cm (hereafter
referred to as top, middle and bottom parts respectively). Each part was filled with 2.033 kg of air-
dried soil and a plastic mesh (5 mm gutter guard) was used to separate top and middle soil layers
(Figure 5.1).
Top soil mixed withresidue and fertilizer
Gutter guard screen
Middle soil
Bottom soil
End cap with holesNylon screen
Leaching base
Figure 5.1 : Details of pot preparation
When the bottom and the middle parts of the pots had been filled to a depth of approximately16 cm with 4.066 kg of air-dried soil the 2.033 kg of air-dried soil, into which the appropriate plant
residue and fertiliser treatment had been mixed was added. The gutter guard was used to separate
top and middle layers to restrict residue movement between the 2 layers (Figure 5.1).
ii) Experimental Design and LayoutTreatments were laid out according to a Split-Plot Design with 3 replicates. The mainplot
factor was harvest time and the sub-plot factors consisted of plant residue and fertiliser rate.

78 CHAPTER 5 : THE IMPACT OF PLANT RESIDUES ON CROP PRODUCTIVITY...
Japanese millet (Echinochloa frumentocea), a C4 crop, was selected as an indicator crop because of
its appropriate 8130 value (813C value = -13.40°h.). In summary the design was;
Mainplot factor : 3 Harvests (27 and 48 days after planting, and at maturity (91 days))
Subplot factors : 4 x 2
4 Residue (Non-residue control, Flemingia leaf, Barrel medic hay and Wheat straw)
x 2 Fertiliser application rates (Low and High)
x 3 Replicates
giving a total of 72 pots.
The experiment was conducted for a period of approximately 12 weeks in the controlled
temperature (20 °- 30 °C) glasshouse at the Department of Agronomy and Soil Science, University of
New England.
iii) Experimental TreatmentsThe four residue treatments evaluated were a non-residue control, Flemingia macrophylla leaf
litter, Barrel medic (Medicago truncatula) hay, and Wheat (Triticum aestivum) straw. Hereafter
referred to as non-residue, Flemingia leaf, medic hay and wheat straw respectively. The chemical
characteristics of the applied plant residues are presented in Table 5.1.
Table 5.2 : Selected soil characteristics of the Soloth soil used in the experiment
Soil characteristics Value513C (0/.0) -14.35
15 N (atom%) 0.36796Carbon (%) 1.09Nitrogen (%) 0.07Labile C (mg g-1) 1.04Non-labile C (mg g-1) 9.83Extractable S KCI-40 (pg g-1) 6.1Total Soil S (pg g-1) 93.7Colwell P (pq q-1) 38.6
Before application, plant residues were cut into small pieces, approximately 2 - 3 cm in size,
and dried in an oven at 65 °C until a constant weight was achieved. The residue of the appropriate
treatment was applied at a rate of approximately 5.4 g pot - ', which is equivalent to approximately
3 t ha-1 on the basis of pot surface area. These plant residues were applied and mixed thoroughly
into the top 8 cm soil layer after basal fertiliser application.
The two fertiliser treatments were low and high fertiliser application rates. The sources of
nutrients applied and the rates at which they were applied, in mg pot -1 for each nutrient, and the
equivalent kg ha-1 for each nutrient, on a surface area basis, are given in Table 5.3. These were
applied the day before planting.

CHAPTER 5 : THE IMPACT OF PLANT RESIDUES ON CROP PRODUCTIVITY... 79
Table 5.3 : Basal fertiliser treatments application rates
Nutrients Sources Fertiliser (kg ha -1 ) Fertiliser (mg nutrient pot-1)
Low rate High rate Low rate High rateNitrogen NH2CONH2Potassium KH2PO4Phosphorus KH2PO4Sulfur MgSO4Magnesium MgSO4Zinc ZnCl2
The millet showed symptoms of nitrogen deficiency, so nitrogen fertiliser as urea
(NH2CONH2) solution was applied at 49 and 63 days after planting. The extra nitrogen applications
were each the same as the basal application shown in Table 5.3.
iv) Management of the Japanese Millet CropApproximately 10 seeds of millet were planted into each pot. Shade cloth was used to cover
the pots to facilitate seed germination during the first few days. After 7 days, the shade cloth was
removed and the seedlings were thinned to 4 healthy seedlings. The pots were then placed in a
glasshouse in which the temperature was maintained between 20 °C and 30 °C and the daylength
was maintained at 13 hours day -1 using artificial lights. The pots were weighed periodically to
maintain the soil moisture near field capacity, except during the period of leachate collection when
each pot was watered 25% above field capacity. The leaching was achieved with additions of distilled
water one day prior to the leachate collection. This allowed one day for the excess water to pass
through to the leaching base. Leachate was collected and weighed to record the volume every week
and stored in plastic bottles in the freezer for analysis.
Plant height was recorded on a weekly basis. At each harvest, millet plants were cut at the
soil surface in the appropriate pots. At the third harvest, the tops were separated into grain and
stem + leaf. The millet roots were removed from each soil layer and cleaned. The plant shoot, grain
and root samples were then oven-dried at 80 °C until a constant weight was achieved, weighed and
ground to pass a 1 mm sieve and stored for subsequent chemical analyses.
v) Sample Collection and Measurement
- Sample CollectionsAt each harvest, the soils were pushed out of the pot, laid on trays and separated into the
top, middle and bottom soil layers (Figure 5.1). The soil within each section was mixed thoroughly
and roots removed from each soil layer. A 500 g sub-sample of each soil layer was then taken, air-
dried, ground through a 1 mm sieve and stored in a plastic bottle for chemical analyses.
10 302520
861
0.,18 54.0
45.036.014.410.8
1.8

80 CHAPTER 5 : THE IMPACT OF PLANT RESIDUES ON CROP PRODUCTIVITY...
- Chemical Analyses
Preparation of nitrate and ammonium in leachate for 15N analysisA diffusion method similar to that described by Brooks et al. (1989), and Jensen (1991) was
used to prepare leachate samples for nitrate and ammonium 15N analyses. Whatman GF/D filter
paper was cut into 7 mm disks with a paper punch and each disk pierced with a 62 mm piece of
stainless steel wire. Ten microlitres of 2.5 M KHSO 4 was pipetted onto each filter paper disk. The
disks were suspended across the top of a 100 mL beaker for no longer than 10 minutes in order to
minimise contamination with nitrogen from the air. Fifteen mL of the leachate was placed into a 65
mL specimen container. Approximately 0.4 g of finely ground Devarda's alloy and approximately
0.2 g of MgO heavy powder was added, followed by a 4 mm diameter acid washed glass bead. The
wire with the acidified filter paper was quickly laid across the inside ledge of a 65 mL volume plastic
vial and capped tightly. The outside joint was taped with electrical tape to ensure no leaks (Figure
5.2). The container was then carefully mixed by holding it flat against a lab bench and vigorously
twisting it back and forth so that the glass bead produced a cloud of MgO and Devarda's alloy in
suspension, the MgO making the solution basic. Thorough mixing is essential to ensure complete
reduction of NO 3 to NH 4+ , however, extreme care must be taken during mixing and handling to
prevent the leachate-MgO-Devarda's alloy solution from contacting the filter paper and neutralising
the acid. The containers were left in a controlled temperature room (25 °C) for 6 days without further
mixing.
After 6 days, the wire and filter papers were removed from the specimen container, the wire
inserted into Styrofoam and the disks dried overnight in a desiccator. The wires were then removed
from the desiccator and the filter papers were pushed off the wires and placed into tin capsules before
being analysed for 15 N by ANCA-MS.
Filter paperdisk
4
Cap
Stainless steel wire
Leachate sample+ MgO
+Devarda's alloy Glass bead
Figure 5.2 : Diffusion apparatus used to prepare leachate for 15N analysis
Determination of nitrate and ammonium in leachateLeachate was sub-sampled for nitrate and ammonium determination using an autoanalyser.
Nitrate was reduced to nitrite using a Cd reduction column and a pink colour was developed by
diazotisation and coupling. The manifold is basically that given in the Technicon (1977) notes. The

CHAPTER 5 : THE IMPACT OF PLANT RESIDUES ON CROP PRODUCTIVITY.. 81
column was as described by Adamsen et al. (1985). Absorbance was read at 520 nm using a 1 cm
flow cell with the sample time of 30 seconds and wash time of 150 seconds. The concentration of the
NO3-N standards ranged from 0 to 100 ppm. Reduction efficiency was checked occasionally by
comparison of a NO 2-N standard with a NO 3-N standard.
Ammonium in the leachates was analysed using a variation of the indophenol blue method forthe autoanalyser. In this method a blue colour was developed by reaction of ammonium with
salicylate and chlorine in the presence of nitroprusside as a catalyst. The concentrations of the NH4-
N standards ranged from 0 to 10 ppm. Absorbance was read at 660 nm using a 1 cm flow cell with
the sample time of 30 seconds and 150 seconds wash. The nitrate and ammonium determinations
were analysed simultaneously with parallel manifolds.
Preparation of Leachate for C Determination by ICP-AESThe procedure was similar to that described by Oweezkin et al. (1996). Sucrose standards of
0, 100, 200, 300 and 400 mg L-1 were prepared fresh from the stock sucrose standard solution of
5000 .tg C mL-1 . The leachate samples of week 1 to 4, week 5 to 7 and week 8 to 12 was pooled
together to reduce the number of samples.
Prior to acid-treatment, each leachate sample was filtered through a Whatman No. 42 filter
paper into a clean glass jar, being careful not to allow dust or particulate contamination. Ten mL of
each standard and each filtered leachate solution were then placed in individual glass vials and 2
drops of concentrated HNO3 added. A screw cap, drilled with a hole large enough for a gas inlet and
a gap to allow for gas escape, was fitted and the solution sparged with high purity nitrogen gas for 30
minutes. The leachate samples were then analysed for carbon by ICP-AES, with a carbon line
profiled at 193.09 nm on the polychromator, and calibrated against the acid treated standards
mentioned above.
Preparation of Leachate for 35S Activity Determination
A 3 mL sample of each leachate was sub-sampled and placed into a vial and thoroughlymixed with 17 mL of scintillation fluid, which consisted of toluene, p-terphenyl, POPOP and teric. The
35S activity in the sample was then determined in a Liquid Scintillation Counter (Model TRI-CARB
2000CA).
Determination of total C, N, 5 13 C and atom% 15NFinely ground soil samples (< 0.5 mm) containing approximately 350 jig C were weighed into
tin cups for analyses of total C, 6 13C, total N and atom% 15 N by using the ANCA-MS calibrated
against an appropriate soil standard.
Determination of Labile CarbonThe labile carbon was determined by the method described by Blair et al. (1995b) simplified
from the method of Loginow et al. (1987). In this method, the soil is reacted with an excess of 333
mM potassium permanganate. The reduced permanganate, which is proportional to the amount of
carbon oxidised, is measured by spectrophotometry.

82
CHAPTER 5 : THE IMPACT OF PLANT RESIDUES ON CROP PRODUCTIVITY...
Samples which contained approximately 15 mg C of each of the treatments and of a standard
soil were weighed into centrifuge tubes. 25 mL of the 333 mM KMnat was added to each tube using
a calibrated bottle-top dispenser. The tubes were firmly capped and tumbled end-over-end at 12 rpm
for 60 minutes, ensuring that all tubes were equidistant from the centre of rotation and thus
experienced the same rotational force. At the end of the tumbling period, the tubes were centrifuged
at 2000 rpm (RCF = 800g) for 5 minutes.
The supernatant was diluted by 1 in 250 with distilled and deionised water and mixed
thoroughly. The absorbance of unknown soil samples and a blank were measured by a sensitive split
beam spectrophotometer at a wavelength of 565 nm with calibration against a similarly treated
standard soil. All procedures were undertaken in a 25 °C controlled temperature laboratory. Labile
carbon was calculated using the formula below:
CL (mg g-1)(mM Blank - mM Unknown) x Volume of KMnO4_
1000 x Weight of soil (g)x 9
assuming 9 mg of labile carbon can be oxidised by 1 mM KMnO4
Determination of Soil SulfurExtractable S in soil samples were determined using the KCI-40 soil test developed by Blair
et al. (1991). Three grams of soil was weighed into a 30 mL polycarbonate screw-top vial and 20 mL
of 0.25 M KCI was added, the screw top lid closed tightly and the vial shaken by hand to disperse the
soil. The vial was then heated at 40 °C in an oven for 3 hours. The soil suspension was filtered
through a Whatman No. 42 filter paper and the soil extract was analysed for extractable S by the ICP-AES. A 3 mL sample was taken for determination of 35S activity in a Liquid Scintillation Counter.
Total soil S was determined by the combined phosphorus and sulfur digest method described
by Till et al. (1984). A 2 g dry soil sample was weighed into a 50 mL Erlenmyer flask with 3 - 5 anti-
bumping granules. Ten mL of the digestion mixture (dichromate + perchloric acid (70%) + nitric acid
(70%) was then added and a small funnel placed in the neck of the flask to allow refluxing of the
mixture. After allowing the initial oxidation, the flasks were heated on a digestion block at a low
temperature and the temperature gradually raised until the dichromate in the mixture turned green
and subsequently changed to red. The heating was continued for about 1 hour at approximately 190
°C. After the digestion was completed, the tube was allowed to cool and the volume was made up to
50 g by weight and mixed thoroughly. The tube was allowed to stand overnight and the solution
transferred (minus particulate matter) to a vial ready for analysis on the ICP-AES. A 3 mL sub-
sample of extract was taken for determination of 35S activity by Liquid Scintillation Counting.
The ground millet plant parts and plant residues were sub-sampled (approximately 0.2 g) for
digestion in a sealed container with HCIO4 and H 202 in an oven at 80 °C (Anderson and Henderson,
1986) and the digest measured for cations, P and S by ICP-AES. A 3 mL sub-sample of the plant
extract was also taken for measurement of 35S.

CHAPTER 5 : THE IMPACT OF PLANT RESIDUES ON CROP PRODUCTIVITY... 83
Finely ground plant and residue samples containing approximately 350 jig C were weighed
into tin cups for analyses of 613 0 natural abundance and atom% 15N by using the ANCA-MS which
was calibrated against an appropriate flour standard. Percentage of C and N were also determined
simultaneously.
vi) Data Computation and Analyses
The proportion of soil organic carbon derived from a plant residue (x)The proportion of added residue present in the soil organic fraction was calculated from the
following equation:
(6f - Ss) X
(8r - Ss)
where 8f is the 6130 value of the soil after residue incorporation, Os is the 8 13C of the original
soil or soil of the control treatment, and 6r is the 8 130 value of the plant material (Cadisch and Giller,
1996).
From the total weights (w) of carbon from each sample, the amount of residue present (R)
was calculated from the equation;
x x w
The proportion of 15N derived from a plant residueThe proportion of 15N derived from plant residue was calculated using the following formula;
Proportion of residue '5N(Atom%(f) - Atom%(c)) x Nt (Atom%(r) - Atom%(c)) X Nr
where Atom%(f) is the atom% 15 N value of each component (e.g. soil, plant shoot, leachate
etc.) after residue incorporation, Atom%(c) is the atom% 15 N value of the same component in the
control treatment, Atom%(r) is the atom% ' 5N value of the plant material added, Nt is the total N
content of each component (e.g soil, plant shoot, leachate etc.), and Nr is the total N content of plant
residue (Catchpoole, 1988).
The proportion of 35S derived from a plant residue
(Radioactivity of 35S of each component)
(Radioactivity of added 35 S from residue)
In order to accurately calculate the amount of residue S in each component using 35S data,
the following formula was used;
Specific Activity of residue (SA) =Total S in Residue
Radioactivity of 35 S in Residue
Proportion of residue 35S
Amount of residue S in each component = SA x Radioactivity of the component

100.0 T90.0 I
80.0
,>' 70.0co.../30) 60.0a)E 50.0u.)
40.0tv12)1 30.0evU 20.0
10.0
0.0
--*-- Medic
Flemingia
- - - A- - - Wheat straw
84 CHAPTER 5 : THE IMPACT OF PLANT RESIDUES ON CROP PRODUCTIVITY...
Data were analysed by analysis of variance using the IRRISTAT computer program (IRRI,
1992). Data were subjected to a Split Plot Design analysis of variance. An example of an IRRISTAT
output file is shown in Appendix 5.2. Mean separation was achieved using Duncan's Multiple Range
Technique (DMRT) which is depicted in Tables using lower case letters. Unless specified, means
were separated at the 5% level (P < 0.05) of probability, with means sharing a common letter not
being significantly different.
5.3 Results5.3.1 Perfusion Experiment
a) CO2 ReleaseThe pattern of daily CO 2 release observed from wheat straw, Flemingia leaf and medic hay
were similar but the release rates were different. Evolution of CO 2 started to increase from the
beginning and reached a maximum at day five in all residues. Although they reached the maximum
release at the same day the medic hay produced a much greater amount of CO2 on that day,
amounting to nearly 100 mg CO2 g-1 , compared to 32 and 29 mg CO 2 g-1 observed from wheat straw
and Flemingia leaf respectively. After this peak period the CO 2 release gradually decreased
(Figure 5.3).
0 3 6 9 12 15 18 21 24 27 30 33 36 39 42
Time (days)
Figure 5.3 : Daily CO 2 release from different plant residues as measured in the UNEPerfusion Apparatus

CHAPTER 5 : THE IMPACT OF PLANT RESIDUES ON CROP PRODUCTIVITY... 85
50.0 -
45.0 -
40.0 -
35.0 -
30.0 -
li 25.0 -co
& A" -"Bt--421---M---"491----O-4:tf--M--M:::-g—Mcu
,4.) 20.0 -...
A Ev..4trA s..8-4010*--44-- - -A- - - Wheat straw
10.0 -A JA a Flemingia
5.0 - 7,1grs
.:.....-:
0 3 6 9 12 15 18 21 24 27
30 33 36 39 42
Time (days)
Figure 5.4 : Cumulative C release from different plant residues
After 42 days, 49.3% of added residue carbon had been released from medic hay, which was
significantly higher than the 25.2 and 22.4 % released from wheat straw and Flemingia leaf
respectively (Figure 5.4).
b) Nutrient releaseThe percentage of the initial nutrients released from plant residue after 42 days of perfusion is
shown in the Table 5.4. The percentage of nutrient released varied for different nutrients. After 42
days, 59.0% of N was released from medic hay followed by 44.6 and 20.7% observed from wheat
straw and Flemingia leaf respectively and they were significantly different from each other.
The release pattern of K and Na were similar with the highest release of K and Na measured
from medic hay followed by wheat straw and Flemingia leaf. It was also found that more than 80% of
K was released from the plant residues, while the release of Na had a wider range of 45.8% recordedfrom Flemingia leaf to 91.7% from medic hay (Table 5.4).
0.0
A total of 76.3% of the initial S was released from wheat straw, followed by 63.4 and 16.3%
released from medic hay and Flemingia leaf respectively and these differences were significantly
different. The percentage of Mg released from the residues was similar to the S release, with the
highest value of 87.5% observed from wheat straw followed by 82.4 and 63.9% from medic hay and
Flemingia leaf respectively (Table 5.4). There was no significant difference between residues in the
proportion of P released from the wheat straw, Flemingia leaf and medic hay residues.
86
CHAPTER 5 : THE IMPACT OF PLANT RESIDUES ON CROP PRODUCTIVITY...
Table 5.4 : The percentage and absolute amounts of nutrients released from added plant residuesafter 42 days of perfusion
Residues N P S K Mg Na Mn
Percentage of nutrients released (% of initial) Flemingia 20.7 c 48.2 a 16.3 c 83.9 c 63.9 b 45.8 c 29.5 bMedic hay 59.0 a 45.9 a 63.4 b 91.1 a 82.4 a 91.7 a 40.0 bWheat 44.6 b 58.4 a 76.3 a 87.5 b 87.1 a 68.6 b 65.3 a
Absolute amounts of nutrients released (mg g-1) Flemingia 7.7 b 1.2a 0.4b 10.4c 2.3.c 0.05c 0.05aMedic hay 16.3 a 0.9 b 1.7 ab 30.0 a 4.7 a 2.16 a 0.04 aWheat 1.6c 0.8b 1.8a 22.5b 3.2b 0.12b 0.02b
In a column under each parameter, means followed by a common letter are not significant different at 5% level by the DMRT.
The treatment differences in the absolute amount of nutrient released were different from the
percentage of nutrient released (Table 5.4) since the initial nutrient contents were so different
(Table 5.1). Generally, medic hay released the highest amounts of all nutrients, except P and Mn.
After 42 days, the highest amount of N was released from medic hay (16.3 mg g' 1 ) followed by
Flemingia leaf (7.7 mg g 1 ) and wheat straw (1.6 mg g -1 ) and they were significantly different from each
other; the ranking contrast markedly with the percentage of N released.
Flemingia leaf released the highest amount of P of 1.2 mg g -1 , which was significantly higher
than from medic hay (0.9 mg g -1 ) and wheat straw (0.8 mg g') (Table 5.4).
The release pattern of K, Mg and Na were similar with the highest release measured from
medic hay followed by wheat straw and Flemingia leaf. For S, medic hay and wheat released the
higher amounts (1.8 and 1.7 mg g -1 , respectively), followed by 0.4 mg g -1 from Flemingia leaf
(Table 5.4).
5.3.2 Glasshouse Experiment
a) Millet Tops YieldsAt the 27-day harvest, there were no significant differences in plant top yield between the
residue treatments when the low fertiliser rate was applied (Table 5.5). Application of Flemingia leaf
and wheat straw with the higher rate of fertiliser produced plant top yields of 0.42 and 0.41 g pot-1
respectively, which were significantly higher compared to those of 0.25 and 0.24 g pot - ' from the
control and medic hay treatments, respectively. Increasing the fertiliser rate significantly enhanced
the plant top yields in Flemingia leaf and wheat straw treatments, but there was no significant impact
on the medic hay and the control treatments (Table 5.5).

CHAPTER 5 : THE IMPACT OF PLANT RESIDUES ON CROP PRODUCTIVITY... 87
Table 5.5 : Effect of plant residue and fertiliser rate on plant top yield (g pot -1 ) of millet
Harvest Residue Fertiliser application rateLow High
27 days Non 0.19 b 0.25 bFlemingia leaf 0.22 b 0.42 aMedic hay 0.19 b 0.24 bWheat straw 0.21 b 0.41 a
48 days Non 0.94 d 1.48 cdFlemingia leaf 2.35 b 3.40 aMedic hay 2.51 b 1.96 bcWheat straw 1.91 bc 2.55 a
91 days Non 5.54 e 10.05 cdFlemingia leaf 10.16 cd 17.16 aMedic hay 13.40 bc 13.92 abWheat straw 7.68 de 15.30 ab
Within each harvest, means followed by a common letter are not significantly different at 5% level by DMRT.
At the 48-day harvest, application of medic hay, Flemingia leaf and wheat straw at the low
fertiliser rate produced increased plant top yields compared to the non-residue control. At the high
fertiliser rate, application of plant residues, except medic hay, produced a higher plant top yieldcompared to the control. The highest yield of 3.40 g pot -1 was observed when Flemingia leaf was
applied, with lower yields from wheat straw, medic hay and the control treatments. Interaction
between fertiliser and plant residue was also observed with increasing fertiliser rate significantly
increasing the plant top yields in the Flemingia leaf and wheat straw treatments, but there was no
significant impact on yield in the medic hay treatment (Table 5.5).
The relative response of plant top yields (including grain) to the treatments at the 91-day
harvest were similar to those from the second harvest. When the lower fertiliser rate was applied, the
highest plant tops yield of 13.40 g pot - ' was observed from the medic hay treatment followed byFlemingia leaf, wheat straw and the control treatments (Table 5.5). Increasing the fertiliser led to the
production of 17.16, 15.30 and 13.92 g pot-1 from Flemingia leaf, wheat straw and medic hay
respectively and these were significantly higher than the 10.05 g pot -1 from the non-residue control.
The interaction between plant residue and fertiliser rate was again found with increasing fertiliser
enhancing the crop yield in the Flemingia leaf, wheat straw and control treatments but there was no
significant impact in the medic hay treatment.
The grain yield of millet at the 91-day harvest is shown in Table 5.6. At the low fertiliser rate,
application of plant residue produced slightly more grain yield than that of the control, however, there
was no significant difference between residue treatments. Application of Flemingia leaf at the high
fertiliser rate produced the highest grain yield of 9.43 g pot -1 . An interaction between fertiliser rate
88
CHAPTER 5 : THE IMPACT OF PLANT RESIDUES ON CROP PRODUCTIVITY..
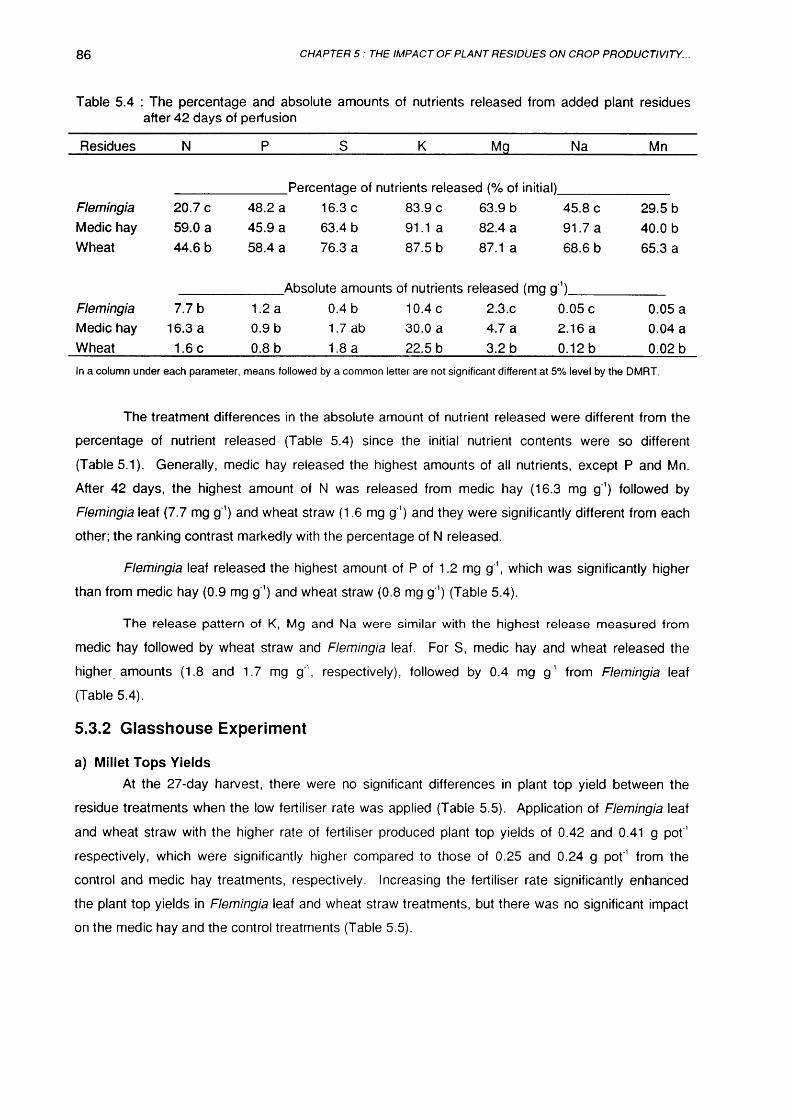
and residue was also observed with increasing fertiliser rate enhancing grain yield in the Flemingia
leaf and wheat straw treatments with no such effect in the medic hay and non-residue treatments.
Table 5.6 : Effect of plant residue and fertiliser rate on grain yield of millet (g pot-1)
Residue 91-day harvestLow High
Non 3.16 d 5.83 bcdFlemingia leaf 4.33 cd 9.43 aMedic hay 6.24 abc 7.14 abcWheat straw 4.11 cd 8.15 abMeans followed by a common letter are not significantly different at 5% level by DMRT.
b) Sulfur in Soil, Plant and Leachate
i) Total Soi135SulfurGenerally, a decline in residue S in the top soil was observed in all residue treatments with
time and increasing fertiliser rate led to a greater decline (Table 5.7). The exception was for the
Flemingia leaf at the high fertiliser rate where the greatest percentage of residue S present in the top
soil was recorded in the 48-day harvest with a decline to the 91-day harvest.
Table 5.7 : Recovery of total 35S in soil as affected by harvest times, residues, fertiliser applicationand soil depth (% of added 35S in soil)
Harvest Residue Low fertiliser High fertiliserTop Middle Bottom Top Middle Bottom
27 days Flemingia 85 9 4 74 14 8Medic 78 13 6 71 19 6Wheat 78 9 11 67 22 7
48 days Flemingia 81 8 7 80 9 8Medic 66 15 6 63 19 8Wheat 75 11 5 49 18 15
91 days Flemingia 75 10 5 70 9 8Medic 53 13 4 45 16 9Wheat 47 16 12 37 15 16
LSD at 5% level for means at each H*M*D, H*F*M, H*F*D = 3.38 (H = Harvest time, M = Residue, F = Fertiliser, D = Soil layer)
In contrast to the top soil, the percentage of residue S in the middle and bottom soil layers
increased with time. In addition, increasing fertiliser rate significantly enhanced the movement. This
is most apparent in the medic hay and wheat straw treatments. However, such an effect was not
obvious in the Flemingia leaf treatment where the percentage of residue S was quite consistent in the
lower soil layers throughout the experiment, except at the 27-day harvest where increased fertiliser
rate resulted in an increase in the percentage of total S in the middle and bottom soil layers
(Table 5.7).

CHAPTER 5 : THE IMPACT OF PLANT RESIDUES ON CROP PRODUCTIVITY... 89
ii) Total Soil SulfurAt the 27-day harvest, the highest level of soil S of 97.1 pg g -1 was recorded in the top soil
followed by 94.2 and 95.1 pg g-1 from the middle and bottom soil layers respectively. At the 48-day
harvest there was a higher concentration of soil S in the middle soil layer. At 48 days after planting,
the soil S level of 98.4, 96.1 and 91.5 pg g -1 were recorded from the top, middle and bottom soil
layers respectively and they were significantly different from each other. At the 91-day harvest there
was a significantly higher soil S concentration in the bottom soil layer compared to the middle soil,
although the concentration in the bottom soil was not significantly different compared to the top soil
(Table 5.8). Interactions between harvest time and soil layer, as well as plant residue and soil layer
on soil S concentration were also observed.
Table 5.8 : Total soil sulfur as affected by harvest times and soil depth (jag g-1)
Soil Layer Harvest time27 days 48 days 91 days
TopMiddleBottom
97.1 a94.2 b95.1 b
98.4 a96.1 b91.5 c
92.7 a89.1 b92.9 a
In a column, means followed by a common letter are not significantly different at 5% level by DMRT.
iii) Extractable Sulfur and 35SulfurThe interaction between harvest time, plant residue and soil layer on the concentration of
extractable S is presented in Table 5.9. At 27 days there was no significant difference among plant
residues in the concentration of extractable S in the top soil. In the middle soil layer, application of
medic led to the highest extractable S of 4.7 pg g -1 , followed by 4.6, 4.0 and 3.7 1..tg V from wheat
straw, Flemingia and the non-residue treatment respectively. In the bottom soil layer, application of
wheat straw resulted in the highest concentration of extractable S of 6.0 lAg g -1 (Table 5.9).

90
CHAPTER 5 : THE IMPACT OF PLANT RESIDUES ON CROP PRODUCTIVITY...
• Table 5.9 : KCI-40 extractable sulfur (lig g -1 ) as affected by harvest time, plant material and soil depth
Harvest Plant residue Soil layerTop Middle Bottom
27 days Non residueFlemingia leafMedic hayWheat straw
Non residueFlemingia leafMedic hayWheat straw
Non residueFlemingia leafMedic hayWheat straw
5.3 a4.9 a5.4 a4.8 a
6.6 a5.6 b5.2 b4.7 b
2.8 ab1.7 c2.1 bc3.2 a
3.7 b4.0 ab4.7 a4.6 ab
5.6 a5.0 a6.0 a5.8 a
3.7 a3.1 ab2.8 ab2.2 b
4.5 b4.8 b5.0 b6.0 a
6.4 a5.0 c6.0 ab5.3 bc
4.0 a3.0 b3.4 ab3.0 b
48 days
91 days
In a column under each harvest, means followed by a common letter are not significantly different at the 5% level by DMRT.
At the 48-day harvest, the highest extractable S concentration in the top soil layer, 6.6 pg g-1,
was observed in the non-residue treatment, followed by 5.6, 5.2 and 4.7 jig g -1 recorded with
Flemingia leaf, medic hay and wheat straw treatments, respectively. However, there were no
significant differences in the concentration of extractable S between the plant residues in the middle
soil layer. In the bottom soil layer, the highest concentrations of extractable S, of 6.4 and 6.0 g-1,
were observed with the non-residue and medic hay treatments respectively, compared to the lower
amounts of 5.3 and 5.0 lig g-1 observed with wheat straw and Flemingia leaf treatments (Table 5.9).
Extending the harvest time to 91 days resulted in a dramatic decrease in extractable S
compared to that at the 27-day and 48-day harvests. The average extractable S at 91 days
decreased by 39.6 and 48.2% from those of 27-day and 48-day harvests respectively (Figure 5.5).
Concentrations of 3.2, 2.8, 2.1 and 1.7 pg g -1 of extractable S were measured in the top soil layer
from the wheat straw, non-residue, medic hay and Flemingia leaf treatments respectively. While in
the middle soil layer, extractable S levels of 3.7, 3.1, 2.8 and 2.2 lig g -1 were recorded in the non-
residue, Flemingia leaf, medic hay and wheat straw treatments respectively. In the bottom soil layer,
the non-residue produced the highest extractable S of 4.0 vtg g -1 (Table 5.9 and Figure 5.5).
Interactions between fertiliser and soil layer, fertiliser and harvest, harvest time and soil layer,
on extractable S were also observed.

CHAPTER 5 : THE IMPACT OF PLANT RESIDUES ON CROP PRODUCTIVITY... 91
6–
5–
cs)4 -zz
cn
3cv
c.)cot- 2
0
-
1 i i Ili
• Residue
i i
Non-residue
i
Extractable
•••■••••.■
1111M
Extractable
i
S
S
1IIIM IIIIIB
MIT
i 1 1 1T M B T M B
27 days 48 days 91 days
Figure 5.5 : The concentration of residue S and non-residue S in the soil layers as affectedby harvest times and soil layers (T = Top soil layer, M = Middle soil layer, B =Bottom soil layer).
The effect of soil layer and harvest time on the proportion of residue and non-residue S
contained in KCI-40 extractable soil S is presented in Figure 5.5. An interaction between harvest time
and soil layer on residue S contained in extractable S was observed. At the 27-day and 48-day
harvest the proportion of residue-S in the top soil layer is highest, followed by the middle and bottomsoil layers, respectively. At the 91-day harvest, the proportion of residue S in extractable S was
decreased in each soil layer. The average residue S in extractable S at the 91-day harvest was
decreased by 59.4% compared to 48-day harvest, and 69.7% compared to 27-day harvest
(Figure 5.5).
iv) Uptake of 35Sulfur by Japanese MilletThere was no significant difference between the residue treatments in the percentage of
residue S contained in the millet when the crop was harvested at day 27 and day 48 (Table 5.10). At
the 91-day harvest it was obvious that application of wheat straw and medic hay resulted in greater
uptake of S from the residue by the millet (21.4 and 21.6% respectively) and these were significantly
higher than those of the 10.0% observed in the Flemingia leaf treatment. In all residue treatments,
increasing the harvest time resulted in an increase in the percentage of residue S in the millet
(Table 5.10).
The residue and non-residue S in millet is shown in Figure 5.6. At the first harvest, only a
small amount of residue S, 0.08, 0.14 and 0.19 mg, was measured in the millet from the Flemingia
leaf, medic hay and wheat straw treatments, respectively, with no significant differences between
them. The total amount of S in millet uptake and the amount derived from the residues gradually
increased by the second and third harvest. By the third harvest the highest uptake of residue S
(5.1 mg) was observed with the medic hay treatment, followed by wheat straw and Flemingia leaf in

92
CHAPTER 5 : THE IMPACT OF PLANT RESIDUES ON CROP PRODUCTIVITY..
which 3.8 and 1.8 mg of residue S respectively was present in the millet (Figure 5.6). These were
significantly different from each other.
Table 5.10 : Recovery of 35S in millet as affected by harvest times and plant residues (% of 35S addedin residue)
Plant Residue Harvest time 27 days0.7 a0.9 a1.5 a
48 days5.0 a7.4 a8.1 a
91 days10.0 b21.6 a21.4 a
Flemingia leafMedic hayWheat straw In a column, means followed by a common letter are not significantly different at the 5% level by DMRT.
There were no significant differences between residue treatments in total plant S (non-residue
and residue S) in millet at each harvest (Figure 5.6).
25 —q Non residue S
20 — ■ Residue S
SiE 15 —Ea)co 1 0 —o
Cf)
5—
0 = I =1 1 = I
F M W27 days
i imp i [1 I I= 1 i III I I I 1F M W F M w
48 days 91 days
Figure 5.6 : The proportion of residue and non-residue S in millet as affected by harvesttimes and plant residues (F = Flemingia leaf, M = Medic hay, W = Wheat strawtreatment).
v) Losses of Sulfur in LeachateLosses of S through leaching were high in week 1 with the highest value observed from the
control, followed by Flemingia leaf, medic hay and wheat straw treatments respectively (Figure 5.7).
At week 2, leached S decreased in all treatments and this was generally followed by a gradual
increase for the following 3 to 5 weeks. The maximum S lost from the control (2.0 mg week -1 ), medic
hay (2.0 mg week-1 ), wheat straw (2.3 mg week -1 ) and Flemingia leaf treatments (1.9 mg week') were
observed at weeks 1, 5, 6 and 7 respectively. After the leaching peak was reached leached S
gradually decreased through to week 12 (Figure 5.7). On average, increasing fertiliser application
enhanced the leaching of S by approximately 13.6%.

Non
---S— Flemingia
Medic Wheat
Or/
2.0
En 1.5"Esa)
1.0(.)COCD
(J) 0.5
—1,— Non
25 —
5% LSD
"63 20 —E
.c(,)ala)u)a)
15
10
—
—-..7.co3g 5 —0 9
,,.....................,.....
,..0-...
:x..!...7-'."---,----4`. .:,:rr.r77.•••
0 I I i 1 I
1 2 3 4 5 6
--IA— Remingia
Medic
Wheat
I I i i I -I
7 8 9 10 11 12
CHAPTER 5 : THE IMPACT OF PLANT RESIDUES ON CROP PRODUCTIVITY... 93
The greatest loss of S by leaching over the 12 week period, 21.4 mg, was observed from the
wheat straw treatment followed by 18.7, 18.2 and 16.9 mg from medic hay, Flemingia leaf and the
control treatments respectively (Figure 5.8).
3.0 —
2.55°/. LSD
0.02 3 4 5 6 7 8 9 10 11 12
Time (weeks)
Figure 5.7 : S leaching rate (mg week -1 ) from different residue treatments over 12 weeks.
Time (weeks)
Figure 5.8 : The cumulative leaching of S from plant residue treatments over 12 weeksperiod.
Leaching of residue S, as measured by 35S, gradually increased from the beginning and
reached a maximum at week 5 in all residues (Figure 5.9). At week 5 the highest amount of residue
S leached, 1.04% of total residue S, was observed from the wheat straw, followed by 0.87 and 0.30%from medic hay and wheat straw treatments, respectively. After the peak, the percentage of residue
S lost in leachate declined gradually (Figure 5.9). Increasing fertiliser application led to an increase
of 29.7% in residue S leached.

FlemingiaMedicWheat
5% LSDI1.2 —
a)
c.) 1 .0 —al
MN 0.8 -
a) 0.6 -=
0.4
O0.2 —
0.0
5% LSDNN
9 --
8
7 —
Flemingia
Medic
Wheat6 —
7:3(T) 5 -
.c15 4 -e 6
3 —
2—E
1—
94 CHAPTER 5 : THE IMPACT OF PLANT RESIDUES ON CROP PRODUCTIVITY...
The cumulative leaching of residue S is shown in Figure 5.10. After 12 weeks, 8.7, 7.4 and
2.3% of residue S was leached from wheat straw, medic hay and Flemingia leaf treatments
respectively. There was no significant difference between wheat straw and medic hay treatments but
these treatments were significantly different to that from the Flemingia leaf treatment.
1.4 —
2 3 4 5 6 7
8 9 10 11 12
Time (weeks)
Figure 5.9 : Percentage of residue S leached from the different residue treatments over 12weeks.
2 3 4 5 6 7 8 9 10 11 12
Time (weeks)
Figure 5.10 : Cumulative loss of residue S in leachate over the 12 weeks.
vi) Summary of 35S in each ComponentA summary of residue 35S expressed as a percentage of 35 S input contained in each
component of the system at the 91-day harvest is shown in Figure 5.11. Increasing fertiliser
application rate led to increasing leachate S in all residue treatments, with the greatest increases, 2.5
and 2.0%, in the medic hay and wheat straw treatments. The effect of fertiliser rate on extractable
and non-extractable soil S varied with residue treatment. Generally, application of Flemingia leaf
resulted in a higher amount of non-extractable S compared to the medic hay and wheat straw

CHAPTER 5 : THE IMPACT OF PLANT RESIDUES ON CROP PRODUCTIVITY.. 95
treatments. In contrast, Flemingia leaf application led to a lower concentration of extractable S andleached residue S compared to medic hay and wheat straw application. Increasing fertiliser
enhanced the concentration of extractable S in the medic hay treatment, but had no significant effect
on other residues.
Uptake of residue S by millet had a similar pattern to that of the leachate S with a lower
uptake in the Flemingia leaf treatment, while the application of medic hay and wheat straw led to a
higher uptake of residue S. Increasing fertiliser significantly enhanced the uptake of S by millet in the
wheat straw treatment but no such effect was recorded in the Flemingia leaf and medic hay
treatments (Figure 5.11).
100 –
80 –
60 –
40 –
20 –
0 lmmI 1Low High
0 Plant
q Non Extractable Soil S
q Ka-40 S
■ Leachate
11111 1 III i MI I ILow High Low High
Flemingia leaf Medic hay Wheat straw
Figure 5.11 : Percentage of 35S recovered in each component of the planting system at lowand high fertiliser at the 91-day harvest (% of 35S input).
c) Nitrogen in Soil, Plant and Leachate
0 Total soil NitrogenThe concentration of total soil N in each soil layer at each harvest is presented in Table 5.11.
Generally, among the residue treatments, the soil N in the top soil layer was higher in the residue
application treatments than in the non-residue treatment. This was most pronounced at the first and
third harvest. At the second harvest the total N in the non-residue treatment was slightly higher than
in the wheat straw treatment. By the 91-day harvest, the concentration of N in the top soil layer of the
Flemingia leaf, wheat straw, medic hay and non-residue treatments was 0.79, 0.74, 0.72 and 0.68 mg1g soil, respectively (Table 5.11).
In the middle soil layer, the concentration of soil N varied but the concentration in the bottom
soil layer was consistent across residues. In all 3 harvests, there were no significant differences in
the amount of soil N in the bottom soil layer among the residue treatments (Table 5.11).

96 CHAPTER 5 : THE IMPACT OF PLANT RESIDUES ON CROP PRODUCTIVITY...
Table 5.11: Total soil nitrogen (mg g -1 soil) as affected by plant residues, harvest times and soildepth
Harvest Residue Soil layerTop Middle Bottom
27 days Non 0.67 b 0.75 a 0.70 aFlemingia leaf 0.77 a 0.74 ab 0.68 aMedic hay 0.81 a 0.69 c 0.70 aWheat straw 0.78 a 0.70 bc 0.68 a
48 days Non 0.77 b 0.71 a 0.69 aFlemingia leaf 0.83 a 0.72 a 0.73 aMedic hay 0.77 b 0.72 a 0.70 aWheat straw 0.75 b 0.68 a 0.69 a
91 days Non 0.68 c 0.67 ab 0.63 aFlemingia leaf 0.79 a 0.71 a 0.64 aMedic hay 0.72 bc 0.68 ab 0.65 aWheat straw 0.74 b 0.65 b 0.64 a
In a column under each harvest, means followed by a common letter are not significantly different at the 5% level by DMRT.
ii) Percentage of Residue N (N 15) in SoilGenerally the percentage of N derived from the residue ( 15N) in the soil was higher in the top
soil layer at each harvest compared to the middle and bottom soil layers (Table 5.12). At later
harvests there was a lower percentage of 15N in the top soil layer in all residue treatments. Between
the 27-day harvest and the 91-day harvest there was a decline of 8.2%, 29.6% and 9.0% in 15 N in the
top soil layer from the Flemingia leaf, medic hay and wheat straw treatments, respectively. In
contrast to the top soil layer, the percentage of 15 N in the middle and bottom soil layers generally
increased with time up to 48 days in the medic hay and Flemingia leaf treatments. However, by 91
days the percentage of 15N in these two treatments had declined slightly. In the wheat straw
treatment there was a decrease in 15 N content in the lower soil layers at the 48-day harvest compared
to 27-day harvest. However this recovered slightly by the 91-day harvest (Table 5.12).
Among the residue treatments, the percentage of 15N in the middle and bottom soil layers in
the medic hay and wheat straw treatments was higher than in the Flemingia leaf treatment, but the
reverse was true in the top soil layer. At the 91-day harvest the percentage of 15 N in the top soil layer
in the Flemingia leaf treatment was approximately 39.3% and 10.0% higher than in the medic hay and
wheat straw treatments respectively. In contrast to the top soil layer, the percentage of 15 N in the
lower layers observed from the wheat straw and medic hay treatment was approximately 66.9% and
63.1% higher than that from Flemingia leaf treatment respectively (Table 5.12).

CHAPTER 5 : THE IMPACT OF PLANT RESIDUES ON CROP PRODUCTIVITY... 97
Table 5.12 : Percentage of 15N in each soil layer as affected by residue, harvest time and soil depth(% of 15N input in residue).
Residue Soil layer Harvest27 days 48 days 91 days
Flemingia leaf Top 86.2 a 80.5 a 79.2 aMiddle 1.7 b 2.0 b 1.6 bBottom 0.7 b 1.7 b 0.7 b
Medic hay Top 80.8 a 62.7 a 56.9 aMiddle 4.8 b 4.9 b 5.2 bBottom 1.3 c 1.9 c 1.1 c
Wheat straw Top 79.1 a 75.6 a 72.0 aMiddle 5.0 b 4.3b 5.0 bBottom 2.7 b 1.9 b 2.1 c
In a column under each residue, means followed by a common letter are not significantly different at the 5% level by DMRT.
iii) Uptake of 15N by Japanese MilletAt the 27-day harvest there was no effect of residue on the uptake of 15 N by millet (Table
5.13). At the 48-day harvest the highest uptake of 15 N, 11.4°/0 of that added was recorded in the
medic hay treatment and it was significantly higher than the 4.9 and 3.2% observed in the wheat
straw and Flemingia leaf treatments. There was, however, no significant difference between the latter
two treatments. At the 91-day harvest, application of medic hay had resulted in the highest 15N
uptake of 15.8%, followed by 9.8 and 4.5% from wheat straw and Flemingia leaf treatments,
respectively (Table 5.13).
Between the 48 and 91-day harvests there were significant increase in the 15N content of the
millet plants in all residue treatments, with the rate of increase differing between residues (Table
5.13).
Table 5.13 : Percentage of 15 N uptake by millet as affected by harvest time and residue treatment(% of 15 N input in residue)
Plant Residue Harvest time
27 days 48 days 91 daysFlemingia leaf 0.5 a 3.2 b 4.5 cMedic hay 1.8 a 11.4 a 15.8 aWheat straw 1.1 a 4.9 b 9.8 bIn a column, means followed by a common letter are not significantly different at the 5% level by DMRT.
iv) Losses of Nitrogen in Leachate
The amount of NH 4+ -N leached was very low in all treatments and no NH 4+ -N was leached
after week 5, thus the leaching of mineral N presented in Figure 5.12 is a combination of leaching of
mineral NO and NH 4+ -N. From Figure 5.12 it is apparent that the leaching of NO -3 + NH 4+ -N from
all residue treatments was highest in week 1. The highest amount of N leached in week 1 was from
the non-residue treatment followed by the medic hay, Flemingia leaf and wheat straw treatments.

Non
RemingiaMedic Wheat
I 5°/0 LSD
...... .. . . ..... ........
. • •
98
CHAPTER 5 : THE IMPACT OF PLANT RESIDUES ON CROP PRODUCTIVITY...
After week 1 the leaching of mineral N declined gradually through to week 12. The amount of N
leached from the non-residue treatment was generally higher than from the residue treatments at
most times, except week 4 (Figure 5.12).
After 12 weeks, the highest amount of mineral N leached was 327.2 mg from the non-residue
treatment, followed by 294.3, 287.1, and 232.4 mg from medic hay, Flemingia leaf and wheat straw
treatments, respectively (Figure 5.12). Fertiliser rate had no effect on the leaching of mineral N.
350
300
250
200ar
• 150
• 100E(.) 50
1 2 3 4 5 6 7 8 9 10 11 12
Time (weeks)
Figure 5.12 : Cumulative leaching of mineral N (NO + NH 4+) from plant residues over 12weeks (mg)
In all three residue treatment, the leaching of 15N gradually increased from the beginning of
the experiment and reached their maxima at different times (Figure 5.13). Medic hay addition
resulted in the highest 15 N leaching compared to the other residues each week. The leaching of 15N
from the medic hay treatment reached a maximum at week 5, whilst the wheat straw and Flemingia
leaf treatments reached their peaks at week 6. The maximum weekly loss of 15N in leachate was
1.2% from the medic hay treatment, followed by 0.5% and 0.2% from the wheat straw and Flemingia
leaf treatments, respectively. After the maxima were reached, leached N declined in all residue
treatments (Figure 5.13). There was no effect of fertiliser on 15 N leaching.
After 12 weeks the highest cumulative 15N leaching of 6.7% was measured in the medic hay
treatment and this was significantly higher than the 1.7 and 1.0% in the wheat straw and Flemingia
leaf treatments respectively (Figure 5.14). There was no significant difference between the latter two
treatments.

I 5% LSDFlemingia
--fa,— Medic
Wheat
8—
7—,z
z6
N dtl)
5
"a 0 4 —
eas 3 —
2 —
1 —C.)
0
CHAPTER 5 : THE IMPACT OF PLANT RESIDUES ON CROP PRODUCTIVITY... 99
1.4 —
cp 1.2 — I 5°/,, LSD 1ri14\N.c r NN-11,
w /coc
...Z— 0.8 — Al
..."e 0.6 — A..--/
.13L.i 0.4-
°5 0.2 -e
Flemingia
—4E— Medic
Wheat
0.0 1 1 I I ►
1 2 3 4 5 6 7 8 9 10 11 12
Time (weeks)
Figure 5.13 : Percentage of 15 N leached from plant residues over 12 weeks (% of 15 N input)
1 2 3 4 5 6 7 8 9 10 11 12
Time (weeks)
Figure 5.14 : Cumulative leaching of 15 N from plant residues over 12 weeks (% of 15 N input)
v) Summary of 15Nitrogen in each ComponentA summary of the 15 N distribution in each component of the system at the 91-day harvest is
shown in Figure 5.15. Generally, the percentage of 15 N in the soil was greater in the Flemingia leaf
and wheat straw treatments than in the medic hay treatment. In contrast, the percentage of 15N in the
leachate was highest in medic hay treatment while a very low percentage of the 15N was recovered in
the leachate in the Flemingia leaf and wheat straw treatments. The highest uptake of 15 N by millet
was observed in the medic hay treatment followed by wheat straw and Flemingia leaf. Fertiliser rate
had no obvious effect on the percentage of 15N in each component.

100
CHAPTER 5 : THE IMPACT OF PLANT RESIDUES ON CROP PRODUCTIVITY...
100
90
80
704.-7--z0- 60
"a 50t 40z
in▪ 30
20
10
0
q Rant
q Soil
■ Leachate
f MI i NE i Low High
Low High
Low High
Flemingia leaf
Medic hay Wheat straw
Figure 5.15: Percentage of 15N recovered in each component of the planting systems at the91 -day harvest (% of 15N input)
d) Carbon in Soil and Leachate
i) Total Soil CarbonGenerally, the concentration of soil C was higher in the top soil layer, where the residue had
been incorporated than in the middle and bottom soil layers (Table 5.14). Within the top soil layer,
application of plant residues significantly increased soil C by 7.0% compared to the non-residue
treatment. The concentrations of soil C of 11.3, 11.1 and 11.0 mg g -1 soil recovered in the Flemingia
leaf, wheat straw and medic hay treatments were significantly higher than that of 10.4 mg g -1 soil
recorded from the non-residue treatment. The application of Flemingia leaf, wheat straw and medic
hay increased the concentration of soil C in top soil layer by 8.7, 6.5 and 5.8% respectively over the
non-residue treatment. There was no significant difference among the residue treatments in the
concentration of soil C in the middle or bottom soil layers (Table 5.14).
Table 5.14 : Total soil carbon (mg g -1 soil) as affected by plant residues and soil depth.
Plant Residue Soil LayerTop Middle Bottom
Non residue 10.4 b 10.6 a 10.2 aFlemingia leaf 11.3 a 10.9 a 10.4 aMedic hay 11.0 a 10.8 a 10.4 aWheat straw 11.8a 10.5a 10.4a
In a column, means followed by a common letter are not significantly different at the 5% level by DMRT.
ii) Labile Soil CarbonAt the first harvest, the highest amount of labile carbon, 9.40 g pot -1 , was found in the
non-residue treatment followed by 8.81 g pol l with wheat straw and medic hay, and 7.41 g pot -1 with

CHAPTER 5 : THE IMPACT OF PLANT RESIDUES ON CROP PRODUCTIVITY... 101
the Flemingia leaf treatment (Table 5.16). There were no significant differences in the amount of
labile C between the three residue treatments. At the second harvest, the medic hay treatment had
the highest labile C of 8.46 g pol l and this was significantly higher than the to 6.96, 6.64 and 5.99 g
pot -1 from non-residue, wheat straw and Flemingia leaf treatments respectively. There was no
significant difference between the residue treatments in the amount of labile C at the third harvest,
although the wheat straw treatment produced the highest value of 9.63 g pot - ' (Table 5.16).
iii) Percentage of Residue Carbon in SoilThe percentage of residue C in each soil layer at each harvest is shown in Table 5.15.
Although, there were no interactions between plant residue, soil layer and harvest time, this table is
presented in order to enable comparisons with 35S (Table 5.7) and 15N (Table 5.12) data and to depict
C movements in the soil column. Generally, the percentage of residue C was higher in the top soil
layer than in the middle and bottom soil layers. At the later harvests the residue C in the top soil layer
tended to decrease and to increase in the middle and bottom soil layers. However, some negative
values for the calculated percentage of residue C in soil were observed suggesting that there were
significant inputs of carbon from millet roots (8 13C value = -12.34%0).
Table 5.15: Percentage of residue C in each soil layer as affected by residue, harvest time and soildepth.
Residue Soil layer Harvest time27 days 48 days 91 days
Flemingia leaf Top 6.7 a 8.7 a 7.4 aMiddle 1.8 b -6.4 b 1.2 bBottom 0.3 b 4.2 a 3.5 b
Medic hay Top 5.4 a 3.2 a 2.9 abMiddle 2.1 ab -4.0 b 4.5 aBottom -0.8 b 4.0 a -0.1 b
Wheat straw Top 6.0 a 6.4 a 4.7 aMiddle -1.4 b -5.4 b 2.1 aBottom 0.2 b 3.3 a 1.5 a
In a column under each residue, means followed by a common letter are not significantly different at the 5% level by DMRT.
iv) Losses of Carbon in LeachateThe cumulative loss of C in the leachate is presented in Figure 5.16. The percentage C lost
was highest in the medic hay treatment at each harvest although not statistically significant. Even the
highest rate of C loss in leachate were very small, amounting to a total loss much less than 1% of the
total soil carbon. In addition, the leaching of C from medic hay residue treatments was higher than in
the non-residue treatment at each harvest. The wheat straw treatment had lost little C at the 27-day
harvest and it began to leach a larger amount of C by the 48-day harvest. By the third harvest,
0.34% of total soil C was leached from the medic hay treatment followed by 0.33, 0.28 and 0.26%
from the wheat straw, Flemingia leaf and non-residue treatments respectively (Figure 5.16).

0.35 c) 13 Non
60 0.30 — Flemingia
To ■ Medic0 0.25 — 0 Wheat0t 0.20 —
f 0.15 —co
0 0.10
co 0.05 —
E 0.00
5% LSD at each harvest
102 CHAPTER 5 : THE IMPACT OF PLANT RESIDUES ON CROP PRODUCTIVITY...
27 days
48 days
91 days
Harvest time
Figure 5.16 : Cumulative C leached from plant residue over 12 weeks (% of initial soil C +added residue C)
v) Summary of Carbon budgetA summary of the carbon budget of the system from the 3 harvests is shown in Table 5.16.
At the 27-day harvest, there were no significant differences in the amount of non-labile C and C lost
as CO2 (respired) between residue treatments. The highest amount of labile C was in the control
treatment (9.40 g pot -1 ) followed by the medic hay and wheat straw treatments (8.81 g pot -1 ) and theFlemingia leaf treatment (7.41 g pot -1 ). It indicates the dominance of the non-labile C, the smaller,
but important, labile C, and the relatively small amount of C in the leachate. The majority of the initial
soil + residue carbon was in the non-labile C pool and the smallest proportion, was lost in leachate.
At the 48-day harvest, the amount of non-labile C and the loss of C in leachate had increased
with all residue treatments, including the control treatment. The labile carbon decreased, with the
highest amount of labile C (8.46 g pot -1 ) with medic hay, and the lowest (5.99 g pot -1 ) with Flemingia.
There was an apparent decline in the amount of C calculated as lost as 00 2 . Clearly, this is
impossible.
By maturity, the amount of C loss as CO 2 observed from all residue treatments were
increased compared to the 48-days harvest. The highest amount of CO 2-C of 5.03 g pot -1 was
recorded from the medic hay treatment followed by 4.67, 4.42 and 3.12 g pol l observed from the
control treatment, wheat straw and Flemingia leaf treatments respectively. In contrast to the 002-C,
decreasing in the amount of non-labile C, compared to the 48-days harvest, was observed from all
residue treatment. The amount of labile C was varied among all treatments but there was no
significant difference was observed.

CHAPTER 5 : THE IMPACT OF PLANT RESIDUES ON CROP PRODUCTIVITY.. 103
Table 5.16 : Soil carbon budget as affected by plant residues and harvest times (g pot-')
Harvest Carbon Control Flemingia Medic Wheat27 day Labile C 9.40 a 7.41 b 8.81 ab 8.81 ab
Non-labile C 54.80 a 57.81 a 57.10 a 56.78 aLoss as CO2A 2.03 a 3.61 a 2.72 a 2.93 aLeachate 0.07 b 0.09 ab 0.10 a 0.08 ab
48 days Labile C 6.96 b 5.99 b 8.46 a 6.64 bNon-labile C 57.97 b 61.70 a 58.83 ab 59.01 abLoss as CO2 1.26 a 1.10 a 1.29 a 2.80 aLeachate 0.11 c 0.13 be 0.15 a 0.14 ab
91 days Labile C 8.30 a 8.46 a 8.77 a 9.63 aNon-labile C 53.16 b 57.14 b 54.70 ab 54.13 abLoss as CO2 4.67 a 3.12 a 5.03 a 4.42 aLeachate 0.17 c 0.19 b 0.23 a 0.23 a
In each source of carbon under each harvest, means followed by a common letter are not significantly different at 5% level by DMRT.
A Loss as CO2 = [initial soil C + residue C) - [Final soil C (after root removed) + leachate C)
5.4 Discussion5.4.1 Perfusion Experiment
Results from the perfusion study showed that among the three residues used in this
experiment, medic hay had a higher breakdown rate than those of Flemingia leaf and wheat straw.
This result supported the finding from the previous perfusion experiment (Chapter 4) which also found
a rapid breakdown of medic hay and slow breakdown from Flemingia leaf and wheat straw. The
wheat straw used in this study however, had a higher decomposition rate than the wheat straw studied
in Chapter 4. This is because the straw from this study was grown under good growing conditions
with a regular nutrient supply, while the straw from previous experiment was grown under the more
stressed conditions in the field.
The amount of each nutrient release from the residues varied, but the release of major
nutrients, such as N, S, K, Mg and Na, was generally higher from medic hay than from wheat straw
and Flemingia leaf. As a percentage of initial nutrient content, the release of N from medic hay and
wheat straw did not differ much, although the absolute amounts were very, different. This is due to
the great difference in N content of the two residue. The nutrient release of residues in the perfusion
technique reflected the results obtained from the pot trial.
5.4.2 Pot Experiment
a) Crop YieldsThe differences in decomposition rate of the three residues were not obviously reflected in the
millet yields measured in the pot experiment. At the early stage of growth, the poor millet yields from
the treatment receiving medic hay compared to Flemingia leaf and wheat straw was probably the
results of higher organic acid production during rapid decomposition of medic hay. Moreover, during
the leachate collection period the pots were temporary subjected to waterlogging (approximately 5 - 6

104
CHAPTER 5 : THE IMPACT OF PLANT RESIDUES ON CROP PRODUCTIVITY...
hours) and this may have stimulated the accumulation of organic acids from rapidly decomposable
residue (Cannell and Lynch, 1984).
Despite the low contribution of residue N to crop growth in the Flemingia leaf and wheat straw
treatments (Figure 5.18) millet yields were quite high. This suggests that N from applied inorganic
fertiliser had compensated for the lower N supplied from residues, especially during the early stage of
crop growth. By maturity there were no differences in crop yields among the treatments receiving the
three residues, but they produced a higher yield than that of the control treatment. Generally,
application of residues improved crop yields over the control by approximately 44 to 70%. Results
from this study support the findings of many workers that application of plant residues improves crop
growth and yield (Ta and Faris, 1990; Wonprasaid et al, 1995) because the incorporation of residues
of forage or grain legume crops usually results in an increased supply of mineral N (Doughton and
MacKenzie, 1984; Strong et al., 1986).
b) Movement of Nutrients and CThe distribution of residue N and S in each component of the system i.e. plant, soil and
leachate, are shown in Figures 5.17 and 5.18. The recovery of 35S, from the plant, the soil and the
leachate, was near 100%, while the recovery of 15 N ranged from 85% (medic hay) to 90% (wheat
straw). The loss of residue N (10 - 15%) was most likely due to ammonia (NH 3) volatilisation and/or
denitrification occurring during the decomposition process (Floate, 1970, De Datta, 1995). The
unaccounted N from the current study was quite reasonable compared to the findings of Broadbent
and Nakashima (1974), who reported 15 - 17% of residue N loss (residue N in leachate not
determined), and of Jensen (1992), who reported N loss of less than 15% (residue N in leachate
determined).
Results from the perfusion study showed that medic hay and wheat straw had a high
percentage release of N and S and this was reflected to the residue N and S contained in each
component of the plant-soil system in the pot trial. A higher percentage of residue N and S was found
in the leachate and in plant uptake from treatments receiving medic hay. Compared to the Flemingia
leaf treatment, leachate N and S from the medic hay treatment were 3 and 6 fold higher, respectively,
while plant uptake of N and S from the medic hay treatment were 3 and 2 fold higher than uptake
from the Flemingia leaf treatments. The high N and S content of medic hay (2.76 and 0.29%
respectively), in addition to its rapid decomposition rate, resulted in greater amounts of N and S and
the higher percentages of total N and S released during the decomposition process (Figures 5.17 and
5.18). Once released the nutrients were readily available for plant utilisation. However, the high
amount of nutrient release led to a nutrient supply greater than plant demand and this resulted in the
movement of excess nutrients down the soil profile with subsequent loss through leaching, as found
by Becker et al. (1994). As a consequence of greater plant uptake and N and S losses through
leachate, the total soil N and S with an application of medic hay was lower than that with the
Flemingia leaf treatment. This suggests a greater residual value with the slower breakdown material.

120 —.V:ZEL•S 100 - — 1=7
In u)n
M--' -I■1
=
0 Rant0 Non Extractable Sq Extractable S■ Leachate
I■
o 80-0E2 60 -SEo 40-0.co• 20 -c
*ONO
incri 0 _.. 1 .1.1
n} — i mi l 111111 1
F M WF M W
m .i "'1 i 1
F M W91 days27 days 48 days
CHAPTER 5 : THE IMPACT OF PLANT RESIDUES ON CROP PRODUCTIVITY... 105
Figure 5.17 : Effect of plant residue application on percentage of 35S recovered in eachcomponent of the plant-soil system at different harvests (F = Flemingia leaf,M = Medic hay, W = Wheat straw treatment).
100 -..-,z '..'C. 90 II■1, =
=••■•"'Z'
•.,
••■C ._FM 'MEM
Z 80 -. .--
0 Plant
qSoil■ Leachate
"6 70 -0 60 -m 50 -coEta. 40-o• 30-
oo 20 -a)
....c 10-z wIIin 0 — flif 1 f'—'1 fl'i I I—
F M W F M W F M W
27 days 48 days 91 days
Figure 5.18: Effect of plant residue application on percentage of 15N recovered in eachcomponent of the plant-soil system at different harvests (F = Flemingia leaf,M = Medic hay, W = Wheat straw treatment).
Application of wheat straw led to a high residue S but low residue N recovery in leachate with
a significant amount of both residue N and S utilised by the millet. This suggests that most of the N
released from wheat straw was utilised by the millet crop, and this resulted in a low loss of residue N
through leaching. By contrast, the high S content in wheat straw (0.23%) resulted in a high loss of
residue S through leaching, which was similar to that observed from medic hay. This also confirmed
the results from the perfusion study which showed that the release of S was highest from wheat straw.
1 I■I i

106 CHAPTER 5 : THE IMPACT OF PLANT RESIDUES ON CROP PRODUCTIVITY...
In contrast to medic hay and wheat straw, application of Flemingia leaf resulted in the highest
percentage of residue S and N remaining in the soil, with a lower amount of nutrients found in the
leachate and in the plant. The residue N and S in soil resulting from Flemingia leaf application were
both 1.25 times higher than that observed from the medic hay treatment. This resulted from the slow
decomposition of this residue as shown in the perfusion study. The slow decomposition rate resulted
in a slower release of nutrients and, as a result, a significant amount of nutrients remained in
undecomposed residue and soil microbial biomass and less extractable soil S. Subsequently, the
loss of nutrients through leaching was reduced significantly compared to the rapid breakdown residue.
Considering the N content in the two legume residues, the N content in Flemingia leaf (3.70%)
was much higher than that of medic hay (2.76%), but more N was leached and taken up by the crop
from medic hay. This indicates that a high residue-N content does not always results in increased N
mineralisation of plant residues. In addition, the difference in N content between medic hay and
Flemingia leaf indicated that the loss of fertiliser N through leaching will not be proportional to the
amount applied, but will depend on the degree of the decomposition of the residue and the amounts
of nutrient released in relation to plant demand. This supports the similar findings of
Stevenson (1986).
The rapid release of plant residue-S from both medic hay and wheat straw is presumably
because of major S-containing components of these residues, such as protein and amino acids, are
very labile to soil microorganisms and are decomposed prior to other more resistant fractions, such as
cellulose (Stevenson, 1986) . Fitzgerald and Andrew (1984) have shown that methionine-S is rapidly
converted to SO 71 -S and soil organic S in 2 days following its addition to soil. Strickland et al., (1986)
have shown that most (70 - 100%) of the organic-S derived from forest litter can be mineralised or
converted into other forms of organic-S after 7 days exposure in soil. The results of current study
suggest that the application of residue with slow breakdown rates probably helps to slow this process
and, hence, more S was retained in the soil.
Application of the three plant residues had similar effects on the leaching of soluble C as on
the leaching of nutrients. Application of medic hay and wheat straw led to higher amounts of soluble
C loss through leaching. These losses were approximately 21% higher than losses from the
Flemingia leaf treatment. The greater losses of soluble C through leaching from the treatments
receiving medic hay were concomitant with lower amounts of total C remaining in the soil, while the
lower losses observed from Flemingia leaf treatments were related to a higher amounts of total C
retained in the soil. However, the direct impact of leaching of soluble C from these three residues
was small, with maximum losses of 0.34% of the total C added to the soil. These results are
comparable to the study of Miller et al. (1994) who measured leaching of C from residue using
simulated rainfall and reported that approximately 0.45 - 0.83% of organic C was leached from added
plant residues. A technique using 140 labelled residues as a tracer is recommended for future studies
in order to obtain more accurate monitoring of C leaching.

CHAPTER 5 : THE IMPACT OF PLANT RESIDUES ON CROP PRODUCTIVITY... 107
The losses of soluble C through leaching as shown in this experiment suggested that the
situation of movement of soil C is similar to that for plant nutrients, such as N and S. The explanation
for this is that when crop residues with a high turnover rate (such as, medic hay) or green manure are
added to soil, there is an episodic introduction of C and plant nutrients into the system and a rapid
depletion of C and nutrients as mineralisation progresses. Such systems can result in major losses if
the release of C and nutrients from the organic matter is at a rate above plant and microbial demand.
The results from this study show that the nutrient release rate from application of medic hay did not
match the demands of the millet crop. Although millet utilised a significant amount of N from themedic hay the high amount of residue N released was greater than crop demand which resulted in
significant losses of C and nutrient through leaching. The loss of soluble C in leachate reduced the
carbon content of the surface soil layer and this increases the difficulty of rehabilitating soil C levels
back towards their initial values, where the C and nutrient pool sizes were large (Blair et al., 1995c).
By contrast, in the Flemingia leaf treatment, a higher percentage of residue N and S remained in the
soil as well as a higher total soil C, with low soluble C in the leachate. This indicates that residues
and green manures with slow breakdown rates, such as Flemingia leaf, are a better choice to use as
soil amendments to rehabilitate soil fertility and C in the longer term. Residues which breakdown
more slowly result in a build up in C and nutrients which will benefit succeeding crops. This
suggestion is confirmed by this study and that reported in Chapter 4 and is supported by the field
study- of Wonprasaid et al. (1995) in Northeast Thailand, who reported the longer term benefits of
using slow breakdown residues in the rehabilitation of soil C and nutrients.
The evidence of soluble C movement down the soil profile was also reported by Lefroy et al.
(1996) who studied paired samples collected from adjacent areas of a Paleaquult with different
management at sites in Northeast Thailand. They found a large decline in total carbon and larger
decline in labile carbon, down the profile to 40 cm. They further suggested that the relatively large
amounts of total and labile carbon in the 20 to 40 cm layer of a cultivated soil suggests there has
been significant leaching of C and, presumably, other nutrients. The results from the current study
support this finding.
Increasing fertiliser application rate had no obvious effect on crop yields or movement of
residue nutrients and C. Fog (1988) reviewed the effect of added nitrogen on the rate of
decomposition of organic matter and concluded that added N often has a negligible effect on
decomposition. Little N may be required during decomposition because C from plant residue is
unavailable or slowly available to microorganisms and recycling of N and mineralisation of N from
other sources may be adequate to meet the requirement for N. In the current experiment, the
addition of inorganic fertiliser at the low rate of 10 kg N ha -1 was probably adequate to meet thatrequirement and, as a result, no response of crop yields or movement of residue nutrients and C were
recorded when fertiliser rate was increased to 30 kg N ha-1.
c) Leaching of S and NLeaching of mineral S and N during the first week were observed to be highest in the control
treatment compared to the residue added treatments. This is probably due to stimulation of sulfur

108 CHAPTER 5 : THE IMPACT OF PLANT RESIDUES ON CROP PRODUCTIVITY..
and nitrogen immobilisation processes by microorganisms following the addition of residues. The
addition of plant material into soil can markedly decrease the availability of N (Strong et al., 1987;
Saffigna et aL, 1989) and S (Stevenson, 1986) to plants by increasing immobilisation of nutrients.
Net mineralisation of S commenced by week 2. Previous findings have shown that S mineralisation
and S immobilisation can take place concurrently (Ghani et al., 1993).
The leaching of NH 4+ had ceased after week 5, whereas NO; continued to be leached.
Similar observations have been made by Amato and Ladd (1980) who observed that NH 4+
disappeared from the soil profile during the early stage of decomposition, but NO; remained.
The leaching of residue N and S was directly related to the residue N and S content in the soil
profile (8 - 24 cm depth). The higher percentage of residue N and S in the soil profile observed from
medic hay and wheat straw treatments compared to Flemingia leaf led to higher leaching losses of
these plant nutrients. This close relationship between nutrient content in the soil profile and in
drainage confirmed the previous explanation that residue N and S can move down to soil profile and
subsequently be lost through leaching. From their study, Francis et al. (1994) found that the variation
in leaching loss of N were directly related to mineral N content in the profile.
The discussion above, indicates the strong link between breakdown rate of plant residue,
available nutrients in plant uptake, soil profile and leaching. For instance, residues with rapid
breakdown results in greater release of available S. This means more KCI-40 extractable S, more S
for plant uptake, more S for movement down the profile and more S for leaching. In contrast,
residues with slow breakdown rate release a lower available S and this means less KCI-40 extractable
S produced, less S for plant uptake, less S for movement down the profile and less S for leaching.
Consequently, more S remained in the soil. The situation is similar for N and C.
d) Evaluation of 613C technique as a tracer of organic matter dynamicsU use of the 6 13 C technique to estimate residue C in soil was not completely successful in this
study. Some negative values for the calculated percentage of residue C remaining in soil were
observed. Clearly, this is impossible and suggests significant inputs of carbon from millet roots. With
three sources of carbon, of different 5 13C, namely soil (-14.35%0), residue (medic = -26.32%0, wheat =
-26.14%, Flemingia = -24.91%0) and millet roots (-12.34%0), it is impossible to calculate precisely the
proportions of C from different sources. To get a value of -6.4% of soil carbon remaining from the
residue (Table 5.15) would require an input of at least 13.4 g of millet roots, if no residue C is present.
With this possible influence of millet roots, these calculations are, at best, conservative estimates. If
the millet roots and the initial soil C had the same 6130 (-14.35%0), more accurate calculations could
be made. Further evidence of carbon input to "soil carbon" from millet roots is the calculated
reduction in total CO 2 loss in respiration (Table 5.16). This is impossible and suggests the final soil C
measurement was an over estimate. This could have arisen as an analytical error, or, more likely, as
a result of addition of C to the soil from the millet as root exudates or from incomplete removed of
millet roots. Another minor factor that may affect the calculated percentage of residue C is that the

CHAPTER 5 : THE IMPACT OF PLANT RESIDUES ON CROP PRODUCTIVITY... 109
sensitivity of the technique is not sufficient to detect changes in the source of carbon over short
periods, as in this experiment (12 weeks). Veldkamp and Weitz (1994) reported the uncertainty of
using 813c methods in soil organic matter studies resulted from measurement errors, sampling and
short time-scale variability. A further possible problem with the 5 13C method is isotopic discrimination
during substrate decomposition in the soil. There are some indications of small changes in the 5130
of CO2 released during decomposition (Mary et al., 1992), but no strong evidence of a significant
trend in the 813c of residue during decomposition.
Despite these limitations, the results obtained from this technique provide some
understanding of residue and soil C dynamics, and particularly, how the residue C moved down the
profile. Results shown in Table 5.15 indicate that the percentage of residue C in the top soil layer in
the Flemingia leaf treatment was generally higher than that observed from wheat straw and medic
hay. Concomitantly the percentage of residue C in the lower soil layers from wheat straw and medic
hay treatments were generally higher than in the Flemingia leaf treatment. The percentage of residue
C in the lower soil layers tended to increase with harvest time, indicating movement of C down the
soil profile. The movement of residue C from different residue treatments was well matched with the
movement of S and N, as well as the soluble C in leachate.
It is concluded that the 5 13C technique is a useful technique to use as a tracer to monitor
changes in the organic matter, even though it was not completely successful in this study. A numberof options exist to improve measurement of C dynamics, particularly C movement in the soil profile
and in leachate. Firstly, greater accuracy can be achieved if the crop roots and the initial soil C have
the same 613C. Secondly, 13 C and 140 labelling of residues would provide greater accuracy than the
natural abundance technique.

CHAPTER 6
GENERAL DISCUSSION
Much of agriculture throughout the world has developed by opening up new land such that
initial production is supported by the utilisation of the nutrients released from the accumulated soil
organic matter. This high initial level of soil organic matter also contributes to the physical fertility of
the soil. Sanchez et al. (1989) indicated that soil organic matter is a key material resource as it is the
reservoir and source of key nutrients and a modifier of soil textural properties. As soil organic matter
declines due to cropping, soil fertility declines and subsequently crop yields decline and they become
unstable and unsustainable. As soil organic matter declines yields can only be maintained by
significant inputs of fertiliser (Sanchez et al., 1987) until, in many soils, the efficiency of utilisation of
fertilisers is so low that their use is uneconomical. To improve the stability and productivity of these
systems, the organic matter content of the soil needs to be increased and management systems
developed which maintain reasonable amounts of SOM. Thus, there is increasing interest in using
plant residues and other organic materials for improving soil productivity in agricultural systems. To
develop the effective use and management of residues, a detailed understanding of decomposition
rate and nutrient release is needed, and this requires techniques that can be used to monitor changes
in decomposition and nutrient release of residues.
An in vitro perfusion apparatus developed in this project (Chapter 3) can be used for such a
purpose. This technique allows screening of plant residues and ranking of potential materials. Recent
field studies by Matta-Machado et al. (1994) have shown that decay rate constants for N were best
correlated with lignin content of the plant residues. Tian et al. (1995b) have developed a plant quality
index using C:N ratio, lignin and polyphenol concentration. The procedure developed from this current
research will potentially provide an additional assessment of the quality of plant residues.
Subsequently, attempts to design farming systems in which the plant residue breakdown rate can be
manipulated to maintain a more continuous supply of carbon for microbial activity and nutrients for
both microbes and plants, would be greatly assisted by this technique. This has been confirmed in the
experiments reported in Chapters 4 and 5 in which the in vitro perfusion technique was successfully
used to predict the outcome of the pot trials.
There is still much to be understood of the factors which control residue breakdown. Until this
is achieved, this less mechanistic, more of a "black box" approach to measuring breakdown provides a
good comparative measure to develop improved farming systems. In addition it can be used to
correlate with improved measurements of residue quality, as they are developed, to more firmly
establish the mechanisms of breakdown control.

CHAPTER 6 : GENERAL DISCUSSION 111
6.1 C and Nutrient Cycling in Plant-Soil Systems
The research program undertaken focused on the major transfer of C and nutrients in a soil-
plant system, including net mineralisation, plant uptake, input via plant residue application and the
movement of C and nutrients in the soil and in leachate.
In the pot experiments reported in Chapters 4 and 5 it was shown that significant
improvements in crop yield can be achieved when plant residues were applied to the soil. The
relative effect of the different plant residues is related to their nutrient content and their breakdown
rate. Residues with rapid breakdown rate improved crop yield significantly in the first crop while
application of residues with slow breakdown tended to produce poor growth of the first crop due to
nutrient immobilisation. In the second crop after residue application (Chapter 4) residues with slow
breakdown produced better crop growth than residues which breakdown rapidly. In the pot
experiment reported in Chapter 5, the application of residue with a rapid breakdown resulted in a
significant amount of nutrients being utilised by the plant as well as greater losses through leaching,with only small amounts of nutrients retained in the soil. A higher amount of soluble C was found in
the leachate when residue with a rapid breakdown rate, medic hay, was applied. This rapid
breakdown rate lead to a rapid release of nutrients and C and this is why the application of green
manure generally results in a short term improvement in crop yield but little or no long term
improvements in soil fertility and soil organic matter. By contrast, the application of residues with
slow breakdown rates resulted in more nutrients and C in the soil and lower losses through leaching.
This suggests that in the long-term, residues which breakdown more slowly, such as Flemingia leaf,
would be more suitable than rapid breakdown residues in building up soil C and nutrients to benefit
the following crops. The response of crops to different types of legume residues and fertilisers
indicates that management of these factors can have significant effects on the short, medium and
perhaps even long term availability of nutrients. Therefore, management of residues can be used to
manipulate the input of carbon and other nutrients into the system and the rate at which soil organic
matter turns over. This in turn will affect the size of soil organic matter pool and fertility of the soilboth of which contribute to the sustainability of the system.
Considering the decomposition of Flemingia leaf in the pot experiment reported in Chapter 4
(without fertiliser application) and in Chapter 5 (with added fertiliser) it is clear that the addition of this
residue without fertiliser resulted in relatively poor performance of the first crop compared to other
residues, including medic hay. Conversely, application of Flemingia leaf with added fertiliser (Chapter
5) enhanced the crop growth to the same level as did medic hay application, with significant
improvement in soil C and nutrients over the medic hay. This suggests that the application of slow
decomposing residues probably results in short term immobilisation of plant nutrients (Strong et al.,
1987; Saffigna et al., 1989), but the application of small amounts of mineral fertiliser during these
periods can overcome the reduction in available nutrients. However, application of fertiliser must be
carefully controlled so as not to stimulate soil biological activity to the extent that there is no long-term
build-up of soil organic matter (Blair et al., 1995a; Green et al., 1995).

112
CHAPTER 6 : GENERAL DISCUSSION
6.2 Practical ImplicationsThis study has shown the very important role that different types of plant residues can play in
improving the soil C and soil fertility in agricultural soils. In the past, organic matter management has
generally been approached via the use of crop residue return and green manuring. The use of green
manure crops is appropriate in regions with cool spring temperatures, which slow the decay rate such
that nutrients, particularly N, are released from the green manure at a rate which is related to crop
demand. In tropical systems, where mineralisation rates are potentially higher because of high soil
temperatures at the beginning of the growing season (Jenkinson and Ayanaba, 1977), and potential
leaching losses are greater because of higher intensity rainfall, a rapid release of nutrients from the
residue is inappropriate. The release of nutrients such as N, K and S can lead to NO -3 , K+ and SO 4= ,
and the associated cations and anions, moving down the soil profile with the wetting front (Stevenson,
1986, Blair et al., 1995a), such that the establishing crop does not have ready access to the released
nutrients. In soils of high hydraulic conductivity and/or poor nutrient retention capacity, such nutrients
may be leached below the rooting zone of the crop (Blair et al., 1995a).
It was demonstrated in Chapter 5 and by many researchers (Wonprasaid et al., 1995; Lefroy
et al, 1996) that C can move down the profile and be lost through leaching, in a similar manner to
plant nutrients. Movement of soluble C down to the soil profile not only reduces the carbon content of
the surface soil layer, but may also have significant effects on the N dynamics of the system. Where
crop residues are added to soil there is a likelihood that denitrification may be increased following the
addition of the energy source especially plant residues with a high water soluble C content, such as
green manures (Paul and Beauchamp, 1989). Several researchers (Bowman and Focht, 1974; Bacon
et al., 1989) have observed these effects with crop residues. Nitrates and nitrites which have moved
down the profile can be recovered when root activity increases in these lower soil layers. If soluble
carbon compounds move down the profile with, or to, the nitrates and nitrites, the carbon compounds
can provide a substrate for denitrifying bacteria, resulting in a loss of N from the soil to the
atmosphere.
To improve soil organic matter, particularly in the tropics, residue with slow breakdown rates
would seem more appropriate. When organic residues with slow breakdown rates are incorporated
into soil, there can be a short-term reduction in available nutrients, particularly N, as they are
immobilised in organic forms. Under certain conditions, and when plant demand is relatively low, theimmobilisation of nutrients can reduce losses by leaching and, in the case of N, volatilisation. Where
this short term reduction in available nutrients limits crop growth it can be overcome by the addition of
inorganic fertilisers with the residues and this requires a balance between the stimulation of organic
matter degradation and the longer term accumulation of soil organic matter, which is the substrate for
microbial activity and the means to sustained improvement in soil fertility.
Wallace (1994c) stated that nitrogen and carbon cycles are closely linked and more carbon
stored in soil surface can also have a significant impact on reducing N losses through leaching. If
nitrogen is being leached from soil to groundwaters it means that carbon and nitrogen are not in
equilibrium with each other - mineralisation exceeds immobilisation. A safe environment requires a

NUTRIENTRELEASE
LOSS zw
PLANT cc--UPTAKE H
LITTERDECAY
DEFICIT BETWEENREQUIREMENT AND
RELEASE
PLANTUPTAKE
LOSS
NUTRIENTRELEASE
I-z
z
CHAPTER 6 : GENERAL DISCUSSION 113
proper balance of carbon and nitrogen. Addition of carbon to soil to increase the C:N ratio may be the
best means of decreasing leaching of nitrates to groundwaters.
In conclusion, the development of efficient residue management systems for improving soil
organic matter and restoring soil fertility level requires an understanding of plant growth rate, and thus
time course of demand for nutrients, such as N and S, and the current nutrient status of the soil hence
the likely leaching risk. Optimising the supply of organic nutrients to crops requires synchronising its
nutrient mineralisation rate with the crops nutrients needs. Improved matching of supply and demand
would result in less excess mineral nutrients in the soil and, therefore, reduced opportunity for losses.
The nutrient supply may be synchronised with plant nutrient uptake by manipulating plant demand; for
example, planting date or crop growth duration may be controlled (McGill and Myers, 1987).
Alternatively, nutrient release and nutrient use efficiency may be manipulated by controlling the
quality of organic inputs such as crop residues and green manures (Francis et al., 1994). Thus, an
organic material of the right quality may release nutrients at approximately the same rate as required
by the crop (Figure 6.1).
1—zw
Z
zHz
TIME TIMEHIGH-QUALITY LITTER LOW-QUALITY LITTER
TIME TIME
HIGH-AND LOW- NO LITTERQUALITY LITTERS
Figure 6.1 : Hypothetical patterns of nutrient availability in four treatments of an experiment to testthe synchrony principle (Myers et al., 1994)

1 14
CHAPTER 6 : GENERAL DISCUSSION
6.3 Future Researcha) In vitro Perfusion Technique : A range of research projects can be undertaken using the
in vitro perfusion technique. Inoculation of the CaCl 2 with soil solution extracts and fertiliser solutions
could be used to investigate their effect on breakdown and nutrient release rates. In addition use of
N2 instead of CO2 free air could be used to assess anaerobic decomposition of residues, as
experienced in flooded rice fields. A preliminary study of this kind indicates very similar ranking of
different residues under aerobic and anaerobic conditions, but with significantly slower breakdown
under anaerobic conditions (Wonprasaid, pers. corn.).
b) Pot Experiments : Due to the significant inputs of carbon from millet roots and root
exudates (with 813C which differed significantly from both the initial soil C and the residues) and due
to the short duration of this experiment with relatively small additions of residue C, the 5 13C technique
was not completely successful in monitoring changes in residue carbon in soil or in leachate. In order
to accurately monitoring the movement of residue C in soil-plant systems, there is a need to use a
crop with the same 813C as the initial soil C; ideally using the same species as the test crop and the
source of soil C. Another possibility is to investigate other techniques for monitoring movement of
residue carbon. In the latter case, using plant material labelled with 13C or 14C may be more
appropriate if efficient labelling techniques can be developed. These labelled plant material
techniques greatly increase the precision of measurement by either having much greater differences
in 813C than occur naturally ( 13 0) or by using a specific tracer (14C).
3) Field Experiments : Similar evaluations of the effects of different management systems
on the dynamics of C and nutrients need to be undertaken in field experiments. Where the use of
radioactively labelled residues is safe and permitted, this is the preferred methodology due to its high
precision and accuracy. In areas where this is not possible, the use of 130, 15N and 34S stable isotope
labelled residue is an attractive alternative. Priority should be given to developing economical
systems for production of large quantities of evenly labelled residues and leaf litters. Natural
abundance techniques (for 13C, 15 N and even 34S) will continue to be useful, but with reduced
accuracy compared to the use of labelled/enriched residues.