Embed Size (px)
Citation preview

The Impact of Mother Literacy and ParticipationPrograms on Child Learning: Evidence from a
Randomized Evaluation in India
Rukmini BanerjiASER Centre
James BerryCornell University
Marc Shotland∗
Jameel Poverty Action Lab
April 2013
Abstract
We report the results of a randomized evaluation of three programs designed to improvethe home learning environment among rural households in India. Households were assignedinto one of four groups that received either: (1) adult literacy classes for mothers, (2) trainingfor mothers on how to enhance their children’s learning at home, (3) a combination of the firsttwo interventions, or (4) nothing, which serves as the control group. We find that mothers inthe first three groups perform 0.11, 0.06, and 0.15 standard deviations better (respectively) on acombined language and math test when compared to the control group. We find that the threeprograms had statistically significant effects of 0.04, 0.05, and 0.07 standard deviations onchildren’s math scores (respectively), but only the combined intervention had significant effectson language scores. We also find that the interventions increased women’s empowerment,mother participation in child learning, and the presence of education assets in the home.
JEL Classifications: C93, D13, I21, O15
Keywords: adult education, education inputs, field experiments
∗We thank Annie Duflo for collaboration and insights on the study design and implementation. We are also gratefulto Jessica Chan, Nandini Gupta, Ravi Gupta, Rachna Nag Chowdhuri, and Nikhil Wilmink for superb work coordinat-ing the field activities in Rajasthan and Bihar. Laurel Wheeler and Kevin Kho provided excellent research assistance.This research was funded by the International Initiative for Impact Evaluation. All errors are our own.
1

1 Introduction
Improving the quality of primary education in the developing world remains a crucial issue for
researchers and policymakers alike. While developing countries have made significant gains to-
wards universal enrollment, with a net enrollment rate of 90% in low and middle income countries
in 2011 (World Bank, 2013), learning has not matched this progress. For example, a 2012 survey
in India found that 96% of rural primary school-aged children were enrolled, but only 38% could
read a simple story (ASER Centre, 2013). Low quality education is often considered the result
of a low quality education system, characterized by poor school infrastructure, limited materials,
inappropriate pedagogy, and low-quality teachers.
However, low learning levels can also be attributed to the home environment: in low-income
households parents spend less time on educational activities with their children, are less productive
with the time they spend, have lower expectations, and allocate fewer resources to education. All
of these factors are believed to be directly related to the low education levels of parents. While the
correlations between parents’ education levels, the home environment, and ultimately child out-
comes are strong, endogeneity makes it difficult for researchers to establish causal links. [Thomas
et al., 1996]. However, for policymakers who face a generation of parents with already low levels
of education, perhaps the more important question is: if the household environment is indeed an
important factor in the child’s education, can policies targeted toward parents help promote a better
home learning environment?
With the aim of influencing the home environment, some policymakers have proposed launch-
ing adult education campaigns, and this movement has been gaining momentum. In India, the
National Literacy Mission was launched in 1988 “to impart functional literacy to non-literates in
the age group of 15-35 years in a time-bound manner” (Government of India, 2009). In 2009, the
Prime Minister of India launched Saakshar Bharat, the revised version of the National Literacy
Mission, aiming to achieve an “80 percent literacy rate and reduc[e] the gender gap in literacy to
10 percent” by 2012 (UNESCO, 2012). Many other countries and donors are investing in such pro-
grams, in part because they could promote children’s schooling (DFID, 2008). Unfortunately, the
2

evidence of the effectiveness of such programs on child learning is sparse, especially in contexts
where parents have little-to-no formal education.
This study is designed to evaluate whether child learning can be improved through interventions
focused on improving the human capital of the mother herself, and/or by interventions that work
with the mother but are focused on enhancing at-home learning for the child. We present the
results of a randomized evaluation of three interventions in rural India designed by Pratham, an
education NGO in India1, to improve child learning through increased mother literacy and direct
encouragement of learning at home. We test for these effects by randomly assigning villages to
one of four groups. In the first group, mothers in the village are offered the mother literacy (ML)
intervention: daily literacy and math classes. In the second, mothers are given the Child Home
Activities and Materials Packet (CHAMP) intervention: materials, activities, and training each
week to promote enhanced involvement in their children’s education at home. In the third, mothers
are offered both the literacy and enhanced home-learning interventions (ML-CHAMP). The fourth
group serves as a control with no intervention. The evaluation was carried out in 480 villages in
the states of Bihar and Rajasthan. In each state, 240 villages were randomly assigned in equal
proportions to the four groups.
We find significant positive impacts of the programs on both mother and child outcomes. For
mothers, the ML program increased learning outcomes by 0.11 standard deviations, CHAMP in-
creased test scores by 0.06 standard deviations, and ML-CHAMP increased test scores by 0.15
standard deviations. We also find significant impacts of each of the 3 programs an aggregate mea-
sure of women’s empowerment outcomes. Turning to the results for children, we find that the
ML, CHAMP, and ML-CHAMP increased child math scores by 0.04, 0.05, and 0.07 standard
deviations, respectively. The only significant impacts on language scores were in the combined
interventions. We find little evidence that the programs affected formal schooling behavior, but
each of the 3 interventions affected the mother’s self-reported participation in child learning and
educational assets in the home. The evidence is therefore consistent with the interventions improv-
1Pratham, is a large, India-wide NGO specializing in child literacy and numeracy. For more information, seehttp://www.pratham.org.
3

ing child learning by changing the home environment, particularly through increased productivity
of the time children spend studying. However, in the cases of ML and ML-CHAMP we cannot
rule out that the interventions affected children directly through child attendance in the classes.
This study makes two main contributions to the literature. First, by evaluating interventions
targeted at parents, our study adds to the literature that asks whether the skills believed to help
parents influence their child’s learning can be acquired as an adult. Such programs fall into three
categories: (1) adult literacy programs, (2) child-participation programs, and (3) “family literacy”
programs which typically bundle the first two, along with other components such as job train-
ing, remedial education for children, etc, in different combinations. Also, these programs are
implemented in different contexts: some in higher-income countries, where parents have had some
personal experience with a formal education system and varying levels of literacy, and developing
countries where there is much less exposure, and literacy levels are far lower. We focus our litera-
ture review on research in developing countries, as parents in poor countries are much less likely to
have a substantial experience with formal education and therefore are likely to respond differently
to these programs. However, we do highlight particularly relevant studies from higher-income
countries.
Several evaluations attempt to establish the impact of developing-country adult literacy pro-
grams on adults and children, although much of the research suffers from methodological limi-
tations. Some studies find significant impacts of adult literacy programs on adult learning using
ex-post comparison with non-participants (Carron, 1990; Ortega and Rodriguez, 2008). Aker et
al. (2011) conduct a randomized evaluation of a program that provided cell phones to participants
in existing adult education classes in Niger and find significant impacts of the cell phone program
on math and literacy scores. However, there is no evaluation of the adult literacy program, per
se. Research on the effects of adult literacy programs on children’s outcomes is sparse, and these
studies also rely on retrospective selection of a comparison group (Aoki, 2005; Abadzi, 2003). 2
There are few existing studies evaluating developing-country participation programs that en-
2Although there are numerous evaluations of adult literacy programs in the U.S., much of the research also suffersfrom methodological limitations (Beder, 1999) .
4

courage parents to be more involved in their children’s schooling. Bekman (1998) evaluates a
Turkish program that trained mothers to help educate their children at home. Using a matching
procedure to construct a comparison group, the study finds large effects of the program on child
learning. In the developed country context, a randomized evaluation of a program in France to
enhance parental involvement in the education of their adolescent children found significant posi-
tive effects on parental and student participation, student attitudes, and students’ grades in school
(Avvisati et al., 2011).
In the family literacy movement, we only know of one randomized evaluation, which is in the
developed-country context.: St. Pierre et al. (1993) evaluate the National Even Start Program in
the U.S. They find no statistically significant effects on child learning, performance, or parental
help with studies. However, sample size was small and takeup was low.
Our study adds to the prior literature by providing the first randomized evaluation (of which we
are aware) of 1) an adult literacy program, 2) a participation program, and 3) a combined “family
literacy” program, in a developing country. We also examine impacts on both adult and child
outcomes, a feature that is relatively rare in prior literature.
Second, our study adds to the broader literature exploring the relationship between parental
education and child outcomes. A number of studies provide causal evidence on this relationship
(e.g., Rosenzweig and Wolpin, 1994; Oreopoulos et al., 2006), although rigorous evidence on
the mechanisms through which this occurs is more scarce. Several studies suggest that the home
learning environment is indeed a key factor in this relationship. Using data from Pakistan, Andrabi
et al. (2009)instrument for mother’s schooling with the availability of girls’ schools in the mother’s
birth village and find that children study more hours at home and perform better if their mother
had some education.3 Using data from the Green revolution, where women’s schooling did not
enhance their opportunities outside the household, Behrman et al. (1999) rule out that bargaining
power and matching of parental preferences cause the relationship between women’s schooling
3Indeed, the context is one where returns to schooling on the labour market for women are nonexistent, ruling outincreased female earnings as a possible channel of bargaining power. The authors also find no relationship betweenwomen’s education and educational decisions taken in the household.
5

and children’s learning outcomes, suggesting that it is productivity—women’s ability to teach their
children—that is causing it.
Our study, by creating exogenous changes to the home environment, provides further evidence
of the channels through which learning is affected at home. As with some of the prior literature,
our analysis relies on intermediate outcomes that are not themselves exogenously influenced. We
determine which channels are most plausible in our context by examining which intermediate
outcomes were influenced by the programs. Further, we cannot rule out the possibility that children
benefited directly from mother literacy intervention by accompanying their mothers during class
time.
Our paper is structured as follows. Section 2 discusses the programs and context. Section 3
outlines a conceptual framework for the effects of the programs on child learning. 4 covers the
study design, data collected and analysis. Section 5 describes the results for mothers and 6, the
results for children. We conclude in Section 7.
2 Program Description
The interventions were conducted in two blocks (district subdivisions) of the Purnia district in
Bihar and two blocks of the Ajmer district in Rajasthan. Bihar and Rajasthan were selected by
Pratham based on the low literacy levels of the two states. According to the latest census, these
states have the lowest female literacy rates in India at roughly 53% each (Census of India, 2011).
The intervention districts within each state were selected because of existing Pratham programs
and infrastructure in those areas. Within the intervention districts, the blocks were selected because
they did not have any pre-existing Pratham programs.
Children’s education outcomes are similar between the two states. For example, 48% of rural
children in grades 3 to 5 can read at a grade 1 level in both states, just below the national average of
54% (ASER Centre, 2013). On the other hand, Bihar is a much poorer state. Bihar has the lowest
GDP per capita of any state in the country, and while Rajasthan is below the national average, its
6

per capita GDP is double that of Bihar (Central Statistics Office, 2013). Similarly, in Rajasthan
67% of households have electricity, about the national average, while Bihar ranks last among
Indian states, with only 16% of households having electricity (Census of India, 2011).
Households in our sample broadly follow these patterns. Appendix Table 1 displays the dif-
ferences in baseline demographic variables between the two states. Households in the Rajasthan
sample have more assets and are more likely to be electrified, but child learning levels are only
slightly higher than households in the Bihar sample. Women in the Rajasthan sample spend more
time working (46 hours per week compared to 26), while women in the Bihar sample spend more
time per week reading to their children or helping with homework (2.4 hours per week compared
with 1.4). The average education level for a woman in our sample is under 1 year for Rajasthan and
Bihar, and both have similar scores on our baseline test, with Rajasthan mothers scoring slightly
higher in math.
Running the interventions in multiple sates in different areas of the country aids external va-
lidity of the evaluation. Although the interventions were identical in both states, they were imple-
mented by different local teams and supervised by separate state-level Pratham leadership. And
while learning levels in both states were similar, the differences in wealth and preexisting activities
of the mothers presented distinct implementation challenges in each area.4
In each state, 240 hamlets were selected for the randomization. Hamlets were selected based
on a target number of households (the approximate size that could support one mother literacy
class) and geographic distance from other target locations to limit spillovers. In Rajasthan, where
villages are typically far apart, one appropriately-sized hamlet per village was selected, and the
randomization was effectively conducted at the village level. In Bihar, where hamlets may be
close to one another (whether in the same village or in different villages), hamlets of the target size
were included if they were sufficiently far from other included hamlets. 5 For ease of exposition,
we refer to the randomization unit as a “village” throughout.
In each state, 60 villages were randomly assigned to each of the four treatment groups. Ran-
4In Appendix B we explore heterogeneity in the program effects on mother and child learning by state.5Appendix A details the location selection procedure within the study blocks.
7
domization was stratified geographically to allow Pratham to organize its monitoring structure
based on a known number of program villages in each area. The 240 villages in each state were
first divided into geographically proximate groups of 20 villages. These groups of villages were
further divided into 2 “phases”. These phases determined the order of the rollout of the programs.
The Pratham team rolled out the interventions in Phase 1 villages and began in Phase 2 villages
approximately 3 weeks later. The randomization was stratified by the resulting 24 groups of 10
villages in each state, subject to integer constraints.
Three interventions were designed and implemented by Pratham in each location. Each was
implemented for approximately one year. Recruitment of mothers for each program was targeted
towards a set of women in each village with children aged 5 to 8. These mothers were targeted
in order to maximize precision of estimated effects on children just beginning formal education.
It was hypothesized that the programs would have the greatest effects on children that were just
beginning to develop the most basic reading and math skills. Within each village in the sample, a
census was conducted to determine a list of target mothers. Twenty-two mothers of children aged
5 to 8 years old were randomly selected to be targeted. If there were fewer than 22 such mothers
in the village, all mothers were targeted.
The Mother Literacy (ML) intervention consisted of daily literacy classes held in the villages.
In each location, a volunteer was recruited from the community to teach classes for two hours
per day at the time and place that was most convenient to interested women. Volunteers utilized a
version of Pratham’s Read India methodology. This approach, shown effective in teaching children
to read Banerjee et al. [2010], was modified to suit the interests of adults. While ML classes were
open to any who wished to attend, volunteers were given a list of target mothers to recruit into the
classes.
The Child and Mother Activities Packet (CHAMP) intervention was designed to engage the
mothers at home with their children’s learning. Once per week, a Pratham staff member visited
each target mother and gave her a worksheet to help her child complete. Mothers were also given
instruction on how to review her child’s school notebooks, discuss child learning with her child’s
8

school teacher, and encourage the child to do schoolwork at home.
The combined intervention (ML-CHAMP) included both the ML and CHAMP interventions.
The combined intervention was not integrated—both interventions were simply conducted in the
same villages with the same target group of mothers.
3 Conceptual Framework
3.1 Conceptual Framework
In theory, the amount children learn at home is a function of the time they spend on educational
activities and the productivity of that time spent. The factors that contribute to both time and
productivity are quite similar: child preferences, the educational inputs or assets available, time
parents spend monitoring educational activities and/or directly instructing, and the productivity of
the time parents spend. In other words, children will likely spend more time learning and be more
productive learners when their parents dedicate resources and (productive) time to their education.
The amount of resources and time that parents spend on child learning, and the productivity of
those inputs, can in turn be influenced by a number of factors. We identify three key factors relevant
to our context. First, parents’ expectations and aspirations can directly influence child motivation,
parents’ own time allocation, and the amount of resources they dedicate to educational assets in
the home. Second, if mothers have a relative preference for educational outcomes, their own
empowerment may serve as a key intermediate step in procuring educational assets, or allocating
their time accordingly. Third, parents’ own human capital and experience with the process of
learning influence the productivity of the time and inputs they provide. This last set of factors may
also influence their preferences, as well as relative empowerment.
9

3.2 Theory of Change
One driving assumption behind ML and CHAMP is that mothers have a preference to help their
children learn, but lack the skills and/or experience to do so, and therefore do not dedicate as
much (productive) time or resources. By design, ML was intended to directly influence the human
capital of mothers. Classes focused on basic literacy and numeracy skills. Through an increase in
these skills, the productivity of time and inputs that mothers provide to their children will increase.
CHAMP was intended to increase mothers’ experience with the process of learning, time spent,
and assets available in the home, but not human capital nor preferences directly. Parents were
given materials and guidance on how to interact with their kids at home to foster child learning.
Again, this increase in experience is intended to increase the inputs and productivity of inputs that
mothers provide.
However, these interventions could influence the other factors as well. ML classes teach moth-
ers how to read, write and do simple arithmetic, influencing their human capital, but these classes
also give mothers experience in the process of learning as adults. While different from child learn-
ing (e.g. it doesn’t involve the formal education system), mothers may still be able to translate their
own experience of learning into an understanding of how children learn. By providing confidence
and skills to make decisions within the household, or by creating or strengthening social networks
through class attendance, ML could promote a sense of empowerment. Finally, if children attend
the ML classes (along with, or in place of mothers), it could influence children’s own motivation,
the time they spend on educational activities, and the productivity of that time.
CHAMP interactions teach mothers the process of how children learn, endowing them with
experience. While not directly giving instruction on how to read, write or do math, the interac-
tion—both with Pratham staff and/or with their own children—may result in mothers learning,
improving their human capital directly. As with ML, CHAMP classes could give mothers the con-
fidence and skills to make household decisions related to education. Finally, CHAMP could affect
child learning directly: if children are present when material and activities are being demonstrated,
this could impact their productivity, time and preferences, independent from interacting with their
10

mother.
4 Data collection
Baseline data was collected from selected households at the onset of the interventions, and endline
data was collected after approximately one year. Data collection consisted of standardized tests
and household surveys.
The standardized tests, designed to evaluate a basic set of Hindi and math skills, were developed
by the ASER Centre, Pratham’s research arm and were an expanded version of the ASER Centre’s
standard assessment tool used each year in their Annual Status of Education Report.6 At the
baseline, the tests were administered to all eligible mothers, target children, other children in the
household in grades 1 to 4, and children aged 4 and below who were going to be enrolled in
school in the next year. The endline testing included all mothers and children tested at baseline, in
addition to the remaining children who were aged 3 or 4 at the baseline. These tests were scored
on a 20-point scale for children in both the baseline and endline, a 24-point scale for mothers at
baseline, and a 28-point scale for mothers at endline. The mother test was the same as the child test,
but included several additional questions that related to the material taught in the mother literacy
classes. Minor additions and deletions were made in the testing instruments between baseline and
endline. For the purposes of the analysis, test scores were normalized based on the control group
means and standard deviations in each round of testing, separately for mothers and children.
In addition to the primary standardized testing instruments, at the baseline other household
members were given very short tests designed to quickly assess whether they could read simple
sentences and do basic subtraction.
The household surveys were administered to eligible mothers. The baseline contained modules
on basic household demographics, asset ownership, schooling status of children in the household,
mother perceptions of education, and mother’s time use. In addition, questions were asked about
6The ASER tool is used in the ASER Centre’s national assessments of child learning and is administered to ap-proximately 450,000 children annually (ASER Centre, 2013).
11

the time use of the child aged 5-8 in the household (in the cases where there was more than one
such child, one was randomly selected). The endline survey repeated the measures of the baseline
survey, with the exception of demographics, and included additional questions on empowerment.
Table 1 contains descriptive statistics from the baseline tests and surveys and compares the
means of the variables between each treatment group and the control group. Out of 60 comparisons
performed, 6 are significant at the 10% level, and 3 are significant at the 5% level. No variable
is jointly significantly different at the 10% level between the 3 treatment groups and the control
group (not shown). On the whole, this suggests that the randomization was successful in creating
comparable groups.
Appendix Table 2 details weighting procedure and the weighted test scores for each question
on the test. The average baseline mother scores on the test were 3.0/10 for reading and 3.1/14
for math. Mothers scored the highest on the most basic competencies on the test, such as picture
recognition, letter recognition, writing one’s own name, and number recognition. Child scores
averaged 2.9/10 in reading, and 2.9/10 in math. As with mothers, children scored the highest on
the most basic competencies.
Out of 8857 mothers tested at baseline, 8552 (97%) were re-tested for the endline. Child tests
are available for 14,575 out of 15,502 (94%) of children tested at the baseline.
5 Results - Mothers
5.1 Estimating Equation
Throughout the analysis we utilize the following estimating equation:
Y 1iv = β0 +β1MLv +β2CHAMPv +β3MLCHAMP+β4Y0ihv +δGv + εiv (1)
In this equation, Yihv is the outcome for individual i, in household h, in village v. ML, CHAMP,
and MLCHAMP are dummies indicating the treatment status of the village. Y01 is the baseline
12

value of the outcome of interest (when measured). G is a dummy for stratum, as described in
Section 2 above. εiv is the individual error term, clustered by village, the level of randomization.
5.2 Program Takeup
Takeup of the mother literacy classes is analyzed in Table 2. Compared with the control group,
approximately 32% more mothers in the ML treatment and 37% in the ML-CHAMP treatment
reported ever having attended the classes.7Children attended the classes as well. Children were
21% more likely to ever attend in the ML treatment, and 27% more likely to ever attend in the
ML-CHAMP treatment, compared with the control group.
We assume 100% takeup of the CHAMP activities. This was a door-to-door intervention where
Pratham staff visited each mother in her household.
5.3 Test Scores
Turning to the results on mother learning, Table 3 presents the effect of the treatment groups on
mothers’ normalized test scores. All three programs had statistically significant impacts on literacy,
math and combined test scores. The Mother Literacy program improved mother test scores by 0.09
standard deviations in Hindi and 0.12 standard deviations in math, and 0.11 standard deviations
overall. The last column in the table presents instrumental variables estimates of the effects of
takeup of the program on learning, instrumenting takeup with assignment to the ML treatment.
To account for spillovers within households, “takeup” is defined as either the mother or the child
attending a class at least once. Using this method, the effect of takeup is 0.33 standard deviations
overall.8
7It is important to note that 7 percent of mothers in the control group attended classes. This is due to a governmentprogram “Saakshar Bharat” that was conducted in the spring of 2012 in Bihar. Research staff monitored this programcarefully. Where they were set up, classes were held for approximately one week, and were not differentially held intreatment or control villages.
8Note that the exclusion restriction in the IV estimation assumes that the mother literacy classes influenced learningonly through attendance in the classes. This assumption would be violated, if, for example, mother learning wasinfluenced by the attendance of other members in the community.
13

The CHAMP program improved mother test scores as well. Test scores improved by 0.04 stan-
dard deviations in Hindi, 0.07 standard deviations in math, and 0.06 standard deviations overall.
The effect of the combined intervention on total test scores was 0.15 standard deviations. While
this is slightly lower than the sum of the effects of the ML and CHAMP interventions, we cannot
reject that the ML-CHAMP effect equals the sum of the effects of the two individual interventions
(p-value = 0.338).
Appendix Tables 3 and 4 display the treatment effects on each question of the test for language
and math, respectively. For comparability across questions, the maximum score for each question
is re-scaled to 1. On the language portion of the test, ML and ML-CHAMP interventions had the
largest effects on more basic skills such as reading letters, reading simple words, and writing the
mother’s name. For example, mothers in the ML group were 3.5 percentage points more likely to
be able to read letters, while mothers in the ML-CHAMP group were 4.7 percentage points more
likely to read letters, compared with the endline control group mean of 17.3%. The point estimates
for CHAMP, on the other hand, were modest and positive (about 0.5 to 1.5 percentage points) on
most questions, although most of the estimated effects are not statistically significant.
On the math portion of the test, all three interventions had the strongest effects on the number
recognition questions, the most basic skills tested. For example, the mothers’ ability to identify
digits 1-9 was 7, 3 and 11 percentage points higher in ML, CHAMP, and ML-CHAMP, respec-
tively, compared to the control group mean of 47%. Interestingly, all three interventions also had
statistically significant effects on the mother’s ability to complete the division word problem in
addition to the more basic math skills. This suggests that either classes attracted some relatively
more numerate mothers, or that the programs were particularly effective in “mental math” (i.e.
solving word problems) in addition to the more basic skills.
5.4 Intermediate Outcomes
The programs could have affected mother learning through a variety of channels. In addition to the
more direct effects that mother literacy and child participation could have had on mother learning,
14

there are a number of indirect channels. Section 6 analyzes changes in the home environment,
including education assets at home and mothers’ involvement in child learning. We find that the
programs did increase both assets and mothers’ involvement in child learning, both of which could
have had feedbacks to mother learning.
We also find evidence that the programs induced others in the households to help the mothers
learn. Table 4 analyzes whether the mother reported learning various skills from family members.
We find that significantly more mothers in the ML and ML-CHAMP treatments reported learning
any of the skills from family members, from 21% in the control group to 26% in ML and ML-
CHAMP. For the CHAMP interventions, we find smaller coefficients, and the coefficients are
significant only for learning about counting and counting change.
5.5 Empowerment and Time Use
This subsection examines the effects of the programs on women’s empowerment and time use.
These indicators are both potential channels through which the program could have affected mother
and child learning, as well as important outcomes in and of themselves.
We first turn to the effects of the programs on women’s empowerment. We include 19 variables
from the survey instrument reflecting a number of underlying aspects of empowerment. First, we
include a set of variables reflecting the mother’s ability to make decisions and carry out tasks
on her own. Second, we include a set of variables indicating whether the mother is involved in
certain household decisions. Third, we include a set of variables reflecting beliefs about own and
daughters’ education. Finally, we include a measure of happiness.
Using these variables, we construct an index of empowerment using the methodology pio-
neered by Kling et al (2007). Each variable is normalized by subtracting the control group mean
and dividing the result by the control group standard deviations. The resulting normalized vari-
ables are then averaged to create the index. We construct separate indices for both the baseline
and endline. The baseline index contains fewer elements than the endline index, as additional
empowerment questions were added to the endline questionnaire.
15

Table 5 presents the program effects on the index and its components. Using our index, we
find positive and statistically significant impacts of each of the three treatments on empowerment.
The estimated effects of the ML and CHAMP programs were both 0.04 standard deviations, both
significant at the 5% level. Turning to the components of the index, both the ML and CHAMP
interventions had significant impacts on whether the mother counts change, beliefs about adult
daughter’s choices, and beliefs that the mother should be responsible for her children’s education.
The ML intervention also had impacts on several variables more directly related to mother literacy
and math (the mother signing her name, considering herself literate, the value of goods she could
buy), and beliefs about a wife’s level of education relative to her husband. The CHAMP inter-
vention had a significant impact on leaving the village without adult accompaniment and a small
negative impact on self-help group membership.
We next turn to the effects of the programs on women’s time use. Andrabi et al. (2012) find
that women with more education spend more time with their children. In Table 6, we examine
whether the ML, CHAMP and combined programs affect mother time use in this manner. Across
all measures, we see little evidence that the programs impacted time use. The combined interven-
tions increased weekly hours spent on paid work by 1 hour per week (significant at the 10% level),
and livestock work by 0.5 hours per week (significant at the 5% level). While it is plausible that
the programs increased labor supply either through productivity or through empowerment, more
work is needed to explore the mechanisms through which the programs can have these effects.
6 Results - Children
6.1 Test Scores
Table 7 presents the effects of the treatment groups on child test scores. All children tested at
the endline are included in this table, including the younger children not tested at baseline. The
regressions include a dummy variable for missing values of the baseline test scores.
All three interventions had significant impacts on math skills: the effect size is 0.04 standard
16

deviations for ML, 0.05 standard deviations for CHAMP, and 0.07 standard deviations for ML-
CHAMP. The effects of ML and CHAMP on literacy and cumulative scores are not statistically
different from zero. However, ML-CHAMP had statistically significant effects on literacy (0.05
standard deviations), and cumulative scores (0.06 standard deviations).
The last column of Table 7 follows the mother test score results in Table 3 by presenting in-
strumental variables estimates of the effect of a mother or child attending the ML classes on child
learning. The IV estimate of the effect of attendance is 0.11 standard deviations for math and is
significant at the 5% level. Because the reduced-form estimates are not significant for literacy or
cumulative test scores, it is not surprising that the IV estimates are not significant at conventional
levels.
Appendix Tables 5 and 6 disaggregate the test score effects by individual question. As with
the mother results, we re-scale the questions so that the maximum possible score for each is 1.
The results for language are displayed in Appendix Table 5. The ML intervention did not have
a statistically significant impact on any competency, and the estimated magnitudes are very small
and inconsistently signed. For the CHAMP intervention, the magnitudes of the coefficients on
each question is positive, but none reaches statistical significance. The ML-CHAMP intervention
had positive and statistically significant impacts on the child’s ability to read letters, matra (more
complex) words, and paragraphs.
Appendix Table 6 displays question-wise results for math. Across all three interventions, the
largest effects are concentrated in the more basic number recognition questions. For example,
child scores were 2.3, 4.0 and 3.9 percentage points higher on the question that asked the child to
identify the digits 1 to 9, compared with the endline control group mean of 56.0 percent.
6.2 Intermediate Outcomes
This section analyzes impacts of the treatment groups on intermediate outcomes. We start by dis-
cussing outcomes that relate to learning outside of the home. Table 8 presents the impacts of the
programs on school participation. We find no evidence that the individual programs affected cur-
17

rent enrollment, regular attendance or recent absences. We do find that the ML program resulted
in a small decrease in parents reporting that their children would be enrolled in the coming school
year. However, the magnitude is almost identical to the positive (but statistically insignificant)
estimated impact on current enrollment, suggesting that the ML program may have resulted in
children enrolling at earlier ages. We also find a small positive impact on school attendance of the
combined program. Finally, we find a statistically significant increase in monthly tuition expen-
ditures for the ML group, but the effects are smaller and statistically insignificant in the ML and
ML-CHAMP groups. On balance, this table shows limited, if any, impacts of the interventions on
schooling outcomes.
We next turn to a set of indicators of the mother’s participation in the child’s schooling. We
include 9 measures of mother involvement, including indicators of school visits, helping with
homework, and talking to the child and others about the child’s studies. We construct an index of
mother involvement using the 9 measures, following the procedure outlined above. These survey
questions were asked about the selected child, and hence the sample size is equal to the sample of
mothers.
Table 9 presents the results on mother involvement. We find positive and statistically signifi-
cant impacts of all three programs on the index of indicators. The magnitudes are approximately
0.04 for ML, 0.07 for CHAMP and 0.05 for ML-CHAMP. While both ML and CHAMP had sta-
tistically significant impacts on the mother looking at the child’s notebook, talking to the child
about studies and talking to others about the child’s studies, CHAMP had impacts on the mother
knowing whether the child received homework and on helping her child with homework.
We next examine impacts on child time use. Table 10 presents the estimated impacts of the
program on the child’s weekly time use. Overall, there were very few impacts. The combined
ML-CHAMP intervention increased time spent on homework by 0.3 hours per week, statistically
significant at the 5% level. While the effects of the individual interventions fail to reach statistical
significance at the 5% level, the magnitude of the CHAMP effect is 0.2 hours per week, significant
at the 10% level, suggesting that the ML-CHAMP effect could be driven primarily by CHAMP.
18

The ML and ML-CHAMP interventions also have significant impacts on time spent in household
business, mirroring the results for mothers. As with mother time use results, more work is needed
to understand the impacts of the programs on work behavior.
Table 11 presents the treatment effects on the presence of education assets in the home. For
the ML intervention, the only statistically significant effect is on the presence of schoolbooks, with
an estimated magnitude of 0.018. The CHAMP intervention, on the other hand, had a statistically
significant effect on the presence of pencils, school books, other books, and newspapers/magazines.
The combined intervention increased the presence of school books, other books, and slates. (Note
that pencils are present in 95% of comparison group households, so minimal of movement on this
indicator is unsurprising.)
Finally, in Table 12 we turn to a set of indicators that reflect mother aspirations for their children
and perceptions of child reading ability. We do not find statistically significant impacts of any of
the interventions on the highest grade that the mother aspires her child to pass. We do find that
the CHAMP and combined interventions increased mother perceptions of her child’s reading and
math ability. When compared to the child’s actual ability, however, the CHAMP and combined
programs caused mothers to be overly optimistic: the absolute difference between the mother’s
perception and measured child ability increased for the CHAMP and combined interventions.
7 Conclusion
Adult literacy and participation programs are increasing in popularity, frequency, funding and in-
fluence—particularly in developing countries. Proponents and policymakers draw an explicit link
between the education of parents and child welfare outcomes when advocating for such programs.
The underpinning theory starts with the observation that parent levels of education are strongly cor-
related with child outcomes, and draws on further evidence that the relationship is causal (rather
than due to other factors such as inherent ability, or cultural preferences, which could lead to both
outcomes independently). Educating parents in adulthood, the theory goes, will shift preferences
19

toward demanding more quantity of education and of higher quality, household resources toward
more educational assets at home, time allocation toward more time educating their children at
home, and increased productivity of that time. However, there is very little rigorous evidence on
whether these programs are actually effective in the developing country context.
We show that an adult literacy and a participation program targeting mothers in rural India were
effective at “educating parents”—improving mothers’ basic literacy and numeracy skills. These
programs also had an impact on measures of women’s empowerment, educational assets in the
home, and the participation of mothers in child learning. Lastly, they improved learning levels of
younger school-aged children. Literacy classes were more effective at educating the mothers than
the participation program, while the participation program was most effective at improving child
learning outcomes. The results on learning (for mothers and children) were highest when the two
interventions were combined, suggesting that the two interventions are at least additive, and not
substitutes.
We find that the programs influenced a number of intermediate outcomes that could in turn
have affected child learning. However, we cannot isolate the most important of these factors in the
effectiveness of the programs. Understanding the importance of the each mechanism is a key area
for future research. Nonetheless, our evaluation shows that literacy and participation programs can
impact both mother and child learning. This is encouraging evidence for policymakers looking to
improve adult and child learning, as well as the education environment in the home.
20

ReferencesAdult literacy: An update. Department for International Development Briefing August 2008, Au-
gust 2008.
Helen Abadzi. Adult literacy: A review of implementation experience. The World Bank OperationsEvaluation Department, 2003.
Jenny C. Aker, Christopher Ksoll, and Travis J. Lybbert. Can mobile phones improve learning?evidence from a field experiment in niger.
Tahir Andrabi, Asim Ijaz Khwaja, and Jishnu Das. What did you do all day? Maternal educationand child outcomes. World Bank Policy Research Working Paper No. 5143, 2009.
Tahir Andrabi, Jishnu Das, and Asim. What did you do all day?: Maternal education and childoutcomes. Journal of Human Resources, 47:873–912, 2012.
Aya Aoki. Assessing learning achievements and development impact: Ghana’s national functionalliteracy program. Australian Journal of Adult Learning, 45, November 2005.
Francesco Avvisati, Marc Gurgand, Nina Guyon, and Eric Maurin. Getting parents involved: Afield experiment in deprived schools.
Abhijit V. Banerjee, Rukmini Banerji, Esther Duflo, Rachel Glennerster, and Stuti Khemani. Pit-falls of participatory programs: Evidence from a randomized evaluation in education in india.American Economic Journal: Economic Policy, 2(1):1–30, 2010.
Hal Beder. The outcomes and impacts of adult literacy education in the United States. NationalCenter for th eStudy of Adult Learnign and Literacy Report 6, (6), 1999.
Jere Behrman, Andrew Foster, Mark Rosenzweig, and Prem Vashishtha. Women’s schooling,home teaching, and economic growth. The Journal of Political Economy, 107(4):682–714, 1999.ISSN 00223808.
Sevda Bekman. A fair chance. an evaluation of the mother-child program. Mother-Child EducationFoundation Publication 13, 1998.
G. Carron. The functioning and effects of the kenya literacy program. African Studies Review, 33(3):97–120, 1990. ISSN 00020206.
Central Statistics Office of India. Statement: Per capital net state domestic product at constant(2004-2005) prices. Technical report, Central Statistics Office, 2013. URL http://mospi.
nic.in/Mospi_New/upload/Item_12_SDP-2004-05.xls.
ASER Centre. Annual status of education report (rural) 2012. 2013.
Jeffrey R. Kling, Jeffrey B. Liebman, and Lawrence F. Katz. Experimental analysis of neighbor-hood effects. Econometrica, 75 (1):83–119, 2007.
21

India Office of the Registrar General & Census Commissioner. Provisional population totals paper1 of 2011 india. Technical report, 2011.
Philip Oreopoulos, Marianne Page, and Ann Huff Stevens. The intergenerational effects of com-pulsory schooling. Journal of Labor Economics, 24, 2006.
Daniel Ortega and Francisco Rodriguez. Freed from illiteracy? a closer look at venezuelaÿs misionrobinson literacy campaign. Economic Development and Cultural Change, 57(1):1–30, 2008.
Mark R. Rosenzweig and Kenneth I. Wolpin. Are there increasing returns to the intergenerationalproduction of human capital? maternal schooling and child intellectual achievement. The Jour-nal of Human Resources, 29, 1994.
Robert St.Pierre, Janet Swartz, Stephen Murray, Dennis Deck, and Phil Nickel. National evalu-ation of the Even Start Family Literacy Program: Report on effectiveness. US Department ofEducation - Office of Policy and Planning, October 1993.
The World Bank Group. World development indicators, education statistics. Technical report, TheWorld Bank Group, 2013.
Duncan Thomas, Robert F. Schoeni, and John Strauss. Parental investments in schooling: Theroles of gender and resources in urban brazil. Labor and Population Program, Working PaperSeries, 96-02, 1996.
22

Table 1: Randomization Check
Mean Relative to ControlControl ML CHAMP ML-CHAMP N
(1) (2) (3) (4) (5)AssetsFirst Pincipal Component of Durables Ownership -0.0328 0.00923 0.0924 0.0282 8888
[2.261] [0.0866] [0.0952] [0.0906]
Main Income Source of HouseholdFarming 0.431 0.0251 0.00974 0.0414* 8819
[0.495] [0.0230] [0.0250] [0.0226]
Wages 0.431 -0.0121 -0.0149 -0.0370* 8819[0.495] [0.0215] [0.0226] [0.0216]
Other 0.447 -0.0129 0.00521 -0.00445 8819[0.497] [0.0133] [0.0143] [0.0131]
Number of Household MembersTarget-Aged Children (5 yrs to 8 yrs) 1.453 -0.0351* -0.0293 -0.0158 8888
[0.612] [0.0184] [0.0199] [0.0179]
Other Primary-Aged Chilred (4 yrs and 9 yrs) 1 0.0475 0.0217 0.0467* 8888[0.960] [0.0298] [0.0307] [0.0275]
Younger Children (Less than 4 yrs) 0.942 -0.0161 0.0115 0.0639** 8888[0.909] [0.0299] [0.0335] [0.0303]
Older Children (More than 9 yrs) 3.269 0.00905 0.114* 0.0932 8888[1.751] [0.0632] [0.0687] [0.0634]
Mother Test ScoresMother- Literacy 2.993 0.0442 0.134 0.0548 8857
[2.474] [0.110] [0.131] [0.115]
Mother- Numeracy 3.022 0.0885 0.147 0.0822 8857[3.376] [0.153] [0.181] [0.160]
Mother- Composite 6.015 0.133 0.281 0.137 8857[5.616] [0.259] [0.307] [0.271]
Children's Test ScoresChildren- Literacy 2.803 0.0603 0.0730 0.0824 15502
[2.370] [0.0883] [0.0908] [0.0876]
Children- Numeracy 2.770 0.114 0.131 0.0857 15502[3.032] [0.111] [0.117] [0.109]
Children- Composite 5.573 0.175 0.204 0.168 15502[5.233] [0.195] [0.204] [0.192]
Other Members' Reading/MathOther Members- Can Read? 0.380 -0.00151 0.0274 0.0163 13891
[0.485] [0.0162] [0.0178] [0.0175]
Other Members- Can Do Math? 0.249 0.00460 0.0249 0.0233 13891[0.433] [0.0146] [0.0170] [0.0147]
Parent EducationMother Education Level 0.764 0.0475 0.152 0.0694 8864
[2.282] [0.102] [0.118] [0.103]
Father Education Level 3.876 -0.150 0.133 0.234 8181[4.438] [0.203] [0.226] [0.213]
Mother Has Past Experience with Literacy Classes 0.117 -0.00839 -0.00825 -0.0209* 8635[0.321] [0.0123] [0.0130] [0.0124]
Child GenderChild Is Male 0.521 -0.0133 -0.00804 -0.0214** 15500
[0.500] [0.0108] [0.0110] [0.0106]Notes:Columns 2, 3 and 4 display the differences in means between each treatment group and thecontrol group.Standard errors are clustered at the village level.* denotes significance at 0.10; ** at 0.05; *** at 0.01
23

Table 2: Takeup of Mother Literacy Classes
MeanControl ML CHAMP ML-CHAMP N
(1) (2) (3) (4) (5)
Knew about ML classes 0.218 0.402*** -0.00558 0.451*** 8581[0.413] [0.0226] [0.0199] [0.0217]
Mother attended ML classes 0.0710 0.321*** -0.00101 0.368*** 8581[0.257] [0.0184] [0.0128] [0.0177]
Child attended with mother 0.0509 0.211*** -0.0105 0.271*** 8581[0.220] [0.0149] [0.00961] [0.0163]
Child attended alone 0.0252 0.161*** 0.0000870 0.218*** 8581[0.157] [0.0126] [0.00727] [0.0133]
Notes:Columns 2, 3 and 4 display estimated coefficients of a regression of the outcomein each row on treatment group dummies, controlling for stratification unit dummies.Standard errors are clustered at the village level.* denotes significance at 0.10; ** at 0.05; *** at 0.01
OLS: Impact of treatment in endline
24

Bas
elin
e M
ean
End
line
Mea
nF
irst
sta
geIV
All
Obs
Con
trol
ML
CH
AM
PM
L-C
HA
MP
NP
-val
ue:
addi
tive
eff
ects
Att
end
lit
clas
sIm
pact
of
lit
clas
s(1
)(2
)(3
)(4
)(5
)(6
)(7
)(8
)(9
)
Lit
erac
y0.
0430
0.11
50.
0913
***
0.04
00**
0.12
6***
8552
0.84
80.
341*
**0.
261*
**[1
.055
][1
.329
][0
.018
5][0
.019
3][0
.018
8][0
.018
9][0
.052
9]
Num
erac
y0.
0616
-0.0
158
0.12
0***
0.06
93**
*0.
159*
**85
520.
226
0.35
3***
[1.0
65]
[1.0
17]
[0.0
167]
[0.0
158]
[0.0
173]
[0.0
493]
Tot
al0.
0560
0.04
140.
111*
**0.
0587
***
0.15
0***
8552
0.38
50.
325*
**[1
.066
][1
.153
][0
.015
1][0
.014
2][0
.015
8][0
.043
9]N
otes
:C
olum
ns 3
, 4 a
nd 5
dis
play
est
imat
ed c
oeff
icie
nts
of a
reg
ress
ion
of th
e ou
tcom
e in
eac
h ro
w o
n tr
eatm
ent g
roup
dum
mie
s, c
ontr
olli
ngfo
r st
rati
fica
tion
uni
t dum
mie
s an
d ba
seli
ne v
alue
s.C
olun
mn
7 di
spla
ys th
e p-
valu
e of
the
test
that
the
coef
fici
ents
ML
+C
HA
MP
=M
L-C
HA
MP
.C
olum
n 8
disp
lays
the
impa
ct o
f as
sign
men
t to
the
mot
her
lite
racy
trea
tmen
t gro
up o
n li
tera
cy c
lass
att
enda
nce
by m
othe
r or
chi
ld.
Col
umn
9 di
spla
ys th
e im
pact
of
litt
erac
y cl
ass
atte
ndan
ce o
n th
e de
pend
ent v
aria
bles
, usi
ng a
ssig
nmen
t to
the
ML
trea
tmen
t gro
up a
san
inst
rum
ent f
or a
tten
danc
e.S
tand
ard
erro
rs a
re c
lust
ered
at t
he v
illa
ge le
vel.
* de
note
s si
gnif
ican
ce a
t 0.1
0; *
* at
0.0
5; *
** a
t 0.0
1
OL
S: I
mpa
ct o
f tr
eatm
ent i
n en
dlin
e
Tab
le 3
: Mot
her
Lea
rnin
g
25

Endline MeanControl ML CHAMP ML-CHAMP N
(1) (2) (3) (4) (5)
Family member taught mother: ANY 0.206 0.0507*** 0.00683 0.0560*** 8581[0.404] [0.0146] [0.0154] [0.0146]
Family member taught mother: to write her name 0.173 0.0414*** -0.00953 0.0502*** 8581[0.378] [0.0131] [0.0135] [0.0130]
Family member taught mother: counting 0.0818 0.0509*** 0.0200* 0.0577*** 8581[0.274] [0.0106] [0.0107] [0.0105]
Family member taught mother: hh accounts 0.0537 0.0230*** 0.0118 0.0285*** 8581[0.226] [0.00825] [0.00826] [0.00828]
Family member taught mother: counting change 0.0514 0.0314*** 0.0194** 0.0295*** 8581[0.221] [0.00820] [0.00860] [0.00956]
Notes:Columns 2, 3 and 4 display estimated coefficients of a regression of the outcome in each row on treatmentgroup dummies, controlling for stratification unit dummies.Standard errors are clustered at the village level.* denotes significance at 0.10; ** at 0.05; *** at 0.01
Table 4: Family Assistance in Mother LearningOLS: Impact of treatment in endline
26

Baseline Mean Endline MeanAll Obs Control ML CHAMP ML-CHAMP N
(1) (2) (3) (4) (5) (6)
Empowerment Index -0.00625 0.000225 0.0409*** 0.0360** 0.0695*** 8539[0.391] [0.378] [0.0143] [0.0147] [0.0148]
Times left village in the past month 1.405 1.146 0.0338 0.0741 0.0977 8581[2.244] [1.672] [0.0607] [0.0627] [0.0661]
Left without adult accompaniment (% of mothers) 0.127 0.114 0.00319 0.0286*** 0.00449 8581[0.333] [0.318] [0.00998] [0.0103] [0.0103]
Left village without permission (% of mothers) 0.0258 0.0168 -0.00426 0.000597 -0.00313 8581[0.159] [0.129] [0.00366] [0.00390] [0.00372]
Signed name on official documents 0.538 0.562 0.0630*** 0.0127 0.0829*** 8581[0.499] [0.496] [0.0140] [0.0134] [0.0138]
Counts change 0.876 0.869 0.0250** 0.0227** 0.0421*** 8581[0.330] [0.337] [0.0117] [0.0114] [0.0112]
Caught mistakes counting change 0.310 0.318 0.0151 -0.00742 0.0269 8581[0.463] [0.466] [0.0172] [0.0169] [0.0174]
Considers self literate 0.235 0.0479*** 0.0165 0.0730*** 8581[0.424] [0.0164] [0.0176] [0.0170]
Value of goods can buy alone 2442.0 130.4 80.68 165.3* 8581[2259.3] [83.58] [91.02] [91.72]
Does not believe husband should be more educated 0.380 0.350 0.0441*** 0.0169 0.0567*** 8581[0.485] [0.477] [0.0163] [0.0174] [0.0170]
Does not believe daughter should be at home or married when 18 0.0539 0.0439 -0.00217 0.00592 0.00308 8581[0.226] [0.205] [0.00631] [0.00649] [0.00648]
Believes daughter should be doing further studies 0.161 0.383 0.0478*** 0.0701*** 0.0954*** 8581/ what they want / paid work outside home [0.368] [0.486] [0.0169] [0.0183] [0.0186]
Would have wanted to study up to: grade level 5.620 -0.432*** 0.183 -0.261 8581[4.434] [0.161] [0.181] [0.159]
Member of self help group (SHG) 0.277 0.330 0.00665 -0.0303* -0.00403 8581[0.447] [0.470] [0.0171] [0.0169] [0.0160]
Happiness 3.101 0.0556 0.0784 0.0558 8581[1.439] [0.0501] [0.0511] [0.0470]
Involved in purchasing: utensils, cot or cycle 0.586 0.0271 0.0118 0.0247 8581[0.493] [0.0181] [0.0180] [0.0194]
Involved in purchasing: educational materials 0.479 0.0209 0.0188 0.0383** 8581[0.500] [0.0183] [0.0179] [0.0183]
Involved in deciding: girl or boy enrollment 0.519 0.0114 0.00638 0.0156 8581[0.500] [0.0173] [0.0173] [0.0175]
Involved in deciding: girl or boy school type 0.522 0.0115 0.00966 0.0287* 8539[0.500] [0.0170] [0.0174] [0.0171]
Mother/ both should be responsible for child's education 0.717 0.0409*** 0.0322** 0.0424*** 8581[0.451] [0.0138] [0.0138] [0.0136]
Notes:Columns 3, 4 and 5 display estimated coefficients of a regression of the outcome in each row on treatment group dummies, controllingfor stratification unit dummies and baseline values (where available).The "empowerment index" is an average of z-scores of the other variables in the table, using the control group means and standard deviations.The baseline empowerment index only includes indicators for which data were collected.Standard errors are clustered at the village level.* denotes significance at 0.10; ** at 0.05; *** at 0.01
OLS: Impact of treatment in endline
Table 5: Empowerment
27

Baseline Mean Endline MeanAll Obs Control ML CHAMP ML-CHAMP N
(1) (2) (3) (4) (5) (6)
Help w/ homework (weekly hrs) 1.686 2.313 0.114 0.126 0.0602 8519[2.903] [2.704] [0.0919] [0.0973] [0.0918]
Read (weekly hrs) 0.201 0.324 -0.0116 -0.0217 0.00582 8399[1.056] [1.332] [0.0397] [0.0365] [0.0422]
Play with child (weekly hrs) 0.255 1.322 0.0720 0.0544 -0.0272 8472[1.309] [3.172] [0.110] [0.116] [0.108]
Share stories (weekly hrs) 0.383 0.515 0.0196 -0.00556 0.0358 8514[1.201] [1.401] [0.0464] [0.0438] [0.0507]
Paid work (weekly hrs) 26.81 31.27 1.022* 0.487 0.975 8547[18.53] [20.93] [0.604] [0.587] [0.610]
Livestock work (weekly hrs) 9.242 9.528 0.171 -0.253 0.505** 8573[7.020] [6.745] [0.246] [0.231] [0.241]
Collect animal feed (weekly hrs) 6.828 0.209 -0.161 0.178 8577[6.601] [0.261] [0.266] [0.274]
Collect wood (weekly hrs) 3.302 0.0804 -0.125 0.00144 8570[4.962] [0.179] [0.193] [0.189]
Housework (weekly hrs) 22.20 18.86 0.365 0.252 0.316 8581[8.844] [7.918] [0.304] [0.301] [0.286]
Buy supplies (weekly hrs) 4.832 1.231 -0.0582 -0.0654 -0.0182 8567[6.188] [2.656] [0.0901] [0.0905] [0.0877]
Look after children (weekly hrs) 5.751 4.640 -0.209** -0.143 0.0737 8581[4.035] [3.695] [0.106] [0.109] [0.104]
Notes:Columns 3, 4 and 5 display estimated coefficients of a regression of the outcome in each row on treatmentgroup dummies, controlling for stratification unit dummies and baseline values (where possible).Standard errors are clustered at the village level.* denotes significance at 0.10; ** at 0.05; *** at 0.01
OLS: Impact of treatment in endline
Table 6: Mother Time Use
28

Bas
elin
e M
ean
End
line
Mea
nF
irst
sta
geIV
All
Obs
Con
trol
ML
CH
AM
PM
L-C
HA
MP
NP
-val
ue: M
L-C
HA
MP
=
ML
+ C
HA
MP
Att
end
lit
clas
sIm
pact
of
lit
clas
s(1
)(2
)(3
)(4
)(5
)(6
)(7
)(8
)(9
)
Lit
erac
y0.
0253
0.13
4-0
.002
290.
0288
0.05
37**
*18
282
0.33
10.
352*
**0.
0005
52[1
.008
][1
.130
][0
.019
2][0
.019
7][0
.018
6][0
.019
9][0
.054
8]
Num
erac
y0.
0306
0.12
70.
0374
**0.
0469
**0.
0685
***
1828
20.
552
0.11
4**
[1.0
14]
[1.0
58]
[0.0
185]
[0.0
189]
[0.0
182]
[0.0
523]
Tot
al0.
0292
0.13
40.
0194
0.03
87**
0.06
32**
*18
282
0.84
10.
0635
[1.0
12]
[1.0
85]
[0.0
176]
[0.0
183]
[0.0
171]
[0.0
499]
Not
es:
Col
umns
3, 4
and
5 d
ispl
ay e
stim
ated
coe
ffic
ient
s of
a r
egre
ssio
n of
the
outc
ome
in e
ach
row
on
trea
tmen
t gro
up d
umm
ies,
con
trol
ling
for
stra
tifi
cati
on u
nit d
umm
ies
and
base
line
val
ues.
Mis
sing
val
ue d
umm
ies
are
incl
uded
for
chi
ldre
n no
t tes
ted
at b
asel
ine.
Col
unm
n 7
disp
lays
the
p-va
lue
of th
e te
st th
at th
e co
effi
cien
ts M
L+
CH
AM
P=
ML
-CH
AM
P.
Col
umn
8 di
spla
ys th
e im
pact
of
assi
gnm
ent t
o th
e m
othe
r li
tera
cy tr
eatm
ent g
roup
on
lite
racy
cla
ss a
tten
danc
e by
mot
her
or c
hild
.C
olum
n 9
disp
lays
the
impa
ct o
f li
tter
acy
clas
s at
tend
ance
on
the
depe
nden
t var
iabl
es, u
sing
ass
ignm
ent t
o th
e M
L tr
eatm
ent g
roup
as
an in
stru
men
t for
att
enda
nce.
Sta
ndar
d er
rors
are
clu
ster
ed a
t the
vil
lage
leve
l.*
deno
tes
sign
ific
ance
at 0
.10;
**
at 0
.05;
***
at 0
.01
Tab
le 7
: Chi
ld L
earn
ing
OL
S: I
mpa
ct o
f tr
eatm
ent i
n en
dlin
e
29

Baseline Mean Endline MeanAll Obs Control ML CHAMP ML-CHAMP N
(1) (2) (3) (4) (5) (6)
Monthly tuition fees 14.25 20.92 3.564* 2.114 1.299 8438[36.68] [53.28] [1.926] [1.962] [1.839]
Child is enrolled 0.775 0.0122 0.0136 0.0144 25053[0.418] [0.0118] [0.0116] [0.0118]
Child will be enrolled 0.905 -0.00203 0.00483 0.00964 25053[0.293] [0.00741] [0.00724] [0.00722]
Child attends school 0.833 0.845 -0.00486 0.00349 0.0193* 25053[0.373] [0.362] [0.0109] [0.0108] [0.0106]
Child attends private school 0.114 0.0805 0.00565 -0.000640 0.00427 25053[0.318] [0.272] [0.00847] [0.00859] [0.00883]
Hours spent in school 3.642 4.063 0.0554 0.0827 0.0885 8475[1.971] [1.599] [0.0554] [0.0537] [0.0558]
Days missed per month 2.152 -0.0820 -0.0206 -0.133 7383[4.753] [0.175] [0.183] [0.164]
Days missed in last week 2.825 1.379 0.0275 -0.0572 -0.0361 6980[2.469] [1.946] [0.0710] [0.0760] [0.0683]
Notes:Columns 3, 4 and 5 display estimated coefficients of a regression of the outcome in each row on treatmentgroup dummies, controlling for stratification unit dummies and baseline values (where available).Standard errors are clustered at the village level.* denotes significance at 0.10; ** at 0.05; *** at 0.01
OLS: Impact of treatment in endline
Table 8: Child Schooling
30

Baseline Mean Endline MeanAll Obs Control ML CHAMP ML-CHAMP N
(1) (2) (3) (4) (5) (6)
Mother-Child Participation Index 0.0231 0.0123 0.0371** 0.0634*** 0.0507** 8231[0.643] [0.512] [0.0184] [0.0196] [0.0198]
Take child to school (# times/week) 0.255 0.336 -0.0385 0.0370 -0.00939 8451[1.095] [1.130] [0.0380] [0.0420] [0.0357]
Visit school (% of mothers) 0.128 0.155 0.00511 0.0136 0.0132 8451[0.335] [0.362] [0.0119] [0.0129] [0.0123]
Visit school: (% of mothers) 0.0969 0.0763 0.00894 0.0157* 0.00824 8451[0.296] [0.266] [0.00951] [0.00903] [0.00895]
Know whether child received homework (% of mothers) 0.762 0.0158 0.0321** 0.0189 8479[0.426] [0.0151] [0.0150] [0.0162]
Help child with homework (% of mothers) 0.325 0.708 0.0158 0.0419*** 0.0258* 8479[0.469] [0.455] [0.0153] [0.0146] [0.0154]
Time spent helping per week (weekly hrs) 1.686 2.313 0.114 0.126 0.0602 8519[2.903] [2.704] [0.0919] [0.0973] [0.0918]
Looked at notebook (% of mothers) 0.126 0.216 0.0300** 0.0651*** 0.0495*** 8572[0.332] [0.412] [0.0149] [0.0157] [0.0152]
Talk to child about school: number of times per week 3.090 0.222** 0.194* 0.247** 8438[3.018] [0.101] [0.105] [0.105]
Talk to others about child's studies: number of times per week 0.551 1.609 0.235*** 0.181** 0.251*** 8521[0.497] [2.222] [0.0778] [0.0773] [0.0797]
Notes:Columns 3, 4 and 5 display estimated coefficients of a regression of the outcome in each row on treatment group dummies, controlling forstratification unit dummies and baseline values (where available).The "Mother-Child Participation Index" is an average of z-scores of the other variables in the table, using the control group means andstandard deviations. The baseline participation index only includes indicators for which data were collected.Standard errors are clustered at the village level.* denotes significance at 0.10; ** at 0.05; *** at 0.01
OLS: Impact of treatment in endline
Table 9: Mother-Child Participation
31

Baseline Mean Endline MeanAll Obs Control ML CHAMP ML-CHAMP N
(1) (2) (3) (4) (5) (6)
Homework (weekly hrs) 2.992 3.760 -0.00138 0.241* 0.302** 8331[4.103] [4.243] [0.149] [0.141] [0.138]
Reading (weekly hrs) 0.258 0.460 -0.0451 -0.00993 0.0549 7942[1.253] [1.571] [0.0485] [0.0526] [0.0531]
Drawing/ painting (weekly hrs) 0.465 0.698 0.00414 0.0743 0.0901* 7902[1.339] [1.543] [0.0531] [0.0520] [0.0527]
Playing w/ adult (weekly hrs) 0.448 0.547 0.000218 -0.0281 -0.0997 8337[2.001] [1.953] [0.0653] [0.0654] [0.0622]
Tuition (weekly hrs) 1.848 2.263 0.194 0.151 0.0103 8416[4.428] [4.861] [0.180] [0.194] [0.174]
Television 3.832 3.673 -0.112 0.144 0.0408 8339[5.644] [4.934] [0.169] [0.175] [0.164]
Housework (weekly hrs) 3.182 3.552 0.0547 0.115 0.129 8408[4.211] [3.987] [0.132] [0.129] [0.130]
Household business (weekly hrs) 1.175 1.786 0.229* 0.0882 0.328** 8407[3.550] [3.705] [0.128] [0.134] [0.128]
Notes:Columns 3, 4 and 5 display estimated coefficients of a regression of the outcome in each row on treatmentgroup dummies, controlling for stratification unit dummies and baseline values (where available).Standard errors are clustered at the village level.* denotes significance at 0.10; ** at 0.05; *** at 0.01
OLS: Impact of treatment in endline
Table 10: Child Time Use
32

Baseline Mean Endline MeanAll Obs Control ML CHAMP ML-CHAMP N
(1) (2) (3) (4) (5) (6)
Education assets in home: pencil (% of hh) 0.930 0.945 -0.0000251 0.0148** 0.0123 8581[0.256] [0.227] [0.00850] [0.00727] [0.00795]
Education assets in home: school books 0.906 0.0179* 0.0168* 0.0264*** 8581[0.292] [0.00978] [0.00935] [0.00990]
Education assets in home: other books/ comics 0.229 0.245 0.0164 0.0364** 0.0410** 8581[0.420] [0.430] [0.0155] [0.0169] [0.0159]
Education assets in home: newspaper/ magazine 0.122 0.0533 0.0105 0.0301*** 0.00867 8581[0.328] [0.225] [0.00789] [0.00881] [0.00789]
Education assets in home: slate 0.891 0.0125 -0.00444 0.0259*** 8581[0.312] [0.0103] [0.0104] [0.00974]
Education assets in home: none 0.0154 -0.00161 -0.00581 -0.00197 8581[0.123] [0.00398] [0.00357] [0.00375]
Notes:Columns 3, 4 and 5 display estimated coefficients of a regression of the outcome in each row on treatment group dummies,controlling for stratification unit dummies and baseline values (where available).Standard errors are clustered at the village level.* denotes significance at 0.10; ** at 0.05; *** at 0.01
Table 11: Education AssetsOLS: Impact of treatment in endline
33

Baseline Mean Endline MeanAll Obs Control ML CHAMP ML-CHAMP N
(1) (2) (3) (4) (5) (6)
Number of things for which parents are responsible 0.730 1.345 0.0559 0.0434 0.0668* 8888[0.0426] [0.0433] [0.0392]
Number of things mother can do to help child 1.246 1.856 0.0454 0.00462 0.0816* 8888[0.0436] [0.0486] [0.0441]
Mother thinks child will likely pass 8th standard 0.798 0.818 -0.000437 0.0121 0.0134 8490[0.0138] [0.0134] [0.0134]
Mother thinks child will likely pass 12th standard 0.579 0.608 0.00665 0.0168 0.0124 8482[0.0177] [0.0175] [0.0174]
Highest standard to which mother aspires for child to study 9.881 10.13 -0.0180 0.0929 0.222 3200[0.125] [0.130] [0.139]
Mother's perception of child's reading ability 1.645 2.452 -0.0421 0.132*** 0.105** 7595[0.0513] [0.0508] [0.0512]
Mother's perception of child's math ability 1.954 2.558 0.00103 0.237*** 0.160*** 7711[0.0544] [0.0551] [0.0577]
Reading: Abs. value of diff. between mother's guess and child sc 1.085 1.601 -0.0256 0.103** 0.0315 7235[0.0429] [0.0445] [0.0426]
Math: Abs. value of diff. between mother's guess and child score 1.265 1.476 -0.0403 0.161*** 0.0997** 7350[0.0444] [0.0486] [0.0458]
Notes:Columns 3, 4 and 5 display estimated coefficients of a regression of the outcome in each row on treatment group dummies, controlling forstratification unit dummies and baseline values (where available).Standard errors are clustered at the village level.* denotes significance at 0.10; ** at 0.05; *** at 0.01
OLS: Impact of treatment in endline
Table 12: Mother Perceptions
34

A Appendix: Location Selection
Because of the slightly different organization of the villages in Rajasthan and Bihar, a different
selection procedure was used in each state. The procedure focused on finding distinct geographic
units, called ‘hamlets’, in which the programs could run, while limiting spillovers. Hamlet eligibil-
ity was therefore determined based on size, according to the number of households, and distance
from other target hamlets.
In Rajasthan, dispersed clusters of villages comprise larger geographic units known as, ‘Gram
Panchayats’. Villages are divided into smaller hamlets, which are known there as, ‘mohellas’.
Hamlets in Rajasthan met the size eligibility requirements if they contained between 40 and 100
households, whereby a household is defined as a family that eats from one kitchen.9 To limit
spillovers, one hamlet per village was selected.
All villages in two blocks, Kekri and Bhinay, were targeted for the intervention in Rajasthan.
Within each village, first preference was given to hamlets with 60-80 households, as Pratham and
the research team determined this to be the approximate size to support one adult literacy class. In
each village, the hamlet with 60-80 households was selected unless there was more than one, in
which case one hamlet of that size was chosen at random. If there were no hamlets in a village
with 60-80 households, second preference was given to hamlets of 40-100 households. Again, if
there was only one hamlet in a target village with 40-100 households, it was selected; otherwise,
one hamlet of that size was selected at random. To identify a total of 240 target hamlets, the
boundaries of Kekri and Bhinay were extended into a third block. Target hamlets were identified
using the same procedure used in Kekri and Bhinay until 240 had been selected.
In Bihar, the village boundaries are less distinct and villages are much denser than in Rajasthan.
Each panchayat has multiple revenue villages, with each revenue village comprising smaller ham-
lets known there as, ‘tolas’ (the equivalent of a ‘mohella’ in Rajasthan). Within each revenue
village, there is typically a main village and hamlets that surround the main village. In Bihar, ham-
9In one instance, a hamlet containing more than 100 households was split into smaller “synthetic hamlets” for thepurposes of the intervention.
35
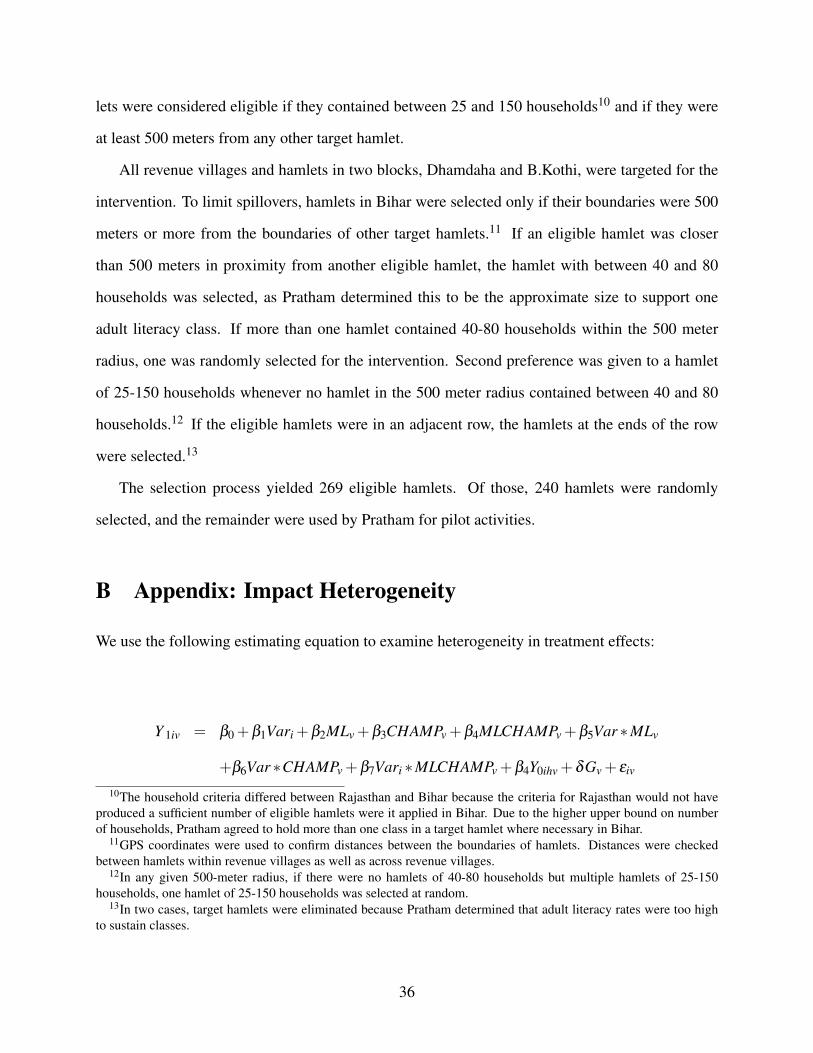
lets were considered eligible if they contained between 25 and 150 households10 and if they were
at least 500 meters from any other target hamlet.
All revenue villages and hamlets in two blocks, Dhamdaha and B.Kothi, were targeted for the
intervention. To limit spillovers, hamlets in Bihar were selected only if their boundaries were 500
meters or more from the boundaries of other target hamlets.11 If an eligible hamlet was closer
than 500 meters in proximity from another eligible hamlet, the hamlet with between 40 and 80
households was selected, as Pratham determined this to be the approximate size to support one
adult literacy class. If more than one hamlet contained 40-80 households within the 500 meter
radius, one was randomly selected for the intervention. Second preference was given to a hamlet
of 25-150 households whenever no hamlet in the 500 meter radius contained between 40 and 80
households.12 If the eligible hamlets were in an adjacent row, the hamlets at the ends of the row
were selected.13
The selection process yielded 269 eligible hamlets. Of those, 240 hamlets were randomly
selected, and the remainder were used by Pratham for pilot activities.
B Appendix: Impact Heterogeneity
We use the following estimating equation to examine heterogeneity in treatment effects:
Y 1iv = β0 +β1Vari +β2MLv +β3CHAMPv +β4MLCHAMPv +β5Var ∗MLv
+β6Var ∗CHAMPv +β7Vari ∗MLCHAMPv +β4Y0ihv +δGv + εiv
10The household criteria differed between Rajasthan and Bihar because the criteria for Rajasthan would not haveproduced a sufficient number of eligible hamlets were it applied in Bihar. Due to the higher upper bound on numberof households, Pratham agreed to hold more than one class in a target hamlet where necessary in Bihar.
11GPS coordinates were used to confirm distances between the boundaries of hamlets. Distances were checkedbetween hamlets within revenue villages as well as across revenue villages.
12In any given 500-meter radius, if there were no hamlets of 40-80 households but multiple hamlets of 25-150households, one hamlet of 25-150 households was selected at random.
13In two cases, target hamlets were eliminated because Pratham determined that adult literacy rates were too highto sustain classes.
36

In this equation,Vari is the interacted variable, and the remainder of the variables are defined
as in equation (1).
B.1 Mothers
Appendix Table 7 examines heterogeneity in treatment effects of the interventions on mother test
scores. We focus on heterogeneity by the state where the intervention took place, the mother’s
baseline score, mother’s age, and mother’s education level.
The first three columns of Appendix Table 7 examine heterogeneity by state. There is evidence
that the ML and ML-CHAMP interventions were more effective in Bihar. For example, the effects
of the ML intervention were 0.02 standard deviations higher for language, 0.13 standard deviations
higher for math, and 0.09 standard deviations higher for composite scores in Bihar compared with
Rajasthan. The latter two results are significant at the 1 percent level. Similarly, the ML-CHAMP
intervention increased language, math, and combined scores by 0.08, 0.12, and 0.11 standard de-
viations more in Bihar than in Rajasthan. There are no significant differences in treatment effects
across states for the CHAMP intervention.
Columns 4 through 7 of Appendix Table 7 examine heterogeneity by mother’s baseline test
score. There is little evidence that ML and ML-CHAMP were more effective for mothers with
higher or lower test scores. ML-CHAMP did increase composite scores significantly more for
mothers who scored lower at the baseline, but the interaction effects on the disaggregated lan-
guage and math scores are insignificant and inconsistently signed. On the other hand, the CHAMP
intervention was significantly more effective for mothers with higher initial test scores.
The remaining columns of Appendix Table 7 examine heterogeneity by mother age and educa-
tion level. Here, there are few significant interaction effects, and the magnitudes are small. There
is evidence that ML-CHAMP was more effective for less-educated mothers in increasing math
and composite scores, although these interactions are not reflected in either the ML or CHAMP
interventions.
37

B.2 Children
Appendix Tables 8a and 8b examine heterogeneity in treatment effects on child test scores. Ap-
pendix Table 8a uses the same set of variables that were used in the analysis for mothers. Overall,
there is little evidence of heterogeneity by any of these variables. Unlike the effects found for
mothers, there is no significant heterogeneity by state, although the point estimates do suggest that
ML and ML-CHAMP were more effective in Bihar. Children with older mothers had significantly
stronger effects of the ML intervention on math and composite scores.
Appendix Table 8b examines heterogeneity by child age, child baseline score, and gender.
Again, there are few large or statistically significant effects. There is some evidence that ML-
CHAMP was more effective for older children in improving literacy and composite scores. The
only other statistically significant interaction in the table suggests that lower-scoring children per-
formed better in math in the ML-CHAMP intervention, although this heterogeneity is not reflected
in language or composite scores.
38

Rajasthan Bihar(1) (2)
First Principal Component of Durables Ownership 1.250 -1.202(2.281) (1.397)
Does household have electricity 0.808 0.154(0.394) (0.361)
Roof has cement, stone, metal, beams, or plastic 0.981 0.626(0.136) (0.484)
Family's largest source of income was self-employed agriculture or rent agriculture 0.517 0.385(0.500) (0.487)
Family's largest source of income was agricultural wages, regular wages, or irregular wa 0.311 0.543(0.463) (0.498)
Number of children (14 and younger) in household 3.277 3.565(1.418) (1.263)
Number of adults (15 and older) in household 3.682 2.980(2.099) (1.395)
Mother's weighted baseline literacy score 3.220 2.871(2.535) (2.548)
Mother's weighted baseline numeracy score 3.612 2.601(3.504) (3.391)
Mother education level 0.741 0.922(2.173) (2.480)
Father education level 4.819 3.124(4.436) (4.296)
Member has attended any adult literacy classes 0.143 0.0743(0.350) (0.262)
Baseline Empowerment Index -0.0295 0.0161(0.353) (0.423)
Baseline Mother-Child Participation Index -0.0456 0.0893(0.589) (0.685)
Hours weekly spent on housework 21.27 23.10(8.374) (9.185)
Hours weekly spent on agricultural, paid, and livestock work 46.11 26.38(17.78) (19.03)
Hours weekly spent looking after, telling stories to, or playing with kids 5.300 7.456(3.945) (4.886)
Hours weekly spent helping with homework or reading with kids 1.378 2.385(2.458) (3.876)
Family member has worked under the NREGA in the last month 0.557 0.303(0.497) (0.460)
Mother is member of a self help group 0.0553 0.490(0.229) (0.500)
Child attends private school 0.155 0.0240(0.362) (0.153)
Child attends school 0.840 0.827(0.366) (0.378)
Child's weighted baseline literacy score 3.144 2.626(2.546) (2.224)
Child's weighted baseline numeracy score 3.022 2.730(3.018) (3.116)
Child's weighted baseline composite score (total of literacy and numeracy) 6.166 5.356(5.397) (5.179)
Other household member can read 0.415 0.358(0.493) (0.480)
Other household member can do math 0.268 0.259(0.443) (0.438)
Appendix Table 1: Baseline Means of Variables in Rajasthan and Bihar Samples
39

Baseline EndlineWeight Weight Mothers Children
(1) (2) (3) (4)
Identify Pictures 2 2 1.495 1.458(0.388) (0.566)
Read Letters 2 2 0.392 0.690(0.712) (0.838)
Read simple words 1 1 0.146 0.251(0.341) (0.416)
Read complex words 1 1 0.131 0.214(0.327) (0.393)
Read paragraph 2 2 0.197 0.250(0.596) (0.662)
Read Story * -- 2
Write own name * 1 1 0.565(0.496)
Write child's name * 1 1 0.117(0.321)
Write village name * -- 2
Literacy score 10 14 3.042 2.863(2.547) (2.390)
Notes:Columns 1 and 2 display the weights used in aggregating the test questions.* Denotes that the question appeared only on the mother test.
Appendix Table 2a: Question-wise Literacy Baseline Means
Baseline Weighted Score
40

Baseline EndlineWeight Weight Mothers Children
(1) (2) (3) (4)
Subtraction word problem * 1 1 0.402(0.490)
Division word problem * 1 1 0.228(0.420)
Read digits 1-9 1 1 0.593 0.626(0.471) (0.466)
Identify digits 1-9 1 1 0.448 0.529(0.459) (0.474)
Read digits 11-20 1 1 0.299 0.449(0.443) (0.492)
Identify digits 11-20 1 1 0.192 0.349(0.371) (0.457)
Identify numbers 21-99 1 1 0.103 0.163(0.286) (0.339)
Single digit addition 1 1 0.127 0.266(0.333) (0.442)
Double digit addition 1 1 0.101 0.207(0.302) (0.405)
Single digit subtraction 1 1 0.0781 0.151(0.268) (0.358)
Double digit subtraction 2 2 0.0865 0.124(0.407) (0.483)
Tell time: 10:30 * 0.5 0.5 0.117(0.212)
Tell time: 1:40 * 0.5 0.5 0.0826(0.186)
Dial a number read out loud * 1 1 0.238(0.426)
Numeracy score 14 14 3.096 2.863(3.483) (3.075)
Notes:Columns 1 and 2 display the weights used in aggregating the test questions.* Denotes that the question appeared only on the mother test.
Appendix Table 2b: Question-wise Numeracy Baseline Means
Baseline Weighted Score
41

Appendix Table 3: Mother Question-wise Treatment Effects--Language
Baseline Mean Endline MeanAll Obs Control ML CHAMP ML-CHAMP N
(1) (2) (3) (4) (5) (6)
Identify Pictures 0.747 0.775 0.00275 0.00759 0.0116** 8552[0.194] [0.186] [0.00477] [0.00471] [0.00450]
Read Letters 0.196 0.173 0.0351*** 0.00927 0.0474*** 8552[0.356] [0.338] [0.00593] [0.00580] [0.00609]
Read simple words 0.146 0.115 0.0165*** 0.0117** 0.0244*** 8552[0.341] [0.308] [0.00472] [0.00486] [0.00499]
Read complex words 0.131 0.0922 0.00540 0.00973** 0.0108** 8552[0.327] [0.278] [0.00436] [0.00460] [0.00432]
Read paragraph 0.0985 0.0776 0.00243 0.00714 0.00334 8552[0.298] [0.268] [0.00421] [0.00507] [0.00443]
Read story 0.0627 0.00303 0.0141 0.00571 8580[0.242] [0.00968] [0.0112] [0.00986]
Write own name 0.565 0.556 0.0794*** 0.00835 0.0907*** 8552[0.496] [0.497] [0.0145] [0.0134] [0.0143]
Write child's name 0.117 0.105 0.0212*** 0.00537 0.00571 8551[0.321] [0.306] [0.00668] [0.00615] [0.00986]
Write name of village 0.0856 0.00843 0.0136 0.0159 8580[0.280] [0.0113] [0.0133] [0.0116]
Notes:Columns 3, 4 and 5 display estimated coefficients of a regression of the outcome in each row ontreatment group dummies, controlling for stratification unit dummies and baseline values (whereavailable).Standard errors are clustered at the village level.* denotes significance at 0.10; ** at 0.05; *** at 0.01
OLS: Impact of treatment in endline
42

Appendix Table 4: Mother Question-wise Treatment Effects--Math
Mean Endline MeanAll Obs Control ML CHAMP ML-CHAMP N
(1) (2) (3) (4) (5) (6)
Read digits 1-9 0.593 0.627 0.0967*** 0.0457*** 0.140*** 8552[0.471] [0.460] [0.0134] [0.0129] [0.0128]
Identify digits 1-9 0.448 0.469 0.0661*** 0.0304*** 0.109*** 8552[0.459] [0.460] [0.0103] [0.0100] [0.0108]
Read digits 11-20 0.299 0.298 0.0677*** 0.0204** 0.0779*** 8552[0.443] [0.442] [0.00997] [0.00965] [0.0101]
Identify digits 11-20 0.192 0.182 0.0228*** 0.0130* 0.0399*** 8552[0.371] [0.361] [0.00677] [0.00737] [0.00752]
Identify numbers 21-99 0.103 0.0964 0.0140*** 0.00636 0.0147*** 8552[0.286] [0.276] [0.00435] [0.00441] [0.00439]
Single digit addition 0.127 0.129 0.0124 0.0134* 0.0321*** 8552[0.333] [0.335] [0.00752] [0.00727] [0.00762]
Double digit addition 0.101 0.0781 0.00200 0.00555 0.0137** 8552[0.302] [0.268] [0.00550] [0.00592] [0.00565]
Single digit subtraction 0.0781 0.0692 0.00651 0.00445 0.00592 8551[0.268] [0.254] [0.00574] [0.00580] [0.00570]
Double digit subtraction 0.0432 0.0580 0.0127* 0.0134* 0.00608 8552[0.203] [0.234] [0.00674] [0.00689] [0.00615]
Double digit subtraction with carryov 0.0355 0.00662 0.0147* 0.00253 8580[0.185] [0.00735] [0.00882] [0.00728]
Subtraction word problem 0.402 0.240 0.0239 0.0238 0.0381*** 8552[0.490] [0.427] [0.0149] [0.0160] [0.0145]
Division word problem 0.228 0.134 0.0264** 0.0271** 0.0238** 8552[0.420] [0.340] [0.0110] [0.0115] [0.0115]
Tell time at 10:30 0.233 0.252 0.00952 0.00460 -0.00427 8552[0.423] [0.434] [0.0111] [0.0129] [0.0124]
Tell time at 1:40 0.165 0.0767 0.0107 0.00830 -0.00331 8552[0.371] [0.266] [0.00771] [0.00773] [0.00765]
Dial a number that is read out to her 0.238 0.261 0.0287** 0.00522 0.0283** 8552[0.426] [0.440] [0.0111] [0.0119] [0.0112]
Notes:Columns 3, 4 and 5 display estimated coefficients of a regression of the outcome in each row on treatment groupdummies, controlling for stratification unit dummies and baseline values (where available).Standard errors are clustered at the village level.* denotes significance at 0.10; ** at 0.05; *** at 0.01
OLS: Impact of treatment in endline
43

Appendix Table 5: Child Question-wise Treatment Effects--Language
Baseline Mean Endline MeanAll Obs Control ML CHAMP ML-CHAMP N
(1) (2) (3) (4) (5) (6)
Identify Pictures 0.729 0.758 0.000473 0.0104* 0.00966 18282[0.283] [0.285] [0.00633] [0.00625] [0.00603]
Read Letters 0.345 0.387 0.00110 0.0146 0.0272*** 18282[0.419] [0.430] [0.00892] [0.00917] [0.00894]
Read simple words 0.251 0.271 -0.00517 0.0124 0.0121 18282[0.416] [0.421] [0.00826] [0.00862] [0.00818]
Read complex words 0.214 0.175 0.00116 0.00983 0.0122** 18282[0.393] [0.352] [0.00642] [0.00633] [0.00618]
Read paragraph 0.125 0.117 -0.00211 0.00215 0.0134** 18282[0.331] [0.321] [0.00620] [0.00621] [0.00611]
Read story 0.0757 0.00713 0.00749 0.0101 18282[0.265] [0.00875] [0.00838] [0.00823]
Notes:Columns 3, 4 and 5 display estimated coefficients of a regression of the outcome in each row ontreatment group dummies, controlling for stratification unit dummies and baseline values (whereavailable).Standard errors are clustered at the village level.* denotes significance at 0.10; ** at 0.05; *** at 0.01
OLS: Impact of treatment in endline
44

Appendix Table 6: Child Question-wise Treatment Effects--Math
Mean Endline MeanAll Obs Control ML CHAMP ML-CHAMP N
(1) (2) (3) (4) (5) (6)
Read digits 1-9 0.626 0.652 0.0249*** 0.0227** 0.0397*** 18282[0.466] [0.459] [0.00938] [0.00925] [0.00885]
Identify digits 1-9 0.529 0.560 0.0203** 0.0385*** 0.0399*** 18282[0.474] [0.474] [0.00856] [0.00876] [0.00861]
Read digits 11-20 0.449 0.487 0.0195* 0.0275*** 0.0482*** 18282[0.492] [0.496] [0.0101] [0.0102] [0.00974]
Identify digits 11-20 0.349 0.387 0.00338 0.0189* 0.0332*** 18282[0.457] [0.470] [0.00936] [0.00987] [0.00887]
Identify numbers 21-99 0.163 0.200 0.00104 0.00285 0.00800 18282[0.339] [0.367] [0.00724] [0.00713] [0.00692]
Single digit addition 0.266 0.311 0.0130 0.0254** 0.0192* 18282[0.442] [0.463] [0.0104] [0.0104] [0.0102]
Double digit addition 0.207 0.196 0.0231** 0.00822 0.00790 18282[0.405] [0.397] [0.00946] [0.00914] [0.00880]
Single digit subtraction 0.151 0.171 0.00757 0.0193** 0.0143* 18282[0.358] [0.377] [0.00838] [0.00896] [0.00842]
Double digit subtraction 0.0622 0.133 0.0132 0.0153* 0.0131 18282[0.241] [0.339] [0.00912] [0.00914] [0.00918]
Double digit subtraction with carryov 0.0579 0.0150* 0.00115 0.00637 18282[0.234] [0.00779] [0.00742] [0.00693]
Notes:Columns 3, 4 and 5 display estimated coefficients of a regression of the outcome in each row on treatment groupdummies, controlling for stratification unit dummies and baseline values (where available).Standard errors are clustered at the village level.* denotes significance at 0.10; ** at 0.05; *** at 0.01
OLS: Impact of treatment in endline
45

App
endi
x T
able
7. H
eter
ogen
eity
in I
mpa
ct
Out
com
e: M
othe
r T
est S
core
s
Inte
ract
ed V
aria
ble
Sta
te =
Bih
arM
othe
r B
asel
ine
Sco
reM
othe
r A
geM
othe
r E
duca
tion
Lev
elL
iter
acy
Num
erac
yC
ompo
site
Lit
erac
yN
umer
acy
Com
posi
teL
iter
acy
Num
erac
yC
ompo
site
Lit
erac
yN
umer
acy
Com
posi
te(1
)(2
)(3
)(4
)(5
)(6
)(7
)(8
)(9
)(1
0)(1
1)(1
2)
ML
0.08
10**
*0.
0533
***
0.06
57**
*0.
0903
***
0.11
1***
0.12
0***
0.06
150.
0610
0.05
960.
0988
***
0.12
2***
0.11
7***
[0.0
266]
[0.0
199]
[0.0
183]
[0.0
180]
[0.0
148]
[0.0
164]
[0.0
768]
[0.0
615]
[0.0
563]
[0.0
153]
[0.0
165]
[0.0
142]
CH
AM
P0.
0681
**0.
0740
***
0.07
73**
*0.
0370
**0.
0557
***
0.06
59**
*0.
0933
0.16
4***
0.13
8**
0.02
64*
0.05
44**
*0.
0459
***
[0.0
272]
[0.0
196]
[0.0
177]
[0.0
181]
[0.0
135]
[0.0
150]
[0.0
768]
[0.0
601]
[0.0
564]
[0.0
148]
[0.0
156]
[0.0
127]
ML
-CH
AM
P0.
0865
***
0.09
73**
*0.
0958
***
0.12
5***
0.15
1***
0.16
1***
0.17
9**
0.12
3*0.
150*
*0.
131*
**0.
173*
**0.
162*
**[0
.026
5][0
.022
1][0
.020
1][0
.018
1][0
.015
5][0
.017
0][0
.079
2][0
.063
5][0
.060
4][0
.016
3][0
.017
6][0
.015
3]
Var
iabl
e0.
221*
**0.
0811
0.16
9***
1.18
2***
1.05
9***
0.89
9***
-0.0
0077
6-0
.006
92**
*-0
.002
58**
0.14
9***
0.07
11**
*0.
0917
***
[0.0
825]
[0.0
504]
[0.0
598]
[0.0
260]
[0.0
141]
[0.0
117]
[0.0
0158
][0
.001
24]
[0.0
0119
][0
.008
71]
[0.0
0594
][0
.005
60]
Var
iabl
e x
ML
0.02
010.
130*
**0.
0890
***
0.02
21-0
.006
02-0
.009
520.
0009
210.
0017
90.
0016
0-0
.013
3-0
.005
67-0
.010
4[0
.036
9][0
.032
1][0
.029
4][0
.032
4][0
.019
2][0
.017
1][0
.002
15]
[0.0
0181
][0
.001
63]
[0.0
103]
[0.0
0814
][0
.007
59]
Var
iabl
e x
CH
AM
P-0
.056
1-0
.009
96-0
.037
50.
0571
*0.
0369
**0.
0371
**-0
.001
66-0
.002
98*
-0.0
0247
0.00
518
0.00
852
0.00
607
[0.0
376]
[0.0
299]
[0.0
265]
[0.0
326]
[0.0
180]
[0.0
159]
[0.0
0212
][0
.001
72]
[0.0
0161
][0
.009
05]
[0.0
0772
][0
.006
35]
Var
iabl
e x
ML
-CH
AM
P0.
0788
**0.
123*
**0.
109*
**0.
0370
-0.0
118
-0.0
358*
*-0
.001
650.
0011
00.
0000
176
-0.0
107
-0.0
198*
**-0
.017
6***
[0.0
370]
[0.0
333]
[0.0
304]
[0.0
330]
[0.0
181]
[0.0
170]
[0.0
0220
][0
.001
88]
[0.0
0174
][0
.009
71]
[0.0
0735
][0
.006
44]
N85
5285
5285
5285
5285
5285
5285
5285
5285
5285
2885
2885
28
Eac
h co
lum
n di
spla
ys th
e re
sult
s of
a r
egre
ssio
n of
the
mot
her's
nor
mal
ized
lite
racy
, num
erac
y or
com
posi
te te
st s
core
on
trea
tmen
t dum
mie
s, th
e in
tera
ctio
n va
riab
led
indi
cate
d, a
nd in
tera
ctio
ns o
f th
e va
riab
le a
nd tr
eatm
ent d
umm
ies.
R
egre
ssio
ns c
ontr
ol f
or b
asel
ine
test
sco
res
(exc
ept w
here
the
inte
ract
ed v
aria
ble
is th
e ba
seli
ne s
core
itse
lf),
and
str
atum
dum
mie
s.S
tand
ard
erro
rs a
re c
lust
ered
at t
he v
illa
ge le
vel.
* de
note
s si
gnif
ican
ce a
t 0.1
0; *
* at
0.0
5; *
** a
t 0.0
1
46

Lit
erac
yN
umer
acy
Com
posi
teL
iter
acy
Num
erac
yC
ompo
site
Lit
erac
yN
umer
acy
Com
posi
teL
iter
acy
Num
erac
yC
ompo
site
(1)
(2)
(3)
(4)
(5)
(6)
(7)
(8)
(9)
(10)
(11)
(12)
ML
-0.0
0299
0.02
810.
0147
-0.0
0107
0.03
85**
0.02
07-0
.101
-0.0
849
-0.0
946
-0.0
0679
0.03
71**
0.01
73[0
.027
7][0
.024
3][0
.024
2][0
.018
7][0
.017
9][0
.017
0][0
.071
8][0
.063
5][0
.062
2][0
.018
8][0
.018
2][0
.017
2]
CH
AM
P0.
0231
0.05
11**
0.03
860.
0226
0.04
53**
0.03
50**
-0.0
300
-0.0
251
-0.0
317
0.01
160.
0402
**0.
0275
[0.0
282]
[0.0
255]
[0.0
252]
[0.0
174]
[0.0
180]
[0.0
167]
[0.0
733]
[0.0
626]
[0.0
620]
[0.0
179]
[0.0
182]
[0.0
170]
ML
-CH
AM
P0.
0438
0.04
94**
0.04
80**
0.05
25**
*0.
0682
***
0.06
25**
*0.
0200
0.12
1*0.
0800
0.04
57**
0.06
55**
*0.
0579
***
[0.0
269]
[0.0
224]
[0.0
223]
[0.0
174]
[0.0
176]
[0.0
162]
[0.0
752]
[0.0
685]
[0.0
669]
[0.0
183]
[0.0
177]
[0.0
166]
Var
iabl
e-0
.069
5-0
.024
3-0
.040
60.
0775
***
0.06
38**
*0.
0743
***
-0.0
0481
***
-0.0
0235
*-0
.003
81**
*0.
0336
***
0.03
02**
*0.
0316
***
[0.0
667]
[0.0
600]
[0.0
586]
[0.0
125]
[0.0
110]
[0.0
112]
[0.0
0152
][0
.001
25]
[0.0
0123
][0
.006
10]
[0.0
0597
][0
.005
78]
Var
iabl
e x
ML
0.00
153
0.01
690.
0085
40.
0049
60.
0172
0.00
795
0.00
303
0.00
379*
*0.
0035
2*0.
0064
80.
0031
70.
0045
2[0
.038
3][0
.036
3][0
.034
9][0
.017
4][0
.015
1][0
.015
1][0
.002
09]
[0.0
0187
][0
.001
80]
[0.0
0807
][0
.008
07]
[0.0
0766
]
Var
iabl
e x
CH
AM
P0.
0103
-0.0
0762
0.00
0133
0.02
98*
0.01
410.
0177
0.00
180
0.00
223
0.00
217
0.01
47*
0.00
461
0.00
896
[0.0
393]
[0.0
372]
[0.0
363]
[0.0
178]
[0.0
152]
[0.0
158]
[0.0
0209
][0
.001
83]
[0.0
0177
][0
.008
44]
[0.0
0760
][0
.007
53]
Var
iabl
e x
ML
-CH
AM
P0.
0182
0.03
500.
0279
0.02
170.
0225
0.02
190.
0010
3-0
.001
64-0
.000
539
0.00
815
0.00
301
0.00
552
[0.0
372]
[0.0
355]
[0.0
337]
[0.0
184]
[0.0
150]
[0.0
155]
[0.0
0221
][0
.002
00]
[0.0
0193
][0
.009
18]
[0.0
0795
][0
.008
03]
N18
282
1828
218
282
1782
317
823
1782
318
282
1828
218
282
1823
418
234
1823
4
Eac
h co
lum
n di
spla
ys th
e re
sult
s of
a r
egre
ssio
n of
the
chil
d's
norm
aliz
ed li
tera
cy, n
umer
acy
or c
ompo
site
test
sco
re o
n tr
eatm
ent d
umm
ies,
the
inte
ract
ion
vari
able
din
dica
ted,
and
inte
ract
ions
of
the
vari
able
and
trea
tmen
t dum
mie
s.
Reg
ress
ions
con
trol
for
bas
elin
e te
st s
core
s (e
xcep
t whe
re th
e in
tera
cted
var
iabl
e is
the
base
line
sco
re it
self
), a
nd s
trat
um d
umm
ies.
Sta
ndar
d er
rors
are
clu
ster
ed a
t the
vil
lage
leve
l.*
deno
tes
sign
ific
ance
at 0
.10;
**
at 0
.05;
***
at 0
.01
App
endi
x T
able
8a.
Het
erog
enei
ty in
Im
pact
Out
com
e: C
hild
Tes
t Sco
res
Inte
ract
ed V
aria
ble
Sta
te =
Bih
arM
othe
r B
asel
ine
Sco
reM
othe
r A
geM
othe
r E
duca
tion
Lev
el
47

Lit
erac
yN
umer
acy
Com
posi
teL
iter
acy
Num
erac
yC
ompo
site
Lit
erac
yN
umer
acy
Com
posi
te(1
3)(1
4)(1
5)(1
6)(1
7)(1
8)(1
9)(2
0)(2
1)
ML
0.02
560.
0188
0.02
26-0
.009
540.
0385
*0.
0165
-0.0
0873
0.03
600.
0164
[0.0
351]
[0.0
331]
[0.0
300]
[0.0
210]
[0.0
198]
[0.0
186]
[0.0
235]
[0.0
231]
[0.0
214]
CH
AM
P0.
0110
0.03
060.
0230
0.01
720.
0460
**0.
0325
*0.
0370
0.05
88**
0.04
96**
[0.0
350]
[0.0
338]
[0.0
316]
[0.0
203]
[0.0
197]
[0.0
186]
[0.0
238]
[0.0
240]
[0.0
222]
ML
-CH
AM
P-0
.036
70.
0389
0.00
669
0.05
47**
*0.
0723
***
0.06
58**
*0.
0554
**0.
0609
***
0.05
98**
*[0
.032
6][0
.034
2][0
.031
0][0
.019
8][0
.019
4][0
.017
9][0
.022
5][0
.022
8][0
.020
9]
Var
iabl
e0.
0412
***
0.06
85**
*0.
0486
***
0.97
0***
0.88
8***
0.95
1***
0.04
81**
*0.
0829
***
0.06
51**
*[0
.005
58]
[0.0
0551
][0
.005
16]
[0.0
133]
[0.0
118]
[0.0
102]
[0.0
180]
[0.0
185]
[0.0
166]
Var
iabl
e x
ML
-0.0
0456
0.00
283
-0.0
0060
80.
0090
90.
0094
00.
0092
50.
0137
0.00
442
0.00
707
[0.0
0597
][0
.005
48]
[0.0
0487
][0
.020
1][0
.016
1][0
.015
0][0
.024
8][0
.025
3][0
.022
6]
Var
iabl
e x
CH
AM
P0.
0026
50.
0025
90.
0024
40.
0195
-0.0
173
0.00
0399
-0.0
156
-0.0
225
-0.0
207
[0.0
0603
][0
.005
46]
[0.0
0514
][0
.019
8][0
.016
3][0
.015
0][0
.026
3][0
.025
7][0
.023
7]
Var
iabl
e x
ML
-CH
AM
P0.
0143
**0.
0044
70.
0089
0*0.
0193
-0.0
302*
-0.0
0619
-0.0
0200
0.01
750.
0086
2[0
.005
55]
[0.0
0548
][0
.004
88]
[0.0
184]
[0.0
166]
[0.0
142]
[0.0
263]
[0.0
257]
[0.0
239]
N18
281
1828
118
281
1457
514
575
1457
518
282
1828
218
282
Eac
h co
lum
n di
spla
ys th
e re
sult
s of
a r
egre
ssio
n of
the
chil
d's
norm
aliz
ed li
tera
cy, n
umer
acy
or c
ompo
site
test
sco
re o
n tr
eatm
ent
dum
mie
s, th
e in
tera
ctio
n va
riab
led
indi
cate
d, a
nd in
tera
ctio
ns o
f th
e va
riab
le a
nd tr
eatm
ent d
umm
ies.
R
egre
ssio
ns c
ontr
ol f
or b
asel
ine
test
sco
res
(exc
ept w
here
the
inte
ract
ed v
aria
ble
is th
e ba
seli
ne s
core
itse
lf),
and
str
atum
dum
mie
s.S
tand
ard
erro
rs a
re c
lust
ered
at t
he v
illa
ge le
vel.
* de
note
s si
gnif
ican
ce a
t 0.1
0; *
* at
0.0
5; *
** a
t 0.0
1
App
endi
x T
able
8b.
Het
erog
enei
ty in
Im
pact
Out
com
e: C
hild
Tes
t Sco
res
Inte
ract
ed V
aria
ble
Chi
ld A
geC
hild
Bas
elin
e S
core
Gen
der
48