Embed Size (px)
Citation preview
1401003_DriverBehaviorWhitepaper.R3.2
The Impact Of Measuring Driver And Vehicle Behavior
Why Businesses are Investing in Fleet Data | A Teletrac Whitepaper

1401003_DriverBehaviorWhitepaper.R3.2The Impact Of Measuring Driver And Vehicle Behavior 2
The Impact Of Measuring Driver And Vehicle BehaviorData has many meanings. Virtually any business that has invested in a GPS tracking solution can track the location of their vehicles by pinpointing them on a map. But times have changed. The sophistication of data has expanded to deliver the real financial costs of vehicle and driver behavior on the road. Progressions in technology can now tie driver behavior directly to company benchmarks, including safety behavior, fuel use and the vehicle maintenance costs. The right software will identify a company’s biggest priorities, whether it’s revenue, customer satisfaction or federal compliance, and deliver that data to motivate daily business decisions.
What Is Vehicle and Driver Behavior Data? Vehicle and driver behavior data helps businesses record daily vehicle activity without physically reaching inside the hood of a vehicle to extract information. This data gives users a powerful look at the health of their business through custom vehicle statistics about their fleet’s activity. This type of deep data goes beyond track-and-trace information by steering a company’s focus towards items, such as the total time spent at a job site, that may have been previously overlooked. In-depth data leads to more informed business decisions that can impact a company’s financial success.
The versatility of fleet data helps track and monitor fuel waste and related costs, distances and miles traveled, idle time including power take-off (PTO) time, and driving habits, for single vehicles, sub-group or an entire fleet. GPS tracking software provide a full view of this fleet performance data, including the lowest and highest ranking vehicles for each of the metrics, giving users a handful of productivity, diagnostics and maintenance data.
Overall, actionable vehicle data can benefit even the smallest of fleets. Obvious GPS data can give you peace of mind when you want to ask “Where are my vehicles?” but using comprehensive fleet data as part of everyday fleet management provides key performance data that can help cut down fuel consumption and other inefficiencies, increasing a fleet’s lifespan, productivity levels and cost savings.
The Benefits Of Tracking Fleet Data • 11% increase in
customer satisfaction• 11% increase in service
delivery/revenue• 7% higher productivity
(jobs completed daily)
• 9% decrease in idle time
• 8% decrease in speeding incidents
• 6% decrease in accidents
What Does Vehicle and Driver Behavior Data Measure?
P
Total Miles DrivenThe cumulative miles a driver has accrued for a specific time period.
Fuel UseThe amount of fuel utilized by a driver, which can be impacted by harsh driving, idle time and unnecessary stops.
Idle TimeThe total time a vehicle’s engine is running when the vehicle is not in motion.
MaintenanceData summarizing engine statistics and fault codes in addition to routing information and service mileage.
Start Time & End TimeThe time a driver clocks in and clocks out each day.
Time On Lunch BreakThe time, length and number of breaks that a driver takes on the Road.
Driver StopsThe number of stops a driver takes while on the clock, including en route to a job site.
Time Spent At Job SiteThe total time a driver spends delivering and completing a task at a job site.
*Source Aberdeen Group
1401003_DriverBehaviorWhitepaper.R3.2The Impact Of Measuring Driver And Vehicle Behavior 3
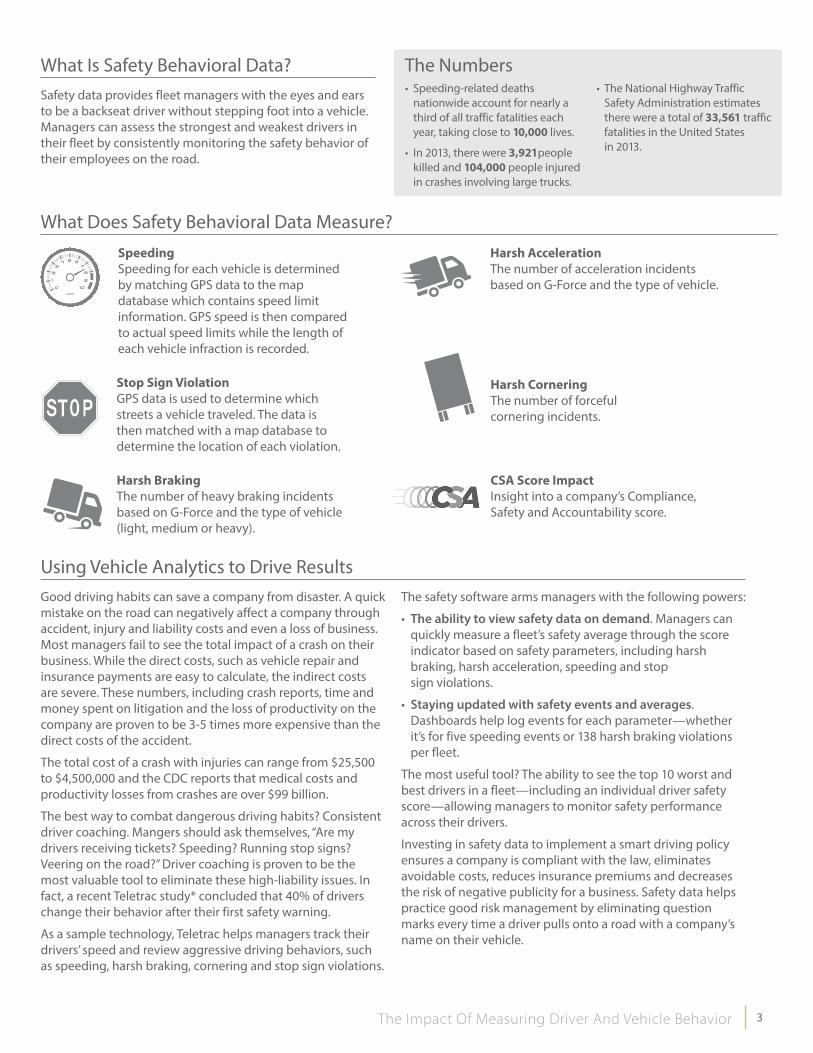
What Is Safety Behavioral Data?Safety data provides fleet managers with the eyes and ears to be a backseat driver without stepping foot into a vehicle. Managers can assess the strongest and weakest drivers in their fleet by consistently monitoring the safety behavior of their employees on the road.
SpeedingSpeeding for each vehicle is determined by matching GPS data to the map database which contains speed limit information. GPS speed is then compared to actual speed limits while the length of each vehicle infraction is recorded.
Stop Sign ViolationGPS data is used to determine which streets a vehicle traveled. The data is then matched with a map database to determine the location of each violation.
Harsh BrakingThe number of heavy braking incidents based on G-Force and the type of vehicle (light, medium or heavy).
Harsh AccelerationThe number of acceleration incidentsbased on G-Force and the type of vehicle.
Harsh CorneringThe number of forcefulcornering incidents.
CSA Score ImpactInsight into a company’s Compliance,Safety and Accountability score.
What Does Safety Behavioral Data Measure?
The Numbers • Speeding-related deaths
nationwide account for nearly a third of all traffic fatalities each year, taking close to 10,000 lives.
• In 2013, there were 3,921people killed and 104,000 people injured in crashes involving large trucks.
• The National Highway Traffic Safety Administration estimates there were a total of 33,561 traffic fatalities in the United Statesin 2013.
Using Vehicle Analytics to Drive ResultsGood driving habits can save a company from disaster. A quick mistake on the road can negatively affect a company through accident, injury and liability costs and even a loss of business. Most managers fail to see the total impact of a crash on their business. While the direct costs, such as vehicle repair and insurance payments are easy to calculate, the indirect costs are severe. These numbers, including crash reports, time and money spent on litigation and the loss of productivity on the company are proven to be 3-5 times more expensive than the direct costs of the accident.
The total cost of a crash with injuries can range from $25,500 to $4,500,000 and the CDC reports that medical costs and productivity losses from crashes are over $99 billion.
The best way to combat dangerous driving habits? Consistent driver coaching. Mangers should ask themselves, “Are my drivers receiving tickets? Speeding? Running stop signs? Veering on the road?” Driver coaching is proven to be the most valuable tool to eliminate these high-liability issues. In fact, a recent Teletrac study* concluded that 40% of drivers change their behavior after their first safety warning.
As a sample technology, Teletrac helps managers track their drivers’ speed and review aggressive driving behaviors, such as speeding, harsh braking, cornering and stop sign violations.
The safety software arms managers with the following powers:
• The ability to view safety data on demand. Managers can quickly measure a fleet’s safety average through the score indicator based on safety parameters, including harsh braking, harsh acceleration, speeding and stopsign violations.
• Staying updated with safety events and averages. Dashboards help log events for each parameter—whether it’s for five speeding events or 138 harsh braking violations per fleet.
The most useful tool? The ability to see the top 10 worst and best drivers in a fleet—including an individual driver safety score—allowing managers to monitor safety performance across their drivers.
Investing in safety data to implement a smart driving policy ensures a company is compliant with the law, eliminates avoidable costs, reduces insurance premiums and decreases the risk of negative publicity for a business. Safety data helps practice good risk management by eliminating question marks every time a driver pulls onto a road with a company’s name on their vehicle.

1401003_DriverBehaviorWhitepaper.R3.2
4
A Look At Driver And Vehicle Behavior Software
MileageProvides the number of miles traveled per state, per vehicle, for a selected date range.
Idle TimeShows an in-depth view of all idle time, organized by location, date and total duration.
How Does Teletrac Measure Driver and Vehicle Behavior?Teletrac’s extensive reporting allows fleet managers to drive their business forward with the power of data. These reports make operational decisions easier through insight on daily driver and vehicle statistics, from information about job performance to fuel use and everything in between. Here’s a look at Teletrac reports that monitor fleet behavior:
Technology Case Study: Teletrac Fleet DirectorThe power to monitor vehicle and driver behavior provides companies with a strong competitive advantage. Teletrac’s GPS fleet tracking goes beyond location tracking to offer businesses measurable data that provides a snapshot of daily vehicle and driver activity. Having access to accurate behavioral data—such as fuel use, productivity levels and safety patterns—allows companies to stay efficient, productive and cost-effective.
To see it live visit www.teletrac.com/demo or call 1.800.TELETRAC.
Vehicle and driver behavior software provides a clean snapshot of all things related to fleet performance, including a close look at fuel consumption and costs, idle time, travel trends and safety activity.

1401003_DriverBehaviorWhitepaper.R3.2
5To see it live visit www.teletrac.com/demo or call 1.800.TELETRAC.
Fuel UseProvides the average speed and fuel used within a selected date range, as well as total distance traveled, idle and PTO time.
MaintenanceProvides a detailed breakdown of engine diagnostic and fault code alerts for a selected date range.
Start Time &End TimeProvides an overview of status changes, including on-duty and off-duty and at lunch or on break.
Driver StopsProvides detail of all stops and distance traveled as well as idle time and travel time between stops with a summary of the stop, idle and travel percentages for any given day.
Time On Lunch& BreakProvides a list of all durations, including time spent at lunch and on breaks during the work day.
Time SpentAt Job SiteProvides data on time spent at both user-defined job sites and additional addresses to help monitor the total time it took to complete a delivery.
How Does Teletrac Measure Driver and Vehicle Behavior?
1401003_DriverBehaviorWhitepaper.R3.2
6
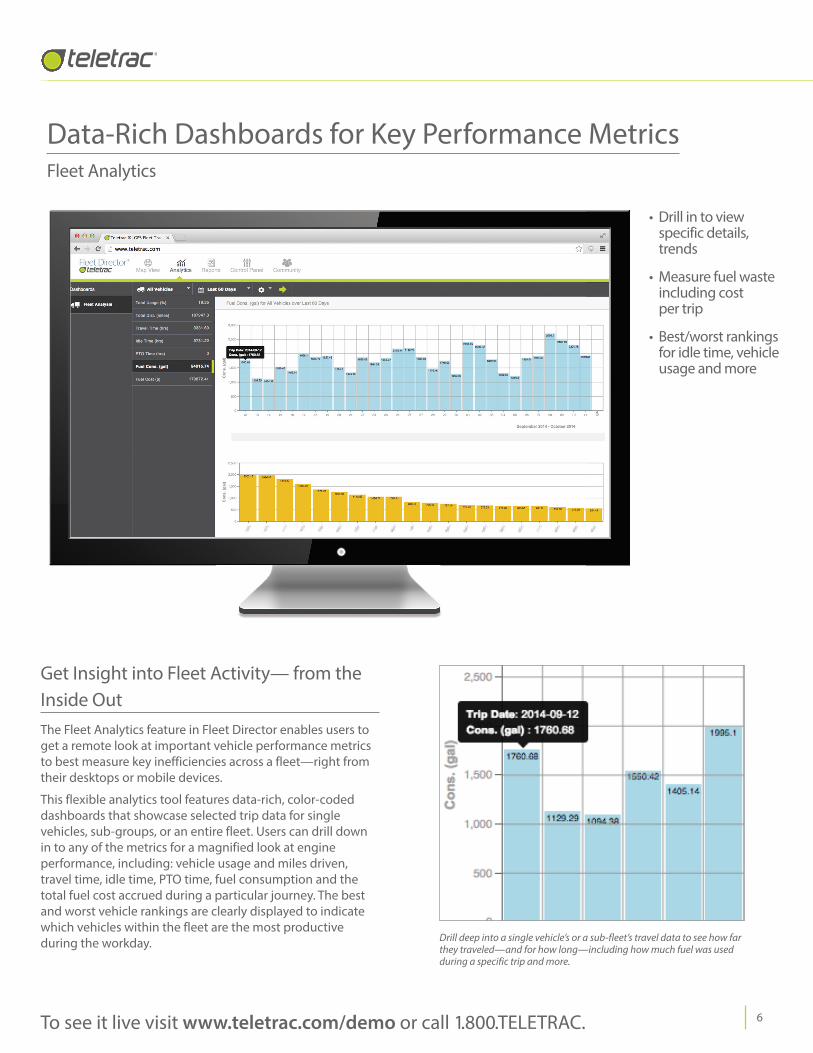
Data-Rich Dashboards for Key Performance MetricsFleet Analytics
Drill deep into a single vehicle’s or a sub-fleet’s travel data to see how far they traveled—and for how long—including how much fuel was used during a specific trip and more.
Get Insight into Fleet Activity— from the Inside OutThe Fleet Analytics feature in Fleet Director enables users to get a remote look at important vehicle performance metrics to best measure key inefficiencies across a fleet—right from their desktops or mobile devices.
This flexible analytics tool features data-rich, color-coded dashboards that showcase selected trip data for single vehicles, sub-groups, or an entire fleet. Users can drill down in to any of the metrics for a magnified look at engine performance, including: vehicle usage and miles driven,travel time, idle time, PTO time, fuel consumption and thetotal fuel cost accrued during a particular journey. The best and worst vehicle rankings are clearly displayed to indicate which vehicles within the fleet are the most productive during the workday.
• Drill in to view specific details, trends
• Measure fuel waste including costper trip
• Best/worst rankings for idle time, vehicle usage and more
To see it live visit www.teletrac.com/demo or call 1.800.TELETRAC.
1401003_DriverBehaviorWhitepaper.R3.2
7
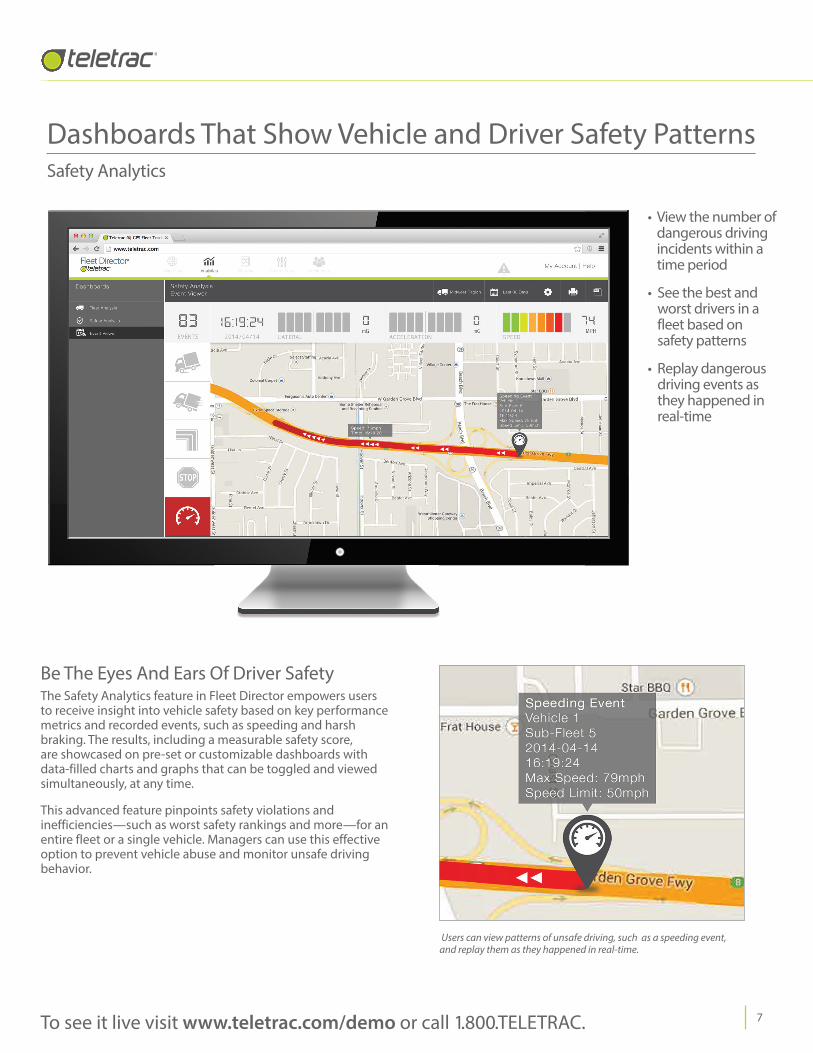
Dashboards That Show Vehicle and Driver Safety PatternsSafety Analytics
Users can view patterns of unsafe driving, such as a speeding event, and replay them as they happened in real-time.
Be The Eyes And Ears Of Driver SafetyThe Safety Analytics feature in Fleet Director empowers users to receive insight into vehicle safety based on key performance metrics and recorded events, such as speeding and harsh braking. The results, including a measurable safety score, are showcased on pre-set or customizable dashboards with data-filled charts and graphs that can be toggled and viewed simultaneously, at any time.
This advanced feature pinpoints safety violations and inefficiencies—such as worst safety rankings and more—for an entire fleet or a single vehicle. Managers can use this effective option to prevent vehicle abuse and monitor unsafe driving behavior.
• View the number of dangerous driving incidents within a time period
• See the best and worst drivers in a fleet based onsafety patterns
• Replay dangerous driving events as they happened in real-time
To see it live visit www.teletrac.com/demo or call 1.800.TELETRAC.