Embed Size (px)
Citation preview
ARTICLE IN PRESS
0961-9534/$ - se
doi:10.1016/j.bi
�CorrespondE-mail addr
Biomass and Bioenergy 31 (2007) 137–144
www.elsevier.com/locate/biombioe
The impact of feedstock cost on technology selection and optimum size
Jay B. Cameron, Amit Kumar, Peter C. Flynn�
Department of Mechanical Engineering, University of Alberta, Edmonton, Alberta, Canada T6G 2G8
Received 3 December 2004; received in revised form 20 June 2006; accepted 15 July 2006
Available online 27 October 2006
Abstract
Development of biomass projects at optimum size and technology enhances the role that biomass can make in mitigating greenhouse
gas. Optimum sized plants can be built when biomass resources are sufficient to meet feedstock demand; examples include wood and
forest harvest residues from extensive forests, and grain straw and corn stover from large agricultural regions. The impact of feedstock
cost on technology selection is evaluated by comparing the cost of power from the gasification and direct combustion of boreal forest
wood chips. Optimum size is a function of plant cost and the distance variable cost (DVC, $ dry tonne�1 km�1) of the biomass fuel;
distance fixed costs (DFC, $ dry tonne�1) such as acquisition, harvesting, loading and unloading do not impact optimum size. At low
values of DVC and DFC, as occur with wood chips sourced from the boreal forest, direct combustion has a lower power cost than
gasification. At higher values of DVC and DFC, gasification has a lower power cost than direct combustion. This crossover in most
economic technology will always arise when a more efficient technology with a higher capital cost per unit of output is compared to a less
efficient technology with a lower capital cost per unit of output. In such cases technology selection cannot be separated from an analysis
of feedstock cost.
r 2006 Elsevier Ltd. All rights reserved.
Keywords: Biomass gasification; Direct combustion; Biomass power economics; Scale factor; Optimum size
1. Introduction
One major source of interest in biomass utilization ismitigation of greenhouse gas (GHG). In this, biomasscompetes with other alternatives, such as wind, solar, andsequestration. If the full potential of biomass to mitigateGHG is to be realized at maximum social benefit, biomassapplications must be developed in their most economicalform.
For a given source of biomass three factors have a strongimpact on the cost of biomass utilization: the end product(e.g. power, heat, ethanol), the technology of conversion,and the scale. In this work we explore the impact offeedstock cost on technology selection and optimum sizewhen a lower efficiency technology with a lower capitalcost per unit of output is compared to a higher efficiencytechnology with a higher capital cost per unit output.Specifically, we look at one end product, electrical power,
e front matter r 2006 Elsevier Ltd. All rights reserved.
ombioe.2006.07.005
ing author. Tel.: +1780 492 6438; fax: +1 780 492 2200.
ess: [email protected] (P.C. Flynn).
and evaluate the impact of feedstock cost on the optimalscale and overall power cost for direct combustion andhigh pressure gasification of boreal forest woodchips.Optimum size is measured by the cost of power, with thesole limitation of maximum size set by electrical gridstability; limitations in biomass feedstock and possiblebyproduct disposition, e.g. heat, are not considered. Thiscase illustrates a generalizable conclusion: if feedstock costis low, the less efficient lower cost process is moreeconomic, and at higher feedstock cost the more efficienthigher cost process is more economic. Further, feedstockcost can be broken down into two components, one thatvaries with transportation distance, which we call distancevariable cost (DVC) and one that is independent oftransportation distance, which we call distance fixed cost(DFC). Cost of transport is the main component of DVC,while harvesting and acquisition (payment to the owner ofthe biomass) and biomass loading and unloading costs arethe main components of DFC. (For a fuller discussion ofDVC and DFC see [1].) Note that both DVC and DFCmay vary over the life of a project. Competition for
ARTICLE IN PRESSJ.B. Cameron et al. / Biomass and Bioenergy 31 (2007) 137–144138
feedstock can raise DFC, while increasing transportationfuel costs can raise DVC. DFC normally has no impact onthe optimum size of a biomass processing plant because itis scale independent. The optimum size for biomassprojects arises from a tradeoff between the capital andoperating cost efficiency of larger plants versus the risingDVC of fuel for such plants [2]. (Note that biomasspower plants are inherently different than most fossil fuelpower plants, for which the DVC of fuel is often less asproject size increases, due to more efficient use of deliveryinfrastructure such as a gas pipeline or coal unit train.) Forbiomass-based plants, because increases in DVC arepartially offset by adjustments in optimum plant size,DVC and DFC have asymmetric impacts on the overallcost of output of an optimally sized biomass processingplant.
Biomass power projects have typically been developed atsmall scale; with the exception of a Finnish plant (nearPietarsaari) with mixed fuel at 240 gross MW (beforeallowing for consumption of power in the generation plantitself) and a US wood plant at 80 net MW [3,4], all arebelow 70MW and many are much smaller. Many authorshave calculated economic optimum sizes that are signifi-cantly larger than 50MW (see, for example [2,5,6]; twostudies have suggested that at certain biomass yielddensities and transportation costs optimum size is in excessof 400MW [5,6]. Three factors have contributed to thesmall size of existing biomass power projects. First,biomass supply is limited in some plants, as often occurswhen using mill residues such as bark or sawdust. Second,many projects are of a demonstration nature for which sizereflects the goal (demonstration rather than economicaloperation) and the uncertainty of technology. Third, manyprojects are supported from public funds, and thelimitation on funding constrains the selection of size.
In this paper we focus on a biomass source for whichavailability is high in comparison to plant size. This is truefor many agricultural residues (e.g. corn stover in the USMidwest, grain straw in parts of Europe and NorthAmerica, and wood and forest harvest residues (limbsand tops of trees harvested for pulp or lumber) in borealforests and other large forested areas). In such areas thecorrect selection of biomass power plant size will have astrong impact on overall cost of power. The analysis in thispaper is based on wood chips but would apply in conceptto any abundant biomass source.
One technology available to the developer of a biomass-based electrical power project is high pressure biomassgasification followed by an integrated combined cycle unitthat combusts the gas in a turbine and recovers heat foradditional power generation in a conventional steam cycle;this is referred to in the literature as BIGCC (see, forexample [6–8]), and in this work will be referred to asgasification. A second option is conventional directcombustion of the biomass in a boiler, utilizing aconventional steam cycle; we refer to this as directcombustion.
This study uses a prior model that studied in detail thecost factors for the collection and transportation of woodchips in western Canada [5]. Note that variable truckingcost, the main component of DVC, is $0.125 dry tonne�1
km�1, which is typical of North American costs (for adetailed discussion of trucking costs for biomass, see [9]).All costs in this work are in year 2004 US dollars.In this study, data for gasification are drawn from
information provided by General Electric Corporation(GE) [10] for plant sizes of 20, 40, 250, and 500MWcapacities. Although high pressure gasification of biomasshas not been commercially developed on a large scale,detailed designs have been completed and all of thecomponents are well known: gasification is a wellestablished technology, and combustion of low heatingvalue gas in turbines is already practiced, for example withcoke oven gas.Data for direct combustion are drawn from three
sources:
�
an analysis of existing units, most of small scale and‘‘first of a kind’’ demonstration units; � a comparison to large coal fired units; � an estimate based on extrapolating differences expectedbetween a mature biomass combustion technology andthe existing mature coal combustion technology, basedon key differences between the processes.
Gasification and direct combustion have differentmaximum sizes of single units. If sufficient fuel wereavailable there is no evident technical reason why directcombustion power plants utilizing biomass could not bedeveloped to 500MW of net output and perhaps higher.The maximum size evaluated in this study, a size frequentlychosen in North America because of grid stability issuesarising from a unit trip. Coal fired direct combustion plantshave been commonly built in this size range, and morerecently have been developed up to sizes of 900–1000MW[11]. This contrasts to gasification processes, wherematerials constraints on turbine size in the combined cycleplant currently limit the maximum size of a single turbineunit firing low heating value gas to 250MW of output [10].Above 250MW, the design would change to two parallelgas fired turbines supplied by two gasifiers, with a commonheat recovery steam generator (HRSG) and steam turbine.Maximum unit size is a critical factor in assessing
relative economics because the economy of scale typicallychanges at the point that a maximum unit size is reached.Scale factor is the most commonly used technique forestimating the impact of size of plant on the cost of a singleprocessing train. Scale factor is the exponent in thecommonly used cost estimating formula
Cost 2=Cost 1 ¼ ðSize 2=Size 1Þðscale factorÞ. (1)
Scale factor for large projects is a matter of somedispute. Jenkins uses a formula that increases the scalefactor with increasing plant size; in his reference case the
ARTICLE IN PRESSJ.B. Cameron et al. / Biomass and Bioenergy 31 (2007) 137–144 139
scale factor is 0.9 at a plant size of 100MW [2]. Larsonet al. [6] use a formula for capital costs that in effectequates to a scale factor near unity at power plant sizes inexcess of 250MW. Both believe that more of the benefit ofscale is realized in the size range up to 250MW thanbetween 250 and 500MW. However, engineering firms thatroutinely build power plants and classical cost estimatinganalysis hold the view that a scale factor of approximately0.7 applies up to and even above 500 plant size for powerplants [12–14]. The behavior of firms that own and operateplants would seem to support this view: coal power plantsare routinely built in the 450–500MW range in NorthAmerica and as large as 1000MW in Japan [11,15,16].
However, scale factor is not valid when the size of aplant increases to point where a second parallel train isrequired. Engineering firms estimate on the basis that asecond identical unit built at the same time and site (i.e. asecond train) costs 95% of the initial unit [12]; this estimateis used in this study.
2. Methodology
In this study we explore scale over the range of verysmall plants to a maximum of 500MW, which is one trainfor direct combustion and two trains for gasification.Actual detailed design data from GE are used to estimategasification capital costs up to 500MW. For directcombustion, we assume a scale factor of 0.75 operatingup to a range of 500MW. Note, however, that feedstockcost will have an impact on technology selection andoptimum size using either approach to scale factor, theselection of a constant value (this study) or a decliningvalue (the approach of Jenkins et al.).
Calculated scale factors from GE data are 0.59 in therange up to 250MW, and 0.89 for 500 vs. 250MW sincepartial paralleling is required above 250MW: two gasifiersand turbines are required in that case. GE cost data did notinclude owners’ costs, site preparation and cooling facil-ities. The Appendix A shows the cost components for sitework and owners’ costs included in this study. Total plantcost per kW at 250 and 500MW are $1532 and $1407,respectively. We used a thermal efficiency for gasificationof 45% on an LHV basis. Boreal forest wood chips have amoisture content of 50%, and the equivalent HHVefficiency is 36.5%.
Table 1
Biomass direct combustion power plant cost based on adjustment from coal p
% of coal plant [17] Coal ($ kW
Boiler 20.2 182
Ash handling 11.2 101
Fuel handling 3.4 30
Other equipment 65.3 589
AFUDCa (4.5% per year) 30
Total plant 100.0 932 [17]
aAllowance for funds used during construction.
We use three approaches to define a range of plantcapital cost estimates for direct combustion of biomass, forwhich the estimated thermal efficiency is 34% on an LHVbasis. First, existing plant data for total plant costs at smallscale (not including the 240MW Finnish plant) areextrapolated to larger scale with a scale factor of 0.75, anapproach taken in an earlier study [5]. Many biomasscombustion plants are demonstration units, ‘‘first of akind’’ in a particular area. The use of these cost figures anda relatively high scale factor gives an estimated plant costof $1,295 kW�1 at a scale of 500MW, which we believe islikely a high estimate for a mature biomass plant.Second, we develop a lower estimate, $932 kW�1 at
500MW, by looking at the total plant cost of a large scalecoal power plant excluding flue gas desulphurization(FGD) [17]. Reported cost figures for the Finnish plant,even adjusted for assumed internal consumption of power,are in this price range; the plant is a mixed heat and powerplant built on an existing industrial site, so exactcomparison to a stand alone pure generation plant isdifficult. Biomass power plants are likely to be more costlythan coal power plants (excluding FGD) because of thelarger volume and lower heating value of biomass relativeto coal, and hence we believe this figure is a lower boundthat biomass power plants are not likely to achieve.Third, we also develop an estimated cost based on
considering the design differences between a large scaleplant using biomass instead of coal, and applying anadjustment to reported values for stand alone coal powerplants. Table 1 shows a breakdown of the total estimatedcost of a power plant using a low sulfur sub-bituminouscoal, the expected differences in scale for biomass vs. coal,and the adjustments to build an estimate for a biomassplant based on a mature coal technology. This gives a valueof $1,124 kW�1 at 500MW. We refer to this third estimateas the ‘‘nth plant’’ estimate, since it is developed incomparison to a mature coal power plant. We believe thata mature biomass combustion technology might reason-ably be expected to achieve this cost.Gasification has a higher capital cost per unit input of
fuel and unit output of power than direct combustion;gasification also has higher efficiency, i.e. more electricalpower is produced per unit input of fuel. At one extreme, ifbiomass delivered to the plant site were free and availablein unlimited supply it would make no economic sense to
lant cost
�1) Size adjustment for biomass Nth plant ($ kW�1)
3� larger 415
15� smaller 13
3� larger 69
Same 589
38
1124

ARTICLE IN PRESSJ.B. Cameron et al. / Biomass and Bioenergy 31 (2007) 137–144140
spend the premium on gasification; the economicallypreferred choice would be a direct combustion plantproducing the same amount of power from a largeramount of free fuel. At the other extreme, if the deliveredcost of biomass were very high then the efficiency gain thatallowed the use of less biomass for a given electrical outputwould be favored economically.
In this work we systematically explore the impact ofDVC on optimum size for gasification and direct combus-tion of boreal forest wood chips, and then identify thecombination of DVC and DFC that determines wheregasification is economically favored over direct combustionfor an optimally sized plant. We do this by adjusting thebiomass yield in dry tonnes per gross (total) hectare of landto manipulate the DVC of delivered biomass fuel, and theacquisition payment to the owner of the biomass tomanipulate the DFC. These figures are input to a detailedcost model for biomass power described in Kumar et al. [5].Calculated power cost includes fuel cost, operatingcost and capital recovery with a pre-tax return on capitalof 10%.
0
100
200
300
400
500
600
0.01 0.1 1 10 100
Yield (dry tonnes gross ha-1)
Op
tim
um
Pla
nt
Siz
e
(MW
, cap
ped
at
500)
BIGCC Direct Combustion
Fig. 1. Optimum plant size as a function of biomass yield.
0
100
200
300
400
500
600
0 25
Distance Variable C
Op
tim
um
Pla
nt
Siz
e (M
W)
BIGCC
2.0 tonnesgross ha-1 0.75 tonnes gro
0.25 tonnes gross ha-1
Fig. 2. Optimum plant size as a function of
3. Results
For each assumed yield of boreal forest wood chipbiomass, there is a unique optimum size. Fig. 1 shows theoptimum plant size as a function of yield over a range offour orders of magnitude; values for direct combustion arebased on the ‘‘nth plant’’ cost estimate. As yield increasesbiomass haul distances decrease, and optimum plant sizeincreases. For gasification, this increase is smooth until theconstraint of maximum unit size of 250MW is reached, atwhich point there a large range of yields for which 250MWremains the optimum size. Finally, as yield increases evenmore, there is a jump to an optimum of two gasifiers andturbine units (500MW). Note that two units at a size lessthan 250MW are not optimal at any yield. Note that atvery low yields the optimum plant size is larger forgasification than for direct combustion; in effect, the scalefactor benefit for a higher capital intensity justifies drawingbiomass from a larger area.Fig. 2 shows optimum size as a function of DVC; in this
case, there are some values of DVC for which there are twooptimum sizes. The dashed lines in Fig. 2 are lines ofconstant yield. For DVC above $33 dry tonne�1, theoptimum size of plant is larger for gasification than directcombustion at any given yield, for the reason notedabove. However, for DVC values between $20 and$33 dry tonne�1, the optimum gasification plant is smallerthan the optimum direct combustion plant because thegasification scale factor has changed. The shift from onetrain to two trains for gasification removes much ofthe incremental economy of scale for gasification, while thedirect combustion plant still has the economy of scaleassociated with a single train. When optimum plant sizejumps from one unit to two, as occurs for gasification,DVC increases because of the increased haul distancesneeded to supply the larger plant.Fig. 3 shows three planes: the total cost of power at
optimum plant size from direct combustion (based on thenth plant cost estimate) and from gasification in a oneturbine (capacity 250MW or less) and two turbine 500MW
50 75 100
ost (US$ dry tonne-1)
Direct Combustion
0.03 tonnes gross ha-1
0.12 tonnesgross ha-1
ss ha-1
biomass distance variable cost (DVC).
ARTICLE IN PRESS
Fig. 3. Power cost at optimum size for direct combustion and gasification in a one and two train plant of biomass as a function of distance variable and
fixed fuel cost.
J.B. Cameron et al. / Biomass and Bioenergy 31 (2007) 137–144 141
plant. The cost is a function of both the distance variableand distance-fixed biomass fuel costs. Note that as DVCincreases optimum plant size is decreasing, while along theDVC axis there is no change in optimum plant size. Powercost rises linearly with any increase in DFC; it rises morerapidly with an increase in DVC, since the optimum plantsize is decreasing as DFC increases, and capital efficiency isbeing lost as well. The inflection points in Fig. 3 showwhere increasing DVC reduces optimum size.
Several observations can be made from Fig. 3. The rise inpower cost as DVC and DFC increase is lower forgasification than for direct combustion; this occurs becauseof the higher efficiency of gasification. However, at lowerbiomass fuel costs direct combustion gains over gasificationfrom two factors. First, the higher efficiency of gasificationsaves little because the fuel is worth little. Second, once theoptimum size of gasification reaches 250MW there is along plateau in which no incremental capital economy ofscale is realized until two trains are justified; this plateau isnot reached until 500MW or higher for direct combustion.When gasification shifts from an optimum size of250–500MW, the reduction in capital cost per unit outputis relatively small, 7%, because a second train is beingadded. Fig. 3 illustrates that there is a region of low fuelcost where direct combustion is more economical thangasification.
The region in which single train gasification is lesseconomic than direct combustion is not symmetric: agreater increase in DFC can be accommodated with directcombustion remaining economically favored because itdoes not change optimum plant size, whereas any change inDVC is also causing a change in optimum plant size.
Consider a DFC of zero: DVC has the impact of reducingthe optimum size of a direct combustion in the region from$23 to $62 dry tonne�1 but the economically favored size ofa gasification plant remains at 250MW. For directcombustion, an increase in DVC causes a greater increasein power cost than a corresponding increase in DFC, whilefor gasification, in this range, the impact of an increase inDVC and DFC is identical. This asymmetry, in which anincrease in DVC more quickly shifts the balance in favor ofgasification than DFC, occurs when the scale of onetechnology is changing but the scale of the other is not. Itdoes not occur initially for a two train gasifier vs. a500MW biomass fired direct combustion plant becauseinitially the increase in DVC does not cause the optimumsize of plant to change for either technology, which can beobserved by inspection of Fig. 3: initially, the plant size foreach technology is 500MW as DVC increases, up to avalue of DVC of $23 dry tonne�1. Above this value of DVCoptimum plant size drops, associated with the inflectionpoint, reducing capital efficiency.For reference, the estimated cost of power from a new
450MW mine-mouth coal fired plant in western Canada isabout $35 to $40MWh�1; one such plant using super-critical direct combustion technology has been recentlycommissioned in the Province of Alberta.Four values of fuel are illustrated by vertical lines in
Fig. 3 for the two technologies: mill residues, and westernCanadian values for wood chips from harvesting thewhole boreal forest, wood chips from boreal forest har-vest residues (limbs and tops of trees harvested for pulpand lumber), and straw from wheat and barley [5]. (Costsin this study were developed for wood chips, but
ARTICLE IN PRESSJ.B. Cameron et al. / Biomass and Bioenergy 31 (2007) 137–144142
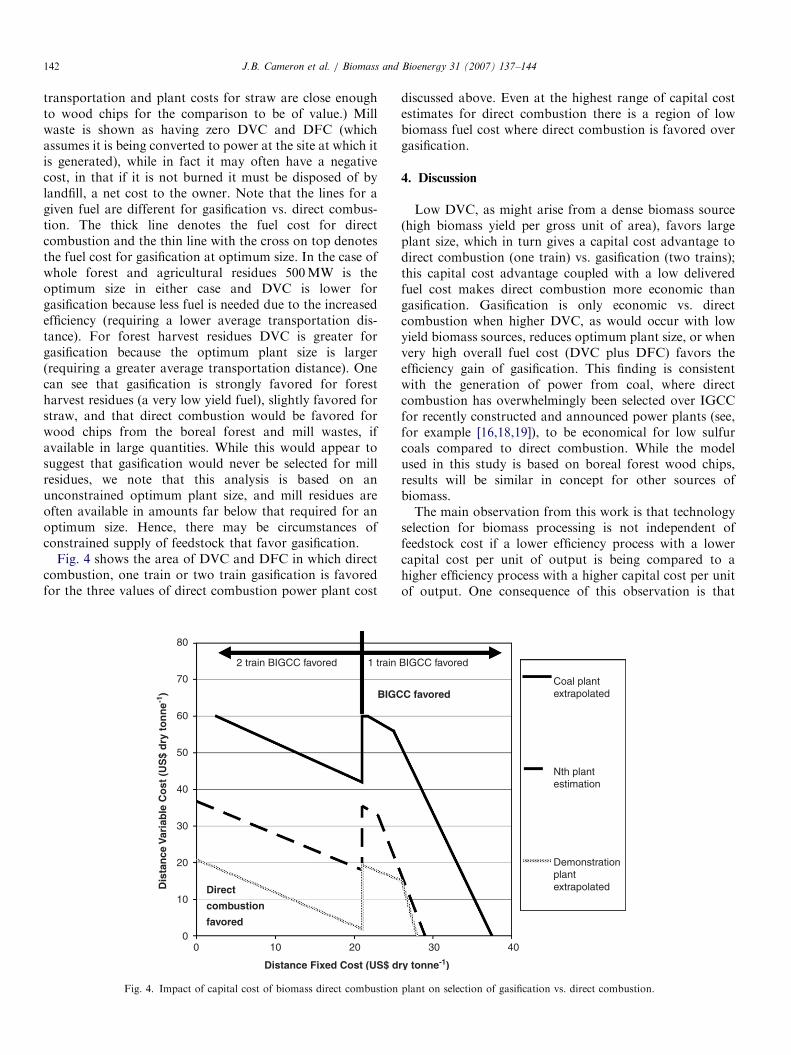
transportation and plant costs for straw are close enoughto wood chips for the comparison to be of value.) Millwaste is shown as having zero DVC and DFC (whichassumes it is being converted to power at the site at which itis generated), while in fact it may often have a negativecost, in that if it is not burned it must be disposed of bylandfill, a net cost to the owner. Note that the lines for agiven fuel are different for gasification vs. direct combus-tion. The thick line denotes the fuel cost for directcombustion and the thin line with the cross on top denotesthe fuel cost for gasification at optimum size. In the case ofwhole forest and agricultural residues 500MW is theoptimum size in either case and DVC is lower forgasification because less fuel is needed due to the increasedefficiency (requiring a lower average transportation dis-tance). For forest harvest residues DVC is greater forgasification because the optimum plant size is larger(requiring a greater average transportation distance). Onecan see that gasification is strongly favored for forestharvest residues (a very low yield fuel), slightly favored forstraw, and that direct combustion would be favored forwood chips from the boreal forest and mill wastes, ifavailable in large quantities. While this would appear tosuggest that gasification would never be selected for millresidues, we note that this analysis is based on anunconstrained optimum plant size, and mill residues areoften available in amounts far below that required for anoptimum size. Hence, there may be circumstances ofconstrained supply of feedstock that favor gasification.
Fig. 4 shows the area of DVC and DFC in which directcombustion, one train or two train gasification is favoredfor the three values of direct combustion power plant cost
0
10
20
30
40
50
60
70
80
0 2010
Distance Fixed Cost (US$ d
2 train BIGCC favored 1 train
Dis
tan
ce V
aria
ble
Co
st (
US
$ d
ry t
on
ne-1
) BIGC
Direct
combustion
favored
Fig. 4. Impact of capital cost of biomass direct combustion
discussed above. Even at the highest range of capital costestimates for direct combustion there is a region of lowbiomass fuel cost where direct combustion is favored overgasification.
4. Discussion
Low DVC, as might arise from a dense biomass source(high biomass yield per gross unit of area), favors largeplant size, which in turn gives a capital cost advantage todirect combustion (one train) vs. gasification (two trains);this capital cost advantage coupled with a low deliveredfuel cost makes direct combustion more economic thangasification. Gasification is only economic vs. directcombustion when higher DVC, as would occur with lowyield biomass sources, reduces optimum plant size, or whenvery high overall fuel cost (DVC plus DFC) favors theefficiency gain of gasification. This finding is consistentwith the generation of power from coal, where directcombustion has overwhelmingly been selected over IGCCfor recently constructed and announced power plants (see,for example [16,18,19]), to be economical for low sulfurcoals compared to direct combustion. While the modelused in this study is based on boreal forest wood chips,results will be similar in concept for other sources ofbiomass.The main observation from this work is that technology
selection for biomass processing is not independent offeedstock cost if a lower efficiency process with a lowercapital cost per unit of output is being compared to ahigher efficiency process with a higher capital cost per unitof output. One consequence of this observation is that
4030
ry tonne-1)
Coal plantextrapolated
Nth plantestimation
Demonstrationplantextrapolated
BIGCC favored
C favored
plant on selection of gasification vs. direct combustion.
ARTICLE IN PRESSJ.B. Cameron et al. / Biomass and Bioenergy 31 (2007) 137–144 143
research programs that develop technology in isolationfrom feedstock cost analysis or that set feedstock costobjectives without regard to processing technology run therisk of selecting sub-optimal processing technology. Whilelow feedstock cost is always a worthwhile objective, theefficiency and cost of conversion have a significant impacton what is an affordable limit on delivered cost of biomass.
The specific cost model used in this study is based onboreal forest wood chips in western Canada. There aredifferences in biomass properties that will be reflected indifferences in capital cost; for example, straw has a higheralkali halide and silica content than wood, and one canexpect a more expensive boiler design. Turbine design forBIGCC continues to evolve. Hence, the analysis in thisstudy will need to be updated as technological evolutionand more accurate cost information emerge. However,unless there is a major breakthrough one can still expectthat direct combustion will be more economical for lowcost fuels, since the capital cost for gasification pluscombustion in a turbine plus heat recovery and a secondarysteam cycle can be expected to be higher than simple directcombustion and a conventional steam cycle. Note thatreported cost figures for the one large scale plant designedto process biomass or coal are comparable to the lowestrange of cost estimates for direct combustion used in thisstudy. Hence the general conclusion that there is a regionof fuel cost in which direct combustion is favored will likelyremain valid. This is different than the conclusion of
Table A1
Capital cost w/o site work and owners cost Value ($ kW�1)
250MW 1350.00
500MW 1250.00
Site work for 500 MW plant
Cooling tower for 500MW IGCC 17.98
Area clear and grub 19.20
Area cut and fill 22.40
Security fencing 1.10
Materials—office building 0.72
Materials—warehouse building 1.55
Materials—maintenance building 0.91
Labor—office building 1.38
Labor—warehouse building 2.34
Labor—maintenance building 1.49
Subcontract asphalt paving 0.07
Subtotal at 500MW 1319.13
Owners cost for 500MW plant
Insurance at1% 13.19
Camp cost at 500MW 29.84
Cap cost at 500MW 1332.33
AFUDC 45.00
Total installed cost at 500MW 1407.13
Total installed cost at 250MW 1532.41
previous studies that gasification of biomass was alwaysmore economical than direct combustion [6,20]. One canidentify regions of fuel cost in which gasification is moreeconomic than direct combustion, but we note that theseregions have a relatively high corresponding power cost.This research has focused on biomass sources that are
available in abundance relative to the size of a singleprocessing plant. We note that the general conclusion forsuch sources, i.e. that gasification is only economic athigher fuel costs, may not apply when the supply ofbiomass is constrained. In this case, highly specific projectfactors must be considered in an economic evaluation.
5. Conclusions
Delivered fuel cost to a biomass plant can be broken intotwo components, DVC that is dependent on distance (andhence on plant scale) and DFC that is independent ofdistance and plant scale. Power cost from direct combus-tion or high pressure gasification of boreal forest woodchips is affected differently by DVC and DFC. At lowvalues of DVC and DFC direct combustion is favored overgasification, because the higher capital cost paid for thehigher efficiency of gasification is not justified in savingsdue to the low fuel cost. At high values of DVC and DFCthe high fuel cost more than justifies the extra capitalinvestment in gasification. An increase in DVC morequickly shifts the balance from direct combustion to
Inputs Source
— [10]
— [10]
Cnd $12M at 500MW [13]
1280 acres, $125 h�1 (person plus
equipment)
[21]
1280 acres, $125 h�1 (person plus
equipment)
[21]
6miles [21]
10,000 sq. ft. [21]
30,000 sq. ft. [21]
15,000 sq. ft. [21]
10,000 sq. ft., $30 h�1 [21]
15,000 sq. ft., $30 h�1 [21]
10,000 sq. ft., $30 h�1 [21]
3000 sq. yards [21]
[5]
18 months construction, 6% interest rate,
assumed capital spending profile
$1350+(site work and owners costs for
500MW scaled back to 250MW using a
scale factor of 0.75)
ARTICLE IN PRESSJ.B. Cameron et al. / Biomass and Bioenergy 31 (2007) 137–144144
gasification because it reduces the optimum size of directcombustion plant more than for gasification. These resultscan be extrapolated to any biomass fuel which is availablein sufficient abundance to support an optimum-sized plant,for example straw and corn stover in regions where thesecrops are widespread, and will be observed when atechnology with lower efficiency and lower cost per unitof output is compared to a more efficient technology with ahigher cost per unit of output.
Acknowledgements
The authors gratefully acknowledge the AMEC Cor-poration, Epcor, the Poole Family and Bud Kushnir,whose financial support has made this research possible.Numerous individuals in Epcor provided valuable insightinto the generation of power from coal. David Williams,Chief Estimator for Bantrel Corporation (an affiliate ofBechtel), and Wayne Silsbe, an estimator with AMECCorporation, provided valuable comments re-capital costestimating. Numerous individuals at NREL providedvaluable comments on gasification, as did Norm Shillingof the General Electric Corporation. However, all conclu-sions and opinions are solely the authors, and have notbeen reviewed or endorsed by any other party.
Appendix A. Components of site works and owner’s costs for
gasification
Table A1
References
[1] Mahmudi H, Flynn PC. Rail vs. truck transport of biomass. Applied
Biochemistry and Biotechnology 2006;129(1–3):88–103.
[2] Jenkins BM. A comment on the optimal sizing of a biomass
utilization facility under constant and variable cost scaling. Biomass
and Bioenergy 1997;13(1/2):1–9.
[3] Organisation for the Promotion of Energy Technologies, Finland
(OPET). The world’s largest biofuel CHP plant Alholmens Kraft,
Pietarsaari, May 2002. Available at: /http://www.tekes.fi/opet/pdf/
Alholma_2002.pdfS (accessed on June 19, 2006).
[4] Wiltsee G. Lessons learned from existing biomass power plants.
National Renewable Energy Laboratory Report No. NREL/SR-570-
26946, 2000.
[5] Kumar A, Cameron JB, Flynn PC. Biomass power cost and optimum
plant size in western Canada. Biomass and Bioenergy 2003;24:445–64.
[6] Larson ED, Marrison CI. Economic scales for first-generation
biomass-gasifier/gas turbine combined cycles fueled from energy
plantations. Journal of Engineering for Gas Turbines and Power
1997;119:285–90.
[7] Craig KR, Mann MK. Cost and performance analysis of three
integrated gasification combined cycle power systems, National
Renewable Energy Technology, 1997. URL: /http://www.eere.
energy.gov/biopower/bplib/library/li_snowpapr.htmS[8] Blackadder WH, Lundberg H, Rensfelt E, Waldheim L. Heat and
power production via gasification in the range 5–50MWe. In: Bridg-
water AV, editor. Advances in Thermochemical Biomass Conversion.
London: Blackie Academic & Professional; 1994. p. 449–75.
[9] Kumar A, Cameron JB, Flynn PC. Pipeline transport and
simultaneous saccharification of corn stover. Bioresource Technology
2005;96(7):819–29.
[10] Shilling NZ. Personal communication. Leader—Process Power
Plants, Energy Products. USA: General Electric; 2004.
[11] Electric Power Development Company Limited. Tachibana-
wan Power Station, December 15, 2000. Available at: /http://www.
jpower.co.jp/english/news_release/news/news126.pdfS (accessed on
June 19, 2006).
[12] Williams D. Personal communication. Chief estimator for Bantrel
Corporation (an affiliate of Bechtel), Alberta, Canada, 2002.
[13] Silsbe W. Personal communication. An estimator for AMEC
Corporation, Alberta, Canada, 2002.
[14] Park WR. Cost engineering analysis: a guide to economic evaluation
of engineering projects, 2nd edition. New York, USA: Wiley-
Interscience Publication; 1984.
[15] ICE Coalition questions ‘clean coal technology’ proposed for two
Southwest Indiana merchant plants, granted intervenor status.
Available at: /http://www.citact.org/enviropower.htmlS (accessed
on June 19, 2006).
[16] EPCOR. Genesee 3—Canada’s first supercritical coal-fired unit.
Available at: /http://www.epcor.ca/Communities/Alberta/Operations/
PowerGeneration/Genesee/G3Initiative/S (accessed on June 19, 2006).
[17] Bohachuk M. Personal Communication. Director of project manage-
ment. Edmonton, Alberta, Canada: EPCOR Generation INC; 2004.
[18] Transalta. Transalta Keephills 3 project. Available at: /http://www.
transalta.com/Website2001/tawebsite.nsf/9601eeb83bcdb335872568dc
0062d915/72fae6332f5752208725716200092a46/$FILE/TA%20Keephills%
203%20booklet%20May%202006.pdfS (accessed on June 19, 2006).
[19] National Energy Technology Laboratory (NETL), US. Tracking new
coal-fired power plants. Available at: /http://www.netl.doe.gov/coal/
refshelf/ncp.pdfS (accessed on June 19, 2006).
[20] Craig KR, Bain RL, Overend RP. Biomass power systems—where
are we, where are we going, and how do we get there? The role of
gasification. EPRI Conference on New Power Generation Technol-
ogy, San Francisco, California, 1995.
[21] Page JS. Conceptual cost estimating manual, 2nd edition. Houston,
Texas: Gulf Publishing Company; 1996.