Embed Size (px)
Citation preview
The Impact of Economics Blogs*
David McKenzie, World Bank, BREAD, CEPR and IZA
Berk Özler, World Bank
Extract: PART I – DISSEMINATION EFFECT
Abstract
There is a proliferation of economics blogs, with increasing numbers of famous and not-so-famous
economists devoting a significant amount of time to writing blog entries, and in some cases, attracting
large numbers of readers. Yet little is known about the impact of this new medium. We utilize event
study analysis, regression, original survey evidence, and a randomized experiment to measure several
key impacts of blogs. Strong results are found in terms of dissemination of research, with blog postings
causing a large increase in the number of abstract views and downloads of linked papers. XXX
Keywords: Blog; Dissemination; Influence; Impact Evaluation.
JEL codes: A11, A23, O12, C93.
* The authors thank Irem Yoruk, Matthew Groh and Gustavo Andrade for excellent research assistance; Jed Friedman and Markus Goldstein for their collaboration on the Development Impact blog; Innovations for Poverty Action for their assistance in conducting the survey; and all the individuals who took time to participate in this survey. All views expressed are those of the authors only.
2. Event Study Analysis of Dissemination Impact
One of the main purposes of economics blogs is to help better disseminate economic ideas and research
- both to other economists and to the broader public. Some of this effort is very hard to measure the
impact of – for example, many economics blogs have devoted considerable space to discussing public
policy issues in the U.S. such as different plans for dealing with budget deficits, but it is difficult to assess
how much any one particular blog post has influenced this debate. However, one area of research
dissemination that is potentially important and can be measured is whether blogging about a research
paper leads to more people looking at that research.
The typical economics working paper gets very few readers, especially after its first couple of months.
For example, a random sample of papers released in the NBER working paper series in January 2010
shows that the median paper in this prestigious series received 21 abstract views and 12 downloads
through Repec services in the first two months, and then an average of 6-7 abstract views and 2-3
downloads per month through Repec over the next year. Given these low readership levels, blog posts
which draw attention to such research can potentially have large relative impacts on readership.
2.1 Descriptive Figures
Several economics blogs regularly link to working papers. However, two issues arise in trying to measure
the impact of this on downloads. First, many of these links are to the webpages of the individual authors
or to working paper series for which download statistics are not publicly available. To resolve this, we
restrict our analysis to blog posts which link directly to papers in the Repec – the largest database of
economics papers. Monthly abstract views and download statistics are publicly available from this site.
The second issue is that, in some cases, papers are linked to when they are first released in a working
paper series. It is harder to form a counterfactual in these cases, since there are often several avenues
of dissemination when papers are first released which might also drive download statistics, and
heterogeneity in topics amongst papers would make comparison to other papers in the same series or
by the same author not necessarily a good counterfactual.
We therefore focus on blog postings to papers which have been out several months at the time of a blog
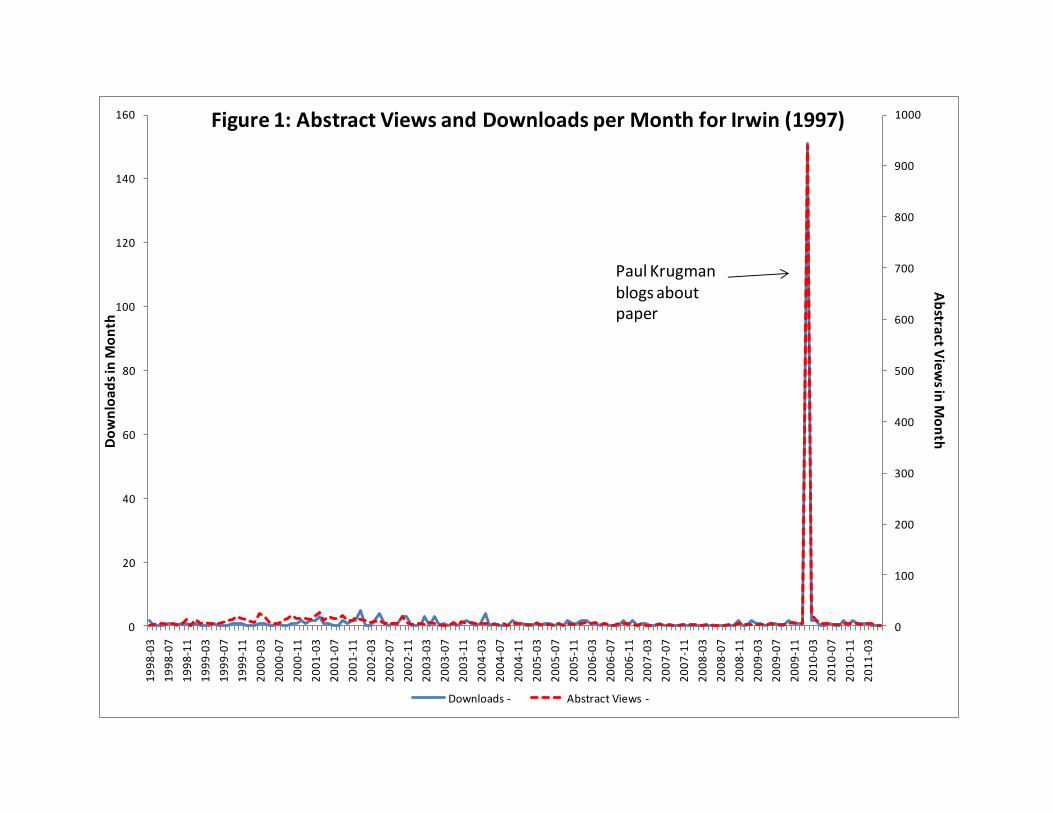
posting, and which are listed in Repec. Figure 1 then provides a particularly striking illustration of the
phenomenon we wish to measure. Irwin (1997) received an average of 3.4 abstract views and 0.8
downloads per month from the NBER working paper series during 2009. Then on February 16, 2010,
Paul Krugman blogged about the paper on his Conscience of a Liberal blog, resulting in 940 abstract
views and 151 downloads in February 2010.1 The paper then went back to averaging 0.8 downloads a
month and 5.3 abstract views a month from April 2010 through March 2011.
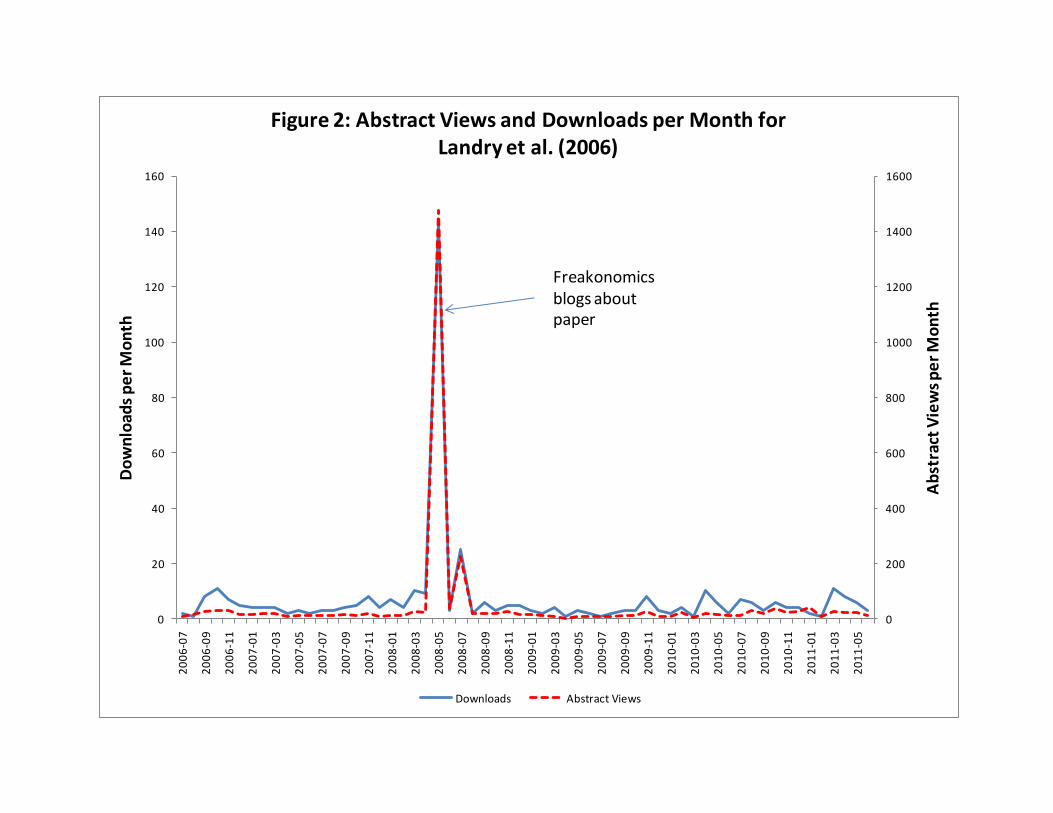
Similar patterns occur for other blogs. Figure 2 gives the example of Landry et al. (2006), which was
averaging 14.4 abstract views and 5.2 downloads per month in the year before Freakonomics blogged
about the paper, and then had 1478 abstract views and 144 downloads in the month it was blogged
1 The paper is in the NBER working paper series, which is gated (requiring payment) to readers from institutions which do not subscribe to the NBER series, limiting downloads.
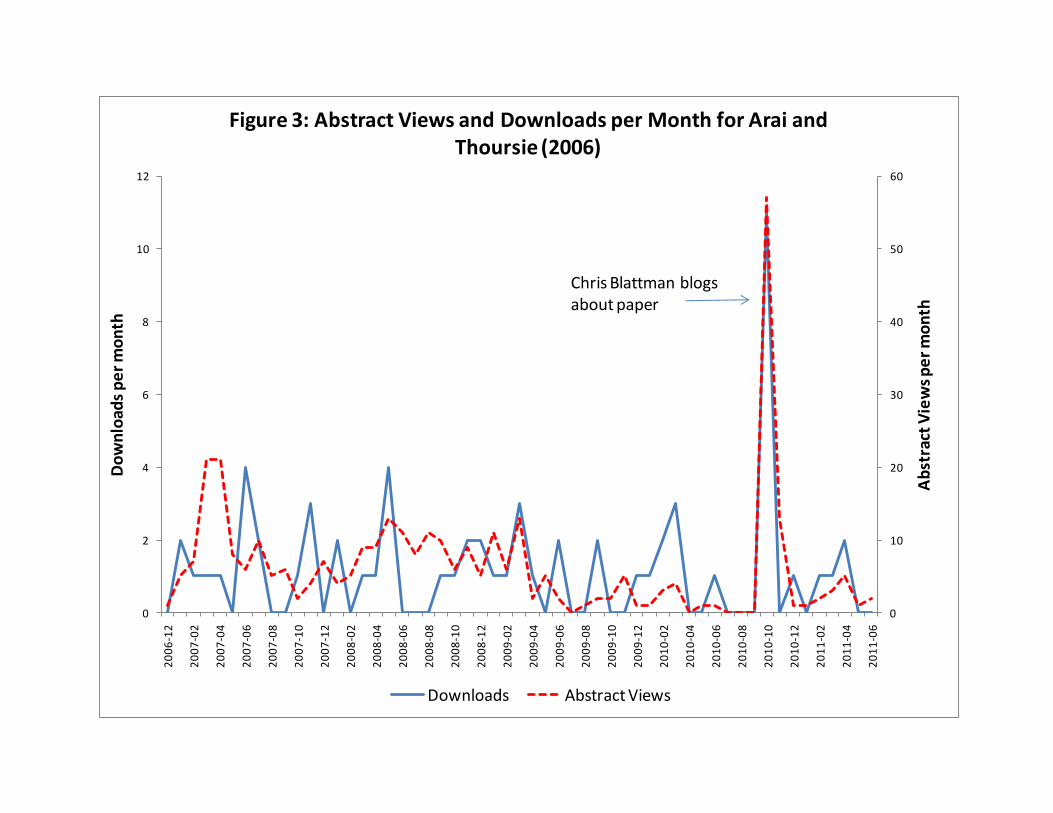
about. Figure 3 shows abstract views and download statistics for Arai and Thoursie (2006), which
averaged only 1.5 abstract views and 0.67 downloads per month in the year before Chris Blattman
blogged about the paper, then had 57 abstract views and 11 downloads in the month the paper was
blogged about.
2.2 Formal Estimation
We systematically searched the posts of eight popular economics blogs: Freakonomics, Marginal
Revolution, Greg Mankiw, Paul Krugman, The New York Times’ Economix blog, Dani Rodrik, Chris
Blattman and Aid Watch for links to research papers in Repec.2 This resulted in a database of 94
research papers that were referenced with a link to the Repec version and which had been out for at
least three months before being blogged about. We use this database to formally test for whether
blogging about a paper increases its abstract views and downloads through event study analysis.
The Repec statistics are available at a monthly frequency, and so for each paper i which is blogged
about, we define t=0 in the month in which the blog entry occurred, t=-1 in the month before, t=+1 in
the month after, etc. Then we estimate the impact of blog s blogging about a paper via the following
regression:
(1)
Where Blogi,t is a dummy variable which takes value one if the paper is blogged about in time period t, βs
is our coefficient of interest, measuring the increase in abstract views in the month of blog s blogging
compared to the paper-specific average, and γs allows for a one-month lagged effect which may arise
particularly for blog posts towards the end of the month. We include paper-specific fixed effects (αi) and
cluster the standard errors at the paper level. The corresponding equation is likewise estimated for
paper downloads.
Equation (1) is known as the constant mean model in event study analysis (Campbell et al, 1997). A first
threat to this assumption is if abstract views or downloads are trending over time. Paper view statistics
appear to trend downwards over the first couple of months of release of the typical paper, but
otherwise seem reasonably stable. Excluding access statistics for papers which are blogged about in the
first two months after release therefore should alleviate this concern. Nevertheless, for robustness we
also re-estimate equation (1) after adding paper-specific linear time trends.
A second concern is that of reverse causation, with bloggers blogging about a paper because people
have suddenly started downloading it and talking about it. The inclusion of the lead term
allows us to test whether , and thereby rule out the case that a paper which attracts a lot of
attention in month t gets blogged about in month t+1. A related concern is that a particular paper
attracts a lot of attention for some unrelated reason in month t, resulting in a simultaneous increase in
interest in the paper and in blog entries about the paper. If this were the case, we should see the same
2 There were no links to Repec papers on Greg Mankiw’s or Dani Rodrik’s blogs. The search was done just for links directly to the papers on the Repec website – so links directly to working paper series that did not contain a reference to Repec are not included.
paper being blogged about on multiple blogs. There are two occasions where this occurred in our
sample of blogs. The first is multiple blog entries pointing to Mortensen and Pissarides (1994) in October
2010, when they were awarded the Nobel Prize. The second case is Rockey (2009), which was blogged
about by Marginal Revolution on June 26, 2010, and then picked up (with acknowledgement to Marginal
Revolution) in a blog post on July 8, 2010. We exclude the first case, and code the second case as having
been blogged about in both June and July 2010.
In our baseline specification we estimate equation (1) using monthly data within up to 2 years on either
side of the blogging month. We then examine robustness by narrowing the window to ±1 year and to ±6
months.
2.3. Results
Table 1 shows the results of estimating equation (1). We see large and significant impacts of blogging on
both paper abstract views and paper downloads in the month in which the paper is blogged about.
There are also some significant, but smaller, impacts on these access statistics in the month after the
paper is blogged about. The lead terms are all small, and in all but one case, insignificant.3 These
statistical results are therefore consistent with the graphical illustrations seen in Figures 1-3, and show a
big spike in abstract views and downloads in the month that the paper is blogged about.
To place the impacts in perspective, it is useful to first compare them to the download and abstract
numbers for an average NBER working paper: 10.3 abstract views per month and 4.2 downloads per
month from Repec in months 3-14 after release. A blog post on Chris Blattman or Aid Watch is thus
equivalent to an extra 7-9 months of abstract views, and 4-6 months of downloads. The impacts of
Freakonomics, Marginal Revolution and Paul Krugman are even larger – with the abstract view impact of
300-470 equivalent to 3 or more years of regular views, and the download impact of 33-100 downloads
equivalent to 8 months to 2 years of regular downloads.
Exact and consistent data across all the blogs in our list are not available, but the data which are
available suggest that the most-read blogs have significantly lower click-through rates than the more
research-focused niche blogs. Marginal Revolution and Freakonomics are both estimated to have
approximately 35,000-40,000 page views and 25,000 unique visits per day. This suggests a click-through
rate of only 1-2 percent for abstract reads, and 0.1-0.4 percent for downloads. Chris Blattman’s blog is
estimated to have approximately 2,200 page views per day, suggesting a click-through rate of 4.3
percent for abstract reads and 1.1 percent for downloads.4 This seems consistent with the intuition that
as an academic’s blog expands readership to a larger and larger audience, the additional readers are less
likely to be interested in the academic papers.
3 The exception is on downloads for Freakonomics, and arises from the case mentioned in which it blogged about a paper the month after Marginal Revolution had. Excluding this paper reduces the Freakonomics lead term download coefficient to 2.5 with p=0.17 in column 5. 4 Blog traffic statistics from http://www.gongol.com/lists/bizeconsites/ [accessed March 2011 rankings on July 28, 2011]; Marginal Revolution and Freakonomics traffic data from SiteMeter; and www.websitevalue.us. Chris Blattman traffic statistics based on a blog posting in which he said he had 800,000 page views in 2010.
Finally, we should note that the estimates in Table 1 show the average impacts of being linked to by
these blogs. In practice, there appears to be considerable heterogeneity in the spike in blog traffic
caused by a particular blog. For example, just taking the difference in abstract views in the month
blogged about compared to the mean abstract views over the months before the paper was blogged
about gives a range of +33 to +2908 over the 31 papers linked by Marginal Revolution in our sample
(25th percentile to 75th percentile range is 69 to 314). It is likely the size of the increase reflects a
combination of the interest in the topic to the general blog reader, and the manner in which the blog
links to the paper (e.g. full post about a paper vs single line link, positive, neutral or negative link, etc.).
Unfortunately there are insufficient data in our sample to explore this more systematically.
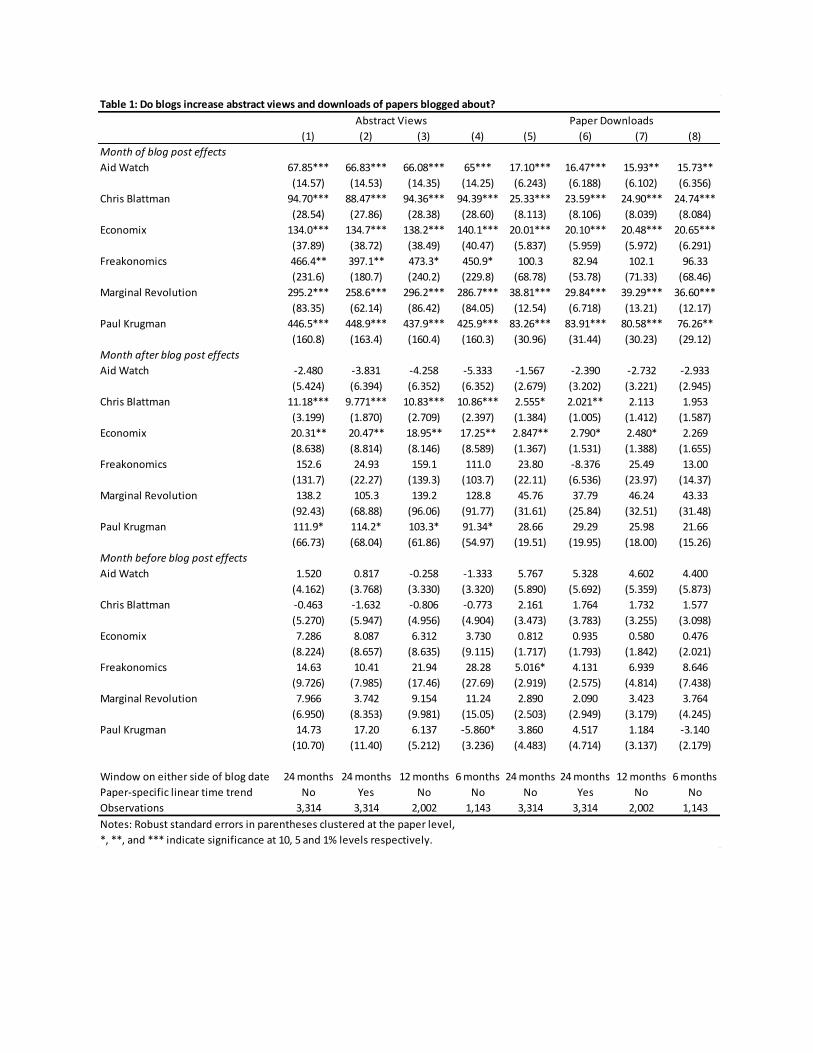
Table 1: Do blogs increase abstract views and downloads of papers blogged about?
(1) (2) (3) (4) (5) (6) (7) (8)
Month of blog post effects
Aid Watch 67.85*** 66.83*** 66.08*** 65*** 17.10*** 16.47*** 15.93** 15.73**
(14.57) (14.53) (14.35) (14.25) (6.243) (6.188) (6.102) (6.356)
Chris Blattman 94.70*** 88.47*** 94.36*** 94.39*** 25.33*** 23.59*** 24.90*** 24.74***
(28.54) (27.86) (28.38) (28.60) (8.113) (8.106) (8.039) (8.084)
Economix 134.0*** 134.7*** 138.2*** 140.1*** 20.01*** 20.10*** 20.48*** 20.65***
(37.89) (38.72) (38.49) (40.47) (5.837) (5.959) (5.972) (6.291)
Freakonomics 466.4** 397.1** 473.3* 450.9* 100.3 82.94 102.1 96.33
(231.6) (180.7) (240.2) (229.8) (68.78) (53.78) (71.33) (68.46)
Marginal Revolution 295.2*** 258.6*** 296.2*** 286.7*** 38.81*** 29.84*** 39.29*** 36.60***
(83.35) (62.14) (86.42) (84.05) (12.54) (6.718) (13.21) (12.17)
Paul Krugman 446.5*** 448.9*** 437.9*** 425.9*** 83.26*** 83.91*** 80.58*** 76.26**
(160.8) (163.4) (160.4) (160.3) (30.96) (31.44) (30.23) (29.12)
Month after blog post effects
Aid Watch -2.480 -3.831 -4.258 -5.333 -1.567 -2.390 -2.732 -2.933
(5.424) (6.394) (6.352) (6.352) (2.679) (3.202) (3.221) (2.945)
Chris Blattman 11.18*** 9.771*** 10.83*** 10.86*** 2.555* 2.021** 2.113 1.953
(3.199) (1.870) (2.709) (2.397) (1.384) (1.005) (1.412) (1.587)
Economix 20.31** 20.47** 18.95** 17.25** 2.847** 2.790* 2.480* 2.269
(8.638) (8.814) (8.146) (8.589) (1.367) (1.531) (1.388) (1.655)
Freakonomics 152.6 24.93 159.1 111.0 23.80 -8.376 25.49 13.00
(131.7) (22.27) (139.3) (103.7) (22.11) (6.536) (23.97) (14.37)
Marginal Revolution 138.2 105.3 139.2 128.8 45.76 37.79 46.24 43.33
(92.43) (68.88) (96.06) (91.77) (31.61) (25.84) (32.51) (31.48)
Paul Krugman 111.9* 114.2* 103.3* 91.34* 28.66 29.29 25.98 21.66
(66.73) (68.04) (61.86) (54.97) (19.51) (19.95) (18.00) (15.26)
Month before blog post effects
Aid Watch 1.520 0.817 -0.258 -1.333 5.767 5.328 4.602 4.400
(4.162) (3.768) (3.330) (3.320) (5.890) (5.692) (5.359) (5.873)
Chris Blattman -0.463 -1.632 -0.806 -0.773 2.161 1.764 1.732 1.577
(5.270) (5.947) (4.956) (4.904) (3.473) (3.783) (3.255) (3.098)
Economix 7.286 8.087 6.312 3.730 0.812 0.935 0.580 0.476
(8.224) (8.657) (8.635) (9.115) (1.717) (1.793) (1.842) (2.021)
Freakonomics 14.63 10.41 21.94 28.28 5.016* 4.131 6.939 8.646
(9.726) (7.985) (17.46) (27.69) (2.919) (2.575) (4.814) (7.438)
Marginal Revolution 7.966 3.742 9.154 11.24 2.890 2.090 3.423 3.764
(6.950) (8.353) (9.981) (15.05) (2.503) (2.949) (3.179) (4.245)
Paul Krugman 14.73 17.20 6.137 -5.860* 3.860 4.517 1.184 -3.140
(10.70) (11.40) (5.212) (3.236) (4.483) (4.714) (3.137) (2.179)
Window on either side of blog date 24 months 24 months 12 months 6 months 24 months 24 months 12 months 6 months
Paper-specific linear time trend No Yes No No No Yes No No
Observations 3,314 3,314 2,002 1,143 3,314 3,314 2,002 1,143
Notes: Robust standard errors in parentheses clustered at the paper level,
*, **, and *** indicate significance at 10, 5 and 1% levels respectively.
Abstract Views Paper Downloads
0
100
200
300
400
500
600
700
800
900
1000
0
20
40
60
80
100
120
140
160
19
98
-03
19
98
-07
19
98
-11
19
99
-03
19
99
-07
19
99
-11
20
00
-03
20
00
-07
20
00
-11
20
01
-03
20
01
-07
20
01
-11
20
02
-03
20
02
-07
20
02
-11
20
03
-03
20
03
-07
20
03
-11
20
04
-03
20
04
-07
20
04
-11
20
05
-03
20
05
-07
20
05
-11
20
06
-03
20
06
-07
20
06
-11
20
07
-03
20
07
-07
20
07
-11
20
08
-03
20
08
-07
20
08
-11
20
09
-03
20
09
-07
20
09
-11
20
10
-03
20
10
-07
20
10
-11
20
11
-03
Ab
stract View
s in M
on
thDo
wn
load
s in
Mo
nth
Figure 1: Abstract Views and Downloads per Month for Irwin (1997)
Downloads - Abstract Views -
Paul Krugman blogs about paper
0
200
400
600
800
1000
1200
1400
1600
0
20
40
60
80
100
120
140
1602
00
6-0
7
20
06
-09
20
06
-11
20
07
-01
20
07
-03
20
07
-05
20
07
-07
20
07
-09
20
07
-11
20
08
-01
20
08
-03
20
08
-05
20
08
-07
20
08
-09
20
08
-11
20
09
-01
20
09
-03
20
09
-05
20
09
-07
20
09
-09
20
09
-11
20
10
-01
20
10
-03
20
10
-05
20
10
-07
20
10
-09
20
10
-11
20
11
-01
20
11
-03
20
11
-05
Ab
stra
ct V
iew
s p
er
Mo
nth
Do
wn
load
s p
er
Mo
nth
Figure 2: Abstract Views and Downloads per Month for Landry et al. (2006)
Downloads Abstract Views
Freakonomics blogs about paper
0
10
20
30
40
50
60
0
2
4
6
8
10
122
00
6-1
2
20
07
-02
20
07
-04
20
07
-06
20
07
-08
20
07
-10
20
07
-12
20
08
-02
20
08
-04
20
08
-06
20
08
-08
20
08
-10
20
08
-12
20
09
-02
20
09
-04
20
09
-06
20
09
-08
20
09
-10
20
09
-12
20
10
-02
20
10
-04
20
10
-06
20
10
-08
20
10
-10
20
10
-12
20
11
-02
20
11
-04
20
11
-06
Ab
stra
ct V
iew
s p
er
mo
nth
Do
wn
load
s p
er
mo
nth
Figure 3: Abstract Views and Downloads per Month for Arai and Thoursie (2006)
Downloads Abstract Views
Chris Blattman blogsabout paper