Embed Size (px)
Citation preview
January 2018
1
Environmental Research Group King’s College London
The impact of a green screen on concentrations of nitrogen dioxide at
Bowes Primary School, Enfield
Prepared for the London Borough of Enfield
January 2018
Anja H. Tremper and David C. Green
Environmental Research Group
King’s College London

January 2018
2
Environmental Research Group King’s College London
Title
The impact of a green screen on concentrations of nitrogen dioxide at
Bowes Primary School, Enfield
Customer
Enfield Council
Customer Ref
File Reference
Report
Number
Environmental Research Group King's College London 4th Floor Franklin-Wilkins Building 150 Stamford St London SE1 9NH
Tel 020 7848 4044 Fax 020 7848 4045
Name Signature Date
Lead Author Anja Tremper
Reviewed by David Green
Approved by David Green
January 2018
3
Environmental Research Group King’s College London
Summary City Hall data revealed that many schools within London are currently located in areas exceeding
legal air quality limits. In a new scheme by the GLA/Mayor of London to protect school children from
the effects of air pollution, audits will be carried out to review ways of lowering the exposure to
pollution in and around Schools, one of which could be the use of “'green infrastructure' such as
‘barrier bushes’ along busy roads and in playgrounds to ‘block’ out toxic fumes.
Research on urban vegetation suggests that it can help reduce the impact of pollution on people and
buildings by acting as a pollution sink. Furthermore, the transport of pollutants from nearby traffic
sources in urban areas can be effectively reduced by using green barriers. Thus, green infrastructure
might be a cost effective and easy way to reduce the impact of pollution in near road environments.
This is especially important for vulnerable members of the population, such as children, whose lung
growth is slowed in areas with high pollutant concentrations. Therefore, a measure to reduce
pollution levels at schools situated at roadsides will be of particular benefit.
To assess the efficacy of a green screen to prevent the transport of vehicle emissions from the
nearby road into the playground, an ivy screen was installed at Bowes Primary School in the London
Borough of Enfield. Nitrogen dioxide (NO2) was then measured either side of the screen and the
difference in concentration between the roadside side and playground side of the screen was
assessed as it matured.
The screen was found to be an effective pollution barrier and a significant impact could be seen once
the screen had matured. It led to a decrease in the mean daily pollution concentrations on the
playground side of the screen by 22%; this was higher than the measurement uncertainty and thus
significant. Comparing school hours independently a mean reduction in concentrations of up to 23%
was found for NO2. This demonstrates that the screen is very effective in reducing pollution
concentrations during daytime hours, when both emissions and exposure are highest.
Unfortunately, the annual mean air quality objective would not have been met on either side of the
screen for NO2; assuming that the analysis periods were representative of an entire year. Therefore,
further vehicle emissions abatement, in addition to these local measures, would be required to
reduce concentrations below the EU Limit Value at the playground.

January 2018
4
Environmental Research Group King’s College London
This page is left intentionally blank
January 2018
5
Environmental Research Group King’s College London
Contents
Summary ................................................................................................................................................. 3
1 Introduction ................................................................................................................................ 6
2 Methods ...................................................................................................................................... 8
2.1 Measurement configuration ............................................................................................... 8
3 Results and Discussion .............................................................................................................. 10
3.1 Co-location and analyser comparison ............................................................................... 10
3.2 Overview of monitoring data ............................................................................................ 11
3.3 Influence of wind speed and wind direction..................................................................... 14
3.4 Concentration difference between roadside and playground ......................................... 16
3.5 Temporal variation in NO2 ................................................................................................ 17
4 Conclusions ............................................................................................................................... 18
5 References ................................................................................................................................ 19
January 2018
6
Environmental Research Group King’s College London
1 Introduction City Hall data revealed that within London 360 primary schools are currently located in areas
exceeding legal air quality limits (GLA, 2017). In cities, like London, the concentration of air
pollutants such as nitrogen dioxide (NO2) and particulate matter are elevated close to roads and
many schools in London are located close to roads, with classrooms and playgrounds only a few
meters from heavy traffic. Despite many years of investment in exhaust emission abatement
technology, moving from Euro 4 to 5 etc. (EC Regulation 715/2007/EC), and policy interventions such
as the London Low Emission Zone, the concentrations of pollutants, especially NO2, remain high
close to roads.
Toxic air pollutants, such as NO2 have been shown to have detrimental health effects including
increased cardio-pulmonary and lung cancer mortality and increased risk of respiratory symptoms
(WHO, 2003) and children are particularly vulnerable to the effects of poor air quality. Indeed,
exposure to NO2, nitrogen oxides (NOX), and particles below 2.5µm in size (PM2.5) has been shown to
negatively affect the lung function in schoolchildren (Gehring et al., 2013).
In a new scheme by the GLA/Mayor of London to protect school children from the effects of air
pollution, detailed audits will be carried out to review ways of lowering the exposure to pollution in
and around Schools (GLA, 2017). One of the recommendations of such an audit could be the use of
“'green infrastructure' such as ‘barrier bushes’ along busy roads and in playgrounds to ‘block’ out
toxic fumes (GLA, 2017).
Research on urban vegetation suggests that it can help reduce the impact of pollution on people and
buildings by acting as a pollution sink. Furthermore, the transport of pollutants from nearby traffic
sources in urban areas can be effectively reduced by using green barriers (Sternberg et al, 2010; Hill,
1971). Thus, green infrastructure might be a cost effective and easy way to reduce the impact of
pollution in near road environments. As mentioned above this is especially important for vulnerable
members of the population, such as children, whose lung growth is slowed in areas with high
pollutant concentrations (Kelly and Fussel, 2011). Therefore, a measure to reduce pollution levels at
schools situated at roadsides will be of particular benefit.
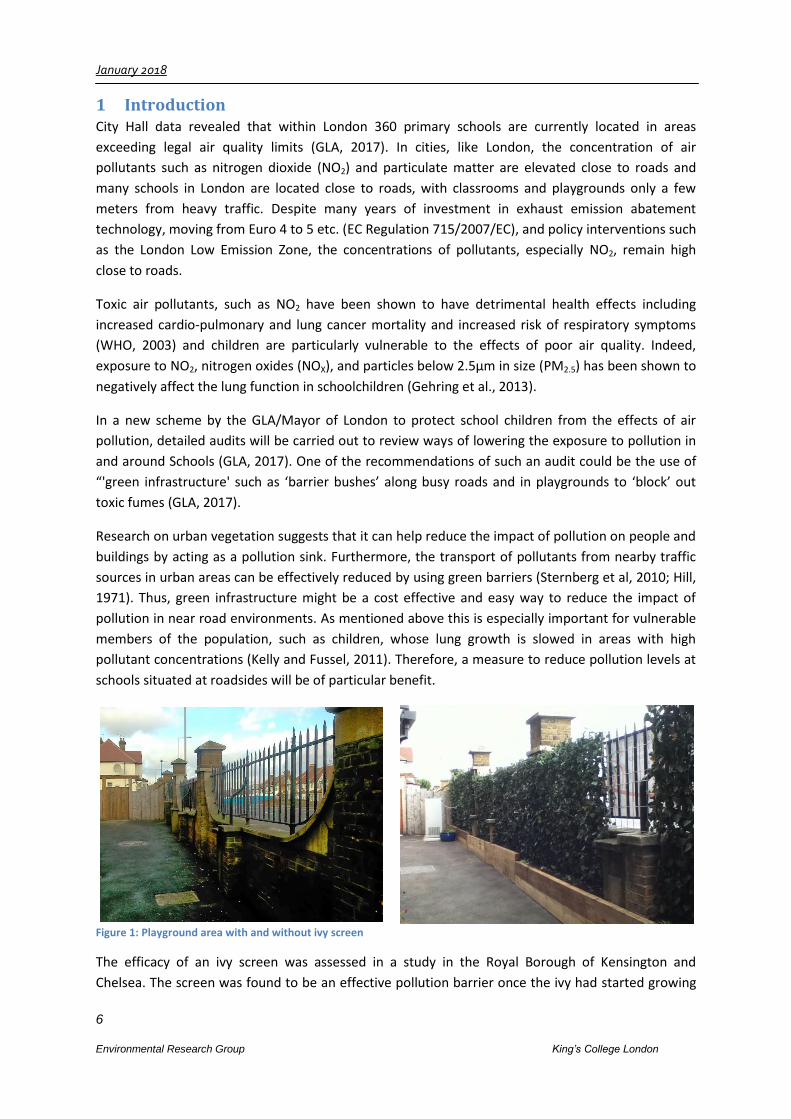
Figure 1: Playground area with and without ivy screen
The efficacy of an ivy screen was assessed in a study in the Royal Borough of Kensington and
Chelsea. The screen was found to be an effective pollution barrier once the ivy had started growing
January 2018
7
Environmental Research Group King’s College London
and a significant impact could be seen once the screen had matured (Tremper et al., 2015).
However, the measurements were taken immediately either side of the screen and thus may not
reflect the pollutant concentrations further away from the screen.
In the current study, 12 m of ivy screen were installed in the nursery entrance area of Bowes Primary
School in the London Borough of Enfield (Figure 1). The green screen was designed to fill gaps in the
existing barrier and reached 2.4 m in height as shown in Figure 1. Data was collected before and
after the screen was installed and a follow up study was carried out after the screen had matured.
NO2 was monitored on the roadside and playground side of the screen to assess the efficacy of the
screen in reducing exposure in this area of the school.
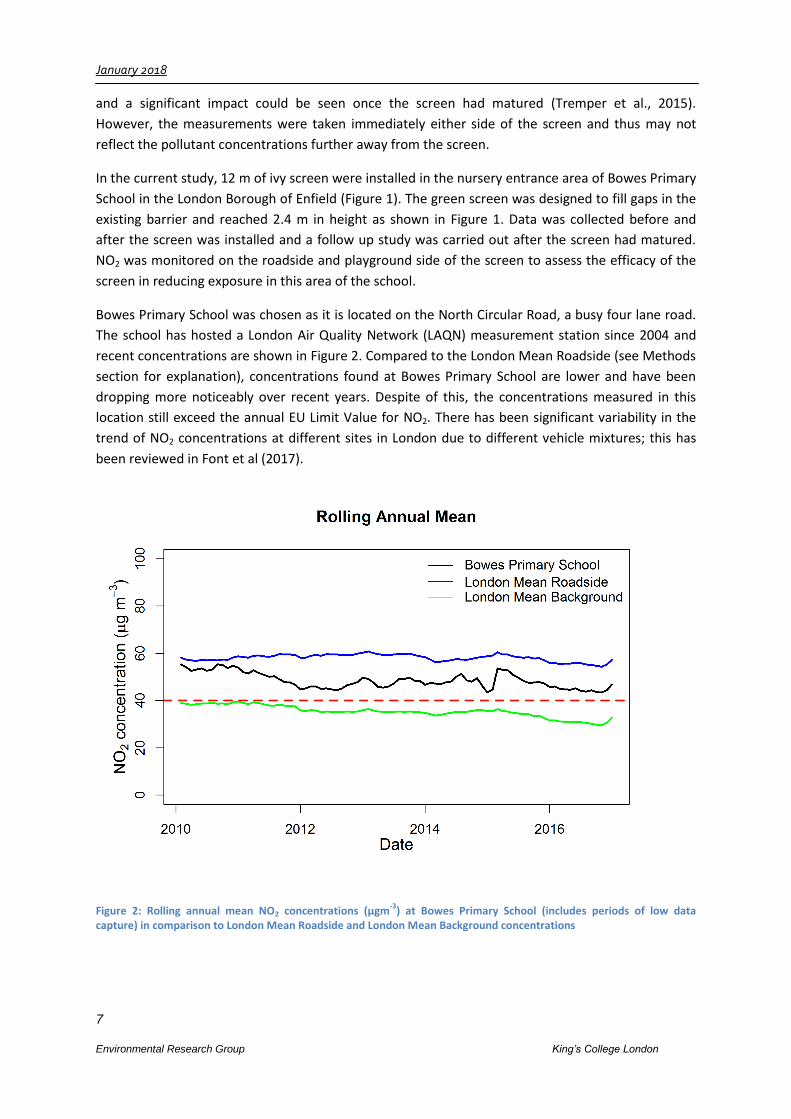
Bowes Primary School was chosen as it is located on the North Circular Road, a busy four lane road.
The school has hosted a London Air Quality Network (LAQN) measurement station since 2004 and
recent concentrations are shown in Figure 2. Compared to the London Mean Roadside (see Methods
section for explanation), concentrations found at Bowes Primary School are lower and have been
dropping more noticeably over recent years. Despite of this, the concentrations measured in this
location still exceed the annual EU Limit Value for NO2. There has been significant variability in the
trend of NO2 concentrations at different sites in London due to different vehicle mixtures; this has
been reviewed in Font et al (2017).
Figure 2: Rolling annual mean NO2 concentrations (µgm-3
) at Bowes Primary School (includes periods of low data capture) in comparison to London Mean Roadside and London Mean Background concentrations
January 2018
8
Environmental Research Group King’s College London
2 Methods
2.1 Measurement configuration
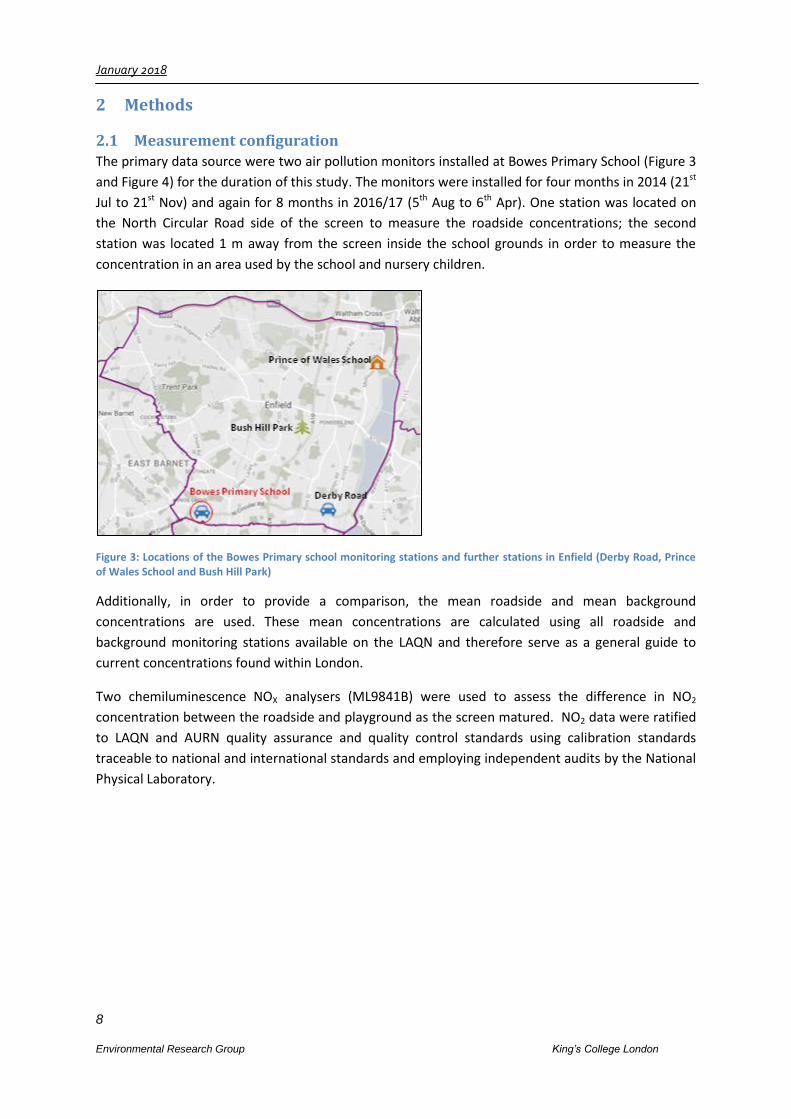
The primary data source were two air pollution monitors installed at Bowes Primary School (Figure 3
and Figure 4) for the duration of this study. The monitors were installed for four months in 2014 (21st
Jul to 21st Nov) and again for 8 months in 2016/17 (5th Aug to 6th Apr). One station was located on
the North Circular Road side of the screen to measure the roadside concentrations; the second
station was located 1 m away from the screen inside the school grounds in order to measure the
concentration in an area used by the school and nursery children.
Figure 3: Locations of the Bowes Primary school monitoring stations and further stations in Enfield (Derby Road, Prince of Wales School and Bush Hill Park)
Additionally, in order to provide a comparison, the mean roadside and mean background
concentrations are used. These mean concentrations are calculated using all roadside and
background monitoring stations available on the LAQN and therefore serve as a general guide to
current concentrations found within London.
Two chemiluminescence NOX analysers (ML9841B) were used to assess the difference in NO2
concentration between the roadside and playground as the screen matured. NO2 data were ratified
to LAQN and AURN quality assurance and quality control standards using calibration standards
traceable to national and international standards and employing independent audits by the National
Physical Laboratory.
January 2018
9
Environmental Research Group King’s College London
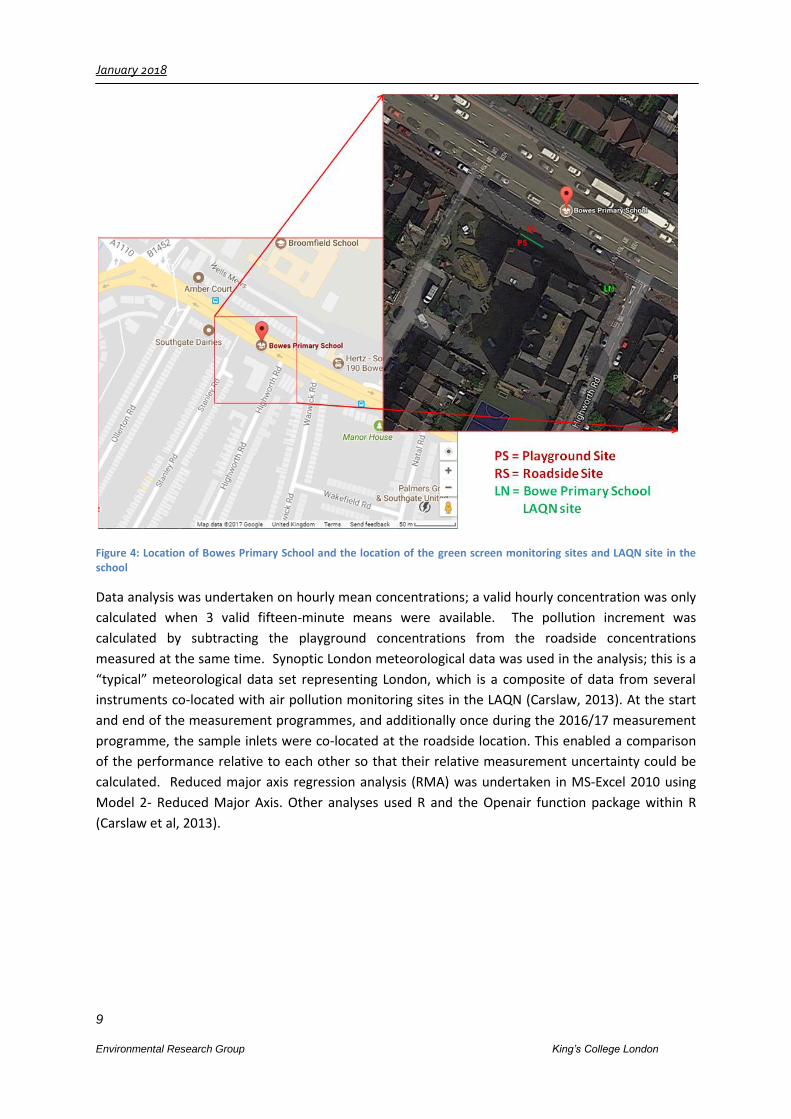
Figure 4: Location of Bowes Primary School and the location of the green screen monitoring sites and LAQN site in the school
Data analysis was undertaken on hourly mean concentrations; a valid hourly concentration was only
calculated when 3 valid fifteen-minute means were available. The pollution increment was
calculated by subtracting the playground concentrations from the roadside concentrations
measured at the same time. Synoptic London meteorological data was used in the analysis; this is a
“typical” meteorological data set representing London, which is a composite of data from several
instruments co-located with air pollution monitoring sites in the LAQN (Carslaw, 2013). At the start
and end of the measurement programmes, and additionally once during the 2016/17 measurement
programme, the sample inlets were co-located at the roadside location. This enabled a comparison
of the performance relative to each other so that their relative measurement uncertainty could be
calculated. Reduced major axis regression analysis (RMA) was undertaken in MS-Excel 2010 using
Model 2- Reduced Major Axis. Other analyses used R and the Openair function package within R
(Carslaw et al, 2013).
January 2018
10
Environmental Research Group King’s College London
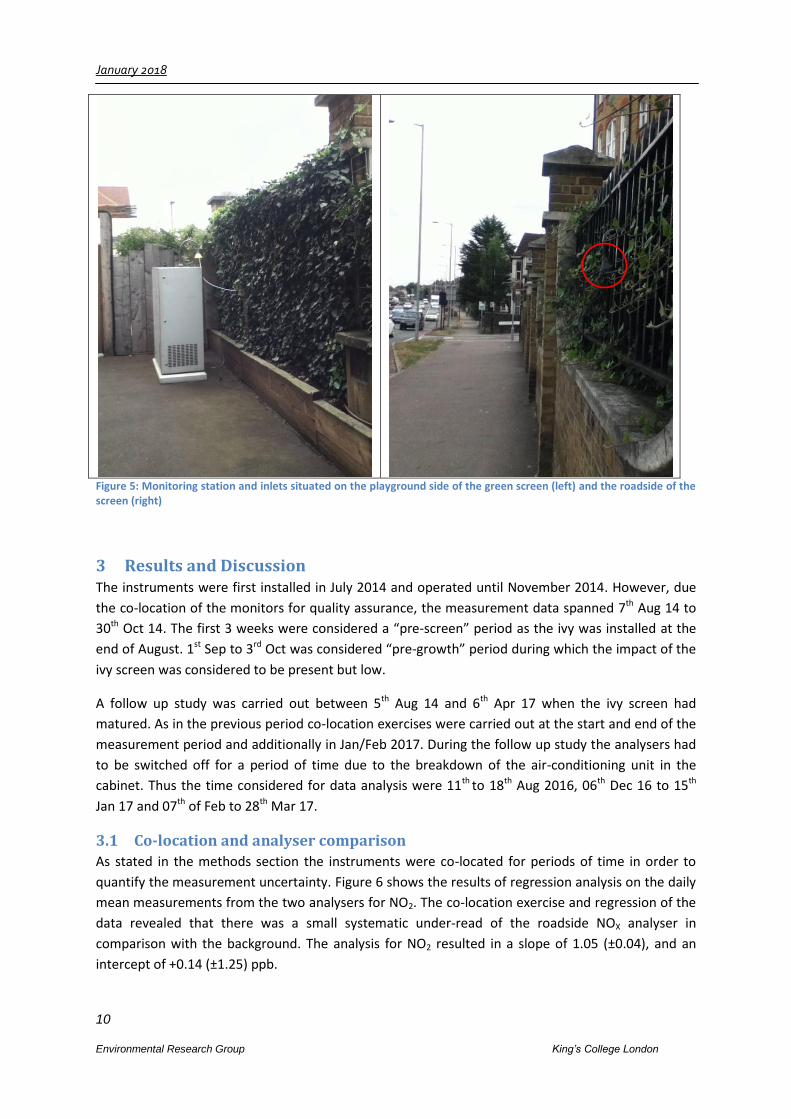
Figure 5: Monitoring station and inlets situated on the playground side of the green screen (left) and the roadside of the screen (right)
3 Results and Discussion The instruments were first installed in July 2014 and operated until November 2014. However, due
the co-location of the monitors for quality assurance, the measurement data spanned 7th Aug 14 to
30th Oct 14. The first 3 weeks were considered a “pre-screen” period as the ivy was installed at the
end of August. 1st Sep to 3rd Oct was considered “pre-growth” period during which the impact of the
ivy screen was considered to be present but low.
A follow up study was carried out between 5th Aug 14 and 6th Apr 17 when the ivy screen had
matured. As in the previous period co-location exercises were carried out at the start and end of the
measurement period and additionally in Jan/Feb 2017. During the follow up study the analysers had
to be switched off for a period of time due to the breakdown of the air-conditioning unit in the
cabinet. Thus the time considered for data analysis were 11th to 18th Aug 2016, 06th Dec 16 to 15th
Jan 17 and 07th of Feb to 28th Mar 17.
3.1 Co-location and analyser comparison
As stated in the methods section the instruments were co-located for periods of time in order to
quantify the measurement uncertainty. Figure 6 shows the results of regression analysis on the daily
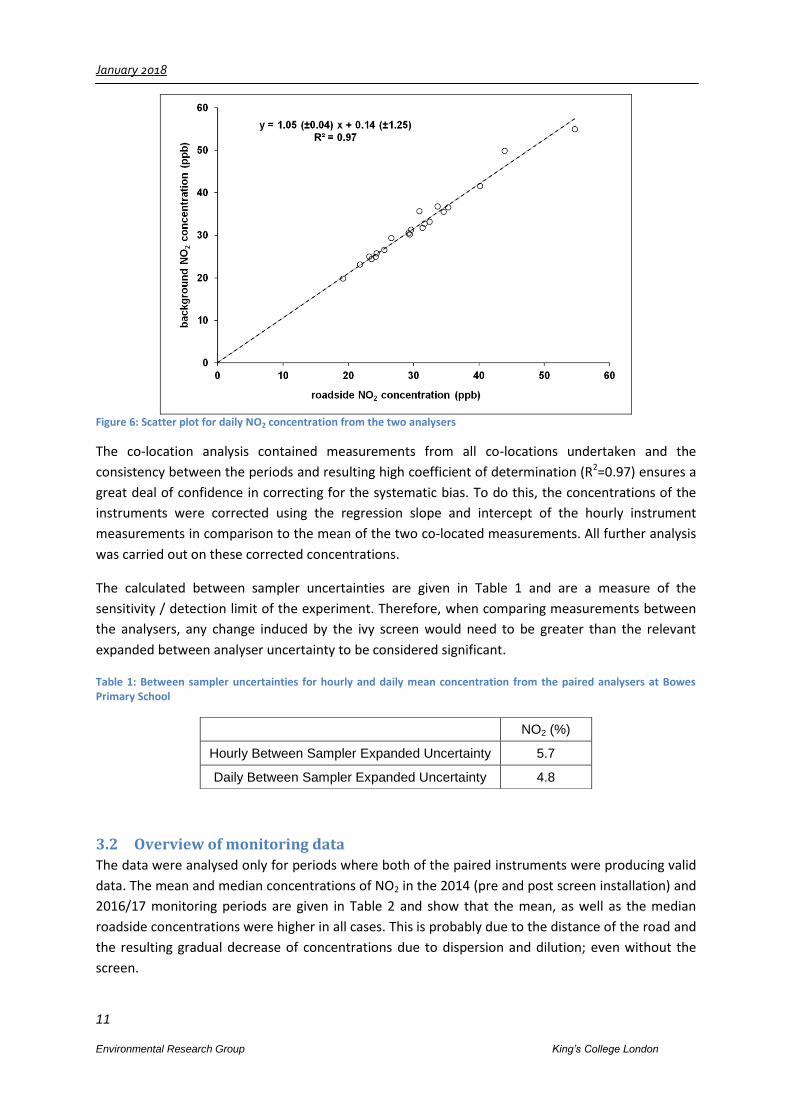
mean measurements from the two analysers for NO2. The co-location exercise and regression of the
data revealed that there was a small systematic under-read of the roadside NOX analyser in
comparison with the background. The analysis for NO2 resulted in a slope of 1.05 (±0.04), and an
intercept of +0.14 (±1.25) ppb.
January 2018
11
Environmental Research Group King’s College London
Figure 6: Scatter plot for daily NO2 concentration from the two analysers
The co-location analysis contained measurements from all co-locations undertaken and the
consistency between the periods and resulting high coefficient of determination (R2=0.97) ensures a
great deal of confidence in correcting for the systematic bias. To do this, the concentrations of the
instruments were corrected using the regression slope and intercept of the hourly instrument
measurements in comparison to the mean of the two co-located measurements. All further analysis
was carried out on these corrected concentrations.
The calculated between sampler uncertainties are given in Table 1 and are a measure of the
sensitivity / detection limit of the experiment. Therefore, when comparing measurements between
the analysers, any change induced by the ivy screen would need to be greater than the relevant
expanded between analyser uncertainty to be considered significant.
Table 1: Between sampler uncertainties for hourly and daily mean concentration from the paired analysers at Bowes Primary School
3.2 Overview of monitoring data
The data were analysed only for periods where both of the paired instruments were producing valid
data. The mean and median concentrations of NO2 in the 2014 (pre and post screen installation) and
2016/17 monitoring periods are given in Table 2 and show that the mean, as well as the median
roadside concentrations were higher in all cases. This is probably due to the distance of the road and
the resulting gradual decrease of concentrations due to dispersion and dilution; even without the
screen.
NO2 (%)
Hourly Between Sampler Expanded Uncertainty 5.7
Daily Between Sampler Expanded Uncertainty 4.8
January 2018
12
Environmental Research Group King’s College London
Means provide the information necessary to assess regulatory targets (e.g. the 40 µg m-3 annual
mean limit value) but can be heavily influenced by a small number of high concentrations. However,
medians provide a better descriptor of the data populations that are log normally distributed; like air
pollution concentrations.
Site NO2 Concentration (µgm-3)
Median Mean
2014 Roadside 53.6 53.5 (pre screen) Background 50.6 51.5
Increment 1.9 2.1
2014 Roadside 64.3 64.4 (pre growth) Background 60.3 60.0
Increment 3.9 4.3
2016/17 Roadside 66.8 68.2 (mature screen) Background 51.3 53.2
Increment 14.0 15.0
Table 2: Summary of pollution concentrations at Bowes Primary school
Assuming the analysis periods were representative of the entire year, the annual mean air quality
objective would not have been met for any of the periods and locations for NO2. The measurement
periods were relatively short and thus may not be representative of a whole year. However,
exceedance of the annual mean would be expected as the Bowes Primary School LAQN monitoring
site has measured NO2 concentrations above the annual limit value for the last 5 years (see Figure 2).
The hourly mean limit value cannot be assessed using short term measurement as produced in this
project.
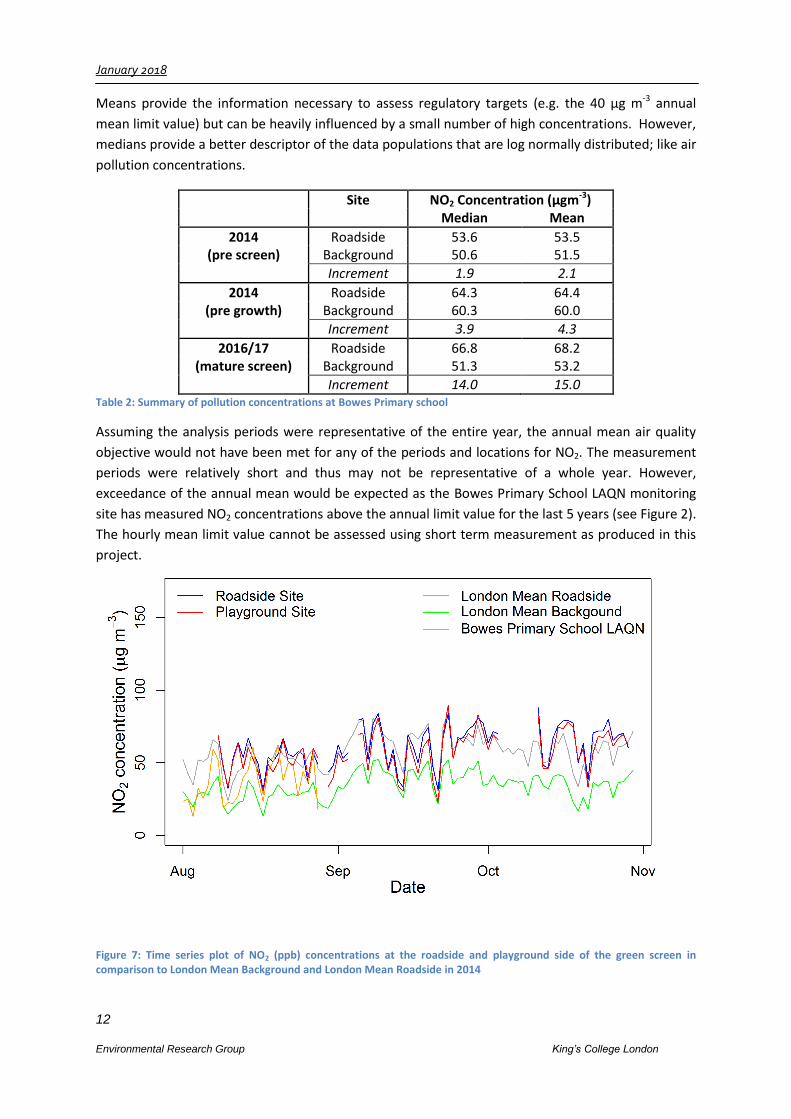
Figure 7: Time series plot of NO2 (ppb) concentrations at the roadside and playground side of the green screen in comparison to London Mean Background and London Mean Roadside in 2014
January 2018
13
Environmental Research Group King’s College London
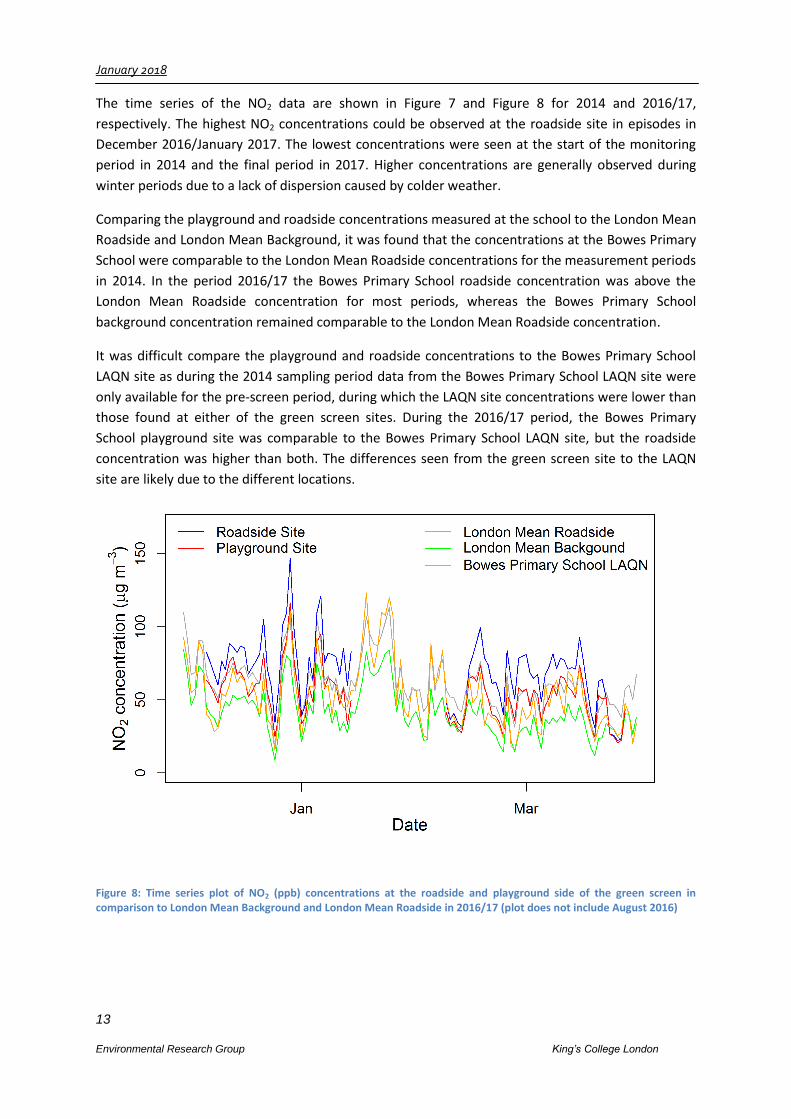
The time series of the NO2 data are shown in Figure 7 and Figure 8 for 2014 and 2016/17,
respectively. The highest NO2 concentrations could be observed at the roadside site in episodes in
December 2016/January 2017. The lowest concentrations were seen at the start of the monitoring
period in 2014 and the final period in 2017. Higher concentrations are generally observed during
winter periods due to a lack of dispersion caused by colder weather.
Comparing the playground and roadside concentrations measured at the school to the London Mean
Roadside and London Mean Background, it was found that the concentrations at the Bowes Primary
School were comparable to the London Mean Roadside concentrations for the measurement periods
in 2014. In the period 2016/17 the Bowes Primary School roadside concentration was above the
London Mean Roadside concentration for most periods, whereas the Bowes Primary School
background concentration remained comparable to the London Mean Roadside concentration.
It was difficult compare the playground and roadside concentrations to the Bowes Primary School
LAQN site as during the 2014 sampling period data from the Bowes Primary School LAQN site were
only available for the pre-screen period, during which the LAQN site concentrations were lower than
those found at either of the green screen sites. During the 2016/17 period, the Bowes Primary
School playground site was comparable to the Bowes Primary School LAQN site, but the roadside
concentration was higher than both. The differences seen from the green screen site to the LAQN
site are likely due to the different locations.
Figure 8: Time series plot of NO2 (ppb) concentrations at the roadside and playground side of the green screen in comparison to London Mean Background and London Mean Roadside in 2016/17 (plot does not include August 2016)
January 2018
14
Environmental Research Group King’s College London
3.3 Influence of wind speed and wind direction
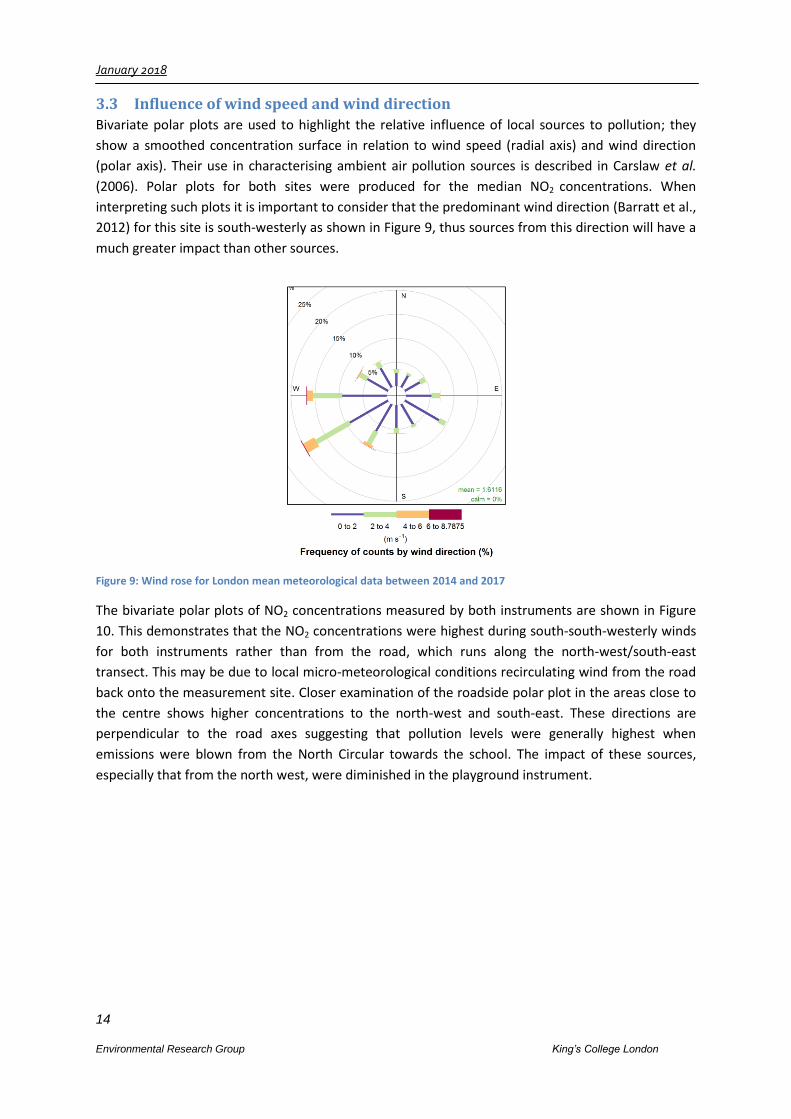
Bivariate polar plots are used to highlight the relative influence of local sources to pollution; they
show a smoothed concentration surface in relation to wind speed (radial axis) and wind direction
(polar axis). Their use in characterising ambient air pollution sources is described in Carslaw et al.
(2006). Polar plots for both sites were produced for the median NO2 concentrations. When
interpreting such plots it is important to consider that the predominant wind direction (Barratt et al.,
2012) for this site is south-westerly as shown in Figure 9, thus sources from this direction will have a
much greater impact than other sources.
Figure 9: Wind rose for London mean meteorological data between 2014 and 2017
The bivariate polar plots of NO2 concentrations measured by both instruments are shown in Figure
10. This demonstrates that the NO2 concentrations were highest during south-south-westerly winds
for both instruments rather than from the road, which runs along the north-west/south-east
transect. This may be due to local micro-meteorological conditions recirculating wind from the road
back onto the measurement site. Closer examination of the roadside polar plot in the areas close to
the centre shows higher concentrations to the north-west and south-east. These directions are
perpendicular to the road axes suggesting that pollution levels were generally highest when
emissions were blown from the North Circular towards the school. The impact of these sources,
especially that from the north west, were diminished in the playground instrument.

January 2018
15
Environmental Research Group King’s College London
Figure 10: Bivariate polar plot of the median NO2 (µgm-3
) concentrations at the roadside site and playground site by wind speed and direction for all monitoring periods
To illustrate how the green screen influenced the impact of the local pollution sources in more
detail, the pollution increment was calculated by subtracting the playground concentrations from
the roadside concentrations and bivariate polar plots were produced for the sampling periods in
2014 and 2016/17 (Figure 11).
2014 (pre screen installation) 2014 (post screen installation) 2016/2017 (ivy screen fully matured)
Figure 11: Bivariate polar plot of the median NO2 (µgm
-3) concentration increment by wind speed and direction for 2014
pre screen installation (left), 2014 post screen installation (centre) and 2016/2017 (right) monitoring periods
Before the ivy screen was installed the increment was relatively uniform in all directions (± 5µg m-3)
although an overall positive increment was observed due to the dilution and dispersion effects of
measuring further away from the road. This was enhanced during westerly winds, possibly due the
sheltering effect of a nearby wall on the playground instrument. After the screen installation there
was a positive increment in from westerly and northerly winds at all wind speeds, at wind speeds
about 1ms-1 from easterly winds and at very low wind speeds (<1ms-1) from all wind directions. After
the screen has matured (2016/2017) this increment was more pronounced, thus showing the
positive effect of the screen.
Before the screen had matured a negative increment could be detected for about a quarter of the
measurements (26%), thus during these periods the concentrations were higher in the playground
site than the roadside site. This was mainly the case when the wind direction was from the north
east or south east. After the screen had matured this negative increment was only experienced
during 2% of the measurements, thus further showing a clear benefit of the screen.
January 2018
16
Environmental Research Group King’s College London
3.4 Concentration difference between roadside and playground
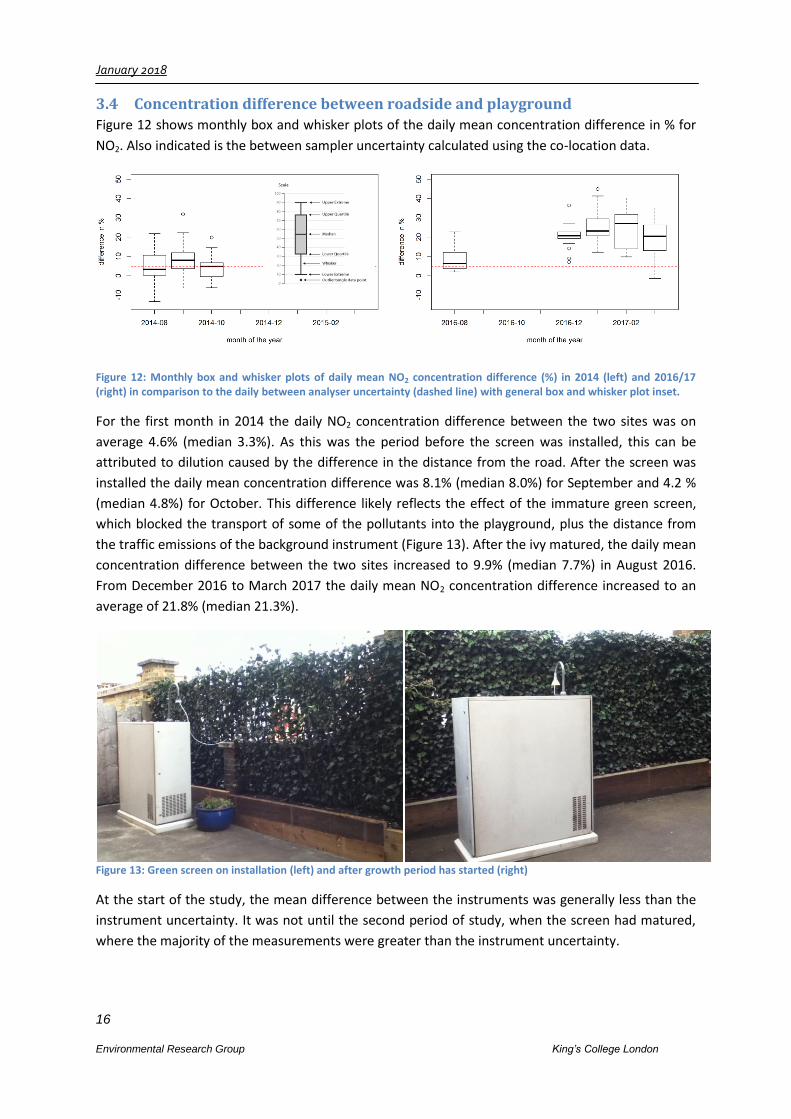
Figure 12 shows monthly box and whisker plots of the daily mean concentration difference in % for
NO2. Also indicated is the between sampler uncertainty calculated using the co-location data.
Figure 12: Monthly box and whisker plots of daily mean NO2 concentration difference (%) in 2014 (left) and 2016/17 (right) in comparison to the daily between analyser uncertainty (dashed line) with general box and whisker plot inset.
For the first month in 2014 the daily NO2 concentration difference between the two sites was on
average 4.6% (median 3.3%). As this was the period before the screen was installed, this can be
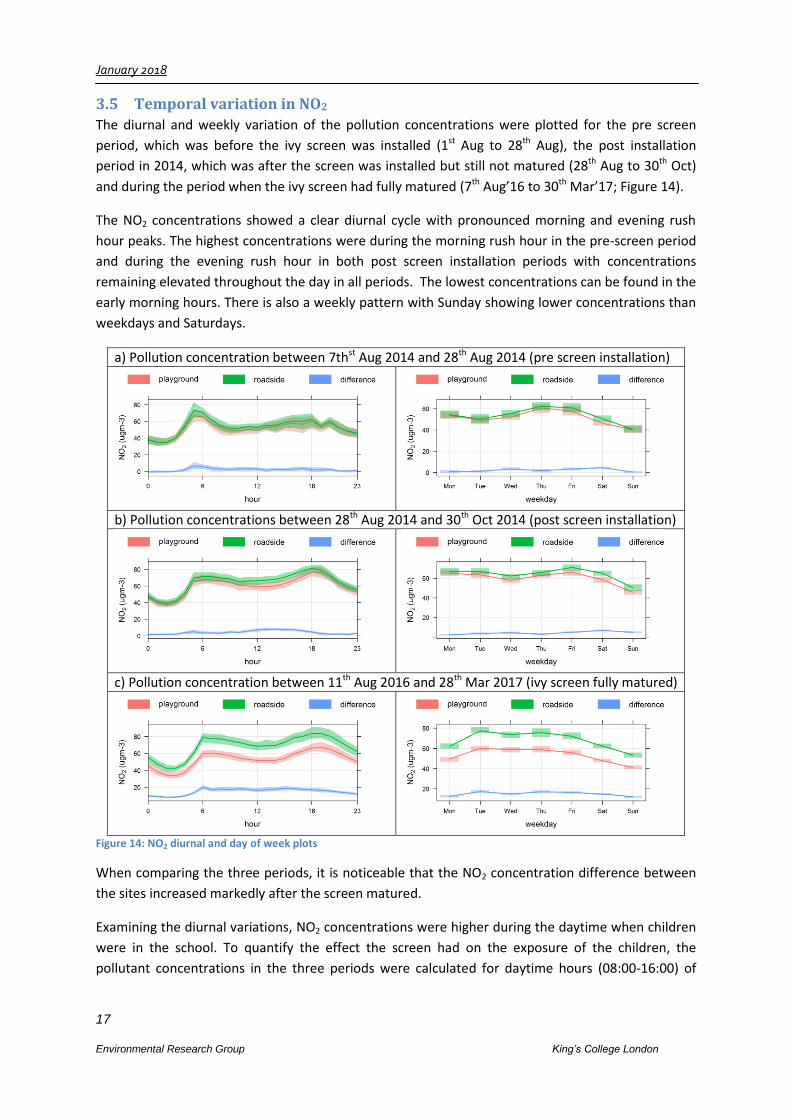
attributed to dilution caused by the difference in the distance from the road. After the screen was
installed the daily mean concentration difference was 8.1% (median 8.0%) for September and 4.2 %
(median 4.8%) for October. This difference likely reflects the effect of the immature green screen,
which blocked the transport of some of the pollutants into the playground, plus the distance from
the traffic emissions of the background instrument (Figure 13). After the ivy matured, the daily mean
concentration difference between the two sites increased to 9.9% (median 7.7%) in August 2016.
From December 2016 to March 2017 the daily mean NO2 concentration difference increased to an
average of 21.8% (median 21.3%).
Figure 13: Green screen on installation (left) and after growth period has started (right)
At the start of the study, the mean difference between the instruments was generally less than the
instrument uncertainty. It was not until the second period of study, when the screen had matured,
where the majority of the measurements were greater than the instrument uncertainty.
January 2018
17
Environmental Research Group King’s College London
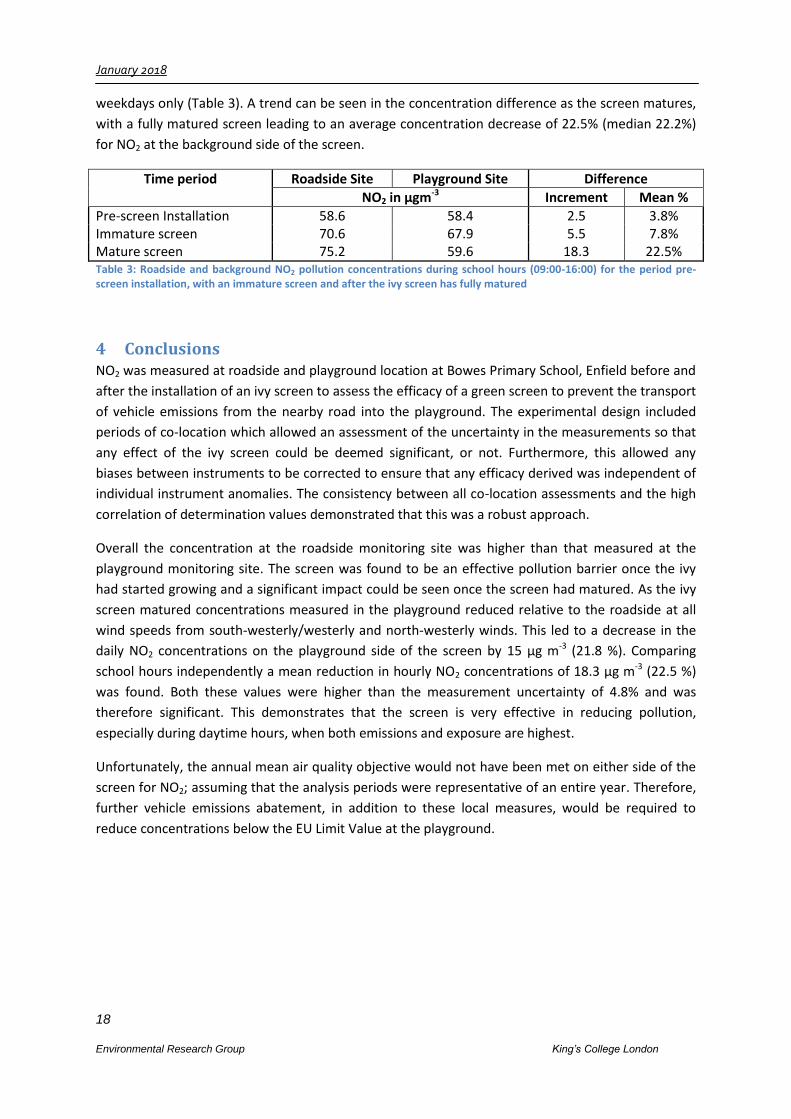
3.5 Temporal variation in NO2
The diurnal and weekly variation of the pollution concentrations were plotted for the pre screen
period, which was before the ivy screen was installed (1st Aug to 28th Aug), the post installation
period in 2014, which was after the screen was installed but still not matured (28th Aug to 30th Oct)
and during the period when the ivy screen had fully matured (7th Aug’16 to 30th Mar’17; Figure 14).
The NO2 concentrations showed a clear diurnal cycle with pronounced morning and evening rush
hour peaks. The highest concentrations were during the morning rush hour in the pre-screen period
and during the evening rush hour in both post screen installation periods with concentrations
remaining elevated throughout the day in all periods. The lowest concentrations can be found in the
early morning hours. There is also a weekly pattern with Sunday showing lower concentrations than
weekdays and Saturdays.
a) Pollution concentration between 7thst Aug 2014 and 28th Aug 2014 (pre screen installation)
b) Pollution concentrations between 28th Aug 2014 and 30th Oct 2014 (post screen installation)
c) Pollution concentration between 11th Aug 2016 and 28th Mar 2017 (ivy screen fully matured)
Figure 14: NO2 diurnal and day of week plots
When comparing the three periods, it is noticeable that the NO2 concentration difference between
the sites increased markedly after the screen matured.
Examining the diurnal variations, NO2 concentrations were higher during the daytime when children
were in the school. To quantify the effect the screen had on the exposure of the children, the
pollutant concentrations in the three periods were calculated for daytime hours (08:00-16:00) of
January 2018
18
Environmental Research Group King’s College London
weekdays only (Table 3). A trend can be seen in the concentration difference as the screen matures,
with a fully matured screen leading to an average concentration decrease of 22.5% (median 22.2%)
for NO2 at the background side of the screen.
Time period Roadside Site Playground Site Difference
NO2 in µgm-3 Increment Mean %
Pre-screen Installation 58.6 58.4 2.5 3.8% Immature screen 70.6 67.9 5.5 7.8% Mature screen 75.2 59.6 18.3 22.5% Table 3: Roadside and background NO2 pollution concentrations during school hours (09:00-16:00) for the period pre-screen installation, with an immature screen and after the ivy screen has fully matured
4 Conclusions NO2 was measured at roadside and playground location at Bowes Primary School, Enfield before and
after the installation of an ivy screen to assess the efficacy of a green screen to prevent the transport
of vehicle emissions from the nearby road into the playground. The experimental design included
periods of co-location which allowed an assessment of the uncertainty in the measurements so that
any effect of the ivy screen could be deemed significant, or not. Furthermore, this allowed any
biases between instruments to be corrected to ensure that any efficacy derived was independent of
individual instrument anomalies. The consistency between all co-location assessments and the high
correlation of determination values demonstrated that this was a robust approach.
Overall the concentration at the roadside monitoring site was higher than that measured at the
playground monitoring site. The screen was found to be an effective pollution barrier once the ivy
had started growing and a significant impact could be seen once the screen had matured. As the ivy
screen matured concentrations measured in the playground reduced relative to the roadside at all
wind speeds from south-westerly/westerly and north-westerly winds. This led to a decrease in the
daily NO2 concentrations on the playground side of the screen by 15 μg m-3 (21.8 %). Comparing
school hours independently a mean reduction in hourly NO2 concentrations of 18.3 μg m-3 (22.5 %)
was found. Both these values were higher than the measurement uncertainty of 4.8% and was
therefore significant. This demonstrates that the screen is very effective in reducing pollution,
especially during daytime hours, when both emissions and exposure are highest.
Unfortunately, the annual mean air quality objective would not have been met on either side of the
screen for NO2; assuming that the analysis periods were representative of an entire year. Therefore,
further vehicle emissions abatement, in addition to these local measures, would be required to
reduce concentrations below the EU Limit Value at the playground.
January 2018
19
Environmental Research Group King’s College London
5 References Barratt B., Carslaw D.C., Fuller G., (2012). Characterisation & trends in air quality within the Royal Borough of Kensington & Chelsea. Client: Royal Borough of Kensington & Chelsea Carslaw D.C., Beevers S.D., Ropkins K., Bell M.C., (2006). Detecting and quantifying aircraft and other on-airport contributions to ambient nitrogen oxides in the vicinity of a large international airport. Atmospheric Environment, 40(28), 5424-5434. Carslaw D.C., (2013). The openair manual; open-source tools for analysing airpollution data. European Parliament and Council, (2007). Regulation (EC) No 715/2007 on type approval of motor vehicles with respect to emissions from light passenger and commercial vehicles (Euro 5 and Euro 6) and on access to vehicle repair and maintenance information. Font Font, A. & Fuller, G. W., (2016). Did policies to abate atmospheric emissions from traffic have a positive effect in London? Environmental Pollution, 218 (2016), pp. 463–474 Gehring, U., Gruzieva, O., Agius, R. M., Beelen, R., Custovic, A., Cyrys, J., Eeftens, M., Flexeder, C., Fuertes, E., Heinrich, J., Hoffmann, B., de Jongste, J. C., Kerkhof, M., Klumper, C., Korek, M., Molter, A., Schultz, E. S., Simpson, A., Sugiri, D., Svartengren, M., von Berg, A., Wijga, A. H., Pershagen, G., and Brunekreef, B.: Air Pollution Exposure and Lung Function in Children: The ESCAPE Project, Environ Health Persp, 121, 1357-1364, 2013. GLA: https://www.london.gov.uk/press-releases/mayoral/air-quality-audits-to-protect-school-kids Hill A. C. (1971). Vegetation: a sink for atmospheric pollutants. Journal of the Air Pollution Control Association, 21, 341–346. Kelly, F. J., & Fussell, J. C. (2011). Air pollution and airway disease. Clinical and Experimental Allergy, 41(8), 1059 – 1071 Sternberg, T., Viles, H., Carthersides, A., Edwards, M., (2010). Dust particulate absorption by Ivy (Hedera Helix L.) on historic walls in urban environments. Science of the Total Environment, 409, 162-168. Tremper, A.H., David C. Green, D.C., Chatter-Singh, Eleftheriou-Vaus, K. (2015). Impact of green screens on concentrations of particulate matter and oxides of nitrogen in near road environments. Prepared for the Royal Borough of Kensington and Chelsea WHO, (2003). Health Aspects of Air Pollution with Particulate Matter, Ozone and Nitrogen Dioxide. Copenhagen, World Health Organization.